france ** antenne orstom, ifremer, b.p
TRANSCRIPT

Profils de température en 1982-1984
Océan Atlantique 25"N-25"S, 6OoW-15"E
Temperature profiles in 1982-1984
Atlantic Ocean 25"N-25"S, 60°W-15"E
Gilles Reverdin* Y. Gouriou**, Y. du Penhoat**
revu le 15 avril 1988
* LODYC, Paris VI, Tour 14,4 PI. Jussieu, Paris 05, FRANCE ** Antenne ORSTOM, IFREMER, B.P. 70,29263 Plouzané, FRANCE
I
Fonds Documentaire ORSTOM

I, Introduction
The field experiment FOCAL-SEQUAL was designed to monitor, the seasonal variability in the upper water column of the tropical Atlantic Ocean, and especially its temperature structure near the equator. The first cruise was carried out in July 1982, and the last observations were collected in September 1984. Meteorological data were analyzed by various investigators for the period 1982-1984, so we will extend slightly the time fi-ame to include the three years 1982, 1983, and 1984. One component of the program was based on the collection of temperature profiles in the upper ocean. This was done by dropping XBTs, air borne XBTs, and collecting casts with CTDs, or profiling current meters. Drifting buoys or moorings equipped with thermistance chains were also deployed. This report will not include the important mooring data which have been earlier analyzed (Weisberg and Weingartner, 1986; Weisberg and Tang, 1987, Colin and Garzoli, 1987).
At the same time as this field experiment, temperature profiles were also collected for other aims during scientific cruises fi-om various counties (U.S.A, U.S.S.R., B.R.D., D.D.R.). Some of these data are already available, and were incorporated. Also, a XBT monitoring program was Set-up by the Institut für Meereskunde in Kiel with the support of the Deutsches Hydrographisches Dienst @HD, Hamburg), and complements a french XBT line between Europe and Brasil. There were also some TOGA XBTs collected with the support of the Office of Naval Research (Bay-Saint Louis, Miss.), and other profdes are gathered from naval hydrographic institutes (French XBT's at the Etablissement Principal du Service Hydrographique de la Marine, and the amencan MOODS file at Fleet Numerical Oceanic Center, which is expected to be available through through NODC). In these latter files, it is not always reported how the profile was collected (for MOODS, at least in the released version through NODC, the source of the data is not even reported). The data are not all processed in the same way, and are not devoid of large errors. We will first describe how we validated these data, and then report some known characteristics of the different files to evaluate the accuracy of the profiles. The data set has been gathered cooperativally with Jim Carton (University of Maryland). However, it is possible that the data sets in the two institutions differ as part of the validation was carried independently in the two institutions.

IT. Oualitv check
The Master Oceanographic Observation Data Set (MOODS) compiled at F.N.O.C. is designed to be a Master file of all temperature data (Bauer, 1982). It includes both radio-messages sent when collecting the data (usualy on board a ship), and profiles processed in various institutions. It encloses a large body of profiles, but the quality checks performed are not very stringent, and many radio-meesages enclosed in the file will be duplicated by higher quality data in other files.
In composing a common data set of higher quality, the f i s t step is to remove the radio-message profiles which are duplicates of other data. The criterion for two profiles to be duplicates is when they are within a distance of 0.1" and 3 hours of each other. This was f i s t tested within the MOODS files, and then between MOODS añd other data sets. The profile which has the poorest vertical resolution is then removed (quite often, in 1982 and 1983, the surface temperature differed noticeably between the two profiles, with a standard deviation of the differences of O.6O0C, but this was not found in the 1984 data). Within MOODS, we found 267 profiles in 1982, 364 profiles in 1983, and 587 profiles in 1984 which were duplicates.
MOODS also duplicates other data sets. The duplication test was doneJsystematically with the Russian data, the FOCAL CTD stations 1982, and the XBTs collected along the line from Europe to Brazil, and the XBT's collected on board the R.V. Polarstern, for which we were aware of radio messages been sent. We consider that a MOODS profile duplicates an other station when it is located within 15 km and 8 hours of the other station. Of course, some duplicates are still retained, when the time reported to the profile or its position is slightly different. This is noticeable in the central Atlantic on the example presented (Fig. l), but we did not attempt to remove these profiles. No mean bias was found in the MOODS data which were duplicates of statiosn in other fdes, but there is an rms difference with the other profiles which is of the order of 0.32"C for the sea surface temperature, 3.5 meter for the depth of the 20°C isotherm, 12 meter for the depth of the 12°C isotherm. Altogether, nearly half of the stations initially in the MOODS files were removed.
We then went through the files, and removed numerous erroneous bottom segments of the profiles, as well as erroneous sea surface temperature in the XBT or AXBT data. Also, many temperatures reported at the sea surface were collected a few meters below the surface (for instance, the FOCAL CTD casts), and we often changed the indicated depth from O to 1 meter. No quality index is introduced at this step.
Then, we perform a more careful validation. First, the profiles with a strong temperature inversion (larger than OSOC) are checked. Only a few were retained: they are located off north-eastern South America, off north-east Africa, or when the inversion occured in the surface layer (this often happens in the rainy season when a fresher cap of water forms at the surface). Then, we visualized all profiles in 1984 as well as the profiles in the MOODS file, and profiles which were digitized and

w o
Figure I: vmntkly d i s t r ibu t ion of the s ta t ions o MOODS s t a t i o n s x CTD, Nansen c a s t s and buoy data + expandable bathy thermograms and other prof i les
20
15
10
5
O
-5
-1 o
15
-20
20
15
10
5
O
-5
-10
-15
-20
-60 -50 - 40 -30 -20 -1 o O 10 20
temperature profiles year: 84 month: 11 LONG ITU D E
t-
-60 -50 - 40 - 30 -%O -10 O 10 29
temperature prociles year: 8-4- moatti: 12 LO:.IXUCE

not recorded. Major errors were for near-surface temperature or in the lower part of the profiles, and could be corrected. In some instances, the whole profile is shifted or it does not bear resemblance with any known profiie in the area, and is removed,
Then an objective mapping of various isotherm depths was carried to identify profiles which differ very much from their neighbouring data. These were checked, and eventually removed or corrected. This test was not effective in areas near the coast of Brasil, where eddy variability is very large or in data sparse Aas . The last test was to plot the spatial data distribution within 10 day periods, and to check data off ship:tiacks. Some of them apparently resulted from an error in reporting the position, or the date, and this was corrected (12 profiles). The other 15 ones had to be eliminated. That this can happen is obvious when one finds data reported in the middle of Amazonia (November 1982, and September 1983). Höwever, some isolated data collected from fishing vessels are quite allright, and were left (see the distribution of data for February 1982 in the annex). Also some data are not reported with a precise position (in the XBT-EPSHOM file, for example), ans this was not corrected.
F .
Altogether, only 1.3% of the stations were eliminated, and 2.5% had to be corrected (I do not include in this number the numerous profiles with erroneous lower segment found commonly for profiles recorded automatically and in AXBTs). We also checked visually profiles to estimate whether they had a sufficient vertical resolution in the mixed layer, the thermocline or below, and report this with an index (for the MOODS data, or the Nansen bottle casts of the russian SECTION
Program).
The summary of the validation work done is reported for the different files. The convention adopted for the names is xxx-yyy:
- where xxx refer to the instrument used: CTD, XBT(T4), and XBT(T7) are standard, AXBT is for air borne XBTs, STA stands for stations, and MOODS for Master oceanogaphic observation data set - and where yyy refers to the origin of the fíle (FOCA1, SEQUAL, WWS (warm Wasser Sphare), and the Russian SECTION, or to a ship name (Capricorne, Oceanus, Lynch, Polarstern, Port-Harcourt, the east German Humboldt). Some times, it is a cruise name: AJAX or Oceanus 133. XBT-Cruises includes XBTs collected on cruises were CTDs were also taken (the Lynch cruise, two Oceanus sections at lloS, and 18OS, the FLOT data, and no).

o 1
file name profiles removed Instrumented buoys 0 CTD-FOCAL CTD-FLOT S TA-NICALEC
XB T-SEQUAL CTD-Lynch
XBT-Cruises XBT-Capricorne X B T(T4)-FOCAL XBT('I7bFOCAL XBT(T4)-SEQUAL 25 XBT(T7)-TOGA1 1 AXBT-SEQUAL 1 AXBT-Navy2 - - o other american civilian scientific data: CTD-TTO O CTD-AJAX O CTD-1 loS,24OS O CID-Oceanus 133 O
german profiles: CTD-METEOR XBT-WWS 11
XBT-Port Harcourt1 5 XBT-Polarstern1 2
profiles fiom other countries CTD-Humboldt O STA-SECTION-823 1 STA-SECTION-8% STA-SECTION-853 CTD-SECTION-833 CTD-SECTION-843 CTD-SECTION-853
non civilian sources: other C T D s O XBT-EPSHOM 1 Xl3T-fisheries O
MOODS-834 60 MOODS-844 26 miscellaneous
MOODS-824 34
total 1 67
profiles kept 629 1123 45 48 51 390 769 40 67 1 247 ' 2187 1638 419 421
102 33 182 35
18 470 171 175
93 567 161 474 210 507 397
218 823 67 5 17 1022 770 62
profiles corrected
7 O O 6 6 1 3 8 10 16 O 14 3
O O O O
14 2 4
2 1
2 7 O 46 134 77
15774 346 (13542 for the period 1982-1984)
The indices correspond to foot-notes.

5 -
Foot-notes:
O: the instrumented buoy profiles are collected by a thermistance chain within the upper 120 meters, and are transmitted with the ARGOS system. The number indicated corresponds to the number of days with data at least at three levels in the water column, of which only 360 days correspond to more complete profiles, primarily in November 1983-February 1984, near 4 W, 0-6 "S.
1: this also includes profiles in I985 or 1986: profiles for those years have not been validated (in XBT-TOGA, there are also profiles in other areas).
2: data digitized by J. Carton (University of Maryland, and later checked by me ; see comments on this file in section W). The corrections indicated do not include the initial checking stage.
.. .
3: the SECTION data are available for 1982, 1984, and 1985. Only one of the two cruises is available in 1983. Corrections on headers, as well as on the profiles were pegomzed by us, but the file communicated to us is probably not the final version of the data, and we will not report this validation.
4: the MOODS files recieved included profiles east of 60 W, between 25 "N and 2.5 OS (tape communicated by NODC in September 1986). Only the profiles within 20 O of the equator were retained, and vdiaked.

? 6 -
III. The data
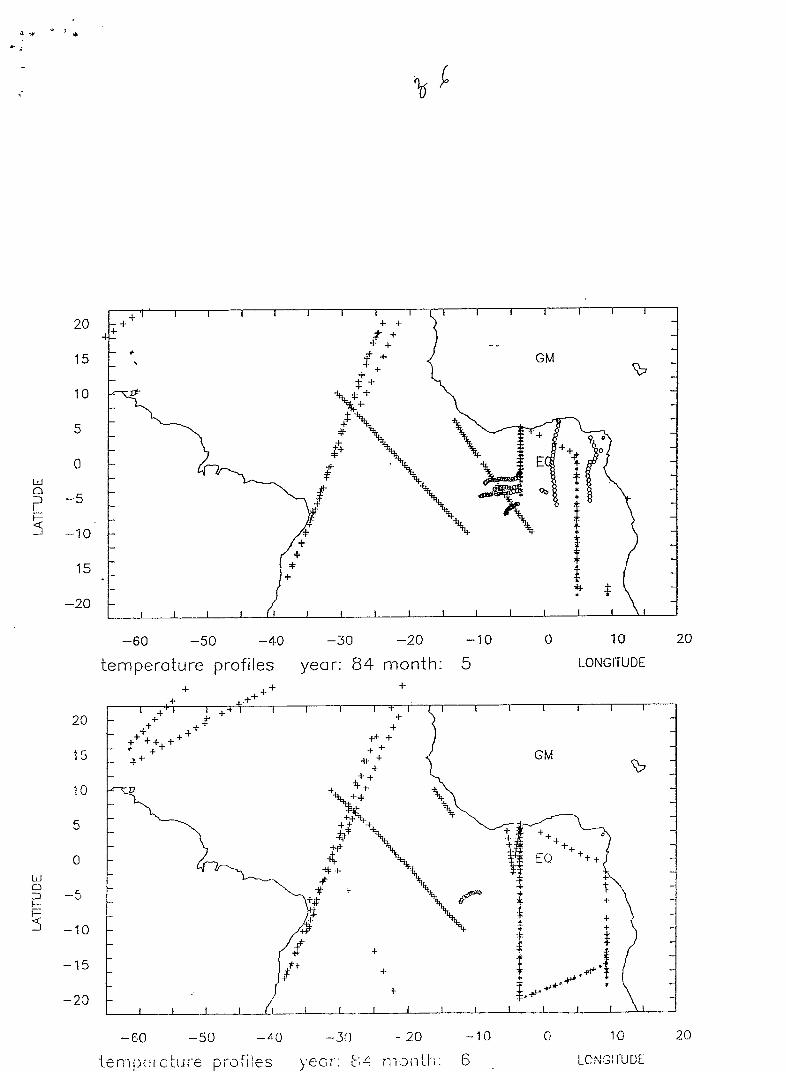
Monthly positions of the data were plotted (in Annex). On these figures, we distinguish NANSEN and buoy casts, CTD casts, and other stations (mainly XBTs and AXBTs, but there are also some mechanical BTs). MOODS data are not reported separately from the other profiles; they are widely spread over the domain, and, spatially, the tracks are sampled with a separation broader than lo. Data distribution is very uneven, and the patterns change in time. In 1982, there is a coarse coverage in the Gulf of Guinea, and in mid-1984, few profiles are found in the western Atlantic Ocean, especially between May and July 1984. In 1985,, less data are available, as the specific FOCAL-SEQUAL effort was ended.
The data are distributed in latitude bands as: -. -
25"s 20"s 15"s 10"s 5"s O" 5"N 10"N 15"N 20"N 25'N n: 199 422 609 1852 2812 3307 3620 1650 1084 385
"h20"C 198 412 607 1802 26633250 3438 1597 1067 384
nh20OC (clima.) 20894087 61056903 5158 4762
where n is the number of profiles, and n u 0 is the number of profiles for which the depth of the
20°C isotherm could be estimated (86% of the profiles were collected in 1982-1984). Most of the data are within 15" of the equator. This meridional distribution emphasizing the equator is caused by the objectives of FOCAL-SEQUAL and the SECTION program with most FOCAL sections between 5"N and 5"S, and XBT-SEQUAL between 10°N and 10"s). Alltogether, between 15"N and 15"S, the number of profiles reaching the immersion of the 20°C isotherm is 46% (40% if only 1982-1984 is considered) of the one in the previous climatology described by Merle and Amault (1987).
The time distribution of the number of data (Fig. 2) also shows the increase due to the field phase of FOCAL-SEQUAL between November 1982 and September 1984 (however, some of the FOCAL-SEQUAL data were also collected earlier on, and the SECTION cruises also show up in the data distribution). The histogram of the deepest level reached by the profiles (Fig. 3) clearly depicts the instruments used. A small peak between 100 and 120 meters is caused by the buoy data, the peak at 200 meters corresponds to mechanical BTs, likely to have been collected by Navy vessels (they originate primarily from the MOODS files, in which they account to 10% of the data). The increase between 350 and 400 nieters (6.6%) is caused by the AXBTs. At 450-480 meters (23.3% of the profiles), one finds T4 XBTs. At 490-500 meters (9.8%), there is a contribution both from the CTD-FOCAL stations, and from T4 XBTs from the XBT-WWS data ser (also, sonic T6 XBTs from XBT-SEQUAL). The surge at 740-770 meters (13.1%) is caused by T7 XBT, arid data reaching depths larger than 990 meters (16.2%) were collected during other scientific

Figure 2
I O00 number of profiles per month.
8 O0
600 I 500
400 300
200
1 O0
- _
I " "
25
20
15
10 %
5
O
I982 1983 1984 1985
Fiqure 3
distribution of the immersions reached by the stations
O 100 200 300 400 500 600 700 800 900
immersion ( m )

h 8 -
expeditions (CTD casts from ?TO, Oceanus 133, AJAX and the Oceanus sections at 11"s and 18"S, SECTION Nansen and CTD casts to 2000 meters). There is an other source of deep data, but is was not available to us.
Although they reach a large immersion, some profiles in the MOODS files, the Nansen casts and in XBT-WWS file obviously have a coarse vertical resolution. However, some profiles in the MOODS files also have a fine vertical resolution,. As we are unaware of the processing used to digitize or record these profiles, we will ommit them from the discussion hereafter.
Except for the MOODS data file and the XBT-WWS data, we generally are aware of how the profiles were processed. The data were either recorded or digitized. Processing is similar for most American SEQUAL data: i.e. they have been reported at one meter interval, and then automatically reduced at inflection points. Interpolation at 5 meter intervals is then done. An exception: the profiles in AXBT-Navy which have been de visu digitized at inflection points, and then also interpolated linearly at 5 meter interval. Data digitized by EPSHOM in France are also based on an extraction of inflection points (XBT-EPSHOM, XBT-fisheries, and the XBT-Polars tem data of 1983), and do retain large steps in the temperature profiles (larger than 10 meter thick). FOCAL CTD casts from the R.V. Capricorne have been digitized on board the vessel, retaining only inflexion points (70 to 110 points in the 500 dbars profile). The version communicated to the SEQUAL investigators was then linearly interpolated at 3 meter intervals. The CTD casts in CTD-FLOT were averaged over 10 meter steps, and the Nansen casts from the R.V. Nizery in the Gulf of Guinea, east of 0"W are at 16 levels, 12 of these been in the upper 200 meters. Other scientific cruise data (including CTD-Humboldt, XBT-Polarstern in 1984 and XBT-Port Harcourt) have generally a finer vertical resolution (with the exception of CTD-TTO, with a sampling interval of the order of 20 meters, and the Russian SECTION CTD casts sampled at 5 meter intervals), and have not been reduced at inflection points.
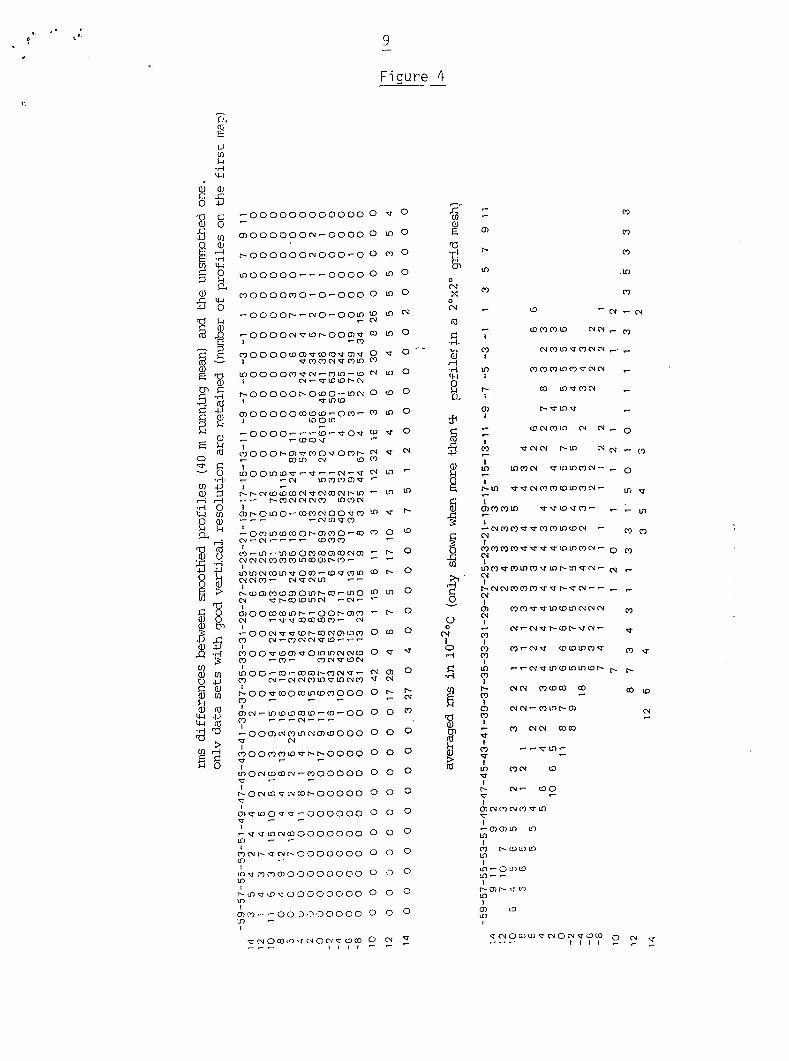
Except in the MOODS files and the Nansen casts, the "fine structure" (10 to 50 meter steps) is retained, although possibly not with the same intensity in the various files. In the 350-500 meter depth range, below the core of the thermocline, steps have been observed in various places. We investigate a level of "fine structure" in this depth range by considering the temperature change resulting from filtering the profile with a 40 meter running mean. The variance of this change is computed fro each profile and averaged in 2"*2" boxes. The rms is presented (Fiz. 4). It is very low south of 5"S, and north of 5"N away from the coast lines. It is especially large north of 10°N and south of 10"s near South America (also off-shore over lo"), and very near South-America, even in the equatorial area.
I
II +' * L' t
C.
3 -
Fiaure 4
.;i w
c. .c
~ O O O O O O O O O O O O O u 0 cn o)000000N.-0000 o 0 E
2 a
r -000000pi000~00 m 0
L-looooo---oooo o 0 O
(u
(u
m0000m0-0-000 o 0 x
-oc..~ot--No-oom w tn c-4
- 0 0 0 0 N P w r - 0 0 a P (0 0 c m o o o o w o ) v a l o o m ~ o P o - - a,
Q m m N u o m m 4
m o o o o m U @ 4 - m m - w 0 w e t - o o o o o t - o w o - m N o (D 0 a I + o ) 0 0 0 0 0 a l w w . - 0 m - ~ m 0 mcm
5 ~ o o o o - - - w - T o P w - U 0
r N rd
I -m .d. l n
4 N - P a w r - p i
7 - (OCOP
~ 0 0 0 r - o ) ~ m O o O m t - N alm N w m v - 5
A o N m o ~ a l ~ o o o o o o o 3 v b u w O u o ~ 0 0 0 0 0 0 o o 0 v -
I m U
,--om- - II N- w c P
I o ) N C ) N m P m o

i o --
IV. Information on individual files
The general information on the files is available in various data reports (a list of reports is provided), and here we will only describe some peculiarities of the files in order to estimate how the different files can be mixed in a common data set. Indeed, systematic differences between various instruments are known (for instance, the studies on the accuracy of XBT temperature profiles by Heinmiller et al. , 1982, Roemmich and Cornuelle, 1987). We are providing a persona1 judgment on the quality of each individual data set, but of course, this does not preclude that the quality of the profiles may be estimated differently for other purposes than our goal of analyzing the temperature variability in the upper ocean.
CTD-FOCAL: the data in the Gulf of Guinea east of O" are Nansen casts, emphasizing the upper 150 meters (11 bottles), and only 5 more were collected below down to 500 meters. The data available to us are the Nansen bottle data, but the profiles which were released to the SEQUAL community are 3-meter interpolated data.
CTD-TTO: the CTD stations available to us were forwarded through NODC and had a coarse vertical resolution of the order of 20 meters. According to George Heimerdinger, these data are time averaged over a depth of 2 meter when the CTD is descending. It is not obvious how the vertical motions induced by the ship alter the averaging. I am also not too sure whether the data result from a sampling or whether they were not vertically averaged over the 20 meters interval. The immersions do not increase monotonically (the CTD remains for a while at some depths, and the surface point reported is obviously erroneous (it commonly implies a density inversion)). The Nansen casts have a higher resolution near the surface.
We tried to compare the CTD casts with nearly simultaneous T4-XBT's (in XBT-Cruise) collected within 3 hours of a CTD cast. There are twenty such pairs, and the comparison for various isotherm depths yields the following:
isotherm("C) 20 19 18 17 16 15 14 13 12 11 10
depth (CTD) 103 109 114 119 126 133 149 187 238 281 321
~ C T D - ~ X B T average(m) 4.7 5.0 5.6 6.5 6.8 6.6 7.6 5.0 6.5 8.5 4.0
I-fns (m) 4.8 5.0 , 5.2 5.5 5.6 '7.1 9.6 14.7 12.2 11.8 11.7
There is a systematic difference well above noise level, unexpected from T4 XBT's in the upper part of the profile. There is also a large difference when comparing the CTD data with T7-XBTs, but these profiles are closer to the coast, and the noise in the comparison is very large, so that the results are not reliable.

11
HG5
Fiaure 5
U60 1150 U40 U30 CI20 M l 0 EO EIO E I
“20
u20 $10 EO E10 €!E W30 I I I t I I t I I l I I l
*
I U50 Ud0 i.- i.
I . .
N! O
NO
510
520 Hi5 u60 u50 U40 W30 w20
N20
NI0
NO
510
520
U30 uzo u10 EO E I 0 E i W60 U50 w40 I I I I l I I I I I 1 I l I
+ +
+’ + .l. +
+ + +
) : ,+++++ + + + +

1 L 12 -
This suggests that the largest bias for the upper 150 meters is in the CTD data. Therefore, for studies of the temperature structure in this layer, when there are both XBT and CTD profiles from ?TO, the XBT profile should be retained (the spatial distribution of these data shown on Fig. 5 is similar). Below, the comparison with the bottle data suggests that the CTD should be more accurate.
CI'D-Lynch The temperature profiles collected in July 1983 in the central Atlantic Ocean (23"W and 28"W) originate from two sets of measurements:
one is a collection of profiler data (down to 300 meters), the other one includes CTD casts down to 500 meters. The two sets are very comparable after correcting the profiler data for the atmospheric pressure (9 pairs of profiles separated by less than 3 hours, with the profiler indicating isotherm depths one meter deeper, and with a rms difference in isotherm depths of the order of 6 meters).
- -
T7-XBTs (in XBT-Cruise) were also collected along the track. When compared with profiler data. collected within 3 hours (64 pairs), one finds the following:
isotherm (OC) 20 19 18 17 16 15 14 13 12 11 depth(profi1er) 80 82 87 92 98 111 131 168 219 251
hprofiler-hXBT
average (m) -8.9 -9.3 -8.7 -8.6 -7.8 -4.9 0.4 3.3 6.7 6.6
rms (m) 7.3 7.7 8.0 9.3 10.7 11.5 12.2 17.3 18.8 22.6
The standard deviation has an expected value, but the systematic differences are too large in the upper part, and no obvious explanation for such biases can be provided. The near surface values of the XBT profiles is too cold, but its mixed layer value is normal when compared to the CTD data or bucket estimates (Perkins, personal communication). Also, no drift of the recording system was reported during the cruise. A different formula was used to estimate the depth, but this was introduced to reduce the systematic differences (Perkins, personal communication).
In the absence of other evidence, we recommend not to use the XBT data of the Lynch cruise when possible along the 23OW and 28OW sections (see, the spatial dismbution of these data on Fig. 6).
AXBT-SEOUAL.The profiles had been previously checked carefully by R. Houghton (Houghton and Colin, 1986). He noticed that some profiles seemed to be shifted (some times by niore than 0.4OC), and he corrected those by adding a constant temperature shift. He also corrected some profiles which had not started at depth O. Bottom parts of most AXBTs had to be removed, following the advice of R. Houghton, who suggested that near the equator or the coast, strong vertical shear could induce errors in the estimated deprhs below 300 meters. The corrected data were compared at the equator with simultaneous (hourly averaged) temperature data from the

I " . * ." 13
Figure 6
20
!O
YO
10
20
u10 EO €10 E! U30 u20 l l i I I l I , I 1 I I
U60 HSO U40 l t
a I U 1
a ++.I-++++ *++
+&++?+i-+*+ +++++.I-+++ 7 a I U 1 frcm the Lynch (July 19831 t
(in xKT-cruise)
. b
+
ì
I I I l 1 I I l I I 1 I
E I 0 E EO I
U30 u20 U10 i H60 uso U4G

14
FOCAL mooring (Colin and Garzoli, 1987, for a description of some of the mooring data).
In the upper themoclin where the thermistances of the moorin data of two different fde III e FOCAL-S#QUk tapes
e e closely spaced (temperature ), comparison is done
JLv#õ+d&d,-~ S ~ Q O &esc! fi1.s;~ &&XJ& .
for isotherm depths assuming that the mooring hangs vertically below its surface buoy, and that the temperature profile can be approximated by linear interpolation between the thermistance levels. For 30 observational pairs, it is found that the mooring indicates shallower depths by 2-3 meters with a rms of the order of 3.5 meter (2OOC isotherm is in the average at an immersion of 41 meters in this sample) ; as the thermistance chain is likely to have been slightly uplifted, the difference in depths could be slightly larger. It is not obvious that this (small) difference originates from the AXBTs, and not from the mooring data.
In 1984, there were also mooring measurements at 200m and 310m (respectively, 18 and 20 simultaneous AXBT profiles at these depths). At both depths, the AXBT is too warm compared to the mooring: at 200m, the mean difference is 0.15OC (rms 0.17OC) with a background temperature gradient of loC/75m, and at 310m, the mean difference is 0.18"C ( m s 0.31"C) with a background temperature gradient of loC/20m (notice that the instrument accuracy in the upper ocean is better than expected). This also suggests that the estimate of the deeper isotherm depths from an AXBT profile would be too large by the AXBT (of the order of 5 meters), (the opposite to what is expected from T4 XBTs).
These comparisons suggest that the quality of the data is good, and we do not think that a correction is required for the possible biases.
AXBT-Navv These data have been digitized by J. Carton (University of Maryland), and near the surface redigitized by us. During the process, steps larger than 10 meters are retained. There were 10 cases when a Russian station reported in the MOODS file was taken close-by. The comparison suggests that the biases do not exceed 5 meters in the upper 150 meters of the water column. With this lack of information, we will estimate that their accuracy is comparable to the one found for AXBT-SEQUAL.
FLOT-XBTs T7 XBT's (in XBT-Cruise) were collected between CTD casts. The stations were collected from an old Bisset-Behan 9040 CTD which temperature was calibrated in situ using protected thermometers "Richter and Wiese", and the temperature accuracy should be better than .0loC (the pressure estimate should be accurate to 1 or 2 decibar within the upper 500 meters). When comparing XBTs with CTDs separated by less than 3 hours (38 couples), we find:

isotherm(0C) 20 19 18 17 16 15 14 13 12 1 1
average(CTD) 73 77 81 87 96 109 132 177 246 309
CTD-XBT (m):
10 9 8 7 6
370 419 484 565 643
mean (m) O -0,4 -0,5 -0,3 -0,2 1.1 O -1.6 1.6 - O . 4 3.4 5.0 7.6 7.4 10.2
I-II-ls (m) 7.3 7.6 8.0 8.4 8.7 9.8 12.2 14.5 15.6 23.5 18.2 18.3 18.7 22.6 23.7
There is no bias in the upper 300 meters, and the standard deviation has the expected magnitude. The bias at deeper immersions follows-the expected pattem for T7 XBTs.
XBT-SEOUAL This file includes both T6 and T7 profiles, which in 1984 were alternatively used along the route (T6 reach a depth of 500 meters, as T7 reach 750 meters). For 67 (T6, T7) station pairs separated by less than 3 hours, we find:
isotherm (OC) 20 19 18 17 16 15 14 13 ' 12 1 1 10 9 8 7
averàge(T6) 99 99 103 108 115 126 149 176 215 271 323 381 445 499
h ~ 6 - h n :
mean (m) 0.6 0.0 0.2 0.9 0.8 0.4 0.4 0.9 1.8 5 . 1 5.3 5.7 7.2 7.6
l-ms (m) 9.6 9.7 9.8 10.7 11.4 13.4 15.0 20.3 21.2 21.7 24.8 32.7 29.5 26.7
If the SEQUAL T7 XBTS have the documented biases of other "7 XBTs (the FLOT XBTs and the Oceanus XBTs at 24OS, for instance), this would imply that there is almost no bias in the T6 XBTs even below 300 meters, and that on that matter there are of better quality than the T7 XBTs (this is quite different to what is usually reported for T4 XBTs with which the T6 XBTs are supposed to be closely related). Notice that an other set of T4 XBTs, along the 11"s Oceanus version, the T4 XBTs have a bias of the opposite sign to the one documented in Heinmiller et al. (1 982).
XBT(T4bFOCAL and XBT-WWS These twb sets of data are T4 XBTs used on a ship line between Europe and Brazil (slightly different tracks north of the equator). The T4 XBTs in FOCAL are expected to have an accuracy similar to the one described in the literature (large biases expected below 300 meters), but we are concemed that T4 XBTs in XBT-WWS ( W S , hereafter) have a lower quality, as the vertical resolution is often quite coarse, and the processing of digitization can bring up biases. However, there are few pairs of close stations. Even when accepting station pairs

separated by up to 1" in longitude, 0.5" in latitude and 5 days, there are only 15 station pairs, and the statistics for this comparison are:
isothem("C) 20 19 18 17 16 15 14 13 12 11 10 average(F0CAL) 107 115 123 134 148 165 192 220 263 309 340
hT4-FOCAL-hT4-WWS : mean (m) -6.3 -6.0 -3.4 -3.6 4.4 -3.6 -2.0 -5.0 -8.0 -14.3 -19.6 rms (m) 23.8 25.3. 26.2 26.3 26.6 31.6 38.0 34.7 32.0 38.2 42.8
The rms difference is much larger that I had expected. It is certainly larger than the expected variability'within the time-space bin. This suggests to me that the WWS profiles are not of the highest quality, and I would recommend to use them with great caution. The mean difference is not very large, and is within the error bars.
DiPitized XBTs There are many sets which were digitized from the SIPPICAN plots (the whole XBT( T4)-SEQUAL, XB T-EPSHOM, XBT- Capricorne, XB T-fis heries , AXBT-Nav y , 19 8 3 XBT-SEQUAL, and many profiles in the MOODS data set, although in this last case we do not know how they were processed). There is one set of XBT for which we have both the recorded and the digitized set. These are the XBT (T7) from the FLOT cruise, and the digitization was done by EPSHOM. For these 120 XBTs, we find
isotherm (OC) 20 19 18 17 16 15 14 13 12 1 1
depth(T7recorded)69 73 78 83 92 109 143 193 244 288 10 9 8 7 6
332 381 440 514 614
hT7 recorded-hT7 digitized : mean (m) 3.8 4.8 5.8 6.4 7.8 9.1 12.1 12.6 10.6 11.0
8.7 7.4 8.5 10.6 13.0 l-ms (m) 4.7 4.7 4.7 4.8 4.9 5.7 9.0 10.8 9.4 9.7
10.7 10.9 12.2 12.2 16.0
The differences are large, and could arise at various stages of the processing (or even, the plotted trace may not be very well calibrated). The rms between the two is not excessively large, and there is obviously some rather high resolution in the details of the profile retained through the
digitization. Biases will vary from one case to an other, and other examples that we had in the Indian Oce'm (SINODE cruises) suggest that the magnitude is typical.
J
Accordingly, the digitized data should be considered of a lower quality than the recordcd data. 01' course, most previous studies on XBTs have been perfornied with digitized data, alid Inq be slightly pessimistic on their quality (an exception is Cornuelle and Roemmich, 1987 who tackled
one aspect of the problem: i.e., the accuracy of recorded temperature measurements).

summary
Temperature profiles in the equatorial Atlantic Ocean during 1982-1984 originate from many different files which have been merged after a validation. It is expected that few large errors reniain in the files (13854 stations in 1982-1984), and that the number of near duplicates retained is small, although some with approximate positions were left. When merging the data sets, we investigated whether systematic differences are present which could harm our goal to investigate the temeprature structure in the tropical Atlantic. Indeed, systematic differences due to instrumental errors are present, but a careful selection of the data is often possible, and the range of errors (typically 10 meters) should not influence the analyses of the variability in the upper 300 meters of the ocean (vertical displacements of over 40 meters are expected in most parts of the equatorial Atlantic). Addressing variability below 300 m is more tricky as the systematic biases a?ê large there in some of the XBT data sets. Also, the number of profiles is less is less at these depths: less than 54% of the observations reach 490 meters.
The profiles validated for the three years 1982-1984 constitutes an important share of what is available in former validated files (the so called "historical data"). For instance, the number of profiles within 15' of the equator is 40% of the one in the pre-FGGE data set presented in Merle and Arnault (1985) pre FGGE data set. In the 300-400 depth range the share is larger (86%). The validated profiles are included in a set of files (all at the same format) which can be requested for scientific use only, either from:
Gilles Reverdin, LODYC, Paris VI, Tour 14, 4 Place Jussieu, Paris 05, FRANCE or Yves Gouriou, Antenne ORSTOM, FREMER, B.P. 70, 29263 Plouzané, FRANCE
Some of the files are of restricted use, and special request should be made for them: CTD-Humboldt, XBT-Polarstern, XBT-Port-Harcourt, XBT-EPSHOM, other-CTDs, AXB T-Nav y.
Also, notice that we retain temperature only to the hundreth of degree, anci that only the upper 1000 meters of the CTD casts were retained, and that the original data are available from NODC.
Ac kn ow led Pmen t$ All the SEQUAL data, and most data from NODC were diligently forwarded by George Heimerdinger. He also answered our numerous questions with an outstanding patience. Al l
SEQUAL and FOCAL P.1.s should be thanked for releasing their data before they were 0ffici;tlly available. I am also indebted to E. Fahrbach, H. Lass, and W. Zenk who have been very

18
cooperative in providing their data sets. This study would not have been possible without the good will and the support of J. Merle and E. Katz. The benevolent (but tea-bargained) computing support by Bruno Camusat was provided just at the time when I really needed encouragement in completing this quality checking task.

Reference2
Baue.r, P., 1982: Functional description, Master Oceanographic Data Set (MOODS). Unpublished manuscript. Compass Systems. San Diego.
Colin, C. and S. Garzoli, 1987: In situ wind measurements and the ocean response in the Equatorial Atlantic during the Programme Français Océan et Climat dans l'Atlantique Equatorial and Seasonal Response of the Atlantic Ocean Experiment. J. Geophys. Res., 92,3741-3750.
Heinmiller, R.H., C.C. Ebbesmeyer, B.A. Taft, D.B. Olson and O.P. Nikitin, 1983: Systematic errors 'in expendable bathythermograph (XBT) profi,les. Deep-sea Res., 30, 1 185- 1197.
Houghton, R. and C. Colin, 1986: Thermal structure along 4OW in the Gulf of Guinea during 1983-1984. J. Geophys. Res., 91, 11727-1 1739.
Merle, J. and S. Arnault, 1985: Seasonal variability of the surface dynamic topography in the tropical Atlantic Ocean. J. Mar. Res., 43,267-288.
Roemmich, D. and B. Cornuelle, 1987: Digitization and calibration of the expendable bathythermograph. Deep-sea Res., 34,.
Weisberg, R.H. and T. Tang, 1987: Further studies on the response of the equatorial thermocline in the Atlantic Ocean to the seasonally varying trade winds. J. Geophys. Res., 92, 3709-3727.
Weisberg, R.H. and T.J. Weingartner, 6986: On the baroclinic response of the zonal pressure gradient in the equatorial Atlantic Ocean. J. Geophys. Res., 91, 11717-1 1725.

21 -
Data remorts
Boyd, J.D., H. Perkins and K.D. Saunders, 1985: Hydrographic measurements off the Northeast Coast of South America. July 1983. NORDA-305.
Bruce, J.G., 1987: XBT observations between 1O0N-1OoS in the Atlantic from ships-of-opportunity complemented by AXBT surveys. WHOI-87-41.
Chuchla, R., M. Privé, P. Gallis, R. Gérard and F. Jarrige, 1986: Programme FOCAL, XBT-Atlantique 1981-1982. Doc. Tech. ORSTOM, no 33,1986.
Chuchla; R., M. Privé, R. Gallis and P. Rual, 1986: Programme FOCAL, XBT Atlantique 1983-1984. Doc. Tech. ORSTOM, no 35,1986.
Gamberoni, L. and M. Fieux, 1985: MD36/FLOT à bord du "Marion Dufresne", 29 mai-5 juillet 19 83. TAM-8 3-03.
Hénin, C., P. Hisard and B. Piton, 1986: Observations hydrologiques dans l'Océan Atlantique équatorial (juillet 1982-août 1984). ORSTOM, Travaux et Documents No 196.
Knapp, G.P. and H.M. Stommel, 1985: Hydrographic data from R.V. Oceanus Cruise 133, Leg VII. WHOI-85-38.
Mele, P.A. and E.J. Katz, 1985: Report of XBT data from four SEQUAL cruises. LDGO-85-2.
Mele, P.A. and R.W. Houghton, 1985: SEQUAL AXBT report, 1983-1984. LDGO-85-3.
Reverdin, G. and A. Kartavtseff, 1985: Bouees FOCAL, mai 1983-avril 1985, recueil des trajectoires et series temporelles. Mai 1985.
SCRIPPS and TEXAS A&M, 1985: Physical, chemical and in situ CTD data from the AJAX expedition in the South Atlantic Ocean. SIO-85-24, TAMU-85-4-D.

u 3 n 'L
t- Q
w 3 o t 'j -
Annex : monthly d i s t r ibu t ions of the prof i les 1c CTD s t a t i o n s 9 Nansen c a s t s and buoy thermistance chain data t expandable bathy thermograms and other p ro f i l e s
20
15
10
5
O
-5
-10
15
-20
20
*r 13
10
5
O
-5
-10
-15
- 23
-60 -50 -40 -30 -20 -10 O 10 20
temperature profiles year: 82 month: 1 LO NGlTU DE +

w o
w
20
15
10
5
O
-5
-1 o
15
-20
-60 -50 - 40 -30 -20 -10. O 10 20
temperature profiles yea.r: 82 month: 3,' . i +
LONGITUDE
4

I ‘I ’. ’ L
20
15
10
5
O
-5
-10
i 5
-20
20
15
10
5
O
-5
-10
-15
-20
r
- 60 -50 - 40 - 30 -20 -10 O 10 20
temperature profiles year: 82 month: 5 LONGITUD E
i-

I
20
15
10
5
O
-5
-10
15
- 20
-40 -30 -20 -1 o O 10 20 -60 -50 temperature profiles year: 82 month: 7 LONGITUDE
-+ r I I l I I 1 l I ' I L I I I 1 1 I l
20
15
10
5
O W n
-5
-10
i2
-1 5
-20
GM +++
+ +
t - + ++
- 20 -10 O 1 ,3 20 - 60 -- 50 -40 - 30 teryir,erû';i;r e profi les )'ear: E 2 rnorìth: 8 LDf:WU3E

20
15
10
5
O
-5
-10
15
-20
-60 -50 -40 -30 -20 -10 O 10 20
t empera ture profiles year: 82 month: 9 LONGITU DE
20
15
10
5
O
-5
-10
-15

20
15
10
5
O
-5
-1 o
15
-20
I I I I I I +I I - + - -
+ - 20
15
10
5
O
-5
-10
-15
-20

w Q 3 I
5
LLi
3
k-
n
t 4
20
15
10
5
O
-5
-10
15
-20
20
15
10
5
O
-5
- 10
-15
- 23

20-
15
10
5
O
-5
-1 o
15
-20
temperature profiles year: 83 month: 3 - LONG ITU DE
20
45
10
5
O
-5
-10
- 15
- 23

W o ? 4
W
3 n t 3
20
15
10
5
O
-5
-10
15
-20
- 60 -50 -40 -30 -20 -10 O 10 20
temperature profiles year: 85 month: 5 LONGITUDE 4- L f
20
15
10
5
o
-5
-10
-15
-2c
+ - 5 ! ) - 50 -40 - 30 - .!U -10 o 10 20

20
15
10
5
O
-5
-1 o
15
-20
-60 -50 - 40 -30 -20 -10 O 10 20
temperature profiles year: 83 month: 7 LONGITUDE
I- + +
20
15
10
5
O
-5
-10
-15
on -LW

W 0 3 I
4
W
3 n t- 5
20
15
10
5
O
-5
-10
15
-20
20
I f ,
10
5
O
-5
-10
-15
-20
:+ j *+' + + I- + '
GM
+ 1 ' ++k p-.+ L + . ,=: I * -
I + + - + ' - - -
I 1 I I I I I l 1 I I I I I I
O IO 20 -60 -50 -40 - 30 -20 -10
temperature profiles year: 83 month: 9 LONGITUDE
i - +

d
20
15
10
5
O
-5
-1 o
15
-20
- 60 -50 - 40 -30 -20 -10 O 10 20
temperature profiles year: 83 month: 1 1 LONGITUDE
20
15
10
5
O
n 3 -5 t
w
t- 4 -10
-15
-2C
+ - -
- c -
+ + + p++ + + + + + - - -
t - 60 -50 - 40 -30 - 20 -10 O 10 20

20
15
10
5
O
-5
-1 o
15
-20
311
-60 - 50 -40 -30 - 20 -10 O 10 20
temperature profiles year: 84 month: 1 LONGITUDE
20
15
10
5
O
-5
-10
-15
-2G

4 I
3 ¿
20
15
10
5
O
-5
-10
15
-20
- 60 - 50 - 40 -30 -20 -1 o O 10 20
temperature profiles year: 84 month: 3 LONGITUDE
20
15
10
5
O
-5
-10
-15
I ri n LU
w Q
? 4
w 3 n
t. 4
20
15
10
5
O
-5
-10
15
-20
-60 -50 - 40 -30 -20 -10 O 10 20
t empera ture profiles year: 84 month: 5 LONGITUDE
+ +
20
I t ,
10
5
O
C -LJ
-10
-15
- 23

a l
3 y'
+
- 60 -50 -40 -30 -20 -1 o O 10
temperature profiles year: 84 month: 7 LONGITUDE
I l I I 1 1 I I 1 ( 1 I
+ .
+ 20 * *
f
15 1 +, + L
10
5
O
-5
-?O
-15
-20
+
* * * *
t
+ + + i
+++ +++ + I
4 + + * + t
1 I l I l
b GM
+
4 + + * t
20

t
20
15
10
5
.o
-5
-10
15
-20
-60 -50 - 40 -30 - 20 -10 O 10 20
temperature profiles year: 84 month: 9 LONGITUDE
20
15
10
5
O
-5
-19
-15
- 20

20
15
10
5
O
-5
-1 o
--15
<> n -"Lu
-60 -50 - 40 -30 -20 -10 O 10 20
temperature profiles year: 84 month: 1 I LONGlTU DE