framework for boosting intra-african trade in …
TRANSCRIPT

FRAMEWORK FOR BOOSTING INTRA-AFRICAN TRADE IN AGRICULTURAL COMMODITIES AND SERVICES


Published bythe Food and Agriculture Organization of the United Nationsand the African Union CommissionAddis Ababa, 2021
FRAMEWORK FOR BOOSTING INTRA-AFRICAN TRADE IN AGRICULTURAL COMMODITIES AND SERVICES

FAO and AUC. 2021. Framework for boosting intra-African trade in agricultural commodities and services. Addis Ababa. https://doi.org/10.4060/cb3172en
The designations employed and the presentation of material in this information product do not imply the expression of any opinion whatsoever on the part of the Food and Agriculture Organization of the United Nations (FAO) or African Union Commission (AUC) concerning the legal or development status of any country, territory, city or area or of its authorities, or concerning the delimitation of its frontiers or boundaries. The mention of specific companies or products of manufacturers, whether or not these have been patented, does not imply that these have been endorsed or recommended by FAO or AUC or in preference to others of a similar nature that are not mentioned.”
The views expressed in this information product are those of the author(s) and do not necessarily reflect the views or policies of FAO or AUC.
ISBN 978-92-5-133914-5 ©FAO and AUC, 2021
Some rights reserved. This work is made available under the Creative Commons Attribution-NonCommercial-ShareAlike 3.0 IGO licence (CC BY-NC-SA 3.0 IGO; https://creativecommons.org/licenses/by-nc-sa/3.0/igo/legalcode).
Under the terms of this licence, this work may be copied, redistributed and adapted for non-commercial purposes, provided that the work is appropriately cited. In any use of this work, there should be no suggestion that FAO or AUC endorses any specific organization, products or services. The use of the FAO or AUC logo is not permitted. If the work is adapted, then it must be licensed under the same or equivalent Creative Commons license. If a translation of this work is created, it must include the following disclaimer along with the required citation: ‘This translation was not created by the Food and Agriculture Organization of the United Nations (FAO) or African Union Commission (AUC). FAO and AUC are not responsible for the content or accuracy of this translation. The original English edition shall be the authoritative edition.’
Disputes arising under the licence that cannot be settled amicably will be resolved by mediation and arbitration as described in Article 8 of the licence except as otherwise provided herein. The applicable mediation rules will be the mediation rules of the World Intellectual Property Organization http://www.wipo.int/amc/en/mediation/rules and any arbitration will be in accordance with the Arbitration Rules of the United Nations Commission on International Trade Law (UNCITRAL)
Third-party materials. Users wishing to reuse material from this work that is attributed to a third party, such as tables, figures or images, are responsible for determining whether permission is needed for that reuse and for obtaining permission from the copyright holder. The risk of claims resulting from infringement of any third-party-owned component in the work rests solely with the user.
Sales, rights and licensing. FAO information products are available on the FAO website (www.fao.org/publications) and can be purchased through [email protected]. Requests for commercial use should be submitted via: www.fao.org/contact-us/licence-request. Queries regarding rights and licensing should be submitted to: [email protected].

iii
CONTENTSForeword v
Acknowledgements vi
Acronyms vii
Executive Summary viii
A. Introduction 1
B. Rationale and overview of the framework 3
C. Methodology 4
D. Policies and structural reforms 4
Malabo Declaration and structural reforms 4The African Continental Free Trade Area (AfCFTA) 6Key pillars of Africa’s regional integration 7
E. Macroeconomic overview 8
Trends in economic growth 8Agricultural transformation 11
F. Trade and food security 14
Food and nutrition security 14Trade and food security 16
G. Agricultural trade in africa 19
Trends in agricultural trade in Africa 19African agricultural exports 21African agricultural imports 23Africa agricultural outlook 25Trade in services 25
H. Challenges and constraints to Intra-African agricultural trade 28
Supply-side constraints 28Business environment 28Informal cross-border trade 29Agricultural value chains 29Tariffs 30Non-tariff barriers 30Demand and supply shocks during COVID-19 31Rules of origin 34Trade remedies, dispute settlement and intellectual property rights protection 34Internet connectivity and digitalization 35Market information systems and statistics on trade 35Climate change and trade 35Gender, youth and trade 37Other challenges 37
I. Sustainable financing to support implementation 38
J. Implementation of the framework 41
Institutional arrangements 41Roadmap 41The way forward 47
References 58
Annex 1: Top agricultural commodities traded by subregion 64
iv
FIGURESFigure 1: Structure of the AfCFTA Agreement 6
Figure 2: Africa Regional Integration Index (ARII) 8
Figure 3: GDP growth before the COVID-19 crisis 9
Figure 4: Remittances as a share of GDP in Africa in 2019 10
Figure 5: Agricultural value added (percentage of GDP) 11
Figure 6: Employment in agriculture as a share of total employment (percentage) 12
Figure 7: Trade and food security 18
Figure 8: Africa’s agricultural imports and exports, constant unit values (USD 1 000, Year 2000) 19
Figure 9: Subregional shares of African agricultural imports and exports (percentage) and net agricultural trade, constant prices (USD 1 000, Year 2000) 20
Figure 10: Agricultural exports 2005–2007 and 2015–2017 by African RECs 21
Figure 11: Africa’s top agricultural exports (average 2015–2017) and share of intraregional trade 22
Figure 12: Agricultural imports 2005–2007 and 2015–2017 by African REC 23
Figure 13: Africa’s top agricultural imports (average 2015–2017) and share of intraregional trade 24
Figure 14: Key services in the food and agricultural sector 26
Figure 15: Aid for Trade distribution for Africa, 2007–2017 39
TABLESTable 1: Regional implementation of the CAADP Process/Malabo Declaration 5
Table 2: Import-dependency ratios (percentage) 13
Table 3: Prevalence of undernourishment in Africa and its subregions (percentage), 2000–2018 14
Table 4: Number of undernourished in Africa and its subregions (in millions), 2000–2018 15
Table 5: Agricultural outlook, 2019–2028 (in 1 000 metric tonnes) 25
Table 6: Trade and market disruptions and policy responses 32
Table 7: Roadmap for the Framework for Boosting Intra-African Trade in Agricultural Commodities and Services 47
BOXESBox 1: Trade and food security 16
Box 2: Benefits and challenges of the liberalisation of agricultural services in Africa 27
Box 3: Climate-smart agriculture 36
Box 4: Aid for Trade 39
Box 5: Selected African Union programmes 43
Box 6: Selected PIDA projects 45

v
FOREWORDIt is a great honour and pleasure to bring to you the first Framework for Boosting Intra-African Trade in Agricultural Commodities and Services. The Framework represents a paradigm shift from “business as usual” and translates the commitments undertaken by the African Union (AU) into tangible programmes and actions to expand trade among AU Member States within the African Continental Free Trade Area (AfCFTA). It supports closer regional economic integration and the removal of barriers to unlock the potential of the agricultural sector to contribute to sustainable and inclusive growth for Africa’s rapidly growing and urbanising population.
The Framework rests on a solid foundation based on the commitments agreed to by AU Member States. These commitments include advancing Agenda 2063: the Africa We Want; the Comprehensive Africa Agriculture Development Programme (CAADP); the Malabo Declaration on Accelerated Agricultural Growth and Transformation for Shared Prosperity and Improved Livelihoods; the 2030 Agenda; and the Sustainable Development Goals (SDGs), particularly SDG 2 on ending hunger, achieving food security and improved nutrition and promoting sustainable agriculture. This document complements other initiatives such as the 15 AU flagship programmes, which also include the AfCFTA, CAADP and the Continental Agribusiness Strategy.
The Framework provides a timely blueprint for the structural transformation of agriculture and sustainable growth and prosperity in Africa. A key priority is the pursuit of industrial transformation policies and programmes that support the private sector to add value to African exports, compete with imports from outside Africa and expand opportunities for job creation. At the same time, since the beginning of 2020, Africa and other regions have put in place necessary response measures to contain the spread of COVID-19. As a result, the agricultural, commodity and tourism sectors in Africa have been severely affected by the measures taken to halt the spread of the pandemic, as evidenced by the sharp decline in commodity prices, sporadic shortages, food price increases in net food-importing countries and the collapse of export demand in external markets. Even the official date for the commencement of trading under the AfCFTA had to be postponed to 1 January 2021 in light of the health crisis. Yet, many policy-makers and business leaders, such as the Afrochampions, remain hopeful and share the vision of a transformed and more resilient Africa led by the AfCFTA, forging a pathway out of the current pandemic.
The AfCFTA is the largest free trade area in the world since the establishment of the World Trade Organization (WTO) in 1995, covering at least 54 Member States and a market of 1.2 billion consumers with a combined income of USD 2.5 trillion. The benefits of a seamless free trade area include the economies of scale and scope flowing from
expanded market access and market linkages connecting smallholder farmers and both small-size and larger enterprises in regional value chains within a single market. This mega free trade area promises to create the right conditions for a business environment that is conducive for inward investment and for a modern, dynamic, productive, inclusive and resilient sustainable agricultural sector to thrive using science, technology, innovation and indigenous knowledge.
It is expected that the coronavirus-induced responses and similar initiatives to the economic crisis, including the promotion of local production and import substitution, will not only help to expand intra-African trade and sustain and improve livelihoods, but also build African food systems that are more resilient to future supply shocks while significantly reducing Africa’s food import bill.
This practical and timely Framework will help guide policy-makers and the private sector to develop roadmaps and action plans for the implementation of the AfCFTA Agreement with a specific focus on agriculture. The national and regional action plans developed will support the private sector to address non-tariff barriers and benefit from AfCFTA market access opportunities as well as obtain financing to develop productive capacity to grow exports of agricultural commodities and services.
Ghana has been chosen by the Assembly of Heads of State and Government of the African Union to host the AfCFTA Secretariat. The mandate of the Secretariat will be to implement the AfCFTA Agreement which, to date, has been ratified by 36 Member States. The AfCFTA Secretariat will leverage the continent’s advantages – political will, commodities, human resources and its strategic location and proximity to international shipping lanes – for an integrated, prosperous and peaceful Africa. We look forward to the progressive expansion of trade under the AfCFTA and a brighter future for most of the population, including youth and women, on the African continent.
H.E. Josefa Leonel Correia Sacko Commissioner for Rural Economy and Agriculture African Union Commission
Abebe Haile-Gabriel Assistant Director-General and Regional Representative for Africa Food and Agriculture Organization of the United Nations (FAO)
H.E. Wamkele Mene Secretary General African Continental Free Trade Area Secretariat
vi
ACKNOWLEDGEMENTSThe Framework for Boosting Intra-African Trade in Agricultural Commodities and Services was jointly developed by the African Union Commission (AUC) and the Food and Agriculture Organization of the United Nations (FAO) Regional Office for Africa (RAF).
This publication was prepared under the technical guidance and leadership of Jean Senahoun (RAF) and Komla Bissi (AUC), under the overall supervision and guidance of H.E. Amb. Thomas Kwesi Quartey, Deputy Chairperson of the AUC, H.E. Amb. Josefa Leonel Correia Sacko, Commissioner for Rural Economy and Agriculture of the AUC, and Abebe Haile-Gabriel, FAO Assistant Director-General and Regional Representative for Africa, assisted by Ade Freeman, FAO Regional Programme Leader.
The AUC-FAO collaboration was supported and facilitated by Nomathemba Mhlanga FAO Subregional Office for Eastern Africa under the guidance of David Phiri, SFE coordinator.
The development of the Framework received extensive contributions and guidance from Janet Edeme, Josue Dione and Kennedy Mukulia Ayason of the AUC.
For FAO, valuable contributions were received from Ameir Mbonde, Mankan Koné, Mark Fynn, Ishrat Gadhok and Georgios Mermigkas. Specific review comments from Andre Croppenstedt were helpful in revising the final draft.
The authors thank the participants of the joint AUC/ECA/FAO Validation Workshop for the Guidelines Framework for the Development of Regional Agricultural Value Chains and the Framework for Boosting Intra-African Trade in Agricultural Commodities and Services (October 2019) for their helpful comments and suggestions.
Further appreciation goes to the Communications Unit of RAF, including Zoie Jones, Joas Fiodehoume, Samuel Creppy and Samuel Owusu Baafi, and to Kiertey Azakudo.

vii
ACRONYMS3ADI+ Accelerator for Agriculture and Agroindustry
Development and Innovation
ACE Agricultural Commodity Exchange for Africa
AfCFTA African Continental Free Trade Area
AfDB African Development Bank
AFREXIM African Export and Import Bank
AFSA Africa Food Safety Agency
AGOA African Growth and Opportunity Act
AMIS Agricultural Market Information System
AMU Arab Maghreb Union
ATO African Trade Observatory
AUC African Union Commission
BIAT Boosting Intra-African Trade
CAADP Comprehensive Africa Agriculture Development Programme
CAC Codex Alimentarius Commission
CAAP Common African Agro-Park
CBM Coordinated Border Management
CENSAD Community of Sahel-Saharan States
COMESA Common Market for Eastern and Southern Africa
COVID-19 Coronavirus Disease 2019
CSA Climate-Smart Agriculture
DfID Department for International Development of the United Kingdom
EAC East African Community
EAGC East African Grain Council
ECCAS Economic Community of Central African States
ECOWAS Economic Community of West African States
FAO Food and Agriculture Organization of the United Nations
GDP Gross Domestic Product
GIEWS Global Information and Early Warning System
GNSAS Grain Network of Southern Africa Stakeholders
HS Harmonised System/Harmonised Commodity Description and Coding System
IBM Integrated Border Management
ICT Information and Communications Technology
IGAD Intergovernmental Authority on Development
IPPC International Plant Protection Convention
IUU Illegal, Unreported and Unregulated Fishing
LDC Least Developed Country
MFN Most Favoured Nation
MSME Micro, Small and Medium-Size Enterprise
NAIP National Agricultural Investment Plan
NEPAD New Partnership for Africa’s Development
NPCA NEPAD Planning and Coordination Agency
NTB Non-Tariff Barrier
NTM Non-Tariff Measure
OECD Organisation for Economic Co-operation and Development
OIE World Organisation for Animal Health
PAPSS Pan-African Payment and Settlement System
PAQI Pan-African Quality Infrastructure
PIDA Programme for Infrastructure Development in Africa
RAIP Regional Agricultural Investment Plan
RATIN Regional Agricultural Trade Intelligence Network
REC Regional Economic Community
ReSAKSS Regional Strategic Analysis and Knowledge Support System
RESIMAO West African Network of Market Information Systems
SACCO Savings and Credit Cooperative Organization
SADC Southern African Development Community
SDG Sustainable Development Goal
SPS Sanitary and Phytosanitary Measures
SSDP Services Sector Development Programme
TBT Technical Barrier to Trade
TFI Trade Facilitation Index (associated with the CAADP/Malabo process)
UNCTAD United Nations Conference on Trade and Development
UNECA United Nations Economic Commission for Africa
WAGN West African Grain Network
WHO World Health Organization
WTO World Trade Organization
viii
The Framework for Boosting Intra-African Trade in Agricultural Commodities and Services is built around the fifth commitment of the 2014 Malabo Declaration to triple intra-African trade in agricultural commodities and services by 2025. Increased trade will help create sustainable jobs, incomes and livelihoods while improving long-term agricultural productivity and food security on the continent.
Recent evidence suggests that the export of agroprocessed and other value added goods made in Africa is greater in regional markets than in external markets outside Africa, typically dominated by mostly low-value raw material exports. The African Continental Free Trade Area (AfCFTA), which will start trading in January 2021, is expected to accelerate economic integration and expand trade in Africa’s first single market of 1.2 billion people, valued at USD 2.5 trillion. The World Bank (2013) estimates that the value of Africa’s agriculture and agribusiness market could expand to USD 1 trillion by 2030.
The agreement establishing the AfCFTA entered into force on 30 May 2019, covering 54 of the 55 African Union (AU) Member States (except Eritrea), 36 of which have ratified the agreement so far. African countries have undertaken commitments to remove tariffs on 90 percent of over 5 000 tariff lines as well as liberalise services. It is estimated that tariff liberalisation in the transition phase could generate welfare gains of USD 16.1 billion, and growth in intra-African trade of 33 percent up from 15 percent (UNCTAD, 2019).
However, Africa’s growth is likely to be adversely affected by the COVID-19 shock. The health crisis has already erased some of the gains achieved by African countries over the last two decades, marking the first recession in the region in 25 years. Restrictive measures have disrupted essential services such as food production
and processing, imports of food and other essentials, transportation and other key functions of agricultural supply chains. Lessons learned from the pandemic crisis include maintaining open trade channels safely, policy coordination and transparency between member states and protecting essential workers to ensure that public health and food systems continue to operate.
The pandemic has exposed Africa’s food insecurity and vulnerabilities to trade disruptions of food imports on which the continent depends. For example, the number of undernourished people in Africa increased to 256 million people in 2018, well before the current pandemic. In the next 10 years, it is projected that agricultural demand in Africa will continue to outstrip agricultural supply. Despite its vast agricultural potential, Africa remains a net importer of agricultural products with a food import bill of about USD 80 billion per year compared with exports of USD 61 billion in 2015–2017.
Africa is ranked among the lowest performing regions, according to the World Bank Doing Business indicators and as measured by the share of intra-African agricultural trade as a percentage of total African agricultural trade, which has consistently remained below 20 percent in recent years. Overall progress on achieving the Malabo Declaration commitments by 2025 and on regional integration in general has been slow due to country disparities in the levels of development, inconsistent and conflicting regulations and standards, as well as infrastructure and connectivity problems at the border and behind the border that add to the cost of doing business in Africa (Benin, 2020).
The Framework identifies several major challenges and constraints to food security arising from issues of limited productive capacity and intra-African trade. As documented in the AU’s 2019 Biennial Review and other sources, the poor state of infrastructure in Africa such as water, roads and telecommunications has reduced economic growth by 2 percent and lowered productivity by as much as 40 percent annually. Meeting the growing demand for trade and investment in the agricultural sector remains a major challenge in Africa, where it is estimated that only 10 percent of farmers have access to credit.
EXECUTIVE SUMMARY
ix
EXECUTIVE SUMMARYFood safety measures and other non-tariff barriers (NTBs) act as major barriers to trade compared to tariffs. Estimates show that domestic food prices in sub-Saharan Africa are 13 percent higher on average due to sanitary and phytosanitary (SPS) measures only. Other NTBs contribute to high domestic transportation costs, accounting for between 50 and 60 percent of marketing costs in the region, while roadblocks very often add to the cost of transport. In the agricultural services sector, several factors contribute to increased trade costs of services and decreased competitiveness, including compliance costs, regulatory barriers and language differences.
Tariffs, NTBs, gender inequality and poor skills limit access to the formal economy and therefore contribute to poor compliance with SPS measures and high levels of informality such that informal cross-border trade accounts for at least 30-40 percent of total intraregional trade. Women account for between 60 percent and 70 percent of informal cross-border traders while 90 percent of informal workers are women and youth.
While countries are beginning to trade more and more with one another, food security will continue to be underpinned by imports for the foreseeable future. Accordingly, AU Member States have undertaken commitments to accelerate the implementation of the Malabo Declaration and the AfCFTA Agreement to ensure increased levels of intra-African trade in agricultural commodities and services and reduce food insecurity – the basis and rationale for the Framework for Boosting Intra-African Trade in Agricultural Commodities and Services.
The Framework was jointly developed by the African Union Commission (AUC) and the Food and Agriculture Organization of the United Nations (FAO), in consultation with member states, regional economic communities (RECs), the private sector and civil society. The document is organized into ten sections: introduction, rationale and overview, methodology, policies and reforms, macroeconomic overview, trade and food security, trends of traded agricultural products, challenges to intra-African trade in agriculture, sustainable financing, and the implementation strategy.
The Framework contains a roadmap with seven clusters based on the Boosting Intra-African Trade (BIAT) Action Plan adopted at the 2012 Assembly of the African Union. The roadmap translates BIAT objectives into tangible outputs and actions in terms of short, medium and long-term activities. The seven clusters are trade policy, trade facilitation, productive capacity, trade-related infrastructure, trade finance, factor market integration and cross-cutting issues, including the strengthening of trade and market information systems.
The implementation of the Framework will be led by the AUC at the continental level, by RECs at the subregional level and by Member States at the country level, building on and working with existing institutional and coordination mechanisms and structures. Other key stakeholders in the implementation process will include the private sector, civil society and development partners. The implementation of the Framework will require substantial investment from all key partners, repurposing of available resources where necessary and other innovative financing mechanisms.
Additionally, the implementation of the Framework will prioritise harmonisation of trade regimes, rules of origin and NTBs. Other actions will cover regulatory reforms to improve trade facilitation, enhance access to finance for the private sector, and address barriers to the movement of people. The Framework also addresses challenges in African productive capacity and poor physical infrastructure, and promotes the digitalisation of markets and information systems in coordination with new and ongoing initiatives such as the AU flagship programmes.

1
A. INTRODUCTIONThe African agricultural and food market is expanding quickly as indicated by World Bank projections that show that the value of Africa’s agriculture and agribusiness industry is expected to more than triple to reach USD 1 trillion by 2030, compared to 2010 (World Bank, 2013). This provides an opportunity to not only boost trade in food and non-food agricultural commodities and services within the continent but also enhance food security in Africa. Regional integration is also gaining momentum as evidenced by progress in the creation of customs unions and the initial steps in setting up a common external tariff at the regional level in a number of regional economic communities (RECs) such as the East African Community (EAC) and the Economic Community of West African States (ECOWAS). The establishment of the African Continental Free Trade Area (AfCFTA) further reinforces the gains achieved in regional integration and opens new market opportunities for farmers and other economic operators. It has been shown that the export of higher value-added products made in Africa is greater in regional markets than in external markets outside Africa, which are typically dominated by raw material exports.
However, more than a decade after the adoption of the Comprehensive Africa Agriculture Development Programme (CAADP) in Maputo in 2003 by the New Partnership for Africa’s Development (NEPAD) in response to the stagnation of African agriculture, Africa continues to remain a marginal player, accounting for only 2.7 percent of world trade in goods and 5 percent of world agricultural trade (Bouët and Odjo, 2019). These figures are likely to trend downwards significantly in the near term due to the economic shock caused by the onset of the COVID-19 pandemic in 2020. The continent currently depends to a significant degree on extra-African sources for imports of food and agricultural products. The share of intra-African agricultural trade has been consistently below 20 percent in recent decades (Bouët and Odjo, 2019; AGRA, 2019). Comparable figures for intraregional agricultural trade are higher for Asia and Europe (more than 60 percent). Additionally, Africa remains a net food importer as the continent’s demand for food continues to outstrip domestic supply. According to FAO (2019), sub-Saharan Africa’s food import bill was USD 48.7 billion in 2019 compared to USD 46.9 billion in 2018. The food import bill for the whole of Africa was about USD 80 billion per year in 2015–2017. However, as the COVID-19 hits globally, food imports are likely to be affected by disruptions in international logistics and distribution and other containment measures.
To take advantage of the fast growing intra-African market opportunities and be competitive, African agriculture must undergo structural transformation that entails shifting from subsistence-oriented production systems towards more market-oriented and inclusive ones. Transformation can be achieved through improvements in farm-level productivity, inputs, mechanization and post-harvest management driven by investment and technology within a coordinated and effectively executed policy framework. This aims to ensure that the benefits also accrue to the most vulnerable segments of the population, including smallholder farmers, rural women and youth while at the same time linking farmers to regional and global value chains. The transformation of African agriculture is necessary to help build and maintain a resilient sustainable food system, which is imperative for minimizing the social, economic and human impact of the COVID-19 pandemic as well as meeting the food security needs of Africa’s growing population.
The Framework draws on the vision, mission, guiding principles, objectives, results and lessons of NEPAD, CAADP and the 2014 Malabo Declaration on deepening economic integration and promoting agro-based industrialisation through expanded market access and trade. The Framework was derived from an earlier decision taken by the Assembly of the African Union to establish a Continental Free Trade Area and endorse an Action Plan for Boosting Intra-African Trade (BIAT) at its 18th Ordinary Session held in Addis Ababa, Ethiopia, in January 2012 (Assembly/AU/Dec. 394 (XVIII)). The decision taken was aimed at deepening Africa’s market integration and using trade to serve as an effective instrument for rapid and sustainable development.
1 According to the draft African Union Commodity Strategy (DTI/STC-TIM/SO/5[II]), agriculture is defined broadly to encompass crops, livestock, fisheries and forestry subsectors, and is key to broad-based and inclusive economic growth, enterprise development and employment creation, food and nutrition security and poverty eradication in Africa.
2 The food import bill reported in this document is higher than in AfDB (2016), where Africa spent USD 35 billion on food imports in 2015. In AfDB (2016), the food import bill is the agricultural trade balance (exports minus imports) in 2015 and excludes intra-African agricultural trade, while the FAO estimate of Africa’s food import bill corresponds to the total agricultural imports in nominal terms per year in 2015–2017. The value of total agricultural imports as reported in the Framework is a better measurement of the food import bill.

2
For this reason, the Framework incorporates the key elements of these initiatives, particularly the fifth commitment of the Malabo Declaration on tripling intra-African trade in agricultural commodities and services by 2025. Other programmes such as the Continental Agribusiness Strategy and ongoing work to develop the AU Commodities Strategy, including the prioritisation of strategic food and non-food agricultural commodities as well as commodities from the mining and energy sectors at the national, regional and continental levels, informed the development of the Framework. Additionally, the establishment of the AfCFTA in 2018 increased the urgency for a comprehensive framework that would articulate the response by AU Member States to this new market opportunity in the agricultural and other sectors. The priorities contained in this Framework for agricultural trade were discussed and recommendations agreed at a joint AUC/FAO/ECA validation workshop of key stakeholders held in in October 2019 in Nairobi, Kenya.
This document is organized into 10 sections. The next section (Section B) presents the rationale and overview of the Framework for Boosting Intra-African Trade (BIAT) in Agricultural Commodities and Services. Section C covers the methodology of the Framework. Section D reviews the policies and reforms to address agricultural transformation and trade. Section E provides a macroeconomic overview, highlighting the drivers of intraregional trade. Section F is about the linkages and interaction between trade and food security. Section G focuses on trends and prospects of trade in the main agricultural products in Africa. Section H discusses the challenges and constraints to intra-African trade in agriculture. Section I is about sustainable financing while Section J outlines the implementation strategy which includes the institutional arrangements and the roadmap of the Framework.

3
B. RATIONALE AND OVERVIEW OF THE FRAMEWORKA key objective of the Framework for Boosting Intra-African Trade in Agricultural Commodities and Services is tripling intra-African trade in agricultural commodities and services, one of the seven commitments of the Malabo Declaration undertaken by African governments. Africa is a net food-importing region of commodities such as cereals, meat, dairy products, fats, oils and sugar. The thrust of the Framework includes strengthened policy and trade regime coordination, including food and trade standards; food safety and compliance; expanded market-oriented infrastructure that is demand-driven with agricultural growth zones/corridors; and strengthened trade negotiation capacity.
It is estimated that the AfCFTA will create a trade bloc with a combined gross domestic product (GDP) of USD 2.5 trillion and 1.2 billion people in the short term, according to the United Nations Economic Commission for Africa (ECA). This economic base is expected to support economies of scale and scope as well as increased competitiveness, diversification, economic transformation and commodity-based industrialisation and value-addition around strategic commodities.
For example, a number of strategic commodities (food and non-food) have been identified at the continental level at the 2006 Abuja Food Security Summit, such as rice, legumes, maize, cotton, palm oil, beef, dairy, poultry and fishery products, cassava, sorghum and millet (AUC, 2008). At the national and regional levels, priority commodities have been selected for development and expansion through regional value chains. This regional, inclusive approach has the potential to absorb smallholder farmers (landholdings of less than two hectares), micro, small and medium-sized enterprises (MSMEs), rural women and youth, and connect them to commercial, modern, better-resourced private sector firms in sustainable agricultural value chains. Increased integration of the agricultural value chain actors from “the farm to the plate” is likely to boost intra-African trade, create sustainable jobs, incomes and livelihoods and improve long-term agricultural productivity and food security on the continent within a supportive and predictable policy and business environment.
Key lessons from almost two decades of CAADP implementation and related strategic initiatives are reflected in the Framework outlined below, which includes a multisectoral strategy and a roadmap. The strategy is made up of several elements, including the institutional infrastructure to oversee the development
and implementation of the AfCFTA; the priority sectors and commodities as well as the associated development programmes and the CAADP commitment areas; sustainable financing; and monitoring and evaluation.
The Framework and its roadmap are made up of seven clusters or priority areas based on the BIAT adopted at the 2012 Assembly of the African Union. The seven clusters are trade policy, trade facilitation, productive capacity, trade-related infrastructure, trade finance, factor market integration and cross-cutting issues (including the institutional arrangements for AfCFTA implementation, information across agricultural value chains, a communication and visibility plan and a monitoring and evaluation framework). The seven clusters are elaborated in a roadmap with corresponding objectives, activities, indicators, lead implementing agencies and timelines (short, medium and long term) within the context of the AfCFTA.
The Framework will guide RECs and Member States in developing agricultural trade policies, strategies and plans to take advantage of the market opportunities offered by the AfCFTA. The process will be based on national and regional priorities, inclusive trade policy setting and harmonised regulatory frameworks. In addition, the Framework incorporates guidelines for the development of sustainable regional value chains around strategic commodities identified at the national, regional and continental levels. It will also take into consideration investment plans aligned with initiatives such as CAADP, AfCFTA and other AU flagship programmes, the provision of competitive inputs and services along the lines of the Services Sector Development Programme (SSDP), the elimination of non-tariff barriers (NTBs) and ambitious trade liberalisation that encompasses substantially all trade within the AfCFTA. Another feature is market information systems as part of the African Trade Observatory.

4
C. METHODOLOGYThe Framework for Boosting Intra-African Trade in Agricultural Commodities and Services was jointly developed by the African Union Commission (AUC) and the Food and Agriculture Organization of the United Nations (FAO), in consultation with member states and RECs. The Framework is based on the fifth commitment of the Malabo Declaration and on the BIAT Action Plan adopted by the Assembly of the African Union in 2012.
The formulation and adaptation of the Framework for the agricultural sector included an inception workshop convened by the Department of Rural Economy and Agriculture (DREA) of the AUC with key stakeholders at the national and REC levels in June 2019 at the AUC headquarters in Addis Ababa, Ethiopia, to review the initial conceptual Framework and work programme. The Framework was validated in early October 2019 in Nairobi, Kenya, at a joint AUC/FAO/ECA workshop with representatives from the RECs, Member States, civil society and the private sector. One of the recommendations of
the validation workshop was that the trade information cluster, one of the seven clusters mentioned in Section B, should be integrated into part of a larger cluster of cross-cutting issues. Following the validation workshop, the document was later endorsed in October 2019 by the Specialised Technical Committee (STC) on Agriculture, Rural Development, Water and Environment of the AUC in preparation for its launch to coincide with the official start of trading under the AfCFTA regime, which was initially planned for 1 July 2020 but is now postponed to 1 January 2021 due to the COVID-19 pandemic.
In its current form, the roadmap outlines the programme of activities, including several flagship programmes, required to address the major constraints to intra-African trade, and identifies the main implementing stakeholders for each programme or activity. The implementation of the programmes and activities is organized into three phases: short-term (under three years), medium-term (seven years) and long-term (beyond seven years).
D. POLICIES AND STRUCTURAL REFORMS
Malabo Declaration and structural reformsIn an effort to accelerate structural reform, African leaders revisited the CAADP of 2003 and adopted the Malabo Declaration in 2014, committing themselves to ensure food and nutrition security through agriculture-led growth based on seven commitments (African Union Commission Biennial Review, AUC, 2020). Progress achieved by countries towards implementing the Malabo Declaration commitments in the second Biennial Review of 2019 shows that of the 49 countries that provided information, 4 were on track compared to 20 who were on track out of the 47 countries who provided information in the inaugural Biennial Review of 2017. The four best performing countries were Rwanda, Morocco, Mali and Ghana. None of the five subregions (Central, Eastern, Northern, Southern and Western Africa) achieved an overall score above the minimum score of 6.6 required to be on track in making progress towards the Malabo commitments. The Biennial Review process allows countries not only to
monitor implementation of their commitments but also to measure and benchmark their performance against other countries in the region, learn lessons and share best practices, including regional trade integration (AUC, 2018a). The COVID-19 pandemic, which has exposed the serious vulnerabilities of Africa’s farm systems to external shocks, is likely to slow down the progress achieved by African countries in implementing the Malabo Declaration, as observed in the results of the second Biennial Review (Benin, 2020).
The fifth commitment of the Malabo Declaration is for AU Member States to boost intra-African trade in agricultural commodities and services. The objective is to deepen Africa’s market integration and significantly increase the volume of trade that African countries engage in among themselves. In support of this resolution, AU governments have undertaken commitments (a) to triple, by the year 2025, intra-African trade in agricultural commodities and services; and (b) to create and enhance policies and institutional conditions and support systems. The countries has resolved to simplify and formalise trade practices,

5
create a continental free trade area with its own common external tariff (to be established as part of the AfCFTA), invest in markets and trade institutions, support platforms for multi-actor interactions, and adopt a common African position on agriculture-related international
trade negotiations and partnership agreements. Table 1 below provides a more detailed snapshot of the progress achieved by various regions in meeting their CAADP/Malabo commitments as by 2019.
Table 1: Regional implementation of the CAADP Process/Malabo Declaration
REGION PROGRESS
Central Africa Central Africa faces challenges in implementing the CAADP process and delivering on the Malabo commitments. Two out of eight Member States that reported are on track in completing the CAADP/Malabo process and only one is on track in establishing CAADP-based policy and institutional support. The subregion is not on track in meeting the seven CAADP/Malabo commitment areas. It still faces challenges in meeting the fifth commitment on intra-African trade in agricultural commodities and services, although it is on track for improving intra-African trade policies and institutional conditions.
Eastern Africa Eastern Africa is not on track in meeting all CAADP/Malabo commitment areas. In particular, the subregion is not on track in meeting the CAADP/Malabo commitment for intra-African trade in agricultural commodities and services, although it has done well in improving intra-African trade policies and institutional conditions.
Northern Africa Overall, the subregion is not on track in meeting the CAADP/Malabo commitments, including Commitment 5 on intra-African trade in agricultural commodities and services.
Southern Africa Southern Africa has made progress on the CAADP process of delivering on the Malabo commitments. Five Member States are on-track in implementing the CAADP/Malabo process. However, Southern Africa is not on track in meeting any of the seven CAADP/Malabo commitments (including on intra-African trade in agricultural commodities and services). The low performance is in contrast with the performance recorded in the 2017 Biennial Review. Nevertheless, it is worth mentioning the good performance achieved on intraregional trade in certain countries of the subregion, which have exhibited greater openness to trade.
Western Africa Western Africa is not on track on two performance categories – the CAADP/Malabo process and CAADP-based cooperation, partnerships and alliances. The subregion is also not on track in meeting the CAADP/Malabo commitments. However, Western Africa is on track in meeting the CAADP/Malabo commitment for intra-African trade in agricultural commodities and services. Improved performance of the subregion can be attributed to various trade facilitation mechanisms, including the free movement of persons and goods within the ECOWAS region, and regional policies and regulations that promote trade and facilitate implementation of such policies and regulations.
Source: African Union Commission Biennial Review (AUC, 2020a)
6
The African Continental Free Trade Area (AfCFTA)The AfCFTA is a landmark achievement in the continent’s history of regional integration. The first major expression of this vision was the creation of the Organization of African Unity (OAU) in 1963, which was succeeded by the African Union (AU) in 2000, providing Africans with a platform to speak with one voice on the world stage. In 2010, the sixth Ordinary Session of the AU Ministers of Trade held in Kigali, Rwanda, recommended to the 16th AU Summit (2011) to fast-track the establishment of a continental free trade area and to dedicate the 18th AU Summit (2012) to the theme of “Boosting Intra-African Trade”. The latter endorsed a framework, roadmap and architecture for the establishment of an African Continental Free Trade Area (AfCFTA) by an indicative date of 2017 and the Action Plan for Boosting Intra-Africa Trade (BIAT).
Recognizing the importance of intraregional trade, the commitment to triple by the year 2025 the level of intra-African trade in agricultural commodities and services was
part of the Malabo Declaration on “Accelerated Agricultural Growth and Transformation for Shared Prosperity and Improved Livelihoods” adopted by African Heads of State and Government in 2014. It also includes fast-tracking the establishment of a Continental Free Trade Area (CFTA) and adopting a continent-wide Common External Tariff (CET) scheme.
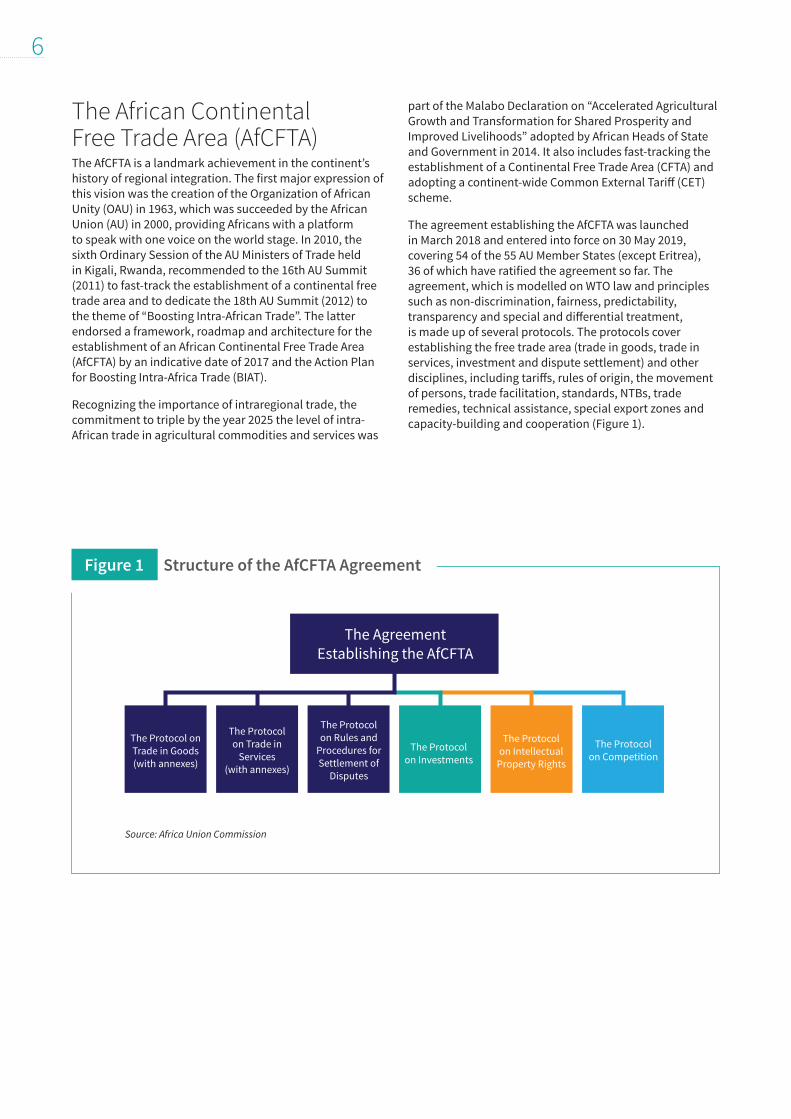
The agreement establishing the AfCFTA was launched in March 2018 and entered into force on 30 May 2019, covering 54 of the 55 AU Member States (except Eritrea), 36 of which have ratified the agreement so far. The agreement, which is modelled on WTO law and principles such as non-discrimination, fairness, predictability, transparency and special and differential treatment, is made up of several protocols. The protocols cover establishing the free trade area (trade in goods, trade in services, investment and dispute settlement) and other disciplines, including tariffs, rules of origin, the movement of persons, trade facilitation, standards, NTBs, trade remedies, technical assistance, special export zones and capacity-building and cooperation (Figure 1).
Figure 1 Structure of the AfCFTA Agreement
The Protocol onTrade in Goods(with annexes)
The Protocolon Trade in
Services(with annexes)
The Protocolon Investments
The Protocolon Intellectual
Property Rights
The Protocolon Competition
The Protocolon Rules and
Procedures forSettlement of
Disputes
The AgreementEstablishing the AfCFTA
Source: Africa Union Commission

7
Trade negotiations are ongoing to address market offers and exclusion lists, competition, intellectual property rights and e-commerce. In Phase 1 of the AfCFTA negotiations, the protocols on goods, on services and on dispute settlement have been finalised. However, the protocols on investments, on intellectual property and on competition are yet to be negotiated since Phase 2 of the AfCFTA negotiations have not yet started. Additionally, in February 2020 the Assembly of the AU decided to negotiate the protocol on e-commerce as part of Phase 3 of the negotiations. There is a growing momentum to prioritise and fast-track the negotiations on e-commerce in light of the recent developments and trade-related restrictions brought about by the COVID-19 pandemic.
African countries have undertaken commitments to remove tariffs on 90 percent of over 5 000 tariff lines, with the remaining 10 percent being “sensitive or excluded items”, as well as liberalise services such as transport, communication, tourism, financial services and business services. The agreement includes the mutual recognition of standards and licences and the harmonisation of plant import requirements and SPS measures to reduce NTBs and facilitate trade. Trading under the new regime was officially scheduled to start on 1 July 2020 but has been postponed to 1 January 2021 due to the coronavirus pandemic. The free trade area represents a large export base for agricultural goods and services. It is expected to provide economies of scale and scope to support diversification, economic transformation and commodity-based industrialisation with a focus on a number of strategic food and non-food agricultural commodities at the national, regional and continental levels.
As noted earlier, while implementation of the AfCFTA has been postponed to 1 January 2021, it provides an opportunity for a rethink of how the AfCFTA could be a catalyst for recovery by taking advantage of new trends emerging from the pandemic. This pause provides opportunity to address much of the unfinished business for smooth implementation of the agreement. Key among these are: of the 54 countries that signed the agreement, only 36 have submitted instruments for ratification of the agreement; only 13 countries have submitted schedules of tariff concessions in line with agreed modalities; the operationalization of the Pan-African Payment and Settlement System (PAPSS) – the first continent-wide digital payment system focused on facilitating payments for goods and services in intra-African trade in African currencies – is still pending; and issues related to rules of origin and trade in services are yet to be finalised. Other implementation challenges include Nigeria’s border closures in response to smuggling, and challenges created by bilateral trade deals with non-African countries, which may undermine the broader integration agenda. The postponement gives African States and the African Union a space to address these issues in an appropriate manner to ensure smooth implementation of the AfCFTA in 2021 and beyond (AUC, 2020b).
Key pillars of Africa’s regional integrationRegional integration in Africa is currently low although individual RECs score higher than average in one or more dimensions of the Africa Regional Integration Index (ARII) put together by the African Union Commission, the African Development Bank and the United Nations Economic Commission for Africa (see Figure 2). The five dimensions of the ARII (a score closer to 1 being better) are regional infrastructure and interconnections, financial integration and macroeconomic policy convergence, productive integration, trade integration and the free movement of persons. The regions that performed above the African average in terms of trade integration (all trade in goods and services, including agriculture) were the Arab Maghreb Union (AMU), the Common Market for Eastern and Southern Africa (COMESA), the East African Community (EAC), the Economic Community of West African States (ECOWAS) and Intergovernmental Authority on Development (IGAD) while the best performers in productive integration were the East African Community (EAC) and the Arab Maghreb Union (AMU). Generally, progress has been slow due to country disparities in levels of development and economic integration, vast distances between markets, multiple RECs with inconsistent and conflicting regulations and standards, as well as infrastructure and connectivity problems.
While countries are beginning to trade more and more with one another, food security will continue to be underpinned by imports for the foreseeable future. Africa’s increasing food import dependency and vulnerability to external shocks, including COVID-19, underscores the need for robust measures to close the food deficit in affected subregions. Accordingly, Member States have undertaken commitments to support the implementation of the AfCFTA Agreement in several areas including tariff liberalisation, reduction of non-tariff barriers, rules of origin and improved market Information systems to grow intra-African trade in agricultural commodities and services in an orderly and predictable manner.

8
Figure 2 Africa Regional Integration Index (ARII)
Regional integration Trade integration Productive integration
Macroeconomic integration Infrastructural integration Free movement of people
Average AMU CENSAD COMESA EAC ECCAS ECOWAS IGAD SADC0.0
0.1
0.2
0.3
0.4
0.5
0.6
0.7
0.8
Source: Africa Regional Integration Index Report 2019
E. MACROECONOMIC OVERVIEW
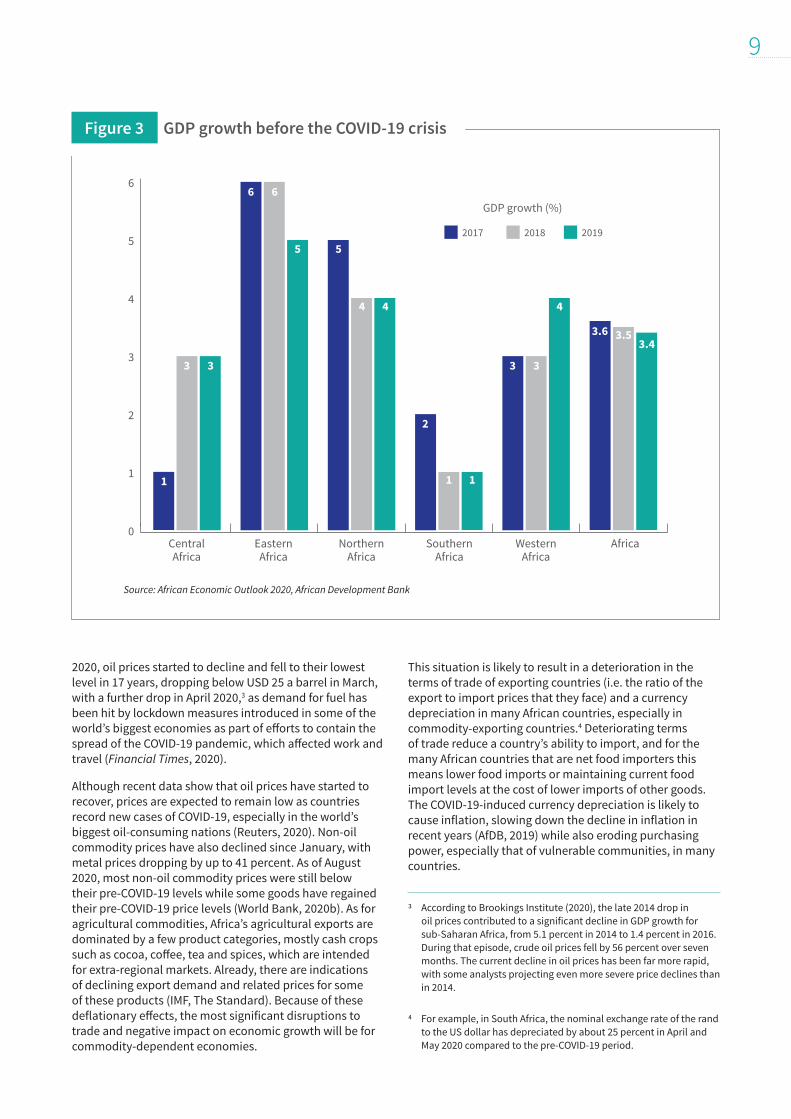
Trends in economic growthAfrica’s real GDP growth averaged 3.5 percent in the past three years (AfDB, 2020). The continent is home to some of the world’s fastest-growing economies such as Rwanda and Ethiopia (IMF World Economic Outlook Database). As shown in Figure 3, Eastern Africa (5.0 percent) and Northern Africa (4.1 percent) were the fastest-growing Africa’s regions in 2019, followed by Western Africa (3.7 percent) and Central Africa (3.2 percent). However, the world is currently grappling with the economic effects of the COVID-19 pandemic and Africa is particularly affected. A sharp fall in income from the commodity trade, remittances and tourism caused by the current crisis will have significant negative impacts on economic growth and employment in Africa. Growth in sub-Saharan Africa is forecast to fall sharply from 2.4 percent in 2019 to -2.1 to -5.1 percent in 2020, the first recession in the region in 25 years, according to the latest Africa’s Pulse report of the World Bank (Zeufack et al., 2020). The region’s three largest
economies and commodity exporting countries – Nigeria, South Africa and Angola – will be hardest hit. Growth is also expected to weaken substantially in the two fastest-growing areas – the West African Economic and Monetary Union (WAEMU) and the EAC – due to weak external demand, disruptions to supply chains and domestic production following a combined demand and supply shock due to increasing virus-induced restrictive measures and a global oil glut.
The COVID-19 pandemic will affect Africa’s growth through domestic and external channels. The first channel is the high dependence on primary commodity exports, which is a crucial factor driving economic slowdowns and downturns on the continent. Many African countries are highly dependent on primary commodity exports and/or imports and are therefore vulnerable to international price and demand/supply shocks related to these commodities. For example, oil exports are a vital source of foreign exchange earnings in Equatorial Guinea, where they represent about 40 percent of GDP. Already in January
9
2020, oil prices started to decline and fell to their lowest level in 17 years, dropping below USD 25 a barrel in March, with a further drop in April 2020,3 as demand for fuel has been hit by lockdown measures introduced in some of the world’s biggest economies as part of efforts to contain the spread of the COVID-19 pandemic, which affected work and travel (Financial Times, 2020).
Although recent data show that oil prices have started to recover, prices are expected to remain low as countries record new cases of COVID-19, especially in the world’s biggest oil-consuming nations (Reuters, 2020). Non-oil commodity prices have also declined since January, with metal prices dropping by up to 41 percent. As of August 2020, most non-oil commodity prices were still below their pre-COVID-19 levels while some goods have regained their pre-COVID-19 price levels (World Bank, 2020b). As for agricultural commodities, Africa’s agricultural exports are dominated by a few product categories, mostly cash crops such as cocoa, coffee, tea and spices, which are intended for extra-regional markets. Already, there are indications of declining export demand and related prices for some of these products (IMF, The Standard). Because of these deflationary effects, the most significant disruptions to trade and negative impact on economic growth will be for commodity-dependent economies.
This situation is likely to result in a deterioration in the terms of trade of exporting countries (i.e. the ratio of the export to import prices that they face) and a currency depreciation in many African countries, especially in commodity-exporting countries.4 Deteriorating terms of trade reduce a country’s ability to import, and for the many African countries that are net food importers this means lower food imports or maintaining current food import levels at the cost of lower imports of other goods. The COVID-19-induced currency depreciation is likely to cause inflation, slowing down the decline in inflation in recent years (AfDB, 2019) while also eroding purchasing power, especially that of vulnerable communities, in many countries.
Figure 3 GDP growth before the COVID-19 crisis
0
1
2
3
4
5
6
2017 2018 2019
Central Africa
Eastern Africa
Northern Africa
Southern Africa
Western Africa
Africa
GDP growth (%)
1
3 3 3 3
3.4
6 6
5 5
4 4
3.6 3.5
4
2
1 1
3 According to Brookings Institute (2020), the late 2014 drop in oil prices contributed to a significant decline in GDP growth for sub-Saharan Africa, from 5.1 percent in 2014 to 1.4 percent in 2016. During that episode, crude oil prices fell by 56 percent over seven months. The current decline in oil prices has been far more rapid, with some analysts projecting even more severe price declines than in 2014.
4 For example, in South Africa, the nominal exchange rate of the rand to the US dollar has depreciated by about 25 percent in April and May 2020 compared to the pre-COVID-19 period.
Source: African Economic Outlook 2020, African Development Bank
10
Amplifying the effects of economic shocks is the reduction of government expenditure as a result of deteriorating public finances in an environment where government spending (as a percentage of GDP) was already low in Africa (World Economic Outlook Database, IMF). The share of government spending in GDP is highest in Northern Africa (e.g. Libya and Algeria) and Southern Africa (e.g. Lesotho, Namibia and South Africa), while it is lowest in Central Africa (e.g. Central African Republic and Democratic Republic of the Congo).
To mitigate some of these effects, many countries will be forced to increase their debt to unsustainable levels. According to ReSAKSS data, the government debt-to-GDP ratio was 46.5 percent in 2018 in Africa, up from 44.7 percent in 2017 (ReSAKSS, 2020). However, there are significant variations between countries, ranging from 85.4 percent in Eastern Africa to 27.6 percent in Western Africa. African countries thus urgently need support to respond to the unprecedented crisis created by the COVID-19 pandemic.
Additionally, Africa’s overall foreign direct investment (FDI) inflows are estimated to shrink due to the COVID-19 pandemic. The continent’s share of world FDI inflows ranged between 2.4 percent and 3.4 percent between 2017 and 2019 (UNCTAD, 2020). FDI inflows in Africa reached USD 45 billion in 2019 but remain below the USD 51 billion attained in 2018 (UNCTAD, 2020). According to AfDB (2020), Africa experienced the fastest growth in FDI inflows in 2018 (+11 percent), compared with negative global flows (-13 percent) and negative flows to developed economies (-27 percent) and a modest increase in Asia (+4 percent).5 However, the COVID-19 pandemic will
severely curtail foreign investment in Africa. FDI flows to Africa are forecast to fall by 25 to 40 percent in 2020, according to the UNCTAD World Investment Report (2020). The negative trend of FDI flows will be exacerbated by low oil and commodity prices.
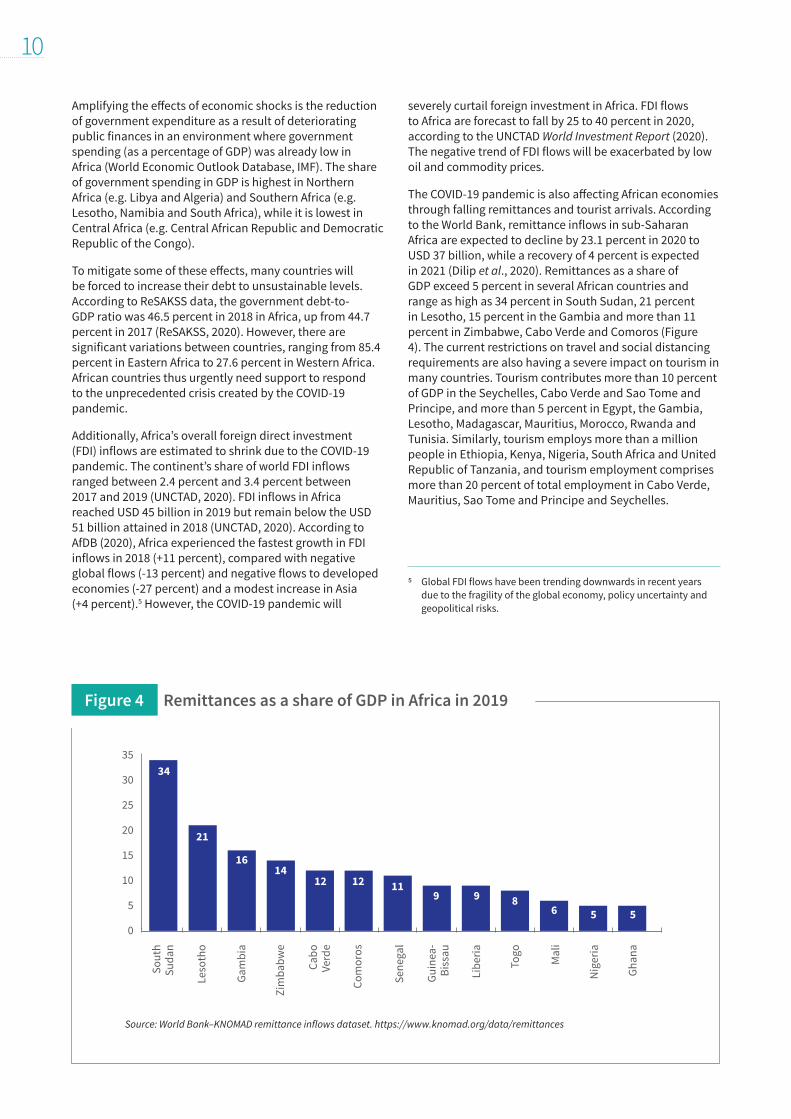
The COVID-19 pandemic is also affecting African economies through falling remittances and tourist arrivals. According to the World Bank, remittance inflows in sub-Saharan Africa are expected to decline by 23.1 percent in 2020 to USD 37 billion, while a recovery of 4 percent is expected in 2021 (Dilip et al., 2020). Remittances as a share of GDP exceed 5 percent in several African countries and range as high as 34 percent in South Sudan, 21 percent in Lesotho, 15 percent in the Gambia and more than 11 percent in Zimbabwe, Cabo Verde and Comoros (Figure 4). The current restrictions on travel and social distancing requirements are also having a severe impact on tourism in many countries. Tourism contributes more than 10 percent of GDP in the Seychelles, Cabo Verde and Sao Tome and Principe, and more than 5 percent in Egypt, the Gambia, Lesotho, Madagascar, Mauritius, Morocco, Rwanda and Tunisia. Similarly, tourism employs more than a million people in Ethiopia, Kenya, Nigeria, South Africa and United Republic of Tanzania, and tourism employment comprises more than 20 percent of total employment in Cabo Verde, Mauritius, Sao Tome and Principe and Seychelles.
Figure 4 Remittances as a share of GDP in Africa in 2019
0
5
10
15
20
25
30
35
Sout
hSu
dan
Leso
tho
Gam
bia
Zim
babw
e
Cabo
Ve
rde
Sene
gal
Com
oros
Guin
ea-
Biss
au
Libe
ria
Togo
Nig
eria
Mal
i
Ghan
a
34
21
1614
12 12 119 9 8
6 5 5
5 Global FDI flows have been trending downwards in recent years due to the fragility of the global economy, policy uncertainty and geopolitical risks.
Source: World Bank–KNOMAD remittance inflows dataset. https://www.knomad.org/data/remittances
11
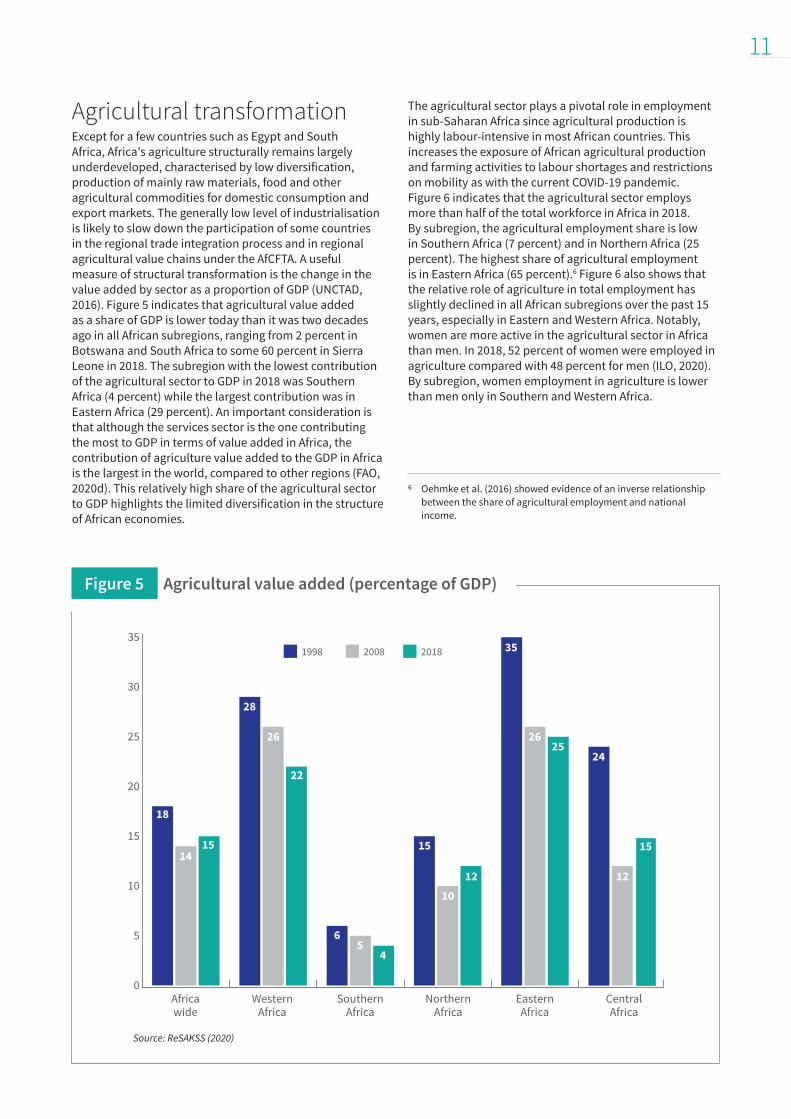
Agricultural transformationExcept for a few countries such as Egypt and South Africa, Africa's agriculture structurally remains largely underdeveloped, characterised by low diversification, production of mainly raw materials, food and other agricultural commodities for domestic consumption and export markets. The generally low level of industrialisation is likely to slow down the participation of some countries in the regional trade integration process and in regional agricultural value chains under the AfCFTA. A useful measure of structural transformation is the change in the value added by sector as a proportion of GDP (UNCTAD, 2016). Figure 5 indicates that agricultural value added as a share of GDP is lower today than it was two decades ago in all African subregions, ranging from 2 percent in Botswana and South Africa to some 60 percent in Sierra Leone in 2018. The subregion with the lowest contribution of the agricultural sector to GDP in 2018 was Southern Africa (4 percent) while the largest contribution was in Eastern Africa (29 percent). An important consideration is that although the services sector is the one contributing the most to GDP in terms of value added in Africa, the contribution of agriculture value added to the GDP in Africa is the largest in the world, compared to other regions (FAO, 2020d). This relatively high share of the agricultural sector to GDP highlights the limited diversification in the structure of African economies.
The agricultural sector plays a pivotal role in employment in sub-Saharan Africa since agricultural production is highly labour-intensive in most African countries. This increases the exposure of African agricultural production and farming activities to labour shortages and restrictions on mobility as with the current COVID-19 pandemic. Figure 6 indicates that the agricultural sector employs more than half of the total workforce in Africa in 2018. By subregion, the agricultural employment share is low in Southern Africa (7 percent) and in Northern Africa (25 percent). The highest share of agricultural employment is in Eastern Africa (65 percent).6 Figure 6 also shows that the relative role of agriculture in total employment has slightly declined in all African subregions over the past 15 years, especially in Eastern and Western Africa. Notably, women are more active in the agricultural sector in Africa than men. In 2018, 52 percent of women were employed in agriculture compared with 48 percent for men (ILO, 2020). By subregion, women employment in agriculture is lower than men only in Southern and Western Africa.
Figure 5 Agricultural value added (percentage of GDP)
0
5
10
15
20
25
30
351998 2008 2018
Africawide
WesternAfrica
SouthernAfrica
NorthernAfrica
EasternAfrica
CentralAfrica
18
1415
28
35
2625
24
12
15
26
22
15
1012
65
4
Source: ReSAKSS (2020)
6 Oehmke et al. (2016) showed evidence of an inverse relationship between the share of agricultural employment and national income.

12
Agricultural growth is particularly important for poverty reduction and food security in developing countries. Sustaining positive agricultural growth is a necessary condition for improving food security and reducing rural poverty. However, agricultural value-added growth has been slow but remains positive in all African subregions over the past few years. Growth was 2.9 percent on the continent in 2018, down from 4.5 percent in 2017 (ReSAKSS, 2020). Southern Africa experienced the largest decline, from 8.3 percent to 1.7 percent between 2017 and 2018. Northern Africa had the highest growth in 2018 (3.7 percent). It is evident that agricultural annual growth in most countries is still below the 6 percent targeted by CAADP. This trend is likely to continue if special steps are not taken to address underlying productivity constraints as well as mitigate the impact of the COVID-19 pandemic on the agricultural sector in Africa.
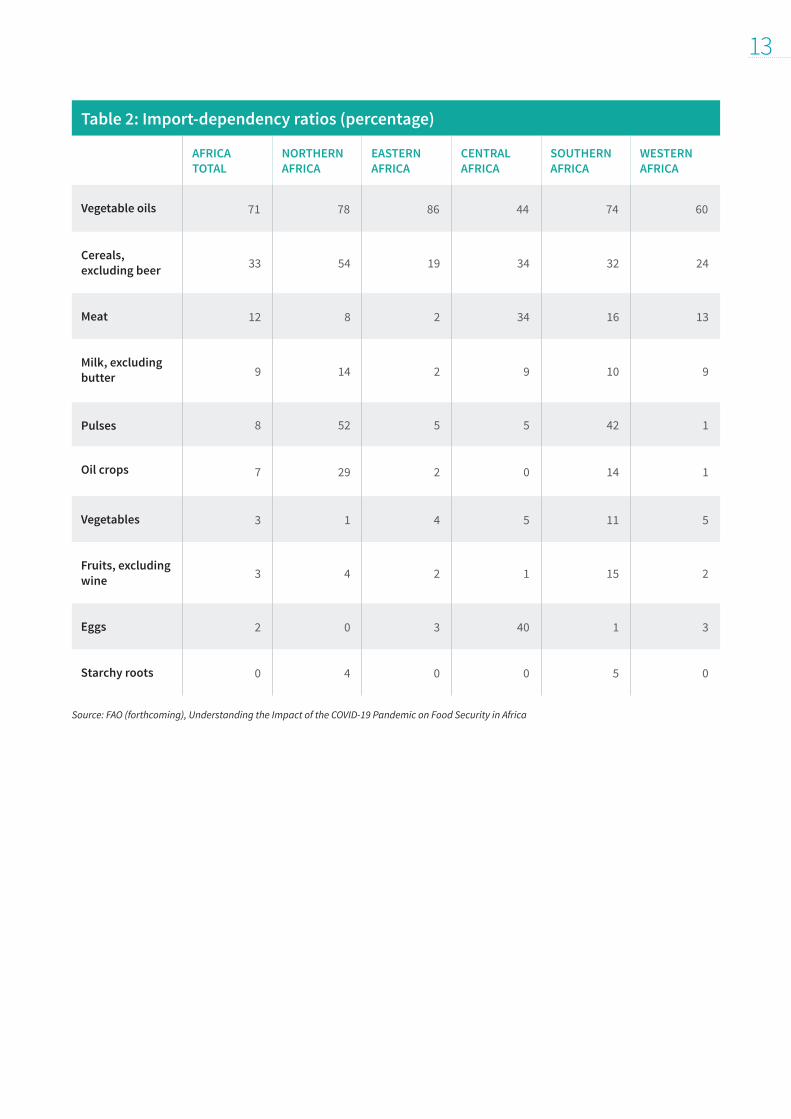
Despite its vast agricultural potential, Africa is a net importer of agricultural products, and increasingly so. The increase in agricultural and food imports has been
particularly striking for basic foodstuffs such as cereals, vegetable oils, sugar, meat and dairy products. Most imports are sourced from outside the region (e.g. wheat, sunflower oil and dairy products from Europe; rice and palm oil from Asia; maize, poultry and beef from Latin America). Dependence on extra-regional imports for food makes African countries vulnerable to disruptions in international logistics and distribution, in addition to production problems in other countries due to the COVID-19 pandemic containment measures. These vulnerabilities could result in food shortages and raise food prices, particularly in countries that are highly dependent on food imports (Table 2). These factors, combined with losses in consumer incomes, minimal savings and limited access to public safety nets, mean that COVID-19 also creates significant demand-side risks, particularly among poorer populations.
Figure 6 Employment in agriculture as a share of total employment (percentage)
0
10
20
30
40
50
60
70
80
2005 2008 2018
Africawide
WesternAfrica
SouthernAfrica
NorthernAfrica
EasternAfrica
CentralAfrica
35
64 6359
7371
65
5250
41
57 55
49
33 32
25
9 8 7
Source: International Labour Organization, 2020
13
Table 2: Import-dependency ratios (percentage)
AFRICA TOTAL
NORTHERN AFRICA
EASTERN AFRICA
CENTRAL AFRICA
SOUTHERN AFRICA
WESTERN AFRICA
Vegetable oils 71 78 86 44 74 60
Cereals, excluding beer 33 54 19 34 32 24
Meat 12 8 2 34 16 13
Milk, excluding butter 9 14 2 9 10 9
Pulses 8 52 5 5 42 1
Oil crops 7 29 2 0 14 1
Vegetables 3 1 4 5 11 5
Fruits, excluding wine 3 4 2 1 15 2
Eggs 2 0 3 40 1 3
Starchy roots 0 4 0 0 5 0
Source: FAO (forthcoming), Understanding the Impact of the COVID-19 Pandemic on Food Security in Africa

14
F. TRADE AND FOOD SECURITY
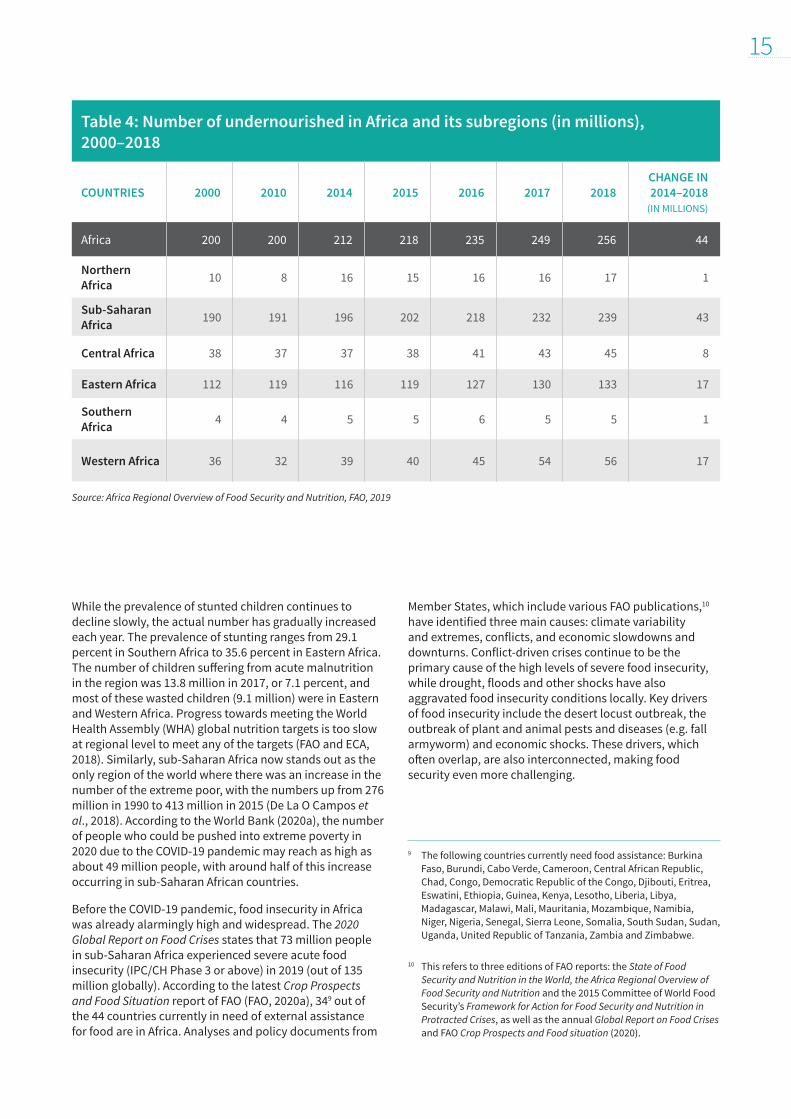
Food and nutrition securityThe food and nutrition security situation in Africa remains a major concern, marked by both chronic and acute poverty and vulnerabilities. After declining for a prolonged period, the prevalence of undernourishment (PoU)7 has been slightly increasing in Africa since 2014, reaching 19.9 percent in 2018 (up from 18.2 percent in 2014), according to FAO (Table 3). This increase was stronger in Western and Central Africa. Most of the rise in the prevalence and number of undernourished occurred in 2015–2018. This affected approximately 256 million people who today
suffer from undernourishment in Africa, up from 249 million in 2017 and 212 million in 2014 (Table 4). By far, the largest number of the undernourished live in Eastern Africa, and the biggest increase in the number of undernourished in 2014–2018 occurred in Eastern and Western Africa (Table 4). Acute malnutrition (among children under five) across the region is persistent, meaning that the emergency threshold of 15 percent global acute malnutrition has been frequently exceeded over many years if not decades (Young and Marshak, 2018).
Table 3: Prevalence of undernourishment in Africa and its subregions (percentage), 2000–2018
COUNTRIES 2000 2010 2014 2015 2016 2017 2018CHANGE IN 2014–2018
(IN % POINTS)
Africa 24.5 19.1 18.2 18.3 19.2 19.8 19.9 1.70
Northern Africa8 6.7 5.0 7.2 6.9 7.0 7.0 7.1 -0.10
Sub-Saharan Africa 28.4 21.7 20.8 20.9 22.0 22.7 22.8 2.00
Central Africa 39.2 27.8 24.6 24.7 25.9 26.4 26.5 1.90
Eastern Africa 39.1 31.2 30.0 29.9 31.0 30.8 30.8 0.80
Southern Africa 7.3 7.1 7.5 7.8 8.5 8.3 8.0 0.50
Western Africa 15.3 10.4 11.3 11.4 12.4 14.4 14.7 3.40
Source: Africa Regional Overview of Food Security and Nutrition, FAO, 2019
7 The prevalence of undernourishment is an estimate of the proportion of the population whose habitual food consumption is insufficient to provide the dietary energy levels that are required to maintain a normal active and healthy life.
8 The series for Northern Africa experienced a jump in 2012 due to the inclusion of the Sudan from that year onwards.
15
While the prevalence of stunted children continues to decline slowly, the actual number has gradually increased each year. The prevalence of stunting ranges from 29.1 percent in Southern Africa to 35.6 percent in Eastern Africa. The number of children suffering from acute malnutrition in the region was 13.8 million in 2017, or 7.1 percent, and most of these wasted children (9.1 million) were in Eastern and Western Africa. Progress towards meeting the World Health Assembly (WHA) global nutrition targets is too slow at regional level to meet any of the targets (FAO and ECA, 2018). Similarly, sub-Saharan Africa now stands out as the only region of the world where there was an increase in the number of the extreme poor, with the numbers up from 276 million in 1990 to 413 million in 2015 (De La O Campos et al., 2018). According to the World Bank (2020a), the number of people who could be pushed into extreme poverty in 2020 due to the COVID-19 pandemic may reach as high as about 49 million people, with around half of this increase occurring in sub-Saharan African countries.
Before the COVID-19 pandemic, food insecurity in Africa was already alarmingly high and widespread. The 2020 Global Report on Food Crises states that 73 million people in sub-Saharan Africa experienced severe acute food insecurity (IPC/CH Phase 3 or above) in 2019 (out of 135 million globally). According to the latest Crop Prospects and Food Situation report of FAO (FAO, 2020a), 349 out of the 44 countries currently in need of external assistance for food are in Africa. Analyses and policy documents from
Member States, which include various FAO publications,10 have identified three main causes: climate variability and extremes, conflicts, and economic slowdowns and downturns. Conflict-driven crises continue to be the primary cause of the high levels of severe food insecurity, while drought, floods and other shocks have also aggravated food insecurity conditions locally. Key drivers of food insecurity include the desert locust outbreak, the outbreak of plant and animal pests and diseases (e.g. fall armyworm) and economic shocks. These drivers, which often overlap, are also interconnected, making food security even more challenging.
Table 4: Number of undernourished in Africa and its subregions (in millions), 2000–2018
COUNTRIES 2000 2010 2014 2015 2016 2017 2018CHANGE IN 2014–2018
(IN MILLIONS)
Africa 200 200 212 218 235 249 256 44
Northern Africa 10 8 16 15 16 16 17 1
Sub-Saharan Africa 190 191 196 202 218 232 239 43
Central Africa 38 37 37 38 41 43 45 8
Eastern Africa 112 119 116 119 127 130 133 17
Southern Africa 4 4 5 5 6 5 5 1
Western Africa 36 32 39 40 45 54 56 17
Source: Africa Regional Overview of Food Security and Nutrition, FAO, 2019
9 The following countries currently need food assistance: Burkina Faso, Burundi, Cabo Verde, Cameroon, Central African Republic, Chad, Congo, Democratic Republic of the Congo, Djibouti, Eritrea, Eswatini, Ethiopia, Guinea, Kenya, Lesotho, Liberia, Libya, Madagascar, Malawi, Mali, Mauritania, Mozambique, Namibia, Niger, Nigeria, Senegal, Sierra Leone, Somalia, South Sudan, Sudan, Uganda, United Republic of Tanzania, Zambia and Zimbabwe.
10 This refers to three editions of FAO reports: the State of Food Security and Nutrition in the World, the Africa Regional Overview of Food Security and Nutrition and the 2015 Committee of World Food Security’s Framework for Action for Food Security and Nutrition in Protracted Crises, as well as the annual Global Report on Food Crises and FAO Crop Prospects and Food situation (2020).
16
COVID-19 risks further escalating these figures, with likely huge rises in humanitarian needs and food insecurity because of both the pandemic itself and containment efforts. COVID-19 is causing a decline in incomes, job losses and a deterioration of livelihoods of the most vulnerable communities. With food and agriculture systems being highly labour-intensive in most African countries, shortages of workers due to restrictions on labour mobility may compromise the provision of inputs in upstream farming activities and downstream trading, processing and transportation activities. The decline in food imports could also heighten food insecurity in Africa and result in a sharp rise in food prices and rising hunger and malnutrition in food-importing countries.
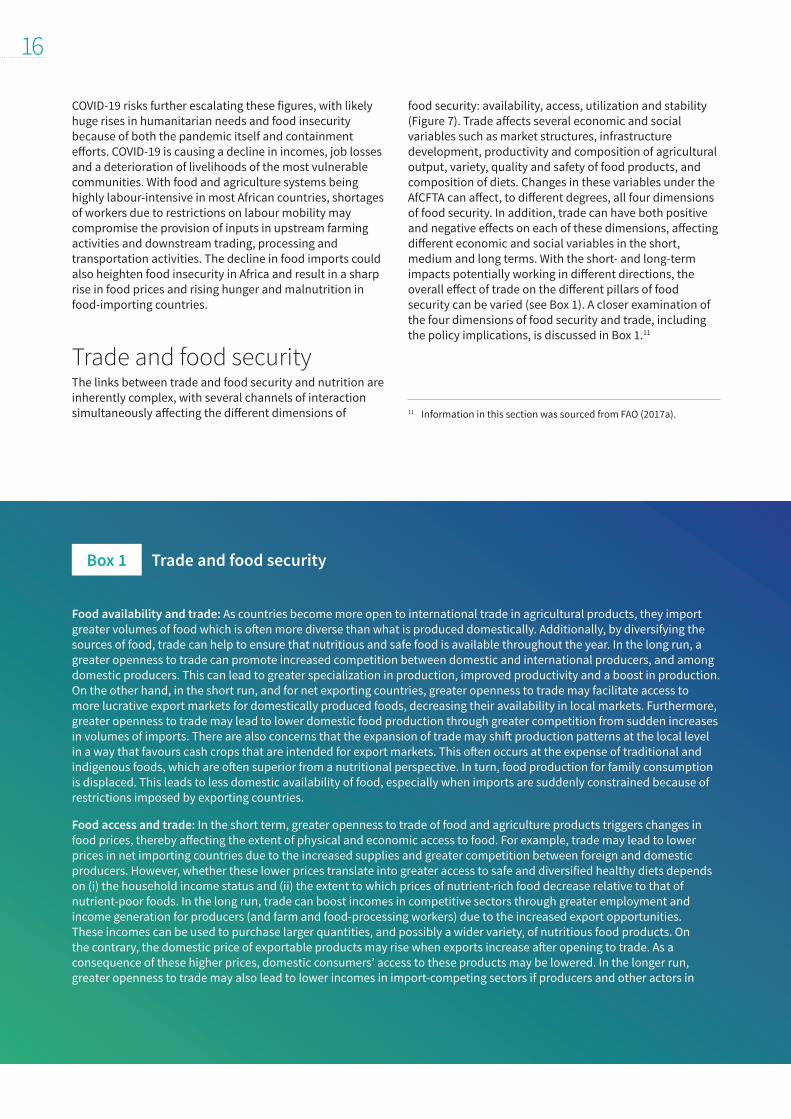
Trade and food securityThe links between trade and food security and nutrition are inherently complex, with several channels of interaction simultaneously affecting the different dimensions of
food security: availability, access, utilization and stability (Figure 7). Trade affects several economic and social variables such as market structures, infrastructure development, productivity and composition of agricultural output, variety, quality and safety of food products, and composition of diets. Changes in these variables under the AfCFTA can affect, to different degrees, all four dimensions of food security. In addition, trade can have both positive and negative effects on each of these dimensions, affecting different economic and social variables in the short, medium and long terms. With the short- and long-term impacts potentially working in different directions, the overall effect of trade on the different pillars of food security can be varied (see Box 1). A closer examination of the four dimensions of food security and trade, including the policy implications, is discussed in Box 1.11
11 Information in this section was sourced from FAO (2017a).
Food availability and trade: As countries become more open to international trade in agricultural products, they import greater volumes of food which is often more diverse than what is produced domestically. Additionally, by diversifying the sources of food, trade can help to ensure that nutritious and safe food is available throughout the year. In the long run, a greater openness to trade can promote increased competition between domestic and international producers, and among domestic producers. This can lead to greater specialization in production, improved productivity and a boost in production. On the other hand, in the short run, and for net exporting countries, greater openness to trade may facilitate access to more lucrative export markets for domestically produced foods, decreasing their availability in local markets. Furthermore, greater openness to trade may lead to lower domestic food production through greater competition from sudden increases in volumes of imports. There are also concerns that the expansion of trade may shift production patterns at the local level in a way that favours cash crops that are intended for export markets. This often occurs at the expense of traditional and indigenous foods, which are often superior from a nutritional perspective. In turn, food production for family consumption is displaced. This leads to less domestic availability of food, especially when imports are suddenly constrained because of restrictions imposed by exporting countries.
Food access and trade: In the short term, greater openness to trade of food and agriculture products triggers changes in food prices, thereby affecting the extent of physical and economic access to food. For example, trade may lead to lower prices in net importing countries due to the increased supplies and greater competition between foreign and domestic producers. However, whether these lower prices translate into greater access to safe and diversified healthy diets depends on (i) the household income status and (ii) the extent to which prices of nutrient-rich food decrease relative to that of nutrient-poor foods. In the long run, trade can boost incomes in competitive sectors through greater employment and income generation for producers (and farm and food-processing workers) due to the increased export opportunities. These incomes can be used to purchase larger quantities, and possibly a wider variety, of nutritious food products. On the contrary, the domestic price of exportable products may rise when exports increase after opening to trade. As a consequence of these higher prices, domestic consumers’ access to these products may be lowered. In the longer run, greater openness to trade may also lead to lower incomes in import-competing sectors if producers and other actors in
Box 1 Trade and food security

17
Several underlying factors, as outlined in Box 1, affect the way in which trade interacts with food security outcomes, ultimately determining whether the impact is positive or negative. These factors include the functioning of domestic food markets, the ability and willingness of producers to respond to changing incentives, and the participation of smallholders in markets. Trade policy interventions need to take into consideration the various underlying factors that influence the linkages between trade and food security. Moreover, the complexity of the channels of interaction between trade and food security produces great differences in country experiences, making the overall impact largely context- specific. This complexity and the importance of flexibility and coordination in the design and implementation of trade policies, based on the situation of each country and subregion at a given time, needs to be taken into consideration in the context of the AfCFTA.
Trade policies are only one of the many categories of policies that can affect the flow of the food trade in Africa. Producer- and consumer-oriented measures can be equally important because of their direct effects on national production levels and the indirect effects that changes in national production can have on trade flows and global markets. Price policies (that introduce a gap between domestic prices of inputs and outputs and those that would prevail in the absence of such measures) can be particularly important, but as they can be designed and implemented in different ways, they can have quite different impacts. The objectives of trade and related policies address different dimensions of food security and nutrition, differ across countries, and will change over time. There is no single most “appropriate, one-size-fits-all”
these sectors do not have access to the appropriate safety nets and opportunities for transitioning to other competitive activities in order to cope with the negative consequences of the food trade.
Food utilization and trade: Trade could lead to a more varied diet, which is associated with better nutritional outcomes in countries where food production is less diversified than total food availability, which includes imports. However, trade is also associated with shifts in food consumption patterns and the so-called “nutrition transition” by reducing prices and increasing the availability of a variety of foods that include those of low nutritional value. This transition indicates a shift in the diet towards higher intakes of livestock products, as well as sugar, fats and oils, often in the form of convenience and fast food. Some drivers of this trend include relative price changes, income growth, urbanization, value chain development, investment in infrastructure, transformation of the retail sector and trade policy reforms. Moreover, trade can affect the safety of food products for human consumption. Adherence to international standards governing trade in the agricultural sector, such as those established by the Codex Alimentarius, as part of engaging in international trade, can help to improve the safety and quality of food available to consumers.
Food stability and trade: Considering that domestic production in individual countries is typically more volatile than global and regional aggregates, trade can play an important role in pooling the risks associated with production shortfalls. Moreover, with a large share of the food consumed in developing countries produced domestically, food imports that complement domestic production help to stabilize food prices and ensure year-round access to nutritious foods, such as fruits and vegetables. This stabilizing effect of trade in individual countries also extends to global markets, whereby weather-induced production shortages in some regions can be balanced by production surpluses in other regions. However, greater openness to trade may also present a challenge to a country’s stability of food supplies and food prices, exposing the importing countries to shocks associated with sudden changes in trade policies adopted by their trading partners. In addition, it may exacerbate vulnerability to changes in world prices and to import surges in the sectors where production is largely non-commercial, where input and output markets are fragmented and where risk management systems are inadequate.
Source: FAO (2017a). Strengthening Sector Policies for Better Food Security and Nutrition Results.

18
policy instrument. The objectives of policy interventions should be paramount in determining the appropriateness and in informing the design of trade-related policy.
Often, debates related to trade and food security focus on the short-term impacts of market shocks, and the resulting changes in trade flows and prices that consumers and producers face. In the context of the AfCFTA and the coronavirus crisis, it is important to look beyond short-term policy interventions and their possible short-term consequences and focus on the long-term effects as well
as wider regional impacts. This should be done preferably through close coordination with trading partners when assessing the effectiveness of policy measures, e.g. border closures, curfews, export bans, etc. to achieve food security objectives. Transparency and improved policy coordination can be facilitated by using, for example, the AfCFTA’s notifications system and other information reporting systems to communicate changes in domestic laws, regulations, procedures and administrative rulings.
Figure 7 Trade and food security
Availability
Utilization
Stability
Trad
e
Grow
th Food safety, quality, variety
Weather, climate change, conflict
Food waste/loss
Social protection
Production
Prices
Labour Market
Competition
Distribution & Infrastructure
Government Budget
Household IncomeFarm Income; Employment;
Wages; Transfers
Government ServicesFood Safety; Health;
Education
Food SupplyProduction; Net Trade;
Stock
Access
Economic variables directly a�ected by trade
Economic variables indirectly a�ected by trade
Food security dimension
Endogenous intervening factors
Legend:
Exogenous intervening factors
Source: FAO (2015), The State of Agricultural Commodity Markets 2015–16
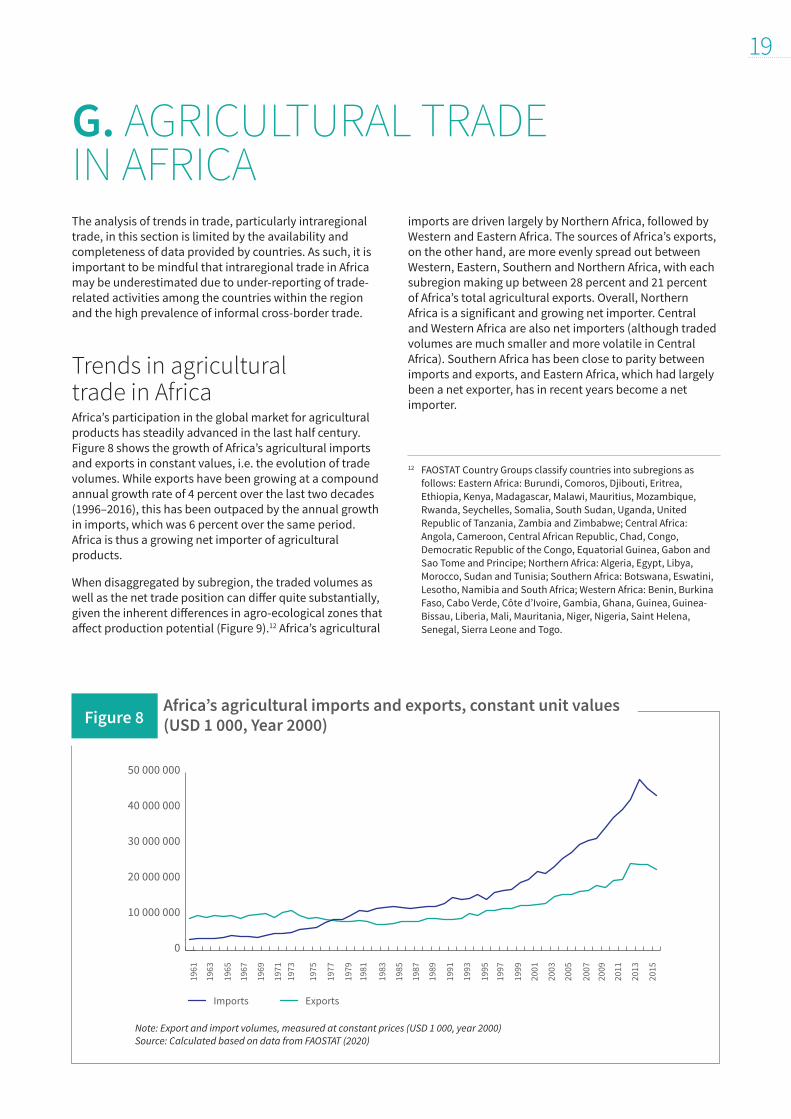
19
G. AGRICULTURAL TRADE IN AFRICAThe analysis of trends in trade, particularly intraregional trade, in this section is limited by the availability and completeness of data provided by countries. As such, it is important to be mindful that intraregional trade in Africa may be underestimated due to under-reporting of trade-related activities among the countries within the region and the high prevalence of informal cross-border trade.
Trends in agricultural trade in AfricaAfrica’s participation in the global market for agricultural products has steadily advanced in the last half century. Figure 8 shows the growth of Africa’s agricultural imports and exports in constant values, i.e. the evolution of trade volumes. While exports have been growing at a compound annual growth rate of 4 percent over the last two decades (1996–2016), this has been outpaced by the annual growth in imports, which was 6 percent over the same period. Africa is thus a growing net importer of agricultural products.
When disaggregated by subregion, the traded volumes as well as the net trade position can differ quite substantially, given the inherent differences in agro-ecological zones that affect production potential (Figure 9).12 Africa’s agricultural
imports are driven largely by Northern Africa, followed by Western and Eastern Africa. The sources of Africa’s exports, on the other hand, are more evenly spread out between Western, Eastern, Southern and Northern Africa, with each subregion making up between 28 percent and 21 percent of Africa’s total agricultural exports. Overall, Northern Africa is a significant and growing net importer. Central and Western Africa are also net importers (although traded volumes are much smaller and more volatile in Central Africa). Southern Africa has been close to parity between imports and exports, and Eastern Africa, which had largely been a net exporter, has in recent years become a net importer.
Figure 8 Africa’s agricultural imports and exports, constant unit values (USD 1 000, Year 2000)
Imports
1961
1963
1965
1967
1971
1969
1973
1975
1977
1979
1981
1983
1985
1987
1989
1991
1993
1995
1997
1999
2001
2003
2005
2007
2009
2011
2013
2015
0
10 000 000
20 000 000
30 000 000
40 000 000
50 000 000
Exports
Note: Export and import volumes, measured at constant prices (USD 1 000, year 2000) Source: Calculated based on data from FAOSTAT (2020)
12 FAOSTAT Country Groups classify countries into subregions as follows: Eastern Africa: Burundi, Comoros, Djibouti, Eritrea, Ethiopia, Kenya, Madagascar, Malawi, Mauritius, Mozambique, Rwanda, Seychelles, Somalia, South Sudan, Uganda, United Republic of Tanzania, Zambia and Zimbabwe; Central Africa: Angola, Cameroon, Central African Republic, Chad, Congo, Democratic Republic of the Congo, Equatorial Guinea, Gabon and Sao Tome and Principe; Northern Africa: Algeria, Egypt, Libya, Morocco, Sudan and Tunisia; Southern Africa: Botswana, Eswatini, Lesotho, Namibia and South Africa; Western Africa: Benin, Burkina Faso, Cabo Verde, Côte d’Ivoire, Gambia, Ghana, Guinea, Guinea-Bissau, Liberia, Mali, Mauritania, Niger, Nigeria, Saint Helena, Senegal, Sierra Leone and Togo.
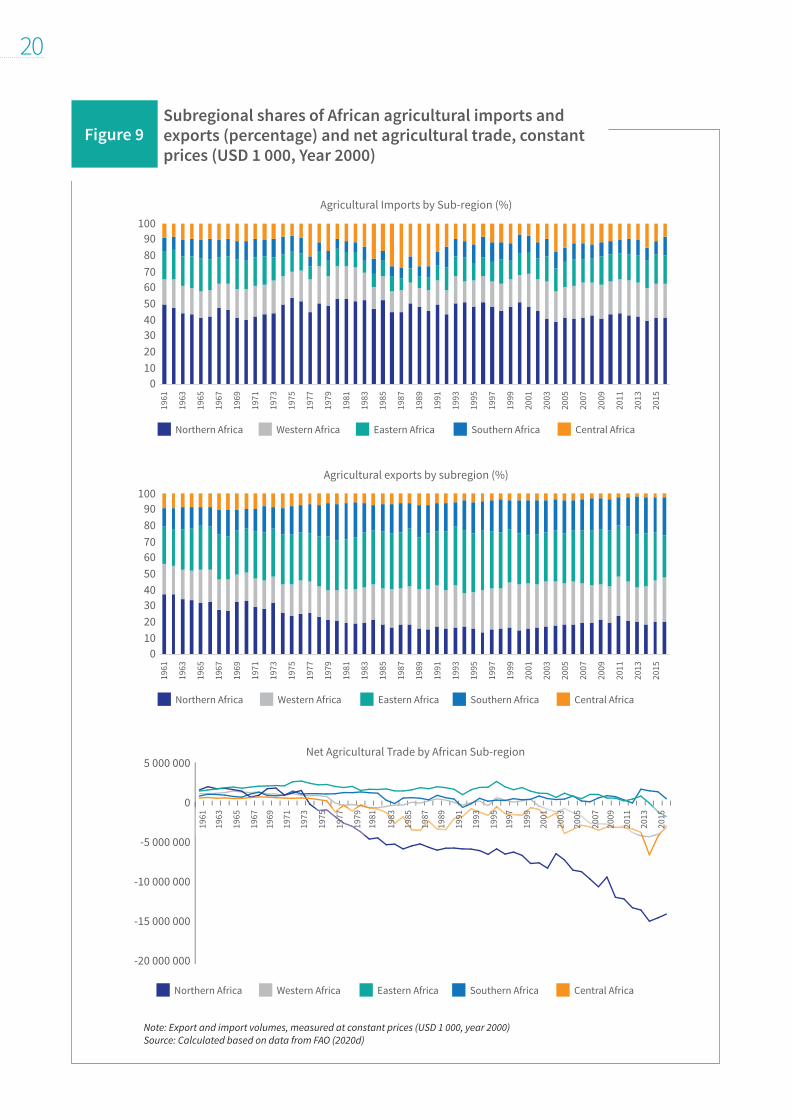
20
Figure 9Subregional shares of African agricultural imports and exports (percentage) and net agricultural trade, constant prices (USD 1 000, Year 2000)
Agricultural Imports by Sub-region (%)
Northern Africa Western Africa Eastern Africa Southern Africa Central Africa
1961
1963
1965
1967
1971
1969
1973
1975
1977
1979
1981
1983
1985
1987
1989
1991
1993
1995
1997
1999
2001
2003
2005
2007
2009
2011
2013
2015
100908070605040302010
0
Note: Export and import volumes, measured at constant prices (USD 1 000, year 2000) Source: Calculated based on data from FAO (2020d)
Agricultural exports by subregion (%)
Northern Africa Western Africa Eastern Africa Southern Africa Central Africa
1961
1963
1965
1967
1971
1969
1973
1975
1977
1979
1981
1983
1985
1987
1989
1991
1993
1995
1997
1999
2001
2003
2005
2007
2009
2011
2013
2015
100908070605040302010
0
-20 000 000
-15 000 000
-10 000 000
-5 000 000
0
5 000 000
1961
1963
1965
1967
1971
1969
1973
1975
1977
1979
1981
1983
1985
1987
1989
1991
1993
1995
1997
1999
2001
2003
2005
2007
2009
2011
2013
2015
Northern Africa Western Africa Eastern Africa Southern Africa Central Africa
Net Agricultural Trade by African Sub-region
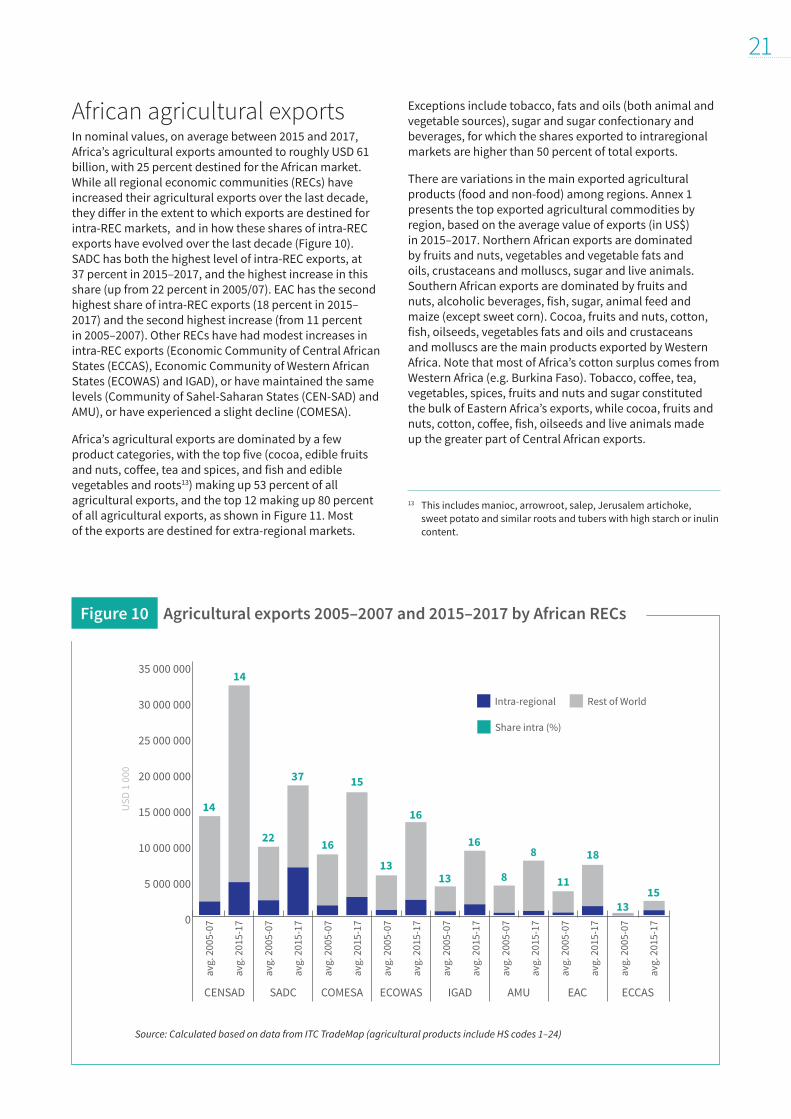
21
African agricultural exportsIn nominal values, on average between 2015 and 2017, Africa’s agricultural exports amounted to roughly USD 61 billion, with 25 percent destined for the African market. While all regional economic communities (RECs) have increased their agricultural exports over the last decade, they differ in the extent to which exports are destined for intra-REC markets, and in how these shares of intra-REC exports have evolved over the last decade (Figure 10). SADC has both the highest level of intra-REC exports, at 37 percent in 2015–2017, and the highest increase in this share (up from 22 percent in 2005/07). EAC has the second highest share of intra-REC exports (18 percent in 2015–2017) and the second highest increase (from 11 percent in 2005–2007). Other RECs have had modest increases in intra-REC exports (Economic Community of Central African States (ECCAS), Economic Community of Western African States (ECOWAS) and IGAD), or have maintained the same levels (Community of Sahel-Saharan States (CEN-SAD) and AMU), or have experienced a slight decline (COMESA).
Africa’s agricultural exports are dominated by a few product categories, with the top five (cocoa, edible fruits and nuts, coffee, tea and spices, and fish and edible vegetables and roots13) making up 53 percent of all agricultural exports, and the top 12 making up 80 percent of all agricultural exports, as shown in Figure 11. Most of the exports are destined for extra-regional markets.
Exceptions include tobacco, fats and oils (both animal and vegetable sources), sugar and sugar confectionary and beverages, for which the shares exported to intraregional markets are higher than 50 percent of total exports.
There are variations in the main exported agricultural products (food and non-food) among regions. Annex 1 presents the top exported agricultural commodities by region, based on the average value of exports (in US$) in 2015–2017. Northern African exports are dominated by fruits and nuts, vegetables and vegetable fats and oils, crustaceans and molluscs, sugar and live animals. Southern African exports are dominated by fruits and nuts, alcoholic beverages, fish, sugar, animal feed and maize (except sweet corn). Cocoa, fruits and nuts, cotton, fish, oilseeds, vegetables fats and oils and crustaceans and molluscs are the main products exported by Western Africa. Note that most of Africa’s cotton surplus comes from Western Africa (e.g. Burkina Faso). Tobacco, coffee, tea, vegetables, spices, fruits and nuts and sugar constituted the bulk of Eastern Africa’s exports, while cocoa, fruits and nuts, cotton, coffee, fish, oilseeds and live animals made up the greater part of Central African exports.
Figure 10 Agricultural exports 2005–2007 and 2015–2017 by African RECs
Source: Calculated based on data from ITC TradeMap (agricultural products include HS codes 1–24)
13 This includes manioc, arrowroot, salep, Jerusalem artichoke, sweet potato and similar roots and tubers with high starch or inulin content.
0
5 000 000
10 000 000
15 000 000
20 000 000
25 000 000
30 000 000
35 000 000
CENSAD
avg.
200
5-07
avg.
201
5-17
avg.
200
5-07
avg.
201
5-17
avg.
200
5-07
avg.
201
5-17
avg.
200
5-07
avg.
201
5-17
avg.
200
5-07
avg.
201
5-17
avg.
200
5-07
avg.
201
5-17
avg.
200
5-07
avg.
201
5-17
avg.
200
5-07
avg.
201
5-17
SADC COMESA ECOWAS IGAD AMU EAC ECCAS
USD
1 0
00
14
14
22
37
16
15
13
16
13
16
8
8
11
18
1315
Intra-regional Rest of World
Share intra (%)

22
Figure 11 Africa’s top agricultural exports (average 2015–2017) and share of intraregional trade
Source: Calculated based on data from ITC TradeMap (agricultural products include HS codes 1–24 and raw cotton HS 5201–5203)
0 2 000 000 4 000 000 6 000 000 8 000 000 10 000 000
Intra-regional
Rest of World
% intra
HS 18 - Cocoa and cocoa preparations
HS 08 - Edible fruit and nuts; peel ofcitrus fruit or melons
HS 09 - Co�ee, tea, maté and spices
HS 03 - Fish and crustaceans, molluscs andother aquatic invertebrates
HS 07 - Edible vegetables and certainroots and tubers
HS 24 - Tobacco and manufacturedtobacco substitutes
HS 12 - Oil seeds and oleaginous fruits; miscellaneous grains,seeds and fruit; industrial or medicinal plants; straw and fodders
HS 15- Animal or vegetable fats and oils and their cleavageproducts; prepared edible fats; animal or vegetable waxes
HS 17 - Sugars and sugar confectionery
HS 22 - Beverages, spirits and vinegar
HS 5201-5203 - Raw, waste and carded cotton
HS 16 - Preparations of meat, of fish or ofcrustaceans, molluscs or other aquatic invertebrates
USD 1 000
2
6
19
17
23
57
13
50
59
58
9
23

23
African agricultural importsIn nominal values, on average between 2015 and 2017, Africa’s agricultural imports amounted to roughly USD 80 billion, having more than doubled, from USD 39 billion in 2005–07.14 The share of intra-REC imports today is roughly 17 percent and has not significantly increased from a decade ago (15 percent in 2005–2007). Agricultural imports have risen in all the RECs over the same period, albeit with differing shares of intra-REC imports (Figure 12). This share is highest in SADC at 33 percent, followed by EAC at 21 percent. Although EAC has the lowest levels of imports of all the RECs, it has seen a very rapid increase in the share of intra-REC imports (up from 11 percent in 2005–2007). This contrasts with most other RECs where there has been either a very modest increase in the share of intra-REC imports (AMU, CEN-SAD, ECOWAS and ECCAS) or it has declined (COMESA and IGAD).
As with agricultural exports, imports are also dominated by a few product categories, with the top five of these making up 56 percent of the total imports and the top 11 making up 80 percent as shown in Figure 13. Most of the top imports are sourced from outside the region, with shares of intraregional imports for all these products remaining below 35 percent of total imports.
Figure 12 Agricultural imports 2005–2007 and 2015–2017 by African REC
Source: Calculated based on data from ITC TradeMap (agricultural products include HS codes 1–24)
14 The food import bill reported in this document is higher than in AfDB (2016), where Africa spent USD 35 billion on food imports in 2015. In AfDB (2016), the food import bill is the agricultural trade balance (exports minus imports) in 2015 and excludes intra-African agricultural trade, while the FAO estimate of Africa’s food import bill corresponds to the total agricultural imports in nominal terms per year in 2015–2017. The value of total agricultural imports as reported in the Framework is a better measurement of the food import bill.
0
10 000 000
20 000 000
30 000 000
40 000 000
50 000 000
CENSAD
avg.
200
5-07
avg.
201
5-17
avg.
200
5-07
avg.
201
5-17
avg.
200
5-07
avg.
201
5-17
avg.
200
5-07
avg.
201
5-17
avg.
200
5-07
avg.
201
5-17
avg.
200
5-07
avg.
201
5-17
avg.
200
5-07
avg.
201
5-17
avg.
200
5-07
avg.
201
5-17
SADCCOMESA ECOWAS IGADAMU EACECCAS
Intra-regional Rest of World
USD
1 0
00
Share intra (%)
7
8
10
9
1
3
28
33
5
7
14
13
34
1121
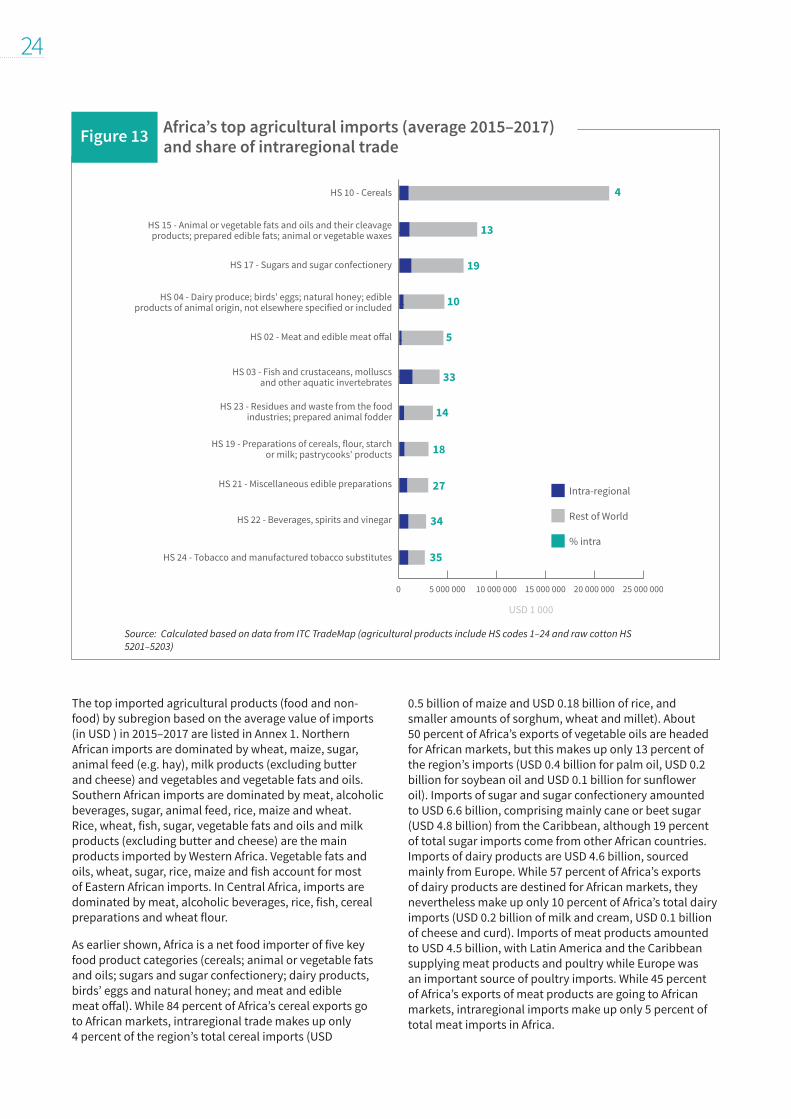
24
The top imported agricultural products (food and non-food) by subregion based on the average value of imports (in USD ) in 2015–2017 are listed in Annex 1. Northern African imports are dominated by wheat, maize, sugar, animal feed (e.g. hay), milk products (excluding butter and cheese) and vegetables and vegetable fats and oils. Southern African imports are dominated by meat, alcoholic beverages, sugar, animal feed, rice, maize and wheat. Rice, wheat, fish, sugar, vegetable fats and oils and milk products (excluding butter and cheese) are the main products imported by Western Africa. Vegetable fats and oils, wheat, sugar, rice, maize and fish account for most of Eastern African imports. In Central Africa, imports are dominated by meat, alcoholic beverages, rice, fish, cereal preparations and wheat flour.
As earlier shown, Africa is a net food importer of five key food product categories (cereals; animal or vegetable fats and oils; sugars and sugar confectionery; dairy products, birds’ eggs and natural honey; and meat and edible meat offal). While 84 percent of Africa’s cereal exports go to African markets, intraregional trade makes up only 4 percent of the region’s total cereal imports (USD
0.5 billion of maize and USD 0.18 billion of rice, and smaller amounts of sorghum, wheat and millet). About 50 percent of Africa’s exports of vegetable oils are headed for African markets, but this makes up only 13 percent of the region’s imports (USD 0.4 billion for palm oil, USD 0.2 billion for soybean oil and USD 0.1 billion for sunflower oil). Imports of sugar and sugar confectionery amounted to USD 6.6 billion, comprising mainly cane or beet sugar (USD 4.8 billion) from the Caribbean, although 19 percent of total sugar imports come from other African countries. Imports of dairy products are USD 4.6 billion, sourced mainly from Europe. While 57 percent of Africa’s exports of dairy products are destined for African markets, they nevertheless make up only 10 percent of Africa’s total dairy imports (USD 0.2 billion of milk and cream, USD 0.1 billion of cheese and curd). Imports of meat products amounted to USD 4.5 billion, with Latin America and the Caribbean supplying meat products and poultry while Europe was an important source of poultry imports. While 45 percent of Africa’s exports of meat products are going to African markets, intraregional imports make up only 5 percent of total meat imports in Africa.
Figure 13 Africa’s top agricultural imports (average 2015–2017) and share of intraregional trade
Source: Calculated based on data from ITC TradeMap (agricultural products include HS codes 1–24 and raw cotton HS 5201–5203)
0 5 000 000 10 000 000 15 000 000 20 000 000 25 000 000
Intra-regional
Rest of World
% intra
HS 10 - Cereals
HS 15 - Animal or vegetable fats and oils and their cleavage products; prepared edible fats; animal or vegetable waxes
HS 17 - Sugars and sugar confectionery
HS 04 - Dairy produce; birds' eggs; natural honey; edible products of animal origin, not elsewhere specified or included
HS 02 - Meat and edible meat o�al
HS 03 - Fish and crustaceans, molluscs and other aquatic invertebrates
HS 23 - Residues and waste from the food industries; prepared animal fodder
HS 19 - Preparations of cereals, flour, starch or milk; pastrycooks' products
HS 21 - Miscellaneous edible preparations
HS 22 - Beverages, spirits and vinegar
HS 24 - Tobacco and manufactured tobacco substitutes
USD 1 000
4
13
19
10
5
33
14
18
27
34
35

25
Africa agricultural outlookThe OECD-FAO Agricultural Outlook 2019–2028 shows that agricultural demand will continue to outstrip agricultural supply over the 2019–2028 period.15 According to the report, demand for agricultural commodities such as beef, poultry, maize, rice, soybean and vegetable oils (including palm oil) will be consistently higher than production over the outlook period (see Table 5). Cotton and roots and tubers16 are the only commodities whose production will exceed demand. Demand is expected to increase by 3.7 percent each year for rice, 2.2 percent for fish and 2.4 percent for vegetable oils, while production will grow by 2.3 percent, 1 percent and 1.1 percent respectively. This situation will put significant pressure on agricultural commodity inventories, while remaining one of the primary drivers of increasing trade deficits in many subregions on the continent.
Trade in servicesThere are four types of services that are important for food and agriculture: transport and logistics services, financial services, information and communications technology (ICT) services and distribution and retail services (Figure 14). Services are not only embodied within traded goods such as processed foods, but services also facilitate linkages with upstream and downstream parts of the agricultural value chain. Services support trade across borders in the form of transport and logistics, food safety, laboratory testing and certification, e-commerce, fintech, delivery and payment systems and electronic dissemination of agricultural data and market information. The services sector now contributes nearly 50 percent of
GDP in US dollar terms and above 50 percent in nominal market prices (FAO, forthcoming). The services sector generates jobs, raises wages and contributes to growth within and across borders. Typical drivers of trade in services are differences in the cost and quality of services and the non-availability of certain specialised services (Dihel and Goswami, 2016).
Well-functioning markets for services contribute to competitiveness in agriculture and productivity growth by adding value to food and farm goods, extending product shelf life and ensuring product quality and variety. Services can also contribute to reducing greenhouse gas emissions and planning ideal planting and harvesting activities using weather forecasts, crop-specific advice and local market prices. Smallholder farmer productivity increasingly relies on markets for various inputs (seeds, fertilizers, pesticides) and services. These services play an important role in every phase from pre- and post-harvest operations to trade facilitation, processing and delivery to the end consumer.
15 The OECD-FAO Agricultural Outlook provides a ten-year forward-looking assessment of trends and prospects in the major agricultural commodity markets. The projections in this Agricultural Outlook are influenced by both current market conditions (production and price) and assumptions about the macroeconomic, demographic and policy environment. The projections are also subject to some uncertainties as well as an assumption of average weather conditions. For further details, refer to OECD/FAO, 2019. It is worth noting that the report was published before the COVID-19.
16 E.g. cassava, sweet potato, yams, potatoes and taro.
Table 5: Agricultural outlook, 2019–2028 (in 1 000 metric tonnes)
COMMODITIES2019 2028
SUPPLY DEMAND BALANCE SUPPLY DEMAND BALANCE
Beef and veal 6 751 7 412 deficit 7 850 8 876 deficit
Cotton 1 920 453 surplus 2 300 558 surplus
Fish 12 026 13 950 deficit 13 264 16 993 deficit
Maize 82 983 101 072 deficit 100 192 122 843 deficit
Poultry meat 5 986 7 925 deficit 7 237 10 019 deficit
Rice 21 307 40 334 deficit 25 920 54 791 deficit
Roots and tubers 90 107 88 271 surplus 104 433 104 030 surplus
Soybean 3 130 8 039 deficit 3 646 9 080 deficit
Vegetable oils 8 219 19 359 deficit 9 388 24 119 deficit
Source: OECD-FAO Agricultural Outlook 2019–2028

26
Services are a crucial component in all stages of the agricultural and food value chain in Africa, from extension and technical advisory services and the credit farmers need to invest in inputs to the processing and distribution of finished goods. For example, transport costs represent up to a third of the farm gate price in parts of Africa. ICT services are now integral to the production cycle (pre-cultivation, crop cultivation and harvesting and post-harvest), food processing as well as in the marketplace where prices are disseminated through, for example, commodity exchanges and mobile apps on smartphones.
For many years, large subsectors of the services economy in Africa have been treated as non-tradables, and have therefore been allowed to operate in the opaque informal sector. As a result, formal trade in services is still low and not well documented. While trade in services accounts for about 22 percent of Africa’s total trade in goods and services, African countries remain responsible for only about 2 percent of global service exports.17 The current low level of value added in services indicates the vast potential for growth of intra-African trade in agricultural commodities and services. The services sector is a source
of income for 30 percent of the African working-age population, and about 33 percent of youth work in the sector (World Economic Forum, 2017).
Regulations on the cross-border supply of services have been shown to hinder the growth of agricultural trade in services such as business operating hours, restrictions on product distribution, incompatible or lack of recognition of standards on SPS and technical certification and professional qualifications. Other trade barriers include the lack of transparency and availability of information, regulatory bureaucracy, high licensing costs and service fees, labelling requirements, the complexity of customs procedures and underdeveloped transport and technology infrastructure, including inadequate last-mile delivery capabilities (Box 2).
17 https://www.tralac.org/discussions/article/12839-trade-in-services-and-the-afcfta-no-service-is-an-island.html#_ftn1 (accessed: 02-03-2020).
Figure 14 Key services in the food and agricultural sector
Transport & Logistics
ICT
Distribution Financial Services
FOOD & AGRICULTURE
Source: Adapted from FAO (forthcoming), Synergy Between Agriculture and Services Trade: Enabling New Growth Opportunities.

27
The free movement of persons across borders is another very sensitive issue for many African countries as shown by the plethora of regulatory barriers put in place: costly visas, restrictions on getting residency and work permits and other immigration hurdles. Negotiated regulations on the four modes of supply of trade in services, which will be codified into the regulatory frameworks of countries, will be guided by the AfCFTA’s Protocol on Trade in Services and the work of the interstate Committee on Trade in Services, which oversees implementation, monitoring and evaluation of the Protocol. The four modes of supply of trade in services are: Mode 1 (cross-border supply, e.g. digital content, telecoms); Mode 2 (consumption abroad, e.g. medical, education, tourism services); Mode 3 (commercial presence, e.g. branch offices of foreign firms); and Mode 4 (presence of natural persons, e.g. expatriate consultants, traders).
The AfCFTA’s Protocol on Trade in Services seeks to create a liberalised continental single market for trade in services. Some of the important issues addressed in the AfCFTA cover transparency, special and differential treatment, regulations, mutual recognition, monopolies and anti-competitive behaviour, payments and transfers and subsidies. African Member States have initially agreed on the liberalisation of five priority services – financial services, communication, transport, tourism and business services – under the AfCFTA. A key consideration in the cross-border supply of services is the mutual recognition of qualifications and the harmonisation of standards, licenses and certifications. For this to happen, there needs to be uniform regulations that ensure the quality and standard of services in terms of their technical merits and the safety of consumers, businesses and other users.
The liberalisation of trade in services in Africa is expected to boost competitiveness of domestic economies and the export performance of countries in goods and services. It will attract additional FDI into services, as services in the agricultural sector are largely traded through commercial presence (Mode 3). Several factors contribute to increasing trade costs of services and decreased competitiveness. In the distribution subsector, service providers face challenges such as compliance costs, regulatory barriers, risks of fraud and non-payment, language differences, low trust in foreign providers, different tax regulations, higher costs of dispute resolution and supplier restrictions. Similarly, the ICT subsector is subject to foreign ownership limitations, government ownership of major suppliers and screening of foreign investment. In the underdeveloped financial services sector, harmonised regulations within regions can help scale up fintech or digitalized financial services by maximizing limited resources and enabling the financial industry to compete in regional and international markets.
Source: Adapted from FAO (forthcoming), Synergy Between Agriculture and Services Trade: Enabling New Growth Opportunities.
Box 2 Benefits and challenges of the liberalisation of agricultural services in Africa
28
H. CHALLENGES AND CONSTRAINTS TO INTRA-AFRICAN AGRICULTURAL TRADEAccording to UNCTAD (2019), there are three major categories of obstacles to intra-African trade: (i) weak productive capacities and limited economic diversification, which constrict the range of intermediate and final goods that can be traded and potentially inhibit the fuller development of regional value chains; (ii) tariff-related trade costs associated with the slow implementation of the tariff liberalization schedules underpinning free trade agreements; and (iii) high non-tariff-related trade costs, including those caused by the recent COVID-19 pandemic that hamper the competitiveness of firms and economies in Africa. Such high trade costs, related to business and trade facilitation, can be explained in terms of the hard and soft infrastructure deficits in Africa that have an impact on transport and transit costs, including at-the-border and behind-the-border costs.
Supply-side constraintsChallenges related to supply-side constraints and weak productive capacities include land degradation and localised water stress, high levels of post-harvest losses and fragile agrifood markets. For example, only 6 percent of arable land is irrigated in Africa18 compared with 14 percent and 50 percent in Latin America and Southern Asia, respectively (FAO, 2020d). The average sub-Saharan African farmer uses 16 kg of fertilizer per hectare, in contrast to 140 kg and 160 kg in Latin America and Southern Asia, respectively (World Bank, World Development Indicators). The opportunities for increasing the shelf life of perishable and other soft goods through agroprocessing (e.g. canned preserved meat, vegetables and fruit) are similarly limited due to undercapitalisation and underinvestment in processing facilities and mechanization, inadequate storage or cold chain infrastructure, poor extension services and access to affordable value chain and trade finance.
Another challenge relates to access to electricity in Africa. According to the World Bank, more than half of sub-Saharan Africans lacked access to electricity in 2016, far higher than any other developing region (including
Southern Asia and Latin America and the Caribbean) and higher than Northern Africa (Blimpo and Cosgrove-Davies, 2019). In sub-Saharan Africa, countries of Eastern and Central Africa are ranked among the lowest in access to electricity. Although it is improving, Internet access in Africa is still marked by different levels among African countries. The share of the population using the Internet is closer to 30 percent in Western Africa and only around 10 percent in Central Africa, whereas more than half the population uses the Internet in Southern Africa (Mahler et al., 2019).
Business environmentIn terms of reforms to improve business regulation and strengthen property rights protection, Africa is ranked among the lowest regions, according to the World Bank Doing Business indicators.19 The lowest-ranked subregion is Central Africa, while Southern Africa has the highest ranking in Africa.
Furthermore, African exporters face challenges related to the time it takes to cross borders and the high transaction costs of shipped products. According to the World Bank, the time required to export or to import is still very high in most African countries. For example, the time to export (border requirements) is estimated at 296 hours in the Democratic Republic of the Congo and 239 hours in Côte d’Ivoire, while it is less than four hours in Eswatini and Lesotho. The time to export (documentation requirements) is estimated at 192 hours in the Democratic Republic of the Congo and South Sudan, while it is two hours in Eswatini and three hours in Tunisia.
18 The share of arable land equipped for irrigation is 3 percent in sub-Saharan African but almost 20 percent in Northern Africa.
19 https://www.doingbusiness.org/en/data/exploretopics/trading-across-borders (accessed: 02-03-2020)

29
informal cross-border tradeTariffs as well as non-tarrif barriers contribute to high levels of informality as observed in many African countries. For example, in Southern Africa informal cross-border trade (ICBT) accounts for 30 to 40 percent of total intra-SADC trade, amounting to as much as USD 17.6 billion a year (Afrika and Ajumbo, 2012). In Uganda, data indicate that informal exports to neighbours were about 86 percent of official exports and 19 percent of official imports, while informally traded agricultural products were about 75 percent of official agricultural exports (Lesser and Moisé-Leeman, 2009). In Eastern Africa, the informal cattle trade made up 85 percent of the total cattle trade in 2011 (Afrika and Ajumbo, 2012). Similarly, in Western Africa, official statistics may account for only one-third of the actual value of the intraregional livestock trade in Mali and Burkina Faso (Josserand, 2013).
Informally traded maize accounts for about 40 to 45 percent of all officially traded maize – and 31 percent of all traded maize – between the Democratic Republic of the Congo, Malawi, Mozambique, United Republic of Tanzania, Zambia and Zimbabwe (Lesser and Moisé-Leeman, 2009). In Nigeria, ICBT accounts for between 20 percent of GDP in Nigeria and 75 percent in Benin (UNECA, 2010). Indeed, 15 percent of Nigeria’s imports are informal and arrive through the Benin–Nigeria border. However, even if ICBT is included, the total level of intra-African trade is not likely to be more than 20 percent of the total trade (AUC, 2012).
ICBT is especially important for women as a livelihood and a source of income. Women dominate trade between the Democratic Republic of the Congo and its Great Lakes neighbours, and two-thirds of respondents indicated that cross-border trade was their main source of income (Brenton and Isik, 2012). The available evidence indicates that women make up between 60 and 70 percent of informal cross-border traders (Quisumbing et al., 2014; Afrika and Ajumbo, 2012).
ICBT is widespread because of weaknesses in institutional capacities related to taxation, regulation and private property rights. Tax rates are often high, and procedures related to taxation, business registration, licensing and inspection are typically very complicated. Moreover, other barriers to trading in the formal sector, such as poor skills, education and training and weak infrastructure force traders to engage in informal trade to earn a living (Koroma et al., 2017). To address these issues, governments need to simplify legislation and regulations governing trade, educate traders on formal procedures, and tackle corruption (Koroma et al., 2017).
Informality exacts a personal and social cost on traders who are mostly women. Informal traders operate at the mercy of officials who often solicit bribes, harass and sexually abuse traders and confiscate their goods, holding back the contribution that the informal sector makes to economic development. In addition, ICBT is often viewed in a negative light by officials as a form of unfair competition to domestically produced goods in the formal economy, responsible for significant government revenue losses.
Agricultural value chainsAfrican Member States have made a commitment as outlined in the CAADP and Malabo policies to adopt the sustainable regional value chain approach. For this reason, the BIAT Framework prioritises sustainable agricultural value chains, integrating smallholders and other key actors in intra-African trade, to spur agricultural transformation and improve food security through local sourcing and regional value addition. The 2006 AU Summit on Food Security in Africa already identified the following strategic commodities to achieve economies of vertical integration and scale in African agriculture: rice, legumes, maize, cotton, palm oil, beef, dairy, poultry and fishery products, cassava, sorghum and millet. The idea is that emphasis should be placed at the regional/subregional level around a limited number of strategic commodities without prejudice to ongoing efforts at sector-wide developments.
RECs have also identified strategic commodities at the regional level to support the development of regional value chains (AU-SAFGRAD, 2017). For example, COMESA has prioritised maize, cassava, livestock, dairy, leather, soya beans, fruits, vegetables and flowers. EAC’s priority commodities include maize, rice, beans, soya beans, sunflower, palm oil, cassava, Irish potatoes, dairy and fish. The key commodities for ECCAS are rice, cassava, livestock, meat, poultry and cotton. ECOWAS has prioritised cassava, maize, rice, sorghum, beans, livestock, meat, dairy, cotton, cocoa, fisheries and aquaculture. IGAD’s proposed commodities include sorghum, millet, sesame, maize, sugar cane, gum arabic and livestock, meat, feed, leather and dairy value chains. SADC’s priority commodities are livestock, leather and associated value chains, soya beans, cotton and groundnuts.

30
TariffsAverage applied tariffs in sub-Saharan Africa are already relatively low. The effectively applied tariff weighted average (customs duty) for sub-Saharan Africa for all merchandise was 5.67 percent in 2017 while the most favoured nation (MFN) weighted average tariff was 7.85 percent. In comparison, the effectively applied agricultural tariff weighted average (customs duty) for sub-Saharan Africa in 2019 was 9.54 percent while the MFN weighted average tariff was 13.23 percent.20 AfCFTA Member States have commited to liberalise substantially all trade by eliminating tariffs on 90 percent of goods. The remaining 10 percent is divided between sensitive products (7 percent) and the exclusion list, namely, products on which no reduction in tariffs would be proposed (3 percent). The timeframe for implementation for non-sensitive products is 5 years for developing countries and 10 years for the least developed countries (LDCs), while for sensitive products, it is 10 years and 13 years, respectively. Trade within RECs will continue according to the trading regimes they have in place and new tariff liberalisation under AfCFTA will only occur among Member States that do not have an existing agreement with one another. There are considerable differences among the RECs in the degree of tariff liberalisation they have achieved among Member States. According to UNECA (2016), the intraregional economic community tariffs (tariffs applied by REC members on imports from other members of the same REC) are as follows: CEN-SAD (7 percent), ECOWAS (6 percent), SADC (4 percent), AMU (3 percent), ECCAS (2 percent), COMESA (2 percent), IGAD (2 percent) and EAC (0 percent).
During the trade negotiations and in future trade policy reviews, policy-makers and their chief trade negotiators must ensure that the principle of substantially all trade is adhered to without overloading the exclusion list with too many sensitive products. Examples include agrifood products as well as raw materials, intermediates and capital goods that are critical for the agroprocessing and manufacturing industries. Preferably, the exclusion lists of goods negotiated under the AfCFTA should be regionally focused and not only country-specific. In this way, freeing up the trade in critical goods would lower importation costs and increase the trade competitiveness of regional value chains which rely heavily on a number of imported inputs such as food ingredients, packaging materials, capital equipment and similar products in the production process.
It is expected that the benefits of further trade integration will materialise in the long term, while most of the costs of adjustment and integration will be incurred in the short term. According to UNCTAD, the full elimination of tariffs in the transition phase could generate welfare gains of USD 16.1 billion while intra-African trade is estimated to grow to 33 percent from 15 percent (UNCTAD, 2019). These figures are likely to be significantly affected by the current COVID-19 pandemic.
Non-tariff barriersAs mentioned earlier, the reduction of NTBs21 and the harmonisation of complementary policies that facilitate trade are critical for boosting intra-African trade. Although there is political will at the highest levels, implementation hurdles remain, adding costs to crossing borders in Africa. Domestic transportation costs are also high, accounting for between 50 and 60 percent of marketing costs in the region, while roadblocks very often add to the cost of transport.
Specific to agriculture, SPS measures have become relatively more burdensome compared to tariffs. SPS measures have the legitimate and critical function to protect public health and animal and plant life and health. However, weak national capacity to comply with SPS requirements can result in a country’s exclusion from key markets, while poorly applied procedures can increase the cost of trade. Estimates shows that domestic food prices in sub-Saharan Africa are 13 percent higher on average due to SPS measures (Cadot and Gourdon, 2014). Promoting intraregional trade will require the reduction of such barriers to trade, which today often push traders towards using informal channels, thereby failing to comply with SPS measures entirely and defeating their intended purpose.
The text of the AfCFTA Agreement (Annex 7 of the Protocol on Trade in Goods) emphasises cooperation and technical assistance to enhance the capacity of countries to meet SPS standards and promote the harmonisation and equivalence of standards in the furtherance of intra-African trade and the removal of unnecessary trade barriers. At the national and regional levels, several countries and RECs have made progress in establishing coordinating mechanisms such as SPS committees to ensure that standards are aligned with those of the international standard-setting bodies, such as the Codex Alimentarius Commission (CAC), the World Organisation for Animal Health (OIE) and the International Plant Protection
20 Debar and Tapsoba (2019) have pointed out that the choice of weights used to calculate the average tariff influences the level of tariff protection. This is confirmed in the IFPRI Africa Agricultural Trade Monitor 2019. It is suggested to use weights based on a reference group instead of weights based on the trade value. The authors found a much higher average African agricultural tariff with the new method (18.01 percent in 2016).
21 According to Deardorff’s Glossary of International Economics (2014), NTBs can refer to a vast array of domestic measures or policies, apart from tariffs, which serve to or result in discouraging imports. NTBs may include customs procedures, administrative requirements and even domestic regulations such as health, environmental or labour standards. A related concept is non-tariff measures, that is, any policy or official practice that alters the conditions of international trade, including those that act to increase trade as well as those that restrict it. A non-tarrif measure is therefore broader than a non-tariff barrier, although the two are usually used interchangeably.
31
Convention (IPPC). Additionally, several RECs, such as the COMESA-EAC-SADC Tripartite and ECOWAS, have put in place online portals for reporting and resolving complaints on NTBs. Similarly, the AUC recently rolled out a new continental portal for monitoring and eliminating NTBs.22
Governments can facilitate cross-border trade by investing in physical infrastructure, simplifying customs formalities, harmonising standards, streamlining licensing procedures and certificates of origin requirements and improving market information and finance, while improving the professionalism of customs officers at border crossing points.
There is also the need for smart trade facilitation policies (for example, single windows, one-stop border posts, pre-arrival clearance, customs risk management, cargo tracking systems and recognition of licensing and insurance systems) that address NTBs in support of regional agricultural value chains and economic integration. In the case of informal trade, there is a need to further simplify procedures and improve security conditions in the border areas for small and informal cross-border traders. These measures include simplified certificates of origin and customs documents, lists of qualified goods, exemption of small goods consignments similar to the example in EAC. Additionally, trade helpdesks can provide assistance to traders and at the same time capture data on informal trade activities to support the design of appropriate policies that minimise the incentives for informality.
Addressing these NTBs, including at-the-border and behind-the-border bottlenecks, will help reduce the time and cost associated with the export transaction process, reduce rejection rates of goods at ports of entry and increase regional and international buyers’ confidence in country-level product certification systems. As a result of these improvements, African exporters will be in a stronger position to increase export volumes, command higher prices for certified goods and generate wealth and jobs through the expansion of regional and international trade. In the meantime, the ramifications of the coronavirus shock will continue to be a drag on Africa’s economic and trade performance for the foreseeable future.
Demand and supply shocks during COviD-19COVID-19 has effectively erased the gains in economic growth that many African countries had built up over the last two decades. The coronavirus pandemic has created shocks globally with negative impacts on intra-African trade, with the GDP expected to drop precipitously from 2.4 percent in 2019 to -2.1 percent to -5.1 percent in 2020,
marking the first recession in the region in 25 years. The pandemic has triggered containment measures, including border closures and restrictions on the movement of people, goods and services. These restrictive measures have disrupted essential services in agriculture and food systems such as food production and processing, transportation and other key elements of agricultural supply chains. The pandemic has negatively impacted African countries as evidenced by a significant contraction in agricultural exports and imports as well as short-term localised shortages and price spikes of essential medical and food supplies affecting smallholders and other vulnerable populations due to transportation bottlenecks, panic-buying, fear and speculation.23
COVID-19 has shown the potential for a health emergency to rapidly deteriorate into a food and nutrition security crisis with widespread and long-term damaging effects if not properly managed. As a preventive measure, a number of lessons learned and best practices can be incorporated into the risk management system of the AfCFTA at national, regional and continental levels. These practices can help to minimise the disruptive effects of COVID-19 and similar future shocks on intra-African trade in agricultural commodities and services. The key lessons of the response to the coronavirus pandemic include the absolute necessity and imperative to maintain open trade channels and cross-border trade, policy coordination between Member States, protecting essential workers to ensure that public health and food systems continue to operate and the deployment of innovative approaches to facilitate trade, investment and economic activities such as digital solutions and robust surveillance systems to complement traditional business practices.
22 See https://tradebarriers.africa.
23 Based on rapid assessments conducted by FAO and other organizations between April and August 2020, there is evidence that agrifood trade was affected by declining demand and/or logistical disruptions. Exports of non-food products have been affected by falling prices and slowing demand in major export markets e.g. cotton exports from Mali and other Western African countries; tea, coffee and floriculture products from Kenya; cashews from Guinea-Bissau; apples and pears from South Africa; and tea, cotton, coffee and horticultural products from United Republic of Tanzania. Imports have been affected by logistical disruptions and COVID-19 containment measures, e.g. border delays and spoilages of fresh foods in Kenya and United Republic of Tanzania; live animals and livestock sectors and transhumance have been affected in Burkina Faso, Eritrea, and Mali. See https://www.undp.org/content/undp/en/home/covid-19-pandemic-response/socio-economic-impact-of-covid-19.html (accessed: 09-09-2020).

32
Mitigating the impact of pandemics such as COVID-19 and other catastrophic events on food systems will require coordinated efforts to ensure markets are functioning (AUC and FAO, 2020; FAO, 2020b). For this to happen, countries should review trade and taxation policy options and their likely impacts to create a more favourable environment for the food trade. Trade policies should be coordinated and oriented toward maintaining access to food in a way that is targeted, proportionate, transparent and temporary, particularly for trade-restrictive measures. For example, governments should eliminate existing export restrictions, including export bans, while lowering import tariffs to facilitate imports and thus help to address the immediate concern about low food supplies and rising food prices. African countries have responded to COVID-related disruptions affecting the agricultural and food trade by adopting various measures:
• Reduction or suspension of import tariffs and other import barriers;
• Trade facilitation measures;
• Temporary export restrictions;
• Temporary price controls and restrictions on private hoarding; and
• Expansion of local production and support to producers.
Table 6 is a summary, based on prior experiences of health and food crises, of the pros and cons of various policy responses to build a more resilient AfCFTA single market during COVID-19 and in the recovery and post-crisis phases which can also be applicable to future emergencies.
Table 6: Trade and market disruptions and policy responses
DISRUPTIONS/POTENTIAL DISRUPTIONS IN FOOD SYSTEMS
POLICY RESPONSES
SOLUTIONS, BEST PRACTICES, INNOVATIONS, LESSONS LEARNED AND/OR EXPERIENCES FROM PREVIOUS CRISES/EMERGENCIES
SOLUTION PROS SOLUTION CONS
1. Border closures and lockdowns, transportation challenges and bottlenecks
• Coordinate response with neighbouring countries
• Streamline trade facilitation procedures
• Provide temporary exemptions for essential goods from customs duties, waive or defer taxes
• Adopt legislation negotiated by neighbouring countries to expedite movement of food items
• Remove road barriers, taxes
• Improve flow of goods
• Less uncertainty and greater price stability
• Expedited clearance of essential goods
• Enhanced food availability
• Loss of tax revenue
• Lower prices of domestic substitutes penalising local producers
• Higher demand on international markets and higher international prices

33
Table 6: Trade and market disruptions and policy responses
DISRUPTIONS/POTENTIAL DISRUPTIONS IN FOOD SYSTEMS
POLICY RESPONSES
SOLUTIONS, BEST PRACTICES, INNOVATIONS, LESSONS LEARNED AND/OR EXPERIENCES FROM PREVIOUS CRISES/EMERGENCIES
SOLUTION PROS SOLUTION CONS
2. Collapse in demand for agricultural exports
• Consult with trading partners and neighbouring countries
• Maintain exports of strategic agricultural commodities
• Find alternative export markets, e.g. AfCFTA, regional markets
• Promote import substitution – provide inputs, encourage major retail outlets to sell local food products
• Support MSMEs through export promotion agencies
• Extend the shelf life of commodities through preservation and agroprocessing
• Seek debt relief and support stimulus programmes and social protection measures
• Ensure client retention, jobs
• Penetrate new markets
• None
3. Supply shortages in the domestic market and price instability
• Introduce temporary export controls of selected essential foods
• Based on sound market intelligence, build emergency food stockpiles, e.g. national strategic grain reserves as required
• Increase local production
• Ramp up monitoring and surveillance of critical supplies and trade flows, including periodic socioeconomic impact assessments
• Consult with trading partners and neighbouring countries
• Explore alternative supply chain channels, e.g. e-commerce
• Extend the shelf life of commodities through preservation and agroprocessing
• Less uncertainty in the national market, greater price stability and food availability
• Alleviate potential food shortages
• Lower global supply and higher international prices, adding to instability in global markets
• Lower domestic producer prices
• Loss of export earnings

34
Table 6: Trade and market disruptions and policy responses
DISRUPTIONS/POTENTIAL DISRUPTIONS IN FOOD SYSTEMS
POLICY RESPONSES
SOLUTIONS, BEST PRACTICES, INNOVATIONS, LESSONS LEARNED AND/OR EXPERIENCES FROM PREVIOUS CRISES/EMERGENCIES
SOLUTION PROS SOLUTION CONS
4. Rising food prices
• Introduce temporary price controls with monitoring and surveillance
• Price control committees
• Prohibitions and penalties for related basic foodstuffs
• Reduction in import tariffs for critical agricultural commodities
• More affordable food available
• Penalises local producers by lowering prices and discourages future production
• Challenging to implement in practice
Source: AUC and FAO (2020), FAO (2020b) and authors’ compilation from FAO Regional Office for Africa’s Country Food System Monitoring Data, which documented food system disruptions and policy actions related to the COVID-19 outbreak.
Rules of originThe AfCFTA contains provisions for the application of rules of origin in the Protocol on Trade in Goods which help to distinguish imported goods qualified for preferential treatment from goods that are not. Due to differing levels of economic development, Member States have agreed on a hybrid approach that includes a general rule, such as a requirement of 40 percent local content, together with a number of product-specific rules that address the business and other strategic concerns of Member States. Bigger economies with larger, more mature industries have pushed for product-specific rules that prevent abuse of the rules for commercial gain by one trading partner at the expense of other members, particularly for goods sourced externally that do not meet rules of origin requirements and therefore do not qualify for trade preferences. Many smaller countries lack appropriate risk management systems and the administrative capacity to enforce product-specific rules; therefore, the hybrid approach provides this flexibility for countries to conduct inspections for compliance and to issue certificates of origin to facilitate intra-African trade in a more predictable and transparent business environment.
Trade remedies, dispute settlement and intellectual property rights protectionThe agreement includes a trade remedy regime or trade defence measures to address unfair trade practices. Trade remedies include anti-dumping measures to offset dumping, countervailing measures to counter illegal subsidies, and safeguard measures to defend against import surges, particularly if they aggravate balance of payments problems.
A dispute settlement mechanism will also be in place to handle trade disputes, such as recent border closures in parts of Eastern and Western Africa, which have had adverse impacts on regional trade and security. Again, the main implementation issues about the rules of origin and trade remedies are the low capacity of countries to handle complaints and enforce rules against corruption, smuggling, counterfeit, dumping and other unfair trade practices.
The agreement also includes provisions for a protocol dedicated to intellectual property rights. The protocol protects against the unauthorised duplication and
35
piracy of products of the creative industries (film, music, publications and other creations), biodiversity (indigenous plant and other genetic material, seeds, place names and geographical indications), products related to data and ICT (computer-based agricultural applications) and other goods and services, including pharmaceuticals, that enter the international market illegally without adequate protection and compensation to their owners, creators and inventors.
internet connectivity and digitalizationWhile Internet access is growing in Africa, it is still marked by different levels among African countries. The share of the population using the Internet is closer to 30 percent in Western Africa and only around 10 percent in Central Africa, whereas more than half the population uses the Internet in Southern Africa (Mahler et al., 2019). This situation, exacerbated by state controls and censorship of the Internet in some countries, affects access to and use of ICT to facilitate trade, especially cross-border trade and youth participation in trade. For instance, digital technologies can facilitate the marketing of produce from farmers to consumers both locally and across borders, especially with COVID-19 restrictions in place. Online sales of produce (e-commerce) can connect farmers to buyers of produce such as fresh fruits and vegetables and other perishables, allowing farmers to sell directly to consumers (for example, in cities) while ensuring food safety through digital traceability. Digital technologies are also used by governments to implement social protection measures (e-cash transfers, mobile money, etc.) and other forms of support for farmers with social distancing measures. Recognizing the importance of digital technologies, e-commerce has been included in the AfCFTA through a decision of the AU Heads of State and Government Assembly in February 2020 and will be integrated through a third phase of negotiations.
COVID-19 has amplified existing trade bottlenecks, including inefficient paper-based analogue systems that rely on in-person contact and physical customs and payment documentation for the movement of agricultural commodities across borders. Digitalization has the potential to facilitate and expedite international trade safely, including the implementation of the AfCFTA, with faster, more cost-efficient and less bureaucratic processes. E-certification can reduce lengthy and costly official clearance processes such as inspection certificates required by food authorities, streamline compliance procedures and establish accurate and readily accessible food-composition and contaminants databases. In these challenging times and in the face of other major challenges across the continent, the AfCFTA could help foster the widespread use of digital technologies to boost trade in Africa.
Market information systems and statistics on tradeMarket and trade information systems in Africa generally share several characteristics such as institutional capacity and infrastructural weaknesses, a shortage of skilled human resources and underinvestment over many decades. As a result, data collection, analysis and dissemination tend to be limited and not reliable with some exceptions. Because of Africa’s weak market infrastructure, regional markets are often localised and fragmented with weak transmission of prices between markets and hence the sharp fluctuations in prices. Thus, acute food shortages in one subregion can coincide with surpluses elsewhere within the same country or region, with economic operators often forfeiting commercial opportunities, frequently due to lack of information, poor communications and bottlenecks in distribution channels. One response to addressing such marketing problems has been to set up more reliable and robust market information systems to make information more readily accessible to private sector operators and poor farmers through digital platforms, smartphones and other media.
As the process of trade integration accelerates in Africa, the supply of reliable trade statistics in near real-time from multiple sources, including government statistical offices, ministries, commercial vendors, farmer-based organizations the databases of financial institutions including business and consumer credit information, research institutions and academia will become essential for the formulation of trade integration policies and for addressing hindrances to trade. These information needs include trade information, intelligence reports, market studies, weather and climate patterns as well as coronavirus and other disease surveillance in food markets. In recognition of the urgent need for a variety of information resources, the AU is establishing the African Trade Observatory (ATO) as a key pillar of the AfCFTA.
Climate change and tradeAccording to FAO (2018), climate change has significant implications for agriculture and food security. Its direct and indirect impacts on trade affect the ability of countries to trade. Higher average temperatures, changes in precipitation, rising sea levels and extreme weather events can affect harvest levels, animal production and fisheries and aquaculture. According to FAO projections, the global average yield across all crops is projected to decline by 1.1 percent between 2011 and 2050 due to climate change only (FAO, 2018). The largest declines will be in developing countries, including parts of Africa, and will affect staple foods, such as wheat (-17 percent), maize (-5 percent), sorghum (-15 percent) and millet (-10 percent) (Knox et al., 2012; FAO, 2018). This situation could lead to changes

36
in comparative advantage across regions and across key commodities and consequently to changes in agricultural trade (FAO, 2018). FAO projections show that, except in Eastern Africa, agricultural net imports are expected to increase over the same period in all African subregions due to climate change (FAO, 2018). Western Africa will be most affected, followed by Northern Africa. Climate change can also increase the vulnerability of the supply, transport and distribution chains on which international trade depends (Tamiotti, 2009) and lead to significant post-harvest losses (FAO, 2016b).
On the other hand, trade can act as a climate change adaptation strategy by stabilizing food prices and quantities during production fluctuations. Evidence suggests that domestic production in individual countries is typically more volatile than global and regional country aggregates. Therefore, trade can allow pooling of the risks associated with production shortfalls caused by weather, conflicts or policies. In this regard, trade policies must be aligned with climate objectives and ensure that
open trade plays its role as an adaptation mechanism without impeding mitigation objectives. For example, trade policies could potentially worsen climatic changes, encouraging the production and distribution of global anthropogenic greenhouse gas (GHG)-intensive goods (De Pinto et al., 2017). Food systems are said to contribute 19 percent to 29 percent of GHG emissions, with agricultural production accounting for 80 percent to 86 percent of total food system emissions, mainly from enteric fermentation, manure, application of synthetic fertilizers, land use change and deforestation (Vermeulen et al., 2012). Thus, an integrated trade policy approach aligned with climate-smart agriculture (CSA) could play an important role in mitigating the effects of agricultural activity on climate change, as well as strengthening the resilience of vulnerable farmers to climate change (see Box 3). The COVID-19 crisis can serve as a turning point to rebalance and transform food systems, making them more inclusive, sustainable and resilient.
Climate-smart agriculture (CSA) is a multi-objective approach to help the people who manage agricultural systems respond effectively to climate change. The CSA approach pursues the triple objectives of (i) sustainably increasing productivity and incomes; (ii) adapting to climate change; and (iii) reducing greenhouse gas emissions where possible (mitigation). CSA is not a set of practices that can be universally applied, but rather an approach that involves different elements embedded in local contexts. CSA relates to actions both on farm and beyond the farm, and incorporates technologies, policies, institutions and investment. Actions to implement a CSA approach include:
1. expanding the evidence base;
2. supporting enabling policy frameworks;
3. 3strengthening national and local institutions;
4. enhancing financing options; and
5. implementing practices at field level.
Source: http://www.fao.org/climate-smart-agriculture/overview/en/ (accessed: 02-03-2020)
Box 3 Climate-smart agriculture

37
Gender, youth and tradeAs mentioned earlier in Section E, agriculture is, relative to manufacturing and services, the most important source of employment for women by a wide margin in sub-Saharan Africa. However, consistent with the downward trend in the employment share in agriculture (for both men and women) in recent years, the share of women who are economically active in agriculture is decreasing in all African subregions, except for Eastern Africa (ILO, 2020). The proportion is higher in Central and Eastern Africa. Additionally, women make a significant contribution to trade, especially cross-border trade. In fact, according to UN Women, women account for between 60 percent and 70 percent of informal cross-border traders in Western, Central and Southern Africa (Afrika and Ajumbo, 2012).
African women are overrepresented in cross-border trade, but their specific needs are not sufficiently considered and their activities largely fall within the informal sector. This is explained by gender-specific constraints such as women’s traditional role in the community as unpaid caregivers and homemakers, the lack of access to factors of production as well as barriers to free movement and control over assets and participation in productive activities. For the latter, restrictions or corruption at the border are limiting factors when it comes to selling products abroad. Gender gaps exist in several areas such as land, livestock, agricultural labour, education, extension services, inputs, financial services and technology as well as the lack of social protection for informal workers. For example, female-headed households are less likely to use fertilizers, improved seeds or use mechanical tools and equipment. In some areas, the size of the farm run by a woman is smaller than that of a man (FAO, 2011). Possible solutions include reforms to create more equitable access to land and other resources including financial services.
Similarly, youth are a dominant group in the informal sector with nine in ten informal workers being women and youth (UNECA, 2015). Young entrepreneurs also face a wide range of barriers that limit their ability to join value chains and benefit from international trade. Youth are more affected by high trade barriers, notably non-tariff barriers, which limit their ability to access other African markets and take advantage of economies of scale to increase their competitiveness. In addition, their activities are strongly influenced by the institutional and regulatory environment at the national level, which affects their ability to invest, and is sometimes not conducive for innovation. The lack of assets to pledge as collateral for loans, the slow pace of innovation and adoption of digital and mobile technologies by financial institutions in many African countries, and youth’s limited business networks, access to information, youth-specific trade support and trade-related skills and education are other trade-related
barriers for youth which also contribute to limited access to finance. These constraints can be overcome through the use of mobile apps and other ICT technologies, value chain finance, financial literacy training and building the capacity of financial institutions to tailor services appropriate for young farmers and SMEs (ITC, 2015; AGRA, 2016). One promising statistic is that the median age of Africa’s population is 19 years, which gives young people an advantage in rapidly adapting to the digital age and applying technology and science for structural transformation and economic growth.
Additionally, rural-urban and international migration comprising mainly youth is a major challenge of intra-African agricultural trade owing to rising unemployment, population growth and uncertain job prospects. It is, therefore, essential to connect young African entrepreneurs to trade by helping them to meet their specific challenges and by allowing them to see the agricultural sector as a viable business capable of offering them decent jobs and careers.
Other challengesThe informal character of African smallholder farmers and MSMEs, including scattered production units and unregistered businesses, poses a challenge when it comes to linking them to trade, taking advantage of economies of scale and the formal economy.
The low level of education and literacy, especially among women and young people, is a significant challenge for intra-African trade. Low education levels limit trade capacity, particularly among women and young entrepreneurs, due to lack of entrepreneurial skills, as well as a general lack of education on trade and public awareness of trade issues.
Corruption in trade also increases the cost of trade and contributes to the inefficiency of business processes. It also drives African MSMEs and cross-border traders to informality.
Language barriers between traders from different countries represent another challenge for intra-African trade. Literacy in the language of a trading partner is an important skill for trade purposes, especially for informal cross-border traders (e.g. Kiswahili in Eastern Africa or Yoruba in Benin, Nigeria and Togo).
38
I. SUSTAINABLE FINANCING TO SUPPORT IMPLEMENTATIONMeeting the growing demand for finance in the agricultural sector in Africa remains a major challenge and is a symptom of market failure. It is estimated that only 10 percent of African farmers have access to credit (Inter-Réseaux and S.O.S Faim, 2019) while commercial bank lending for agriculture represented 4.8 percent of annual lending in 2016 (AfDB, 2016), often forcing farmers to borrow at exorbitant interest rates from informal moneylenders. Eighty percent is made up of smallholders who are responsible for producing 80 percent of Africa’s food supply which comprises low-yield staple food crops with low input utilisation and a heavy dependence on rainwater (FAO, forthcoming and Concord Europe, 2017). The reasons for the limited financial investment in African agriculture include weak policy and regulatory environments and the high-risk profile of smallholder farmers and SMEs, as well as the low productivity and returns of agriculture, infrastructure deficiencies and poorly defined property rights and land tenure systems. According to its “Feed Africa” Strategy for African Agricultural Transformation (2016–2025), the AfDB estimates that the transformation of selected key value chains will require approximately USD 315 to 400 billion over the period 2016–2025.
Various financing approaches and innovations have evolved, aimed at reducing risk and the cost of finance, scaling up access to fill the financial gap and creating an enabling environment for financing agriculture: budgetary resources from governments and donors; financial institutions such as commercial banks, microfinance institutions and development finance institutions; private investment (smallholder farmers account for 90 percent of total investment in agriculture [Inter-Réseaux and S.O.S Faim, 2019]); and non-bank financial institutions, like savings and credit cooperative organizations (SACCOs) and financial cooperatives.24
Governments have traditionally acted as the primary source of budgetary support and investment supporting public infrastructure, extension services, subsidies, credit, risk management and research and development. One of the commitments of CAADP is that governments must allocate at least 10 percent of the public budget to agriculture (see the results of the 2019 Biennial Review in Section G). Another important source of public funding in recent years has been donor governments and multilateral institutions in the form of Aid for Trade consisting of grants and soft loans for agricultural development and other priority sectoral programmes.25 These resources have helped African countries to some extent close the funding gap, particularly when addressing agriculture-related supply-side constraints. Donor commitments to Africa for all sectors almost doubled in the 10 years between 2007 and 2017 from USD 12.7 billion to USD USD 23.8 billion. The top three sectors receiving assistance were transport and storage, energy and agriculture while banking and financial services ranked a distant fourth (see Box 4 for details).
24 Information in this section was sourced from AGRA (2016) while data on Aid for Trade came from the OECD.
25 There are four categories of Aid for Trade: (1) technical assistance for trade policy regulations (helping countries to develop trade strategies, negotiate trade agreements and implement their outcomes; (2) building productive capacity (supporting the private sector to exploit their comparative advantages and diversify their exports in sectors like fisheries, tourism, agriculture and services); (3) economic infrastructure (building roads, ports and telecommunications networks to connect domestic markets to the global economy); and (4) trade-related adjustment (helping developing countries with the costs associated with trade liberalisation, such as tariff reductions, preference erosion, or declining terms of trade).
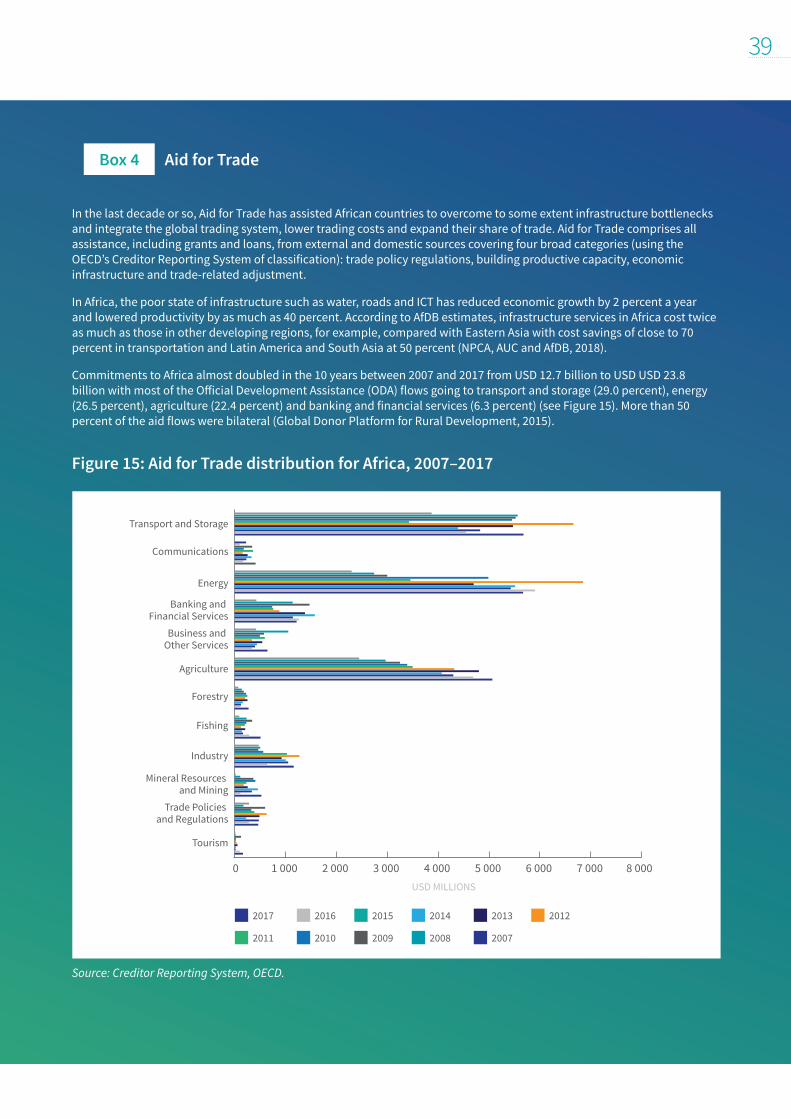
39
In the last decade or so, Aid for Trade has assisted African countries to overcome to some extent infrastructure bottlenecks and integrate the global trading system, lower trading costs and expand their share of trade. Aid for Trade comprises all assistance, including grants and loans, from external and domestic sources covering four broad categories (using the OECD’s Creditor Reporting System of classification): trade policy regulations, building productive capacity, economic infrastructure and trade-related adjustment.
In Africa, the poor state of infrastructure such as water, roads and ICT has reduced economic growth by 2 percent a year and lowered productivity by as much as 40 percent. According to AfDB estimates, infrastructure services in Africa cost twice as much as those in other developing regions, for example, compared with Eastern Asia with cost savings of close to 70 percent in transportation and Latin America and South Asia at 50 percent (NPCA, AUC and AfDB, 2018).
Commitments to Africa almost doubled in the 10 years between 2007 and 2017 from USD 12.7 billion to USD USD 23.8 billion with most of the Official Development Assistance (ODA) flows going to transport and storage (29.0 percent), energy (26.5 percent), agriculture (22.4 percent) and banking and financial services (6.3 percent) (see Figure 15). More than 50 percent of the aid flows were bilateral (Global Donor Platform for Rural Development, 2015).
Figure 15: Aid for Trade distribution for Africa, 2007–2017
Source: Creditor Reporting System, OECD.
Box 4 Aid for Trade
2017 2016 2015 2014 2013
2011 2010 2009 2008 2007
2012
0 1 000 2 000 3 000 4 000 5 000 6 000 7 000 8 000
Tourism
Trade Policies and Regulations
Mineral Resources and Mining
Industry
Fishing
Forestry
Agriculture
Business and Other Services
Banking and Financial Services
Energy
Communications
Transport and Storage
USD MILLIONS

40
Apart from external sources of government funding for agriculture in Africa, value chain financing is one of the most efficient and cost-effective sources of financing for the agricultural sector. Key players in the value chain such as processors, wholesalers, exporters and multinational enterprises (MNEs) that base their decisions and risk assessment on real-time information and trade intelligence extend financing at critical points of the production cycle to farmers for pre- and post-harvest activities. Supplier credit and advance payments from customers are made available as short- and long-term credit to farmers and SMEs in the value chain to cover inputs, equipment, labour, transport, storage, processing and other services to facilitate the efficient movement of produce from the farm gate and up the agricultural value chain to importers and supermarkets.
Formal financial institutions, including commercial banks and insurance companies, play a major role in funding agriculture, although there remains massive untapped capacity. For example, commercial bank lending for agriculture was 4.8 percent of annual lending in 2016 (AfDB, 2016). However, lending and insurance services to smallholder farmers are limited due to the high risk associated with asset-poor smallholder farmers and SMEs. State-owned agricultural development banks are another source of funding to address the challenges farmers face of limited credit and high market interest rates from private institutions. The advantages of development bank loans include relatively low interest rates and longer maturity periods. Some projects may also benefit from grace periods, allowing the investment to mature (maybe one season) before reimbursement starts. These are conditions that businesses in the agricultural sector need, given the high uncertainty inherent in agricultural projects.
Multilateral financial institutions such as the African Development Bank and the World Bank, philanthropic foundations and non-governmental organizations also play an important role in African agriculture particularly in areas where the perceived risks are high. Other participating funding institutions, including sovereign wealth funds and pension and insurance funds and the Grow Africa partnership, are channelling investment into agricultural development. The AfDB is a notable contributor to the agricultural sector in Africa, directing over USD 100 billion to agriculture since 1967. AfDB has been backing efforts to support climate-smart agriculture through initiatives such as the Climate Investment Fund, the Global Environmental Facility, the Green Climate Fund and the Africa Climate Change Fund to make African countries become more resilient to climate change and transition to low carbon growth.
Microfinance financial institutions, including banks, NGOs and other non-bank institutions, are another important source of credit for smallholder farmers and SMEs who often lack adequate collateral to qualify for conventional loans. Additionally, non-bank, member-based financial institutions such as cooperatives, SACCOs and self-help groups offer members more affordable and better access to
financial services. Advances in ICT have helped de-risk and lower transaction costs of reaching smallholder farmers, who in most cases belong in the unbanked demographic group, through mobile payments and mobile banking. Digital financial services have facilitated data collection to better understand and serve the smallholder sector while providing access to micro loans, savings, insurance services and digital payments such as social transfers and subsidies. Another innovation based on pledging moveable assets like stored commodities is the warehouse receipt system. There are also private financial inclusion initiatives such as crowdfunding that address the constraints of access to finance for women and young people in agriculture in Africa.
Other sources of funding are bonds and equity for the long-term development of the agricultural sector. Some of these bonds are based on remittances and diaspora investment in agriculture, while private equity funds made up of capital from investors such as the AfDB cover fast-growing SMEs, services, industries, infrastructure, regional expansion and sustainable agricultural projects. Funding for large-scale projects is complemented by public-private partnership (PPP) initiatives such as the Global Agriculture and Food Security Program (GAFSP). Another type of equity financing that is showing great potential in Africa is blended finance, which entails the strategic use of development finance for the mobilisation of additional commercial finance (including private capital flows) in developing countries.26
Risk management is another key element in the financing of agriculture. Agriculture in Africa is exposed to several risks that can potentially harm productivity and competitiveness and, therefore, limit the flow of finance and investment to the sector. These risks are associated with commodity price movements, adverse weather and other natural emergencies, transboundary diseases and migratory pests as well as infrastructure deficits and an unpredictable regulatory environment. Examples of tools available to de-risk agriculture include weather index insurance and credit guarantees. Weather index insurance compensates subscribers for loss of production due to poor weather. Credit guarantees, usually provided by governments or donors, encourage financial institutions to lend to smallholders and SMEs by providing partial cover for bad loans.
26 A good example of blended finance in Africa is the Africa Agriculture and Trade Investment Fund (AATIF), managed by Deutsche Bank. Note that the catalytic role of blended finance in this process is to reduce the gap between the real and perceived risks of investment for the purposes of leveraging additional investment dollars that otherwise would not be available due to perceived market failure and other barriers to accessing finance.
41
J. IMPLEMENTATION OF THE FRAMEWORKThe objective of the Framework for the agricultural sector is to create an enabling environment in support of the fifth commitment of the Malabo Declaration to boost intra-African trade in agricultural commodities and services. Implementation of the Framework is to be based on policies, coordination mechanisms and institutional arrangements that respond to trade-related challenges, including the negative impacts of the COVID-19 pandemic on African economies. Additionally, the Framework also responds to the economic opportunities created by the AfCFTA single market. One priority is to address the weak linkages between African farmers and input and output markets by developing inclusive regional value chains in markets that are already geographically fragmented. Another priority is to engage the private sector, from farmers, processors, exporters and service providers to domestic and foreign investors to create incentives and enhance competitiveness. Coordinated and timely execution is key to getting the Framework implemented at the country level and this will require a core team of experts and champions to move the process forward. Implementation of the Framework includes the institutional arrangements and coordination mechanisms to oversee implementation of the Framework and the areas of intervention as specified in the roadmap or action plan consisting of the seven clusters recommended by the AUC based on AU declarations and commitments.
institutional arrangementsThe implementation of the Framework for Boosting Intra-African Trade in Agricultural Commodities and Services will build on existing institutional mechanisms and structures at the country and REC levels. For example, 14 countries have set up national AfCFTA committees to guide and oversee implementation of the AfCFTA with new committees progressively being established. Other structures in place include trade focal points and trade facilitation committees to support implementation of the WTO’s Trade Facilitation Agreement and national and regional committees dedicated to addressing SPS issues (such as CAC, OIE and IPPC focal points), the African Growth and Opportunity Act (AGOA) between the United States of America and eligible African countries as well as other trade-related bodies. The scope of work covers a wide range of related issues such as putting in place policy and regulatory frameworks for trade in goods and services, developing trade and investment strategies, establishing trade support institutions and programmes and a monitoring and evaluation (M&E) framework. A
key principle in setting up the institutional arrangements for implementing the Framework will be to work with or build on existing structures and mechanisms to maintain forward momentum and avoid duplication and a waste of scarce resources where applicable.
RoadmapThe roadmap is the action plan of the Framework for Boosting Intra-African Trade in Agricultural Commodities and Services. The key elements of the roadmap include the seven clusters related to boosting intra-African trade with objectives, activities and corresponding indicators, lead agencies and timelines (short, medium and long term) within the context of the AfCFTA. The seven clusters were derived from the BIAT initiative endorsed by Member States at a 2012 Assembly of the African Union. In addition to the six clusters tailored for the agricultural sector (trade policy, trade facilitation, productive capacity, trade-related infrastructure, trade finance and factor market integration), the roadmap includes a revised seventh cluster encompassing cross-cutting issues. The seventh cluster contains 11 cross-cutting issues as outlined below. Furthermore, a number of risks and mitigation measures have been identified in six areas of risk that could potentially impede implementation of the Framework, including variable commitments of key stakeholders, the inadequate level and utilisation of human and financial resources, uncertain partner support, capacity constraints at the REC and national levels, limited participation by a constrained private sector and weak M&E systems (AUC, 2017a). The COVID-19 shock is an additional risk that will require appropriate mitigating measures. The main lesson learned from the experience of COVID-19 and previous crises is the importance of disaster preparedness to respond to major events including pandemics and other emergencies.
Member States are gradually building systems based on a whole-of-government approach to boost their resilience to external shocks, including COVID-19.27 These measures are expected to address trade disruptions and enhance Africa’s resilience to shocks and become institutionalised during the recovery process. Below is a narrative summary of the seven clusters of the roadmap (Table 7).
27 For details, see Understanding the Impact of the COVID-19 Pandemic on Food Security in Africa (FAO, forthcoming).

42
CLUSTER 1: TRADE POLICY
The trade policy cluster supports policy coherence and predictability, comprising a number of elements such as effective public and private trade policy institutions and implementation of regional free trade areas. The cluster is built on several AU initiatives such as the trade protocols of the AfCFTA Agreement and the AU Commodity Strategy. Additionally, it addresses other priorities including trade policy reforms that integrate food security measures, for example, safety nets and risk-mitigating programmes, as well as coordination and harmonisation of SPS standards with international standard setting bodies such as CAC, OIE and IPPC to reduce the adverse impact of NTBs on trade. In this respect, a newly established online portal based on similar portals such as that of COMESA, would help to monitor and eliminate NTBs.28
In the context of the COVID-19 response and recovery efforts, promoting intraregional trade in agrifood products is crucial, both as a short- and long-term policy objective in Africa. It is essential to support cross-border trade to maintain the continued flow of agricultural and food commodities and inputs, including through expanded care services and testing. In particular, it would be important to avoid policy responses to COVID-19 that could undermine the AfCFTA Agreement, such as ad hoc import and export restrictions, and instead, focus on strengthening mechanisms for monitoring food and input market prices.
CLUSTER 2: TRADE FACILITATION
The trade facilitation cluster covers the simplification and harmonisation of customs procedures and documents, one-stop border posts, transit procedures, coordinated border management (CBM) and integrated border management (IBM). Price stability is also a priority and hence the importance of producer cooperatives and marketing associations to among others stabilise seasonal prices through, for example, the use of warehousing for storage. Enhancement of food safety systems and standards and infrastructure improvements of laboratories and traceability systems would be necessary to improve trade and nutrition-related outcomes. Linking producers to formal markets is also crucial and this would be achieved through commodity exchanges at the national and regional levels as well as supermarkets and school feeding programmes. These efforts will be complemented on the supply side through aggregators such as farmer cooperatives and other strategic alliances between farmers and private enterprises.
A crucial programme of the AU is Pan-African Quality Infrastructure (PAQI). Many African countries lack adequate infrastructure and the capacity to comply with standards, resulting in poor trade performance both in terms of intra-African and international trade. PAQI seeks to establish a common policy on standardisation and measurement systems to ensure satisfactory quality and safety of products. It includes standards, measurement, testing, conformity assessment and accreditation (AUC, 2017c). Branding and marketing of agrifoods made in Africa, including certification, labelling and packaging that guarantee minimum safety and sustainability standards, would also be a part of the AU’s agricultural development strategy of growing intra-African trade.
In the context of COVID-19 and post-crisis efforts, accelerating digital transformation is an important priority for Africa’s recovery and growth agenda. In this regard, trade facilitation would be promoted through measures such as green channels to expedite the movement of food and other critical supplies across borders,29 effective food safety control systems and standards mechanisms promoting risk-based programming and decision-making, customs automation and digital solutions for electronic declarations, certification and payments would be maintained and expanded as necessary.
CLUSTER 3: PRODUCTIVE CAPACITY
The third cluster focuses more broadly on the supply side and building productive capacity. The focus is on policies, strategies and initiatives that work for smallholder farmers and SMEs by seeking to attract investment into the agricultural sector using tools such as national and regional agricultural investment plans (NAIPs and RAIPs). In addition to CAADP, several African Union flagship programmes support enhancement of productive capacity in the agricultural sector (see Box 5).
28 See https://tradebarriers.africa
29 For example, lessons can be learned from similar efforts such as the Green Pass Certification Scheme attempted by COMESA (see COMESA Annual Report 2015, p. 47, available at https://www.comesa.int/wp-content/uploads/2019/02/2015-Comesa-Annual-Report.pdf).

43
Accelerated Industrial Development for Africa Accelerated Industrial Development for Africa (AIDA) is a plan of the African Union to develop industrial capacity and maximise the use of local productive capacities and inputs. The plan seeks to add value by promoting local processing of natural resources, developing small-scale and rural industries, including the informal sector, and supporting intermediate and capital goods industries with high linkages to other sectors to generate employment.30
Africa Productive Capacity Initiative In 2004, the African Union adopted the Africa Productive Capacity Initiative (APCI) as a sustainable industrial development strategy of NEPAD. The vision of APCI to build productive capacity in Africa is based on the need to harmonise industrial policies and strategies at national and regional levels, implement the African peer review mechanism on industrial performance and competencies, and develop programmes for productive capacity upgrading (Onyeji, 2006).
Sustainable Agriculture Mechanization in Africa Sustainable Agriculture Mechanization in Africa (SAMA) is a new initiative by the AUC and FAO to promote agricultural mechanization in Africa. SAMA contains ten priority elements for national strategies including learning what has worked in other parts of the world and implementing sustainable mechanization in the agricultural sector. The SAMA framework includes boosting farm power using appropriate technologies; employing innovative financing mechanisms and investments tailored for emerging small- and medium-scale commercial farmers and entrepreneurs; manufacturing and distribution of inputs; prioritising mechanization of profitable agrifood value chains like cereals (e.g. maize, wheat, rice, etc.); technology development and transfer, including extension and centres of excellence; sustainable land use, crop and animal husbandry practices; human resources management; policy and strategy, including fostering a business environment that is conducive for mechanization; and regional cooperation and networking to leverage resources as well as expand market access to achieve economies of scale and scope for sustainable mechanization (FAO and AUC, 2018).
African Agribusiness and Agro-industries Development Initiative Plus Accelerator for Agriculture and Agroindustry Development and Innovation (3ADI+) is a joint value chain and market systems development programme of FAO and UNIDO. 3ADI+ supports agribusiness and agro-industrial development in Africa with a focus on the agricultural sector to develop productive and profitable agriculture value chains that link small and medium size producers to markets and generate income from the supply of high-value food, fibre, feed and fuel products. A major objective of 3ADI+ is to increase private sector investment flows into the agricultural sector by mobilising resources for agribusiness and agroindustrial development from domestic and international financial sources (FAO and UNIDO, 2018).
AfricaSeeds AfricaSeeds, formerly the African Seed Network, is an agency of the African Union that oversees the African Seed and Biotechnology Programme. Its mission is to develop a healthy seed sector for the transformation and growth of agriculture and the achievement of food security by 2025 (AUC, 2014).
African Technology Innovation Initiative The African Technology Innovation Initiative (ATII), an AU initiative that also supports implementation of AIDA, aims to bring products to market for commercial distribution using African networks through design, testing, certification, business support and technology transfer (Daily Monitor, 2004; AUC, 2015).
Africa Food Safety Agency Africa Food Safety Agency (AFSA) is a new initiative of the AU that would facilitate a Pan-African, coordinated effort to enhance food safety in the region as well as accelerate intraregional trade. AFSA addresses regulatory barriers and ensures that they do not unnecessarily hinder trade flows. In this respect, AFSA would contribute to significant improvements in food safety systems through inter-REC coordination for harmonisation of standards, streamlining of procedures for achieving and demonstrating SPS compliance, strengthening legal frameworks and promoting risk-based programming and decision-making.31
Source: Compiled by the authors
30 See Action Plan for the Accelerated Industrial Development of Africa (https://www.au.int/web/sites/default/files/documents/30985-doc-plan_of_action_of_aida.pdf) and Accelerated Industrial Development for Africa (AIDA) (https://au.int/en/ti/aida/about).
31 See AUC, Agriculture and Food Security (https://au.int/en/directorates/agriculture-and-food-security).
Box 5 Selected African Union programmes
44
Many of these programmes promote the development of regional value chains to increase local production and processing of agricultural goods and services related to strategic agrifood commodities in association with commodity associations. Examples of these partner associations include the African Grain Council and its constituent members, i.e. East African Grain Council (EAGC), West African Grain Network (WAGN) and the Grain Network of Southern Africa Stakeholders (GNSAS).
Another priority is research and development (R&D), science and technology for the development and commercialisation of new products and services. Initiatives under consideration include regional centres of excellence to support agricultural research and the promotion of agro-industrial parks and special economic zones for agroprocessing, e.g. Programme for Establishing the Common African Agro-Parks (CAAPs). CAAPs is an AU programme, still in the inception phase, to facilitate the development of transboundary infrastructure in key trade corridors by establishing common mega agro-parks to industrialise and scale up African agriculture. The overall goals are to apply African investments funds to reduce food imports, create business and specialised employment for Africans, and boost intra-African trade for staple food commodities.32 The plan for CAAPs is to link up with the infrastructure network of energy, transport, transboundary water and ICT facilities built by initiatives such as the Programme for Infrastructure Development in Africa (PIDA).
In the context of the coronavirus pandemic, the response and recovery measures to build productive capacities would also focus on: limiting the negative impact of border closures, quarantine measures and other restrictions on availability and access to inputs; prioritizing the agrifood system as an essential service that would continue to operate during periods of lockdown, emergency, curfew or other health containment measures; ensuring the continuity of key advisory support and extension services for agrifood value chains; and monitoring market prices and managing price volatility to protect food markets in the long run.
CLUSTER 4: TRADE-RELATED INFRASTRUCTURE
The fourth cluster covers infrastructure development that is demand-driven, improving efficiencies of trade logistics and trade-related services, and the establishment and effective operationalization of a network of food safety reference laboratories under the umbrella of a Pan-African Food Safety Reference Laboratory. The proposed Pan-African Food Safety Reference Laboratory would establish, harmonise and promote standards and controls on food safety across the continent that include a capacity-building and training component to strengthen national laboratories. This is to ensure safe and nutritious food and prevent malnourishment manifested in stunting and underweight in children, as well detect and manage mycotoxins, metals, pesticides, residue concentrations
and other contaminants found in food. These laboratories would also contribute to building the capacity of African countries to implement and comply with international SPS standards so that inspection and food safety certificates issued by accredited national laboratories are internationally recognised and traded agrifood products that are traceable can readily access global markets, including regional markets in Africa (AUC, 2017d; AUC, 2019b; NEPAD, 2020).
Similarly, the PAQI programme of the African union was created in response to the lack of adequate infrastructure and capacity in many African countries to comply with standards, resulting in poor trade performance both in terms of intra-African and international trade (see cluster 2). PAQI seeks to establish a common policy on standardisation and measurement systems to ensure satisfactory quality and safety of products. It includes standards, measurement, testing, conformity assessment and accreditation (AUC, 2017c).
In most parts of Africa, the poor state of infrastructure such as water, roads and ICT has reduced economic growth by 2 percent a year and lowered productivity by as much as 40 percent. According to AfDB estimates, infrastructure services in Africa cost twice as much as those in other developing regions, for example, compared with Eastern Asia with cost savings of close to 70 percent in transportation and Latin America and South Asia at 50 percent (NPCA, AUC and AfDB, 2018). The African Union is working to address these challenges through programmes such as PIDA. By reducing infrastructure bottlenecks, PIDA contributes to the growth in industrialisation and agro-industries, as well as improving competitiveness for both intra-African and international trade. Results of the programme include the addition of 16 066 km of roads and 4 077 km of railway lines to the African transport infrastructure network; 3 506 km of transmission lines to the power grid; and the connection of 17 countries with regional fibre-optic cables, generating 112 900 direct and 49 400 indirect jobs.33
Box 6 gives examples of recent PIDA projects, a number of which currently directly support agricultural development. PIDA will also benefit new proposed initiatives such as the CAAPs programme for the development of agro-parks and special economic zones in key trade corridors with access to more affordable electricity, water and modern storage, logistics, transport and ICT facilities for the production and processing of agricultural raw materials to scale.
32 African Union (2019), Programme For Establishing the Common African Agro-Parks (CAAPs) Concept Note, Forum for Agricultural Research in Africa.
33 See PIDA Dashboard (https://www.au-pida.org/pida-projects/) (accessed 23 August 2019).

45
With respect to the COVID-19 response, several measures to enhance infrastructure and build more resilient value chains during the recovery phase are outlined below:
• Investing in storage facilities (including cold storage for veterinary inputs and perishables) at the local authority, community and household levels for both input reserves and reduction of post-harvest losses. This could be done in collaboration with water and sanitation hygiene stakeholders and others.
• Accelerating national digitalization plans for the agrifood sector;
• Agro-industrial zones and growth corridors: supporting development of special economic zones for agroprocessing, value addition along trade corridors and facilitation of intra-African trade.
CLUSTER 5: TRADE FINANCE
Trade finance includes the development of effective value chain and trade financing mechanisms and innovative contractual arrangements to improve access to finance for farmers and SMEs. Financing measures and innovations are aimed at reducing risk and the cost of finance, scaling up access and creating an enabling environment for financing agriculture. These include budgetary resources from governments and donors; financial institutions such as commercial banks, microfinance institutions, development finance institutions and digital payment and e-commerce platforms; private investment, including resources from smallholder farmers for investment in agriculture, private equity funds and bonds based on remittances and diaspora investment; blended finance to leverage new investment; and non-bank financial institutions like savings and credit cooperative organizations and financial cooperatives. These financing measures also include risk management tools to de-risk agriculture related to commodity price movements, adverse events and bad loans. A related
COMESA: The North-South Multimodal Transport Corridor integrates Eastern and Southern Africa along the north-south corridor spanning from United Republic of Tanzania, Zambia and Democratic Republic of the Congo to Zimbabwe, Botswana, Malawi and Mozambique.
IGAD: The establishment of monitoring networks for the Nubian Sandstone Aquifer System is a project to harness water resources to support wheat cultivation in Sudan.
SADC: The Lobito Corridor Trade Facilitation Project enhances intraregional trade in Southern Africa by accelerating growth in cross-border trade and participation of small enterprises in value chains.
AMU: The Morocco-Algeria-Tunisia-Libya Corridor Mediterranean Highway Development, currently at the feasibility stage, will connect urban hubs and enhance tourist development in Northern Africa. The North-Western Sahara Aquifer System and Iullemden Aquifer System Areas project, also at the feasibility stage, focuses on developing groundwater resources for intense agricultural operations and water irrigation.
ECOWAS/EAC/Central Corridor Transit Transport Facilitation Agency: The Abidjan-Lagos Corridor Highway Development Project, the Lamu-Garissa-Isiolo-Lokichar-Lodwar-Nadapal Highway and the Lake Tanganyika Multimodal Transport Programme facilitate improved connectivity and multimodal transport to enhance regional integration and cross-border activity.
Source: PIDA Dashboard (https://www.au-pida.org/pida-projects/) (accessed 23 August 2019).
Box 6 Selected PIDA projects
46
priority is effective contract enforcement through the establishment and capacity-strengthening of commodity regulatory agencies.
Access to finance for investment and working capital in the agricultural sector will be crucial in the response to and recovery from COVID-19. Measures to enhance access to finance in the context of the COVID-19 pandemic include providing tailored financial stimulus packages that respond to the needs of smallholders and agri-business enterprises, using electronic disbursement of vouchers for government-subsidized or supported input distribution schemes and access to services, where possible.
CLUSTER 6: FACTOR MARKET INTEGRATION
The sixth cluster supports intra-African trade in goods and services. It promotes the free movement of businesspersons and cross-border establishment and the mutual recognition of qualifications and other service-related disciplines to ensure that legally traded goods and services can cross African borders unhindered. The integration and harmonisation of the labour markets of African countries is an important goal since the movement of people is bound up not only with international trade in services but also with cross-border investment flows. Negotiations are currently ongoing to establish clear rules on the movement of people in support of intra-African trade, particularly with respect to commercial presence (Mode 3) and the presence of natural persons (Mode 4).
In order to promote a more efficient and competitive service sector, including finance, transport, energy, telecommunications and other infrastructure services, the African Union developed the Services Sector Development Programme (SSDP). SSDP aims to create a more diversified economic base which includes services to complement agriculture and manufacturing. Services represent the fastest growing sector with the potential to absorb new market entrants, creating new opportunities, especially for young people with good skills and strong qualifications, to work in industries, including agribusiness value chains across the continent within the single market (AUC, 2018b). An example of a potential growth area is the trade in fisheries services such as consulting, resource management, infrastructure development, certification and labelling, trade promotion and marketing services, maintenance and research (FAO, 2020c).
In the context of COVID-19, measures to facilitate trade will require relaxing restrictions on mobility so that trade operations can contribute to functioning as normally as possible with safety protocols in place, especially for essential workers in the food and other critical industries. Crucially, integrating and giving a stake to young people in both the response and recovery phases of COVID-19, taking advantage of youth business relief funds, labour matching platforms, technical support and capacity building, and innovations like e-commerce and other digital solutions in food value chains, would be part of building more sustainable and resilient food systems and supply chains in the future. Youth, who are overrepresented in the informal
sector, one of the worst hit sectors by the coronavirus pandemic, stand to benefit from inclusive innovative service-oriented programmes.
CLUSTER 7: CROSS-CUTTING ISSUES
The seventh cluster covers a number of distinct but related areas. First, the cluster includes the institutional arrangements for implementation (for example, establish BIAT/AfCFTA national committees on trade in agricultural commodities and services in coordination with the RECs). Second, the cluster promotes the strengthening and establishment of the policy institutional infrastructure, i.e. to guide implementation of the Framework and prioritisation of sectors and programme development (short, medium and long term). Third, there is the elaboration of investment and resource mobilisation strategies to facilitate implementation of the Framework and its roadmap. In light of the COVID-19 crisis, implementation of the Framework will require substantial investment from all key partners, repurposing of available resources where necessary, and other innovative financing mechanisms.
Fourth, the cluster promotes information across value chains, i.e. developing or scaling up national, regional and continental agrifood market and trade information systems and networks, including addressing skills development and the training needs of women in the context of AfCFTA. This also includes digitalisation and information technology that promote the use of ICT and other tools to enhance access to trade information, intelligence reports, market studies, weather and climate patterns as well as coronavirus and other disease surveillance in food markets through mechanisms such as the African Trade Observatory in partnership with the Agricultural Market Information System (AMIS) and the Global Information and Early Warning System (GIEWS), etc.34
Fifth, there is a communication and visibility plan for sharing information with stakeholders and raising awareness on the Framework. Sixth, the cluster puts in place a monitoring and evaluation framework on two levels, i.e. the national and REC levels (7.7) and the continental level (7.11). This is designed to track progress on implementation of the BIAT Framework at the national/REC and continental levels, document lessons and learning and disseminate best practices to the Member States.
For a detailed review of the roadmap, including the clusters, outputs, activities, indicators, timeframes, responsible actors and potential sources of funding, see Table 7.
34 Other available resources, including digital applications for agriculture such as fall armyworm monitoring and early warning system, Food Price Monitoring and Analysis Tool, drones for agriculture, potential of drones for locust early warning and preventive control, FAO agricultural stress index system, Information Network on Post-harvest Operations, water productivity through open access of remotely sensed derived data portal, e-agriculture in action – blockchain for agriculture, etc. can be found here: http://www.fao.org/about/meetings/digital-agriculture-transformation/resources/fao-digital-services-portfolio/en/.

47
The way forwardIn summary, the next steps for the implementation of the Framework will involve several critical actions. These steps include mainstreaming and adapting the Framework to respond to the local situation so that each African country and REC has a customised framework, including a tailored roadmap, that reflects national and regional priorities and contexts. First, part of this exercise would necessarily include, early in the implementation phase, detailed baseline assessments and mapping of what is already on the ground in terms of plans, policies, strategies, programmes and projects and other institutional mechanisms, stakeholders, challenges and gaps as well as what has worked and what has not worked, to ensure coherence and avoid a duplication of efforts. Additionally, targets would have to be set at the national and regional levels to facilitate monitoring and evaluation and ensure accountability for results. Therefore, each national and
regional framework would include additional columns for baseline and target indicators. Second, there is the need to establish the institutional arrangements and coordination mechanisms to oversee implementation of the framework and the areas of intervention. Third, continued efforts to develop and strengthen regional value chains around key priority commodities led by the private sector will be an important milestone in the implementation of the AfCFTA in the agricultural sector. Fourth, there will be a need for ongoing technical and financial support by development partners to Member States, RECs and the private sector to implement, monitor and evaluate the Framework and the AfCFTA. In all of the aforementioned, the response and recovery measures to contain the coronavirus pandemic and future supply-side shocks will need to be maintained and scaled up to help build more resilient agriculture and farm systems for trading in the AfCFTA single market.
35 During the inception phase of implementation of the Framework starting in 2021, Member States and RECs will assign baseline and target indicators in their respective roadmaps to measure progress on the achievement of outputs. The baseline year will be 2019 as agreed at the validation workshop held in Nairobi in October 2019.
Table 7: Roadmap for the Framework for Boosting Intra-African Trade in Agricultural Commodities and Services
CLUSTER/ACTION AREA
ACTIVITIES/MEASURES
OUTPUTINDICATOR DESCRIPTION35
TIME FRAME (YEAR)
RESPONS IBILITY
POTENTIAL SOURCE OF FUNDING
1.0 Trade policy
(Promote/improve policy environment to accelerate intra-African agricultural commodities and services trade development)
1.1 Develop, reform, update and implement national and regional agricultural trade policies/strategies aligned with the Framework and gather evidence based on baseline assessments and mapping exercises
1.1.1 National and regional agricultural trade policies/strategies, including NAIPs and RAIPs aligned with the Framework
1.1.1.1 Number of national and regional agricultural trade policies/strategies aligned with the Framework
2021–2026
Member States
RECs
Member States
RECs
Development partners
1.1.1.2 Number of Member States and RECs implementing aligned with agricultural trade policies/strategies
2021–2026
Member States
RECs
Member States
RECs
Development partners
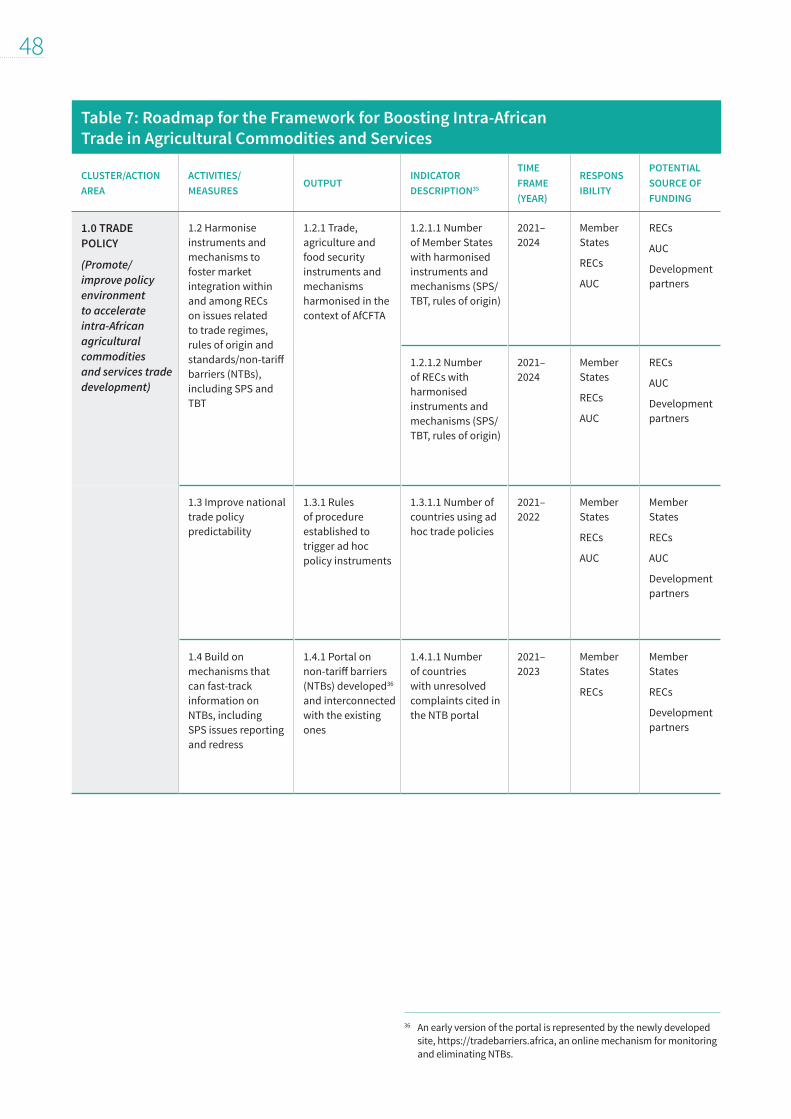
48
36 An early version of the portal is represented by the newly developed site, https://tradebarriers.africa, an online mechanism for monitoring and eliminating NTBs.
Table 7: Roadmap for the Framework for Boosting Intra-African Trade in Agricultural Commodities and Services
CLUSTER/ACTION AREA
ACTIVITIES/MEASURES
OUTPUTINDICATOR DESCRIPTION35
TIME FRAME (YEAR)
RESPONS IBILITY
POTENTIAL SOURCE OF FUNDING
1.0 TRADE POLICY
(Promote/improve policy environment to accelerate intra-African agricultural commodities and services trade development)
1.2 Harmonise instruments and mechanisms to foster market integration within and among RECs on issues related to trade regimes, rules of origin and standards/non-tariff barriers (NTBs), including SPS and TBT
1.2.1 Trade, agriculture and food security instruments and mechanisms harmonised in the context of AfCFTA
1.2.1.1 Number of Member States with harmonised instruments and mechanisms (SPS/TBT, rules of origin)
2021–2024
Member States
RECs
AUC
RECs
AUC
Development partners
1.2.1.2 Number of RECs with harmonised instruments and mechanisms (SPS/TBT, rules of origin)
2021–2024
Member States
RECs
AUC
RECs
AUC
Development partners
1.3 Improve national trade policy predictability
1.3.1 Rules of procedure established to trigger ad hoc policy instruments
1.3.1.1 Number of countries using ad hoc trade policies
2021–2022
Member States
RECs
AUC
Member States
RECs
AUC
Development partners
1.4 Build on mechanisms that can fast-track information on NTBs, including SPS issues reporting and redress
1.4.1 Portal on non-tariff barriers (NTBs) developed36 and interconnected with the existing ones
1.4.1.1 Number of countries with unresolved complaints cited in the NTB portal
2021–2023
Member States
RECs
Member States
RECs
Development partners

49
Table 7: Roadmap for the Framework for Boosting Intra-African Trade in Agricultural Commodities and Services
CLUSTER/ACTION AREA
ACTIVITIES/MEASURES
OUTPUTINDICATOR DESCRIPTION35
TIME FRAME (YEAR)
RESPONS IBILITY
POTENTIAL SOURCE OF FUNDING
2.0 TRADE FACILITATION
(To reduce the complexity and cost of trade transaction process and ensure that all these activities take place in an efficient, transparent and predictable manner)
2.1 Support the implementation of WTO Trade Facilitation Agreement (TFA)
2.1.1 Implementation capacity strengthened
2.1.1.1 Number of country and RECs that have completed categorisation
2021–2023
Member States
RECs
Member States
RECs
AUC
Development partners
2.2 Support the development and strengthen the capacity of actors involved in trade, including MSMEs through the provision of information on market linkages to exporters and the promotion of structured supply integration (i.e. expand exporters’ access to distribution networks, warehouses, joint marketing and export consolidation)
2.2.1 Strengthen capacity of actors (including MSMEs) involved in trade
2.2.1.1 Number of actors participating in workshops
2021–2023
Member States
RECs
Member States
RECs
Development Partners
2.3 Harmonise and simplify customs and transit procedures, documentation and regulations and facilitate replication of fully automated systems in the RECs and the operational ization of one-stop border posts (OSBPs), single windows and electronic payments
2.3.1 Harmonised customs procedures, documents and regulations, border operation hours and automated documentation systems
2.3.1.1 Proportion of countries/RECs with harmonised and automated customs systems
2021–2026
Member States
RECs
AUC
Member States
RECs
Development partners
AUC
2.3.2 Coordinated border management (CBM)/integrated border management (IBM) systems established
2.3.2.1 Number of one-stop border posts operational
2021–2026
Member States
RECs
AUC
RECs
AUC
Development partners

50
Table 7: Roadmap for the Framework for Boosting Intra-African Trade in Agricultural Commodities and Services
CLUSTER/ACTION AREA
ACTIVITIES/MEASURES
OUTPUTINDICATOR DESCRIPTION35
TIME FRAME (YEAR)
RESPONS IBILITY
POTENTIAL SOURCE OF FUNDING
2.0 TRADE FACILITATION
(To reduce the complexity and cost of trade transaction process and ensure that all these activities take place in an efficient, transparent and predictable manner)
2.4 Improve smooth movement of agricultural products by combating harassment, extortion and corruption along trade-sensitive transport corridors
2.4.1 Smooth movement of agricultural products
2.4.1.1 Transit time reduced (in hours)
2021–2023
Member States
Member States
RECS
AUC
Development Partners
2.4.1.2 Number of mechanisms for the mapping and identification of incident hotspots established
2021–2023
Member States
Member States
RECS
AUC
Development Partners
3.0 PRODUCTIVE CAPACITY
(Create regional and continental value chains/ complement- arity to enhance productive capacity of producers, increase local production and processing of agricultural commodities and services)
3.1 Support the development and dissemination of accurate agro-ecological data
3.1.1 Agro-ecological database available online (linked to African Trade Observatory)
3.1.1.1 Continental agro-ecological database developed
2021–2023
RECs
Member States
AUC
Development partners
Private Sector
3.2 Prioritise implementation of continentally agreed flagship programmes (e.g. AIDA, ATII, APCI, 3ADI+, AfricaSeeds, PAQI, SAMA, AFSA, etc.)37 to reduce operating costs in production (e.g. tariffs on electricity, water and sanitation, single windows, electronic payments, statutory taxes)
3.2.1 NAIPs and RAIPs updated and aligned with relevant flagship programmes (AIDA, CAADP, ATII, APCI, 3ADI+, AfricaSeeds, PAQI, SAMA, AFSA, etc.)
3.2.1.1 Number of updated NAIPs and RAIPs
2021–2022
Member States
RECs
Member States
RECs
37 Initiatives to enhance productive capacity: Accelerated Industrial Development for Africa (AIDA), African Technology Innovation Initiative (ATII), Africa Productive Capacity Initiative (APCI), Accelerator for Agriculture and Agroindustry Development and Innovation (3ADI+), AfricaSeeds, Pan-African Quality Infrastructure (PAQI), Sustainable Agriculture Mechanization in Africa (SAMA) and Africa Food Safety Agency (AFSA).

51
Table 7: Roadmap for the Framework for Boosting Intra-African Trade in Agricultural Commodities and Services
CLUSTER/ACTION AREA
ACTIVITIES/MEASURES
OUTPUTINDICATOR DESCRIPTION35
TIME FRAME (YEAR)
RESPONS IBILITY
POTENTIAL SOURCE OF FUNDING
3.0 PRODUCTIVE CAPACITY
(Create regional and continental value chains/ complement- arity to enhance productive capacity of producers, increase local production and processing of agricultural commodities and services)
3.3 Develop regional value chains to increase local production and processing of agricultural commodities and services jointly with commodity associations (e.g. EAGC, GNSAS, WAGN) to promote trade in strategic agrifood commodities
3.3.1 Regional value chains developed for strategic agrifood commodities in partnership with commodity associations (e.g. EAGC, GNSAS, WAGN)
3.3.1.1 Number of regional value chains for strategic agrifood commodity established
2021–2022
Member States
RECs
Member States
RECs
Private sector
Development partners
3.4 Promote agro-industrial parks and special economic zones for agroprocessing with attractive investor and exporter incentives
3.4.1 Agro-industrial parks and special economic zones established for agroprocessing
3.4.1.1 Number of agro-industrial parks and special economic zones for strategic agrifood sectors
2021–2024
Member States
RECs
Member States
Development partners
Private sector
RECs
3.5 Facilitate establishment of regional centres of excellence for technology development, innovation, adaptation and diffusion, e.g. food technology, marketing, packaging, branding (local brands, “Buy in Africa”, “Made in Africa”), codes of conduct for exporters, patents
3.5.1 Regional centres of excellence established to promote agricultural research, technology development, innovation, adaptation and diffusion, mechanization, incubation and vocational skills development
3.5.1.1 Number of regional centres of excellence established
2021–2023
RECs
Member States
AUC
Member States
RECs
Private sector
Development partners
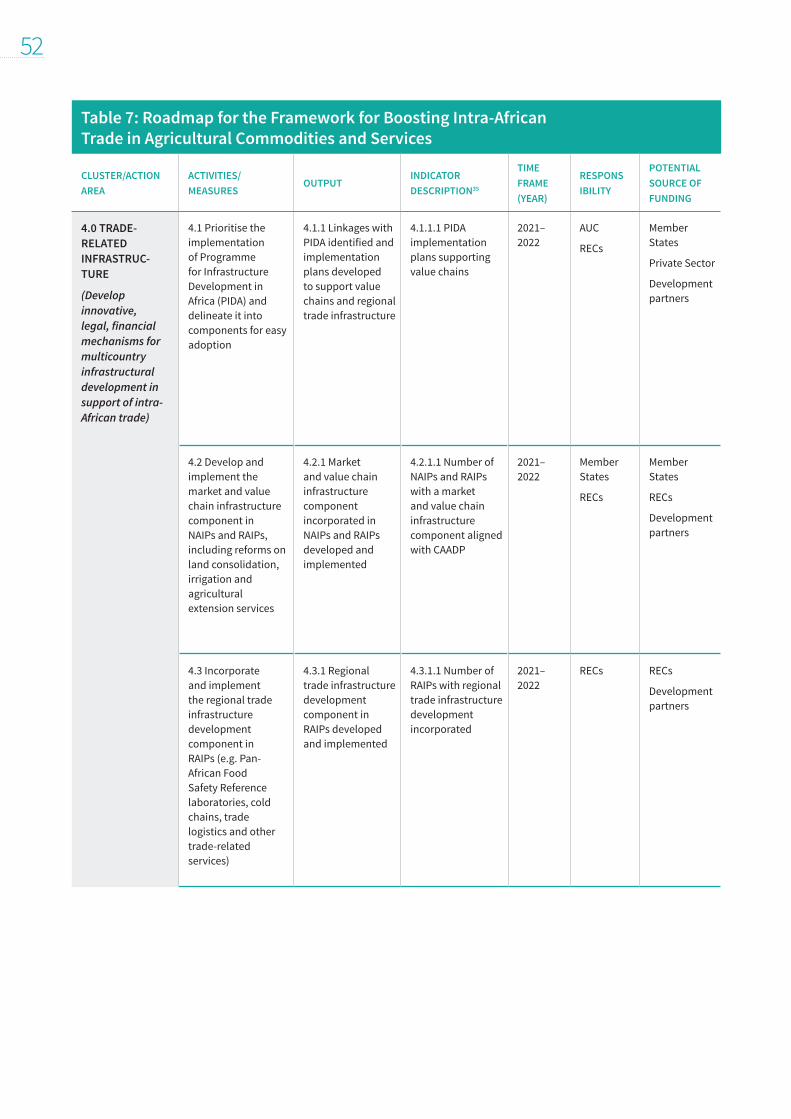
52
Table 7: Roadmap for the Framework for Boosting Intra-African Trade in Agricultural Commodities and Services
CLUSTER/ACTION AREA
ACTIVITIES/MEASURES
OUTPUTINDICATOR DESCRIPTION35
TIME FRAME (YEAR)
RESPONS IBILITY
POTENTIAL SOURCE OF FUNDING
4.0 TRADE-RELATED INFRASTRUC- TURE
(Develop innovative, legal, financial mechanisms for multicountry infrastructural development in support of intra-African trade)
4.1 Prioritise the implementation of Programme for Infrastructure Development in Africa (PIDA) and delineate it into components for easy adoption
4.1.1 Linkages with PIDA identified and implementation plans developed to support value chains and regional trade infrastructure
4.1.1.1 PIDA implementation plans supporting value chains
2021–2022
AUC
RECs
Member States
Private Sector
Development partners
4.2 Develop and implement the market and value chain infrastructure component in NAIPs and RAIPs, including reforms on land consolidation, irrigation and agricultural extension services
4.2.1 Market and value chain infrastructure component incorporated in NAIPs and RAIPs developed and implemented
4.2.1.1 Number of NAIPs and RAIPs with a market and value chain infrastructure component aligned with CAADP
2021–2022
Member States
RECs
Member States
RECs
Development partners
4.3 Incorporate and implement the regional trade infrastructure development component in RAIPs (e.g. Pan-African Food Safety Reference laboratories, cold chains, trade logistics and other trade-related services)
4.3.1 Regional trade infrastructure development component in RAIPs developed and implemented
4.3.1.1 Number of RAIPs with regional trade infrastructure development incorporated
2021–2022
RECs RECs
Development partners

53
Table 7: Roadmap for the Framework for Boosting Intra-African Trade in Agricultural Commodities and Services
CLUSTER/ACTION AREA
ACTIVITIES/MEASURES
OUTPUTINDICATOR DESCRIPTION35
TIME FRAME (YEAR)
RESPONS IBILITY
POTENTIAL SOURCE OF FUNDING
4.0 TRADE-RELATED INFRASTRUC- TURE
(Develop innovative, legal, financial mechanisms for multicountry infrastructural development in support of intra-African trade)
4.4 Create, through conducive policies and regulatory frameworks, an enabling environment for PPPs for infrastructure development
4.4.1 Regional PPP frameworks in place to promote and regulate investment in infrastructure development (to be reflected in national infrastructure priorities)
4.4.1.1 Number of regional PPP frameworks for agriculture-related infrastructure investment developed
2021–2022
Member States
RECs
Member States
RECs
Private sector
Development partners
4.5 Coordinate and harmonise SPS standards with CAC, OIE and IPPC to ensure international recognition
4.5.1 Pan-African food safety standards established and aligned with CAC, OIE and IPPC standards
4.5.1.1 Number of Pan-African food safety standards for food, plant and animal safety and health
2021–2022
Member States
RECs
Develop- ment partners
Member States
RECs
Development partners
4.5.1.2 Number of countries integrating the standards aligned with CAC, OIE and IPPC
2021–2022
Member States
Member States
RECs
Development partners
5.0 TRADE FINANCE
(Develop and strengthen African financial institutions and mechanisms to promote intra-African trade and investment, taking into account the need to address binding constraints confronted by women and youth with respect to issues of trade finance)
5.1 Develop and operationalise value chain and structured trade finance schemes
5.1.1 Improved access to finance for economic operators in agricultural value chains
5.1.1.1 Number of loans approved to agricultural value chain actors
Ongoing Financial institutions
Member States
Private sector
5.2 Develop other innovative non-bank financing tools and contractual arrangement
5.2.1 Improved access to finance for economic operators in agricultural value chains
5.2.1.1 Number of value chain lead firms/champions established
Ongoing Private sector
Member States
Private sector
5.2.1.2 Number of value chain actors with increased access to finance, with emphasis on MSMEs and smallholder farmers
Ongoing Private sector
Member States
Private sector
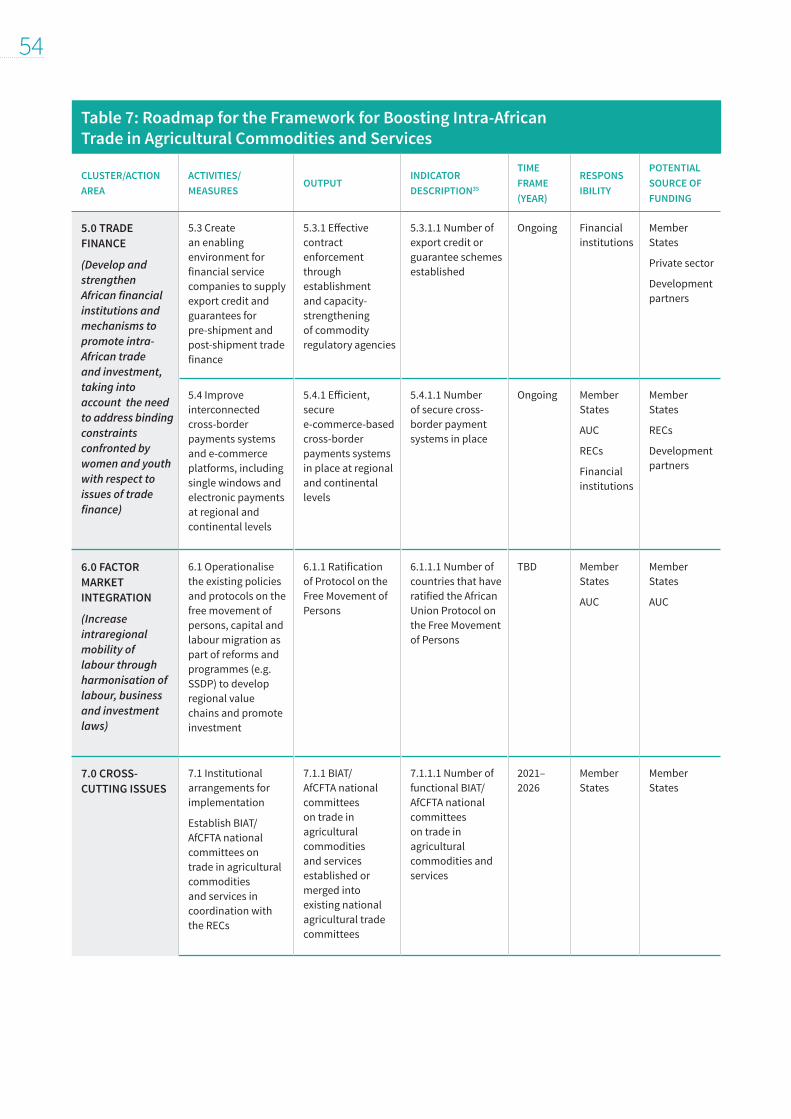
54
Table 7: Roadmap for the Framework for Boosting Intra-African Trade in Agricultural Commodities and Services
CLUSTER/ACTION AREA
ACTIVITIES/MEASURES
OUTPUTINDICATOR DESCRIPTION35
TIME FRAME (YEAR)
RESPONS IBILITY
POTENTIAL SOURCE OF FUNDING
5.0 TRADE FINANCE
(Develop and strengthen African financial institutions and mechanisms to promote intra-African trade and investment, taking into account the need to address binding constraints confronted by women and youth with respect to issues of trade finance)
5.3 Create an enabling environment for financial service companies to supply export credit and guarantees for pre-shipment and post-shipment trade finance
5.3.1 Effective contract enforcement through establishment and capacity-strengthening of commodity regulatory agencies
5.3.1.1 Number of export credit or guarantee schemes established
Ongoing Financial institutions
Member States
Private sector
Development partners
5.4 Improve interconnected cross-border payments systems and e-commerce platforms, including single windows and electronic payments at regional and continental levels
5.4.1 Efficient, secure e-commerce-based cross-border payments systems in place at regional and continental levels
5.4.1.1 Number of secure cross-border payment systems in place
Ongoing Member States
AUC
RECs
Financial institutions
Member States
RECs
Development partners
6.0 FACTOR MARKET INTEGRATION
(Increase intraregional mobility of labour through harmonisation of labour, business and investment laws)
6.1 Operationalise the existing policies and protocols on the free movement of persons, capital and labour migration as part of reforms and programmes (e.g. SSDP) to develop regional value chains and promote investment
6.1.1 Ratification of Protocol on the Free Movement of Persons
6.1.1.1 Number of countries that have ratified the African Union Protocol on the Free Movement of Persons
TBD Member States
AUC
Member States
AUC
7.0 CROSS-CUTTING ISSUES
7.1 Institutional arrangements for implementation
Establish BIAT/AfCFTA national committees on trade in agricultural commodities and services in coordination with the RECs
7.1.1 BIAT/AfCFTA national committees on trade in agricultural commodities and services established or merged into existing national agricultural trade committees
7.1.1.1 Number of functional BIAT/AfCFTA national committees on trade in agricultural commodities and services
2021–2026
Member States
Member States

55
Table 7: Roadmap for the Framework for Boosting Intra-African Trade in Agricultural Commodities and Services
CLUSTER/ACTION AREA
ACTIVITIES/MEASURES
OUTPUTINDICATOR DESCRIPTION35
TIME FRAME (YEAR)
RESPONS IBILITY
POTENTIAL SOURCE OF FUNDING
7.0 CROSS-CUTTING ISSUES
7.2 Policy institutions and frameworks
Establish policy institutional infrastructure, i.e. plans, policies, strategies, programmes and projects and other institutional mechanisms
7.2.1 National institutional infrastructure in Member States established and operational
7.2.1.1 Proportion of countries and RECs who have oriented or aligned their plans and operations with the Framework
2021–2026
Member States
AUC
Member States
Private sector
7.2.2 Key stakeholders and institutions involved in the process identified
7.2.2.1 Number of actors who are engaged in the implementation institution infrastructure
2021–2022
Member States
Member States and private sector
7.3 Sector prioritisation
Select priority sectors (also see 3.3)
7.3.1 Priority sectors at appropriate levels (country, REC and AUC) identified
7.3.1.1 Number of priority sectors identified at country and REC level
2021–2026
AUC
RECs
Member States
AUC
Member States
Private sector
7.3.2 Appropriate stakeholder groups identified
7.3.2.1 Number of stakeholder groups effectively involved
2021–2022
AUC
RECs
Member States
AUC
Member States
Private sector
7.4 Priority programme development
Develop short-, medium- and long-term programmes for priority sectors and cluster areas
7.4.1 Priority sector-targeted short-term programmes developed
7.4.1.1 Number of short-term programmes developed
2021–2026
Member States
RECs
AUC
AUC/AUDA-NEPAD
RECs Member States
Private sector
Development partners
7.4.2 Priority sector-targeted medium- and long-term programmes developed
7.4.2.1 Number of medium- and long-term programmes developed
2021–2026
Member States
RECs
AUC
AUC/AUDA-NEPAD
RECs Member States
Private sector
Development partners

56
Table 7: Roadmap for the Framework for Boosting Intra-African Trade in Agricultural Commodities and Services
CLUSTER/ACTION AREA
ACTIVITIES/MEASURES
OUTPUTINDICATOR DESCRIPTION35
TIME FRAME (YEAR)
RESPONS IBILITY
POTENTIAL SOURCE OF FUNDING
7.0 CROSS-CUTTING ISSUES
7.5 Investment strategy
Develop an investment strategy
7.5.1 A comprehensive strategy under an affirmative agenda to attract domestic and foreign investment developed
7.5.1.1 Number of strategy documents available for implementation
2021–2022
AUC/AUDA-NEPAD
AUC/AUDA-NEPAD
RECs Member States
Private sector
7.6 Resource mobilisation
Resources available for implementation
7.6.1 Innovative options for resource mobilisation identified
7.6.1.1 Actual amount of funds raised out of the pledged commitments disaggregated by source
2021–2026
Member States
RECs
AUC
Member States
RECs
AUC
Private sector
7.6.2 Roundtable resource mobilization events organized
7.6.2.1 Number of fund-raising events organized
2021–2026
Member States
RECs
AUC
Member States
RECs
AUC
7.7 Monitoring & evaluation
Develop and implement monitoring and evaluation framework to track progress on implementation of the Framework
7.7.1 Country-level monitoring and evaluation framework for the Framework developed and operationalized
7.7.1.1 Proportion of countries and RECs where M&E frameworks have been rolled out
2021–2026
RECs
Member States
AUC/AUDA-NEPAD
7.7.2 Baseline data, including all the agreed key performance indicators (KPIs) collected
7.7.2.1 Proportion of countries and RECs with BIAT baselines established as part of Malabo biennial review
2021–2026
RECs
Member States
RECs
Member States
AUC/AUDA-NEPAD
7.7.3 Risks and mitigation framework developed and operationalised
7.7.3.1 Proportion of countries and RECs rolling out BIAT risks mitigation framework
2021–2026
RECs
Member States
RECs
Member States
AUC/AUDA-NEPAD
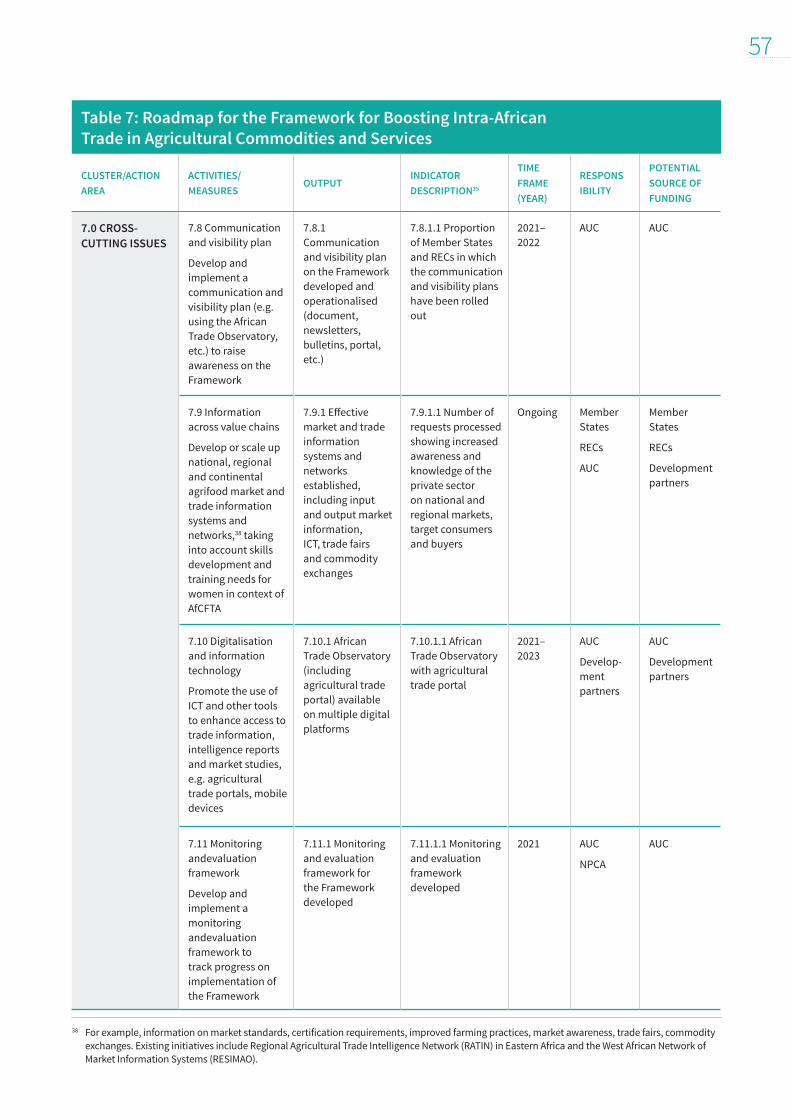
57
Table 7: Roadmap for the Framework for Boosting Intra-African Trade in Agricultural Commodities and Services
CLUSTER/ACTION AREA
ACTIVITIES/MEASURES
OUTPUTINDICATOR DESCRIPTION35
TIME FRAME (YEAR)
RESPONS IBILITY
POTENTIAL SOURCE OF FUNDING
7.0 CROSS-CUTTING ISSUES
7.8 Communication and visibility plan
Develop and implement a communication and visibility plan (e.g. using the African Trade Observatory, etc.) to raise awareness on the Framework
7.8.1 Communication and visibility plan on the Framework developed and operationalised (document, newsletters, bulletins, portal, etc.)
7.8.1.1 Proportion of Member States and RECs in which the communication and visibility plans have been rolled out
2021–2022
AUC AUC
7.9 Information across value chains
Develop or scale up national, regional and continental agrifood market and trade information systems and networks,38 taking into account skills development and training needs for women in context of AfCFTA
7.9.1 Effective market and trade information systems and networks established, including input and output market information, ICT, trade fairs and commodity exchanges
7.9.1.1 Number of requests processed showing increased awareness and knowledge of the private sector on national and regional markets, target consumers and buyers
Ongoing Member States
RECs
AUC
Member States
RECs
Development partners
7.10 Digitalisation and information technology
Promote the use of ICT and other tools to enhance access to trade information, intelligence reports and market studies, e.g. agricultural trade portals, mobile devices
7.10.1 African Trade Observatory (including agricultural trade portal) available on multiple digital platforms
7.10.1.1 African Trade Observatory with agricultural trade portal
2021–2023
AUC
Develop- ment partners
AUC
Development partners
7.11 Monitoring andevaluation framework
Develop and implement a monitoring andevaluation framework to track progress on implementation of the Framework
7.11.1 Monitoring and evaluation framework for the Framework developed
7.11.1.1 Monitoring and evaluation framework developed
2021 AUC
NPCA
AUC
38 For example, information on market standards, certification requirements, improved farming practices, market awareness, trade fairs, commodity exchanges. Existing initiatives include Regional Agricultural Trade Intelligence Network (RATIN) in Eastern Africa and the West African Network of Market Information Systems (RESIMAO).

58
REFERENCESAfrican Development Bank (AfDB). 2016. Feed Africa: Strategy for Agriculture Transformation in Africa 2016–2025. Abidjan.
AfDB. 2019. African Economic Outlook 2019. Abidjan. 214 pp. (also available at https://www.afdb.org/fileadmin/uploads/afdb/Documents/Publications/2019AEO/AEO_2019-EN.pdf).
AfDB. 2020. African Economic Outlook 2020. Abidjan. 206 pp. (also available https://www.afdb.org/en/documents/african-economic-outlook-2020).
Afrika, J.G. & Ajumbo, G. 2012. Informal cross border trade in Africa: Implications and policy recommendations. Africa Economic Brief, 3(10): 1-13.
Alliance for a Green Revolution in Africa (AGRA). 2016. Africa Agriculture Status Report 2016: Progress Towards Agriculture Transformation in Sub-Saharan Africa. Nairobi.
AGRA. 2019. Africa Agriculture Status Report 2019: The Hidden Middle: A Quiet Revolution in the Private Sector Driving Agricultural Transformation. Nairobi.
African Union Commission (AUC). 2012. Synthesis Paper on Boosting Intra-African Trade and Fast Tracking the Continental Free Trade Area. Addis Ababa.
AUC. 2014. Africa-wide seed institution revives efforts to transform African seed systems. Addis Ababa. (also available at https://au.int/fr/node/13982).
AUC. 2015. The African Union Commission’s Africa Business Directory: Toward the facilitation of growth, partnership and global inclusion. Addis Ababa. (also available at https://www.tralac.org/documents/resources/african-union/1669-african-union-commission-africa-business-directory-2015/file.html).
AUC. 2017a. Business Plan to Implement the CAADP-Malabo Declaration (2017–2021). Addis Abba.
AUC. 2017b. Continental Agribusiness Strategy Framework Document: Driving Africa’s Inclusive Growth. African Union Commission. Addis Ababa.
AUC. 2017c. Pan-African Quality Infrastructure: The Technical Barriers to Trade (TBT) and Sanitary and Phytosanitary (SPS) Policies of African Regional Economic Communities (RECs).
AUC. 2017d. A Food Safety Reference Laboratory for Africa. Addis Ababa (also available at https://www.standardsfacility.org/sites/default/files/STDFWG_Oct17_AUC_Nestle.pdf)
AUC. 2018a. Biennial Review Report 2017 on the implementation of the June 2014 Malabo Declaration. Addis Ababa.
AUC. 2018b. AU Services Experts Meet to Develop Services Sector Development Program in the context of the African Continental Free Trade Area (AfCFTA) [online]. (available at https://au.int/en/pressreleases/20180618/au-services-experts-meet-develop-services-sector-development-program-context).
AUC. 2019a. Draft African Union Commodity Strategy (DTI/STC-TIM/SO/5(II)). Addis Ababa.
AUC. 2019b. Prioritising Food Safety in Africa. Addis Ababa. (also available at https://au.int/sites/default/files/documents/33005-doc-prioritizing_food_safety_in_africa-eng.pdf).
AUC. 2020a. Biennial Review Report 2019 on the implementation of the June 2014 Malabo Declaration. Addis Ababa.
AUC. 2020b. Joint Virtual Meeting of the African Ministers Responsible for Agriculture, Trade and Finance, 20 July 2020. (http://www.fao.org/director-general/speeches/detail/en/c/1300518/).
AUC & FAO. 2020. Intra-African trade, the African Continental Free Trade Area (AfCFTA) and the COVID-19 pandemic. Rome, FAO. 4 pp. (also available at http://www.fao.org/3/ca8633en/ca8633en.pdf).
AUC, AfDB & UNECA. 2020. Africa Regional Integration Index: Report 2019. Addis Ababa, UNECA. (also available at https://www.uneca.org/sites/default/files/PublicationFiles/arii-report2019-fin-r39-21may20.pdf).
AUC and UNECA. 2019. Guidelines Framework for the Development of Regional Agricultural Value Chains in Africa. Draft.
59
Benin, S. 2020. The CAADP 2020 biennial review: Why many countries are off-track. ReSAKSS Issue Note 32. Washington, DC, IFPRI. 10 pp. (also available at http://ebrary.ifpri.org/utils/getfile/collection/p15738coll2/id/133721/filename/133930.pdf).
Blimpo, M.P. & Cosgrove-Davies, M. 2019. Electricity access in Sub-Saharan Africa: Uptake, reliability, and complementary factors for economic impact. Washington, DC, World Bank Publications.
Bouët, A. & Odjo, S., eds. 2019. Africa Agriculture Trade Monitor Report 2019. Washington, DC, IFPRI.
Brenton, P. & Isik, G., eds. 2012. De-fragmenting Africa: deepening regional trade integration in goods and services. Washington, DC, World Bank Publications.
Brookings Institute. 2020. Strategies for coping with the health and economic effects of the COVID-19 pandemic in Africa [online]. (also available at https://www.brookings.edu/blog/africa-in-focus/2020/03/18/strategies-for-coping-with-the-health-and-economic-effects-of-the-covid-19-pandemic-in-africa/).
Cadot, O. & Gourdon, J. 2014. Assessing the price-raising effect of non-tariff measures in Africa. Journal of African Economies, 23(4): 425–463.
De la O Campos, A.P., Villani, C., Davis, B. & Takagi, M. 2018. Ending extreme poverty in rural areas – Sustaining livelihoods to leave no one behind. Rome, FAO. 84 pp.(also available at http://www.fao.org/3/ca1908en/CA1908EN.pdf).
De Pinto, A. & Ulimwengu, J.M., eds. 2017. Trade, Climate Change, and Climate-Smart Agriculture. A Thriving Agricultural Sector in a Changing Climate: Meeting Malabo Declaration Goals through Climate-Smart Agriculture. ReSAKSS Annual Trends and Outlook Report 2016. Washington, DC, IFPRI.
Debar, J.C. & Tapsoba, A.F. 2019. Les protections à l’importation sur les produits agricoles. État des lieux et enjeux pour l’Afrique subsaharienne. FARM.
Dihel, N. & Goswami, A.G. 2016. The Unexplored Potential of Trade in Services in Africa: From Hair Stylists and Teachers to Accountants and Doctors. World Bank, Washington, DC.
FAO. 2011. The state of food and agriculture. Women in Agriculture: Closing the gap for development. Rome. 160 pp. (also available at http://www.fao.org/3/a-i2050e.pdf).
FAO. 2015. The State of Agriculture Commodity Markets 2015–16. Trade and food security: achieving a better balance between national priorities and the collective good. Rome. 89 pp. (also available http://www.fao.org/3/a-i5090e.pdf).
FAO. 2016a. Developing gender-sensitive value chains – A guiding framework. Rome. 52 pp. (also available at http://www.fao.org/3/a-i6462e.pdf).
FAO. 2016b. The state of food and agriculture. Climate change, agriculture and food security. Rome. 194 pp. (also available at http://www.fao.org/3/a-i6030e.pdf).
FAO. 2016c. Expert consultation on trade and nutrition: summary of discussions. FAO, Rome. 13 pp. (also available at http://www.fao.org/fileadmin/templates/est/meetings/trade_and_nutrition/Final_report.pdf).
FAO. 2017a. Policy Guidance Series - Strengthening Sector Policies for Better Food Security and Nutrition Results: Trade. Policy guidance Note 9. 32 pp. (also available at http://www.fao.org/3/a-i7910e.pdf).
FAO. 2017b. Evolution of import tariffs and the issue of tariff escalation. Trade Policy Brief No. 25. Rome. 2 pp. (also available at http://www.fao.org/3/a-i8004e.pdf).
FAO. 2018. The State of Agricultural Commodity Markets. Agricultural trade, climate change and food security. Rome. 112 pp. (also available at http://www.fao.org/3/I9542EN/i9542en.pdf).
FAO. 2019. Food Outlook – Biannual Report on Global Food Markets. Rome. 165 pp. (also available at http://www.fao.org/3/ca9509en/CA9509EN.pdf).
FAO. 2020a. Crop Prospects and Food Situation. Rome. 48 pp. (also available at http://www.fao.org/3/cb1101en/cb1101en.pdf).
FAO. 2020b. Agri-food markets and trade policy in the time of COVID-19. Policy brief. Rome. 5 pp. (also available at http://www.fao.org/3/ca8446en/CA8446EN.pdf).

60
FAO. 2020c. The State of World Fisheries and Aquaculture 2020. Sustainability in action. Rome. 244 pp. (also available at http://www.fao.org/3/ca9229en/CA9229EN.pdf).
FAO. 2020d. Food and agriculture data. In: FAOSTAT [online]. (www.fao.org/faostat/en/#home).
FAO. (Forthcoming). Synergy Between Agriculture and Services Trade: Enabling New Growth Opportunities. Rome.
FAO. (Forthcoming). Understanding the Impact of the COVID-19 Pandemic on Food Security in Africa. Rome.
FAO & AUC. 2018. Sustainable Agricultural Mechanization: A Framework for Africa. Addis Ababa. 150 pp. (also available at http://www.fao.org/3/CA1136EN/ca1136en.pdf).
FAO & ECA. 2018. Regional Overview of Food Security and Nutrition. Addressing the threat from climate variability and extremes for food security and nutrition. Accra. 120 pp. (also available at http://www.fao.org/3/ca2710en/CA2710EN.pdf).
FAO & UNIDO. 2018. 3ADI+: Partnering for the Sustainable Development Goals (SDGs). Rome. 4 pp. (also available at http://www.fao.org/3/CA1175EN/ca1175en.pdf).
Financial Times. 2020. Oil prices hit lowest level in 17 years as demand plunges [online]. https://www.ft.com/content/d63d0618-6928-11ea-800d-da70cff6e4d3.
Food Security Information Network (FSIN). 2020. Global Report on Food Crises 2020. Join analysis for better solutions. Rome. 240 pp. (also available at http://www.fao.org/3/ca8786en/CA8786EN.pdf).
Green, R., Issoufou, S., McGregor, T., Peralta-Alva, A., Sy, A. & Versailles, B. 2019. Is the African Continental Free Trade Area a Game Changer for the Continent? Sub-Saharan Africa Regional Economic Outlook: Recovery Amid Elevated Uncertainty. Washington DC, IMF.
International Labour Organization (ILO). 2020. Employment distribution by economic activity (by sex and rural/urban areas). In: ILOSTAT explorer [online]. https://www.ilo.org/shinyapps/ bulkexplorer4/?lang=en&segment=indicator&id=EMP_2EMP_SEX_GEO_ECO_DT_A.
International Trade Center (ITC). 2015. SME Competitiveness Outlook 2015: Connect, compete and change for inclusive growth. Geneva. 268 pp.
Inter-réseaux Développement rural, Bureau Issala & S.O.S Faim Belgique. 2019. The Growing Role of the Private Sector in Agricultural and Food Policy in Africa. Context, forms and issues.
Intergovernmental Panel on Climate Change (IPCC). 2019. Climate Change and Land: an IPCC special report on climate change, desertification, land degradation, sustainable land management, food security, and greenhouse gas fluxes in terrestrial ecosystems. Shukla, P.R., Skea, J., Calvo Buendia, E., Masson-Delmotte, V., Pörtner, H.-O., Roberts, D. C., Zhai, P., Slade, R., Connors, S., van Diemen, R., Ferrat, M., Haughey, E., Luz, S., Neogi, S., Pathak, M., Petzold, J., Portugal Pereira, J., Vyas, P., Huntley, E., Kissick, K., Belkacemi, M. & Malley, J., eds. In press.
Josserand, H.P. 2013. Assessment of Volumes and Value of Regionally Traded Staple Commodities. Paper prepared for the Food Across Borders Conference, Accra, 29–31 January 2013.
Knox, J., Hess, T., Daccache, A. & Wheeler, T. 2012. Climate change impacts on crop productivity in Africa and South Asia. Environmental Research Letters, 7(3), 034032.
Koroma, S., Nimarkoh, J., You, N., Ogalo, V. & Owino, B. 2017. Formalization of informal trade in Africa. Trends, experiences and socioeconomic impacts. Accra, FAO. 38 pp. (also available at http://www.fao.org/3/a-i7101e.pdf).
LaFollette, M.C. 2007. Taking science to the marketplace. Examples of Science’s Service Presentation of Chemistry During the 1930s. The Public Image of Chemistry. Schummer J., Bensaude-Vincent, B. & Van Tiggelen, B. p. 259–295.
Lakner, C., Mahler, D.G., Negre, M. & Prydz, E.B. 2019. How much does reducing inequality matter for global poverty? Global Poverty Monitoring Technical Note 13. Washington, DC, World Bank.

61
Lesser, C. & Moisé-Leeman, E. 2009. Informal Cross-Border Trade and Trade Facilitation Reform in Sub-Saharan Africa. OECD Trade Policy Paper No. 86. Paris, OECD Publishing. (also available at https://citeseerx.ist.psu.edu/viewdoc/download?doi=10.1.1.489.315&rep=rep1&type=pdf).
Luke, D. & MacLeod, J. 2019. Inclusive Trade in Africa: The African Continental Free Trade Area in Comparative Perspective. The International Political Economy of New Regionalisms Series. 1st Edition. New York, Routledge. 226 pp.
Neven, D. 2014. Developing sustainable food value chains. Guiding principles. Rome, FAO. 89 pp. (also available at http://www.fao.org/3/a-i3953e.pdf).
New Partnership for Africa’s Development (NEPAD). 2020. Food Safety in Africa: An Important Deliverable for AUDA-NEPAD. In: AUDA-NEPAD [online]. Midrand, South Africa. www.un.org/africarenewal/news/food-safety-africa-important-deliverable-auda-nepad.
NEPAD Planning and Coordination Agency (NPCA), AUC & AfDB. 2018. PIDA Progress Report 2018. Midran, South Africa, NEPAD Agency, Addis Ababa, African Union Commission, and Abidjan, African Development Bank.
OECD. 2020. Creditor Reporting System (CRS). In: Organisation for Economic Co-Operation and Development [online]. Paris. https://stats.oecd.org/Index.aspx?DataSetCode=crs1.
OECD/FAO. 2016. OECD-FAO Agricultural Outlook 2016-2025. Paris, OECD Publishing. 137 pp. (also available at http://www.fao.org/3/a-i5778e.pdf).
OECD/FAO. 2019. Agricultural Outlook 2019-2028. Paris, OECD Publishing, and Rome, FAO. 326 pp. (also available at http://www.fao.org/3/ca4076en/ca4076en.pdf).
Oehmke, J.F., Naseem, A., Anderson, J., Pray, C., Moss, C.B. & Post, L.A. 2016. Contemporary African structural transformation: An empirical assessment. Draft. Rome, FAO. 39 pp. (also available at http://www.fao.org/3/a-bp141e.pdf).
Onyeji, C. 2006. Africa Productive Capacity Initiative (APCI). A Review. Presentation at SADC Expert Group Meeting.
Quisumbing, A.R., Meinzen-Dick, R., Raney, T.L., Croppenstedt, A., Behrman, J.A. & Peterman, A., eds. 2014. Gender in Agriculture. Closing the Knowledge Gap. Dordrecht, Springer Science + Business Media B.V. and and Rome, FAO.
ReSAKSS. 2020. CAADP indicators across countries and regions. In: Regional Strategic Analysis and Knowledge Support System [online]. https://www.resakss.org.
Reuters. 2020. Oil prices slip as COVID-19 case surge dents fuel demand hopes In: Reuters [online]. https://www.reuters.com/article/global-oil/oil-prices-slip-as-covid-19-case-surge-dents-fuel-demand-hopes-idUSL3N2F10F1.
Saarinen, H., McKeon, N., Brachet, I., Brouwer, E.J., De Meo, P., Delvaux, F., Hummel, A.C., Kesteloot, T., Sonntag, A., Ulmer, K. & Wahis L. 2017. Mixing Means and Ends: what role for (which) private sector in agriculture and food & nutrition security? Brussels, CONCORD Europe. (also available at https://library.concordeurope.org/record/1902/files/DEEEP-PAPER-2017-006.pdf).
Slavchevska, V., Kaaria, S. & Taivalmaa, S.L. 2016. Feminization of agriculture in the context of rural transformations: What is the evidence? World Bank. (also available at https://doi.org/10.1596/25099).
Tamiotti, L. 2009. Trade and climate change: a report by the United Nations Environment Programme and the World Trade Organization. UNEP/Earthprint.
Tongwane, M.I. & Moeletsi, M.E. 2018. A review of greenhouse gas emissions from the agriculture sector in Africa. Agricultural systems, pp. 166, 124–134.
United Nations Conference on Trade and Development (UNCTAD). 2016. African Continental Free Trade Area: Developing and Strengthening Regional Value Chains in Agricultural Commodities and Processed Food Products. New York and Geneva. 78 pp. (also available at https://unctad.org/system/files/official-document/webditc2016d4_en.pdf).

62
UNCTAD. 2016. Virtual Institute Teaching Material on Structural Transformation and Industrial Policy. United Nations Conference on Trade and Development. New York and Geneva. 143 pp. (also available at https://unctad.org/system/files/official-document/gds2016d1_en.pdf).
UNCTAD. 2019. Economic Development in Africa Report 2019: Made in Africa – Rules of Origin for Enhanced Intra-African Trade. Geneva. 25 pp. (also available at https://unctad.org/system/files/official-document/edar2019_en_ch5.pdf).
United Nations Development Programme (UNDP). 2008. Aid for Trade: A Guide to Conducting Aid for Trade Needs Assessment Exercises. 130 pp. United Nations Publication. (also available at https://www.undp.org/content/dam/undp/library/Poverty%20Reduction/Trade,%20Intellectual%20Property%20and%20Migration/Aid%20for%20Trade/AFT%20English%20web.pdf).
United Nations Economic Commission for Africa (UNECA). 2010. Assessing Regional Integration in Africa IV. Enhancing Intra-African Trade. 528 pp. Addis Ababa. (also available at https://www.uneca.org/sites/default/files/PublicationFiles/aria4full.pdf).
UNECA. 2015. Harnessing the Potential of the Informal Sector for Inclusive Growth in Africa. Addis Ababa. (also available at https://www.un.org/en/ecosoc/integration//2015/pdf/eca.pdf).
UNECA. 2016. Assessing Regional Integration in Africa VII: Innovation, Competitiveness and Regional Integration. Addis Ababa. 148 pp. (also available at https://repository.uneca.org/bitstream/handle/10855/23013/b11560812.pdf?sequence=1&isAllowed=y).
Vermeulen, S.J., Campbell, B.M. & Ingram, J.S. 2012. Climate change and food systems. Annual review of environment and resources. In Annual Review of Environment and Resources, 37: 195–222. (also available at https://doi.org/10.1146/annurev-environ-020411-130608).
World Bank. 2013. Growing Africa: Unlocking the potential of agribusiness. Washington, DC. 162 pp. (also available at http://documents1.worldbank.org/curated/en/327811467990084951/pdf/756630v10REPLA0frica0pub03011013web.pdf).
World Bank. 2020a. COVID-19 will hit the poor hardest. Here’s what we can do about it. In: The World Bank [online]. https://blogs.worldbank.org/voices/covid-19-will-hit-poor-hardest-heres-what-we-can-do-about-it.
World Bank. 2020b. Commodity Price Data (The Pink Sheet), monthly prices in nominal US dollars. In: The World Bank [online]. https://www.worldbank.org/en/research/commodity-markets.
World Economic Forum. 2017. The Africa competitiveness report 2017. Addressing Africa’s Demographic Dividend. Geneva. 179 pp. (also available at http://www3.weforum.org/docs/WEF_ACR_2017.pdf).
Young, H. & Marshak, A. 2018. Persistent global acute malnutrition. A discussion paper on the scope of the problem, its drivers, and strategies for moving forward for policy, practice, and research. Boston, Feinstein International Center, Tufts University. (also available at https://fic.tufts.edu/wp-content/uploads/FIC-Publication-Persistent-Global-Acute-Malnutrition_web_2.26s.pdf).
Zeufack, A.G.; Calderon, C., Kambou, G., Djiofack, C.Z., Kubota, M., Korman, V., Cantu Canales, C. 2020. Africa’s Pulse, No. 21 (April), Washington, DC, World Bank.

63
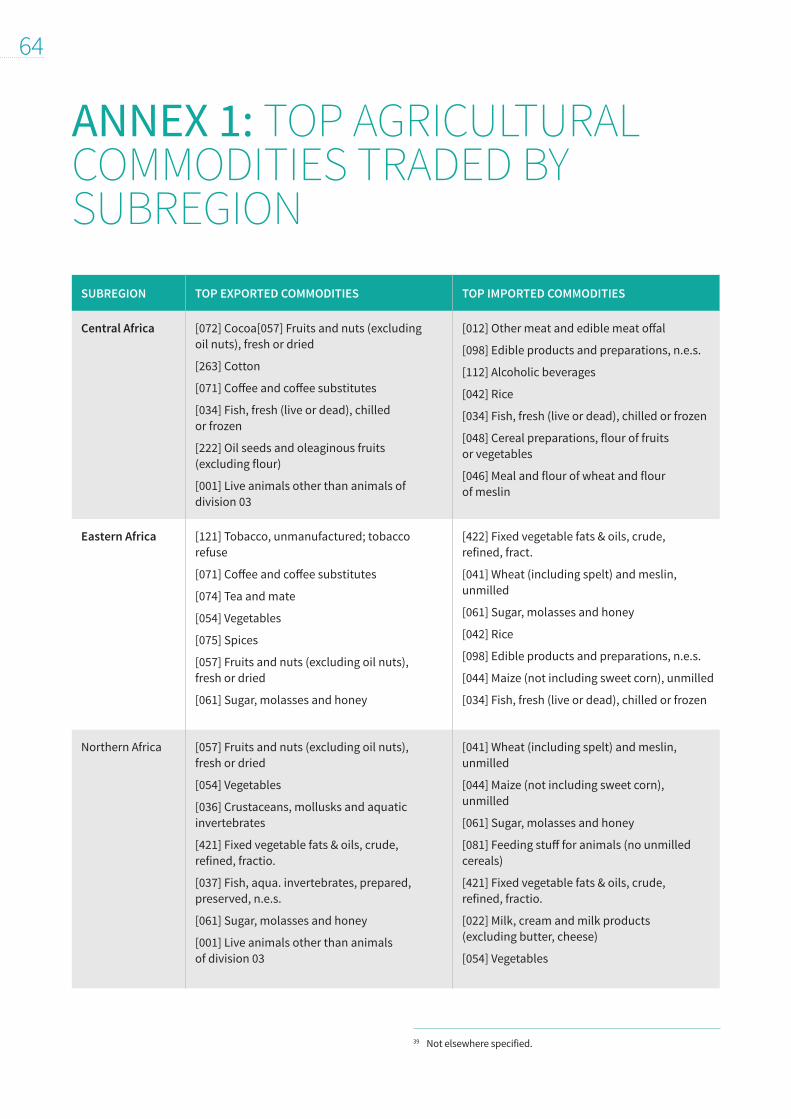
64
ANNEX 1: TOP AGRICULTURAL COMMODITIES TRADED BY SUBREGION
SUBREGION TOP EXPORTED COMMODITIES TOP IMPORTED COMMODITIES
Central Africa [072] Cocoa[057] Fruits and nuts (excluding oil nuts), fresh or dried
[263] Cotton
[071] Coffee and coffee substitutes
[034] Fish, fresh (live or dead), chilled or frozen
[222] Oil seeds and oleaginous fruits (excluding flour)
[001] Live animals other than animals of division 03
[012] Other meat and edible meat offal
[098] Edible products and preparations, n.e.s.
[112] Alcoholic beverages
[042] Rice
[034] Fish, fresh (live or dead), chilled or frozen
[048] Cereal preparations, flour of fruits or vegetables
[046] Meal and flour of wheat and flour of meslin
Eastern Africa [121] Tobacco, unmanufactured; tobacco refuse
[071] Coffee and coffee substitutes
[074] Tea and mate
[054] Vegetables
[075] Spices
[057] Fruits and nuts (excluding oil nuts), fresh or dried
[061] Sugar, molasses and honey
[422] Fixed vegetable fats & oils, crude, refined, fract.
[041] Wheat (including spelt) and meslin, unmilled
[061] Sugar, molasses and honey
[042] Rice
[098] Edible products and preparations, n.e.s.
[044] Maize (not including sweet corn), unmilled
[034] Fish, fresh (live or dead), chilled or frozen
Northern Africa [057] Fruits and nuts (excluding oil nuts), fresh or dried
[054] Vegetables
[036] Crustaceans, mollusks and aquatic invertebrates
[421] Fixed vegetable fats & oils, crude, refined, fractio.
[037] Fish, aqua. invertebrates, prepared, preserved, n.e.s.
[061] Sugar, molasses and honey
[001] Live animals other than animals of division 03
[041] Wheat (including spelt) and meslin, unmilled
[044] Maize (not including sweet corn), unmilled
[061] Sugar, molasses and honey
[081] Feeding stuff for animals (no unmilled cereals)
[421] Fixed vegetable fats & oils, crude, refined, fractio.
[022] Milk, cream and milk products (excluding butter, cheese)
[054] Vegetables
39 Not elsewhere specified.

65
SUBREGION TOP EXPORTED COMMODITIES TOP IMPORTED COMMODITIES
Southern Africa [057] Fruits and nuts (excluding oil nuts), fresh or dried
[112] Alcoholic beverages
[034] Fish, fresh (live or dead), chilled or frozen
[061] Sugar, molasses and honey
[098] Edible products and preparations, n.e.s.
[081] Feeding stuff for animals (no unmilled cereals)
[044] Maize (not including sweet corn), unmilled
[012] Other meat and edible meat offal
[112] Alcoholic beverages
[061] Sugar, molasses and honey
[081] Feeding stuff for animals (no unmilled cereals)
[042] Rice
[044] Maize (not including sweet corn), unmilled
[041] Wheat (including spelt) and meslin, unmilled
Western Africa [072] Cocoa
[057] Fruits and nuts (excluding oil nuts), fresh or dried
[263] Cotton
[034] Fish, fresh (live or dead), chilled or frozen
[222] Oil seeds and oleaginous fruits (excluding flour)
[422] Fixed vegetable fats & oils, crude, refined, fract.
[036] Crustaceans, mollusks and aquatic invertebrates
[042] Rice
[041] Wheat (including spelt) and meslin, unmilled
[034] Fish, fresh (live or dead), chilled or frozen
[098] Edible products and preparations, n.e.s.
[061] Sugar, molasses and honey
[422] Fixed vegetable fats & oils, crude, refined, fract.
[022] Milk, cream and milk products (excluding butter, cheese)
Source: UNCTAD, Merchandise trade matrix – detailed products, in thousands of USD, agricultural products include SITC codes 0, 1 and 4, and oil seeds and oleaginous fruit SITC 22 and Cotton SITC 263.


CB3172EN/1/02.21
ISBN 978-92-5-133914-5
9 7 8 9 2 5 1 3 3 9 1 4 5