framework for application of the toxicity equivalence methodology … · toxicity equivalence...
TRANSCRIPT


EPA/630/P-03/002AJune 2003External Review Draft
Framework for Application of the Toxicity Equivalence Methodology
for Polychlorinated Dioxins, Furans and Biphenyls in Ecological Risk Assessment
NOTICE
THIS DOCUMENT IS A PRELIMINARY DRAFT. It has not been formally released by the U.S. Environmental Protection Agency and should not at this stage be construed to represent Agency policy. It is being circulated for comment.
Risk Assessment ForumU.S. Environmental Protection Agency
Washington, D.C. 20460
Available from: http://cfpub.epa.gov/ncea/raf/recordisplay.cfm?deid=55669
DISCLAIMER
This document is a draft for external review purposes only and does not constitute U.S. Environmental Protection Agency Policy. Mention of trade names or commercial products does not constitute endorsement or recommendation for use.
June 2003 ii DRAFT—DO NOT CITE OR QUOTE

CONTENTS
PREFACE . . . . . . . . . . . . . . . . . . . . . . . . . . . . . . . . . . . . . . . . . . . . . . . . . . . . . . . . . . . . . . . . . . vi
AUTHORS, CONTRIBUTORS, AND REVIEWERS . . . . . . . . . . . . . . . . . . . . . . . . . . . . . . . vii
LIST OF ABBREVIATIONS AND ACRONYMS . . . . . . . . . . . . . . . . . . . . . . . . . . . . . . . . . . . ix
1. INTRODUCTION . . . . . . . . . . . . . . . . . . . . . . . . . . . . . . . . . . . . . . . . . . . . . . . . . . . . . . . . . . 1 1.1. DEFINITIONS . . . . . . . . . . . . . . . . . . . . . . . . . . . . . . . . . . . . . . . . . . . . . . . . . . . . . . . . 3 1.2. EVOLUTION OF THE TOXICITY EQUIVALENCE METHODOLOGY . . . . . . . . . 4
2. THE TOXICITY EQUIVALENCE METHODOLOGY . . . . . . . . . . . . . . . . . . . . . . . . . . . . . 9 2.1. Ah RECEPTOR MEDIATED MECHANISM AND ASSIGNMENT OF
RELATIVE POTENCY . . . . . . . . . . . . . . . . . . . . . . . . . . . . . . . . . . . . . . . . . . . . . . . . . 9 2.2. SELECTION OF THE APPROPRIATE POTENCY FACTORS . . . . . . . . . . . . . . . . 122.3. TOXICITY EQUIVALENCE CONCENTRATION . . . . . . . . . . . . . . . . . . . . . . . . . . 12
3. APPLICATION OF THE TOXICITY EQUIVALENCE METHODOLOGYIN ECOLOGICAL RISK ASSESSMENT . . . . . . . . . . . . . . . . . . . . . . . . . . . . . . . . . . . . . . 143.1. CONSIDERATIONS IN PLANNING . . . . . . . . . . . . . . . . . . . . . . . . . . . . . . . . . . . . . 143.2. CONSIDERATIONS IN PROBLEM FORMULATION . . . . . . . . . . . . . . . . . . . . . . . 17
3.2.1. Assessment Endpoints . . . . . . . . . . . . . . . . . . . . . . . . . . . . . . . . . . . . . . . . . . . 173.2.1.1. Susceptibility: Sensitivity . . . . . . . . . . . . . . . . . . . . . . . . . . . . . . . . . 183.2.1.2. Susceptibility: Exposure . . . . . . . . . . . . . . . . . . . . . . . . . . . . . . . . . . 203.2.1.3. Susceptibility: Integration of Sensitivity and Exposure
Considerations . . . . . . . . . . . . . . . . . . . . . . . . . . . . . . . . . . . . . . . . . . 233.2.1.4. Ecological Relevance . . . . . . . . . . . . . . . . . . . . . . . . . . . . . . . . . . . . . 23
3.2.2. Conceptual Model . . . . . . . . . . . . . . . . . . . . . . . . . . . . . . . . . . . . . . . . . . . . . . . 243.2.3. Analysis Plan . . . . . . . . . . . . . . . . . . . . . . . . . . . . . . . . . . . . . . . . . . . . . . . . . . 25
3.3. CONSIDERATIONS IN ANALYSIS . . . . . . . . . . . . . . . . . . . . . . . . . . . . . . . . . . . . . 283.3.1. Characterization of Exposure . . . . . . . . . . . . . . . . . . . . . . . . . . . . . . . . . . . . . . 28
3.3.1.1. Congener-Specific Analyses . . . . . . . . . . . . . . . . . . . . . . . . . . . . . . . 293.3.1.2. Chemical Fate of PCDDs, PCDFs, and PCBs . . . . . . . . . . . . . . . . . . 293.3.1.3. Choices for the Exposure Dose Metric . . . . . . . . . . . . . . . . . . . . . . . 313.3.1.4. Bioaccumulation of PCDDs, PCDFs, and PCBs . . . . . . . . . . . . . . . . 333.3.1.5. Examples of TEC Calculations for Fish, Birds, and Mammals . . . . . 41
3.3.2. Selection of TEFs or RPFs . . . . . . . . . . . . . . . . . . . . . . . . . . . . . . . . . . . . . . . . 463.3.2.1. General Considerations for Selecting RPFs . . . . . . . . . . . . . . . . . . . . 483.3.2.2. Visualization and Application of Criteria for Selection of Optimum
RPFs . . . . . . . . . . . . . . . . . . . . . . . . . . . . . . . . . . . . . . . . . . . . . . . . . . 493.3.2.3. Examples of ReP Data Prioritization Choices for Selecting RPFs . . 543.3.2.4. Summary of Selection of TEFs or RPFs . . . . . . . . . . . . . . . . . . . . . . 59
June 2003 iii DRAFT—DO NOT CITE OR QUOTE

3.3.3. Characterization of Ecological Effects . . . . . . . . . . . . . . . . . . . . . . . . . . . . . . . 613.4. CONSIDERATIONS IN RISK CHARACTERIZATION . . . . . . . . . . . . . . . . . . . . . . 62
3.4.1. Risk Estimate . . . . . . . . . . . . . . . . . . . . . . . . . . . . . . . . . . . . . . . . . . . . . . . . . . 623.4.2. Lines of Evidence . . . . . . . . . . . . . . . . . . . . . . . . . . . . . . . . . . . . . . . . . . . . . . . 633.4.3. Summary of Uncertainties . . . . . . . . . . . . . . . . . . . . . . . . . . . . . . . . . . . . . . . . 62
3.4.3.1. Uncertainty Associated With the Toxicity EquivalenceMethodology . . . . . . . . . . . . . . . . . . . . . . . . . . . . . . . . . . . . . . . . . . . 66
3.4.3.2. Uncertainty Associated With Application of the ToxicityEquivalence Methodology in Ecological Risk Assessment . . . . . . . . 68
4. CONCLUSIONS . . . . . . . . . . . . . . . . . . . . . . . . . . . . . . . . . . . . . . . . . . . . . . . . . . . . . . . . . . 71
REFERENCES . . . . . . . . . . . . . . . . . . . . . . . . . . . . . . . . . . . . . . . . . . . . . . . . . . . . . . . . . . . . . . 73
GLOSSARY . . . . . . . . . . . . . . . . . . . . . . . . . . . . . . . . . . . . . . . . . . . . . . . . . . . . . . . . . . . . . . . . 82
June 2003 iv DRAFT—DO NOT CITE OR QUOTE

LIST OF FIGURES
1. Chemical structure of PCDDs, PCDFs, and PCBs. . . . . . . . . . . . . . . . . . . . . . . . . . . . . . . . . . 22. The framework for ecological risk assessment. . . . . . . . . . . . . . . . . . . . . . . . . . . . . . . . . . . . 153. An aquatic food web: 2,3,7,8-TCDD bioavailability and trophic transfer. . . . . . . . . . . . . . . 244. Application of the toxicity equivalence methodology in ecological risk assessment for
exposure to PCDDs, PCDFs, and PCBs. . . . . . . . . . . . . . . . . . . . . . . . . . . . . . . . . . . . . . . . . 255. Estimating chemical concentrations in eggs and diet: BSAFs and BAFs for PCDDs,
PCDFs, and PCBs. . . . . . . . . . . . . . . . . . . . . . . . . . . . . . . . . . . . . . . . . . . . . . . . . . . . . . . . . . 306. PCDDs, PCDFs, and PCBs: effects on vertebrates. . . . . . . . . . . . . . . . . . . . . . . . . . . . . . . . . 407. Fish TECs calculated for eggs versus sediment. . . . . . . . . . . . . . . . . . . . . . . . . . . . . . . . . . . 418. Bird TECs calculated for eggs versus sediment. . . . . . . . . . . . . . . . . . . . . . . . . . . . . . . . . . . 419. Mammal TECs calculated for diet versus sediment. . . . . . . . . . . . . . . . . . . . . . . . . . . . . . . . 4310. Three dimensional matrix model for selection of RPFs or TEFs . . . . . . . . . . . . . . . . . . . . . 48
LIST OF TABLES
1. Number of polychlorinated dioxin, furan, and biphenyl congeners . . . . . . . . . . . . . . . . . . . . 62. World Health Organization toxicity equivalence factors (TEFs) for mammals, birds and
fish . . . . . . . . . . . . . . . . . . . . . . . . . . . . . . . . . . . . . . . . . . . . . . . . . . . . . . . . . . . . . . . . . . . . . . 73. Effects of TCDD and related compounds in different animal species . . . . . . . . . . . . . . . . . . 194. An example of estimating toxicity equivalence concentrations (TECs) in fish eggs from
average concentrations of PCDD, PCDF, and PCB congeners measured in surfacesediment samples of a reservoir . . . . . . . . . . . . . . . . . . . . . . . . . . . . . . . . . . . . . . . . . . . . . . . 33
5. An example of estimating toxicity equivalence concentrations (TECs) in bird eggs fromaverage concentrations of PCDD, PCDF, and PCB congeners measured in surfacesediment samples of a reservoir . . . . . . . . . . . . . . . . . . . . . . . . . . . . . . . . . . . . . . . . . . . . . . . 34
6. An example of estimating toxicity equivalence concentrations (TECs) in the diet of otter from average concentrations of PCDD, PCDF, and PCB congeners measured in surface sediment samples of a reservoir . . . . . . . . . . . . . . . . . . . . . . . . . . . . . . . . . . . . . . . . . . . . . . . 35
7. RPF selection matrix model for Caspian terns (example 2) for optimizing species and endpoint specificity. . . . . . . . . . . . . . . . . . . . . . . . . . . . . . . . . . . . . . . . . . . . . . . . . . . . . . . . . 53
8. Considerations in RPF selection for the mink example. . . . . . . . . . . . . . . . . . . . . . . . . . . . . 57
LIST OF TEXT BOXES
1. Clarification of terminology. . . . . . . . . . . . . . . . . . . . . . . . . . . . . . . . . . . . . . . . . . . . . . . . . . . 32. Questions for planning and problem formulation. . . . . . . . . . . . . . . . . . . . . . . . . . . . . . . . . . 163. Questions for analysis. . . . . . . . . . . . . . . . . . . . . . . . . . . . . . . . . . . . . . . . . . . . . . . . . . . . . . . 264. Symbols and notations used in equations. . . . . . . . . . . . . . . . . . . . . . . . . . . . . . . . . . . . . . . . 375. Questions when calculating TECs. . . . . . . . . . . . . . . . . . . . . . . . . . . . . . . . . . . . . . . . . . . . . 446. Questions for risk characterization. . . . . . . . . . . . . . . . . . . . . . . . . . . . . . . . . . . . . . . . . . . . . 61
June 2003 v DRAFT—DO NOT CITE OR QUOTE

PREFACE
Polychlorinated dibenzo-p-dioxins (PCDDs), dibenzofurans (PCDFs), and biphenyls (PCBs) commonly occur as complex mixtures in the environment, including in animal tissues. For more than a decade, the U.S. Environmental Protection Agency (EPA) and other organizations have estimated the combined risks that such mixtures pose to human health using a method known as the toxicity equivalence methodology. Application of this methodology in ecological risk assessments has proceeded more slowly, in part because of the variety of species from different taxonomic classes (e.g., fish, birds, and mammals) that need to be considered.
As both data and experience with the methodology have accumulated, however, experts have come to the consensus that the toxicity equivalence methodology can strengthen assessments of ecological risks (Van den Berg et al., 1998; U.S. EPA, 2001a). Consultations between EPA and the Department of Interior (DOI) on the adequacy of water quality criteria, based on 2,3,7,8-TCDD alone, for protecting endangered species in the Great Lakes led these agencies to more intensively explore the application of the toxicity equivalence methodology in ecological risk assessment. In 1998, EPA and DOI sponsored a workshop that recommended the development of further guidance on application of the toxicity equivalence methodology (U.S. EPA, 2001a). This framework has been developed in direct response to that workshop recommendation. Organized in accordance with EPA’s Guidelines for Ecological Risk Assessment (U.S. EPA, 1998), this framework is intended to assist EPA scientists in using the methodology in ecological risk assessments that involve dioxins and related compounds, as well as to inform EPA decision makers, other agencies, and the public about this methodology.
While this framework touches on many aspects of ecological risk assessment, it is not intended to be a comprehensive guide to risk assessment involving dioxin-like compounds. Rather, the framework provides an introduction to the toxicity equivalence methodology, offers considerations for how and when to apply it, and presents practical examples of its use. Readers are referred elsewhere for details on topics such as chemical analysis, environmental fate and transport modeling, and development of stressor-response profiles for dioxin-like compounds. This framework is not a regulation nor is it intended to substitute for federal regulations.
This framework was prepared by a Technical Panel under the auspices of EPA’s Risk Assessment Forum. The Risk Assessment Forum was established to promote scientific consensus on risk assessment issues and to ensure that this consensus is incorporated into appropriate risk assessment guidance. To accomplish this, the Risk Assessment Forum assembles experts from throughout EPA in a formal process to study and report on these issues from an Agency-wide perspective.
June 2003 vi DRAFT—DO NOT CITE OR QUOTE
AUTHORS, CONTRIBUTORS, AND REVIEWERS
AUTHORS
This framework was prepared by a technical panel under the auspices of EPA’s Risk Assessment Forum.
Technical Panel
Patricia Cirone (Chair)Office of Environmental AssessmentRegion 10U.S. EPASeattle, WA 98101
Philip CookMid-Continent Ecology DivisionNational Health and Environmental Effects
Research Laboratory Office of Research and Development U.S. EPA Duluth, MN 55804
Michael DeVitoExperimental Toxicology DivisionNational Health and Environmental Effects
Research Laboratory Office of Research and Development U.S. EPA Research Triangle Park, NC 27711
Bruce DuncanOffice of Environmental AssessmentRegion 10U.S. EPASeattle, WA 98101
Tala HenryExperimental Toxicology DivisionNational Health and Environmental Effects Research LaboratoryOffice of Research and DevelopmentU.S. EPADuluth, MN 55804
Robert PepinWater DivisionRegion 5U.S. EPAChicago, IL 60604
Steven WhartonOffice of Partnerships and Regulatory
Assistance Region 8 U.S. EPA Denver, CO 80202
Risk Assessment Forum Staff
Scott SchwenkNational Center for Environmental
Assessment Office of Research and Development U.S. EPA Washington, DC 20460
June 2003 vii DRAFT—DO NOT CITE OR QUOTE
REVIEWERS
Linda BirnbaumExperimental Toxicology DivisionNational Health and Environmental Effects
Research Laboratory Office of Research and Development U.S. EPA Research Triangle Park, NC 27711
Chris CubbisonNational Center for Environmental
Assessment-Cin Office of Research and Development U.S. EPA Cincinnati, OH 45268
Dale HoffOffice of Ecosystems Protection andRemediationRegion 8U.S. EPADenver, CO 80202-2466
Matt LorberNational Center for Environmental AssessmentOffice of Research and Development U.S. EPAWashington, DC 20460
Suzanne K. M. MarcyNational Center for Environmental AssessmentOffice of Research and DevelopmentU.S. EPAAnchorage, AK 99513
Diane E. NacciNational Health and Environmental Effects
Research Laboratory Office of Research and Development U.S. EPA Narragansett, RI 02882
John NicholsNational Health and Environmental Effects
Research Laboratory Office of Research and Development U.S. EPA Duluth, MN 55804
Ruth PrinceWaste and Chemicals Management DivisionRegion 3U.S. EPAPhiladelphia, PA 19103-2029
Donald RodierOffice of Prevention, Pesticides, and
Toxic Substances U.S. EPA Washington, DC 20460
Glenn W. Suter IINational Center for Environmental
Assessment-Cin Office of Research and Development U.S. EPA Cincinnati, OH 45268
June 2003 viii DRAFT—DO NOT CITE OR QUOTE

LIST OF ABBREVIATIONS AND ACRONYMS
AhR aryl hydrocarbon receptor BAF bioaccumulation factor BSAF biota-sediment accumulation factor DOI U.S. Department of Interior EC effective concentration ED effective dose EPA U.S. Environmental Protection Agency EROD ethoxyresorufin-O-deethylase IPCS International Programme on Chemical Safety LD lethal dose NATO/CCMS North Atlantic Treaty Organization/Committee on the Challenges of
Modern Society PCBs polychlorinated biphenyls
PCB abbreviations: TCB tetrachlorinated biphenyl PeCB pentachlorinated biphenyl HxCB hexachlorinated biphenyl HpCB heptachlorinated biphenyl OCB octachlorinated biphenyl
PCDDs polychlorinated dibenzo-p-dioxins PCDD abbreviations: TCDD tetrachlorinated dibenzo-p-dioxin PeCDD pentachlorinated dibenzo-p-dioxin HxCDD hexachlorinated dibenzo-p-dioxin HpCDD heptachlorinated dibenzo-p-dioxin OCDD octachlorinated dibenzo-p-dioxin
PCDFs polychlorinated dibenzofurans PCDF abbreviations: TCDF tetrachlorinated dibenzofuran PeCDF pentachlorinated dibenzofuran HxCDF hexachlorinated dibenzofuran HpCDF heptachlorinated dibenzofuran OCDF octachlorinated dibenzofuran
June 2003 ix DRAFT—DO NOT CITE OR QUOTE

QSAR quantitative structure-activity relationship
ReP relative potency
RPF relative potency factor2,3,7,8-TCDD 2,3,7,8-tetrachlorodibenzo-p-dioxin
TEC toxicity equivalence concentration
TEF toxicity equivalence factorTEFs-NATO89 TEFs (sometimes also referred to as I-TEFs) adopted by the
NATO/CCMS TEFs-WHO94 TEFs published by the WHO-ECEH in 1994 TEFs-WHO98 TEFs published in 1998 developed at a WHO sponsored expert meeting WHO World Health Organization WHO-ECEH WHO European Centre for Environmental Health
June 2003 x DRAFT—DO NOT CITE OR QUOTE
123456789
10111213141516171819202122232425262728293031
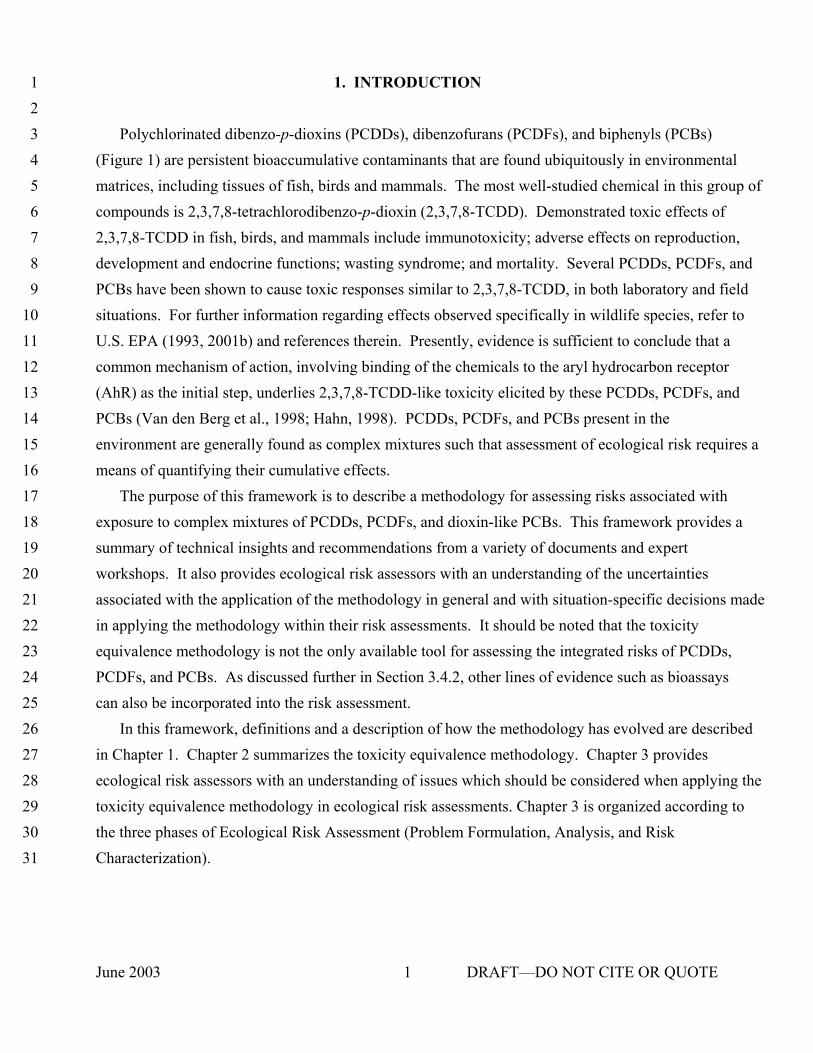
1. INTRODUCTION
Polychlorinated dibenzo-p-dioxins (PCDDs), dibenzofurans (PCDFs), and biphenyls (PCBs) (Figure 1) are persistent bioaccumulative contaminants that are found ubiquitously in environmental matrices, including tissues of fish, birds and mammals. The most well-studied chemical in this group of compounds is 2,3,7,8-tetrachlorodibenzo-p-dioxin (2,3,7,8-TCDD). Demonstrated toxic effects of 2,3,7,8-TCDD in fish, birds, and mammals include immunotoxicity; adverse effects on reproduction, development and endocrine functions; wasting syndrome; and mortality. Several PCDDs, PCDFs, and PCBs have been shown to cause toxic responses similar to 2,3,7,8-TCDD, in both laboratory and field situations. For further information regarding effects observed specifically in wildlife species, refer to U.S. EPA (1993, 2001b) and references therein. Presently, evidence is sufficient to conclude that a common mechanism of action, involving binding of the chemicals to the aryl hydrocarbon receptor (AhR) as the initial step, underlies 2,3,7,8-TCDD-like toxicity elicited by these PCDDs, PCDFs, and PCBs (Van den Berg et al., 1998; Hahn, 1998). PCDDs, PCDFs, and PCBs present in the environment are generally found as complex mixtures such that assessment of ecological risk requires a means of quantifying their cumulative effects.
The purpose of this framework is to describe a methodology for assessing risks associated with exposure to complex mixtures of PCDDs, PCDFs, and dioxin-like PCBs. This framework provides a summary of technical insights and recommendations from a variety of documents and expert workshops. It also provides ecological risk assessors with an understanding of the uncertainties associated with the application of the methodology in general and with situation-specific decisions made in applying the methodology within their risk assessments. It should be noted that the toxicity equivalence methodology is not the only available tool for assessing the integrated risks of PCDDs, PCDFs, and PCBs. As discussed further in Section 3.4.2, other lines of evidence such as bioassays can also be incorporated into the risk assessment.
In this framework, definitions and a description of how the methodology has evolved are described in Chapter 1. Chapter 2 summarizes the toxicity equivalence methodology. Chapter 3 provides ecological risk assessors with an understanding of issues which should be considered when applying the toxicity equivalence methodology in ecological risk assessments. Chapter 3 is organized according to the three phases of Ecological Risk Assessment (Problem Formulation, Analysis, and Risk Characterization).
June 2003 1 DRAFT—DO NOT CITE OR QUOTE

Figure 1. Chemical structure of PCDDs, PCDFs, and PCBs. Numbers byaromatic ring carbons of general structures represent potential chlorine substitutions.
June 2003 2 DRAFT—DO NOT CITE OR QUOTE
123456789
10111213141516171819202122232425262728293031323334
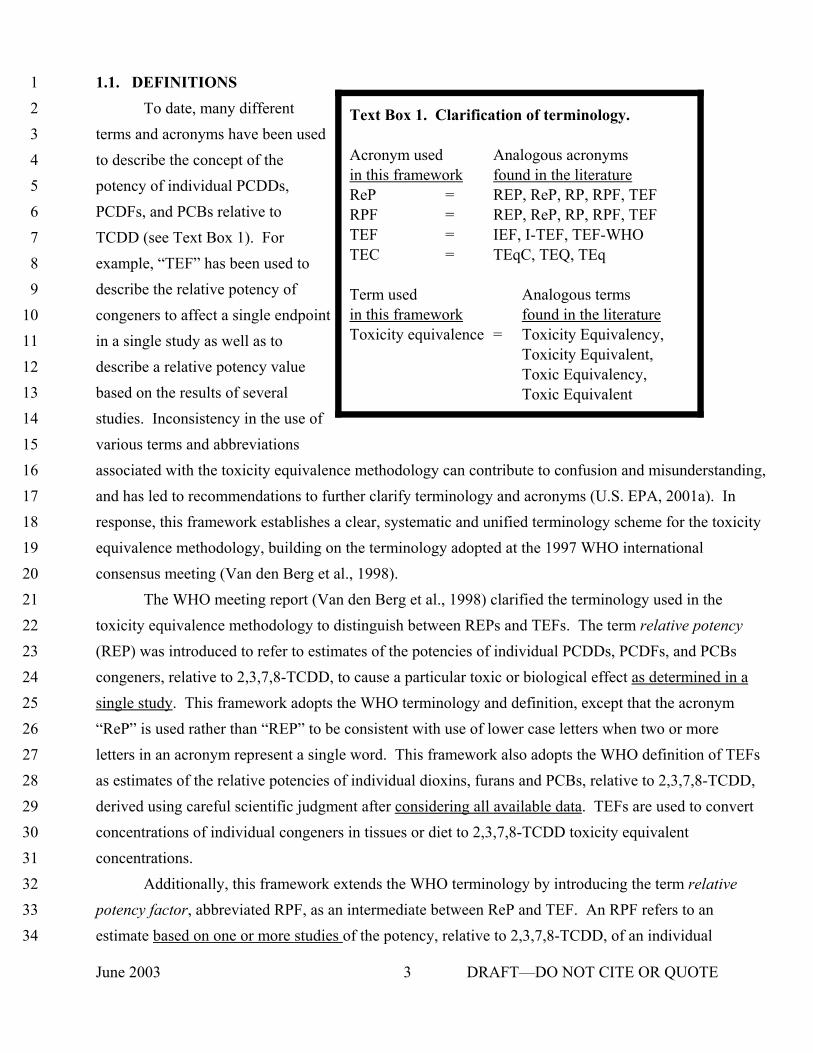
1.1. DEFINITIONS To date, many different Text Box 1. Clarification of terminology.
terms and acronyms have been used to describe the concept of the Acronym used Analogous acronyms
in this framework found in the literaturepotency of individual PCDDs, ReP = REP, ReP, RP, RPF, TEF PCDFs, and PCBs relative to RPF = REP, ReP, RP, RPF, TEF TCDD (see Text Box 1). For TEF = IEF, I-TEF, TEF-WHO
example, “TEF” has been used to TEC = TEqC, TEQ, TEq
describe the relative potency of Term used Analogous terms congeners to affect a single endpoint in this framework found in the literature
in a single study as well as to Toxicity equivalence = Toxicity Equivalency, Toxicity Equivalent,
describe a relative potency value Toxic Equivalency, based on the results of several Toxic Equivalent studies. Inconsistency in the use of various terms and abbreviations associated with the toxicity equivalence methodology can contribute to confusion and misunderstanding, and has led to recommendations to further clarify terminology and acronyms (U.S. EPA, 2001a). In response, this framework establishes a clear, systematic and unified terminology scheme for the toxicity equivalence methodology, building on the terminology adopted at the 1997 WHO international consensus meeting (Van den Berg et al., 1998).
The WHO meeting report (Van den Berg et al., 1998) clarified the terminology used in the toxicity equivalence methodology to distinguish between REPs and TEFs. The term relative potency (REP) was introduced to refer to estimates of the potencies of individual PCDDs, PCDFs, and PCBs congeners, relative to 2,3,7,8-TCDD, to cause a particular toxic or biological effect as determined in a single study. This framework adopts the WHO terminology and definition, except that the acronym “ReP” is used rather than “REP” to be consistent with use of lower case letters when two or more letters in an acronym represent a single word. This framework also adopts the WHO definition of TEFs as estimates of the relative potencies of individual dioxins, furans and PCBs, relative to 2,3,7,8-TCDD, derived using careful scientific judgment after considering all available data. TEFs are used to convert concentrations of individual congeners in tissues or diet to 2,3,7,8-TCDD toxicity equivalent concentrations.
Additionally, this framework extends the WHO terminology by introducing the term relative potency factor, abbreviated RPF, as an intermediate between ReP and TEF. An RPF refers to an estimate based on one or more studies of the potency, relative to 2,3,7,8-TCDD, of an individual
June 2003 3 DRAFT—DO NOT CITE OR QUOTE
123456789
10111213141516171819202122232425262728293031323334
chemical to cause aryl hydrocarbon receptor-mediated toxicity or biological effects. Hence, the term relative potency factor (RPF) is directly analogous to TEF, but an RPF is derived in the context of a specific risk assessment rather than by international expert consensus. It is hoped that adoption of these more logically consistent and grammatically correct terms will ultimately aid in understanding and use of the methodology. In summary, this framework employs the following definitions:
ReP - Relative Potency. Estimate based on a single study of the potency, relative to 2,3,7,8-TCDD, of an individual chemical to cause a particular aryl hydrocarbon receptor-mediated toxicity or biological effect in an individual organism, cellular, or biochemical assay.
RPF - Relative Potency Factor. Estimate based on one or more studies of the potency, relative to 2,3,7,8-TCDD, of an individual chemical to cause aryl hydrocarbon receptor-mediated toxicity or biological effects. The ReP data base used to derive an RPF for a chemical may include multiple endpoints, species, and in vitro or in vivo studies. RPFs may be used as alternatives to TEFs when more specific data for the species, endpoint, and site conditions are judged to improve the accuracy of the risk assessment.
TEF - Toxicity Equivalence Factor. Estimate of the potency, relative to 2,3,7,8-TCDD, of an individual polychlorinated dibenzo-p-dioxin, dibenzofuran or biphenyl congener, using careful scientific judgment after considering all available relative potency data. EPA presently applies this term only to TEFs derived through an international scientific consensus-building process supported by the World Health Organization (Van den Berg et al., 1998).
1.2. EVOLUTION OF THE TOXICITY EQUIVALENCE METHODOLOGY In the 1970s and 1980s, human health risk assessments of complex mixtures of PCDDs and
PCDFs were generally performed including only 2,3,7,8-TCDD or assuming that all congeners were equally potent to 2,3,7,8-TCDD (U.S. EPA, 1987, 1989). A review of the scientific information currently available clearly demonstrates that both of these assumptions were inaccurate. While many PCDD and PCDF congeners act through a common mechanism of action (binding and activation of the
June 2003 4 DRAFT—DO NOT CITE OR QUOTE

123456789
10111213141516171819202122232425262728293031323334
Ah receptor) and induce similar biochemical and toxicological effects, the relative potency of individual congeners to induce such effects has been shown to vary.
The first use of a toxicity equivalence-like method for risk assessment purposes was described by Eadon et al. (1986) as a means to estimate potential human health risks associated with a PCB transformer fire in Binghamton, New York. In an examination of the initial human health risk assessment methodologies designed to address the emission of dioxins and furans from waste incinerators, EPA also concluded that toxicity equivalence factors (TEFs) were the best available interim scientific policy for dealing with complex mixtures of these contaminants. Hence, in 1987, EPA adopted an interim procedure, based on TEFs, for estimating the hazard and dose-response of complex mixtures containing PCDDs and PCDFs in addition to 2,3,7,8-TCDD (U.S. EPA, 1987).
Following adoption of the toxicity equivalence methodology in the United States and Canada, the North Atlantic Treaty Organization Committee on the Challenges of Modern Society (NATO/CCMS) examined the methodology and concluded that it was the best available interim method for PCDD/PCDF human health risk assessment (NATO, 1988a, b). The TEFs proposed for the different congeners were refined by the NATO/CCMS based on inclusion of more recent data sets, resulting in a greater number of the TEFs being based on toxicity observed in vivo. The NATO/CCMS panel assigned TEFs to OCDD and OCDF, and removed TEFs for all congeners lacking chlorine in the 2,3,7,8-positions. Although it was indicated that, theoretically, it may be possible to detect nearly all of the 210 PCDD/PCDF isomers in the environment, only the seventeen 2,3,7,8-substituted congeners were known to bioaccumulate (Table 1). EPA officially adopted the revised TEFs in 1989 (TEFs-NATO89), with the caveat that the methodology remain interim and continued revisions be made (U.S. EPA, 1989; Kutz et al., 1990). The use of the toxicity equivalence methodology for human health risk assessment and risk management purposes has since been formally adopted by a number of other countries (e.g., Canada, Germany, Italy, the Netherlands, Sweden, and the United Kingdom) (Yrjänheiki, 1992).
During the initial development of the toxicity equivalence methodology for PCDDs/PCDFs, a number of researchers were also examining the structure-activity relationships for PCBs (Safe, 1990, 1994). These studies revealed that only PCB congeners substituted in the meta and para positions were approximate stereoisomers of 2,3,7,8-TCDD and induced dioxin-like biochemical and toxicological effects (Leece et al., 1985). In 1991, EPA convened a workshop to consider TEFs for PCBs (Barnes et al., 1991; U.S. EPA, 1991). From the workshop it was concluded that a small subset of the PCBs displayed dioxin-like activity and met the criteria for inclusion in the methodology. It was also noted that the PCBs not included in the toxicity equivalence methodology (i.e., the non-dioxin-like PCBs) are not a single class of
June 2003 5 DRAFT—DO NOT CITE OR QUOTE

5
10
15
20
25
30
1 Table 1. Number of polychlorinated dioxin, furan, and biphenyl congeners 2
3
4 Dioxins (PCDDs)
6
7
8
Furans (PCDFs) 135 10
Biphenyls (PCBs) 209 12
Chemical Class Number of Congeners
Dioxin-like Congeners
75 7
9 chemicals and have multiple toxicities with separate structure-activity relationships (Barnes et al., 1991). In the years since initial adoption of the toxicity equivalence methodology, additional data have
11 accumulated on the toxicological potency of individual PCDDs, PCDFs, and PCBs relative to 2,3,7,8-12 TCDD. To harmonize toxicity equivalence methodologies for dioxin-like compounds, a joint project 13 conducted by the World Health Organization European Centre for Environmental Health (WHO-14 ECEH) and the International Programme on Chemical Safety (IPCS) resulted in development of a
database consisting of all available relevant toxicological data for dioxin-like compounds available 16 through 1993. Following a review of almost 1,200 peer-reviewed publications, 146 were selected and 17 analyzed in deriving TEFs for PCBs (TEFs-WHO94). Based on the reported results for 14 different 18 biological and toxicological parameters, from a total of 60 articles, a panel of experts from eight 19 different countries recommended interim TEFs for 13 dioxin-like PCBs (Ahlborg et al., 1994).
Application of this methodology in human health risk assessment was reaffirmed in EPA’s Dioxin 21 Reassessment (U.S. EPA, 2000a). 22 At a second WHO-ECEH consultation in 1997, the TEFs for PCDDs, PCDFs, and PCBs 23 were reviewed and the toxicity equivalence methodology expanded, based on availability of additional 24 data, to include class-specific TEFs for mammals, birds and fish. TEFs for seven PCDD, 10 PCDF and
12 PCB congeners for mammals, birds and fish (TEFs-WHO98; Table 2) were included in the resulting 26 report (Van den Berg et al., 1998). It should be noted that (as with the previous WHO TEFs) the 27 species and endpoints examined for assignment of TEFs varied among individual congeners. The 28 report also provides greater documentation on how the expert panel selected studies for consideration, 29 derived relative potency factors from individual studies, and developed TEFs from the existing
database. Although a number of uncertainties associated with the toxicity equivalence methodology 31 have been identified (Van den Berg et al., 1998), it was the decision of the 1997 WHO expert meeting 32 that an additive toxicity equivalence
June 2003 6 DRAFT—DO NOT CITE OR QUOTE
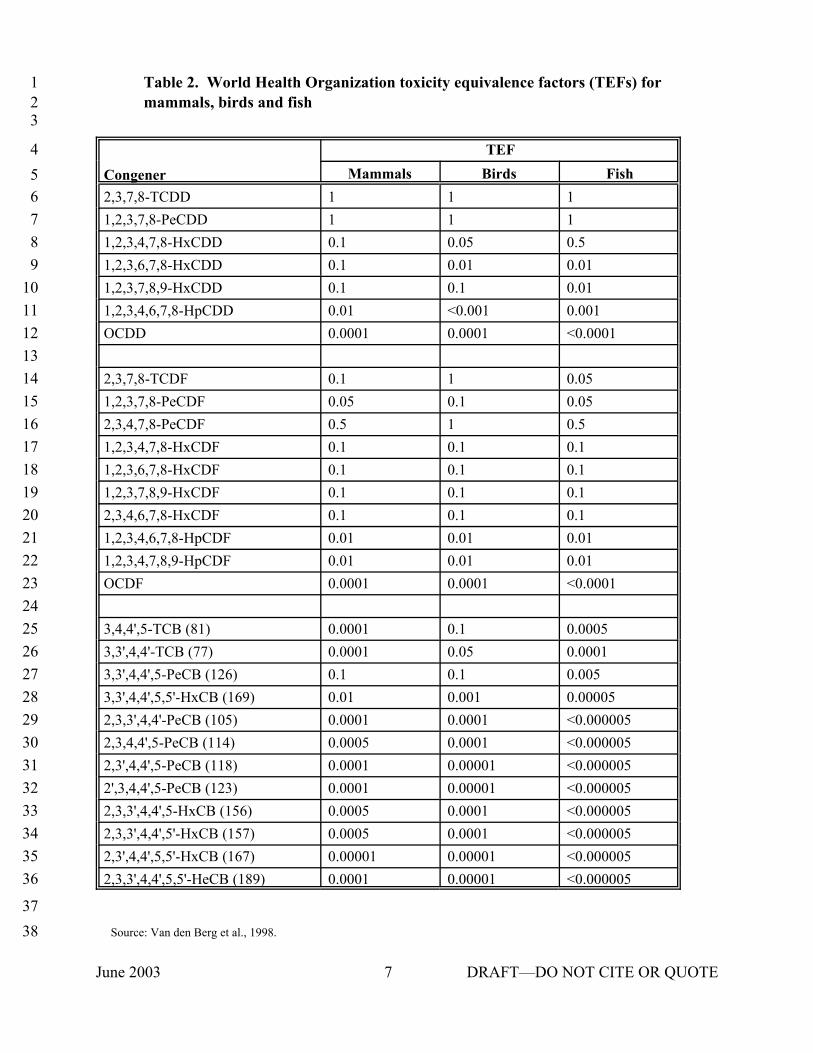
1 Table 2. World Health Organization toxicity equivalence factors (TEFs) for
3 2 mammals, birds and fish
4
5 Congener
TEF Mammals Birds Fish
6 7 8 9
10 11 12 13 14 15 16 17 18 19 20 21 22 23 24 25 26 27 28 29 30 31 32 33 34 35
0.5 0.01 0.01 0.001 <0.0001
0.05 0.05 0.5 0.1 0.1 0.1 0.1 0.01 0.01 <0.0001
0.0005 0.0001 0.005 0.00005 <0.000005 <0.000005 <0.000005 <0.000005 <0.000005 <0.000005 <0.000005
2,3,3',4,4',5,5'-HeCB (189) 0.0001 0.00001 <0.000005
1 1
2,3,7,8-TCDD 1 1,2,3,7,8-PeCDD 1 1,2,3,4,7,8-HxCDD 0.1 0.05 1,2,3,6,7,8-HxCDD 0.1 0.01 1,2,3,7,8,9-HxCDD 0.1 0.1 1,2,3,4,6,7,8-HpCDD 0.01 <0.001 OCDD 0.0001 0.0001
2,3,7,8-TCDF 0.1 1 1,2,3,7,8-PeCDF 0.05 0.1 2,3,4,7,8-PeCDF 0.5 1 1,2,3,4,7,8-HxCDF 0.1 0.1 1,2,3,6,7,8-HxCDF 0.1 0.1 1,2,3,7,8,9-HxCDF 0.1 0.1 2,3,4,6,7,8-HxCDF 0.1 0.1 1,2,3,4,6,7,8-HpCDF 0.01 0.01 1,2,3,4,7,8,9-HpCDF 0.01 0.01 OCDF 0.0001 0.0001
3,4,4',5-TCB (81) 0.0001 0.1 3,3',4,4'-TCB (77) 0.0001 0.05 3,3',4,4',5-PeCB (126) 0.1 0.1 3,3',4,4',5,5'-HxCB (169) 0.01 0.001 2,3,3',4,4'-PeCB (105) 0.0001 0.0001 2,3,4,4',5-PeCB (114) 0.0005 0.0001 2,3',4,4',5-PeCB (118) 0.0001 0.00001 2',3,4,4',5-PeCB (123) 0.0001 0.00001 2,3,3',4,4',5-HxCB (156) 0.0005 0.0001 2,3,3',4,4',5'-HxCB (157) 0.0005 0.0001 2,3',4,4',5,5'-HxCB (167) 0.00001 0.00001
1 1
36
37 38 Source: Van den Berg et al., 1998.
June 2003 7 DRAFT—DO NOT CITE OR QUOTE
1
2
3
4
5
6
7
8
9
10
11
12
13
14
15
16
17
18
19
20
21
22
23
24
25
26
27
methodology remained the most appropriate risk assessment method for complex mixtures of dioxin-
like PCDDs, PCDFs, and PCBs.
In 1998, EPA and DOI sponsored a meeting entitled: “Workshop on the Application of
2,3,7,8-TCDD Toxicity Equivalency Factors to Fish and Wildlife.” The major objective of the
workshop was to address uncertainties associated with the use of the toxicity equivalence methodology
in ecological risk assessment. Thirty-one experts from academia, government, industry, and
environmental groups participated in the workshop. General conclusions regarding application of the
toxicity equivalence methodology in ecological risk assessment included:
C The toxicity equivalence methodology is technically appropriate for evaluating risks to fish, birds,
and mammals associated with AhR agonists and it can support risk analyses beyond screening-level
assessments.
C The methodology entails less uncertainty and is less likely to underestimate risks than are methods
based on single compounds. Specifically, because the methodology takes into account the possible
effects of the suite of dioxin-like chemicals found in complex environmental mixtures, it is less likely
to underestimate risk than methods based on only one of these chemicals (i.e., 2,3,7,8-TCDD).
Further, because total PCBs in the environment can be comprised of many compounds that vary in
concentration and potency as AhR agonists, the toxicity equivalence methodology provides a
means for accounting for their variable potency.
C The uncertainties associated with using the methodology are not thought to be larger than other
sources of uncertainty within the ecological risk assessment process (e.g., dose-response
assessment, exposure assessment, and risk characterization).
For a thorough understanding of the technical issues discussed and conclusions drawn from the
EPA/DOI workshop, refer to U.S. EPA (2001a).
June 2003 8 DRAFT—DO NOT CITE OR QUOTE

1
2
3
4
5
6
789
1011121314151617
18
19
20
21
22
23
24
25
262728
29
30
31
32
33
34
2. THE TOXICITY EQUIVALENCE METHODOLOGY
The toxicity equivalence methodology is a tool for assessing the cumulative toxicity of a
complex mixture of dioxin-like PCDDs, PCDFs, and PCBs. To apply the methodology to such a
mixture, the following steps are needed for each dioxin-like compound in the mixture:
C Verification that the chemical is known to act through the AhR mechanism of action.
C Review of potency estimates relative to 2,3,7,8-TCDD based on in vivo or in vitro studies.
C Selection of an appropriate relative potency estimate if multiple estimates are available.
C Measurement or prediction of concentrations in the appropriate tissues or diet of each species at risk.
C Application of the relative potency estimates to calculate a toxicity equivalence concentration.
Extensive research efforts and numerous expert workshops have resulted in the verification that
certain PCDDs, PCDFs, and PCBs act by the AhR mechanism of action and the derivation of relative
potency estimates for these chemicals. These efforts are summarized and references are provided in
sections 1.2 and 2.1 of this document. The selection of the appropriate relative potency estimates and
the calculation of a TEC are required for each ecological risk assessment that uses the toxicity
equivalence methodology. These activities are summarized in sections 2.2 and 2.3 and discussed
further in Chapter 3.
2.1. Ah RECEPTOR MEDIATED MECHANISM AND ASSIGNMENT OF RELATIVE POTENCY
Inherent in the toxicity equivalence methodology are the assumptions that individual dioxin-like
congeners act via the same AhR-mediated mechanism and that their combined effects are additive. The
general basis for the methodology is the observation that the AhR mediates most if not all biological and
toxic effects induced by dioxin-like chemicals (Safe, 1990; Okey et al., 1994; Birnbaum, 1994;
Hankinson, 1995). For a compound to generate the wide variety of toxic effects caused by dioxin-like
halogenated aromatic hydrocarbons, it must be able to bind to the AhR (Sewall and Lucier, 1995;
June 2003 9 DRAFT—DO NOT CITE OR QUOTE

1
2
3
4
5
6
7
8
9
10
11
12
13
14
15
16
17
18
19
20
21
22
23
24
25
26
27
28
29
30
DeVito and Birnbaum, 1995). It should be noted that just because a compound can bind to the AhR,
however, that does not necessarily mean that the chemical is able to “activate” all of the processes
which underlie the development of toxic effects in an organism. Hence, none of the current WHO-
TEFs are based on AhR binding alone.
The scientific defensibility of the second assumption – that the combined effects of dioxin-like
congeners are additive – has been raised since the onset of the use of TEFs. Arguments challenging this
assumption include the presence of competing agonists or antagonists in various complex mixtures from
environmental sources, interactions based on non-dioxin-like activities (inhibition or synergy), and the
fact that dose-response curves for various effects may not be parallel for all chemicals assigned TEFs.
Despite these concerns, empirical data support the use of the additivity concept. A substantial effort
has been made to test the assumptions of additivity and the ability of the toxicity equivalence
methodology to predict the effects of mixtures of dioxin-like chemicals. These efforts have focused on
environmental, commercial, and laboratory derived mixtures. For a comprehensive review of the
studies supporting the assumptions that form the basis for the toxicity equivalence methodology refer to
U.S. EPA, 2000a (Part II, Chapter 9).
Several criteria have been developed that are deemed requisite for including a compound in the
toxicity equivalence methodology. These criteria were first employed in assigning TEFs for PCBs
(Ahlborg, 1994) and were affirmed in the process of assigning taxonomic class-specific TEFs (Van den
Berg et al., 1998). The criteria are:
C Structural similarity to 2,3,7,8-TCDD.
C Demonstrated binding to the AhR.
C Demonstrated ability to elicit AhR-mediated toxic or biochemical effect.
C Persistence and bioaccumulation in the food chain.
It is important to recognize that not all of the possible PCDDs, PCDFs, and PCBs meet these
criteria. For example, those PCBs with dioxin-like activity (i.e., bind the AhR; produce dioxin-like
responses) are restricted to the non- and mono-ortho substituted coplanar congeners (Figure 1). Using
the inclusion criteria listed above, the WHO developed a toxicity equivalence factor scheme (TEFs-
WHO98) that includes seven PCDD, 10 PCDF and 12 PCB congeners (Table 2).
June 2003 10 DRAFT—DO NOT CITE OR QUOTE
1
2
3
4
5
6
7
8
9
10
11
12
13
14
15
16
17
18
19
20
21
22
23
24
25
26
27
28
29
30
31
The toxicity equivalence methodology applies only to dioxin-like PCBs. Other PCBs,
sometimes referred to as “non-dioxin-like PCBs,” are not a single class of compounds and may have an
additional spectrum of toxicological properties that are not accounted for in the toxicity equivalence
methodology. Although current evidence indicates that the greatest potential for effects on endpoints of
most concern for ecological receptors (e.g., growth, survival, reproduction) from exposure to PCB
mixtures is from the dioxin-like congeners (Giesy and Kannan, 1998; Rice et al., 2002), risk estimates
based solely on the 12 dioxin-like PCBs may underestimate the total PCB risk. Hence, because PCB
mixtures contain both dioxin-like and non-dioxin-like congeners, assessing ecological risks posed by
both types of congeners may be warranted. A dual analysis of risks based on total PCBs and on
toxicity equivalence for dioxin-like PCBs is an approach that may be taken to assess PCB mixtures
(Beltman et al., 1997; Brunstrom and Halldin, 2000; Finley et al., 1997; Giesy and Kannan, 1998;
note, however, that these examples do not incorporate the 1998 taxa-specific WHO TEFs). EPA
currently recommends this combined approach for assessing PCB cancer risks to humans (U.S. EPA,
1996). As more information becomes available about the toxicity mechanisms and relative potency of
specific non-dioxin-like PCB congeners, alternative methods for assessing their risk will likely emerge.
In addition to the PCDDs, PCDFs, and PCBs that are the subject of this framework, a wide
variety of structurally diverse anthropogenic chemicals are capable of interacting with the AhR. These
chemicals also have a broad range of potencies at inducing dioxin-like effects in experimental systems.
Other compounds that bind and activate the AhR include industrial chemicals (e.g., polyhalogenated
biphenyls, halogenated naphthalenes, chlorinated paraffins), pesticides (e.g., hexachlorobenzene),
combustion products (e.g., unsubstituted polycyclic aromatic hydrocarbons (PAHs)), and flame
retardants (e.g., brominated dioxins, dibenzofurans, biphenyls, diphenyl ethers and naphthalenes). The
WHO working group concluded that “at present, insufficient environmental and toxicological data are
available to establish a TEF value” for these other compounds (Van den Berg et al., 1998).
Conceptually, a methodology based on toxicity equivalence (or relative potency factors) can be
applied to other chemicals that share a common mechanism of toxicity and to which aggregate exposure
may occur. For example, EPA has recently issued guidance on assessing cumulative health risks of
pesticides that have a common mechanism of action, which is based on the toxicity equivalence concept
(U.S. EPA, 2002). To date, examples of applying toxicity equivalence to chemicals other than those
that interact with the AhR in ecological risk assessment has been more limited. The government of
Canada has recently used a toxicity equivalence approach in assessing certain nonylphenol ethoxylates
June 2003 11 DRAFT—DO NOT CITE OR QUOTE
1
2
3
4
5
6
7
8
9
10
11
12
13
14
15
16
17
18
19
20
21
22
23
24
25
26
27
28
29
30
(Environment Canada and Health Canada, 2001). Toxicity equivalence and common mechanism of
action also provide the foundation for recent efforts to develop water quality values for mixtures of type
I narcotic chemicals in general and PAHs in particular (DiToro, 2000a, b). Many of the principles
described in this framework may be applicable to other chemical mixtures, but risk assessors should
take care in deciding whether a relative potency factor approach is appropriate for their mixture of
concern (U.S. EPA, 2000b).
2.2. SELECTION OF THE APPROPRIATE POTENCY FACTORS
One of the most important considerations to be made when applying the toxicity equivalence
methodology is the decision regarding what relative potency value to use for each chemical. One
approach is to use the WHO consensus toxicity equivalence factor (TEF). Alternatively, relative
potency (ReP) data from a single study or from multiple relevant studies may be selected as the basis
for a relative potency factor (RPF) to be used in lieu of a TEF. A clear understanding of the difference
between RePs, RPFs and TEFs is critical for making this decision and is thus described here. The
issues to consider when selecting an estimate are described in Section 3.3.2 of this framework.
The relative potency of a congener may be determined from a variety of effect concentrations;
for example, ECx, EDx LDx, NOAEL, LOAEL, benchmark dose, or entire dose-response curves have
all been used. To date, RePs have most commonly been determined as the EC50, ED50 or LD50 of
2,3,7,8-TCDD divided by the EC50, ED50 or LD50 of the individual congener. RePs have been derived
from in vitro and in vivo studies and include endpoints ranging from biochemical changes (e.g.,
CYP1A induction) to mortality. An RPF may be derived from a data base of ReP values that includes
multiple endpoints, species, and in vitro or in vivo studies. RPFs may be derived and used as
alternatives to TEFs when more specific data for the species, endpoint, and site conditions are judged
to improve the accuracy of a risk assessment. An RPF may also be derived and used for chemicals not
currently assigned a TEF by the WHO, but for which data are judged sufficient to include in an
assessment of AhR-mediated risks.
The TEFs-WHO98 values (Table 2) were determined based on the consensus judgment of the
experts present at the WHO workshop (Van den Berg et al., 1998). These TEFs are considered order
to half-order estimates of the potency of the various congeners based on the fact that the final TEF
values were rounded up or down to the nearest half-order of magnitude. A summary, through 1996, of
June 2003 12 DRAFT—DO NOT CITE OR QUOTE
1
2
3
4
5
6
7
8
9
10
11
12
13
14
15
16
17
18
19
20
21
22
23
24
available relative potency factors can be found in the Karolinska Institute database.1 Additional relative
potency factors have been reported in the literature since 1996 and it is expected that more will be
available in the future.
2.3. TOXICITY EQUIVALENCE CONCENTRATION
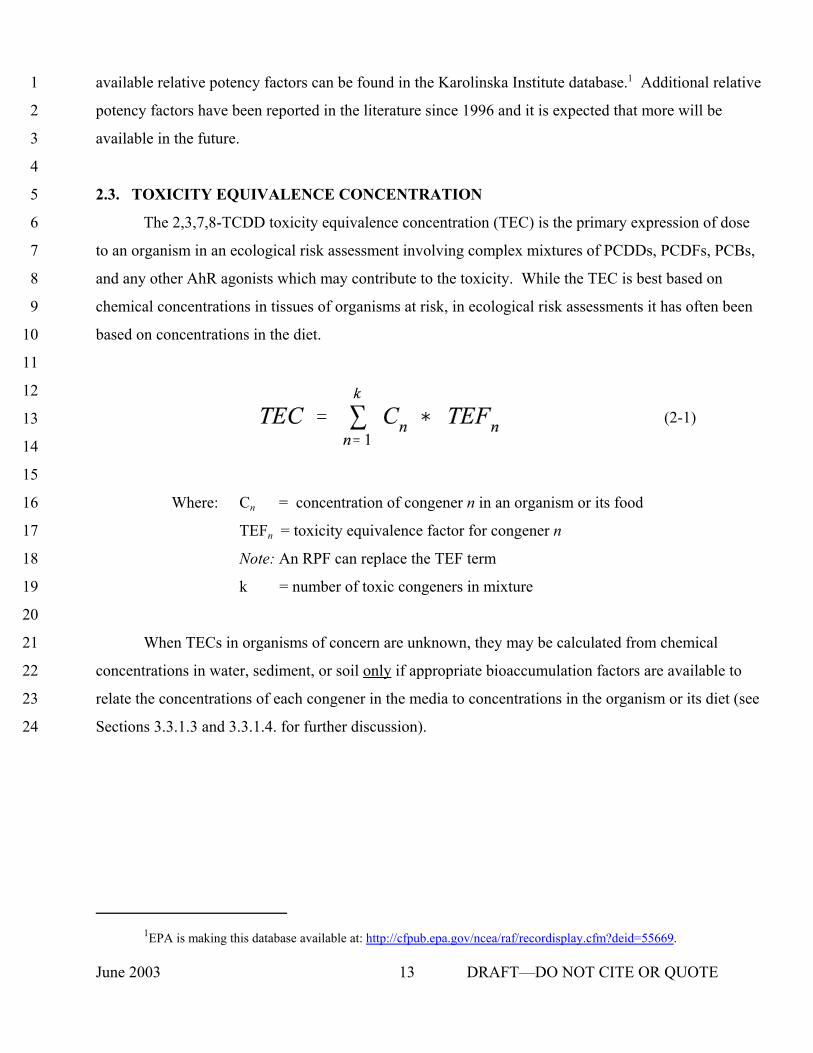
The 2,3,7,8-TCDD toxicity equivalence concentration (TEC) is the primary expression of dose
to an organism in an ecological risk assessment involving complex mixtures of PCDDs, PCDFs, PCBs,
and any other AhR agonists which may contribute to the toxicity. hile the TEC is best based on
chemical concentrations in tissues of organisms at risk, in ecological risk assessments it has often been
based on concentrations in the diet.
(2-1)
Where: Cn = n in an organism or its food
TEFn = toxicity equivalence factor for congener n
Note: An RPF can replace the TEF term
k ber of toxic congeners in mixture
When TECs in organisms of concern are unknown, they may be calculated from chemical
concentrations in water, sediment, or soil only if appropriate bioaccumulation factors are available to
relate the concentrations of each congener in the media to concentrations in the organism or its diet (see
Sections 3.3.1.3 and 3.3.1.4. for further discussion).
W
concentration of congener
= num
1EPA is making this database available at: http://cfpub.epa.gov/ncea/raf/recordisplay.cfm?deid=55669.
June 2003 13 DRAFT—DO NOT CITE OR QUOTE
1
2
3
4
5
6
7
8
9
10
11
12
13
14
15
16
17
18
19
20
21
22
23
24
25
26
27
28
29
30
31
3. APPLICATION OF THE TOXICITY EQUIVALENCE METHODOLOGY
IN ECOLOGICAL RISK ASSESSMENT
In this framework, application of the toxicity equivalence methodology is presented in the
context of each phase of the ecological risk assessment paradigm: planning, problem formulation,
analysis, and risk characterization (see Figure 2). Note that this framework focuses on providing
specific information necessary for applying the toxicity equivalence methodology within an ecological
risk assessment involving PCDDs, PCDFs, and PCBs, but does not discuss the many other aspects
necessary for conducting such a risk assessment. Issues beyond the toxicity equivalence methodology
that are pertinent to problem formulation, analysis (i.e., characterization of exposure and effects) and
risk characterization for dioxin-like chemicals have been described in depth previously (U.S. EPA,
1993; 1995b, c; 2000a; 2001d). Risk assessors are referred to such publications to address broader
issues associated with conducting a risk assessment involving PCDDs, PCDFs, and PCBs.
3.1. CONSIDERATIONS IN PLANNING
Under EPA’s Guidelines for Ecological Risk Assessment (U.S. EPA, 1998), the problem
formulation phase of a risk assessment is preceded by a dialogue among risk managers, risk assessors,
and other interested parties. During this planning phase, risk managers and risk assessors develop
management goals and identify the size and scope of the ecological risk assessment that is needed to
support the risk management decision.
The planning phase represents an important opportunity for the risk assessor and risk manager
to discuss the toxicity equivalence methodology if the risk manager is not familiar with its application in
ecological risk assessment. It is important for risk managers to understand that the methodology is well
accepted in the scientific community, in the international risk assessment community and within EPA for
human health risk assessment (U.S. EPA, 2000a). As stated earlier, the toxicity equivalence
methodology was examined at the EPA/DOI workshop (U.S. EPA, 2001a) and found to be an
appropriate and preferable method for supporting the evaluation of mixtures of PCDDs, PCDFs, and
PCBs. Use of the toxicity equivalence methodology results in more precise characterization of AhR
mediated stressors and their potential effects in ecological receptors. Consequently, risk managers may
better formulate risk management strategies and evaluate risk management alternatives to mediate the
effects of such stressors.
June 2003 14 DRAFT—DO NOT CITE OR QUOTE

1
2
3
4
5
6
7
8
9
10
11
12
13
14
15
16
17
18
19
20
21
22
23
24
25
26
27
Ecological risk assessments range from very simple to complex and demanding (U.S. EPA,
1998). Application of the toxicity equivalence methodology is technically appropriate to support
ecological risk assessments at various tiers or levels of complexity when underlying assumptions are
valid for a given assessment scenario (U.S. EPA, 2001a). As with any method, the ecological risk
assessor should understand and verify that assumptions inherent in applying the toxicity equivalence
methodology are valid for the specific situation to which the methodology is being applied (e.g., the
chemicals of concern are “dioxin-like” PCDDs, PCDFs, and PCBs; congener-specific exposure data
are available). Inherent assumptions of the toxicity equivalence methodology are summarized in
Chapter 2 and supporting experimental data are discussed at length elsewhere (Van den Berg et al.,
1998; U.S. EPA, 2000a; 2001a).
In addition to being applicable to risk assessments of different levels of complexity, the toxicity
equivalence methodology can be applied to both assessments that evaluate the likelihood that effects
were caused by past exposure to stressors (retrospective assessments), and assessments that predict
the likelihood of future adverse effects (prospective assessments). An example of the former is an
aquatic system where adverse effects have been observed in fish and fish-eating birds and mammals,
and the ecological risk assessor wishes to determine the degree to which existing sediment
contamination from dioxin-like compounds may be responsible. An example of the latter is the
evaluation of the potential impacts of an industrial facility anticipated to discharge dioxin and related
compounds into an aquatic system. In both examples, when coupled with techniques to estimate
dioxin-like PCDD, PCDF, and PCB fate, transport, and accumulation in living organisms, the toxicity
equivalence methodology could be used to estimate the cumulative toxicity of dioxin-like compounds to
species of concern. The EPA/DOI workshop report (U.S. EPA, 2001a) includes a detailed case
example for each type of ecological risk assessment.
The toxicity equivalence methodology is appropriate and applicable in ecological risk
assessments involving both aquatic and terrestrial systems (U.S. EPA, 2001a). Certain aspects related
to application of the methodology (e.g., bioaccumulation) have been better described and studied in
aquatic systems, but the same principles apply to terrestrial systems.
June 2003 15 DRAFT—DO NOT CITE OR QUOTE

Figure 2. The framework for ecological risk assessment (Source: U.S. EPA, 1998).
June 2003 16 DRAFT—DO NOT CITE OR QUOTE

1
2
3
4
5
6
7
8
9
10
11
12
13
14
15
16
17
18
19
20
21
22
23
24
25
26
27
28
29
30
31
3.2. CONSIDERATIONS IN PROBLEM FORMULATION
Problem formulation, which follows
planning, provides the foundation for the entire
risk assessment (U.S. EPA, 1998). During Text Box 2. Questions for planning problem formulation, preliminary hypotheses and problem formulation.
about why ecological effects have occurred, or Planning: may occur, as a consequence of exposure to T Is evaluation of “dioxin-like”
dioxin-like PCDDs, PCDFs, and PCBs are toxicity risks, using congener-specific PCDD, PCDF and PCB analysis,
generated and evaluated. Problem formulation necessary to meet risk management also involves selecting assessment endpoints objectives?
T Are the assumptions inherent inthat are relevant to risk management decisions applying the toxicity equivalence (section 3.2.1.), developing conceptual models methodology valid for the specific
that describe the key relationships between situation at hand?
dioxin-like PCDDs, PCDFs, and PCBs and Problem Formulation: assessment endpoints (section 3.2.2.), and T Assessment Endpoints - Has the
initial evaluation of ecological settingpreparing an analysis plan (section 3.2.3.). identified species that are both exposed
to and sensitive to “dioxin-like”
3.2.1. Assessment Endpoints toxicity? T Are the chemicals of concern dioxin-
Assessment endpoints are “explicit like PCDDs, PCDFs, and PCBs? expressions of the environmental values that are T Conceptual Model - Does the
conceptual model describe theto be protected, operationally defined as an relationship between sources, fate & ecological entity and its attributes” (U.S. EPA, transport, and bioaccumulation of
1998). Three principal criteria are used todioxin-like compounds and exposures to identified assessment endpoints?
select assessment endpoints: susceptibility to T Are congener-specific exposure data known or potential stressors, ecological available or obtainable?
relevance, and relevance to management goals.
Susceptibility involves two major factors:
sensitivity (how readily an organism is affected by these compounds) and exposure (the frequency,
duration, and intensity of contact between an organism and these compounds). This section considers
the unique characteristics and effects of dioxin-like PCDDs, PCDFs, and PCBs in identifying the
organisms and attributes that may be candidates for assessment endpoints under the first two criteria,
June 2003 17 DRAFT—DO NOT CITE OR QUOTE

1
2
3
4
5
6
7
8
9
10
11
12
13
14
15
16
17
18
19
20
21
22
23
24
25
26
27
28
29
30
31
susceptibility and ecological relevance. The third criterion, relevance to management goals, is not
discussed further as it relates to the values placed on different assessment endpoints rather than
particular characteristics of dioxin-like chemicals.
3.2.1.1. Susceptibility: Sensitivity
Because of the fundamental role played by the Ah receptor in toxicity caused by dioxin-like
chemicals, presence of the Ah receptor is an important indicator of an organism’s potential susceptibility
to toxicity from these chemicals. One or more forms of the Ah receptor have been identified in
numerous mammalian, avian and fish species (for a review see Hahn, 1998). Accordingly, dioxin-like
toxicity is clearly elicited by various PCDDs, PCDFs, and PCBs in a variety of mammals, birds and fish
(Peterson et al., 1993; U.S. EPA, 1993; 2001b). Homologs of the AhR have also been identified in
other classes of organisms, including one reptile, one amphibian and some invertebrate species (Hahn,
1998; Brown, et al., 1997). Mere presence of such homologs, however, is not sufficient to
demonstrate that an organism is sensitive to TCDD-induced toxicity. Effects data, described below, for
amphibians, reptiles and invertebrates are extremely limited and are observed at relatively high
concentrations. A summary of effects that have been observed in various animal species is presented in
Table 3.
Among reported toxicities that dioxin-like PCDDs, PCDFs, and PCBs can elicit, reproductive
and developmental effects are generally among the most sensitive endpoints in mammals, birds and fish.
Developmental effects are manifested in embryonic or early life stages and hence these life stages are
generally more sensitive than juvenile or adult stages in susceptible mammals, birds, and fish. In
addition to their sensitivity, reproductive and developmental effects are often considered among the
most relevant toxicity endpoints in ecological risk assessment based on the assumption that adverse
effects on these endpoints may lead to impacts on wildlife populations (U.S. EPA, 1993, 1995a).
The relative sensitivity to dioxin-like toxicity among species that possess the Ah receptor varies
greatly, even within taxonomic class. Inter-species differences in sensitivity exist even when considering
only developmental toxicity or mortality endpoints. A variety of mammals including laboratory rodents,
non-human primates, and mink have been shown to be sensitive to TCDD-induced reproductive and
developmental toxicity and prenatal or early life stage mortality, although it is often difficult to quantify
the cross-species range in sensitivity in mammals due to differences in exposure regimens. Recently,
administered doses have been converted to body burden concentrations to facilitate cross-species and
June 2003 18 DRAFT—DO NOT CITE OR QUOTE

1
2
3
4
5
6
7
8
9
10
11
12
13
14
15
16
17
18
19
20
21
22
23
24
25
26
27
28
29
30
31
cross-endpoint comparisons among mammals (U.S. EPA, 2000a). Following this conversion, lowest
observed adverse effect levels (LOAELs) for developmental and reproductive effects are quite similar
among rodents and monkeys, with an approximately 10-fold range in LOAELs (U.S. EPA, 2000a).
Although data for TCDD-induced reproductive and developmental toxicity are lacking for mammalian
wildlife species, mink are considered to be among the most sensitive mammals to dioxin-like toxicity on
the basis of studies with adult animals, PCBs and other than reproductive/developmental endpoints
(Hochstein, 1998; Aulerich, 1988; U.S. EPA, 2001b). The sensitivity of bird species tested to date to
TCDD-induced embryo mortality varies by about 200-fold, with the domestic chicken generally more
sensitive than wildlife species (Hoffman et al., 1996). Of purely aquatic species, fish are more sensitive
than other aquatic species. Among freshwater fish species sensitive to TCDD-induced early life stage
toxicity, sensitivity ranges approximately 50-fold, with salmonids being the most sensitive and zebrafish
the least sensitive species (Walker and Peterson, 1994; Henry et al., 1997; Elonen et al., 1998).
It should be noted that the relative sensitivity of animal classes is not constant across chemical
classes. For example, while fish are generally more sensitive to PCDDs and PCDFs relative to birds
and mammals, they are much less sensitive to mono-ortho-substituted PCBs. These differences in
species sensitivity to particular dioxin-like compounds may create differences in exposure susceptibility
associated with variations in the chemical mixture composition in food webs and demonstrates the utility
of congener-specific site characterization data during problem formulation.
Amphibians, reptiles and primitive fish (e.g., lamprey, hagfish) are relatively insensitive to
dioxin-like chemicals. Although Ah receptor homologs have been identified in amphibians and primitive
fish (Hahn, 1998), their toxicological significance is uncertain. Frogs and toads are at least 100- to
1000-fold less sensitive to 2,3,7,8-TCDD-induced early life stage mortality than fishes (Jung and
Walker, 1997; U.S. EPA, 1993). A very limited number of studies demonstrating that PCBs induce
dioxin-like biochemical effects (e.g., CYP1A induction) in a few frog and turtle species (Huang et al.,
1998; Yawetz et al., 1997) provide some evidence that the AhR-mediated toxicity pathway is
functional in amphibians and reptiles. Gutleb et al. (1999) have reported effects of PCBs on
development in two frog species, but it is unclear whether these effects are mediated via AhR. In
summary, data demonstrating dioxin-like effects in amphibians and reptiles are extremely limited and
effects are observed at relatively high concentrations.
It has been demonstrated that a wide variety of invertebrates including amphipods, cladocerans,
midges, mosquito larvae, sandworms, oligochaete worms, snails, clams, and grass shrimp are insensitive
June 2003 19 DRAFT—DO NOT CITE OR QUOTE
1
2
3
4
5
6
7
8
9
10
11
12
13
14
15
16
17
18
19
20
21
22
23
24
25
26
27
28
29
30
31
to 2,3,7,8-TCDD induced toxicity (West et al., 1997; Barber et al., 1998; Van Beneden et al., 1998;
see U.S. EPA, 1993 and 2001b for summaries and references prior to 1998). Likewise, dioxin-like
PCBs (e.g., congeners 77 and 118) are generally ineffective at causing effects on survival, growth and
reproduction in the cladoceran Daphnia magna and the purple sea urchin (U.S. EPA, 2001b). The
insensitivity of invertebrates to dioxin-like toxicity is consistent with the recent finding that several
invertebrate AhR homologs lack the ability to bind the prototypical AhR ligands, 2,3,7,8-TCDD and $
naphthoflavone (Butler et al., 2001).
Limited data indicate that freshwater plants likewise are relatively insensitive to 2,3,7,8-TCDD.
Despite significant accumulation of 2,3,7,8-TCDD in algae and duckweed (i.e., µg/g concentrations),
no adverse effects were observed (U.S. EPA, 1993).
Given the known differences in sensitivity among species and endpoints, risk assessors should
consider the uncertainty introduced when extrapolating from a species or endpoint for which sensitivity
has been established to a species or endpoint of unknown sensitivity. This uncertainty, which will affect
the choice of the threshold or action level to which the calculated TEC is compared (effects
characterization), should be handled in a manner similar to any other chemical for which interspecies
extrapolations need to be performed (e.g., consideration of taxonomic relatedness, application of
uncertainty factors, etc.).
3.2.1.2. Susceptibility: Exposure
Evaluation of the relative susceptibility of species on the basis of exposure is complicated by
three alternative expressions of exposure: (1) concentrations of PCDDs, PCDFs, and PCBs in water,
sediment, and diet associated with the species; (2) concentrations of PCDDs, PCDFs, and PCBs in the
whole body of the species; or (3) concentrations of PCDDs, PCDFs, and PCBs in specific tissues of
the species. As indicated in section 3.2.1.1., relative sensitivity of species is better measured on the
basis of concentrations of PCDDs, PCDFs, and PCBs in the whole body of the species than on an
external or administered dose. Thus, assessment endpoints should include species that are not only
sensitive on the basis of whole body dose, but are exposed through bioaccumulation of dioxin-like
PCDDs, PCDFs, and PCBs. Species with greatest bioaccumulation of dioxin-like compounds are
generally those located at higher trophic levels because these hydrophobic chemicals have a strong
potential for biomagnification (bioaccumulation to levels exceeding equilibrium with the organism’s
external environment).
June 2003 20 DRAFT—DO NOT CITE OR QUOTE

Table 3. Effects of TCDD and related compounds in different animal species
June 2003 21
DR
AFT—
DO
NO
T CITE O
R Q
UO
TE
Effect Fish Avian
wildlife Chicke
n Marine
mammals Mink Rabbit Guinea
Pig Rat Mouse Hamster Cow Monkey
Presence of AhR + + + + + + 0 + + + + +
Binding of TCDD:AhR Complex to the DRE (enhancer)
+ + + + +
Enzyme induction + + + + + + +
Acute lethality + + + + + + + +
Wasting syndrome + + + + + + +
Teratogenesis/fetaltoxicity, mortality
+ + + + +
Endocrine effects + + + + + + +
21Immunotoxicity + + + + + + + + +
Carcinogenicity + + +
Neurotoxicity + + + +
Chloracnegeniceffects
+ + + +
Porphyria + 0 + + 0 0
Hepatotoxicity + + + + + + +/- + + +/- + +
Edema + + 0 0 + + +
Testicular atrophy + +
Bone marrow hypoplasia
+ +/- +
+ + +
+ + + +
+ + + +
+ + + +
+ + + + + +
+
+
+ +
+
+ = observed.+/- = observed to limited extent, or +/- results.0 = not observed.Blank cells = no data.
1
2
3
4
5
6
7
8
9
10
11
12
13
14
15
16
17
18
19
20
21
22
23
24
25
26
27
28
29
30
31
Temporal and spatial differences in exposure can complicate selection of species with the
highest exposure and bioaccumulation. For example, although biomagnification causes birds and
mammals with contaminated fish diets to achieve greater concentrations in tissues than the fish,
movement of birds and mammals in and out of contaminated areas may result in greatly reduced
bioaccumulation. Since the ability to enhance elimination of dioxin-like chemicals (and thus reduce
bioaccumulation) through metabolism varies across species in a chemical specific manner, relative
differences in TECs for different species can depend on the PCDD, PCDF, PCB mixture composition
to which each species is exposed. Thus, selection of susceptible species should be specific to the
exposure conditions associated with each ecological risk assessment. EPA has previously identified
predaceous fish (lake trout) and piscivorous birds (belted kingfisher, herring gull, bald eagle) and
mammals (river otter, mink) as appropriate assessment endpoint species in regional (i.e., Great Lakes)
and national assessments of potential risks posed by 2,3,7,8-TCDD to aquatic life and associated
wildlife (U.S. EPA, 1993; 1995a,b).
PCDDs, PCDFs, and PCBs are nonpolar compounds that cannot be easily excreted unless
they are first transformed into polar compounds with the introduction of a polar functional group
through metabolism. These compounds do not biomagnify via the diet within invertebrate food chains
and are not metabolized at a significant rate by invertebrates. Therefore, invertebrate tissues tend to be
at equilibrium with water and sediments (Thomann, 1989; Gobas, 1993). PCDD, PCDF and PCB
concentrations in contaminated sediments often exceed values expected for equilibrium conditions with
surface waters. Thus, organisms whose food chains are linked to contaminated sediments through
benthic invertebrates will have greater exposures than those with food chains linked to surface water
through pelagic invertebrates.
Unlike invertebrates, vertebrates metabolize PCDDs, PCDFs, and to a limited extent some
PCBs. PCDDs and PCDFs that do not possess chlorines at all four 2, 3, 7, and 8 positions do not
bioaccumulate in vertebrates. Although metabolism of PCDDs and PCDFs with chlorine substitution at
the 2,3,7,and 8 positions (the most toxic congeners) occurs to a lesser extent than those without, it is
sufficient to significantly reduce bioaccumulation in comparison to PCBs with the same degree of
chlorination (Endicott and Cook, 1994). See Section 3.3.1 for discussion of bioaccumulation factors
and food chain models which are needed to account for competing mechanisms of biomagnification and
metabolism.
June 2003 22 DRAFT—DO NOT CITE OR QUOTE

1
2
3
4
5
6
7
8
9
10
11
12
13
14
15
16
17
18
19
20
21
22
23
24
25
26
27
28
29
30
31
3.2.1.3. Susceptibility: Integration of Sensitivity and Exposure Considerations
Susceptibilities related to species sensitivity and exposure are not independent. As explained in
section 3.2.1.2, species with the greatest dietary exposure do not always achieve the greatest
concentrations of PCDDs, PCDFs, and PCBs in the whole body because of inter-species differences
in biomagnification and metabolism. However, high species sensitivity combined with high
bioaccumulation potential will generally define species at greatest risk. Sensitivity and exposure can
also be opposing factors in determining susceptibility. For example, species with high exposure and
bioaccumulation potential for dioxin-like chemicals may be more vulnerable to toxicity than more
sensitive species experiencing less exposure and bioaccumulation.
Spatial and temporal gradients in environmental concentrations of PCDDs, PCDFs, and PCBs
can complicate determinations of species at greatest risk, especially when both species sensitivity and
population vulnerabilities are being considered. Timing of exposure with respect to timing of toxicity for
sensitive life stages may make a difference. Fish and bird embryos with maternal exposures which
occur outside areas of contamination are probably at greatly reduced risk of early life stage mortality
despite subsequent rearing in contaminated ecosystems.
Variations in dioxin-like chemical mixtures across sites can influence relative susceptibilities of
phyla. Sensitive fish species tend to be more vulnerable at sites with large PCDD and PCDF
concentrations, whereas birds and mammals are relatively more sensitive to PCBs. Even within sites,
differences in the PCDD, PCDF, PCB composition in food chains may influence which species are at
greatest risk. When overall susceptibility is unclear, determination of TECs and consequent levels of
risk for multiple species is advisable.
3.2.1.4. Ecological Relevance
EPA’s Guidelines for Ecological Risk Assessment define ecologically relevant assessment
endpoints as those that reflect important characteristics of an ecosystem and are functionally related to
other endpoints (U.S. EPA, 1998). Given the wide array of taxa and species that have been shown to
be sensitive to dioxin-like toxicity, it is likely that almost any ecological risk assessment scenario would
include “dioxin-sensitive” species that are critical to the function of the ecosystem and are functionally
related to other endpoints. For example, in any aquatic ecosystem, fishes would likely represent an
important guild of ecological receptors, either as valued individual species (e.g., keystone species) or as
a functional link between trophic levels within the foodweb (e.g., between benthic producer and
June 2003 23 DRAFT—DO NOT CITE OR QUOTE

1
2
3
4
5
6
7
8
9
10
11
12
13
14
15
16
17
18
19
20
21
22
23
24
25
26
27
28
29
30
31
piscivorous consumer trophic levels). Hence, fishes would represent both a sensitive and ecologically
relevant assessment endpoint in many, if not most, aquatic ecological risk assessment scenarios.
Ecological relevance is also linked to the nature and intensity of potential effects (U.S. EPA, 1998).
As summarized in Table 3, TCDD and related chemicals are known to cause reproductive toxicity,
developmental toxicity and mortality, among other effects in a wide variety of species. The nature of
these particular effects are ecologically significant, because they have the potential of leading to reduced
populations of fish, birds, and mammals. TCDD and related compounds are also particularly relevant
ecologically because they are among the most, if not the most, potent reproductive and developmental
toxicants known.
3.2.2. Conceptual Model
A conceptual model in problem formulation is a written description and visual representation of
predicted relationships between ecological entities and the stressors to which they may be exposed
(U.S. EPA, 1998). In the case of ecological risk assessments involving TCDD and related
compounds, a conceptual model might depict the hypothesized movement of these compounds from a
source into the environment; the subsequent exposure of ecological entities from media such as soils,
sediments or the water column; further exposure through the food web (bioaccumulation); and finally
the hypothesized direct and secondary ecological effects from these exposures. Figure 3 illustrates
exposure to these compounds through sediment and the water column and resulting exposure through
an aquatic food web. Addition of source and effects information to this figure (omitted for simplicity)
would make it a complete conceptual model representation.
The toxicity equivalence methodology fits well within such a conceptual model. The
methodology serves as a bridge between exposure and effects by accumulating exposures to a number
of different compounds into a single value (expressed as 2,3,7,8-TCDD equivalents). A hypothetical
model for exposure to PCDDs, PCDFs, and PCBs in sediments is illustrated in Figure 4, with areas of
application for the toxicity equivalence methodology noted. The items in the boxes making up the flow
diagram (left-side) represent the measured or calculated values that will be necessary to perform a
toxicity equivalence-based assessment. The items listed on the right-side of the diagram are pertinent
issues that should be considered in selecting or obtaining the values in the flow diagram. The elements of
Figure 4 are discussed in more detail in section 3.3.
June 2003 24 DRAFT—DO NOT CITE OR QUOTE
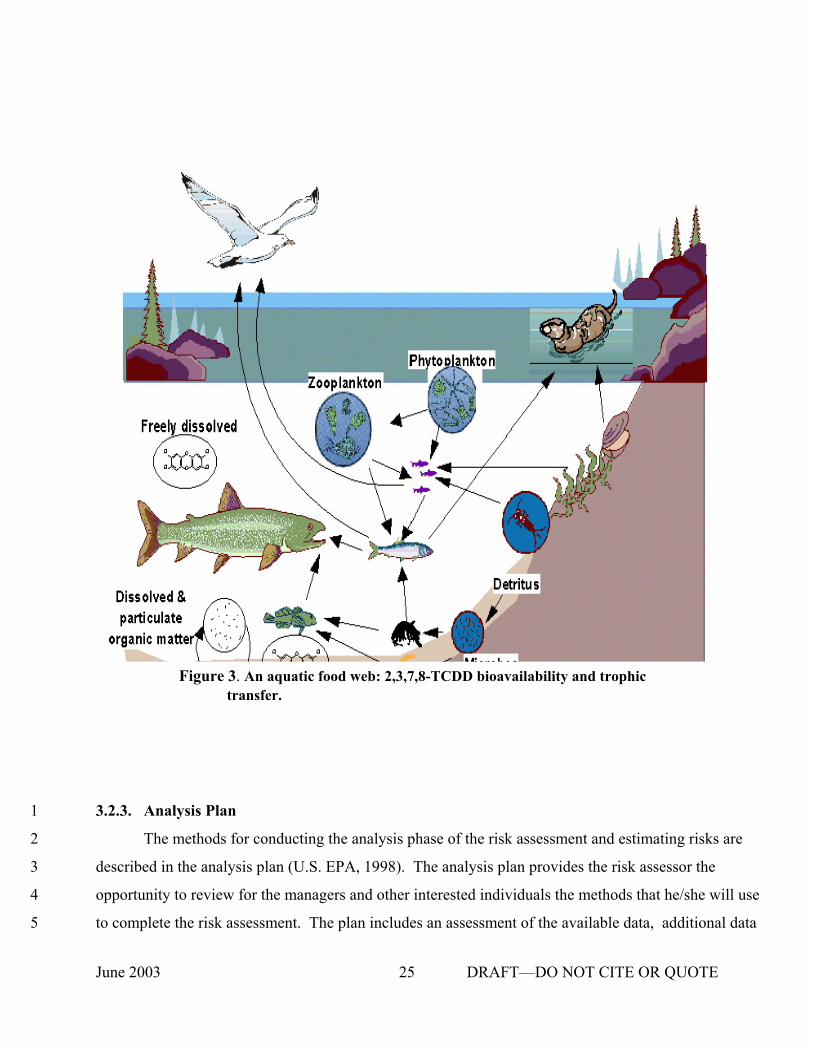
Figure 3. An aquatic food web: 2,3,7,8-TCDD bioavailability and trophic transfer.
1 3.2.3. Analysis Plan
2 The methods for conducting the analysis phase of the risk assessment and estimating risks are
3 described in the analysis plan (U.S. EPA, 1998). The analysis plan provides the risk assessor the
4 opportunity to review for the managers and other interested individuals the methods that he/she will use
5 to complete the risk assessment. The plan includes an assessment of the available data, additional data
June 2003 25 DRAFT—DO NOT CITE OR QUOTE

1
2
3
4
5
6
7
8
9
10
11
12
13
14
15
16
17
needs, the methods for collecting these data (including analytical methods), and the method for
estimating risks. The uncertainties associated with the data gaps are also described to provide the
decision makers with a means of determining the resources needed to complete the assessment or
realistic expectations about the likely outcome of the assessment.
In the application of toxicity equivalence methodology to risk assessment the analysis plan
should describe at a minimum the method(s) for:
1) Detection of PCDD, PCDF, and PCB congeners and how to account for non-detects.
2) Determination of theoretical or empirical measures of exposures.
3) Selection of consensus TEFs or assessment-specific RPFs.
4) Determination of theoretical or empirical measures of toxicity (field or laboratory studies).
5) Estimation of risk (e.g., quotient method).
6) Quantification or qualification of uncertainties.
The analysis plan should give those involved in the risk assessment a clear understanding of the
strengths and limitations of the methods as well as a clear and transparent description of the
assumptions inherent in any of the methods. Analysis methods related to the toxicity equivalence
methodology are described in more detail in section 3.3, Considerations in Analysis.
June 2003 26 DRAFT—DO NOT CITE OR QUOTE

Dose Metric-Specific Calculation of TEC
Administered Dose/Diet Tissue Concentration
Soil/Sediment/Water Congener Concentration
Soil/Sediment/Water Congener Concentration
BAF/BSAF
BAF/BSAF •Chemical Specific •Species Specific •Trophic Level Specific •Site Specific
Diet Congener Concentration
Diet TEC Tissue TEC
Tissue Congener Concentration
TCDD Dose-Response Tissue Concentration
TCDD Dose-Response Administered Dose
TCDD Dose-Response •Appropriate Species •Appropriate Endpoint •Appropriate Dose Metric
Ch aracterization of EffectsCharacterization of Effects
Charac teriza tion of ExposureCharacterization of Exposure
TEF/RPF
TEF/RPF •Chemical Specific •Species/Class Specific •Choice influenced by &
determines level of uncertainty
Risk CharacterizationRisk Characterization
Figure 4. Application of the toxicity equivalence methodology in ecological risk assessment for exposure to PCDDs, PCDFs, and PCBs.
1
2
June 2003 27 DRAFT—DO NOT CITE OR QUOTE

1
2
3
4
5
6
7
8
9
10
11
12
13
14
15
16
17
18
19
20
21
22
23
24
25
26
27
28
29
30
31
3.3. CONSIDERATIONS IN ANALYSIS
Analysis is a process that examines two
primary components of risk, exposure and Text Box 3. Questions for analysis. effects, and their relationships between each
other and ecosystem characteristics (U.S. EPA, T Have I selected appropriate analytical methods and data quality objectives for
1998). Important considerations for measuring individual congener characterizing exposure to PCDDs, PCDFs, and concentrations in the media of interest?
T Do I have environmental fate andPCBs are described in section 3.3.1. The transport information for the PCDDs, selection of TEFs or RPFs, which is an PCDFs, and PCBs known or believed to be
important link in connecting exposure and present? T Have I obtained bioaccumulation
effects, is described in section 3.3.2. Aspects of factors for individual PCDDs, PCDFs, and the characterization of effects relevant to the PCBs that are relevant to the assessment
endpoints?toxicity equivalence methodology are presented T Am I applying the relative potency in section 3.3.3. factors to the appropriate tissues or dietary
components? T Are the reasons for selection of TEFs or
3.3.1. Characterization of Exposure RPFs for the assessment clear and well-Characterization of exposure (U.S. supported?
T Are the effects of PCDDs, PCDFs, andEPA, 1998) includes a description of the actual PCBs in the receptors of interest or potential contact of a receptor with a stressor documented?
or co-occurring stressors, as in chemical
mixtures. The objective of an exposure characterization is to produce a summary exposure profile that
identifies the exposed ecological entity (organism), describes the exposure pathway, and estimates the
dose of each chemical received by the organism. Important components of an exposure profile for
dioxin-like compounds include: (1) measurements and/or predictions of individual chemical
concentrations in water, sediment, soil, and diet; (2) an accounting for the differential fate and transport
of PCDDs, PCDFs, and PCBs in the ecosystem; (3) measurements and/or predictions of the
bioaccumulation potentials for individual congeners; and (4) calculation of toxicity equivalence
concentrations that are consistent with the dose metrics of the toxicity data being used to determine
risks (Figure 4). The data, models, and procedures are similar, regardless of differences in the
ecosystem type, exposure routes, or vertebrate species at risk.
June 2003 28 DRAFT—DO NOT CITE OR QUOTE

1
2
3
4
5
6
7
8
9
10
11
12
13
14
15
16
17
18
19
20
21
22
23
24
25
26
27
28
29
30
31
3.3.1.1. Congener-Specific Analyses
The toxicity equivalence methodology is inherently congener-specific. Effects, bioaccumulation,
and chemical fate and transport models all require input and output of congener-specific data. Only the
species-specific, effect endpoint-specific, spatially and temporally-specific toxicity equivalence
exposure values which result from the completion of the analysis may be expressed as a chemical
mixture inclusive value (i.e., the toxicity equivalence concentration or TEC). Thus, a prerequisite for
using the methodology is chemical characterization that is of high-quality and is congener-specific. The
toxicity equivalence methodology cannot be directly applied to homolog groups or to total PCBs.
Uncertainty for application of TEFs to PCB congener concentrations estimated from Aroclor or
homolog analyses is probably large because of the wide range of possible congener mixtures, even
within homolog groups. Analytical detection levels for congeners should be lower than concentrations
at which important biological effects may occur. Experts at the EPA/DOI workshop (U.S. EPA,
2001a) concluded that the accuracy, precision, and detection limits of currently available congener-
specific methods, e.g. EPA Method 1668 for PCBs (U.S. EPA, 1999) and EPA Methods 8290 or
1613 for PCDDs and PCDFs (U.S. EPA, 1998), are acceptable for ecological risk assessment
purposes. Instrumental conditions can often be varied to obtain lower detection limits when required.
The workshop participants further concluded that the analytical measurement errors associated with
current congener-specific methods, when conducted to meet appropriate exposure data quality
objectives, are not a major source of uncertainty within an ecological risk assessment which
incorporates the methodology.
3.3.1.2. Chemical Fate of PCDDs, PCDFs, and PCBs
As mentioned in section 3.3.1.1, modeling or monitoring the fate and transport of PCDDs,
PCDFs, and PCBs in the environment requires chemical-specific data and models. This is particularly
evident in the prospective risk assessment scenario used at the EPA/DOI workshop (U.S. EPA,
2001a) because the objective was to set permit conditions for multiple sources of the chemicals to an
aquatic ecosystem. For any assessment which involves chemical transport from external sources or
dynamic behavior of exposures over time, it is beneficial to consider the general characteristics of
dioxin-like compounds, as well as the unique chemical and physical characteristics of each chemical.
PCDDs, PCDFs, and PCBs are persistent in the environment because they are resistant to chemical
and biological degradation. Affinity for organic carbon and lipids, and relatively low volatility, allows
June 2003 29 DRAFT—DO NOT CITE OR QUOTE

1
2
3
4
5
6
7
8
9
10
11
12
13
14
15
16
17
18
19
20
21
22
23
24
25
26
27
28
29
30
31
these chemicals to be retained in soils, sediments, and biota for long periods of time. Transport on
particles through the atmosphere or waterways are important mechanisms for redistribution of PCDDs,
PCDFs, and PCBs and temporal and spatial changes in mixture composition. PCBs tend to be more
volatile than PCDDs and PCDFs, which are more subject to photodegradation (U.S. EPA, 2001c).
The most important chemical property that controls bioavailability from water, sediment, or soils is
hydrophobicity, which can be measured by the octanol-water partition coefficient, Kow. PCDDs,
PCDFs, and PCBs for which dioxin-like toxicity is established have log Kows, increasing with degree of
chlorination, from approximately 6 to 9. This high degree of hydrophobicity makes measurement of
concentrations in water very difficult, especially for PCDDs and PCDFs which are present in the
environment in much smaller amounts than PCBs. Conversely, concentrations in surficial sediments or
soils are often measurable and can be used effectively to reference each chemical’s distribution to
abiotic and biotic components of the ecosystem. In aquatic ecosystems, concentrations measured in
surficial sediments can be used to estimate average concentrations in water.
While physical and chemical properties of PCDDs, PCDFs, and PCBs as a group of chemicals
can be generalized as above, the differences among the individual chemicals result in different profiles
for distribution, fate and transport and thus temporal and spatial changes in the composition of chemical
mixtures in the environment. Properties such as bioavailability, bioaccumulation, metabolism and
biomagnification also differ among PCDDs, PCDFs, and PCBs such that the relative concentration of
the individual chemicals vary with species and trophic level. Therefore, concentrations of individual
PCDDs, PCDFs, and PCBs in abiotic media often do not reflect the chemical concentration profile
observed in the tissues of wildlife. TEFs and RPFs should only be applied on the basis of the specific
chemical mixtures in the exposures of the organisms for which risks are being assessed. Thus, it is
imperative that chemical concentrations in abiotic media be converted to concentrations in either the
tissues of organisms being assessed or their food through use of appropriate bioaccumulation factors
prior to applying TEFs for calculating TECs (see Figure 4). For example, bioaccumulation factors can
be applied to PCDD, PCDF, and PCB concentrations in media to obtain concentrations in organisms
(as described in the following section and illustrated in Figure 5). It follows that TECs should generally
not be directly based on water, sediment, or soil since these media are inconsistent with the dosimetry
basis for the toxicity equivalence model. In cases where direct ingestion of contaminated media (e.g.,
soil, sediment or water) are reasonable and significant exposure pathways, the appropriate exposure
dose metric (i.e., administered dose) as described in section 3.3.1.3, must be considered.
June 2003 30 DRAFT—DO NOT CITE OR QUOTE

1
2
3
4
5
6
7
8
9
10
11
12
13
14
15
16
17
18
19
20
21
22
23
24
25
26
27
28
29
30
31
3.3.1.3. Choices for the Exposure Dose Metric
In any risk assessment the dose metric — i.e., the measurements or predictions of chemical
concentrations — should be consistent between the exposure assessment and the effects assessment.
For example, if the dose-response relationship used in the effects assessment is based on toxicity as a
function of concentrations of 2,3,7,8-TCDD in tissue, exposure estimates would also need to be based
on concentrations in tissue of the species of concern. When incorporating the toxicity equivalence
methodology into an exposure assessment, the dose metric basis for TEFs and RPFs may be
overlooked because they are unitless factors. However, uncertainty associated with application of the
TEFs or RPFs can be minimized if the dose metric basis for the TEFs or RPFs that will be applied are
consistent with that used for the exposure and effects assessments. Regardless of the dose metric used,
TEFs or RPFs that provide for consistency in the bridging of the exposure assessment to the effects
assessment (exposure dose metric = TEF or RPF dose metric = effects dose metric) should be selected
whenever possible. When this is not possible, as when the dose metric for the TEF or RPF does not
match the dose metric for the dose-response relationship (e.g., TEF or RPF is based on concentration
of chemical in tissues and dose-response for effects is based on administered dose in the diet), the risk
assessor should consider, to the extent possible, the direction and magnitude of the errors that may be
introduced.
It is well established that dioxin-like toxicity is mediated through the Ah receptor and that the
toxicity of a dioxin-like chemical depends on the concentration of the chemical that reaches the AhR in
vulnerable tissues of an organism. It is also known that expression of the AhR varies among tissues and
life stages, which will influence the susceptibility of various tissues and/or life stages to the toxic effects
of dioxin-like chemicals. Thus, the concentrations of individual PCDDs, PCDFs, and PCBs that reach
an organism’s vulnerable tissues are the most relevant dose metric for the biological response.
However, it is often impractical or impossible to define toxicity on a tissue specific basis.
Mammalian WHO-TEF98s are largely based on relative potency data associated with administered
doses or concentrations in the diet of test animals rather than concentrations in cells or tissues. Such
relative potency data are subject to variability associated with toxicokinetic differences between
chemicals for absorption, distribution, metabolism, and elimination. For example, the mouse hepatic
EROD RePs based on administered doses for 2,3,7,8-TCDF and 1,2,3,7,8-PeCDF are less than the
RePs based on concentration of the chemicals in the mouse liver that result from the administered dose
(DeVito et al., 1997). The difference in RePs occurs because both 2,3,7,8-TCDF and 1,2,3,7,8-
June 2003 31 DRAFT—DO NOT CITE OR QUOTE
1
2
3
4
5
6
7
8
9
10
11
12
13
14
15
16
17
18
19
20
21
22
23
24
25
26
27
PeCDF are more rapidly metabolized than 2,3,7,8-TCDD and greater administered doses are required
to attain 2,3,7,8-TCDD equivalent concentrations in the liver (DeVito et al., 1997, 1998).
Toxicokinetic differences are related to physiological and biochemical factors that are species-specific
and life-stage specific.
TEFs/RPFs for fish and birds are generally based on the potencies of dioxin-like chemicals
within cells, organs, or whole organisms with concentration in tissue used as the dose metric. The dose
metric for 2,3,7,8-TCDD induced developmental toxicity in fish and birds is also often expressed as a
concentration in tissue (i.e., egg or embryo), which is desirable. Hence, the dose metrics for fish and
bird TEFs/RPFs are often consistent with the dose metrics used for the toxicity relationship, and allow
for an internally consistent exposure and effects assessment based on concentration of chemicals in the
organism’s tissues. TECs based on measurements or estimates of PCDD, PCDF, and PCB
concentrations in tissues are presently most accurate for assessment of effects in fish and birds, with
concentrations in whole embryos used to assess early life stage effects. If concentrations in tissue are
unavailable, they may be estimated from environmental media based on bioaccumulation factors or
models (as described in section 3.3.1.4 and Cook et al., 2003) or bioaccumulation from the diet if
dietary intake and concentrations can be estimated.
In contrast to fish and birds, the dose metric used for mammalian TEFs-WHO98 is generally
administered dose rather than concentration in tissues. Therefore, application of the mammalian TEFs-
WHO98 to dietary exposures, rather than concentrations measured or predicted for specific tissues,
is more accurate and will minimize uncertainty associated with the exposure assessment. Moreover, the
dose metric for mammalian toxicity is most often administered dose or concentrations of chemical in the
diet of test animals, such that using administered dose as the dose metric in mammals will also minimize
uncertainty associated with the final risk estimate. Data are also available for derivation of RePs or
RPFs based on potencies of dioxin-like chemicals in mammalian cells or organs (e.g., for CYP1A
induction). If tissue concentration-based RPFs for mammals are used, potential systematic errors
associated with using such RPFs in conjunction with exposure and effects data based on an
administered dose metric should be recognized and documented in the risk assessment.
June 2003 32 DRAFT—DO NOT CITE OR QUOTE
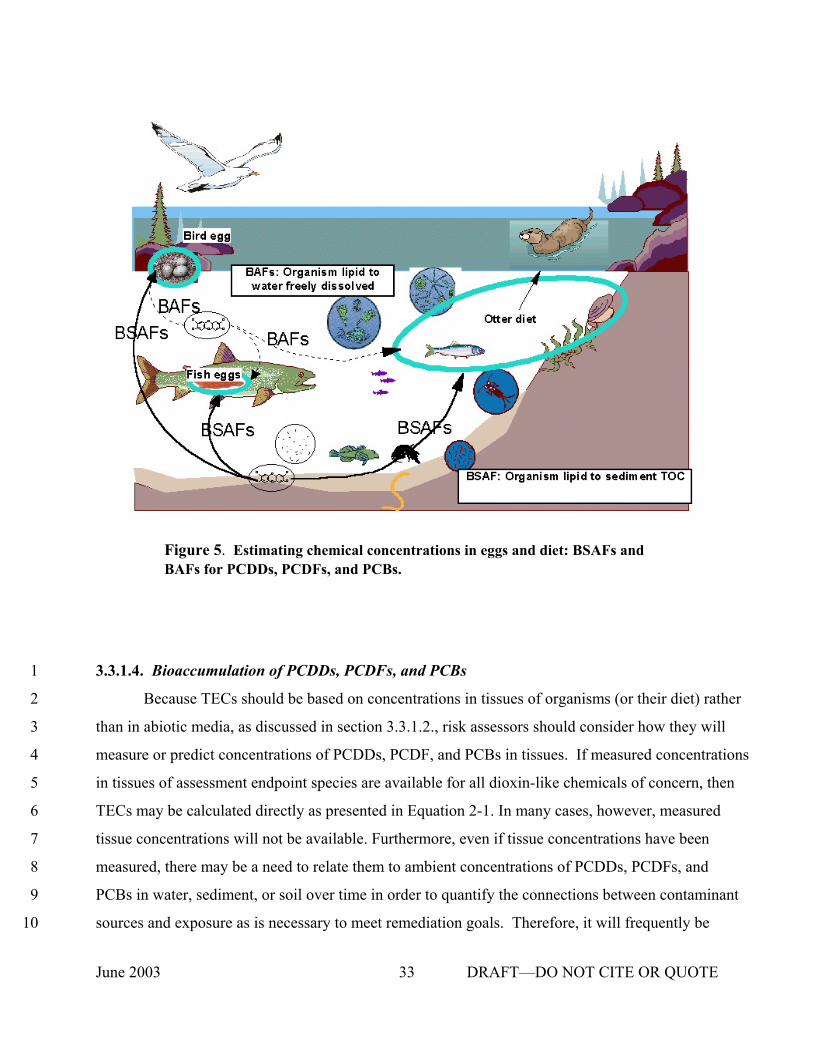
1
2
3
4
5
6
7
8
9
10
Figure 5. Estimating chemical concentrations in eggs and diet: BSAFs and BAFs for PCDDs, PCDFs, and PCBs.
3.3.1.4. Bioaccumulation of PCDDs, PCDFs, and PCBs
Because TECs should be based on concentrations in tissues of organisms (or their diet) rather
than in abiotic media, as discussed in section 3.3.1.2., risk assessors should consider how they will
measure or predict concentrations of PCDDs, PCDF, and PCBs in tissues. If measured concentrations
in tissues of assessment endpoint species are available for all dioxin-like chemicals of concern, then
TECs may be calculated directly as presented in Equation 2-1. In many cases, however, measured
tissue concentrations will not be available. Furthermore, even if tissue concentrations have been
measured, there may be a need to relate them to ambient concentrations of PCDDs, PCDFs, and
PCBs in water, sediment, or soil over time in order to quantify the connections between contaminant
sources and exposure as is necessary to meet remediation goals. Therefore, it will frequently be
June 2003 33 DRAFT—DO NOT CITE OR QUOTE
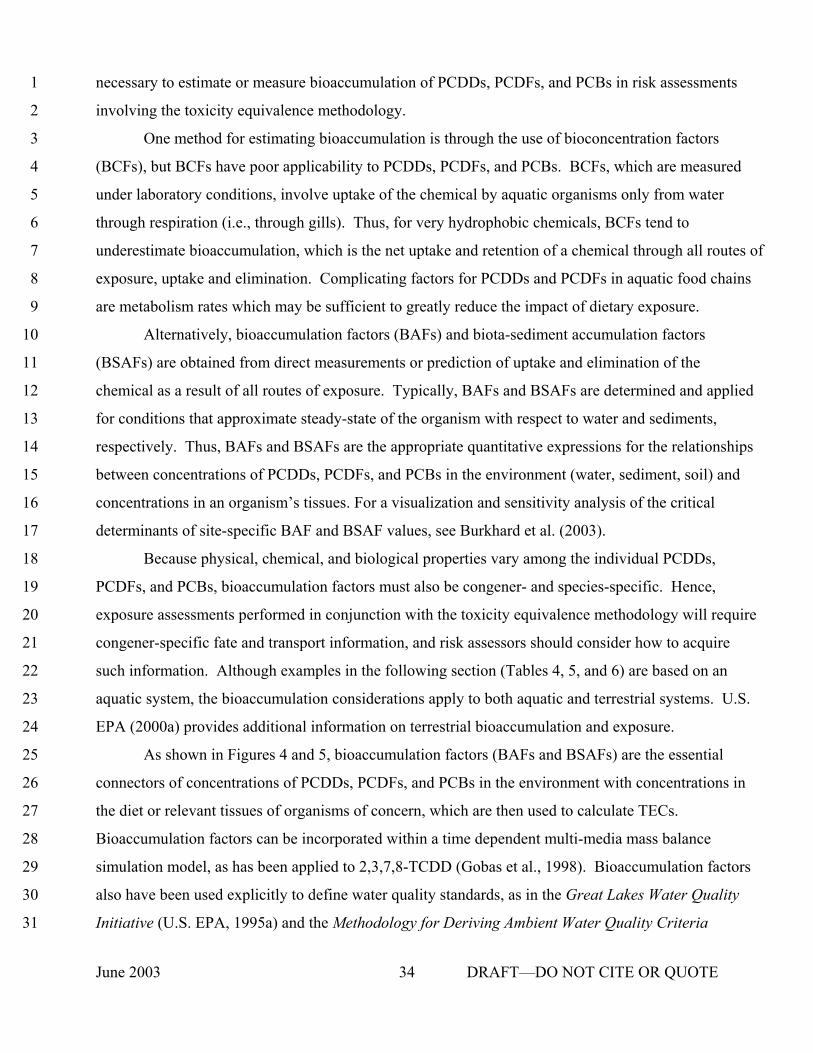
1
2
3
4
5
6
7
8
9
10
11
12
13
14
15
16
17
18
19
20
21
22
23
24
25
26
27
28
29
30
31
necessary to estimate or measure bioaccumulation of PCDDs, PCDFs, and PCBs in risk assessments
involving the toxicity equivalence methodology.
One method for estimating bioaccumulation is through the use of bioconcentration factors
(BCFs), but BCFs have poor applicability to PCDDs, PCDFs, and PCBs. BCFs, which are measured
under laboratory conditions, involve uptake of the chemical by aquatic organisms only from water
through respiration (i.e., through gills). Thus, for very hydrophobic chemicals, BCFs tend to
underestimate bioaccumulation, which is the net uptake and retention of a chemical through all routes of
exposure, uptake and elimination. Complicating factors for PCDDs and PCDFs in aquatic food chains
are metabolism rates which may be sufficient to greatly reduce the impact of dietary exposure.
Alternatively, bioaccumulation factors (BAFs) and biota-sediment accumulation factors
(BSAFs) are obtained from direct measurements or prediction of uptake and elimination of the
chemical as a result of all routes of exposure. Typically, BAFs and BSAFs are determined and applied
for conditions that approximate steady-state of the organism with respect to water and sediments,
respectively. Thus, BAFs and BSAFs are the appropriate quantitative expressions for the relationships
between concentrations of PCDDs, PCDFs, and PCBs in the environment (water, sediment, soil) and
concentrations in an organism’s tissues. For a visualization and sensitivity analysis of the critical
determinants of site-specific BAF and BSAF values, see Burkhard et al. (2003).
Because physical, chemical, and biological properties vary among the individual PCDDs,
PCDFs, and PCBs, bioaccumulation factors must also be congener- and species-specific. Hence,
exposure assessments performed in conjunction with the toxicity equivalence methodology will require
congener-specific fate and transport information, and risk assessors should consider how to acquire
such information. Although examples in the following section (Tables 4, 5, and 6) are based on an
aquatic system, the bioaccumulation considerations apply to both aquatic and terrestrial systems. U.S.
EPA (2000a) provides additional information on terrestrial bioaccumulation and exposure.
As shown in Figures 4 and 5, bioaccumulation factors (BAFs and BSAFs) are the essential
connectors of concentrations of PCDDs, PCDFs, and PCBs in the environment with concentrations in
the diet or relevant tissues of organisms of concern, which are then used to calculate TECs.
Bioaccumulation factors can be incorporated within a time dependent multi-media mass balance
simulation model, as has been applied to 2,3,7,8-TCDD (Gobas et al., 1998). Bioaccumulation factors
also have been used explicitly to define water quality standards, as in the Great Lakes Water Quality
Initiative (U.S. EPA, 1995a) and the Methodology for Deriving Ambient Water Quality Criteria
June 2003 34 DRAFT—DO NOT CITE OR QUOTE

June 2003 DRAFT—DO NOT CITE OR QUOTE35
for the Protection of Human Health (U.S. EPA, 2000c). Concentrations in biota, sediments, and1
water are defined to accommodate variability in bioavailability conditions and express bioaccumulation2
on a thermodynamic basis (degree of equilibrium between biota, water, and sediments). The3
concentration of the chemical in the organism’s tissues (Ct) is normalized to lipid content (CR) with the4
fraction lipid (fR) in the organism’s tissues. The concentration of the chemical in sediment (Cs) is5
normalized to organic carbon content (Csoc) with the fraction of organic carbon in the sediment (fsoc). 6
The concentration of the bioavailable chemical in water is defined as the concentration of freely7
dissolved chemical (Cwf d) which is calculated with the fraction of chemical that is freely dissolved (ffd) as8
estimated from concentrations of particulate organic carbon (POC) and dissolved organic carbon9
(DOC) in the water (U.S. EPA, 1995a and 2000c). Thus there are two basic forms of10
bioaccumulation factor in current use: for water, the bioaccumulation factor, BAFRfd, and for sediment,11
the biota sediment accumulation factor, BSAF:1213141516171819 (3-1)2021222324252627 (3-2)

1 Table 4. An example of estimating toxicity equivalence concentrations (TECs)2 in fish eggs from average concentrations of PCDD, PCDF, and PCB congeners3 measured in surface sediment samples of a reservoir45
6 7 8 9
10 11 12 13 14 15 16 17 18 19 20 21 22 23 24 25 26 27 28 29 30 31 32 33 34 35 36 37 38 39 40 41
Concentration in Sediment
Trout Egg BSAF1
Concentration in Trout Egg
WHO -TEF/98 Fish TEF
Trout Egg TEC
ng/kg ng/kg egg ng/kg egg
2,3,7,8-TCDD 0.30 0.149 0.22 1 0.22 1,2,3,7,8-PeCDD 1.20 0.121 0.73 1 0.73 1,2,3,4,7,8-HxCDD 1.10 0.018 0.10 0.5 0.05 1,2,3,6,7,8-HxCDD 4.70 0.007 0.17 0.01 0.002 1,2,3,7,8,9-HxCDD 2.90 0.010 0.15 0.01 0.002 1,2,3,4,6,7,8-HpCDD 78.20 0.002 0.78 0.001 0.0008 OCDD 530.00 0.0007 1.96 <0.0001 < 0.002 2,3,7,8-TCDF 1.10 0.069 0.38 0.05 0.02 1,2,3,7,8-PeCDF 0.92 0.009 0.04 0.05 0.002 2,3,4,7,8-PeCDF 1.40 0.162 1.13 0.5 0.57 1,2,3,4,7,8-HxCDF 4.10 0.0045 0.09 0.1 0.009 1,2,3,6,7,8-HxCDF 1.60 0.007 0.06 0.1 0.006 1,2,3,7,8,9-HxCDF 0.30 0.020 0.03 0.1 0.003 2,3,4,6,7,8-HxCDF 1.00 0.002 0.01 0.1 0.001 1,2,3,4,6,7,8-HpCDF 2.70 0.001 0.01 0.01 0.0001 1,2,3,4,7,8,9-HpCDF 133.00 0.023 15.30 0.01 0.15 OCDF 2.40 0.001 0.01 <0.0001 <0.00001 Sum PCDD and PCDF 1.76
3,4,4',5-TCB 60 0.95 285 0.0005 0.14 3,3',4,4'-TCB 1623 0.29 2353 0.0001 0.24 3,3',4,4',5-PeCB 16 4.18 334 0.005 1.67 3,3',4,4',5,5'-HxCB 4.8 5.58 134 0.00005 0.007 2,3,3',4,4'-PeCB 5370 2.54 68199 <0.000005 < 0.341 2,3,4,4',5-PeCB 4170 5.22 108837 <0.000005 < 0.544 2,3',4,4',5-PeCB 35658 4.66 830831 <0.000005 <4.154 2',3,4,4',5-PeCB 538 3.80 10222 <0.000005 <0.051 2,3,3',4,4',5-HxCB 8413 5.87 246921 <0.000005 <1.2346 2,3,3',4,4',5'-HxCB 917 7.89 36175 <0.000005 <0.1809 2,3',4,4',5,5'-HxCB 705 2.03 7156 <0.000005 <0.0358 2,3,3',4,4',5,5'-HpCB 1876 2.07 19416 <0.000005 <0.0971 Sum PCB 2.06 - 8.70 Sum all 3.82 - 10.46
(81) (77)
(126) (169)
(105) (114) (118) (123)
(156) (157) (167)
(189)
42 BSAFs for trout eggs are based on 7% lipid in eggs and 1.4% organic carbon in sediment.
June 2003 36 DRAFT—DO NOT CITE OR QUOTE
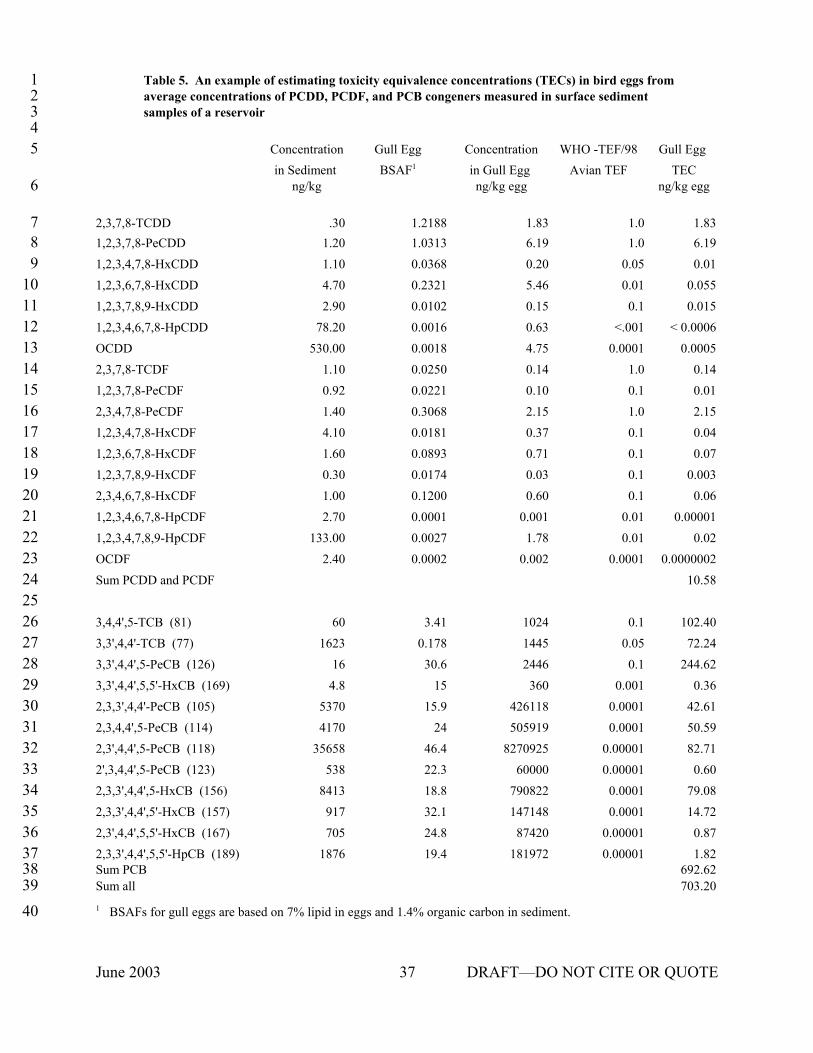
1 Table 5. An example of estimating toxicity equivalence concentrations (TECs) in bird eggs from2 average concentrations of PCDD, PCDF, and PCB congeners measured in surface sediment3 samples of a reservoir45
6
7 8 9
10 11 12 13 14 15 16 17 18 19 20 21 22 23 24 25 26 27 28 29 30 31 32 33 34 35 36 37 38 39
Concentration in Sediment
Gull Egg BSAF1
Concentration in Gull Egg
WHO -TEF/98 Avian TEF
Gull Egg TEC
ng/kg ng/kg egg ng/kg egg
2,3,7,8-TCDD .30 1.2188 1.83 1.0 1.83 1,2,3,7,8-PeCDD 1.20 1.0313 6.19 1.0 6.19 1,2,3,4,7,8-HxCDD 1.10 0.0368 0.20 0.05 0.01 1,2,3,6,7,8-HxCDD 4.70 0.2321 5.46 0.01 0.055 1,2,3,7,8,9-HxCDD 2.90 0.0102 0.15 0.1 0.015 1,2,3,4,6,7,8-HpCDD 78.20 0.0016 0.63 <.001 < 0.0006 OCDD 530.00 0.0018 4.75 0.0001 0.0005 2,3,7,8-TCDF 1.10 0.0250 0.14 1.0 0.14 1,2,3,7,8-PeCDF 0.92 0.0221 0.10 0.1 0.01 2,3,4,7,8-PeCDF 1.40 0.3068 2.15 1.0 2.15 1,2,3,4,7,8-HxCDF 4.10 0.0181 0.37 0.1 0.04 1,2,3,6,7,8-HxCDF 1.60 0.0893 0.71 0.1 0.07 1,2,3,7,8,9-HxCDF 0.30 0.0174 0.03 0.1 0.003 2,3,4,6,7,8-HxCDF 1.00 0.1200 0.60 0.1 0.06 1,2,3,4,6,7,8-HpCDF 2.70 0.0001 0.001 0.01 0.00001 1,2,3,4,7,8,9-HpCDF 133.00 0.0027 1.78 0.01 0.02 OCDF 2.40 0.0002 0.002 0.0001 0.0000002 Sum PCDD and PCDF 10.58
3,4,4',5-TCB 60 3.41 1024 0.1 102.40 3,3',4,4'-TCB 1623 0.178 1445 0.05 72.24 3,3',4,4',5-PeCB 16 30.6 2446 0.1 244.62 3,3',4,4',5,5'-HxCB 4.8 15 360 0.001 0.36 2,3,3',4,4'-PeCB 5370 15.9 426118 0.0001 42.61 2,3,4,4',5-PeCB 4170 24 505919 0.0001 50.59 2,3',4,4',5-PeCB 35658 46.4 8270925 0.00001 82.71 2',3,4,4',5-PeCB 538 22.3 60000 0.00001 0.60 2,3,3',4,4',5-HxCB 8413 18.8 790822 0.0001 79.08 2,3,3',4,4',5'-HxCB 917 32.1 147148 0.0001 14.72 2,3',4,4',5,5'-HxCB 705 24.8 87420 0.00001 0.87 2,3,3',4,4',5,5'-HpCB 1876 19.4 181972 0.00001 1.82 Sum PCB 692.62 Sum all 703.20
(81) (77)
(126) (169)
(105) (114) (118) (123)
(156) (157) (167)
(189)
40 1 BSAFs for gull eggs are based on 7% lipid in eggs and 1.4% organic carbon in sediment.
June 2003 37 DRAFT—DO NOT CITE OR QUOTE
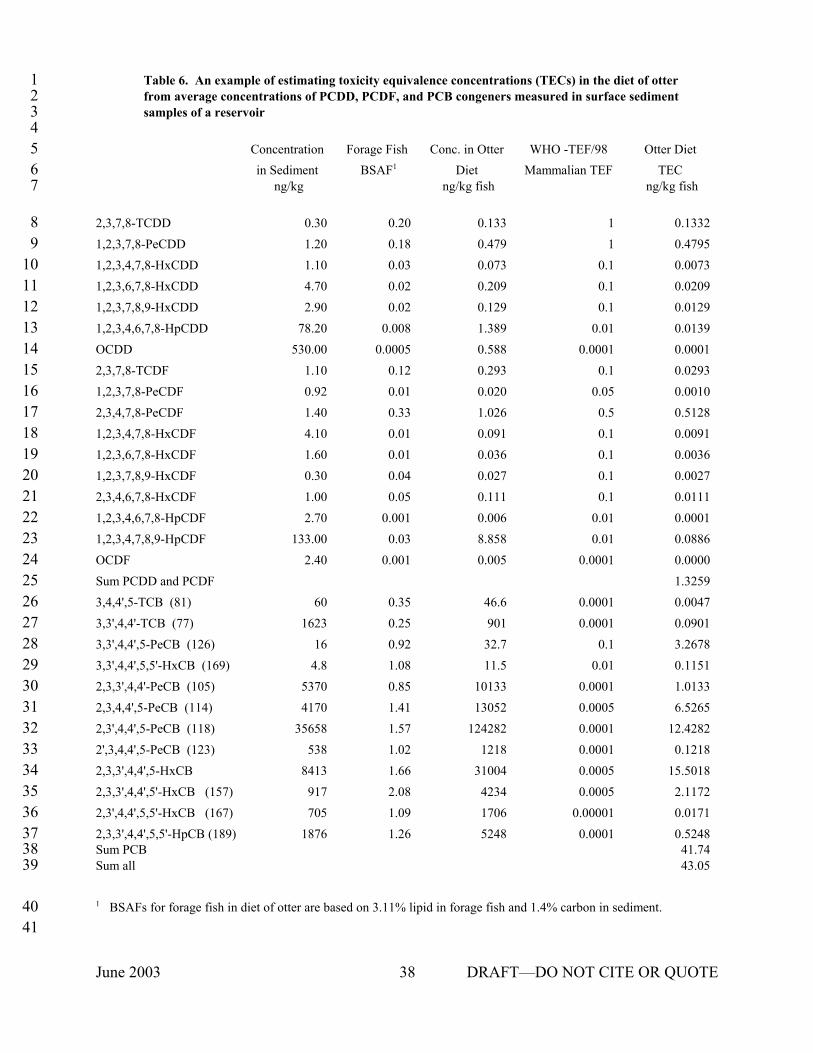
1 Table 6. An example of estimating toxicity equivalence concentrations (TECs) in the diet of otter2 from average concentrations of PCDD, PCDF, and PCB congeners measured in surface sediment3 samples of a reservoir45 6 7
8 9
10 11 12 13 14 15 16 17 18 19 20 21 22 23 24 25 26 27 28 29 30 31 32 33 34 35 36 37 38 39
Concentration in Sediment
Forage Fish BSAF1
Conc. in Otter Diet
WHO -TEF/98 Mammalian TEF
Otter Diet TEC
ng/kg ng/kg fish ng/kg fish
2,3,7,8-TCDD 0.30 0.20 0.133 1 0.1332 1,2,3,7,8-PeCDD 1.20 0.18 0.479 1 0.4795 1,2,3,4,7,8-HxCDD 1.10 0.03 0.073 0.1 0.0073 1,2,3,6,7,8-HxCDD 4.70 0.02 0.209 0.1 0.0209 1,2,3,7,8,9-HxCDD 2.90 0.02 0.129 0.1 0.0129 1,2,3,4,6,7,8-HpCDD 78.20 0.008 1.389 0.01 0.0139 OCDD 530.00 0.0005 0.588 0.0001 0.0001 2,3,7,8-TCDF 1.10 0.12 0.293 0.1 0.0293 1,2,3,7,8-PeCDF 0.92 0.01 0.020 0.05 0.0010 2,3,4,7,8-PeCDF 1.40 0.33 1.026 0.5 0.5128 1,2,3,4,7,8-HxCDF 4.10 0.01 0.091 0.1 0.0091 1,2,3,6,7,8-HxCDF 1.60 0.01 0.036 0.1 0.0036 1,2,3,7,8,9-HxCDF 0.30 0.04 0.027 0.1 0.0027 2,3,4,6,7,8-HxCDF 1.00 0.05 0.111 0.1 0.0111 1,2,3,4,6,7,8-HpCDF 2.70 0.001 0.006 0.01 0.0001 1,2,3,4,7,8,9-HpCDF 133.00 0.03 8.858 0.01 0.0886 OCDF 2.40 0.001 0.005 0.0001 0.0000 Sum PCDD and PCDF 1.3259 3,4,4',5-TCB 60 0.35 46.6 0.0001 0.0047 3,3',4,4'-TCB 1623 0.25 901 0.0001 0.0901 3,3',4,4',5-PeCB 16 0.92 32.7 0.1 3.2678 3,3',4,4',5,5'-HxCB 4.8 1.08 11.5 0.01 0.1151 2,3,3',4,4'-PeCB 5370 0.85 10133 0.0001 1.0133 2,3,4,4',5-PeCB 4170 1.41 13052 0.0005 6.5265 2,3',4,4',5-PeCB 35658 1.57 124282 0.0001 12.4282 2',3,4,4',5-PeCB 538 1.02 1218 0.0001 0.1218 2,3,3',4,4',5-HxCB 8413 1.66 31004 0.0005 15.5018 2,3,3',4,4',5'-HxCB 917 2.08 4234 0.0005 2.1172 2,3',4,4',5,5'-HxCB 705 1.09 1706 0.00001 0.0171 2,3,3',4,4',5,5'-HpCB (189) 1876 1.26 5248 0.0001 0.5248 Sum PCB 41.74 Sum all 43.05
(81) (77)
(126) (169)
(105) (114) (118) (123)
(157) (167)
40 1 BSAFs for forage fish in diet of otter are based on 3.11% lipid in forage fish and 1.4% carbon in sediment. 41
June 2003 38 DRAFT—DO NOT CITE OR QUOTE
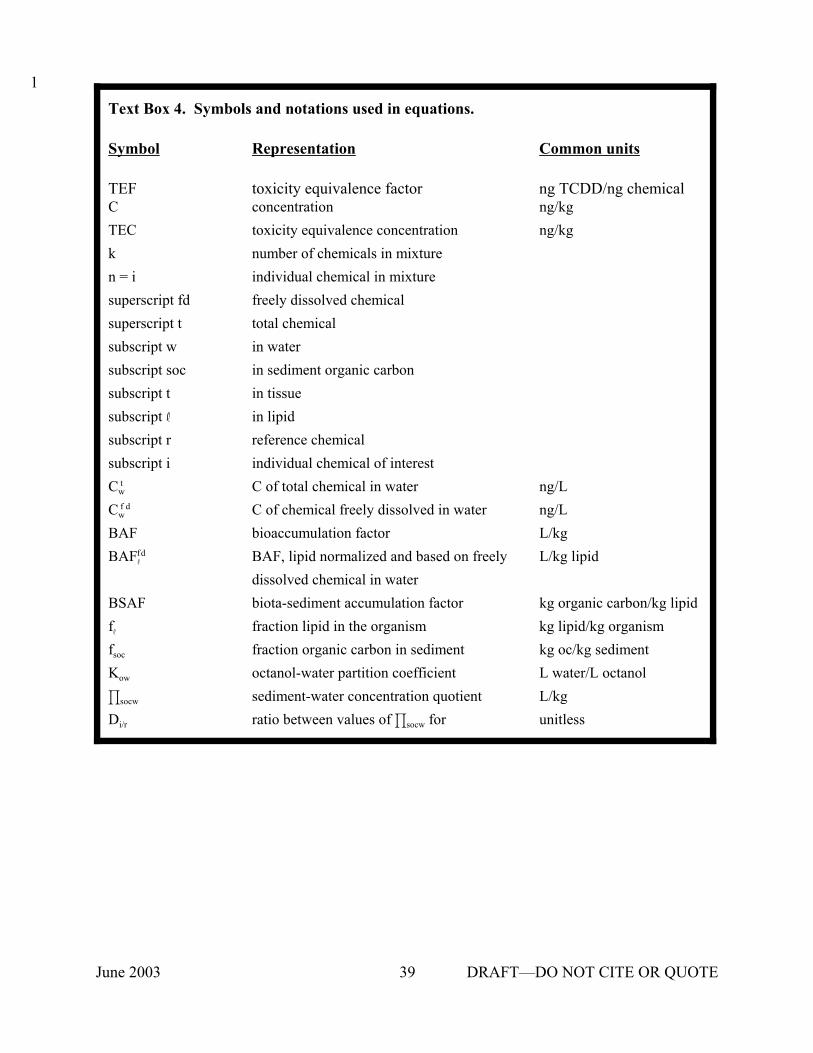
1
Text Box 4. Symbols and notations used in equations.
Symbol Representation Common units
TEF toxicity equivalence factor ng TCDD/ng chemical C concentration ng/kg TEC toxicity equivalence concentration ng/kg k number of chemicals in mixture n = i individual chemical in mixture superscript fd freely dissolved chemical superscript t total chemical subscript w in water subscript soc in sediment organic carbon subscript t in tissue subscript R in lipid subscript r reference chemical subscript i individual chemical of interest Cw
t C of total chemical in water ng/L Cw
f d C of chemical freely dissolved in water ng/L BAF bioaccumulation factor L/kg BAFR
fd BAF, lipid normalized and based on freely L/kg lipid dissolved chemical in water
BSAF biota-sediment accumulation factor kg organic carbon/kg lipid fR fraction lipid in the organism kg lipid/kg organism fsoc fraction organic carbon in sediment kg oc/kg sediment Kow octanol-water partition coefficient L water/L octanol Jsocw sediment-water concentration quotient L/kg Di/r ratio between values of Jsocw for unitless
June 2003 39 DRAFT—DO NOT CITE OR QUOTE

June 2003 DRAFT—DO NOT CITE OR QUOTE40
following two equations:123 (3-3)45678 (3-4)9
10Risk assessments which are concerned with ecological effects as a consequence of loadings of11
PCDDs, PCDFs, and PCBs to aquatic ecosystems must be designed to consider the masses, and thus12the concentrations, of these chemicals in both water and sediments. In these cases the risk analysis will,13either directly or indirectly, involve specific values of BAFR
fd and BSAF for each chemical. BAFRfds can14
be measured for many PCB congeners but are difficult to measure directly for PCDDs, PCDFs, and15the most toxic PCB congeners because concentrations in water fall below detection limits.16Nevertheless, it may be necessary to calculate BAFR
fds, such as for water quality criteria development17and application, even if the BAFR
fds are not needed for calculating TECs. Any risk management18decision, based on future chemical mass balances associated with reducing concentrations of chemicals19in sediments and/or external sources, has to address concentration changes in biota, water, and20sediment compartments, regardless of whether measured concentrations are available for each21compartments at any point in time. EPA presently uses measured BSAFs for PCDDs, PCDFs, and22co-planar PCBs, combined with estimates of sediment-water concentration quotients (Jsocw as defined23by equation 3-5) for reference chemicals which have measurable concentrations in water, to calculate24BAFR
fds for such purposes (U.S. EPA, 1995a; 2000c). The BSAF method, as described by equation 3-256, has provided very accurate predictions of BAFR
fds for PCBs in several different ecosystems. This26method robustly captures congener-specific differences in bioavailability and metabolism in the food27chain through use of BSAFs as indicators of relative bioaccumulation potentials for the congeners. The28method also highlights the necessity for linking biota to both water and sediment when quantitative29ecological risk assessments are required. Reference chemicals (r) can often be chosen so that Di/r, the30difference between Jsocw values for the reference chemical and chemical of interest (i), is approximately311. For more details see U.S. EPA, 2000c.32

June 2003 DRAFT—DO NOT CITE OR QUOTE41
12 (3-5)34567 (3-6)89
BSAFs are advantageous for describing and predicting bioaccumulation of PCDDs, PCDFs,10and PCBs because they can be measured at a site to capture effects of food web structure,11bioavailability, and metabolism. BSAFs also tend to integrate fluctuations of chemical concentrations in12the water and accommodate spatial gradients in sediment. When risks are to be assessed and managed13on the basis of approximate steady state conditions expected in the future, the predictive power of14BSAFs depends on adjustments to account for expected changes in these conditions.15
163.3.1.5. Examples of TEC Calculations for Fish, Birds, and Mammals17
Examples of estimating TCDD toxicity equivalence concentrations in fish eggs and bird eggs18(TECeggs) from average values of measured PCDD, PCDF, and PCB congener concentrations in19sediments are presented in Tables 4 and 5. The hypothetical sediments are representative of a20moderately contaminated ecosystem. Calculations of TECs are conceptualized in Figures 5 and 6. The21risk problem behind these examples is the determination of whether the chemicals have accumulated22sufficiently to cause significant mortality of lake trout and herring gulls during early life stages. BSAFs,23roughly based on Lake Ontario data for sediments (U.S. EPA, 1995a), lake trout eggs (Guiney et al.,241996), and herring gull eggs (Government of Canada, 1991), are used here to illustrate how25concentrations of the congeners in trout and gull embryos, respectively, may be estimated from26contaminated sediment data by using the following relationships:27
282930 (3-7)
3132

June 2003 DRAFT—DO NOT CITE OR QUOTE42
Figure 6. PCDDs, PCDFs, and PCBs: effects on vertebrates. TECs are calculated fromconcentrations in bird eggs, fish eggs, or mammal diet.
1234 (3-8)56
where the fraction of organic carbon ( fsoc) is measured for sediments, in association with7concentrations of each congener in sediments (Cs), and the fraction of lipid in trout or gull eggs (fR) that8would inhabit the site is assumed from literature values. Finally, the tissue concentrations are multiplied9by the fish TEFs and bird TEFs (see Table 2) and the products summed to estimate a total TEC for10
June 2003 DRAFT—DO NOT CITE OR QUOTE43
trout and gull embryos, respectively, as indicated by equation 2-1. The TECtrout egg is reported as a1range from 3.82-10.46 ng/kg trout egg to reflect the value assuming no toxicity (TEFs = 0) from mono-2ortho PCBs (PCBs with only one chlorine occupying an ortho position on the phenyl rings), in contrast3to the value based on use of the toxicity detection limits (TEFs = 0.000005) for mono-ortho PCBs. 4The TECgull egg is reported as a single value of 703.2 ng/kg gull egg because the avian TEFs for mono-5ortho PCBs biphenyls represent measurable effects. In this hypothetical example the non-ortho PCBs6contribute 2.06 ng/kg trout egg and 419.62 ng/kg gull egg in contrast to 1.76 ng/kg trout egg and 10.587ng/kg gull egg for PCDDs and PCDFs. 8
Figures 7 and 8 show the relative contributions to the TECs made by PCDDs and PCDFs in9comparison to PCBs for trout and gull eggs, respectively. In this example PCDDs and PCDFs make10approximately equal contributions with PCBs to the trout egg TEC, whereas the PCBs make a much11greater contribution to the gull egg TEC. This is a consequence of both PCB TEFs and BSAFs being12greater for birds than fish. The graphs also illustrate the consequences of calculating a TEC based on13concentrations in sediments rather than in the eggs as required to evaluate toxicity risks. In the fish14example the sediment-based TEC is somewhat greater than the egg-based TEC but the PCDD/PCDF15contribution is magnified greatly in comparison to the PCB contribution. In the gull egg example the16sediment-based TEC is much less than the egg-based TEC because the effect of bioaccumulation is not17included when TEFs are applied to concentrations in sediment. The TEC gull egg, which is approximately18one hundred times greater than the TECtrout egg, does not necessarily indicate that the gulls are at greater19risk than trout. The risk for lake trout can be greater if the trout are more than one hundred fold more20sensitive to 2,3,7,8-TCDD than herring gulls on the basis of TECeggs.21
In some cases analytical detection limits for specific chemicals may be too large to allow22measurement of concentrations which would significantly add to the TEC. In such cases, options exist23for calculating the TEC. For example, concentrations for undetected chemicals may be set equal to24zero (no contribution to TEC) or calculated based on either one half the detection limits, or the whole25detection limits. Alternatively, the TEC may be reported as the range of possible values based on the26options. If the TECs are reported in a manner that is transparent to the risk managers, the uncertainties27associated with undetected chemicals will be understood. The best method for handling non-detects in28a particular risk assessment should be determined through consultation between risk assessors and risk29managers early in the risk assessment process (Planning/Problem Formulation Phase).30
31 32
33 (3-9)

1 A third example of a TEC calculation, also conceptualized in Figure 5 and 6, is based on biota 2 utilized as food for a mammal associated with the contaminated sediment. The exposure data utilizes 3 equation 3-9 and the TEC calculations are reported in Table 6. The TEC for assessing risks to otters is 4 based on dietary exposure to fish, rather than chemical concentrations reached in the mammal’s tissue, 5 for reasons described in Section 3.3.1.3.
Figure 7. Fish TECs calculated for eggs versus sediment.
Figure 8. Bird TECs calculated for eggs versus sediment.
June 2003 44 DRAFT—DO NOT CITE OR QUOTE

123456789
101112131415161718
Figure 9. Mammal TECs calculated for diet versus sediment.
Figure 9 shows that, as in the case of birds, if the otter diet TEC is calculated directly from sediments, it will significantly underestimate the TEC based on tissue because effects of bioaccumulation on the fish dietary exposure to the otters are ignored. Also as with birds associated with these contaminated sediments, the mammalian TEFs cause the majority of the TEC in the otter diet to be associated with PCBs.
TEC calculations for terrestrial birds and mammals exposed through food chains connected to contaminated soils should proceed in a manner parallel to the aquatic examples in Tables 5 and 6. The principal exposure pathway is soil to insect to mammal/bird through diet. Dietary uptake from ingestion of plant foods or soil through preening may in some cases provide important exposures. Unlike aquatic systems in which respiration from water is an important exposure route, the EPA human exposure assessment for dioxins (U.S. EPA, 2000a) indicates, by analogy between humans and other mammalian species, that respiration of air is unlikely to be a significant direct exposure route for terrestrial organisms. Although the TEC calculations are straightforward and fairly simple, there are multiple decisions that need to be made beforehand. Some of these are described in Text Box 5. Decisions and assumptions used in the examples described in Tables 4, 5, and 6 include using measured BSAFs for Great Lakes trout and gulls (which assumes Great Lakes exposure and food web conditions are sufficiently representative of the aquatic system to be assessed), and selecting values for % lipid for organisms and % organic carbon for sediments.
June 2003 45 DRAFT—DO NOT CITE OR QUOTE

123456789
1011121314151617181920212223242526272829303132
Measured bioaccumulation factors from one site, such as the Lake Ontario values used in the GLWQI (U.S. EPA, 1995a), may be extrapolated to another assessment site where similar measurements are either not possible (e.g., chemicals not detectable) or feasible (e.g., insufficient time, resources). When the trophic level, food web, and the sediment-water concentration quotient Jsocw are similar for two ecosystems, direct extrapolation of BAFR
fds or BSAFs from one ecosystem to the other can be accurate if concentrations of chemicals in water or sediments are defined and measured in a consistent way for both sites. When conditions are not comparable, as often is the case, BAFR
fds or BSAFs can be adjusted, using a basic food chain model such as that of Gobas (1993), for known differences in trophic level, food web, and Jsocw. This will increase accuracy of the BAFR
fds or BSAFs when applied to the unmeasured system. There is a need to acquire data in case studies in order to validate such extrapolation approaches.
The case studies used for the 1998 EPA/DOI workshop (U.S. EPA, 2001a) present additional and more detailed examples of exposure characterizations. Many practical exposure and bioaccumulation assessment concerns were incorporated into these case studies, including how to employ the toxicity equivalence methodology in setting total maximum daily loading limits (TMDLs).
3.3.2. Selection of TEFs or RPFs In using the toxicity equivalence methodology, TEFs and/or RPFs serve as the bridge between
exposure and effects characterizations for mixtures of PCDDs, PCDFs, and PCBs. TEFs or RPFs are applied to measured or modeled concentrations of PCDDs, PCDFs, and PCBs in tissues or diets of fish, birds, and mammals in order to account for the net exposure of a species to all of the congeners present with a single value, the TEC. Although the methodology is based on broad similarities in the rank order of relative potencies of congeners that exist across different endpoints and species (Safe, 1990), the absolute relative potency of a specific congener can vary among species and across endpoints within a species. The basic causes of these natural variations are related to the interplay between toxicodynamic and toxicokinetic relationships that vary across species and endpoints. Furthermore, differences in the measurement or expression of doses used to determine RePs can introduce further variability as well as systematic errors in the point estimates. Thus, the first step in developing a stressor-response profile for dioxin-like compounds is to select a set of TEFs or RPFs that are both reasonable and defensible within the context of a given ecological risk assessment. In most cases, it is reasonable to use the TEFs presented in Table 2 in ecological risk assessment. that are both reasonable and defensible within the context of a given ecological risk assessment.
June 2003 46 DRAFT—DO NOT CITE OR QUOTE

123456789
101112131415161718192021222324252627282930313233
In most cases, it is reasonable to use the TEFs presented in Table 2 in ecological risk assessment. They reflect careful scientific judgment following expert review of the existing database of
Text Box 5. Questions when calculating TECs.
T Have I selected the appropriate species, identified a percent lipid for the whole organism, specific tissues of the organism, or the diet of the organism?
T Have I selected appropriate analytical methods for measuring concentrations of chemicals in sediment or water?
T Have I decided how to handle chemicals that have concentrations below the detection limit?
T Have I selected appropriate methods for measuring or estimating the fraction of organic carbon in the sediment?
T Have I measured or selected appropriate BAFs or BSAFs that will be used to estimate concentrations of each chemical in the organism’s tissue or diet?
T Have I selected and applied the TEFs or RPFs in a transparent fashion? (See sections 3.3.1.3 and 3.3.2.)
relative potency studies (Van den Berg et al., 1998; see footnote 1 for availability of this database). The process used in selecting consensus values involved consideration of ReP data with regard to differences in species, endpoints, and dose metrics for the purpose of representing each of the three classes of vertebrates (mammals, birds, and fish). Using these TEFs minimizes the effort required on the part of the risk assessor in selecting appropriate relative potency factors.
In addition to considering the consensus TEFs, the risk assessor may wish to explore the selection and use of RPFs. For example, if RPFs can be derived from RePs for relevant effects to a particular species of concern in an
ecological risk assessment, they may be more accurate in calculating toxicity equivalence concentrations than the TEFs, which are consensus values for entire taxonomic classes of organisms. Risk assessors will need to consider the potential reductions in uncertainty that may be achieved by using specific RPFs as alternatives to corresponding TEFs. While increased effort is involved in identifying and selecting the appropriate values, a number of benefits may be accrued: (1) increased confidence that TEF values are most appropriate; (2) description of ranges of uncertainty through alternative calculations of TECs (TEFs vs. RPFs); (3) provision of a basis for inclusion of AhR agonists without assigned TEFs; (4) identification of new ReP data not utilized in the 1997 WHO effort to set TEFs; and (5) increased risk assessor knowledge of the pros and cons of alternative RPFs.
June 2003 47 DRAFT—DO NOT CITE OR QUOTE

123456789
101112131415161718192021222324252627282930313233
3.3.2.1. General Considerations for Selecting RPFs Selection of an RPF based on a few data points, or even a single ReP value, is appropriate if
the ReP data are of high quality and the overall species, endpoint, and dose specificity is greater than for the comparable TEF. Since the TEFs represent expert opinion based on thorough review of ReP data existing in 1997, selection of alternative RPFs should be based on a review of all of the available ReP data that are presently available for the class of concern. As with the TEFs, the RPF selection process should be documented in a transparent manner that describes the increased accuracy expected in the risk assessment. Because TEFs for different dioxin-like chemicals are based on quite different amounts and qualities of ReP data (Van den Berg et al. 1998), increased accuracy achieved by selecting a specific RPF is related to the ReP data used for both the RPF and the corresponding TEF.
When selecting RPFs in lieu of TEFs, care must be taken when basing the RPFs on relative potency data that include mixed data sets. Mixed data sets may occur when either the effects data or dosimetry data used for 2,3,7,8-TCDD and the chemical of interest are inconsistent. Examples include: (1) dose-response relationships for the two chemicals from different laboratories or experiments; (2) inconsistent measures of dose (e.g. one chemical based on concentrations in tissues and the other on concentrations in exposure media); (3) potency of 2,3,7,8-TCDD assumed from previous experiments; (4) differences in experimental conditions that may influence relative potency; (5) inconsistent measures of effects (e.g. NOEL versus EC50), (6) inferred potency for a chemical from effects of mixtures with and without the chemical, and (7) inferred potency based on different effect endpoints and/or species/cell types for the two chemicals. While these examples may seem unlikely, cases have and can occur in which organisms are exposed to large concentrations of suspected or known AhR agonists which have not been assigned TEFs. When the relative potency data for these chemicals are limited to mixed data sets and new data can not be obtained, the systematic error associated with excluding the chemicals from the TEC analysis may well exceed any errors associated with use of the weak relative potency data. Under these circumstances mixed data probably should be used, as long as the nature of the data and uncertainties for the application are transparently reported. Transparent reporting includes providing a comparison of TECs calculated with and without (RPF = 0) an RPF that is based on mixed relative potency data.
Ideally, chemical-specific relative potencies based on both the species and endpoint of concern should be selected by risk assessors who wish to use RPFs. Often, however, such data are not available. In the absence of such data, a decision must be made as to which TEFs or RPFs provide the most accurate measure of relative potency for use in calculating TECs from chemical-specific residue data. In essence, the decision involves choosing between the uncertainty introduced by species-,
June 2003 48 DRAFT—DO NOT CITE OR QUOTE

123456789
101112131415161718192021222324252627282930313233
endpoint-, and dose metric-dependent differences in relative potencies. Although introduction of systematic errors is the most important component of these potential uncertainties to be reduced, data variability should be within acceptable bounds. In many cases, more than one type of uncertainty may be present. Common sense suggests that one should select the RPFs or TEFs that represent the best (i.e., most accurate) information available. However, since the magnitude of the uncertainty or potential error inherent in a given RPF or TEF choice often can not be quantified, the choice often requires best professional judgment.
3.3.2.2. Visualization and Application of Criteria for Selection of Optimum RPFs Data limitations do not negate the need to consider uncertainties and make optimum RPF/TEF
decisions, consistent with the applicable mechanism of action and dose metric, for the particular problem formulation, species, and effects of concern. To this end, the three dimensional matrix model (Figure 10) for evaluating relative potency data provides an approach for evaluating the applicability of different ReP data associated with TEFs or RPFs that may be available (or that could be derived) and the types of uncertainty inherent to each. Using this concept, selection of TEFs or RPFs can be based on a three dimensional hierarchical approach involving use of the best available information relative to the ideal choice - a species-specific RPF for the endpoint of concern based on optimum dose metrics. The rationale behind this hierarchical methodology is the mechanistic understanding of AhR-mediated toxicity as well as empirical data that support the extrapolation of relative potency data across endpoints and species. Currently, the ReP matrix model’s primary value is to allow a visualization of the complex factors that influence the applicability of potentially diverse relative potency data for specific risk assessment scenarios. This could include enhancement of efforts to describe uncertainties associated with RPF selections. Ultimately, the matrix model may be helpful in describing research needs and developing more quantitative methods and guidance for selecting RPFs.
It is important to keep in mind that the issue of species- or endpoint-specific differences in RPFs is separate from that of species differences in sensitivity to 2,3,7,8-TCDD. Limited ReP data for fish embryos (bull trout, lake trout, rainbow trout, and medaka) suggest that species sensitivity to 2,3,7,8-TCDD is associated with smaller RPFs for PCB 126 when based on early life stage mortality. These differences in RPFs are less than proportional to the differences in species sensitivity. Two species that differ widely in their sensitivity to 2,3,7,8-TCDD can have relatively similar RePs for most congeners. For example, chickens are 119-fold more sensitive than ducks for in vitro effects of 2,3,7,8-TCDD, yet for TCDF and PCB congeners 126 and 81 the in vitro-based RPFs differ less than 5-fold between these species (Kennedy et al., 1996). Similarly among fish, salmonids are the most
June 2003 49 DRAFT—DO NOT CITE OR QUOTE
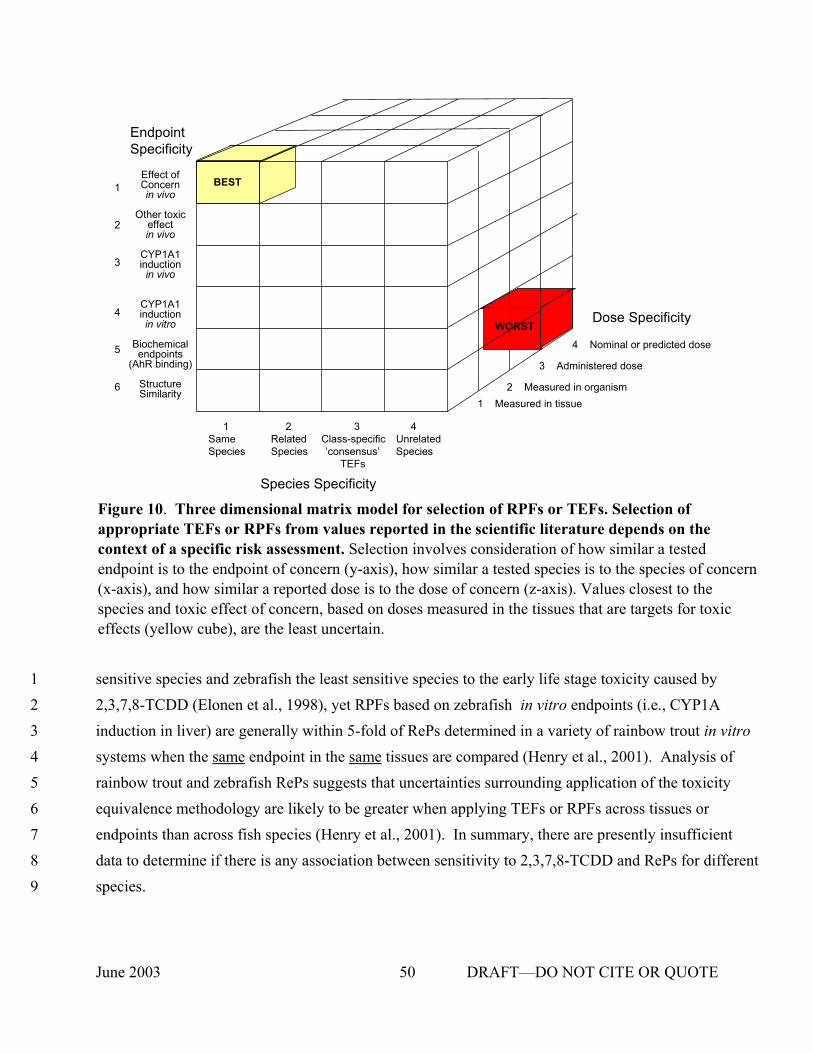
123456789
3 .
2 .
1
BEST
WORST
Endpoint Specificity
Effect of Concern in vivo1
Other toxic 2 effect
in vivo
CYP1A1 induction
in vivo
CYP1A14 induction Dose Specificityin vitro
5 Biochemical 4 Nominal or predicted dose endpoints
(AhR binding) Administered dose
6 Structure Similarity Measured in organism
Measured in tissue
1 2 3 4 Same Related Class-specific Unrelated Species Species ‘consensus’ Species
TEFs
Species Specificity
Figure 10. Three dimensional matrix model for selection of RPFs or TEFs. Selection of appropriate TEFs or RPFs from values reported in the scientific literature depends on the context of a specific risk assessment. Selection involves consideration of how similar a tested endpoint is to the endpoint of concern (y-axis), how similar a tested species is to the species of concern (x-axis), and how similar a reported dose is to the dose of concern (z-axis). Values closest to the species and toxic effect of concern, based on doses measured in the tissues that are targets for toxic effects (yellow cube), are the least uncertain.
sensitive species and zebrafish the least sensitive species to the early life stage toxicity caused by 2,3,7,8-TCDD (Elonen et al., 1998), yet RPFs based on zebrafish in vitro endpoints (i.e., CYP1A induction in liver) are generally within 5-fold of RePs determined in a variety of rainbow trout in vitro systems when the same endpoint in the same tissues are compared (Henry et al., 2001). Analysis of rainbow trout and zebrafish RePs suggests that uncertainties surrounding application of the toxicity equivalence methodology are likely to be greater when applying TEFs or RPFs across tissues or endpoints than across fish species (Henry et al., 2001). In summary, there are presently insufficient data to determine if there is any association between sensitivity to 2,3,7,8-TCDD and RePs for different species.
June 2003 50 DRAFT—DO NOT CITE OR QUOTE
3
123456789
101112131415161718192021222324252627282930
3.3.2.2.1. Endpoint specificity. The y axis of the conceptual model for RPF selection represents six tiers that correspond to the various in vivo, in vitro, and molecular similarity endpoints used currently to determine relative potency of congeners. The tiers represent a preferential ranking based on the endpoint for which RPFs are to be derived. The order of preference is similar to that used at the WHO workshop in deriving TEFs for fish, birds, and mammals (Van den Berg et al., 1998). The highest preference is given to RPFs determined for in vivo toxicity endpoints. Tier 1 is reserved for in vivo toxicity data for the endpoint of concern (e.g. early life stage mortality). Tier 2 is for other in vivo toxicity endpoints that may be less directly connected to the assessment endpoint of concern (e.g., growth or behavior). Tier 3 includes data for CYP1A1 induction in vivo and is followed by CYP1A1 induction in vitro in Tier 4 because in vitro data tend to be less toxicokinetically realistic than in vivo data. Lower preference in Tier 5 is assigned to RPFs determined using biochemical endpoints, which are more distantly related to typical ecological assessment endpoints. A primary example of Tier 5 is AhR binding affinity which is very mechanistically connected to, but considerably upstream from, toxicities of concern. Consistent with the WHO TEF selection process (Van den Berg et al., 1998), Tier 6 is reserved for chemical structure similarity approaches which may be more or less quantitative in comparing AhR agonist potencies to 2,3,7,8-TCDD for a variety of endpoints.
3.3.2.2.2. Species specificity. The x axis in the matrix model for RPF selection indicates the phylogenetic relatedness of the species of concern to the species for which RPFs are to be applied. It is divided into four levels, reflecting different degrees of uncertainty, with uncertainty increasing from left to right. If RePs are available for the species of concern (level 1 - same species), no interspecies extrapolation is involved in using these as RPFs, although other uncertainties such as endpoint extrapolation may still be an issue. If ReP data are available for a closely related species, a species within the same genus or family for example (level 2), uncertainty is greater due to potential species differences. The TEFs, although based in some cases on species-specific data, are based on class generalizations and are thus represented in the third level. In some cases TEFs may be based on a species closely related to the species of concern. In these cases the phylogenetic uncertainty is relatively less and the TEF may equate to one of the first two levels (same or related species). If ReP data are from a more distantly related species within the same class, uncertainty increases (level 4). When level 4 data are in agreement with other ReP data for more related species (level 2), uncertainty
June 2003 51 DRAFT—DO NOT CITE OR QUOTE

123456789
101112131415161718192021222324252627282930313233
is reduced for use of the level 4 data to determine an RPF for a specific chemical without level 2 ReP data.
The basis for the phylogenetic methodology reflected by the x axis of the three dimensional matrix model in Figure 10 for RPF selection is both theoretical and empirical. It assumes that two species that are more closely related phylogenetically will have RPFs (determined for the same endpoint) that are similar or identical. This methodology is supported by data such as that showing that the RPFs for PCB 126 to produce early life stage mortality in lake trout and rainbow trout vary by less than a factor of two (Zabel et al., 1995). However, it is clear that more data on the relative potency of congeners to produce various effects in additional species are necessary to more systematically test this assumption. Exceptions to this assumption for certain species or congeners may be revealed as additional data are collected.
It is important to note that when RePs for different endpoints are compared, rank order potencies of AhR agonists appear to be conserved but RePs based on CYP1A1 induction tend to be greater than RePs based on early life stage mortality. For example, rainbow trout liver EROD, liver cell culture EROD, and gonad cell CYP1A1 mRNA assays all produce RePs that average six to ten times greater than RePs based on rainbow trout early life stage mortality (Cook et al., 1997). This tendency for systematic differences related to organismal and biochemical response endpoints was considered in the WHO selection of TEFs for fish, birds, and mammals (Van den Berg et al., 1998) and the TEF workshop recommendations for improving RPF selections (U.S. EPA, 2001a).
3.3.2.2.3. RPF dose specificity for effect and consistency with dose-response relationship. The z axis of the matrix model for RPF selection represents the degree to which the dose data associated with different sets of RePs are related to the effect of concern and the associated mechanism of action (specificity) and the 2,3,7,8-TCDD dose-response relationship chosen for the assessment (consistency). To the extent dose specificity is related to the endpoint and species associated with each candidate set of RPFs, it may be best considered after characterizing the endpoint and species specificity of available RePs. A third concern is the specificity and accuracy of the analytical methodology used for the available relative potency data. Because of the complexity of dose metric impacts on RPF choices, evaluation of potential systematic errors associated with the analytical methodology should probably be accomplished as a final step in choosing RPFs.
As established in section 3.3.1.3, concentrations of chemicals measured in specific tissues of organisms or cell cultures, at a time most closely reflecting potency for causing the effect, are optimum expressions for doses associated with AhR mediated toxicity and can be placed in dose specificity Tier
June 2003 52 DRAFT—DO NOT CITE OR QUOTE

123456789
101112131415161718192021222324252627282930313233
1 if consistent with the 2,3,7,8-TCDD dose-response relationship chosen for the assessment. RPFs based on measured concentrations in fish embryos close to fertilization in association with subsequent mortality are good examples of Tier 1. RPFs based on in vivo CYP1A1 induction in fish would also fall into Tier 1 if concentrations of chemicals are measured at the appropriate time in the appropriate tissues.
Dose specificity Tier 2 incorporates uncertainties and systematic differences affecting measurements of administered doses (typically external to the organism or cell culture) associated with changes in concentrations during chemical uptake and distribution through different routes of exposure. An example is the effect metabolism in the organism may have on the relative amounts of 2,3,7,8-TCDD and test chemical in vivo in comparison to the relative amounts in the administered doses (e.g. in diet, water, sediment/soil, injection). As with Tier 1, Tier 2 assumes that the dose is consistent with the 2,3,7,8-TCDD dose-response relationship chosen for the assessment.
Dose specificity Tier 3 includes nominal (not based on measurement of concentrations in exposures) or predicted (based on mechanisms of fate and uptake during exposures) doses. In other words, Tier 3 includes both estimated/predicted in vivo doses and administered doses which are not determined by direct measurement during the test. Most in vitro effects based ReP data probably fall in Tier 3 of this axis, rather than Tier 2, because concentrations of the chemicals are often not measured in the cell cultures.
The consequences of inconsistencies between dose metrics used for RePs and the dose metrics involved with the 2,3,7,8-TCDD dose-response relationship chosen for an assessment are varied but should be considered. Dose specificity Tier 4 includes ReP data that would be in Tiers 1 or 2, if such inconsistencies were not present. A hypothetical example might be use of a largemouth bass early life stage mortality response relationship based on concentration of 2,3,7,8-TCDD in food of females during ovulation. The selection of the fish TEFs which have dose as concentrations measured in rainbow trout eggs would create a dose inconsistency associated with Tier 4. This inconsistency could be avoided and Tier 1 dose specificity/consistency achieved if the concentrations of 2,3,7,8-TCDD associated with largemouth bass early life stage mortality were measured in the largemouth bass eggs. Inconsistencies involving application of RPFs based on administered doses to 2,3,7,8-TCDD dose-response relationships based on measured dose in vivo would also be associated with Tier 4.
Finally, as mentioned above, dose data suspected of having significant errors that increase uncertainty for the use of an associated ReP as an RPF, effectively place the RPF in a lower dose specificity tier. An example of data which could fall into this category is the presence of more potent impurities in test chemicals that could cause the observed effects. For example, certain PCDFs are
June 2003 53 DRAFT—DO NOT CITE OR QUOTE

123456789
101112131415161718192021222324252627282930313233
known to contaminate PCB congener standards (Elliot et al., 1997; U.S. EPA, 2001a). Contamination of test samples usually becomes a problem when the contaminant causes the relative potency of the test chemical to be overestimated. Other sources of dose measurement errors may be related to limitations of analytical methods.
3.3.2.3. Examples of ReP Data Prioritization Choices for Selecting RPFs Because the three dimensional matrix model for selecting RPFs from relative potency data
(Figure 10) is realistic but is unlikely to evolve into a purely quantitative and unambiguous model in the future, any number of questions concerning specific data may arise with its application in risk assessments. A few examples of such questions are presented here to assist in understanding how the approach can be used to consider and select RPFs from the types of ReP data available:
Example 1. Often, ReP data sets are incomplete. Is it appropriate to select RPFs from different ReP data sets in order to calculate a TEC for a specific species? For example, in performing an ecological risk assessment for lake trout based on early life stage mortality, the only RPF that exists specifically for lake trout is for PCB 126. For other congeners, RPFs exist only for rainbow trout or other fish species. The PCB 126 RPF for lake trout is based on early life stage mortality, with the dose measured as the concentration in the embryo. Therefore, it is appropriate to choose the lake trout RPF for PCB 126, and rainbow trout RPFs for the other congeners. In this specific case, since PCB 126 is the most potent PCB, choosing a more species-specific RPF probably increases accuracy of the TEC for lake trout. Insufficient data exist to determine if use of rainbow trout based TEFs for the other congeners may over- or under- estimate the TEC for lake trout (with respect to the 2,3,7,8-TCDD dose-response relationship based on lake trout).
Example 2. Choosing RPFs on the basis of species similarities versus endpoint similarities, in the absence of data that would allow one to quantify the uncertainty in each, creates difficult questions. For example, early life stage mortality risks for Caspian terns, using measured, congener-specific concentrations of PCDDs, PCDFs, and PCBs in tern eggs, cannot be assessed with RPFs specifically based on early life stage mortality in Caspian terns. Also, the only bird early life stage mortality data for 2,3,7,8-TCDD (i.e., dose-response data for conducting the effects assessment) are for chickens and pheasants. It is well established that chickens are exceptionally sensitive to 2,3,7,8-TCDD induced embryo mortality relative to other bird species. Assume, based on knowledge of population responses of Lake Ontario Caspian terns to historical 2,3,7,8-TCDD exposures, that the terns are significantly less sensitive than chickens. Therefore pheasant, rather than chicken, early life stage mortality data for 2,3,7,8-TCDD has been chosen for application in the effects assessment for Caspian terns. Based on
June 2003 54 DRAFT—DO NOT CITE OR QUOTE

123456789
10111213141516171819202122232425262728293031323334
the present state of the science, the choice of the pheasant early life stage 2,3,7,8-TCDD dose-response relationship for Caspian terns does not influence the choice of RPFs. Rather, selection ofRPFs is based on specificity to Caspian tern early life stage mortality (assuming dose specificity is not a
problem).Assume there are RePs for (A) in vitro CYP1A induction in liver cells of Caspian terns, (B) in
vivo early life stage mortality in domestic chickens (used to establish the TEFs-WHO98) and (C) in vivo CYP1A induction in embryos of common terns, a closely related species. Table 7 illustrates the positions these three types of data would have in the species-endpoint specificity matrix model. Which of these three sets of ReP data would provide the most accurate estimate of the embryo TEC for a population of Caspian terns? The TEFs-WHO98, based largely on chicken embryo mortality, might be regarded as preferable because the endpoint used is more relevant to the effect of concern. However, differences between TEFs-WHO98 and tern RPFs could indicate some fundamental difference between terns and chickens in the relative potencies of these congeners. Under these conditions, the greater species specificity of tern CYP1A induction based RPFs might be considered more relevant than the higher endpoint specificity of most of the chicken based TEFs. Since Caspian terns are very closely related to common terns, RPFs based on in vivo CYP1A induction in embryos of common terns should be preferred over the RPFs based on in vitro CYP1A induction in liver cells of Caspian terns. One option when confronted with such difficult choices is to calculate TECs with both sets of RPFs and then compare the risk estimates obtained for the most relevant toxicity data. The comparison may indicate both the magnitude and sources of the uncertainty (e.g., specific congeners with large differences in RPFs). Thus, this type of analysis can contribute to the Caspian tern early life stage mortality risk assessment itself as well as identifying additional data that might help to reduce the uncertainty.
Example 3. As described in section 3.3.1.3 of this report, the dose metric used in an exposure analysis should be consistent with the dose metric associated with the dose-response relationship chosen for the risk assessment. It follows that the dose metric basis for the RPFs (or TEFs) selected in an assessment should be as consistent as possible with the dose metrics for both the exposure analysis, as reflected in the dose specificity axis of Figure 10, and the dose-response relationship. Example 3 illustrates how the choice of a dose-response relationship and options for the exposure assessment may influence the choice of RPFs.
The case is founded on a study by Tillitt et al. (1996), who assessed risk of reduced mink kit survival as a consequence of exposure of female mink through a diet of contaminated fish. Concentrations of PCDDs, PCDFs, and PCBs in both the fish fed to mink and in the livers of the exposed mink were measured as alternative exposure expressions.
June 2003 55 DRAFT—DO NOT CITE OR QUOTE

1234567
8
91011
1213
141516
171819
202122
232425
26
Table 7. RPF selection matrix model for Caspian terns (example 2) for optimizing species and endpoint specificity. In this example, the risk assessor is faced with choosing from (A) an ReP based on in vitro effects in the species of concern, (B) an ReP based on in vivo effects in a related species, or (C) TEFs, which are based on the in vivo effects of concern in an unrelated species
Endpoint
1) Effect of No data B. Chicken early life
Concern stage mortality data
in vivo
2) Other Toxic Effect in vivo
3) CYP1A induction in vivo
4) CYP1A induction in vitro
5) Biochemical endpoints (AhR binding)
6) Structure Similarity
C. Common Tern data
A. Caspian Tern data
1) Same Species 2) Related Species 3) Class-Specific 4) Unrelated (e.g., same genus ‘Consensus’ TEFs Species
or family)
27 Taxonomic Relationship to Species of Concern
28 29
June 2003 56 DRAFT—DO NOT CITE OR QUOTE
123456789
10111213141516171819202122232425262728293031323334
Two sets of RPFs, the TEFs-WHO94 (the TEFs-WHO94 for mammals are essentially the same as the TEFs-WHO98) and a set of RPFs based on rat hepatoma cell (H4IIE) EROD induction, were then used to estimate alternative TECs that represented kit survival thresholds. The result was four separate kit survival threshold TECs:
• 1.9 pg 2,3,7,8-TCDD equivalence/g diet based on TEFs-WHO94. • 4.4 pg 2,3,7,8-TCDD equivalence/g diet based on H4IIE RPFs. • 60 pg 2,3,7,8-TCDD equivalence/g female mink liver based on TEFs-WHO94. • 70 pg 2,3,7,8-TCDD equivalence/g female mink liver based on H4IIE based RPFs.
Note that the dose-response relationship between exposure to 2,3,7,8-TCDD alone and kit survival was not examined in the Tillitt et al. (1996) study. Only the mixture of PCDDs, PCDFs, and PCBs present in the fish diet and mink livers were evaluated.
Consider a risk assessment that involves the effects of fish contamination on mink kit survival based on a field data set that includes concentrations of PCDDs, PCDFs, and PCBs both in several species of fish and in livers of mink from the area. The paper by Tillitt et al. (1996) is an invaluable source for evaluating risks to mink because it involves both the species of concern and the endpoint of concern, particularly given that no reproductive effects data for 2,3,7,8-TCDD have been reported for mink or any other mammalian wildlife species. Since the Tillitt paper is the logical source for the dose-response relationship, selection of both the exposure metric and the RPFs for the assessment should be consistent with the dose-response relationship used. If a TEC based on mink liver is selected from the study by Tillitt et al., then clearly using the field data set from the mink liver would be a more comparable exposure dose metric than the fish diet data. This choice also would affect selection of corresponding RPFs, suggesting the use of RPFs based on in vivo tissue measurements, as discussed below. Conversely, if a mink diet TEC from the Tillitt et al. study is chosen for the effects characterization, then it would be advisable to employ the field data set based on fish contamination and RPFs based on dietary administration.
Which exposure metric would be preferable, the fish diet or the mink liver concentrations? In this case the mink liver chemical residue data probably provide a more direct and precise measure of exposure than would reconstruction of the average dietary exposure from the fish monitoring data. Theoretically, the net effect of metabolism and biomagnification on the mixture composition in vivo is better accommodated by basing the TEC on concentrations in the mink liver, rather than as administered in the diet. The question then becomes, which RPF set has the greater dose specificity if mink liver based exposure data are chosen? Both TEFs-WHO98 and rat liver H4IIE-RPFs are based
June 2003 57 DRAFT—DO NOT CITE OR QUOTE

123456789
10111213141516171819202122232425262728293031323334
on administered doses and thus cannot be used in a manner completely consistent with the dose metric (measured concentrations in liver tissue) for the liver dose-response relationships available (Tillitt et al., 1996). However, since the H4IIE-RPFs are based on administered dose to liver cells, they circumvent potential errors associated with biomagnification that would affect RPFs based on doses administered through diet. If H4IIE-RPFs are used to derive a TEC for this risk assessment, then they should also be used in deriving the threshold TEC from the Tillitt et al. study (i.e., the selected threshold TEC would be 70 pg 2,3,7,8-TCDD equivalence/g female mink liver).
A third choice of liver exposure consistent RPFs exists: a partial set of RePs based on hepatic EROD in female mice following sub-chronic exposures characterized as measured concentrations in liver of PCDDs and PCDFs (DeVito et al., 1997) and PCBs (DeVito et al., 2000). The mouse liver EROD ReP data for PCDDs and PCDFs are similar to both TEFs-WHO98 and rat liver H4IIE-RPFs but closer for PCBs to the H4IIE-RPFs than rat liver H4IIE-RPFs. Since the mouse liver EROD RFPs are based on measured concentrations in the livers as well as in vivo response, they are more dose specific than TEFs-WHO98 or the rat liver H4IIE-RPFs for application to the chemical concentrations measured in mink livers. Therefore, the best choice for RPFs in this case is probably to use those based on mouse liver EROD, supplemented with H4IIE values for congeners without mouse liver EROD RePs.
Mink liver exposure data are not always going to be available. If the risk assessor chooses to use fish diet as the exposure measure, it would be more consistent to employ RPFs based on administered dose. In that case, the TEFs-WHO98 probably would be preferable to the H4IIE-RPFs or mouse liver EROD-RPFs. This in turn would necessitate selection of the threshold TEC of 1.9 pg 2,3,7,8-TCDD equivalence/g diet based on TEFs-WHO94 from Tillitt et al. (1996).
When choices for RPFs must be made for alternative dose-response relationships as well as alternative dose expressions for ReP data (as summarized for example 3 in Table 8) to what extent can one determine which set of RPFs is the most accurate? Lacking a site-specific mink bioassay, there is insufficient information to be sure which set provides a more accurate result, but consistency in the selection of the dose-response relationship, the exposure metrics, and the RPFs can be maintained, while selecting exposures and effects that correspond as closely as possible to the endpoint of concern. Such consistency greatly reduces the potential for systematic errors. As pointed out in example 2, comparison of calculations using the alternative RPFs may be helpful in describing the range of possible risk values. In the case of Tillitt et al. (1996), differences between the alternative RePs for the PCBs were most responsible for the differences in TECs for the TEFs-WHO98 vs. the H4IIE-RPFs (PCBs were responsible for about 60% of the TECs for the TEFs-WHO94 compared with 10% for the H4IIE-RPFs). Therefore, applications of the RPFs that are inconsistent with the choice of TEC-effect
June 2003 58 DRAFT—DO NOT CITE OR QUOTE

123456789
101112131415161718192021222324252627282930313233
relationship would likely have a more significant effect on the final risk estimates at sites where PCBs are present at high concentrations, relative to PCDD and PCDF concentrations, than where PCBs are relatively less important.
The three examples provided above should be regarded as illustrative of the variety of considerations that may be involved in selecting RPFs or TEFs for specific applications. Choices are suggested primarily to complete the illustrations, not as prescriptions for specific applications. The complexities involved in evaluating RPFs as alternatives or adjuncts to TEFs testify to the value of having the TEFs, which are based on expert opinion, as potency factors in an assessment. Conceptualizing (Figure 10) and experiencing the RPF selection process provides insights into research needs and potential considerations for future reassessments of the TEFs.
3.3.2.4. Summary of Selection of TEFs or RPFs When confronted with a lack of RPF data for the specific species and endpoint of concern,
choices from alternative RPFs and the TEFs must be made. This necessary choice may be used to minimize uncertainty based on differences in species, endpoints, and/or dosimetry associated with specific relative potencies. Uncertainties associated with the use of TEFs and RPFs are separate from the uncertainty occurring as a result of species differences in sensitivity to 2,3,7,8-TCDD. The former affects the accuracy associated with exposure characterization (i.e. the 2,3,7,8-TCDD toxicity equivalence concentration to which the species is exposed), whereas the latter impacts the effects characterization (i.e. the species response expected for exposure of the species to that concentration of 2,3,7,8-TCDD). While data are currently insufficient to determine definitively which type of uncertainty is greater, a larger uncertainty for species response to 2,3,7,8-TCDD exposure does not reduce the need to minimize uncertainties associated with the selection of RPFs and TEFs.
A best available information methodology using the three dimensional matrix model (Figure 10) is recommended for RPF/TEF selection. Species specificity, endpoint specificity, and dose specificity/consistency are the three factors to consider when creating a hierarchy of possible RPFs from the available ReP data for each chemical. To the extent dose specificity is related to the endpoint and species associated with each candidate set of RPFs, it may be best considered after characterizing the endpoint and species specificity of available RePs. When relative potency data for a mixture of chemicals lack consistency for species, endpoint, or dose metric, systematic errors associated with excluding chemicals with inconsistent RPFs from the TEC analysis may well exceed any errors associated with use of the weak relative potency data. However, in the absence of more specific RPFs for the species and endpoint of concern, the class-specific TEFs-WHO98 are expected, in most cases,
June 2003 59 DRAFT—DO NOT CITE OR QUOTE

Table 8. Considerations in RPF selection for the mink example. The risk assessor is seeking to select RPFs or TEFs that are most consistent with the species, endpoint, and dose metrics used for each of four possible dose-response relationships from Tillitt et al. (1996). The advantages and disadvantages of alternative sets must be considered. As described in the text, one approach might be to select the RPFs based on mice EROD induction if concentrations of PCDDs, PCDFs, and PCBs in mink tissue have been obtained, but use the TEFs-WHO94 if concentrations in fish that make up the diet are the only available source of exposure information.
June 2003 60
DR
AFT—
DO
NO
T CITE O
R Q
UO
TE
TEF or RPF
Species
Characteristics of optimal mink RPFs If using the dose-response relationships and exposure metrics presented in Tillitt et al. (1996)
Mink
Characteristics of available TEFs/RPFs from which to select
TEFs-WHO94 H4IIE EROD Mice hepatic EROD (partial set)
Mammals as a class (based primarily on rodents)
Rats Mice
Vary depending on the congener; includes subchronic or chronic effects in vivo and in vitro
EROD induction in vitro
EROD induction in vivo
For in vivo endpoints, based on concentrations in diet
As added to cell culture
Measured in liver tissue
Endpoint
Dose
Kit survival
TEC in diet based on concentrations in fish
TEC in female mink based on concentrations in liver

123456789
10111213141516171819202122232425262728293031323334
to be used for the assessment RPFs. In other cases with more ReP data choices, final selection of RPFs may involve use of sensitivity analysis based on TECs that result from the use of alternative RPFs.
Through three examples involving RPF selection scenarios that illustrate applications of the ReP matrix model for selecting RPFs, several additional considerations were identified: • Accuracy of a TECs is probably increased when a more species-specific and endpoint-specific
RPF is used for a key chemical. • Species specificity for RPFs is based on the species being assessed, not the species on which the
dose response relationship is based. • RPFs based on in vivo CYP1A induction in a closely related species may be preferable to RPFs
based on a more endpoint-specific effect in an unrelated species, especially when significant differences in the RPFs may be attributable to differences in toxicokinetic or toxicodynamic relationships for the species.
• The dose metrics for the RPFs or TEFs used should be as consistent as possible with the dose metrics for both the dose response relationship and the exposure analysis.
• In some cases the most applicable dose response relationship may be based on TECs, determined with a specific set of RPFs for a complex mixture exposure, rather than concentration of 2,3,7,8-TCDD alone.
• The choice of a specific dose response relationship may be influenced by the ReP data available for selecting RPFs and the nature of exposure measurements available.
3.3.3. Characterization of Ecological Effects An ecological effects analysis includes an examination of all data describing the effects of the
specific chemicals of concern. This analysis concludes with a stressor-response profile. Because PCDDs, PCDFs, and PCBs present in the environment are generally found as complex mixtures, an assessment of ecological risk requires both quantifying their individual exposures and developing a stressor-response profile for their cumulative effects. Figure 6 includes a stressor-response curve illustrating the relationship between early life stage mortality and exposure to TCDD, which is an example of a relationship that can be used in developing a stressor-response profile.
Demonstrated toxic effects of 2,3,7,8-TCDD in wildlife species include immunotoxicity; adverse effects on reproduction, development and endocrine functions; wasting syndrome; and mortality. While 2,3,7,8-TCDD is by far the most studied of the dioxin-like compounds, a number of other PCDDs, PCDFs, and PCBs have been shown to cause toxic responses similar to 2,3,7,8-TCDD in both laboratory and field situations. A summary of effects associated with exposure to 2,3,7,8-TCDD and related compounds is presented in Table 3. For further information regarding effects
June 2003 61 DRAFT—DO NOT CITE OR QUOTE

123456789
101112131415161718192021222324252627282930
(3-9)
observed specifically in wildlife, refer to U.S. EPA (1993, 2001b) and references therein. toxicological studies used in generating RPFs and TEFs are of critical importance in providing a basis for evaluating the causal connection between exposure to dioxins and potential effects, and for understanding how the effects change as a function of exposure.
A stressor-response profile for the cumulative effects of PCDD, PCDF, and PCB mixtures is typically based on the stressor-response profile for 2,3,7,8-TCDD. equivalence methodology, TEFs (or RPFs) ‘convert’ the various congener concentrations into a ‘common currency,’ the TEC, which is a TCDD equivalent concentration. profile for TCDD is often used because the only or best available data for endpoints of concern are for this chemical. ve RPFs for other PCDDs, PCDFs, or PCBs may have been derived in in vitro systems or for assessment endpoints other than those defined for a given ecological risk assessment. ay be possible to develop stressor-response profiles for chemicals other than 2,3,7,8-TCDD. employed when particular congeners other than 2,3,7,8-TCDD dominate the estimated TEC.
3.4. CONSIDERATIONS IN RISK CHARACTERIZATION In risk characterization, the final phase of ecological risk assessment, the exposure profile and
stressor-response profile developed during the analysis phase are combined to realize the final estimate of risk. methodology to develop risk estimates is described in section 3.4.1. including field and laboratory studies and process models are evaluated with respect to the risk estimate and the assessment endpoint. ent are also summarized. Section 3.4.3 discusses uncertainties associated with the toxicity equivalence methodology and how they impact use of the methodology in risk assessment. ate are presented.
3.4.1. Risk Estimate When the toxicity equivalence methodology is used, exposure is expressed by the TEC, which
reflects the combined influence of the individual congeners which comprise the mixture. usually estimated based on studies of the toxicity of 2,3,7,8-TCDD.
The
Recall that in applying the toxicity
The stressor-response
Many of the studies used to deri
If sufficient data are available, however, it mSuch an approach has been
Application of the toxicity equivalence Additionally, as discussed in section 3.4.2., during this phase all lines of evidence
The uncertainties in the assessm
Finally, the conclusions regarding the risk estim
Effects are TEC values for the ecological risk
31
62

123456789
101112131415161718192021
assessment are compared to available TCDD toxicity values to estimate the likelihood and magnitude of effects. The nature of the comparison depends upon the extent of both exposure and effects information. The simplest kind of a comparison (known as the quotient method) used for many chemicals is an exposure concentration point estimate divided by a reference toxicity, with quotients exceeding “one” suggesting a likelihood for effects: This approach, however, has a number of limitations. It does not provide an incremental quantification of risks, and it may not be appropriate for predicting secondary ecological effects. If sufficient data are available, more elaborate comparisons or modeling can be performed that reflects a distribution of exposure values and a more comprehensive stressor-response profile. Comparing TEC values to a stressor-response curve, as shown in Figure 6, allows estimates of the magnitude and likelihood of effects and associated uncertainties. Additional discussion of stressor-response profiles and methods for risk estimation in ecological risk assessment is available in U.S. EPA (1998).
It should be noted that dioxin-like compounds may be only one of a number of classes of possible stressors identified in the conceptual model for the ecological risk assessment. The risk estimation will also include other such stressors, and may evaluate the relative contributions of various stressors to observed or anticipated effects.
3.4.2. Lines of Evidence This framework presents
considerations for the application of RPFs or Text Box 6. Questions for risk TEFs in the development of one possible line of characterization.
T Have I clearly presented the assumptions and uncertainties associated with applying the toxicity equivalence methodology and in preparing the risk estimates based on TECs?
T Have I considered multiple lines of evidence, such as bioassays, field surveys, or other relevant RPFs?
T Have I considered the evidence for causality associated with each line of
63
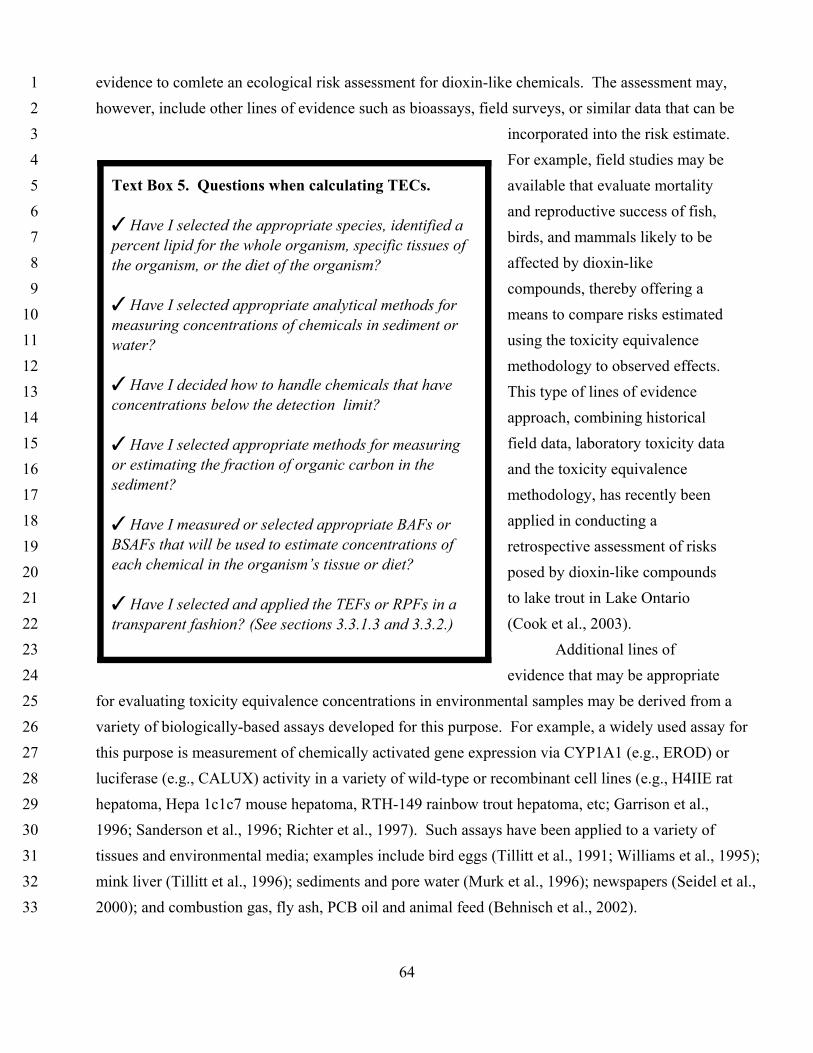
123456789
101112131415161718192021222324252627282930313233
evidence to comlete an ecological risk assessment for dioxin-like chemicals. The assessment may, however, include other lines of evidence such as bioassays, field surveys, or similar data that can be
Text Box 5. Questions when calculating TECs.
T Have I selected the appropriate species, identified a percent lipid for the whole organism, specific tissues of the organism, or the diet of the organism?
T Have I selected appropriate analytical methods for measuring concentrations of chemicals in sediment or water?
T Have I decided how to handle chemicals that have concentrations below the detection limit?
T Have I selected appropriate methods for measuring or estimating the fraction of organic carbon in the sediment?
T Have I measured or selected appropriate BAFs or BSAFs that will be used to estimate concentrations of each chemical in the organism’s tissue or diet?
T Have I selected and applied the TEFs or RPFs in a transparent fashion? (See sections 3.3.1.3 and 3.3.2.)
incorporated into the risk estimate. For example, field studies may be available that evaluate mortality and reproductive success of fish, birds, and mammals likely to be affected by dioxin-like compounds, thereby offering a means to compare risks estimated using the toxicity equivalence methodology to observed effects. This type of lines of evidence approach, combining historical field data, laboratory toxicity data and the toxicity equivalence methodology, has recently been applied in conducting a retrospective assessment of risks posed by dioxin-like compounds to lake trout in Lake Ontario (Cook et al., 2003).
Additional lines of evidence that may be appropriate
for evaluating toxicity equivalence concentrations in environmental samples may be derived from a variety of biologically-based assays developed for this purpose. For example, a widely used assay for this purpose is measurement of chemically activated gene expression via CYP1A1 (e.g., EROD) or luciferase (e.g., CALUX) activity in a variety of wild-type or recombinant cell lines (e.g., H4IIE rat hepatoma, Hepa 1c1c7 mouse hepatoma, RTH-149 rainbow trout hepatoma, etc; Garrison et al., 1996; Sanderson et al., 1996; Richter et al., 1997). Such assays have been applied to a variety of tissues and environmental media; examples include bird eggs (Tillitt et al., 1991; Williams et al., 1995); mink liver (Tillitt et al., 1996); sediments and pore water (Murk et al., 1996); newspapers (Seidel et al., 2000); and combustion gas, fly ash, PCB oil and animal feed (Behnisch et al., 2002).
64

123456789
10111213141516171819202122232425262728293031323334
Several recent reviews summarize the state-of-the-art in performing these assays as well as strengths and limitations associated with them (Behnisch et al., 2001; Seidel et al., 2000; Denison et al., 1999). These bioanalytical tools have the advantage of measuring the integrated effects of complex mixtures of AhR agonists. Such assays have the potential of accounting for, in biological response, compounds that act via the AhR which would not be identified by a chemical residue methodology that measures only PCDDs, PCDFs, and PCBs. Also, bioanalytically-derived TECs can typically be obtained more quickly and at a lower cost than toxicity equivalence concentrations obtained by chemical analysis. These characteristics make the bioanalytical techniques valuable screening tools.
Several potential problems are associated with these tools, however (see Behnisch et al., 2001 for detailed discussion). They can overestimate the toxic potency of compounds that are rapidly metabolized in vivo (e.g., PCB 77) and experts at the EPA/DOI workshop (U.S. EPA, 2001a) concluded that the potential for generating false positive responses was high in situations where potent EROD-inducing, non-dioxin-like compounds (e.g., PAHs) are abundant. An important shortcoming of these assays is that they are not chemical specific (Schmitz et al., 1996), and hence cannot be used to show causality for individual chemicals or classes of chemicals in environmental samples nor can the results derived from them be used in fate and transport and food chain modeling.
Due to current technical limitations, lack of standard testing procedures and lack of established quality criteria associated with existing bioanalytical tools (for summary see Behnisch et al., 2001), the experts at the EPA/DOI workshop concluded that such assays should not be used as an alternative to congener-specific analysis and the toxicity equivalence methodology. Rather, these assays are complementary tools with great utility as screening tools, particularly for defining spatial extent of contamination, for prioritizing remedial actions, and for providing a relative measure of TECs between different environmental media (U.S. EPA, 2001a; Van den Berg et al., 1998).
3.4.3. Summary of Uncertainties One of the components of a successful risk assessment is the identification, quantification, and
where possible reduction of uncertainties. This section provides a summary of both the uncertainties inherent to the toxicity equivalence methodology itself and the uncertainties associated with the application of the methodology in ecological risk assessment. While there are uncertainties associated with the application of the toxicity equivalence methodology, they are believed to be in aggregate less significant those associated with other aspects of the risk assessment process and those associated with other approaches (e.g., Aroclors). The uncertainties associated with TEFs are only briefly discussed here, but are described in detail in Van den Berg et al. (1998) and U.S. EPA (2001a). The EPA workshop report (U.S. EPA, 2001a) further discusses uncertainties in application of the methodology
65
123456789
10111213141516171819202122232425262728293031323334
in ecological risk assessment. Uncertainties associated with interpreting the ecological significance oftoxicity from dioxin-like compounds are not discussed in this framework, but may be found in U.S.EPA (1993; 1995b, c; 2001b).3.4.3.1. Uncertainty Associated With the Toxicity Equivalence Methodology
Though uncertainties in the toxicity equivalence methodology are less than those associated with alternative approaches, they do exist. Uncertainties inherently related to the toxicity equivalence methodology are associated with the assumptions and procedures used to derive TEFs or RPFs and the experimental relative potency data underlying them.
3.4.3.1.1 Ah receptor ligands. The consensus WHO-TEF98s include only those PCDDs, PCDFs
and PCBs known to elicit Ah receptor-mediated responses. The toxicity equivalence methodology
does not apply to effects that are not Ah receptor mediated (even if caused by the same chemical) and
it does not consider modulating effects from chemicals that are not Ah receptor ligands. Currently there
are consensus TEFs for 29 PCDD, PCDF and PCB congeners, but RPFs for other dioxin-like
chemicals are possible based on existing or emerging ReP values (Villeneuve et al., 2000). Bioanalytical tools such as those mentioned in Section 3.4.2. can be used to reduce uncertainty aboutwhether currently available TEFs or RPFs are sufficient to fully characterize dioxin-like exposures being
considered in an ecological risk assessment.
3.4.3.1.2 Additivity assumption. The fundamental assumption of the toxicity equivalence
methodology is that the exposures to PCDDs, PCDFs, and PCBs, when expressed as toxicity
equivalence concentrations in tissues or diet of a fish, bird, or mammal, are additive, regardless of the
exposure concentrations, routes of exposure, and species. Section 2.1 describes the theoretical and
empirical basis for the assumption of additivity. Van den Berg et al. (1998) concluded that use of an
additive toxicity model is the most plausible approach for assessing combined risks from dioxin-like
compounds, despite the fact that some non-additive interactions among compounds have been
reported. Considerable experimental data, for ecologically relevant exposures and toxicity endpoints
such as early life stage mortality, support the additivity assumption with no evidence of antagonism orsynergism (Walker and Peterson, 1991; Walker et al., 1996; Zabel et al., 1995; Tillet et al., 1996). Thus, the assumption of additivity is unlikely to introduce a high degree of error in ecological risk
assessments.
3.4.3.1.3 Relative potency data. Inaccuracies among individual dose-response studies used to
determine relative potencies of dioxin-like chemicals, as well as the variability among alternative ReP
66

123456789
10111213141516171819202122232425262728293031323334
values, are sources of uncertainty in TEFs and RPFs. Accuracy of RePs may be attributed to factors such as purity of the test compounds, study design (e.g., exposure regimens and endpoints measured), and measurement errors. Variability in ReP data may be attributable to factors such as precision of dose and effects measurements and the natural variability among organisms of the same species in their response to dioxin-like chemicals. Sources of inaccuracy and variability have not been adequately examined experimentally to allow for determination of their relative magnitudes or their relative contribution to the overall variability of ReP data used to formulate TEFs or RPFs. Because ReP data sets are inherently heterogeneous, uncertainties in ReP data used to select TEFs or RPFs should be analyzed on a case by case basis.
3.4.3.1.4 Point estimates. TEFs and RPFs are point estimates even though the experimental data from which they are derived may range over several orders of magnitude. Hence, TEFs and RPFs include uncertainty in the individual RePs, as well as the uncertainty in the method used to derive the TEF or RPF. Because of the multiple models used for deriving ReP values for a particular chemical, it is difficult to estimate the variability or uncertainty of a TEF or RPF point estimate; however, qualitative assessment of uncertainties associated with the use of TEFs/RPFs is possible. When evaluating uncertainties associated with use of TEFs or RPFs, some points to consider:
• Qualitative judgements, based on expert opinion, of data quality and confidence in ReP values are embodied in establishment of the TEF-WHO98s.
• In an attempt to harmonize TEFs across vertebrate classes, TEFs-WHO98 were rounded to the nearest factor of 5 or 10 (Van den Berg et al., 1998), which introduces systematic error into the final TEFs-WHO98 values (U.S. EPA, 2001).
• It is generally assumed that considering multiple RePs rather than a single ReP allows a better estimate of the true potency value (i.e., provides greater weight of evidence).
• In some cases, standard errors associated with RePs (i.e, variability around ReP estimates) have been reported in the literature. To date they have not been routinely carried over into deriving TEFs, but if available, could be carried over into RPFs.
• Meta-analyses or Monte Carlo techniques have been proposed as methods for providing quantitative uncertainty descriptors for individual TEFs or RPFs (Finley et al., 1999). However, bear in mind that these approaches deal only with uncertainties associated with the precision of the
67

123456789
10111213141516171819202122232425262728293031323334
data and are only as good as the data available. Given the current incompleteness of available data and limited replication, it has been concluded that such approaches are not feasible at this time (U.S. EPA, 2000a). Alternatively, performing TEC calculations with a range of appropriate RePs in addition to the TEF or RPF point estimates would be one approach for incorporating a measure of uncertainty in risk estimates.
3.4.3.2. Uncertainty Associated With Application of the Toxicity Equivalence Methodology in Ecological Risk Assessment
In addition to uncertainties inherent in the toxicity equivalence methodology, application of the methodology involves a number of uncertainties common to any ecological risk assessment. The uncertainties in characterization of exposure, characterization of effects, and risk characterization are described in the report in detail. This section provides a summary of these uncertainties. In general, uncertainties in any risk assessment include natural variability in chemical concentrations, interspecies differences in sensitivity in exposure, errors in field in laboratory measurements of exposure and effects, lack of knowledge regarding pathways and routes of exposure, and errors in models of effects and exposure.
3.4.3.2.1 Uncertainties in characterization of exposure. Use of the toxicity equivalence methodology in an ecological risk assessment introduces considerations that can affect overall risk assessment uncertainty. As discussed previously, concentration measurements and fate and transport modeling of individual chemicals are essential for application of the toxicity equivalence approach, which is based on estimates of exposure point concentrations for each chemical. Chemical mixture approaches (e.g., Aroclors, homologs, H4IIE), while feasible for toxicity descriptions, are not amenable to fate and transport or bioaccumulation modeling. The scope of chemical-specific fate and transport and bioaccumulation modeling may seem greater due to the tracking of multiple chemicals; however rigor, simplicity, and accuracy are inherently greater than for the mixture approaches. While fate and transport uncertainties in ecological risk assessment are not unique to the toxicity equivalence methodology, the risk assessor needs to be aware that appropriate data need to be collected for each congener considered in the risk assessment and appropriate models modified to include each congener.
The variability in chemical concentrations in environmental media will affect measures of exposure as well as the bioaccumulation potential for organisms at risk. Variability in chemical concentrations may appear to be a concern with the toxicity equivalence methodology because of the number of congeners involved. However, it is the same variability that occurs when any group of chemicals are considered in estimating exposures. Furthermore, each chemical’s incremental
68

123456789
10111213141516171819202122232425262728293031323334
contribution to overall variability in a TEC is proportional to the fraction of the TEC associated with the chemical. Variability associated with each chemical is additive, not compounded, in the toxicity equivalence method. Analytical measurement errors associated with current chemical-specific methods, when conducted to meet appropriate exposure data quality objectives, need not be a major source of uncertainty within an ecological risk assessment.
The bioaccumulation potential of PCDDs, PCDFs and PCBs is influenced by several site- and species-specific factors (e.g., trophic level, benthic/pelagic food chain, sediment organic carbon, organismal lipid, and sediment-water concentration quotient) as discussed in detail in Section 3.3.1.4. Hence, extrapolation of bioaccumulation factors (i.e., BAFs or BSAFs) from one ecosystem to another is a source of uncertainty. Extrapolation of relative bioaccumulation differences between chemicals should be most accurate. When bioaccumulation factors must be extrapolated, the uncertainty associated with this approach can be reduced by selecting bioaccumulation factors for conditions that are most similar to the species and ecosystem of interest. Adjustments for lipid and organic carbon are built into BAFs and BSAFs. Adjustments for other key parameter differences can be made on the basis of simple food chain model predictions (see Burkhard et al., 2003). Uncertainties for the actual site-specific point estimates for each chemical can be reduced by measuring bioaccumulation factors that are specific for the risk assessment being conducted. Choosing fixed reference sites for sampling organisms, sediment, and water for all aspects of the risk assessment and future monitoring is an important step in reducing uncertainty for relating risks to concentrations in water and sediments over time.
Use of the toxicity equivalence methodology in exposure assessment of dioxin-like PCDDs, PCDFs, and PCBs introduces uncertainties inherent in the TEFs or RPFs (discussed in previous section) into the risk assessment. In addition, the use of TEFs or RPFs introduces extrapolation uncertainties that are common to all ecological risk assessments (e.g., inter-species, endpoint, dosimetry). Sections 3.3.1.3 and 3.2 provide detailed presentation of the considerations to be made to select TEFs or RPFs that introduce the least amount of uncertainty with incorporating the toxicity equivalence methodology into an exposure assessment. Furthermore, the matrix which was introduced in this framework (Figure 10) provides an approach for careful selection of the appropriate ReP based on the most appropriate studies and for documenting decisions made in TEF or RPF selection. Gaps encountered in the matrix illustrate the areas where site-specific data or additional research may be needed to reduce uncertainty.
Applying TEFs or RPFs directly to concentrations of chemicals in abiotic media introduces significant errors and uncertainties into risk assessments because this approach does not account for chemical-specific differences in bioaccumulation. In some cases direct application of RPFs to
69
123456789
10111213141516171819202122232425262728293031323334
concentrations of some dioxin-like chemicals in sediments have contributed to large overestimates of the TEC for a species because the chemicals, while theoretically potent, are highly metabolized and thus do not appear in the food chain. Therefore, it is highly recommended that concentrations in abiotic media be converted to concentrations in diet or tissue using bioaccumulation factor and models as discussed in section 3.3.1.4.
3.4.3.2.2 Uncertainties in characterization of ecological effects. Use of the toxicity equivalence methodology in ecological risk assessments requires that 2,3,7,8-TCDD dose-response relationships be used to characterize adverse effects. An impetus for development of the toxicity equivalence approach is the fact that 2,3,7,8-TCDD has been the most well studied dioxin-like compound and, hence, dose-response relationships for a number of effects have been well characterized. Some uncertainty may be introduced in using 2,3,7,8-TCDD dose-response relationships to characterize toxicity of all dioxin-like compounds. For example, it is well established that fish are less sensitive than birds and mammals to ortho-substituted PCBs. Thus, use of a taxonomically harmonized set of toxicity equivalence factors would have introduced significant uncertainty for such congeners. Reduction of this type of uncertainty was the impetus for deriving class specific WHO-TEF98s (Van den Berg et al., 1998). Likewise, for any ecological risk assessment, selection of TEFs or RPFs that best reflect the endpoints and species of concern in the effects assessment will introduce the least amount of uncertainty. Species differences in sensitivity to 2,3,7,8-TCDD are also sources of uncertainty in the measures of effect (i.e, extrapolating from species of known sensitivity to 2,3,7,8-TCDD to a species of unknown sensitivity); however, accommodating this uncertainty is not unique for dioxin-like chemicals.
3.4.3.2.3 Uncertainties in risk characterization. The risk estimate which is derived from a toxicity equivalence concentration has similar uncertainties to other methods of estimating risks for multiple chemicals. The inherent uncertainties in the methods of estimating risks such as the quotient method (see Section 3.4.1.) are not unique to the application of the toxicity equivalence methodology to risk assessment.
Uncertainties in extrapolating risk estimates based on a single toxicity equivalence concentration for the species, endpoint, and dose metric of concern are described in Section 3.3.2. Extrapolation of the toxicity equivalence concentration across space or time is an uncertainty because of the chemical character (e.g., half life) of the individual congeners from which the TEC was derived.
In describing the uncertainty in the risk estimate, it should be clear that the toxicity equivalence methodology only accounts for AhR-mediated effects. Exposure to PCDDs, PCDFs, and PCBs may result in other non-AhR-mediated effects that should be assessed separately.
70

123456789
10111213141516171819202122232425262728293031323334
4. CONCLUSIONS
A number of PCDDs, PCDFs, and PCBs have been shown to cause toxicity to mammals, birds, and fish through a common mechanism of action mediated by the Ah receptor. Although these chemicals can be collectively described as persistent and bioaccumulative in the environment, their specific environmental profiles and potencies differ, in some cases substantially. Because PCDDs, PCDFs, and PCBs frequently occur in the environment as mixtures, ecological risk assessments involving these chemicals should consider their cumulative impacts, taking into account their individual properties. As described in this framework, the toxicity equivalence methodology offers a means to derive a single exposure estimate, the TEC, from multiple chemicals found in a mixture. Although not without uncertainties, the toxicity equivalence methodology has several advantages compared with alternative methods for estimating risks from mixtures of these chemicals.
There is a growing body of evidence that the use of congener-specific analyses decreases the overall uncertainty associated with assessing the risks posed by mixtures of PCDDs, PCDFs, and PCBs. Certainly, a congener-specific approach is far less uncertain compared to 2,3,7,8-TCDD only assessment methods used previously. For example, assessing only 2,3,7,8-TCDD does not take into account the effects of the various other dioxin-like chemicals often found in environmental mixtures and therefore would underestimate risk. Alternatively, assuming that all dioxin-like chemicals found in the environment have toxicity potency equal to 2,3,7,8-TCDD would overestimate risk posed by environmental mixtures of dioxin-like chemicals. In the specific case of assessment of PCBs, a congener-specific approach, including the toxicity equivalence methodology, is more accurate than either an Aroclor- or homolog-based approach for a number of reasons. A significant uncertainty associated with Aroclor analysis is that environmental PCB mixtures often cannot be adequately described by reference Aroclor standards due to the subjective assignment of Aroclor congeners. In addition to these analytical uncertainties, there is great uncertainty introduced in assuming that Aroclors or homolog groups are representative of weathered PCB profiles. Hence, measurements of PCB concentrations, bioaccumulation model predictions, and point estimates of exposures (using the toxicity equivalence methodology) are all likely to be more certain if based on congener-specific data, rather than total PCBs as determined by either Aroclor or homolog methods.
Use of the toxicity equivalence methodology has several implications for ecological risk assessment. The primary implication addressed in this framework is that the ecological risk assessor must select appropriate potency factors for PCDDs, PCDFs, and PCBs. As demonstrated in this framework, practical approaches exist for selecting potency factors. International consensus TEFs (currently, WHO-TEF98s) have been established for mammals, birds, and fish vertebrate classes and
71

123456789
101112131415161718192021
they represent reasonable values for estimating the TEC. This framework also presents a matrix to facilitate the selection of assessment-specific RPFs as alternatives to TEFs that may enhance the accuracy of risk estimates using the toxicity equivalence methodology. The selection matrix is a useful tool in optimizing the application of the toxicity equivalence methodology and encouraging the appropriate use of new potency information as it becomes available.
The relative importance of the uncertainties inherent to the toxicity equivalence methodology versus those endemic to all risk assessments depends on the particular assessment. The decision matrix model for selection of RPFs in Section 3.3.2. provides some considerations for ordering the uncertainties underlying particular elements of the methodology. While there are uncertainties associated with the application of the toxicity equivalence methodology, they are believed to be in aggregate less significant than those associated with other aspects of the risk assessment process (U.S. EPA, 2001a). Nonetheless, it is important to note that the methodology should only be applied in a manner consistent with its underlying assumptions; that is, it should only be used for the appropriate chemicals, media and target receptors. Furthermore, since the toxicity equivalence methodology is applied by combining toxicity data for specific effects, exposure relationships involving different media, and species-related toxicokinetic and toxicodynamic factors, it is important to assure (to the extent possible) that the data and calculations are consistent through each step.
In summary, the benefits of the toxicity equivalence methodology can best be realized by understanding its strengths, limitations, and its role as one of several tools within the broader context of ecological risk assessment. The goal of this framework has been to foster such understanding and to encourage future developments in the assessment of ecological risks from PCDDs, PCDFs, and PCBs.
72
123456789
10111213141516171819202122232425262728293031323334353637383940414243
REFERENCES
Ahlborg, MG; Becking, GC; Birnbaum, LS; Brouwer, A; Derks, HJGM; Feeley, M; Golog, G; Hanberg, S; Larsen, JC; Liem, AKD; Safe, S; Schlatter, C; Waern, F; Younes, M; Yrjanheikki, E. (1994) Toxic equivalency factors for dioxin-like PCBs: report on a WHO-ECEH and IPCS consultation, December 1993. Chemosphere 26(6):1049-1067.
Aulerich, RJ; Bursian, SJ; Napolitano, AC. (1988) Biological effects of epidermal growth factor and 2,3,7,8-tetrachlrodibenzo-p-dioxin on developmental parameters of neonatal mink. Arch Environ Contam Toxicol, 17:27-31.
Barber, TR; Chappie, DJ; Duda, DJ; Fuchsman, PC; Finley, BL. (1998) Using a spiked sediment bioassay to establish a no-effect concentration for dioxin exposure to the amphipod Ampelisca abdita. Environ Toxicol Chem, 17:420-424.
Barnes, D; Alford-Stevens, A; Birnbaum, L; Kutz, FW; Wood, W; Patton, D. (1991) Toxicity equivalency factors for PCBs? Qual Assur 1(1):70-81.
Barron, MG; Galbraith, H; Beltman, D. (1995) Comparative reproductive and developmental toxicology of PCBs in birds. Comp Biochem Physiol 112C:1-14.
Behnisch, PA; Hosoe, K; Sakai, S. (2001) Bioanalytical screening methods for dioxins and dioxin-like compounds – a review of bioassay/biomarker technology. Environ Int 27:413-439.
Behnisch, PA; Hosoe, K; Brouwer, A; Sakai, S. (2002) Screening of dioxin-like toxicity equivalents for various matrices with wildtype and recombinant rat hepatoma H4IIE cells. Toxicol Sci 69:125-130.
Beltman, D; Anderson, M; Barron, M. (1997) Assessment of PCB ecological effects: congener-based vs. aroclor-based approaches. Society of Environmental Toxicology and Chemistry, 18th Annual Meeting Abstracts, p. 119.
Birnbaum, LS. (1994) The mechanism of dioxin toxicity: relationship to risk assessment. Environ Health Perspect 102 Suppl 9:157-67.
Brown, DJ; Clarke, GC; Van Beneden, RJ. (1997) Halogenated aromatic hydrocarbon-binding proteins identified in several invertebrate marine species. Aquatic Toxicol 37:71-78.
Brunstrom, B; Halldin, K. (2000) Ecotoxicological risk assessment of environmental pollutants in the Arctic. Toxicol Lett 112-113:111-118.
Burkhard, LP; Cook, PM; Mount, DR. (2003) The relationship of bioaccumulative chemicals in water and sediment to residues in fish: a visualization approach. Environ Toxicol Chem: accepted for publication.
73
123456789
1011121314151617181920212223242526272829303132333435363738394041
Butler, RA; Kelley, ML; Powell, WH; Hahn, ME; Van Beneden, RJ. (2001) An aryl hydrocarbonreceptor (AHR) homologue from the soft-shell clam, Mya arenaria: evidence that invertebrate AHRhomologues lack 2,3,7,8-tetrachlorodibenzo-p-dioxin and beta-naphthoflavone binding. Gene278:223-234.
Carey, J; Cook, P; Giesy, J; Hodson, P; Muir, D; Owens, J; Solomon, K, eds. (1998)Ecotoxicological risk assessment of the chlorinated organic chemicals. SETAC Pellston Workshop onEnvironmental Risk Assessment for Organochlorine Compounds; 1994 July 24-29; Aliston,Ontario, Canada. Pensacola, FL: SETAC Press, 397 p.
Cook, PM; Zabel, EW; Peterson, RE. (1997) The TCDD toxicity equivalence approach forcharacterizing risks for early life stage mortality in trout. In: Rolland, R; Gilbertson, M; Peterson R, eds.Chemically-Induced Alterations in the Functional Development and Reproduction of Fishes.SETAC Technical Publications Series. Pensacola, FL: SETAC Press, pp. 9-27.
Cook, PM; Robbins, J; Endicott, DD; Lodge, KB; Walker, MK; Zabel, EW; Guiney, PD; Peterson,RE. (2003) Effects of aryl hydrocarbon receptor mediated early life stage toxicity on lake troutpopulations in Lake Ontario during the 20th century. Environ Sci Technol: accepted for publication.
Denison, MS; Seidel, SD; Ziccardi, M; Rogers, WJ; Brown, DJ; Clark, GC. (1999) Ah receptorbased bioassays: applications and limitations. Organohalogen Compd 40:27-30.
DeVito, MJ; Birnbaum, LS. (1995) Dioxins: model chemicals for assessing receptor-mediated toxicity.Toxicology 102:115-123.
DeVito, MJ; Diliberto, JJ; Ross, DG; Ménache, MG; Birnbaum, LS. (1997) Dose-responserelationships for polyhalogenated dioxins and dibenzofurans following subchronic treatment in mice. I.CYP1A1 and CYP1A2 enzyme activity in liver, lung, and skin. Toxicol Appl Pharmacol 147: 267-280.
DeVito, MJ; Ménache, MG; Diliberto, JJ; Ross, DG; Birnbaum, LS. (2000) Dose-responserelationships for induction of CYP1A1 and CYP1A2 enzyme activity in liver, lung, and skin in femalemice following subchronic exposure to polychlorinated biphenyls. Toxicol Appl Pharmacol 167:157-172.
DiToro, DM; McGrath, JA; Hansen, DJ. (2000a) Technical basis for narcotic chemicals and polycyclicaromatic hydrocarbon criteria. I. Water and tissue. Environ Toxicol Chem 19:1951-1970.
DiToro, DM; McGrath, JA. (2000b) Technical basis for narcotic chemicals and polycyclic aromatichydrocarbon criteria. II. Mixtures and sediments. Environ Toxicol Chem 19:1971-1982.
74

123456789
1011121314151617181920212223242526272829303132333435363738394041
Eadon, G; Kaminksy, L; Silkworth, J; Aldous, K; Hilker, D; O'Keefe, P; Smith, R; Gierthy, J; Hawley, J; Kin, N; DeCaprio, A. (1986) Calculation of 2,3,7,8-TCDD equivalent concentrations of complex environmental contaminant mixtures. Environ Health Perspect 70:221-227.
Endicott, DD; Cook, PM. (1994) Modeling the partitioning and bioaccumulation of TCDD and other hydrophobic organic chemicals in Lake Ontario. Chemosphere 28:75-87.
Elliot JE; Kennedy SW; Lorenzen A (1997) Comparative toxicity of polychlorinated biphenyls to Japanese quail (Coturnix c. japonica) and American kestrels (Falco sparverius). J Toxicol Environ Health 51:57-75.
Elonen, GE; Spehar, RL; Holcombe, GW; Johnson, RD; Fernandez, JD; Erickson, RJ; Tietge, JE; Cook, PM. (1998) Comparative toxicity of 2,3,7,8-tetrachlorodibenzo-p-dioxin to seven freshwater fish species during early-life-stage development. Environ Toxicol Chem 17:472-483.
Government of Canada (1991) Toxic chemicals in the Great Lakes and associated effects. Volume 1: Contaminant levels and trends. Environment Canada, Department of Fisheries and Oceans, Health and Welfare Canada, Minister of Supply and Services, Ottawa. 488 pp.
Environment Canada and Health Canada. (2001) Priority substances list assessment report: nonylphenol and its ethoxylates. Available from: http://www.ec.gc.ca/substances/ese/eng/psap/final/npe.cfm
Finley, BL; Trowbridge, KR; Burton, S; Proctor, DM; Panko, JM; Paustenbach, DJ. (1997) Preliminary assessment of PCB risks to human and ecological health in the lower Passaic River. J Toxicol Environ Health, 53:95-118.
Finley, B; Kirman, C; Scott, P. (1999) Derivation of probabilistic distributions for the WHO mammalian toxic equivalency factors. Organo Halogen 42:225-228.
Garrison, PM; Tullis, K; Aarts, JMMJG; Brouwer, A; Giesy, JP; Denison, MS. (1996) Species-specific recombinant cell lines as bioassay systems for the detection of 2,3,7,8-tetrachlorodibenzo-p-dioxin-like chemicals. Fundam Appl Toxicol 30:194-203.
Giesy, JP; Kannan, K. (1998) Dioxin-like and non-dioxin-like toxic effects of polychlorinated biphenyls (PCBS): implications for risk assessment. Crit Rev Toxicol, 28:511-569.
Gobas, FAPC. (1993) A model for predicting the bioaccumulation of hydrophobic organic chemicals in aquatic food-webs: applications to Lake Ontario. Ecol Mod 69:1-17.
75

123456789
10111213141516171819202122232425262728293031323334353637383940414243
Gobas, FAPC; Pasternak, JP; Lien, K; Duncan, RK. (1998) Development and field validation of a multimedia exposure assessment model for waste load allocation in aquatic ecosystems: application to 2,3,7,8-tetrachlorodibenzo-p-dioxin and 2,3,7,8-tetrachlorodibenzofuran in the Fraser River watershed. Eviron Sci Technol 32: 2442-2449.
Guiney, PD; Cook, PM; Casselman, JM; Fitzsimmons, JD; Simonin, HA; Zabel, EW; Peterson, RE. (1996) Assessment of 2,3,7,8-tetrachlorodibenzo-p-dioxin induced sac fry mortality in lake trout (Salvelinus namaycush) from different regions of the Great Lakes. Can J Aquat Sci 53:2080-2092.
Gutleb, AC; Appelman, J; Bronkhorst, MC; van den Berg, JHJ; Spenkelink, A; Brouwer, A; Murk, AJ. (1999) Delayed effects of pre- and early-life time exposure to polychlorinated biphenyls on tadpoles of two amphibian species (Xenopus laevis and Rana temporaria). Environ Toxicol Pharmacol 8:1-14.
Hahn ME. (1998) The aryl hydrocarbon receptor: a comparative perspective. Comp Biochem Physiol C Pharmacol Toxicol Endocrinol 121(1-3):23-53.
Hankinson, O. (1995) The aryl hydrocarbon receptor complex. Annu Rev Pharmacol Toxicol 35:307-340.
Henry, TR; Spitsbergen, JM; Hornung, MW; Abnet, CC; Peterson, RE. (1997) Early life stage toxicity of 2,3,7,8-tetrachlorodibenzo-p-dioxin (TCDD) in zebrafish (Danio rerio). Toxicol Appl Pharmacol 142:56-68.
Henry, TR; Nesbit, DJ; Peterson, RE. (2001) Relative potency values (REPs) for polychlorinated dibenzo-p-dioxin, dibenzofuran and biphenyl congeners based on induction of cytochrome P4501A mRNA in a zebrafish liver cell line (ZFL). Environ Toxicol Chem 20:1053-1058.
Hochstein, JR; Bursian, SJ; Aulerich, RJ. (1998) Effects of dietary exposure to 2,3,7,8-tetrachlorodibenzo-p-dioxin in adult female mink (Mustela vison). Arch Environ Contam Toxicol, 35:348-353.
Hoffman, DJ; Rice, CP; Kubiak, TJ. (1996) PCBs and dioxins in birds. In: Beyer, WN; Heinz, GH; and Redmon-Norwood, AW; eds. Environmental contaminants in wildlife: interpreting tissue concentrations. Boca Raton, FL; Lewis Publishers.
Huang, Y-W; Melancon, MJ; Jung, RE; Karasov, WH. (1998) Induction of cytochrome P450-associated monooxygenase in northern leopard frogs, Rana pipiens, by 3,3'4,4',5-pentachlorobiphenyl. Environ Toxicol Chem 17:1564-1569.
Jung, RE; Walker, MK. (1997) Effects of 2,3,7,8-tetrachlorodibenzo-p-dioxin (TCDD) on development of anuran amphibians. Environ Toxicol Chem, 16:230-240.
76
123456789
101112131415161718192021222324252627282930313233343536373839404142
Kennedy, SW; Lorenzen, A; Jones, SP; Hahn, ME; Stegeman, JJ. (1996) Cytochrome P4501Ainduction in avian hepatocyte cultures: a promising approach for predicting the sensitivity of avianspecies to toxic effects of halogenated aromatic hydrocarbons. Toxicol Appl Pharmacol 141:214-230.
Kutz, FW; Barnes, DG; Bretthauer, EW; Bottimore, DP; Greim, H. (1990) The International ToxicityEquivalency Factor (I-TEF) method for estimating risks associated with exposures to complex mixturesof dioxins and related compounds. Toxicol Environ Chem 26:99-109.
Leece, B; Denomme, MA; Towner, R; Li, SMA; Safe, S. (1985) Polychlorinated biphenyls:correlation between in vivo and in vitro quantitative structural-activity relationships (QSARs). J ToxicolEnviron Health 16:379-388.
Murk, AJ; Legler, J; Denison, MS; Giesy, JP; van de Guchte, C; Brower, A. (1996) Chemical-activated luciferase gene expression (CALUX): a novel in vitro bioassay for Ah receptor activecompounds in sediment and pore water. Fundam Appl Toxicol 33:149-160.
NATO/CCMS (North Atlantic Treaty Organization-Committee on the Challenges of Modern Society). (1988a) International Toxicity Equivalency Factor (I-TEF), method of risk assessment for complex mixtures of dioxins and related compounds. Report No. 176.
NATO/CCMS. (1988b) Scientific basis for the development of International Toxicity Equivalency Factor (I-TEF), method of risk assessment for complex mixtures of dioxins and related compounds. Report No. 178.
Norstrom, RJ, Simon, M, Muir, CDG. (1990) Chlorinated dioxins and furans in marine mammals from the Canadian arctic. Environ Pollut 66:1-20.
Okey, AB; Riddick, DS; Harper, PA. (1994) The Ah receptor: mediator of the toxicity of 2,3,7,8-tetrachlorodibenzo-p-dioxin (TCDD) and related compounds. Toxicol Lett 70:1-22.
Olson, JR; Bellin, JS; Barnes, DG. (1989) Reexamination of data used for establishing toxicity equivalency factors (TEFs) for chlorinated dibenzo-p-dioxins and dibenzofurans (CDDs and CDFs). Chemosphere 18(1-6):371-381.
Ontario Ministry of the Environment (OME). (1984) Scientific criteria document for standard development, No. 4-84: polychlorinated dibenzo-p-dioxins (PCDDs) and polychlorinated dibenzofurans (PCDFs).
Peterson, RE; Theobald, HM; Kimmel, GL. (1993) Developmental and reproductive toxicity of dioxins and related compounds: cross-species comparisons. Crit Rev Toxicol 23:283-335.
77
123456789
101112131415161718192021222324252627282930313233343536373839404142
Rice, CP; O’Keefe, P; Kubiak, TJ. (2002) Sources, pathways and effects of PCBs, dioxins, and dibenzofurans. In: Hoffman, DJ; Rattner, BA; Burton, GA, Jr; Cairns, J, Jr, eds. Handbook of Ecotoxicology. 2nd ed. Boca Raton, FL: CRC Lewis Publishers. pp. 499-571.
Richter, CA; Tieber, VL; Dension, MS; Giesy, JP. (1997) An in vitro rainbow trout cell bioassay for aryl hydrocarbon receptor-mediated toxins. Environ Toxicol Chem 16:543-550.
Safe, S. (1990) Polychlorinated biphenyls (PCBs), dibenzo-p-dioxins (PCDDs), dibenzofurans (PCDFs), and related compounds: environmental and mechanistic considerations which support the development of toxic equivalency factors (TEFs). Crit Rev Toxicol 21(1):51-88.
Safe, S. (1994) Polychlorinated biphenyls (PCBs): environmental impact, biochemical and toxic responses, and implications for risk assessment. Crit Rev Toxicol 24(2):87-149.
Sanderson, JT; Aarts, JM; Brouwer, A; Froese, KL; Denison, MS; Giesy, JP. (1996) Comparison of Ah receptor-mediated luciferase and ethoxyresorufin-O-deethylase induction in H4IIE cells: implications for their use as bioanalytical tools for the detection of polyhalogenated aromatic hydrocarbons. Toxicol Appl Pharmacol 137(2):316-25.
Schmitz, H-J; Behnisch, P; Hagenmaier, A; Hagenmaier, H; Bock, KW; Schrenk, D. (1996) CYP1A1-inducing potency in H4IIE cells and chemical composition of technical mixtures of polychlorinated biphenyls. Environ Toxicol Pharmacol 1:73-79.
Seidel, SD; Li, V; Winter, GM; Rogers, WJ; Martinez, EI; Denison, MS. (2000) Ah receptor-based chemical screening bioassays: application and limitations for the detection of Ah receptor agonists. Toxicol Sci 55:107-115.
Sewall, CH; Lucier, GW. (1995) Receptor-mediated events and the evaluation of the Environmental Protection Agency (EPA) of dioxin risks. Mutat Res 333:111-122.
Thomann, RV. (1989) Bioaccumulation model of organic chemical distribution in aquatic food chains. Environ Sci Technol 23:699-707.
Tillitt, DE; Ankley, GT; Verbruggee, DA; Giesy, JP; Ludwig, JP; Kubiak, TJ. (1991) H4IIE rat hepatoma cell bioassay-derived 2,3,7,8-tetrachlorodibenzo-p-dioxin equivalents in colonial fish-eating waterbird eggs from the Great Lakes. Arch Environ Contam Toxicol 21:91-101.
Tillitt, DE; Gale, RW; Meadows, JC; Zajicek, JL; Peterman, PH; Heaton, SN; Jones, PD; Bursian, SJ; Kubiak, TJ; Giesy, JP; Aulerich, RJ. (1996) Dietary exposure of mink to carp from Saginaw Bay. 3. Characterization of dietary exposure to planar halogenated hydrocarbons, dioxin equivalents and biomagnification. Environ Sci Technol 30:283-291.
78
123456789
1011121314151617181920212223242526272829303132333435363738394041
U.S. EPA (Environmental Protection Agency). (1987) Interim procedures for estimating risks associated with exposures to mixtures of chlorinated dibenzo-p-dioxins and -dibenzofurans (CDDs and CDFs). Risk Assessment Forum., Washington, DC; EPA/625/3-87/012.
U.S. EPA. (1989) Interim procedures for estimating risks associated with exposures to mixtures of chlorinated dibenzo-p-dioxins and -dibenzofurans (CDDs and CDFs) and 1989 update. Risk Assessment Forum, Washington, DC; EPA/625/3-89/016.
U.S. EPA. (1991) Workshop report on toxicity equivalency factors for polychlorinated biphenyl congeners. Risk Assessment Forum, Washington, DC; EPA/625/3-91/020.
U.S. EPA. (1993) Interim report on data and methods for assessment of 2,3,7,8-tetrachlorodibenzo-p-dioxin risks to aquatic life and associated wildlife. Office of Research and Development, Duluth, MN; EPA/600/R-93/055.
U.S. EPA. (1995a) Great Lakes Water Quality Initiative: technical support document for the procedure to determine bioaccumulation. Office of Water; EPA/820/B-95/005.
U.S. EPA. (1995b) Great Lakes Water Quality Initiative: criteria documents for the protection of wildlife: DDT, mercury, 2,3,7,8-TCDD, PCBs. Office of Water; EPA/820/B-95/008.
U.S. EPA. (1995c) Great Lakes Water Quality Initiative: technical support document for wildlife criteria. Office of Water; EPA/820/B-95/009.
U.S. EPA. (1996) PCBs: cancer dose-response assessment and application to environmental mixtures. Office of Research and Development, National Center for Environmental Assessment, Washington, DC; EPA/600/P-96/001F. Available from: http://www.epa.gov/ORD/WebPubs/pcb/.
U.S. EPA. (1998) Guidelines for ecological risk assessment. Risk Assessment Forum, Washington, DC; EPA/630/R-95/002F. Available from: http://cfpub.epa.gov/ncea/raf/recordisplay.cfm?deid=12460.
U.S. EPA. (2000a) Exposure and human health reassessment of 2,3,7,8-tetrachlorodibenzo-p-dioxin (TCDD) and related compounds (External Review Draft). National Center for Environmental Assessment, Office of Research and Development, Washington, DC; EPA/600/P00/001B(a-f). Available from: http://www.epa.gov/ncea//.
U.S. EPA. (2000b) Supplementary guidance for conducting health risk assessments of chemical mixtures. Risk Assessment Forum, Washington, DC; EPA/630/R-00/002. Available from: http://cfpub.epa.gov/ncea/raf/recordisplay.cfm?deid=20533.
79

123456789
101112131415161718192021222324252627282930313233343536373839404142
U.S. EPA. (2000c) Methodology for deriving ambient water quality criteria for protection of human health. Office of Water; EPA/822/B-00/004. Available from: http://www.epa.gov/waterscience/humanhealth/method/.
U.S. EPA. (2001a) Workshop report on the application of 2,3,7,8-TCDD toxicity equivalence factors to fish and wildlife. Risk Assessment Forum, Washington, DC; EPA/630/R-01/002. Available from: http://cfpub.epa.gov/ncea/raf/recordisplay.cfm?deid=23763.
U.S. EPA. (2001b) Dose-response assessment from recently published research of the toxicity of 2,3,7,8-tetrachlorodibenzo-p-dioxin and related compounds to aquatic wildlife - laboratory studies. Office of Research and Development, National Center for Environmental Assessment, Cincinnati, OH. (NCEA-C-0649). Revised after external peer review.
U.S. EPA. (2001c) Database of sources of environmental releases of dioxin-like compounds in the United States. Office of Research and Development, Washington, DC; EPA/600/C-01/012. Available from: http://www.epa.gov/ncea/.
U.S. EPA. (2002) Guidance on cumulative risk assessment of pesticide chemicals that have a common mechanism of toxicity. Office of Pesticide Programs, Washington, DC. Available from: http://www.epa.gov/pesticides/trac/science/.
Van Beneden, RJ; Rhodes, LD; Gardner GR. (1998) Studies of the molecular basis of gonadal tumors in the marine bivalve, Mya arenaria. Mar Environ Res 46:209-213.
Van den Berg, M; Birnbaum, L; Bosveld, ATC; Brunstrom, B; Cook, P; Feeley, M; Giesy, JP; Hanberg, A; Hasegawa, R; Kennedy, SW; Kubiak, T; Larsen, JC; van Leeuwen, FX; Liem, AK; Nolt, C; Peterson, RE; Poellinger, L; Safe, S; Schrenk, D; Tillitt, D; Tysklind, M; Younes, M; Waern, F; Zacharewski, T. (1998) Toxic equivalency factors (TEFs) for PCBs, PCDDs, PCDFs for humans and wildlife. Environ Health Perspect 106(12):775-792.
Villeneuve, DL; Kannan, K; Khim, JS; Falandysz, J; Nikiforov, VA; Blankenship, AL; Giesy, JP. (2000) Relative potencies of individual polychlorinated naphthalenes to induce dioxin-like responses in fish and mammalian in vitro bioassays. Arch Environ Contam Toxicol 39:273-281.
Walker, MK; Peterson, RE. (1991) Potencies of polychlorinated dibenzo-p-dioxin, dibenzofuran, and biphenyl congeners, relative to 2,3,7,8-tetrachlorodibenzo-p-dioxin for producing early life stage mortality in rainbow trout (Oncorhynchus mykiss). Aquatic Toxicol 21:219-238.
Walker, MK; Peterson, RE. (1994) Aquatic toxicity of dioxins and related chemicals. In: Schecter, A, ed. Dioxins and health. New York, NY: Plenum Press; pp. 347-387.
80

123456789
10111213141516171819202122
Walker, MK; Cook, PM; Butterworth, BC; Zabel, EW; Peterson, RE. (1996) Potency of a complex mixture of polychlorinated dibenzo-p-dioxin, dibenzofuran, and biphenyl congeners compared to 2,3,7,8-tetrachlorodibenzo-p-dioxin in causing fish early life stage mortality. Fundam Appl Toxicol 30:178-186.
West, CW; Ankley, GT; Nichols, JW; Elonen, GE; Nessa, DE. (1997) Toxicity and bioaccumulation of 2,3,7,8-tetrachlorodibenzo-p-dioxin in long-term tests with the freshwater benthic invertebrates Chironimus tentans and Lumbriculus variegatus. Environ Toxicol Chem 16:1287-1294.
Williams, LL; Giesy, JP; Verbrugge, DA; Jurzysta, S; Stromborg, K. (1995) Polychlorinated biphenyls and 2,3,7,8-tetrachlorodibenzo-p-dioxin equivalents in eggs of double-crested cormorants from a colony near Green Bay, Wisconsin, USA. Arch Environ Contam Toxicol 29:327-333.
Yawetz, A; Benedek-Segal, M; Woodin, B. (1997) Cytochrome P4501A immunoassay in freshwater turtles and exposure to PCBs and environmental pollutants. Environ Toxicol Chem 16:1802-1806.
Yrjänheiki, EJ. (1992) Review of the models for TEFs in assessing health risks of PCDDs and PCDFs. Toxic Sub J 12:283-288.
Zabel, EW; Cook, PM; Peterson, RE. (1995) Toxic equivalency factors of polychlorinated dibenzo-pdioxins, dibenzofuran and biphenyl congeners based on early life stage mortality in rainbow trout (Oncorhynchus mykiss). Aquat Toxicol 31:315-328.
81

123456789
10111213141516171819202122232425262728293031323334353637383940414243
GLOSSARY
Aryl hydrocarbon receptor (AhR): A ligand activated transcription factor involved in the regulation of several genes, including those for xenobiotic-metabolizing enzymes such as cytochrome P450 1A and 1B. Ligands for the AhR include a variety of halogenated aromatic hydrocarbons including chlorinated dioxins, furans and biphenyls. The endogenous function and ligand(s) for the AhR have not been fully elucidated at this time, but binding of xenobiotic compounds to the AhR is known to disrupt an organism’s normal development and functioning.
Bioaccumulation: the net accumulation of a substance by an organism as a result of uptake from all environmental sources.
Bioconcentration: the net accumulation of a substance by an aquatic organism as the result of uptake directly from the ambient water, through gill membranes or other external body surfaces.
Biomagnification: the increase in tissue concentration of a chemical in organisms at successive trophic levels through a series of predator-prey associations, primarily through the mechanism of dietary accumulation.
BAF: Bioaccumulation Factor. The ratio of the concentration of a substance in tissue of an organism to its concentration in the ambient exposure media (e.g., water or soil) in situations where both the organism and its food are exposed and the ratio does not change substantially over time. For aquatic organisms, the ratio of the concentration of chemical in the organism to its concentration in water, expressed in L/kg. For terrestrial organisms, the ratio of the concentration of chemical in the organism to its concentration in soil.
BSAF: Biota-Sediment Accumulation Factor. A specific type of bioaccumulation factor, defined as the ratio of the lipid-normalized concentration of a substance in tissue of an aquatic organism to its organic carbon-normalized concentration in surface sediment (expressed as kg of sediment organic carbon per kg of lipid).
Congener: Compounds that belong to a class based on a common chemical structure such as chlorinated dibenzo-p-dioxin, dibenzofuran, or biphenyl. The number of congeners in each chemical class depends on the number of unique combinations for chlorine substitution on the common structure.
CYP1A: Cytochrome P450 1A; an enzyme (of the cytochrome P450 family) found in a variety of tissues, predominantly liver, that metabolizes xenobiotic (foreign) chemicals in addition to numerous endogenous compounds; because its production is induced by exposure to dioxin-like chemicals, CYP1A induction can be used to estimate potency of various dioxin, furan, and PCB congeners.
EC50: The concentration of a substance required to produce 50% of maximal effect in an individual test unit (e.g., cell culture) or to produce a response in 50% of a population of test organisms.
82

123456789
10111213141516171819202122232425262728293031323334353637383940414243
ED50 : The dose of a substance required to produce 50% of maximal effect in an individual test unit (e.g., cell culture) or to produce a response in 50% of a population of test organisms.
LC50: The concentration of a substance required to cause lethality in 50% of test units (e.g. cells in a culture; organisms in a population).
LD50: The dose of a substance required to cause lethality in 50% of test units (e.g. cells in a culture; organisms in a population).
PCBs: a family of 209 congeners, the polychlorinated biphenyls, of which 12 (listed in Table 2) are thought to have dioxin-like toxicity. PCBs are no longer manufactured in the United States but formerly were widely used as coolants and lubricants in electrical equipment.
PCDDs: polychlorinated dibenzo-p-dioxins, a family of 75 congeners of which 7 (listed in Table 2) are thought to have dioxin-like toxicity. The polychlorinated dibenzo-p-dioxin structure consists of two benzene rings joined by two ortho oxygen atoms and varying degrees of chlorine atom substitution on the remaining carbon atoms in the rings. 2,3,7,8-Tetrachlorodibenzo-p-dioxin (2,3,7,8-TCDD) is the prototypical compound in this class. PCDDs have not been commercially produced but are produced inadvertently by a number of industrial chemical processes and combustion of waste materials.
PCDFs: polychlorinated dibenzofurans, a chemical class containing 135 congeners of which 10 (listed in Table 2) are thought to have dioxin-like toxicity. The polychlorinated dibenzofuran structure consists of two benzene rings joined by a one oxygen atom ortho to a carbon-carbon bond linkage and have varying degrees of chlorine atom substitution on the remaining carbon atoms in the rings. PCDFs, like the PCDDs, are not produced intentionally but occur as inadvertent by-products in chemical production processes as well as waste combustion and PCB degradation reactions.
QSAR: Quantitative Structure Activity Relationship; mathematical models that use non-empirical structural descriptors (e.g. stereoelectronic indices) and/or empirical parameters (e.g. octanol/water partition coefficients) to estimate biological activity (e.g. toxicity, enzyme induction, lethality, etc.). QSARs are context specific, i.e. chemical structural similarity is defined in the context of a well-defined biological endpoint that is being modeled.
Relative Potency (ReP): Estimate based on a single study of the potency, relative to 2,3,7,8-TCDD, of an individual chemical to cause a particular aryl hydrocarbon receptor-mediated toxicity or biological effect in an individual organism, cellular, or biochemical assay.
Relative Potency Factor (RPF): Estimate based on one or more studies of the potency, relative to 2,3,7,8-TCDD, of an individual chemical to cause aryl hydrocarbon receptor-mediated toxicity or biological effects. The ReP data base used to derive an RPF for a chemical may include multiple endpoints, species, and in vitro or in vivo studies. RPFs may be used as alternatives to TEFs when more specific data for the species, endpoint, and site conditions are judged to improve the accuracy of the risk assessment.
83

123456789
101112131415161718192021
2,3,7,8-TCDD: 2,3,7,8-Tetrachlorodibenzo-p-dioxin, the PCDD congener that has been most extensively studied and is used as the prototypical AhR agonist. Also commonly referred to simply as TCDD.
TEFs-WHO98: Toxicity Equivalence Factors established at a World Health Organization expert meeting (Van den Berg et al. 1998); the TEFs scheme built upon previous international efforts establishing TEFs for humans and added consensus TEFs for fish and birds.
Toxicity Equivalence: The concept of translating the potency of a dioxin, furan or dioxin-like PCB to cause a toxic or biological effect to a 2,3,7,8-TCDD equivalent potency.
Toxicity Equivalence Factor (TEF): Estimate of the potency, relative to 2,3,7,8-TCDD, of an individual polychlorinated dibenzo-p-dioxin, dibenzofuran or biphenyl congener, using careful scientific judgment after considering all available relative potency data. EPA presently applies this term only to TEFs derived through an international scientific consensus-building process supported by the World Health Organization (Van den Berg et al., 1998).
Toxicity Equivalence Concentration (TEC): The TEC is the product of the toxicity equivalence factor (TEF) multiplied by the concentration for an individual congener. The total TEC for a mixture is calculated as the sum of 2,3,7,8-TCDD equivalence concentrations of all congeners present in the mixture.
84