fracture toughness of thin plates by the … · fracture toughness of thin plates by the...
TRANSCRIPT

FRACTURE TOUGHNESS OF THIN PLATES BY THE DOUBLE-TORSION TEST
METHOD
Jonathan A. Salem
NASA Glenn Research Center
Cleveland, OH, 44135
Miladin Radovic, Edgar Lara-Curzio and George Nelson
Oak Ridge National Laboratory
Oak Ridge, TN 37831
ABSTRACT
Double torsion testing can produce fracture toughness values without crack length
measurement that are comparable to those measured via standardized techniques such as the
chevron-notch, surface-crack-in-flexure and precracked beam if the appropriate geometry is
employed, and the material does not exhibit increasing crack growth resistance. Results to date
indicate that 8 < W/d < 80 and L/W > 2 are required if crack length is not considered in stress
intensity calculations. At L/W = 2, the normalized crack length should be 0.35 < a/L < 0.65;
whereas for L/W = 3, 0.2 < a/L < 0.75 is acceptable. In addition, the load-points need to roll to
reduce friction. For an alumina exhibiting increasing crack growth resistance, values
corresponding to the plateau of the R-curve were measured. For very thin plates (W/d > 80)
nonlinear effects were encountered.
INTRODUCTION
Many emerging commercial structures such as fuel cell elements and diesel particulate
filters consist of thin brittle plates. The fracture toughness of such thin plates is of interest for
materials assessment and life prediction. In 2001, American Society for Testing and Materials
(ASTM) committee C28 on Advanced Ceramics developed standard test method C1421,
Standard Test Method for Determination of the Fracture Toughness of Advanced Ceramics at
Ambient Temperatures.1 C1421 covers the determination of KBIpbB (pre-cracked beam), KBIscB
(surface crack in flexure) and KBIvbB (chevron-notched beam). Unfortunately, none of these test
configurations is amenable to evaluate materials in the form of thin plates.
In this investigation, the double-torsion test method2, 3
was used to determine the fracture
toughness of materials that were previously measured using ASTM C 1421. Test specimens of
various thicknesses were cut and machined from billets and tested in comparable environments
in order to compare DT (double-torsion) results to standardized beam results. In addition to the
effect of thickness, the influences of crack curvature and crack length on fracture toughness were
investigated. As the test section (plate) becomes thin the overall stress state changes from plane
strain to plane stress and nonlinear effects can occur. Little study of this effect has been
performed for ceramic materials, though tests on relatively thick sections ranging from 5 mm to
15 mm indicated no influence on the measured fracture toughness4.
Three objectives were sought in this work: (1) to determine the effect of section thickness
on the measured fracture toughness using the DT test specimen; (2) to compare the DT test to
accurate, well documented standardized test techniques such as the SEPB (single-edged-
precracked-beam), CN (chevron-notch) and SCF (surface crack in flexure); and (3) lay the
Submitted to Ceramic Engineering and Science proceedings, 2006
https://ntrs.nasa.gov/search.jsp?R=20070002899 2018-06-25T01:33:57+00:00Z

foundation for an ASTM standard on the DT test specimen. Because so much controversy exists
regarding the DT specimen5, a direct experimental approach was taken by using model materials:
silicon carbide, alumina, and soda-lime silicate glass. Alpha silicon carbide is stiff, has
consistent fracture toughness with little R-curve behavior, and is very insensitive to stress
corrosion. Alumina is more difficult for such a study because it can exhibit a rising R-curve,
stress corrosion, and textural effects.6 Soda-lime glass, though sensitive to stress corrosion, has
a flat R-curve. In addition, its transparency allows easy observation of the crack length. To
insure consistent results, test specimens were cut from bulk sections and tested in comparable
environments.
EXPERIMENTAL PROCEDURES
Materials, Machining, and Precracking
The fracture toughness of the reference SiC (Hexoloy SA) and isopressed 96% alumina
(ALSIMAG 614) were previously measured4 and are summarized in Table I. DT test specimens
measuring W = 23.5 mm by L = 51 mm were machined from billets of the same lots. The
specimen thicknesses ranged from d = 0.25 to 3 mm and were chevron-notched to 25% of the
length to allow rapid precracking to the mid-section. For the glass test specimens, precracking
was initiated from six Vicker’s indentations made at one end of the test specimen with 3 to 5 kg
load. Precracking was performed by rapidly loading to ~3/4 of the expected load and then
slowly loading at a stroke rate of 0.002 to 0.005 mm/min until a crack formed and grew to the
desired length. Once precracked, the specimens were unloaded for crack length measurement
and then failed at a stroke rate of 2 mm/minute. Specimen width to depth of 6 < W/d < 15,
length to width of L/W > 2, and crack length of W < a < L-W have been recommended3, 5
. The
ratios employed herein are W/d = 8 to 16, L/W = 2.1, and a/L 0.4 for the glass specimens, and
W/d = 8 to 90, L/W = 2.1, and 0.4 < a/L < 0.5 for the ceramics. Although side grooves of ~1/2
the depth have been suggested, none were employed herein. Fracture toughness was calculated
from2
( )
øí1Wd
3WPK
21
4mmaxIdt= (Plane strain) (1)
( )
øWd
í13WPK
21
4mmaxIdt
+= (Plane stress) (2)
where +=d
Wexp
W
d40.2
W
d2604.11ø . (3)
and P is the applied force, d the plate thickness, W the plate width, Wm the moment arm, and is Poison’s ratio2. The term is a thickness correction factor to account for interaction of the
torsion arms. It approaches unity at W/d 50. The specimen thickness, d, is raised to the fourth
power and thus must be measured carefully for thin plates.

Table I. Fracture toughness and standard deviation measured by the methods specified in
ASTM C 1421. Results in any row are for the same billet and have identical test orientation
except as noted. The number of tests is given in parenthesis.
Material KBIvbB (A)
MPa m
KBIpbB
MPa m
KBIscB
MPa m
-SiC (JAS) 2.61 ± 0.05 (6) 2.58 ± 0.08 (4)P* 2.76 ± 0.08 (4)
ALSIMAG 614 3.19 ± 0.06 (7)
3.09 ± 0.17
(13)P*PPP 3.18 ± 0.10 (5)
* Different billet from the same material batch as the VB geometry A specimens.
Effect of Friction
The effect of friction was investigated by testing glass plates in a SiC fixture with fixed
loading balls and various lubricants, and by using a steel fixture that allowed the 4 mm diameter
SiC loading balls to rotate, Figure 1. The ball O.D. and specimen edge were aligned to ensure a
consistent definition of crack length relative to load point. Balls were used instead of pins
because the plate bends in two planes, thereby shifting the point of loading for rods. The results
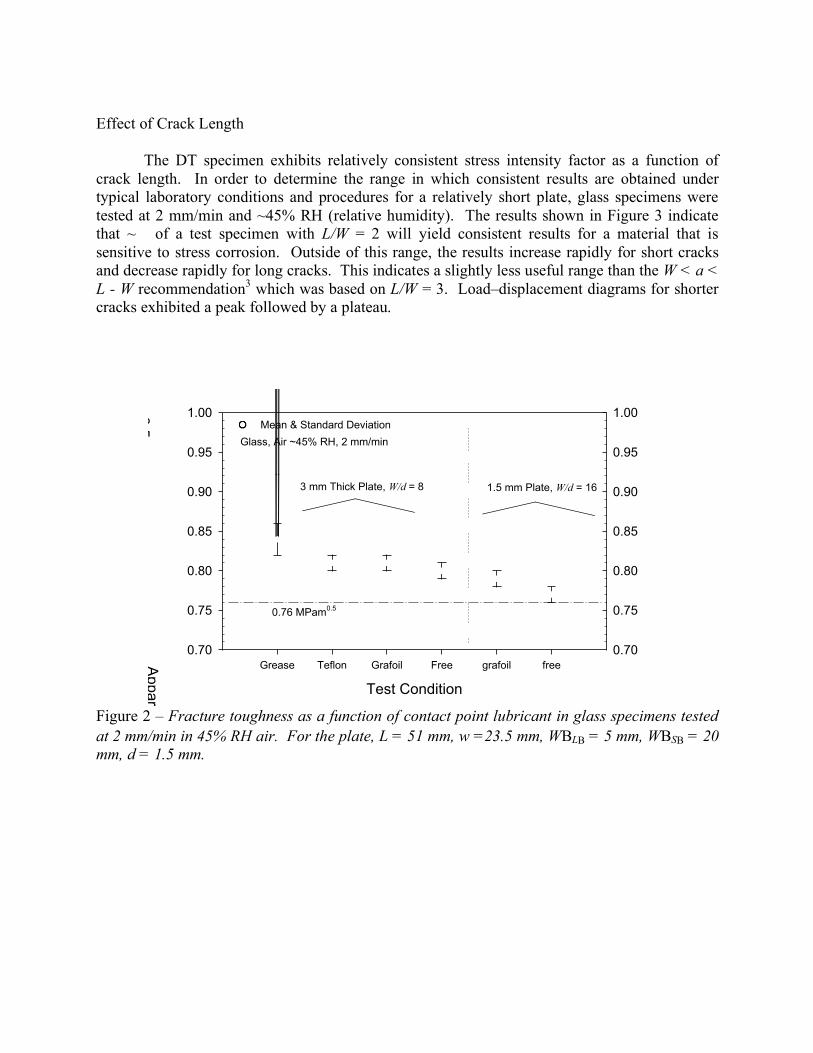
are summarized in Figure 2 and indicate that lubricants such as vacuum grease, graphite foil, and
PTFE tape, though lowering the results toward the expected value (~0.76 MPa m) are not
completely sufficient. Use of load balls that are free to roll in one dimension reduced the
measure fracture toughness by ~5%. The effect was measured by using both 1.5 and 3.0 mm
thick plates. The use of an excessively thick plate (W/d = 8) increases the result ~4%.
Figure 1 –DT test specimen and fixture use this study.
P/2
W
d
P/2
P
Wm
L
a
Alignment
stop
Effect of Crack Length
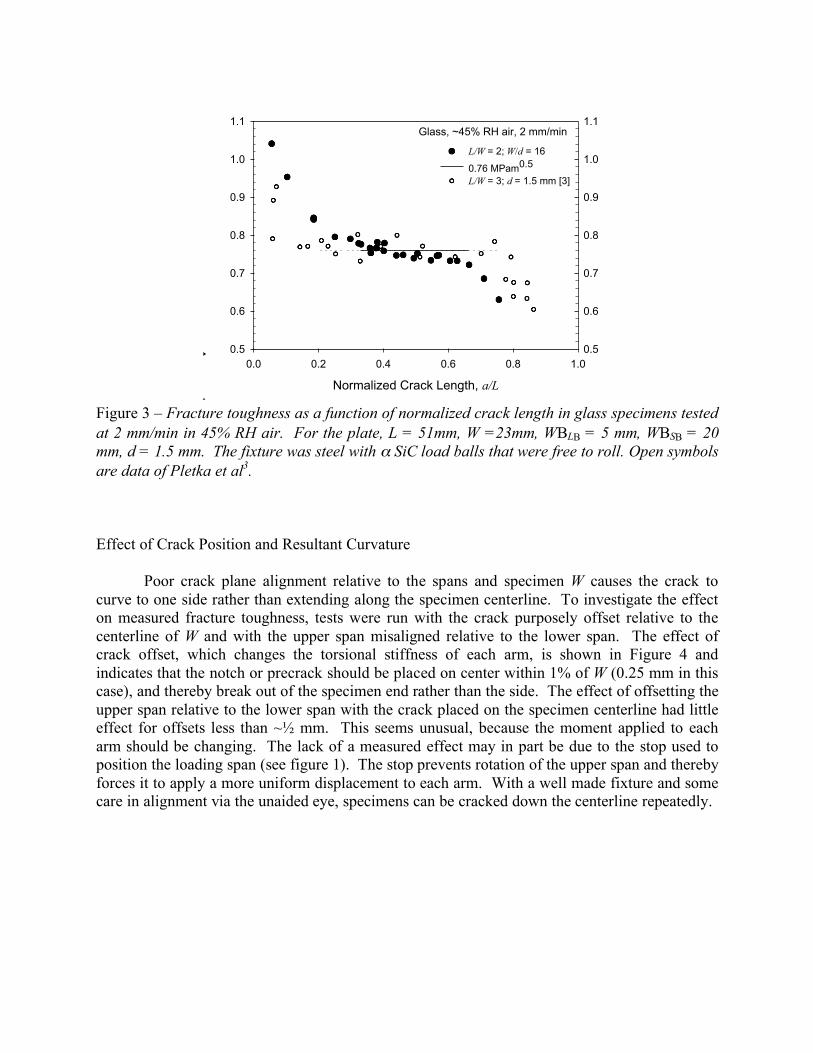
The DT specimen exhibits relatively consistent stress intensity factor as a function of
crack length. In order to determine the range in which consistent results are obtained under
typical laboratory conditions and procedures for a relatively short plate, glass specimens were
tested at 2 mm/min and ~45% RH (relative humidity). The results shown in Figure 3 indicate
that ~ of a test specimen with L/W = 2 will yield consistent results for a material that is
sensitive to stress corrosion. Outside of this range, the results increase rapidly for short cracks
and decrease rapidly for long cracks. This indicates a slightly less useful range than the W < a <
L - W recommendation3 which was based on L/W = 3. Load–displacement diagrams for shorter
cracks exhibited a peak followed by a plateau.
Test Condition
Grease Teflon Grafoil Free grafoil freeAp
pa
r0
5
0.70
0.75
0.80
0.85
0.90
0.95
1.00
0.70
0.75
0.80
0.85
0.90
0.95
1.00
3 mm Thick Plate, W/d = 8
Glass, Air ~45% RH, 2 mm/min
1.5 mm Plate, W/d = 16
Mean & Standard Deviation
0.76 MPam0.5
Figure 2 – Fracture toughness as a function of contact point lubricant in glass specimens tested
at 2 mm/min in 45% RH air. For the plate, L = 51 mm, w =23.5 mm, WBLB = 5 mm, WBSB = 20
mm, d = 1.5 mm.
Normalized Crack Length, a/L
0.0 0.2 0.4 0.6 0.8 1.0
At
0.5
0.6
0.7
0.8
0.9
1.0
1.1
0.5
0.6
0.7
0.8
0.9
1.0
1.1
L/W = 2; W/d = 16
0.76 MPam0.5
L/W = 3; d = 1.5 mm [3]
Glass, ~45% RH air, 2 mm/min
Figure 3 – Fracture toughness as a function of normalized crack length in glass specimens tested
at 2 mm/min in 45% RH air. For the plate, L = 51mm, W =23mm, WBLB = 5 mm, WBSB = 20
mm, d = 1.5 mm. The fixture was steel with SiC load balls that were free to roll. Open symbols
are data of Pletka et al3.
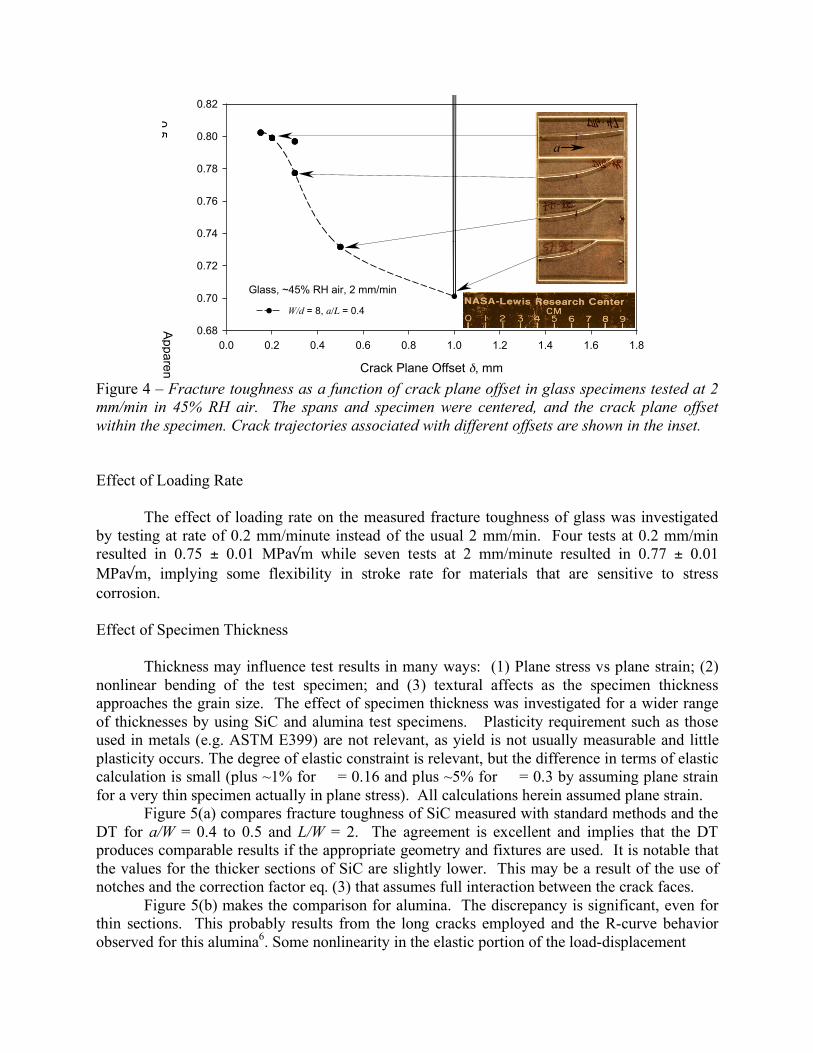
Effect of Crack Position and Resultant Curvature
Poor crack plane alignment relative to the spans and specimen W causes the crack to
curve to one side rather than extending along the specimen centerline. To investigate the effect
on measured fracture toughness, tests were run with the crack purposely offset relative to the
centerline of W and with the upper span misaligned relative to the lower span. The effect of
crack offset, which changes the torsional stiffness of each arm, is shown in Figure 4 and
indicates that the notch or precrack should be placed on center within 1% of W (0.25 mm in this
case), and thereby break out of the specimen end rather than the side. The effect of offsetting the
upper span relative to the lower span with the crack placed on the specimen centerline had little
effect for offsets less than ~ mm. This seems unusual, because the moment applied to each
arm should be changing. The lack of a measured effect may in part be due to the stop used to
position the loading span (see figure 1). The stop prevents rotation of the upper span and thereby
forces it to apply a more uniform displacement to each arm. With a well made fixture and some
care in alignment via the unaided eye, specimens can be cracked down the centerline repeatedly.
Crack Plane Offset , mm
0.0 0.2 0.4 0.6 0.8 1.0 1.2 1.4 1.6 1.8
Ap
pa
ren
t0
5
0.68
0.70
0.72
0.74
0.76
0.78
0.80
0.82
W/d = 8, a/L = 0.4
Glass, ~45% RH air, 2 mm/min
Figure 4 – Fracture toughness as a function of crack plane offset in glass specimens tested at 2
mm/min in 45% RH air. The spans and specimen were centered, and the crack plane offset
within the specimen. Crack trajectories associated with different offsets are shown in the inset.
Effect of Loading Rate
The effect of loading rate on the measured fracture toughness of glass was investigated
by testing at rate of 0.2 mm/minute instead of the usual 2 mm/min. Four tests at 0.2 mm/min
resulted in 0.75 ± 0.01 MPa m while seven tests at 2 mm/minute resulted in 0.77 ± 0.01
MPa m, implying some flexibility in stroke rate for materials that are sensitive to stress
corrosion.
Effect of Specimen Thickness
Thickness may influence test results in many ways: (1) Plane stress vs plane strain; (2)
nonlinear bending of the test specimen; and (3) textural affects as the specimen thickness
approaches the grain size. The effect of specimen thickness was investigated for a wider range
of thicknesses by using SiC and alumina test specimens. Plasticity requirement such as those
used in metals (e.g. ASTM E399) are not relevant, as yield is not usually measurable and little
plasticity occurs. The degree of elastic constraint is relevant, but the difference in terms of elastic
calculation is small (plus ~1% for = 0.16 and plus ~5% for = 0.3 by assuming plane strain
for a very thin specimen actually in plane stress). All calculations herein assumed plane strain.
Figure 5(a) compares fracture toughness of SiC measured with standard methods and the
DT for a/W = 0.4 to 0.5 and L/W = 2. The agreement is excellent and implies that the DT
produces comparable results if the appropriate geometry and fixtures are used. It is notable that
the values for the thicker sections of SiC are slightly lower. This may be a result of the use of
notches and the correction factor eq. (3) that assumes full interaction between the crack faces.
Figure 5(b) makes the comparison for alumina. The discrepancy is significant, even for
thin sections. This probably results from the long cracks employed and the R-curve behavior
observed for this alumina6. Some nonlinearity in the elastic portion of the load-displacement
a

Test Method
CNB SEPB SCF DT 1.0 DT 0.5 DT 0.25 SB 12 SB 25
Fra
ctu
re T
ou
g
2.2
2.4
2.6
2.8
3.0
3.2
2.2
2.4
2.6
2.8
3.0
3.2Mean & 90% confidence interval
StandardizedMethods
SiC, Air ~45% RH
DoubleTorsion
Chevron-NotchShort Bar
Test Method
CNB SEPB SCF DT 0.25 DT 3.0 DT 1.0 DT 0.5 SB 12 SB 25
Fra
cture
To
ug
hn
5
2.5
3.0
3.5
4.0
4.5
2.5
3.0
3.5
4.0
4.5
Mean & 90% confidence interval
StandardizedMethods - Thick Section
Alumina (ALSIMAG 614), Air ~45% RH
DoubleTorsion
Chevron-notch Short Bar
Figure 5 – Fracture toughness and 90% confidence intervals for SiC and alumina in 45% RH air
as a function of test method. CNB = chevron-notch in bending; SEPB = single-edged-
precracked-beam; SCF = surface crack in flexure; DT 3.0 = double torsion with d = 3.0 mm; SB
12 = chevron-notch short bar with 12 mm thickness.

curves could be observed for the thinnest specimens (d = 2.5 mm, a/L 0.4), implying that a
ratio of /d < 0.4 needs to be maintained for stiff, brittle materials. However, a significant effect
of the nonlinearity could not be observed on the measured fracture toughness (2.65 ± 0.04
MPa m). Thin sections of materials with higher toughness and lower elastic modulus will likely
require further consideration.
DISCUSSION
The double torsion test is commonly perceived as giving elevated values of fracture
toughness. For instance a value of 3.84 ± 0.05 MPa m was reported for ALSIMAG alumina7
and values from 2.76 ± 0.05 to 4.6 ± 0.13 MPa m were reported for SiC.8-10
Elevated values
can result from friction at the load points, small a/L, small W/d, and the use of notches instead of
precracks. The use of cracks outside the constant KI regime should also result in more scatter
unless the cracks have very similar lengths. Long or curved cracks reduced the measured
fracture toughness in this study. Material affects such as crack growth resistance and stress
corrosion increase and decrease, respectively, the measured fracture toughness. The good
agreement between the C1421 test methods and the DT for all thicknesses of SiC implies that use
of appropriate test procedures will ensure good results for flat R-curve materials. The elevated
values for the alumina relative to the C1421 values concur with previous long crack values4, 6
from chevron-notch short bar specimens (3.67 to 3.93 MPa m), implying that good results
representative of long cracks are obtained with good practice.
Based on the results in this study, 8 < W/d < 80, L/W > 2, 0.35 < a/L < 0.65 are required
if formulas not considering crack length are to be used. The narrow range of a/L recommended
is required for L/W = 2, however, for larger L/W, a wider range is acceptable.3 Very large L/W
ratios will likely produce large constant KI regions; however, the mass of the test specimen may
begin to affect the result. Load point friction needs to be minimized via free bearing balls. Side
grooves are not needed with careful alignment of a well made fixture. The recommended crack
length is compared for various geometries in Table II in terms of the normalized crack length
a/L. When the criteria are written in terms of a/L, the widest ranges of a/L tend to correspond to
the largest L/W, however, some discrepancies can be noted, and may relate to the use of the total
length of the plate rather than the length from the loading point. The upper end a/L from this
work is in agreement with those in Table II, however, the lower range from this work is more
conservative. In general it can be concluded from Table II that a/L between and will insure
good results for wide range of W/d and L/W.
A general guideline of the required thickness for linear elastic behavior can be derived by
normalizing the deflection to the stress intensity (eq. 2) at failure and writing the plate deflection
as a fraction of the plate thickness. The equation for load point displacement2 is
øWdì
aPW3ä
3
2
m= (4)
where P is the applied force, d the plate thickness, W the plate width, Wm the moment arm, a the crack length, and μ the shear modulus. The ratio of displacement to stress intensity at failure is

( )2/1
43
m
IdtøWd
í13.
øWdì
aW3
K
ä += . (5)
Substituting μ = 3E(1+ ), a = W, and setting the allowable deflection to d/10 gives the criterion
( ) 2/1
m
2/3
Idt
min
ø
WW
í1E
K9d
+. (6)
where E is Young’s modulus. Because the case of interest is usually thin stiff plates, will typically be ~1. For SiC (E = 395 GPa, v = 0.17, KIdt = 2.6 MPa m, Wm = 7.5 mm), eq. (4) gives dmin = 0.23 mm, nominally comparable to the thickness exhibiting nonlinearity in this study. Table II. Normalized crack length range that produced consistent fracture toughness via
equation (1).
W/d L/W a/L range Analysis Method & Material Used Reference 51 1.5 0.26 < a/L < 0.46 Fracture toughness tests, Glass 12 10 2 0.28 < a/L < 0.68 FEM 9 16 2.1 0.35 < a/L < 0.65 Fracture toughness tests, Glass This work 32 2.4 0.20 < a/L < 0.59 “ “ “ 12 17 3 0.20 < a/L < 0.75 “ “ “ 3 25* 3 0.33 < a/L < 0.66 Slow crack growth tests, Mg-Al-Si 3 10 3 0.18 < a/L < 0.78 FEM 9 12 3.5 0.25 < a/L < 0.63 “ “ “ 13, 14
* The test specimens were 2 mm thick, but contained a 1 mm deep side groove. CONCLUSIONS
Double torsion testing can produce fracture toughness values without crack length
measurement that are comparable to those measured via ASTM C1421 if the appropriate
geometry is employed, and the material exhibits little crack growth resistance. Results to date
indicate that 8 < W/d < 80 and L/W > 2 are needed if crack length is not considered in the stress
intensity calculation. At L/W = 2, the normalized crack length should be 0.35 < a/L < 0.65;
whereas for L/W = 3, 0.2 < a/L < 0.75 is acceptable. For materials exhibiting crack growth
resistance, values corresponding to the plateau of the R-curve are likely to be measured. The
load points should be free to roll so that friction is minimized, and the plate thickness should be
measured carefully. For very thin plates, (W/d > 80) nonlinear effects are likely to be
encountered, depending on the stiffness and fracture toughness. One way to minimize the effect
is to shrink the test specimen proportionally; however, alignment issues are likely to be
exacerbated.
ACKNOWLEDGEMENT
This work was funded by the Low Emission Alternative Power Program at NASA Glenn
Research Center and by US Department of Energy, Office of Fossil Energy, SECA Core
Technology Program at ORNL under Contract DE-AC05-00OR22725 with UT-Battelle, LLC.
The authors are grateful to Chris Coffer of ORNL for help with pre-cracking the test specimens.
REFERENCES
1. ASTM C 1421, “Standard Test Method for Determination of Fracture Toughness of
Advanced Ceramics at Ambient Temperatures” Annual Book of Standards, Vol. 15.01
(American Society for Testing and Materials, West Conshohocken, PA, 2001) pp. 641-672. 2. E.R. Fuller, Jr., “An Evaluation of Double Torsion Testing: Analysis,” pp3-18 in Fracture
Mechanics Applied to Brittle Materials, STP678, S.W. Frieman, ed., ASTM, Philadelphia, Penn,
1979. 3. B.J. Pletka, E.R. Fuller, Jr., and B.G. Koepke, “An Evaluation of Double Torsion
Testing: Experimental,” pp19-37 in Fracture Mechanics Applied to Brittle Materials, STP 678,
S.W. Frieman, ed., ASTM, Philadelphia, Penn, 1979. 4. J.A. Salem, G.D. Quinn, M.G. Jenkins, “Measuring the Real Fracture Toughness of
Ceramics: ASTM C1421,”, pp. 531-553 in Fracture Mechanics of Ceramics: Active Materials,
Nanoscale Materials, Composites, Glass, and Fundamentals, R.C. Bradt, D. Munz, M. Sakai and
K. White, eds., Springer, (2005). 5. R.B. Tait, P.R. Fry, and G.G. Garrett, “Review and Evaluation of the Double Torsion
Technique for Fracture Toughness and Fatigue Testing of Brittle Materials, Experimental
Mechanics, pp.14-22, March 1987. 6. J.A. Salem, J.L. Shannon, Jr. and R.C. Bradt, "Crack Growth Resistance of Textured
Alumina," Journal of the American Ceramic Society, 72, [1], pp. 20-27 (1989). 7. G.K. Bansel, W.H. Duckworth, “Fracture Stress as Related to Flaw and Fracture Mirror
Sizes,” Journal of the American Ceramic Society, 60, [7-8], pp. 304-310 (1977). 8. K.D. McHenry and R.E. Tressler, “Fracture Toughness and High Temperature Slow
Crack Growth in SiC,” J. Am. Ceram. Soc. 63 [3-4] 152-156 (1980). 9. A.G. Evans and F.F. Lange, “Crack Propagation and Fracture Toughness in Silicon
Carbide,” J. Matls. Sci, 19, 1659-1664 (1975). 10. G.D. Quinn, National Institute for Standards and Technology, private communication by
email, October 31, (2005). 11. G. G. Trantina, “Stress Analysis of the Double-Torsion Specimen,”J. Am. Ceram. Soc. 60
[7-8] 338-341 (1977). 12. D. Shetty and A.V. Virkar, J. Am. Ceram. Soc. 61 [1-2] 93-94 (1978). 13. L.S. Li, R.F. Pabst, “Subcritical Crack Growth in Partially Stabilized Zirconia (PSZ),” J.
Materials Science, 15, 2861-2866, (1980). 14. L.S. Li, J. Weick, and R.F. Pabst, Berichte der DKG, Ges 57, 5 (1980).