fr2 caltrans airport forecasting study appendices · appendices caltrans airport forecasting study...
TRANSCRIPT

January 31, 2014 www.camsys.com
Caltrans Airport Forecasting Study The Role of California Airports in Smart Growth and Economic Vitality
prepared for
California Department of Transportation Division of Aeronautics
prepared by
Cambridge Systematics, Inc.
with
Mead & Hunt Economic Development Research Group
appendices


appendices
Caltrans Airport Forecasting Study
The Role of California Airports in Smart Growth and Economic Vitality
prepared for
California Department of Transportation Division of Aeronautics
prepared by
Cambridge Systematics, Inc. 555 12th Street, Suite 1600 Oakland, CA 94607
with
Mead & Hunt Economic Development Research Group
date
January 31, 2014


Caltrans Airport Forecasting Study
Cambridge Systematics, Inc. i 8698.004
Table of Contents
A. Summary of Data for California Airports and Surrounding Areas ......... A-1 A.1 Historical Data Related to Economic Analysis ...................................... A-1
A.2 Forecasted Data Related to Economic Analysis .................................... A-3
A.3 Initial Population and Employment Profiles ......................................... A-5
A.4 Representative Airport Traffic Profiles................................................... A-9
B. Characteristics of Smart Growth Potential at Airports ............................... B-1 B.1 Characteristics Making Places More Likely to Attract Smart
Growth ........................................................................................................ B-1
B.2 How Airport Land Supports Smart Growth Attractive Characteristics ............................................................................................ B-3
C. Literature Review: Land Use and Industry near Airports ......................... C-1 C.1 Industries that Typically Cluster near Airports .................................... C-1
C.2 Illustrations of Industry Reliance on Aviation ...................................... C-4
C.3 Airport Business and Land Use Activity ................................................ C-6
C.4 Market Access: List of Candidate Industry Activities to Locate On or Near Airport Facilities ................................................................. C-10
C.5 National Airport Land Use Case Studies ............................................. C-14
D. Case Study Interview Guide............................................................................ D-1 D.1 Interview Guide ......................................................................................... D-1
E. Methodologies for Estimating Economic Potential of Role 1 and Role 2 Airports .................................................................................................... E-1 E.1 Role 1: Potential Productivity Impacts Generated by Smart
Growth Policies .......................................................................................... E-1
E.2 Role 2. Potential Productivity Impacts Generated by Smart Growth Policies ........................................................................................ E-15
F. Rating and Categorizing Airports ................................................................... F-1 F.1 Smart Growth Roles ................................................................................... F-1


Caltrans Airport Forecasting Study
Cambridge Systematics, Inc. iii
List of Tables
Table B.1 Characteristics Making Places More Likely to Attract Smart Growth ...................................................................................................... B-2
Table B.2 Typical Ratings for Airport Land on Smart Growth Attractive Characteristics ......................................................................................... B-4
Table C.1 Division of Air services by purchase and self-Supplied by Percent of Total Outlay (in Producers Prices) ..................................... C-4
Table C.2 Examples of Airport-Proximate Industries/Activities (by Airport Type and Relationship) ............................................................ C-8
Table C.3 Industry Sensitivities to Airport Access-”Quality” ranked on Domestic Airport Sensitivity ............................................................... C-12
Table D.1 Examples of Airport-Proximate Industries/Activities ...................... D-2
Table D.2 Why Non-Aviation Businesses Locate at the Airport ........................ D-3
Table E.1 Summary of Estimated Employment Change by Land Use ............. E-3
Table E.2 Estimated Employment Mix by 2-digit NAICS Category for Each Land Use ......................................................................................... E-4
Table E.3 Estimated Potential Employment Change by NAICS from Smart Growth Policy .............................................................................. E-5
Table E.4 Employment Scenarios for Four Case Study Airport Zip Codes ..... E-6
Table E.5 Summary of Employment Density Changes by Airport and Resulting Income Growth ...................................................................... E-9
Table E.6 Total Economic Impacts to California (2040) .................................... E-10
Table E.7 Economic Impacts to California from Buchanan Airport, by Sector ....................................................................................................... E-11
Table E.8 Economic Impacts to California from Santa Monica Airport, by Sector ....................................................................................................... E-12
Table E.9 Economic Impacts to California from Fresno Airport, by Sector ... E-13
Table E.10 Economic Impacts to California from Gillespie Airport, by Sector ....................................................................................................... E-14
Table E.11 Sample Role 2 Smart Growth Airport Areas ..................................... E-15
Table E.12 Density Changes Assumed for Smart Growth.................................. E-20
Table E.13 Total Job Growth Projected by County .............................................. E-21

List of Tables, continued
iv Cambridge Systematics, Inc. 8698.004
Table E.14 Manufacturing, Wholesale Trade and Truck Transportation Jobs Projected to be Lost by County ................................................... E-22
Table E.15 Adjusted Estimates to Accommodate Additional Capacity of Sonoma County Airport Smart Growth Area ................................... E-23
Table E.16 Direct, Indirect and Induced and Total Impacts by County Due to Jobs Saved in Airport Smart Growth Areas .................................. E-24
Table E.17 Potential Total Jobs by Sector Saved Per County in Role 2 Smart Growth Areas ........................................................................................ E-25
Table E.18 List of Persons Interviewed, by Airport Location ............................ E-30
Table F.1 Remaining Airports for Study ................................................................ F-2
Table F.2 Assignment of Scores to Ratings ............................................................ F-3

Caltrans Airport Forecasting Study
Cambridge Systematics, Inc. v
List of Figures
Figure A.1 Percent Employment by Industry for Airport Categories (2008) ..... A-2
Figure A.2 Percent Employment by Occupation for California Airport Categories (2008) ..................................................................................... A-3
Figure A.3 Average Employment per Airport by Industry for California Airport Categories (2008 to 2035) ......................................................... A-4
Figure A.4 Average Population per Airport by California Airport Category, 2008 to 2035 ............................................................................ A-5
Figure C.1 Industry Reliance on Air Travel ............................................................ C-2
Figure C.2 Rates of Employee Air Travel ................................................................ C-3
Figure E.1 California Average Income Elasticity with Respect to Sector-Specific Employment Density ............................................................... E-8
Figure E.2 Comparison of Regression Results for Retail vs. Professional, Scientific, Technical Services ................................................................. E-9
Figure E.3 Prospective Castle Airport Smart Growth Area ............................... E-16
Figure E.4 Prospective Santa Maria Public Airport Smart Growth Area ......... E-17
Figure E.5 Prospective Sonoma County Airport Smart Growth Area ............. E-18
Figure E.6 Prospective Yuba County Airport Smart Growth Area .................. E-19


Appendices


Caltrans Airport Forecasting Study Appendix
Cambridge Systematics, Inc. A-1
A. Summary of Data for California Airports and Surrounding Areas
This appendix provides data and information in table and charts on key historical and forecasted data about areas surrounding California airports. This material supported the initial qualitative review of California airports, prior to selecting airports for further assessment through the case study methodology. This data is provided as background material and is not directly related to quantitative analysis provided in this report. The aforementioned approach to this qualitative study required some data analysis related to smart growth design principles, but did not support a quantitative, data-driven approach. The nature of the case studies and the uncertainty of economic growth across the state made the qualitative approach the most applicable to practitioners. This data, however, provide useful background to regional demographic and socioeconomic conditions across the state.
A.1 HISTORICAL DATA RELATED TO ECONOMIC ANALYSIS
Employment by Industry
This section describes the distribution of employment across eight industry categories used in the statewide travel demand model, for each airport airside category (Figure A.1).
Non-major airport categories have a greater share of primary sector industry activity on or near the airport than in the state overall. This is likely due to the low-density land uses such as agriculture near airports in undeveloped areas.
Non-major airport categories have a greater share of office-related sectors on or near the airport than in the state overall. Metropolitan airports have the largest share of office uses, at nearly 30 percent of all industry sectors. This reflects the opportunities for aviation-compatible administrative and office facilities in low-density areas near most airports.
Office, education and retail uses are also strongly represented in non-major airports. Community airports have the greatest share of education and health activities of these airport types.

Caltrans Airport Forecasting Study Appendix
A-2 Cambridge Systematics, Inc.
Figure A.1 Percent Employment by Industry for Airport Categories (2008)
Source: California Statewide Travel Demand Model.
Employment by Occupation
This section describes the distribution of employment across nine occupation types used in the TDM, for each airport category (Figure A.2).
Airports in all categories have a greater share of blue collar occupations than in the state overall. This corresponds to the greater industry representation in primary sector.
Office labor, including clerical, managerial and sales occupations, is strongly represented at and near non-major airports. This corresponds closely to statewide occupation shares.

Caltrans Airport Forecasting Study Appendix
Cambridge Systematics, Inc. A-3
Figure A.2 Percent Employment by Occupation for California Airport Categories (2008)
Source: California Statewide Travel Demand Model.
A.2 FORECASTED DATA RELATED TO ECONOMIC ANALYSIS
Projected Employment Growth
The statewide transportation demand model includes forecasts of employment based on local and regional planning efforts. The forecasts extend to the year 2040, with intermediate years included. The forecasts for this study go to the year 2035, in order to align with data available from air travel forecasts. The employment forecasts were estimated by the State’s MPOs as part of regional planning activities, which include extensive public outreach and technical modeling. See Figure A.3.
Employment is expected to grow steadily to 2035 in all airport categories.
Regional, commercial, and major commercial airports are forecast to experience greater employment growth from 2020 to 2035 than the preceding decade.

Caltrans Airport Forecasting Study Appendix
A-4 Cambridge Systematics, Inc.
Figure A.3 Average Employment per Airport by Industry for California Airport Categories (2008 to 2035)
Source: California Statewide Travel Demand Model.
Projected Population Growth
The state travel demand model also includes population forecasts based on local and regional planning efforts and travel demand modeling. Population is generally greatest near airport types with the least existing development (limited use, community, regional). Population growth at these airports is expected to continue, with the growth rate increasing after 2020. See Figure A.4.
Commercial airports are expected to experience population growth near the airport at rates similar to areas near smaller airports. Major commercial airports, which had the lowest nearby population in 2008, are expected to have nearby population roughly equal to metropolitan airports by 2035.
Metropolitan airports will experience flat population growth to the year 2020, then increase growth rate slightly to 2035.

Caltrans Airport Forecasting Study Appendix
Cambridge Systematics, Inc. A-5
Figure A.4 Average Population per Airport by California Airport Category, 2008 to 2035
Source California Statewide Travel Demand Model.
Projected Aviation Capacity Demands
Future air travel demand at different airport types is provided by the Federal Aviation Administration (FAA) in the Terminal Area Forecasts1. The data include enplanements (boarding), vehicle activity (take off and landing), and number of vehicles stored at the airport. This study focuses on landside activity (e.g. population, employment, zoning) and therefore did not consider aviation demands directly. The Caltrans Division of Aeronautics coordinates with the FAA to develop and integrate travel demand data into statewide planning efforts.
A.3 INITIAL POPULATION AND EMPLOYMENT PROFILES Table A.1 provides an overview of population and employment data for areas surrounding selected airports from Caltrans’ five airport categories. The data is
1 For more information, see the Federal Aviation Administration forecast data available
at https://aspm.faa.gov/main/taf.asp.

Caltrans Airport Forecasting Study Appendix
A-6 Cambridge Systematics, Inc.
presented based on observed data in 2010, as well as future forecast data from the CSTDM. These airports were selected for representative purposes and may or may not reflect the data used in the case studies prepared for this study.
Study areas for the selected airports were considered to be the travel analysis zones (TAZ) surrounding the airport. TAZs vary in geographic size, based largely on the amount of travel expected in the area. TAZs in less populous areas will typically cover relatively large land areas, while TAZs in urban areas may cover only several blocks. Therefore the airports in urban areas are typically located in zones that encompass only the airport property.

Caltrans Airport Forecasting Study Appendix
Cambridge Systematics, Inc. A-7
Table A.1 Overview of Demographic and Socioeconomic Profiles of Representative Airports by Airside Category
Airport Name County City
Employment in Nearest Municipality Employment in Airport TAZ Population in Airport TAZ
2008 2035 2008 2035 2008 2035
Major Commercial/Primary
Los Angeles International Los Angeles Los Angeles1 1,820,092 1,994,134 22,616 15,002 - 35
Sacramento International Sacramento Sacramento2 966,316 1,327,424 2,213 9,819 3,152 15,367
San Francisco International San Francisco San Bruno - - 17,103 37,755 - -
Commercial/Primary
Fresno Yosemite International Fresno Fresno 881 4,418 8,300 9,143 1,363 1,839
McClellan Airfield San Diego Carlsbad 1,711 2,333 23,122 26,214 10,245 11,715
Ontario International San Bernardino Ontario 109,075 208,240 8,313 25,235 163 151
Redding Municipal Shasta Redding 1,703 1,899 1,621 8,861 5,184 8,434
San Diego International San Diego San Diego 9,316 20,942 4,740 5,390 50 81
Metropolitan
Buchanan Field Contra Costa Concord 1,588 1,907 16,771 25,501 1,402 1,734
Hayward Executive Alameda Hayward 1,017 1,513 6,567 10,024 630 453
Livermore Municipal Alameda Livermore 16,771 25,501 5,053 8,715 6,825 8,279
Santa Monica Municipal Los Angeles Santa Monica 89,493 101,699 6,387 5,776 580 533
Van Nuys Los Angeles Los Angeles1 1,820,092 1,994,134 9,683 19,541 935 915

Caltrans Airport Forecasting Study Appendix
A-8 Cambridge Systematics, Inc.
Airport Name County City
Employment in Nearest Municipality Employment in Airport TAZ Population in Airport TAZ
2008 2035 2008 2035 2008 2035
Regional
Chino San Bernardino Chino 2,156 380 410 3,359 1,140 10,636
Hollister Municipal San Benito Hollister 1,052 1,315 2,017 6,996 8,601 15,380
Lake Tahoe El Dorado South Lake Tahoe
1,247 1,446 2,322 10,035 7,437 2,929
Napa County Napa Napa 2,017 6,996 9,123 12,783 89 233
Yuba County Yuba Olivehurst 3,023 3,654 1,134 2,280 5,402 7,616
Community
California City Muni. Kern California City 583 2,950 244 814 2,530 3,788
Cameron Air Park El Dorado Cameron Park 1,867 1,260 1,049 1,627 5,223 12,065
Castle Merced Atwater 2,356 3,223 4,012 6,163 2,626 5,042
Marina Municipal Monterey Marina 607 1,780 2,295 4,035 10,773 10,917
University Yolo Davis 1,597 851 12,016 13,475 2,355 4,294
Limited Use
Adin Modoc Adin 635 1,351 113 1,190 2,814 4,160
Blue Canyon Placer Blue Canyon 113 1,190 3,901 2,348 8,841 18,787
Dinsmore Humboldt Dinsmore 635 1,351 4,187 9,951 16,599 4,225
Gravelly Valley Lake Lake 113 1,190 635 1,351 6,541 7,043
Harris Ranch Fresno Coalinga 3,589 9,557 3,589 9,557 4,137 10,582
Source: 1) SCAG 2008 RTP – 2010 and 2035 Employment Estimates; 2010 is the most approximate year to 2008; and 2) SACOG 2012 MTP/SCS – 2008 and 2035 Employment Estimates for the SACOG region.

Caltrans Airport Forecasting Study Appendix
Cambridge Systematics, Inc. A-9
A.4 REPRESENTATIVE AIRPORT TRAFFIC PROFILES This data is based on reports to the Federal Aviation Administration (FAA) and the California Department of Transportation. Airport data will be supplemented or confirmed through interviews with airport managers. The data includes current year enplanements, air traffic, and air freight. Forecasted enplanements are also included for future years from the FAA (Table A.2).
Table A.2 Summary of Air Traffic for Preliminary Case Study Airports by Airport Category
Airport Name 2011 Air Traffic 2011 Freight (U.S. Tons)
Enplanements
2011 Actual 2035
Forecast
Major Commercial/Primary
Los Angeles International 433,452 1,860,540 30,528,737 55,222,199
Sacramento International 125,151 72,028 4,370,895 9,252,370
San Francisco International 427,074 420,220 20,056,568 34,815,661
Commercial/Primary
Fresno Yosemite International 135,454 11,025 615,320 896,676
McClellan Airfield 137,718 NA 45,518 104,904
Ontario International 90,751 410,120 2,271,458 2,625,537
Redding Municipal 104,674 1,221 38,290 68,493
San Diego International 201,720 130,850 8,465,683 15,460,950
Metropolitan
Buchanan Field 93,874 NA 15 15
Hayward Executive 86,069 NA 2 2
Livermore Municipal 124,213 NA 2 2
Santa Monica Municipal 165,130 NA 100 100
Van Nuys 504,502 2 1,018 1,018
Regional
Chino 164,588 NA 13 13
Hollister Municipal NA NA 14 14
Lake Tahoe 23,540 NA 32 32
Napa County 53,953 NA 69 69
Yuba County 35,300 NA 6 6
Community
California City Municipal 37,200 NA NA NA

Caltrans Airport Forecasting Study Appendix
A-10 Cambridge Systematics, Inc.
Airport Name 2011 Air Traffic 2011 Freight (U.S. Tons)
Enplanements
2011 Actual 2035
Forecast
Cameron Air Park 36,036 NA NA NA
Castle 72,153 NA NA NA
Marina Municipal 40,000 NA NA NA
University NA NA NA NA
Limited Use
Adin 1,000 NA NA NA
Blue Canyon 100 NA NA NA
Dinsmore 23,540 NA NA NA
Gravelly Valley 1,200 NA NA NA
Harris Ranch NA NA NA NA
Source: FAA (Air Traffic, Growth forecast), Caltrans (2011 Actual, 2011 Air Freight).
Note: Forecasted 2035 enplanements estimated by applying the growth rate from the Federal Aviation Administration Terminal Area Forecast, years 2011 and 2035.

Caltrans Airport Forecasting Study Appendix
Cambridge Systematics, Inc. B-1
B. Characteristics of Smart Growth Potential at Airports
This analysis includes a two-step exercise to determine a set of characteristics for evaluating the potential for smart growth at airports. Two questions were explored.
1. Determine what characteristics make some places more likely to attract smart growth than other places.
a. If you were trying to predict where Smart Growth will occur next, what would you look for?
b. If you were a developer looking for a location to build a Smart Growth development, what would you look for?
c. If you were an agency trying to encourage Smart Growth, where would you do it?
2. Assess whether airports and the land near airports fare better on any of these characteristics than other places.
B.1 CHARACTERISTICS MAKING PLACES MORE LIKELY TO ATTRACT SMART GROWTH Interviews were conducted with the following experts:
Chris Ratekin, Sustainable Mobility Branch, California Department of Transportation;
Dr. Daniel Chatman, Department of City and Regional Planning, University of California, Berkeley; and
William Fulton, Smart Growth America
The report summarizes finding from the following reviewed reports:
California Department of Housing and Community Development (HCD) Transit-Oriented Development (TOD) Housing Program Second Round Criteria;
California Department of Housing and Community Development (HCD) Infill Infrastructure Grant (IIG) Program Second Round Criteria;
Smart Scorecard for Development Projects, Congress for New Urbanism, U.S. EPA, January 2002;

Caltrans Airport Forecasting Study Appendix
B-2 Cambridge Systematics, Inc.
New Jersey Smart Growth Scorecard; and
Maryland Smart Growth Scorecard, November 2001.
Table B.1 summarizes the characteristics that make a place more likely so attract smart growth.
Table B.1 Characteristics Making Places More Likely to Attract Smart Growth
Characteristic
1 Surrounding population density
2 Surrounding employment density
3 Good supporting transportation infrastructure (auto, transit, bicycle, walking)
4 Permanence of transportation infrastructure
5 Easy to walk around (e.g., block length, continuous sidewalks, lighting, street width)
6 Supportive parking environment
7 Amenities within ½ mile
8 Availability of land for development
9 Suitability of land for development (e.g., not steep slope, floodplain, stream)
10 Proximity to service infrastructure (e.g., water, sewer, fire, police)
11 Lack of resistance to development in surrounding area
Source: Cambridge Systematics, 2013.
The key to smart growth is to generate pedestrians. The first seven characteristics in Table B.1 correlate with generating pedestrians at a given location. A location with high population or employment density nearby is more able to attract pedestrians. Good supporting transportation infrastructure is necessary to get people to and from the location. Permanent transportation infrastructure is more likely to attract development (rail and airports are permanent, buses are not). A location with a good walking network will be attractive to pedestrians.
For most locations in the United States, a supportive parking environment is needed as most people travel by private automobile. This means sufficient parking, but in a way that allows for an attractive walking environment (e.g., parking behind or in structures rather than in large surface lots between building fronts and sidewalks).
A location with amenities nearby is more likely to attract pedestrians. Several amenities are listed in the documents reviewed. They generally fall into the following categories:
Retail (e.g., grocery store, convenience store, etc.);
Entertainment (e.g., theater, restaurant, etc.);

Caltrans Airport Forecasting Study Appendix
Cambridge Systematics, Inc. B-3
Services (e.g., bank, child care, senior center, dry cleaner, medical, dental, etc.);
Recreation (e.g., recreation center, health club, etc.);
Public spaces (e.g., park, playground, etc.); and
Public services (e.g., school, social service center, library, post office, etc.).
The last four characteristics in Table B.1 address the likelihood developers would be willing to develop in a certain location.
A good proxy for the 11 characteristics listed in Table B.1 is to look for places with high land value. A high land value indicates the desirability of a place for development. The higher the land value, the more attractive it is for higher density development, which is in turn a key component of smart growth.
B.2 HOW AIRPORT LAND SUPPORTS SMART GROWTH ATTRACTIVE CHARACTERISTICS How airports fare with respect to the 11 characteristics listed in Table B.1 will vary on an airport-by-airport basis. However, some broad statements can be made:
Surrounding population density. The population density near airports is generally lower than the surrounding region.
Surrounding employment density. Some airports have significant employment activity nearby, other do not. Those that do not could generate it by identifying economic development possibilities based on economic location efficiency (i.e., identify economic activity that is efficient to locate near an airport).
Good supporting transportation infrastructure. Airports generally have good supporting transportation infrastructure. However, it is typically focused on getting people to and from the airport terminal complex itself, and less so on getting people to and from the surrounding land. Thus, some redevelopment of the transportation infrastructure may be needed to attract Smart Growth to land near airports.
Permanence of transportation infrastructure. The airport itself and the roadway network are permanent. However, most airports are served by bus transit, which is not permanent.
Easy to walk around. The environment near airports is generally not conducive to walking. However, it could be made walking conducive by implementing form based codes for future development.
Supportive parking environment. Airports generally have ample parking supply. However, it is typically provided in a manner that precludes an

Caltrans Airport Forecasting Study Appendix
B-4 Cambridge Systematics, Inc.
attractive walking environment. Thus, some redevelopment of the parking infrastructure may be needed to attract Smart Growth to land near airports.
Amenities within ½ mile. There are generally fewer amenities in the vicinity of airports than in the surrounding region.
Availability of land for development. This varies airport-by-airport. The airport terminal itself could be a possibility for development.
Suitability of land for development (e.g., not steep slope, floodplain, stream). The land near airports is generally suitable for development.
Proximity to service infrastructure (e.g., water, sewer, fire, police). Service infrastructure is generally provided at or near airports.
Lack of resistance to development in surrounding area. There is usually less resistance to development near airports than in the surrounding region.
Based on the above general statements, Table B.2 provides a typical rating for airports and the land near airports relative to the 11 characteristics making places attractive for smart growth. Again, these ratings should be adjusted for individual airports.
Of the first seven characteristics (i.e., those related to generating pedestrians at a given location), airport land typically rates better than the surrounding region on two, and worse than the surrounding region on three.
Of the last four characteristics (i.e., those related to the likelihood developers would be willing to develop), airport land typically rates better than the surrounding region on three.
Table B.2 Typical Ratings for Airport Land on Smart Growth Attractive Characteristics
Smart Growth Attractive Characteristics Typical Rating
for Airport Land 1 Surrounding population density – 2 Surrounding employment density 3 Good supporting transportation infrastructure (auto, transit, bicycle, walking) + 4 Permanence of transportation infrastructure + 5 Easy to walk around (e.g., block length, continuous sidewalks, lighting, street width) – 6 Supportive parking environment 7 Amenities within ½ mile – 8 Availability of land for development 9 Suitability of land for development (e.g., not steep slope, floodplain, stream) + 10 Proximity to service infrastructure (e.g., water, sewer, fire, police) + 11 Lack of resistance to development in surrounding area +
+ = Better than surrounding region – = Worse than surrounding region
Source: Cambridge Systematics, 2013.
TBD – breaking down the table into residential versus commercial smart growth attractive characteristics.

Caltrans Airport Forecasting Study Appendix
Cambridge Systematics, Inc. C-1
C. Literature Review: Land Use and Industry near Airports This appendix provides background and summarizes past airport and market access research on the types of uses around airports. This information was used to develop the structured interview guide and to lay the foundation for the economic assessment of the Tier 1 airports.
C.1 INDUSTRIES THAT TYPICALLY CLUSTER NEAR AIRPORTS The following types of industries tend to rely most heavily on air transportation, and therefore may cluster near airports.
Technology based manufacturing and services, including sectors such as business and professional services, manufacture of electronic equipment, and instruments. These industries rely on air services much more than other sectors, for both passenger and cargo travel needs, for the following reasons:
The products produced tend to be delicate and time-sensitive, so that they need to be shipped by air. Typically, these are technology-related products where value reflects high labor costs and precision manufacturing, but may also be perishable agricultural products (including fish and meat, live or processed).
Products that are heavy to ship, but that carry a large return on transportation costs invested, including just-in-time manufacturing and equipment needed to maintain high yielding production.
Business and professional services depend on sales of professional expertise, which often require travel to meet with clients and make presentations.
Companies have statewide, western, national and even global business networks, requiring frequent and often international travel between the various offices.
Tourism. GA and commercial airports serve resorts and tourist destinations. Producers of high-tech products, business services and computer-oriented firms are among the industries that spend the most money on air services. Most of these industries spend at least 25 percent more on air services than the average industry in the United States, and a few spend 50 percent or more than the average of all industries in the United States. This is shown in national statistics on industry reliance on air travel shown on Figure C.1.

Caltrans Airport Forecasting Study Appendix
C-2 Cambridge Systematics, Inc.
Figure C.1 Industry Reliance on Air Travel
Source: U.S. Dept. of Commerce and Bureau of Transportation Statistics, 2000: Transportation Satellite
Accounts, 1996.
Note: Values reflect the relative reliance on air travel among individual industries, represented as a proportion of the national average (which is air travel costs representing 3.6 percent of total industry revenue).
Reliance on air cargo transport is due to the unique characteristics of products:
Long average shipping distances of cargo in these industries,
High average value per ton of the goods produced within these sectors,
High export ratios and long export distances demanded by these sectors, and
Nature of the demands of product delivery.
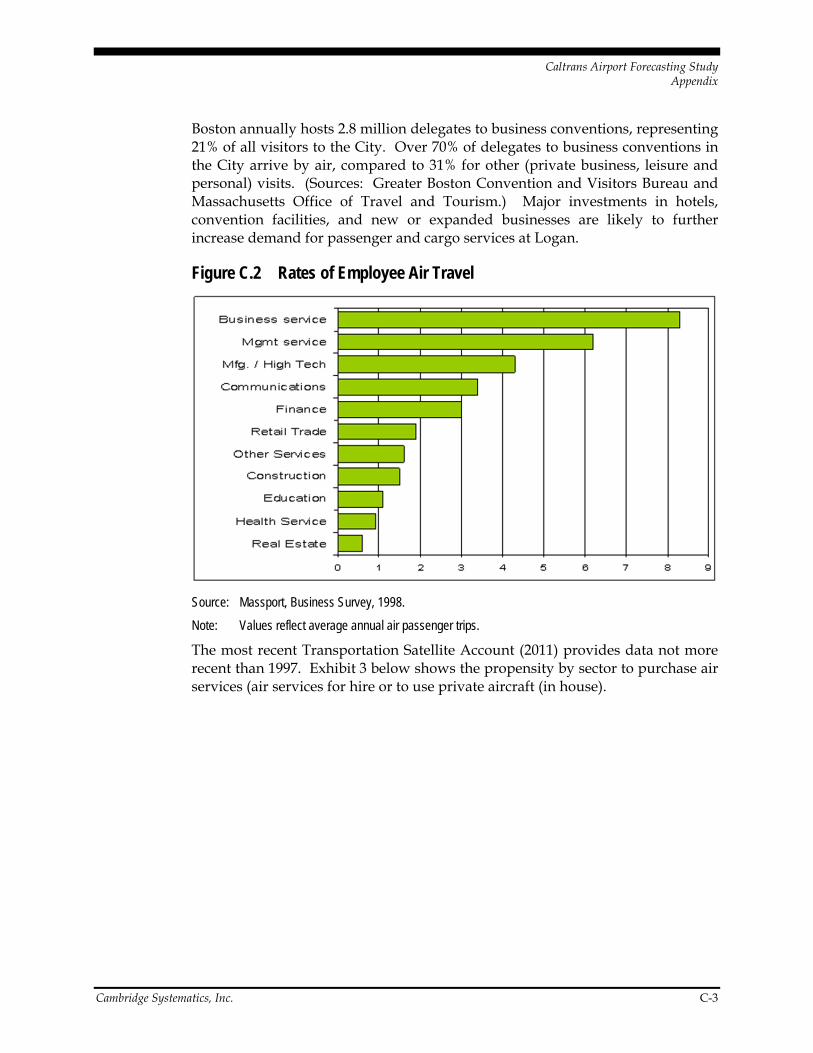
Surveys show that rates of airline passenger travel vary widely among businesses, with the greatest amount of employee air travel occurring in the business and management services, local manufacturing sectors and finance, Figure C.2. Many New England businesses in high-growth industries are part of global business networks, requiring frequent and often international travel between the various offices, as illustrated in the text boxes on the following page.
0.00 0.25 0.50 0.75 1.00 1.25 1.50 1.75 2.00 2.25
Agric products
State & local govt
Cons truction
Real es tate
Radio/TV broadcas t
Retail trade
Stone & clay products
Repair s ervices
Res taurants
Legal s ervices
Educational s ervices
Finance
Scientific ins trum ents
Electrical equipm ent
Com puter & data proc
Ins urance
Bus ines s s ervices
Com puter equipm ent
Freight forwarders
Above Average
Belo Averag
Averag
w
e
Caltrans Airport Forecasting Study Appendix
Cambridge Systematics, Inc. C-3
Boston annually hosts 2.8 million delegates to business conventions, representing 21% of all visitors to the City. Over 70% of delegates to business conventions in the City arrive by air, compared to 31% for other (private business, leisure and personal) visits. (Sources: Greater Boston Convention and Visitors Bureau and Massachusetts Office of Travel and Tourism.) Major investments in hotels, convention facilities, and new or expanded businesses are likely to further increase demand for passenger and cargo services at Logan.
Figure C.2 Rates of Employee Air Travel
Source: Massport, Business Survey, 1998.
Note: Values reflect average annual air passenger trips.
The most recent Transportation Satellite Account (2011) provides data not more recent than 1997. Exhibit 3 below shows the propensity by sector to purchase air services (air services for hire or to use private aircraft (in house).

Caltrans Airport Forecasting Study Appendix
C-4 Cambridge Systematics, Inc.
Table C.1 Division of Air services by purchase and self-Supplied by Percent of Total Outlay (in Producers Prices)
Industry Air Services for Hire Air Services In-House
Construction 96% 4%
Manufacturing Products 95% 5%
Trade 90% 10%
Utilities 68% 32%
Information 70% 30%
Financial Services 70% 30%
Professional and Business Services 84% 16%
Education and Health Services 70% 30%
Leisure and Hospitality 72% 28%
Other Services 70% 30%
Source: Transportation Satellite Accounts: A Look at Transportation’s Role in the Economy, 2011. Data are 1997.
C.2 ILLUSTRATIONS OF INDUSTRY RELIANCE ON AVIATION Below are excerpts of interviews and observations from past studies conducted by EDR Group. Note that all airports have logistics components that serve passengers and shippers. These components, including car rental, taxi cab and other passenger transport services; trucking, freight forwarding and other air cargo related supports are service industries that will grow if the demands for these services exist. Therefore, they are not considered in the list below.
Cargo and Cargo/Business Travel
Perishables. A 1997 study of the seafood industry showed that firms throughout eastern Massachusetts are increasing their use of airfreight with increases in demand for fresh seafood both domestically and internationally. Representatives of seafood processing and distribution companies located in Boston said that, despite the fact that more fresh fish is docked and sold in places like Portland, ME and New Bedford, they do not want to leave the city because they are unwilling to lose their easy access to Logan Airport. Typically, freshly caught fish are flown to Boston, cut into steaks or fillets by Boston seafood processors and the flown to the Midwest, so diners at “white table cloth restaurants” can enjoy fresh ocean seafood dinners.
High-tech Products. EMC (data storage products) Most of EMC’s product is shipped via air cargo to customers worldwide. Even domestic deliveries tend to rely on air transport, as shipments are often time-critical. EMC receives many air

Caltrans Airport Forecasting Study Appendix
Cambridge Systematics, Inc. C-5
cargo shipments from suppliers that are also time critical. The incoming volume of shipments has increased proportional to EMC’s business growth. Also, numerous business trips involving air flights are made daily by employees of EMC operations worldwide.
Heavy Equipment. Air travel is critical for both business travel and cargo at a midsized establishment specializing in manufacture and sales of naval and oil exploration equipment. The time factor for these sales is much more important than the actual shipping costs, and the mode of shipment depends upon the customer’s needs. The weight of products being shipped is often irrelevant if compared to the costs incurred by oil rigs not being operational while replacement equipment is needed. The industry market has become more global and diversified over the past ten years, resulting in increases in air travel, which is particularly important for sales to the oil industry. Employees at this mid-sized company make approximately 2,000 trips a year, including international flights to the UK, France, Australia, Japan, Korea, Indonesia, Malaysia and Taiwan.
Just-in-Time for Traditional Manufacturing. Although airport traffic of a GA Airport in Wisconsin is primarily composed of general aviation operations, the demand for air cargo operations has grown rapidly in recent years. Most of the airport’s activity growth can be traced to an increase in “on-demand” services by local automobile assembly and components plants. Such services are vital to automotive plants, where introduction of just-in-time logistics and production methods has increased the importance of uninterrupted materials deliveries. (Other local companies with perishable products, including a cheese manufacturer and a juice company, also use the airport for rapid transport needs.)
Medical Devices. Smith-Nephew is a producer of medical devices. Aviation is critical or business travel, hosting visitors, and cargo shipments. Deliveries rely on air transportation. Products are sterile surgical instruments that are delivered to hospital operating theaters worldwide on-demand, and are exceptionally time-sensitive. Forty percent of products are shipped internationally, with major markets in Western Europe, Australia, Japan and South Africa.
Business Travel
For Profit. The Global Education Division of IBM sends four to five thousand employees on 6,500 to 8,500 business trips per year, with destinations including San Francisco and various points in Europe and Asia. Regional airports are increasingly used for flights to metro New York, Washington, D.C. and other short-haul destinations.
Non-Profit. MITRE is a Federally funded research and development center that performs engineering, systems research, and strategic management for the Departments of Defense, Aviation, Treasury, and other agencies. MITRE has 60 sites globally, with 7 in Europe, 5 in Asia, and 2,500 employees at its Bedford,

Caltrans Airport Forecasting Study Appendix
C-6 Cambridge Systematics, Inc.
MA site. Employees make frequent business trips between sites and rely on Logan for approximately 95% of their air travel. Air travel has increased in the past 10 years as the company has grown and its customer base has expanded and diversified.
Tourism
High-end Leisure Travel. Resorts, depend on GA airports for bringing in high paying customers. A recent study in South Dakota estimated that air travelers to the state spend almost $51 million annually in staying at hunting resorts. One resort reported that the average visitor arriving through a nearby GA airport spends $3,300 a day. Similar rates of spending are reported by resorts in Colorado that service skiers that arrive by private jet.
C.3 AIRPORT BUSINESS AND LAND USE ACTIVITY This section describes land use and business activities on or proximate to airports and classifies the relationships of those activities to the airport. For the purposes of this discussion, the relationships between airports and “on-airport” or airport-proximate land uses fall into one of three categories:
Aviation/airport dependent. This group includes business activities that operate at an airport or provide services directly to businesses and passengers who use the airport. Examples include charter aircraft services as well as maintenance and flight instruction providers.
Aviation/airport reliant. This group includes businesses or activities that have a higher than average use of air service for freight or business travel, which may motivate location close to airports.
Non-aviation/airport reliant: This group includes businesses or activities that are not dependent or reliant on air service for production, shipping, or other business activities. Other factors motivate the location of these businesses on or near airports; these may include real estate costs, proximity to other transportation facilities, or zoning issues related to environmental impacts (e.g., noise).
Various research efforts inform our understanding of the relationships between airports and surrounding land uses. The Bureau of Transportation Statistics Transportation Satellite accounts have identified freight forwarding, computer equipment, business services, computer and data processing, electrical equipment and scientific instrument industries as those with a higher than average reliance on air travel.2 Similarly, through examining the role of the scale
2 U.S. Dept. of Commerce and Bureau of Transportation Statistics, 2000: Transportation
Satellite Accounts, 1996.

Caltrans Airport Forecasting Study Appendix
Cambridge Systematics, Inc. C-7
of aircraft operations and access to the airport (e.g., drive time) on county-level industry composition (e.g., employment per-capita) for the U.S., EDRG has found that light manufacturing industries that rely on exporting and importing air cargo, and service industries (such as media, technical or scientific, or administrative services) that rely on employee business travel are among the business sectors that value air transportation.3 The value these businesses assign to air service may motivate them to locate operations close to airports when possible. This concept is supported by an analysis by Appold and Kasarda (2006), which studied the role of the 25 busiest U.S. airports4 as urban anchors using an examination of employment composition and dynamics using broad NAICS categorizations from Zip Business Pattern data for 1995 and 2002) identifies that Manufacturing, Wholesale trade, and Transportation and Warehousing activities are 1 to 3 times more concentrated within an airport radius (measured in 2.5-, 5-, and 10-mile increments) than within the same radius to the central business the airport serves.5
Businesses may have varying types of aviation needs within these aviation-reliant industries, however. For example, some must locate adjacent or in very close proximity to an airport or major transportation artery (such as freight transportation businesses and hotels and lodging), while others simply need convenient and reliable access to an airport, and are more flexible in location decisions.6 For businesses that are less reliant on air service for their activities (such as broadcasting, construction, agriculture, and stone and clay products industries), their links to the airport are even less clear.7
It is also worth noting that despite general patterns in industry aviation dependence or reliance (motivating business location), both the physical spread of business location around an airport (from an immediate district to an “airport region”) and the mix of business activities found will vary widely from one airport facility to another.8 Factors shaping this variation include land availability, parcel assembly, land ownership, property taxes, land-side access, abutting land uses, airport size or classification (i.e., general aviation versus
3 Alstadt and Weisbrod, The Relationship of Transportation Access and Connectivity to
Local Economic Outcomes: A Statistical Analysis, Transportation Research Board, Annual Conference January 2012. Also see Appendix 1 – Market Access Memo.
4 All are large or medium commercial hubs and are not the focus of this project. This research is mentioned to note the principle of locating near an airport due to the value assigned to air service.
5 See Appendix 1: Market Access Memo.
6 See Appendix 2: TF Green Research Memo.
7 See “Initial Thoughts of Industries that are Attracted to Airports,” September 19, 2012.
8 See Appendix 1: Market Access Memo.

Caltrans Airport Forecasting Study Appendix
C-8 Cambridge Systematics, Inc.
regional), among others.9 The dynamic that determines this mix and physical spread may range from the organic to the highly facilitated (i.e., planning policies were leveraged to market and attract synergistic land uses), and the pace of airport and other land use “co-location” can be difficult to predict.
Table C.2 below categorizes examples of different land use activities identified through this survey according to adjacent airport type and according to the “aviation/airport dependent,” aviation/airport reliant,” and “non-aviation/airport reliant” categories mentioned above. The inclusion of industries or activities in a given category is based on EDRG’s experience researching patterns of aviation dependence.
Table C.2 Examples of Airport-Proximate Industries/Activities (by Airport Type and Relationship)
Industries/Activities Located in Proximity to Airports
Dependent Reliant Not Dependent or Reliant
General Aviation
Air charter services
Repair and maintenance services
Flight instruction companies
Fixed based operators
Hangar sales and leasing centers
Aerospace manufacturing
Car rentals
Taxi service
Restaurants
Mail/cargo freight forwarders (e.g., FedEx)
Investment firms
Printer manufacturing
Phone/Internet service providers
Engineering consultants
Pharmaceutical companies
Business administration
Corporate headquarters
Agricultural operations
Construction companies
Brewing companies
Plastics manufacturing
Construction products manufacturing
Automotive racing schools
Fertilizer manufacturing
Tanning
Rubber mill
Fiber container production
Reliever Air charter services
Aircraft component suppliers fueling services
Repair, maintenance, and restoration services
Flight instruction companies
Fixed based operators
Hangar sales and leasing centers
Aviation museums
High-tech industries
Financial, accounting and engineering services
Real estate services
Electronics manufacturing
Silicone/polymer manufacturing
Corporate offices
Phone/Internet service providers
Agricultural operations
Packaging manufacturing
Processed food manufacturing
Sports complexes
Public school warehouse and food service facilities
Solar arrays
Golf courses
9 Ibid.

Caltrans Airport Forecasting Study Appendix
Cambridge Systematics, Inc. C-9
Industries/Activities Located in Proximity to Airports
Dependent Reliant Not Dependent or Reliant
Aerospace manufacturing
Car rentals
Taxi service
Restaurants
Mail/cargo freight forwarders (e.g., FedEx)
Small/ Medium Commercial
Passenger transportation (scheduled and non-scheduled)
Hotels and motels
Couriers
Restaurants
Taxi service
Food service
Retail and restaurants,
Other ground transportation to/from airport
Fuel vendors
Airport support activities
Hangar rental
Flight training
Parking lots and garages
Mail/cargo freight forwarders (e.g., FedEx)
Merchant wholesalers
Ambulatory health care services,
Machinery manufacturing and maintenance
Electronics repair and maintenance
Electrical equipment and appliance manufacturing
Truck transportation
Computer and electronic product manufacturing
Telecommunications
Publishing industries (except Internet)
Internet service providers
Data processing
Source: EDR Group, 2012.
The summary presented in Table C.2 suggests a number of possible land development trends for the areas around general aviation airports.
Areas adjacent to airports may provide manufacturing facilities with opportunities to expand that may not be available in denser or more developed parts of the community (see the Smyrna/Rutherford County Airport and Corvallis Municipal Airports examples). It is possible that office operations may have similar concerns.
Airport-area sites are likely attractive for activities that require a lot of space but not necessarily built development. Examples include the solar array at the Smyrna/Rutherford Regional Airport, the farm incubator at the Port of

Caltrans Airport Forecasting Study Appendix
C-10 Cambridge Systematics, Inc.
Skagit, and the raceway and driving schools at the Sebring Regional Airport and Commerce Park.
While the mix of land uses around a given airport depends on a wide variety of factors – including individual business needs, the characteristics of the airport, and the availability of property elsewhere – facilitation on the part of economic development authorities and others plays an important role in shaping this mix.
The desire to avoid environmental impact conflicts, specifically related to noise, is likely a significant motivator for non-aviation businesses locating near airports. That said, the combination of manufacturing, sports, and human service activities at the Chesterfield County Airport Industrial Park suggest that potential environmental conflicts among widely different uses can be managed.
As we move forward, we should consider the following factors when interviewing airport operators and tenants of airport or adjacent business/industrial parks, and local economic developers:
Expansion potential that is considered when making sitting decisions. Airport or business park tenants (particularly those in manufacturing) may consider future opportunities to expand as one of their key criteria. Because of this, they may evaluate whether a particular airport and/or related industrial park may provide these opportunities (air service availability aside).
Complementary factors that create viable economic development climate, including: 1) adjacent transportation facilities, 2) available/access to cost effective infrastructure, including water, sewer, electricity and broadband, 3) real estate prices in comparison with “traditional” local development sites, 4) airport or airport business park business attraction efforts (including tax credits or other financing), 5) open space and supportive zoning, and 6)opportunities to avoid land use conflicts (noise, air quality) when they make business siting decisions on or near airports.
Changes of land use over time, and if development is being attracted to parcels proximate to airports or is leaving airport areas, and if there are discernible reasons for either trend
C.4 MARKET ACCESS: LIST OF CANDIDATE INDUSTRY ACTIVITIES TO LOCATE ON OR NEAR AIRPORT FACILITIES Opportunities will range from businesses that are typically found within/around the airport perimeter depending on land available each side of the fence [supporting passenger/cargo aircraft needs, entities with complimentary needs e.g., Air National Guard, Aerial Spraying-Photographic Services, Aviation-

Caltrans Airport Forecasting Study Appendix
Cambridge Systematics, Inc. C-11
development activities], to other forms of business location driven by (or not deterred by) proximity to the air services offered (passenger and/or cargo, frequency and scale of operations), such as HQ offices, hotels, restaurants, ground transportation providers (including car rental agencies), and industrial activities that ship/receive goods by air.
The physical spread of business location around an airport (from an immediate district to an “ airport region”), as well as the mix of business activities found, will be highly variable from one facility to another (even if the two facilities carry the same State airport functional classification designation) as a result of land availability (determined by topography, extent of pre-existing development, zoning), parcel assembly, land ownership, property taxes, landside access, abutting land uses, producer amenities of the location. The portion of business location within an airport district that is the result of nearby air transportation services will clearly look different within a community airport setting in contrast to a regional airport setting.
The process by which the in-fill around an airport has occurred to date may reflect a dynamic between entirely organic (the area and region was endowed with attractive cost and quality assets needed for conducting business) with no zoning conflicts, and a process that is heavily facilitated by leveraging planning policies (at minimum to protect the operating envelop of aircraft) to market and attract synergistic tenant uses to airport-adjacent land.
The pace of co-location can be hard to predict. There are cases where an airport authority has prepared for business park absorption only to wait years before a new link inserted into the road network completes the “corridor functionality” that a new business entrant requires for an improved base of business operations. Likewise, some airport district plans start to come to fruition only after excess (superior grade) commercial/industrial real estate supplies have been exhausted elsewhere in the city/metro-area.
EDR Group has examined the role of the scale of aircraft operations and access to the airport, drive time, (# of Annual operations ÷ access time) on county-level industry composition (e.g., employment per-capita) for the U.S. In general, business sectors that are known to value air transportation include light manufacturing industries that rely on exporting and importing air cargo, and service industries that rely on employee business travel. The Table C.310 showing instances of significant relationship indicates different business activities place different importance on being close to the scale of air services they require (whether for business travel or air-cargo flows). This identification
10 Alstadt and Weisbrod, The Relationship of Transportation Access and Connectivity to
Local Economic Outcomes: A Statistical Analysis, Transportation Research Board, Annual Conference January 2012.

Caltrans Airport Forecasting Study Appendix
C-12 Cambridge Systematics, Inc.
is not meant to capture key suppliers to the functioning of an airport and fleet of aircraft (aviation support).
Table C.3 Industry Sensitivities to Airport Access-”Quality” ranked on Domestic Airport Sensitivity
NAICS Sector Description
Sensitivity to Access Measure
Scale -0 to 10
511 Publishing Industries (except Internet) 10
541-551 Professional Scientific, Technical, Services 10
561 Administrative & Support Services 10
711-713 Amusement & Recreation 10
512 Motion Picture & Sound Recording 9
230 Construction 7
323 Printing & Related Support Activities 7
531 Real Estate 7
721-722 Accommodations, Eating & Drinking 7
811-812 Repair, Maintenance, & Personal Services 7
813 Religious, Civic, Professional, Organizations 7
920 Government & non NAICs 7
339 Miscellaneous Manufacturing 5
513 Broadcasting 5
514 Internet & data process services 5
524 Insurance Carriers & Related Activities 5
525 Funds, Trusts, & Other Financial Vehicles 5
532 Rental & Leasing Services 5
533 Lessors of Nonfinancial Intangible Assets 5
212-213 Mining & Support Activities 4
325 Chemical Manufacturing 4
331 Primary Metal Manufacturing 4
221 Utilities 3
335 Electric Equipment, Appliances, etc. 3
336 Transportation Equipment 3
337 Furniture & Related Products 3
420 Wholesale Trade 3
441-454 Retail Trade 3
481-487 Transportation 3

Caltrans Airport Forecasting Study Appendix
Cambridge Systematics, Inc. C-13
NAICS Sector Description
Sensitivity to Access Measure
Scale -0 to 10
521-523 Monetary, Financial, & Credit Activity 3
562 Waste Management & Remediation 3
611 Educational Services 3
113 Forestry & Logging 2
313 Textile Mills 2
316 Leather & Allied Products 2
327 Nonmetallic Mineral Products 2
332 Fabricated Metal Products 2
333 Machinery Manufacturing 2
334 Computer & Electronic Products 2
491-493 Mail, package delivery & warehousing 2
111 Crop Production 0
112 Animal Production 0
114 Fishing, Hunting & Trapping 0
115 Support for Agriculture & Forestry 0
211 Oil & Gas Extraction 0
311 Food Products 0
312 Beverage & Tobacco Products 0
314 Textile Product Mills 0
315 Apparel Manufacturing 0
321 Wood Products 0
322 Paper Manufacturing 0
324 Petroleum & Coal Products 0
326 Plastics & Rubber Products 0
621-624 Health Care & Social Services 0
Source: EDR Group, 2012.
An analysis by Appold and Kasarda (2006) of airports as urban anchors for the 25 busiest U.S. airports (an examination of employment composition and dynamics using broad NAICS categorizations from Zip Business Pattern data for 1995 and 2002), identifies that Manufacturing, Wholesale trade, and Transportation & Warehousing activities are 1-to-3-times more concentrated within an airport radius (2.5, 5, and 10-miles) than within the same radius to the central business the airport serves. While this is of interest, it does not conclusively explain the diverse factors (zoning, land availability, traffic conflicts) that may also be at

Caltrans Airport Forecasting Study Appendix
C-14 Cambridge Systematics, Inc.
work in the location decisions of a manufacturer, a distributor, or a transportation logistics firm.
Case studies would be the best approach for trying to “predict” the spatial lure of airport districts to other business types that profess no real need for airport services.
C.5 NATIONAL AIRPORT LAND USE CASE STUDIES The case studies described below include both airports that have been reviewed as part of larger economic impact studies and airports that have been identified through a recent Internet search on land and business activities on or proximate to general aviation airports. These case studies include (when available) information about 1) on-airport and airport area businesses, industries, or activities, 2) the size, tenants, and activities of airport-related or airport-proximate business or industrial parks, and 3) anecdotal information pertaining to business attraction and sitting.
Mesa Falcon Field Airport (Mesa, Arizona)
The City of Mesa’s Falcon Field general aviation airport has been identified as the 5th busiest general aviation airport in the U.S. in 2011, and Falcon Field’s 105 on-airport businesses employ over 1,000 people.11 Businesses that depend on Falcon Fields aviation activities traffic include air charter services, aircraft component suppliers, fueling services, repair, maintenance, and restoration services, flight instruction companies, fixed based operators, hangar sales and leasing centers, and a Commemorative Air Force museum, among others.12 Non aviation dependent airport tenants include several financial, accounting, and real-estate businesses, a software company, an Internet service provider, and an optometry/ophthalmology services center, along with several firms offering office space for lease.13 The surrounding Falcon Field off-airport employment, which is made up of a series of more than 10 industrial parks, employs over 13,000. Tenants include companies in the aerospace/aviation, high-tech, manufacturing and software industries, with Boeing’s Apache Helicopter facility serving as the largest employer.14 The Falcon Field area is promoted by the non-profit Falcon Field Area Alliance, which has described itself as seeking to attract
11 City of Mesa, Arizona. “Falcon Field Employment Center.” 2012.
http://www.mesaaz.gov/economic/FalconField.aspx. (Accessed October 24, 2012).
12 City of Mesa, Arizona. “Falcon Field Business Listings.” 2012. http://apps.mesaaz.gov/falconfield/tenants.aspx. (Accessed October 24, 2012).
13 Ibid.
14 City of Mesa, Arizona. “Falcon Field Employment Center.” 2012. http://www.mesaaz.gov/economic/FalconField.aspx (Accessed October 24, 2012).

Caltrans Airport Forecasting Study Appendix
Cambridge Systematics, Inc. C-15
regional headquarters and financial services businesses to the area in addition to aerospace and aviation-related firms, suggesting a more structured, intentional approach to creating the land use mix surrounding the airport. 15
Skagit Regional Airport (Burlington, Washington)
The Skagit Regional Airport, a general aviation airport, is part of the Port of Skagit, which is described as an economic development engine for Skagit County in northwest Washington. The Port includes the La Conner Marina and the Bayview Business Park along with the airport, and identifies its goal as to “attract manufacturers in different sectors, such as aerospace, agriculture processing and clean tech to complement existing tenants.”16,17 In addition to typical airport tenants such as fixed base operators, restaurants, hangar leasing companies, and repair and maintenance providers, on-airport non-aviation related tenants at Skagit Regional Airport include several construction companies. 18The Port reports that as of spring 2012, the airport, business park, and marina house “76 businesses that employ nearly 1,000 people.”19 Slightly more than half of the businesses in the overall Port are part of the aerospace industry, with the largest tenant being aerospace manufacturer Hexcel Corp.20 Non-aviation-related tenants specific to the business park include Comcast, Seawolf Marine Manufacturing, Olympic Pipeline, Skagit Valley Malting and Brewing, U.S. Mower (industrial, forestry, and roadside mowing equipment), Fiberglass
15 Mike Sunnucks, “New Falcon Field Group Promoting Area Development,” Phoenix
Business Journal, August 29, 2004. http://www.bizjournals.com/phoenix/stories/2004/08/30/story6.html (Accessed October 24, 2011).
16Port of Skagit. “About the Port.” 2012. http://www.portofskagit.com/about-the-port. (Accessed October 24, 2012).
17 Marc Stiles. “Real Estate Buzz: Industrial Market Blooms in Skagit County.”April 26, 2012, Seattle Daily Journal of Commerce. http://www.portofskagit.com/images/uploads/djc_real_estate_buzz_clip.pdf.(Accessed October 24, 2012).
18 Port of Skagit. “Airport Tenants” 2012. http://www.portofskagit.com/skagit-regional-airport/tenants/. (Accessed October 24, 2012.)
19 Marc Stiles. “Real Estate Buzz: Industrial Market Blooms in Skagit County.”April 26, 2012, Seattle Daily Journal of Commerce. http://www.portofskagit.com/images/uploads/djc_real_estate_buzz_clip.pdf.(Accessed October 24, 2012).
20 Ibid.

Caltrans Airport Forecasting Study Appendix
C-16 Cambridge Systematics, Inc.
Supply (reinforced plastics manufacturing), along with a vegetable seeds company and a farms incubator program, among others.21
Chesterfield County Airport (North Chesterfield, Virginia)
The Chesterfield County Airport, a reliever airport for the Richmond International Airport, adjoins the Chesterfield Airport Industrial Park, a 265-acre industrial park for light industry and manufacturing that is home to more than 100 businesses.22,23 Airport dependent businesses include fixed-based operators, onsite flight training companies, charter services, repair services, and restaurants.24,25 Materials, machine and electronics manufacturing comprise a number of the businesses in the industrial park, although packaging and processed food facilities are also represented (for example, as of 2008, Maruchan Virginia, Inc, a ramen and instant-soup manufacturer, was the largest tenant, and moved to expand its existing facilities in 2009).26,27,28 Neighbors to these operations include a wide variety of activities, ranging from sports and dance complexes to technical and engineering services firms to the Chesterfield County Schools food and warehousing operations to Church of Latter Day Saints
21 Port of Skagit. “Current Tenants [Bayview Business Park.]” 2012/
http://www.portofskagit.com/bayview-business-park/current-tenants. (Accessed October 24, 2012.)
22 Chesterfield County Airport. “Chesterfield County Airport – Richmond, Virginia.” 2012. http://flychesterfield.com/ (Accessed October 24, 2012.)
23 Chesterfield Economic Development. “Commercial Property Online Search.” 2012. http://www.chesterfieldbusiness.com/page.asp?id=5 (Accessed October 24, 2012).
24 Chesterfield County Airport. “Chesterfield County Airport – Richmond, Virginia.” 2012. http://flychesterfield.com/ (Accessed October 24, 2012.)
25 Chesterfield County, VA. “Chesterfield County Airport.” 2010. http://www.chesterfield.gov/airport/ (Accessed October 24, 2012).
26 “Chesterfield Airport Industrial Park: Businesses Located in the Chesterfield Airport Industrial Park.” August 25, 2010. https://maps.google.com/maps/ms?ie=UTF8&hl=en&cid=6921540860998839120&hq=&hnear=&msa=0&msid=113081965295176481565.0004830863ae705daf592&ll=37.402523,-77.525899&spn=0.012516,0.015396&t=h&source=embed/ (Accessed October 24, 2012.)
27 Wesley P. Hester. “Industrial Park Expansion: The County Wants to Open Land For Development Around Airport.” March 2, 2008. Richmond Times-Dispatch-Va. “http://www.redorbit.com/news/business/1277537/industrial_park_expansion_the_county_wants_to_open_land_for/(Accessed October 24, 2012.)
28Chesterfield Economic Development. “2009 Investment Announcements.” http://www.chesterfieldbusiness.com/page.asp?id=239&t=2009_Investment_Announcements. (Accessed October 24, 2012.)

Caltrans Airport Forecasting Study Appendix
Cambridge Systematics, Inc. C-17
recovery and animal welfare facilities.29 The president of one tenant, Quantum Silicones, Inc, (a silicone and polymer manufacturing business,) indicated that he found the area’s “location and potential” attractive when making siting decisions, and uses the nearby air service to connect with clients.30
Smyrna/Rutherford County Airport (Smyrna, Tennessee)
The Smyrna/Rutherford County Airport is a reliever airport for the Nashville Area. 31 Airport dependent companies include several fixed base operators and fueling services.32 The airport is adjacent to the 400 acre Smyrna Airport Business Park, a master planned development that offers aviation sites with direct airfield access, corporate headquarter locations, commercial, and industrial sites.33 Both Nissan and Thompson Machinery (heavy construction equipment) rent office space on this site.34 The Smyrna Municipal Golf Course lies on the south side of the airport.
The Nashville Business Journal has reported that as of 2012, the business park is home to more than two dozen businesses but has lacked a corporate powerhouse.35 As part of an effort on the part of the Smyrna/Rutherford County airport authority to secure new tenants and “color the types of firms that set up
29 “Chesterfield Airport Industrial Park: Businesses Located in the Chesterfield Airport
Industrial Park.” August 25, 2010. https://maps.google.com/maps/ms?ie=UTF8&hl=en&cid=6921540860998839120&hq=&hnear=&msa=0&msid=113081965295176481565.0004830863ae705daf592&ll=37.402523,-77.525899&spn=0.012516,0.015396&t=h&source=embed/ (Accessed October 24, 2012.)
30 Wesley P. Hester. “Industrial Park Expansion: The County Wants to Open Land For Development Around Airport.” March 2, 2008. Richmond Times-Dispatch-Va. “http://www.redorbit.com/news/business/1277537/industrial_park_expansion_the_county_wants_to_open_land_for/(Accessed October 24, 2012.)
31 Smyrna/Rutherford County Airport. “About Us.” http://www.smyrnaairport.com/about_us (Accessed October 24, 2012).
32 Smyrna/Rutherford County Airport. “Pilot Info.” http://www.smyrnaairport.com/pilot_info (Accessed October 24, 2012).
33 Smyrna/Rutherford County Airport. “Business Site Opportunities.” http://www.smyrnaairport.com/business_sites (Accessed October 24, 2012).
34 Kevin Litwin. “Smyrna Airport is Tennessee’s Busiest for General Aviation.” April 19, 2012. BusinessClimate.com http://businessclimate.com/murfreesboro-smyrna-la-vergne-tn-economic-development/smyrna-airport-tennessees-busiest-general-avia. (Accessed October 24, 2012).
35 Annie Johnson. “Smyrna Aims to Lure Firms with Solar Field.” February 10, 2012. Nashville Business Journal. http://www.bizjournals.com/nashville/print-edition/2012/02/10/smyrna-firms-with-solar-field.html?page=all (Accessed October 24, 2012).

Caltrans Airport Forecasting Study Appendix
C-18 Cambridge Systematics, Inc.
shop and create jobs in the region,” the Business Park recently became home to a 6-acre, 1 megawatt solar farm through a partnership with the airport authority and Soltas Smyrna, LLC. 36,37 Several airports around the country, including both local airports and larger international facilities, have installed solar arrays on airport property.38 Since the installation of the array, the airport has received a number of inquiries from potential tenants, and Rutherford County’s economic development director noted that, “the installation of a new solar field to the airport continues to position the park and our community as a destination for clients that are pivotal in green technology.”39
Sebring Regional Airport and Commerce (Sebring, Florida)
The Sebring Regional Airport and Commerce Park includes the Sebring Regional general aviation airport as part of a 2,000 acre overall site. This area is shared with the Sebring International Raceway, which leases property from the airport, property owned by the Sebring Utility Commission, existing industrial sites, a “catalyst site” that will focus on health care and science activities, along with acreage planned for future commerce, aviation, and industrial development.40,41
Established aviation and aerospace-related tenants of the airport include Aero-Med/C.J. Systems Aviation Group (aero-medical facility), Carter Aircraft (aircraft maintenance, repair, and painting), Float Planes & Amphibs (sales, repair, and construction of ultra-light sports planes), Lockwood Aviation/Pt Buildings (flight school and engine service center), among others. Non-aviation related tenants include: Everglades Foods, Inc. (seasoning products), Funder America, Inc. (melamine laminate board and other construction products manufacturing), Genpak LLC (Manufacturer of polystyrene products), Globalstar USA, LLC (mobile satellite voice and data services provider), Turf Care Supply Corp. (fertilizer manufacturing plant), Sebring Custom Tanning
36 Ibid.
37 http://www.dnj.com/article/20120429/SPOTLIGHT/304290087/Smyrna-Airport-flying-high-possibilities
38 Annie Johnson. “Smyrna Aims to Lure Firms with Solar Field.” February 10, 2012. Nashville Business Journal. http://www.bizjournals.com/nashville/print-edition/2012/02/10/smyrna-firms-with-solar-field.html?page=all (Accessed October 24, 2012).
39 Ibid.
40 Sebring Regional Airport and Commerce Park. “Sebring Regional Airport and Commerce Park.” http://www.sebring-airport.com/pdf/SRA%20Brochure.pdf (Accessed October 24, 2010).
41 Sharise Cruz. “Sebring Regional Airport’s Plan to Change the Face of Florida.” North America Business Review: U.S. Edition. http://www.businessreviewusa.com/company-reports/sebring-regional-airport. (Accessed October 24, 2010).

Caltrans Airport Forecasting Study Appendix
Cambridge Systematics, Inc. C-19
(tanning of animal hides), Han Cor Inc. (producer of high-density polyethylene plastic drainage pipe), several granite products manufacturers, and several automotive racing schools, among others. 42 An article in Highlands Today (part of Tampa Media Group, which owns the Tampa Tribune) 43, as well as other reports44, describe the proactive work the industrial park’s executive director has done to recruit tenants, but there is limited detail about other factors that may have attracted existing tenants to the site. Various forms of tax credits, refunds, and financing are available in the Highlands County area, in which the airport is located, for economic development purposes.45
Corvallis Municipal Airport (Corvallis, Oregon)
The Corvallis Municipal general aviation Airport is just south of a 220-acre industrial park, which has attracted nearly 20 high-technology, light manufacturing, and services businesses.46 On- airport aviation related tenants include fixed based operators, air medical services, hangar rental companies, and flight schools, among others. Industrial Park tenants include Fed Ex, Oregon Rubber Mills, Western Pulp Products (producer of molded fiber containers),WKL Investments, Viewplus Technologies (Braille printers and learning systems), and
42 Sebring Regional Airport and Commerce Park. “Sebring Regional Airport and
Commerce Park.” http://www.sebring-airport.com/pdf/SRA%20Brochure.pdf (Accessed October 24, 2010).
43 Bill Rettew, Jr. “Sebring’s Airport Business Park Prepares for Growth.” September 21 2008. Highlands Today. http://www2.highlandstoday.com/news/highlands-news/2008/sep/21/la-sebring-airports-business-park-prepares-for-gro-ar-309018/?referer=http://www.google.com/url?sa=t&rct=j&q=airport%20%2B%20business%20parks%20%2B%20general%20aviation&source=web&cd=75&ved=0CDgQFjAEOEY&url=http%3A%2F%2Fwww2.highlandstoday.com%2Far%2F309018%2F&ei=NRB8UP-sNYjW0gHr84CACQ&usg=AFQjCNG6fR0wy5c57Asof0YSZqicv1K5cg&shorturl=http://bit.ly/tT5p7B (Accessed October 24, 2008.)
44“General Aviation Airports: Economic Development Engines for Florida’s Community Development.” March 2006. http://www.sebring-airport.com/docs/draft-final-report-feb-2006.pdf Available From: http://sebring-airport.com/NewsEvents.html. (Accessed October 24, 2012). Pages 20-26.
45 Trade and Industry Development. “Growing, Growing, Growing: Highlands County, Florida.” June 30, 2006. http://www.tradeandindustrydev.com/Region/Florida/growing-growing-growing-highlands-county-florida-3998 (Accessed October 24, 2012).
46 City of Corvallis, Oregon. “Industrial Park.” 2012. http://www.corvallisoregon.gov/index.aspx?page=1058 (Accessed October 24, 2012).

Caltrans Airport Forecasting Study Appendix
C-20 Cambridge Systematics, Inc.
Kattare Internet systems, among others.47 Surveys conducted in support of Oregon’s 2008 Aviation plan reported that the Corvallis Municipal Airport has recreation, local business, tourism, out-of-town business, and agricultural users, and provides mail/cargo service to surrounding communities.48 The Corvallis Airport Industrial Park was made part of the Benton Corvallis Enterprise Zone in 2008; the Enterprise Zone provides tax abatements for new investments that create employment in the area.49
The Corvallis Gazette-Times reported that in October 2012, the Benton County Board of Commissioners voted to rezone the airport industrial park from “urban industrial” to special use zone airport industrial park.50 This means that up to 90,000 square feet of land in the Park can be used for business support services, professional or administrative offices or call centers, and an additional 10,000 square feet can be used for convenience stores, farm stands or restaurants. While the new zoning has been pursued by local economic development authorities to make the property more attractive for development, existing industrial tenants have expressed concern about the zoning change. The president of Oregon Rubber Mills, which has been a tenant of the Park for about 20 years, stated “We have trucks, we have noise, we’re capable of operating 24 hours a day, seven days a week — we have a lot of things that might not mix well with other types of businesses. If you put somebody right next door to us, we could have a problem.” A representative of Western Pulp Products stated that making the park available to non-industrial activities could make it more difficult for companies like Western Pulp Products to operate, expand, or sell their businesses.51
47 Coffman Associates. Corvallis Municipal Airport: Airport Master Plan (Draft Final Report).
Chapter 1: Inventory. http://airportstudy.com/media/corvallis/cvo_mp/Ch1%208-2012.pdf (Accessed October 24, 2012). Exhibit 1L.
48 Mead and Hunt, in cooperation with Economic Development Research Group. 2007 Oregon System Plan. “Corvallis Municipal Airport – Individual Airport Report.” Prepared for the Oregon Department of Aviation. February 2008. “http://www.oregon.gov/aviation/docs/system_plan/airport_reports/corvallis_municipal.pdf, Page 25. (Accessed October 24, 2012).
49 Corvallis Benton Chamber Coalition. “The Corvallis Airport Industrial Park.” 2010. http://corvallis.snappages.com/airport-industrial-park.htm (Accessed October 24, 2012).
50 Bennett Hall. “Airport Industrial Park Rezoned.” October 17, 2012. Corvallis Gazette-Times. http://www.gazettetimes.com/news/local/airport-industrial-park-rezoned/article_708de424-17f3-11e2-9dff-001a4bcf887a.html. (Accessed October 24, 2012).
51 Ibid.

Caltrans Airport Forecasting Study Appendix
Cambridge Systematics, Inc. C-21
Donaldson Center/SCTAC (Greenville, South Carolina)
The Donaldson Center general aviation airport is proximate to Greenville, South Carolina (as is the Greenville Downtown general aviation airport and the Greenville-Spartanburg International Airport.) The Donaldson Center general aviation airport lies six miles south of Greenville and is a part of the SC Technology and Aviation Center (SC-TAC), a 2600 acre “progressive business airport and advanced park.” 52, 53 Over 80 companies are located within the Center. SC-TAC reports that the largest categories of industries represented at the park are manufacturing and engineering services, with prominent private-owned employers including Lockheed Martin, Stevens Aviation, 3M, Cytec Carbon fibers and Ethox Chemicals. SC-TAC provided the following employment breakdown (by industry) for 2010:54
“34 percent Aviation-related activities;
31 percent Manufacturing-related activities;
22 percent Trade businesses; and
13 percent others, including 50 diverse categories ranging from biotech research and development, to pharmaceutical development and professional consulting”
An economic impact study completed for Donaldson Airport reports “The airport is a vital component of the Donaldson Center Industrial Air Park [prior to the creation of the SC-TAC] whose tenants, including Lockheed Martin, Michelin, 3-M and many others, depend on the airport to transport people, goods and parts.” 55
52 South Carolina Technology and Aviation Center. “Your Runway to the World Takes
Off Here.” 2012. http://www.sc-tac.com/location.aspx (Accessed October 24, 2012).
53 South Carolina Technology and Aviation Center. “A Quick Snapshot of SCTAC.” 2012. http://sc-tac.com/quick-facts.aspx (Accessed October 24, 2012).
54 South Carolina Technology and Aviation Center. Economic Impact Analysis Concludes SCTAC Industries Contribute 1.4 Billion to Local and State Economy in 2010.” 2011 ““http://www.sc-tac.com/page1881224.aspx (Accessed October 24, 2012).
55 Wilbur Smith Associates for the South Carolina Department of Commerce. The Economic Impact of Donaldson Center Airport. 2006. http://www.scaeronautics.com/systemplan/images/EconomicImpactRptsPdf%5CEIR_GYH.pdf. (Accessed October 24, 2012). Page 3.

Caltrans Airport Forecasting Study Appendix
C-22 Cambridge Systematics, Inc.
Terrell Municipal Airport (Terrell, Texas)
This general aviation airport, which is owned by the City of Terrell, is adjacent to the Airport Business Park. 56Tenants at the Airport Business Park include an Autozone Distribution Center, and Madix, Inc, a manufacturer of store fixtures and shop fittings.57 Madix, Inc. houses its corporate headquarters as well as manufacturing facilities at this location. Maine’s Paper and Food Service, Inc. recently established a distribution center at the Airport Business Park, and according to Maine’s President and CEO, “Terrell was the perfect location for the new distribution center, with a strategic distribution site, a strong workforce and city incentives.” 58 (The center will serve 196 restaurants throughout Texas, Arkansas, Louisiana, Missouri and Oklahoma.)59The Terrell Economic Development Corporation identifies its 4,500 acre tax increment financing district, which includes the Airport Business Park, as “the single largest Rural TIF in Texas” and “one of the most aggressive in the State of Texas,” which includes support from Urban Development Action Grants, Industrial Revenue Bonds, Texas Capital Fund, Enterprise Zone, and the Skills Development Fund for Job Training.60
56 Terrell Municipal Airport. “Welcome to Terrell Municipal Airport.”
http://www.terrellairport.com/index.htm (Accessed October 24, 2012).
57 Terrell Economic Development Corporation. “Airport Business Park.” http://www.terrelltexasedc.com/TEDC_Airport.pdf (Accessed October 24, 2012).
58 PR Newswire. “Maine’s Paper and & Food Service, Inc. to Hire 100 Employees for New Terrell Location.” October 21, 2011. http://www.prnewswire.com/news-releases/maines-paper-food-service-inc-to-hire-100-employees-for-new-terrell-location-132267408.html (Accessed October 24, 2012).
59 Candace Carlisle, “NY-based Maine’s to open a North Texas distribution center, hire up to 400.” September 29, 2011. Dallas Business Journal, http://www.bizjournals.com/dallas/news/2011/09/29/new-york-based-maines-to-open-a.html?ana=RSS&s=article_search&utm_source=feedburner&utm_medium=feed&utm_campaign=Feed%3A+industry_20+%28Industry+Commercial+Real+Estate%29. (Accessed October 24, 2012).
60 Terrell Municipal Airport. “Taking Business to New Heights!” 2012. http://www.terrellairport.com/pdf/Airport-brochure.pdf. (Accessed October 24, 2012). Page 5.

Caltrans Airport Forecasting Study Appendix
Cambridge Systematics, Inc. D-1
D. Case Study Interview Guide
D.1 INTERVIEW GUIDE
Background Information
1. Airport Name
2. Airport Manager
a. Name
b. Title
c. Contact information
Interview
Your participation in this interview will last from 15 to 45 minutes, depending on the complexity of activities at the airport.
Industries around the Airport
1. What is the current range of public and private aviation uses on the airport (e.g., recreational, business, cargo, crop dusting, firefighting? Try to inquire exact industries and companies and provide examples. We would like stories here.
2. What industries are located on your airport, including seasonal activities, and whether there is direct use of aircraft facilities. Check off uses on List 1. If there are industries not included on the list, please explain.
3. What industries are located near your airport? Check off uses on List 1. If there are industries not included on the list, please add the type and explain what they do.
4. Who are the businesses that have based aircraft at the airport? Start with any information that we obtained from web search.
5. Are there businesses that regularly use the airport that are not based there? E.g., corporate aircraft bringing staff to area businesses; UPS/FedEx (ground and air freight forwarders)/AmeriFlight; seasonal charters, occasional diverted flights from nearby airports that might experience poor weather conditions, etc.

Caltrans Airport Forecasting Study Appendix
D-2 Cambridge Systematics, Inc.
Table D.1 Examples of Airport-Proximate Industries/Activities
Industries/Activities Located in Proximity to Airports
Dependent Reliant Not Dependent or Reliant
Air charter services
Flight instruction companies
Fixed-based operators
Hangar sales and leasing centers
Aerospace manufacturing
Car rentals
Taxi service
Mail/cargo freight forwarders (e.g., FedEx)
Aircraft component suppliers fueling services
Repair, maintenance, and restoration services
Aviation museums
Passenger transportation (scheduled and non-scheduled)
Hotels and motels
Couriers
Food service
Retail and restaurants
Other ground transportation to/from airport
Fuel vendors
Airport support activities
Parking lots and garages
Investment firms
Printer manufacturing
Phone/Internet service providers
Engineering consultants
Pharmaceutical companies
Business administration
Corporate headquarters
High-tech industries
Financial, accounting and engineering services
Real estate services
Electronics manufacturing
Silicone/polymer manufacturing
Corporate offices
Merchant wholesalers
Ambulatory health care services
Machinery manufacturing and maintenance
Electrical equipment and appliance manufacturing
Truck transportation
Computer and electronic product manufacturing
Telecommunications
Publishing industries (except Internet)
Internet service providers
Data processing
Agricultural operations
Construction companies
Brewing companies
Plastics manufacturing
Construction products manufacturing
Automotive racing schools
Fertilizer manufacturing
Tanning
Rubber mill
Fiber container production
Packaging manufacturing
Processed food manufacturing
Sports complexes
Public school warehouse and food service facilities
Solar arrays
Golf courses

Caltrans Airport Forecasting Study Appendix
Cambridge Systematics, Inc. D-3
6. Have non-aviation businesses located on or near the airport? Do you know why they decided to locate here? Was the airport a factor in their decision? If none, skip to next question.
Prompts: Try to find out about whether it is because there are an availability of utilities, the location is proximate to freeway connections, whether it is due to lack of NIMBYism, whether there are transit connections, or perhaps there is available land for development? Check off the following “reasons” why non-aviation dependent uses locate there and explain.
Table D.2 Why Non-Aviation Businesses Locate at the Airport
Business Name
and/or Type Reasons to Locate
at Airport
Amount of land available for non-aviation uses
Availability of parking (e.g., lots, garages, park-n-ride)
Cost of property
Compatibility of surrounding land uses
Proximity to existing communities
Availability of utilities/infrastructure
Proximity to highways and freeways
Existing transit connections
Lack of environmental constraints (e.g., noise, safety)
Other:
7. Have there been any proposals or interest in a business/industrial park around your airports? Do you think this is realistic? Why or why not?
8. What kind of businesses would you like to attract in the future? Do you have a strategy for doing so?
9. What kind of future do you see for your airport in 25 years time?
Development Potential
10. Is there an airport specific business plan currently in use? If so, what year was it developed? What successes came of it?
11. Is there an airport specific marketing plan currently in use? If so, what year was it developed? What successes came of it?
12. What is the availability or likelihood for you to leverage (Federal, state or local) funding to provide complementary infrastructure to attract businesses?

Caltrans Airport Forecasting Study Appendix
D-4 Cambridge Systematics, Inc.
13. Do you work with your economic development agency to promote business development?
14. [ONLY AT RELEVANT AIRPORTS] What is the potential for scheduled passenger service? What about for freight services? Other?

Caltrans Airport Forecasting Study Appendix
Cambridge Systematics, Inc. E-1
E. Methodologies for Estimating Economic Potential of Role 1 and Role 2 Airports
E.1 ROLE 1: POTENTIAL PRODUCTIVITY IMPACTS GENERATED BY SMART GROWTH POLICIES
Background
The relationship between economic density and productivity is widely known61, with research tracing back well over a century. Fundamentally, increasing the scale and density of economic activity increases the size of markets, reduces shared costs, facilitates knowledge spillovers, and stimulates innovation—all of which can lead to increased productivity and growth. Yet, behind these broad outcomes lie a range of specific mechanisms that operate across a range of spatial and industrial scales.
With respect to the GA and small commercial airports in consideration in the present study, two distinct types of agglomeration are of particular importance. The first recognizes the airport as a transportation hub. Airports can provide rapid access to nearby and distant cities in California and other states. Distances enabled by connectivity provided by airports depend on sizes of runways, types of aircraft used and, for commercial service, the connectivity to hub airports. The second simply recognizes the airport as a locus of economic activity—a sub-metropolitan agglomeration of firms that, through co-location, can enjoy greater efficiency and productivity than if the firms were arranged in a more dispersed spatial arrangement.
It is important to emphasize that while these two categories can be (and indeed, will be) measured distinctly—the second is fundamentally related to the first through the processes of agglomeration (i.e., positive spatial feedback). This is best illustrated by an example. Assume that two firms (a warehouse and a small corporate headquarters) are attracted to an airport as a transportation asset. They may develop or expand warehousing and office space to specifically take advantage of the airport (for freight shipment and passenger travel,
61See Weisbrod et al., 2012, http://www.edrgroup.com/pdf/Alstadt-Weisbrod-
Market%20Access-TRB-2012.pdf.

Caltrans Airport Forecasting Study Appendix
E-2 Cambridge Systematics, Inc.
respectively). Once these firms are there, other firms may subsequently be attracted to the site in order to be near the first two firms (for example, a trucking company or a sandwich shop). Note that this secondary attraction is not directly related to the airport itself, but might not exist were it not for the presence of the airport. Finally, the two initially airport-dependent firms may move or go out of business, and the buildings may become re-occupied by firms that have no interest in the airport at all, but are instead attracted by the clustered activity (including the trucking firm and sandwich shop). Again, the specific firms may not be directly related to the airport, but the airport remains a strong residual influencer of the agglomeration process.
In what follows below, for each airport, we attempt to identify how increasing airport density yields productivity in two distinct ways. The first is the additional productivity enjoyed by firms from being proximate to the airport as a transportation asset. The second is the additional productivity enjoyed by firms from being part of clustered economic activity.
Methodology
Our general approach is summarized in the following steps:
1. For each airport presented in the case studies (Section 5), estimate gross employment changes by two-digit NAICS sector resulting from smart growth policy;
2. Estimate net employment changes for the State of California;
3. Use TREDIS to estimate net productivity change from the change in airport access; and
4. Develop and apply statistical relationships to determine productivity effects from increased employment density at zip-code level.
Determine Gross Employment Change in Airport Zip Codes
For both impact types discussed above, a common starting point was to determine the gross change in employment that could be expected from applying smart growth policies to the four airports discussed in Section XX. As outlined there, smart growth policies could be expected to increase the floor-area-ratio (FAR) for different land uses that conform to general zoning guidelines – which in turn would accommodate more employment. These results are summarized in Table E.1.

Caltrans Airport Forecasting Study Appendix
Cambridge Systematics, Inc. E-3
Table E.1 Summary of Estimated Employment Change by Land Use
Land Use Buchanan Santa Monica Fresno Gillespie
Light Industrial 1,796 5,615 6,360 1,520
Warehousing 412 1,551 1,000 10
Office 7,430 0 6,800 7,301
Retail 573 0 0 0
Total 10,211 7,166 14,160 8,831
Note: Sources are discussed in Part 3 of this technical memorandum and in Section 5.1. The sources include ESRI, the National Association for Industrial and Office Properties, Google Maps, observations from site visits and interviews first with airport managers and subsequently with local economic development officials
The next step in determining the economic consequences of these land use changes is to estimate which NIACS industries would likely utilize the four different land uses. These breakouts are summarized in Table E.2. For the “Retail” land use, employment is assumed to be split evenly between “pure” retail sector (e.g., drug stores) and restaurants (the accommodations and food services sector). For the “Office” land use, employment mix is estimated based on observed mix among sectors 53 to 56 for all U.S. zip codes containing a GA or Reliever airport.62 For the “Light Industrial” land use, employment mix is based on work conducted for SCAG.63 Applying these splits to the employment changes in Table E.2 yields potential gross changes in employment by NAICS sector—as shown in Table E.3.
62 The source of this data comes from a database from being developed as part of an
ACRP project currently in progress (Landau, et. al., ACRP 03-28). 63 Employment Density Study, prepared for Southern California Association of
Governments by The Natelson Company, Inc., October 2001.

Caltrans Airport Forecasting Study Appendix
E-4 Cambridge Systematics, Inc.
Table E.2 Estimated Employment Mix by 2-digit NAICS Category for Each Land Use
NAICS Sector
Land Use Type
Light Industrial
Warehousing Office Retail
11 Agriculture, Forestry, Fishing and Hunting
21 Mining Quarrying and Oil and Gas Extraction
22 Utilities
23 Construction 22%
31-33 Manufacturing 39%
42 Wholesale Trade 20%
44-45 Retail Trade 2% 50%
48-49 Transportation and Warehousing 2% 100%
51 Information
52 Finance and Insurance
53 Real Estate and Rental and Leasing 11%
54 Professional, Scientific, and Technical Services 38%
55 Management of Companies and Enterprises 12%
56 Administrative and Support and Waste Management and Remediation Services 5% 39%
61 Educational Services
62 Health Care and Social Assistance
71 Arts, Entertainment, and Recreation
72 Accommodation and Food Services 2% 50%
81 Other Services (except Public Administration)
92 Public Administration 2%
Total 100% 100% 100% 100%
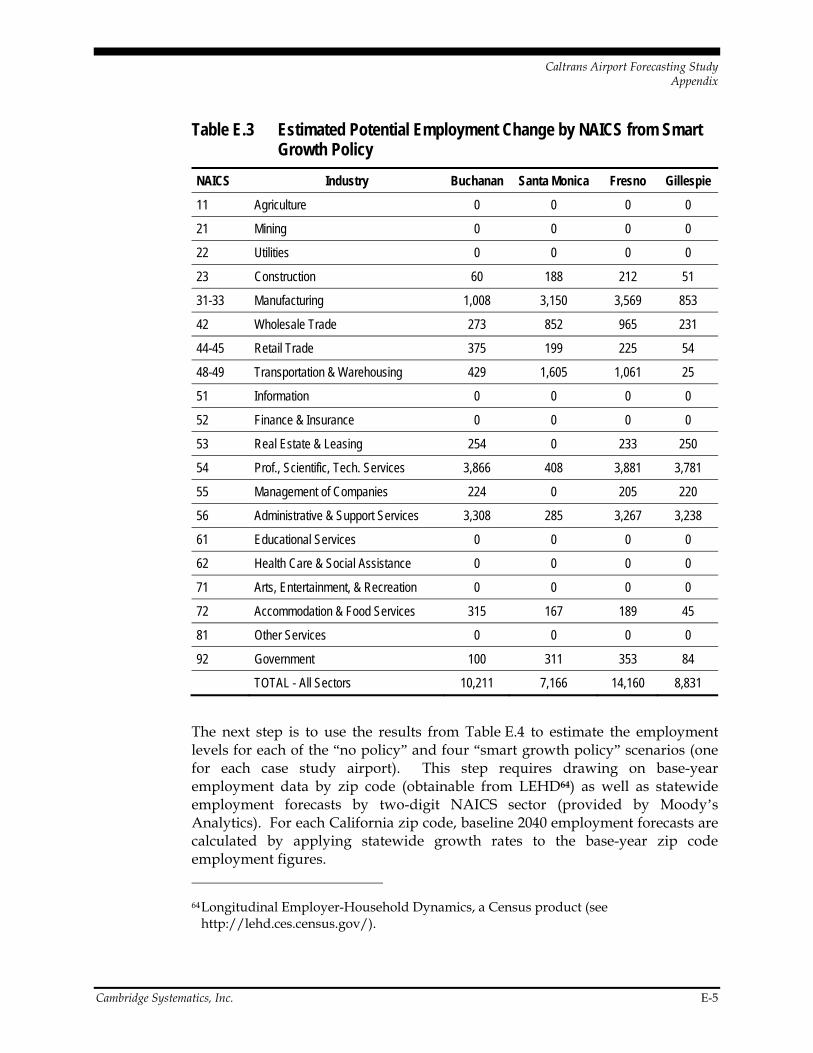
Caltrans Airport Forecasting Study Appendix
Cambridge Systematics, Inc. E-5
Table E.3 Estimated Potential Employment Change by NAICS from Smart Growth Policy
NAICS Industry Buchanan Santa Monica Fresno Gillespie
11 Agriculture 0 0 0 0
21 Mining 0 0 0 0
22 Utilities 0 0 0 0
23 Construction 60 188 212 51
31-33 Manufacturing 1,008 3,150 3,569 853
42 Wholesale Trade 273 852 965 231
44-45 Retail Trade 375 199 225 54
48-49 Transportation & Warehousing 429 1,605 1,061 25
51 Information 0 0 0 0
52 Finance & Insurance 0 0 0 0
53 Real Estate & Leasing 254 0 233 250
54 Prof., Scientific, Tech. Services 3,866 408 3,881 3,781
55 Management of Companies 224 0 205 220
56 Administrative & Support Services 3,308 285 3,267 3,238
61 Educational Services 0 0 0 0
62 Health Care & Social Assistance 0 0 0 0
71 Arts, Entertainment, & Recreation 0 0 0 0
72 Accommodation & Food Services 315 167 189 45
81 Other Services 0 0 0 0
92 Government 100 311 353 84
TOTAL - All Sectors 10,211 7,166 14,160 8,831
The next step is to use the results from Table E.4 to estimate the employment levels for each of the “no policy” and four “smart growth policy” scenarios (one for each case study airport). This step requires drawing on base-year employment data by zip code (obtainable from LEHD64) as well as statewide employment forecasts by two-digit NAICS sector (provided by Moody’s Analytics). For each California zip code, baseline 2040 employment forecasts are calculated by applying statewide growth rates to the base-year zip code employment figures.
64 Longitudinal Employer-Household Dynamics, a Census product (see
http://lehd.ces.census.gov/).

Caltrans Airport Forecasting Study Appendix
E-6 Cambridge Systematics, Inc.
Next, the increased employment shown in Table E.4 is added (separately) to each of the four airport zip codes (Table E.4). To determine the net effect of the land use change, we assume that direct effect of the smart growth policy would be limited to employment redistribution. That is, for all scenarios, total California employment (by NAICS code) is held constant.
All four airports share the same baseline spatial distribution, and the smart growth scenario for each airport has the effect of increasing employment within the airport zip code (according to Table E.4), while drawing from other California zip codes so that total California employment matched the baseline scenario. For simplicity, employment is assumed to be drawn proportional to 2011 levels. That is, if a (non-airport) zip code contained 0.5 percent of statewide retail employment in 2011, then 0.5 percent of the retail employment attracted to the airport smart growth area is assumed to be drawn from that zip code in 2040.
It should be noted that this “zero-sum” assumption is made in order to isolate the pure productivity gains associated with increased density near airports. In reality, the economy is not constrained to “zero-sum” growth. This fact is captured by the multiplier analysis (discussed below). That is, even though the direct effect of the smart growth policy is assumed to only change the location of employment (and not its statewide levels), the increased productivity from the new arrangement leads to increased productivity, which stimulates secondary (indirect and induced) effects that ultimately increase statewide employment levels (along with income and Gross State Product—GSP).
Furthermore, it should be noted that the choice of California as the control area is somewhat arbitrary. In reality, many sectors likely to be attracted to airports (notably Professional, Scientific, Technical Services and Management of Companies and Enterprises) are national in scale, such that individual firms attracted to the airport may come from large cities outside the state.
Table E.4 Employment Scenarios for Four Case Study Airport Zip Codes
Measure Buchanan
(94520)
Santa Monica (90405)
Fresno (93727)
Gillespie (92020
2011 Baseline Employment Levels 39,161 16,250 19,737 28,047
2040 Baseline Employment Levels 51,228 20,852 23,671 32,149
2040 Smart Growth Employment Levels 61,439 28,018 37,831 40,980
2040 Smart Growth Employment Impact 10,211 7,166 14,160 8,831
Predict Airport Access Impacts
The previous section outlined how implementing airport-specific smart growth policies may change the general pattern of employment location in the state. This section looks at how this change in access to airports translates to economic

Caltrans Airport Forecasting Study Appendix
Cambridge Systematics, Inc. E-7
productivity—independent of density effects (which are discussed in the next section).
The TREDIS Market Access model was used to estimate these impacts. This module estimates economic impacts from changes in transportation access and connectivity. One of the specific access variables used in the model calibration is “average access time to domestic airport,” which is defined as “average ground access time to the nearest commercial airport with scheduled operations, weighted by the scale of airport activity (takeoffs + landings).” 65 Based on the predicted change in employment location in the previous section, we are able to determine the net change in airport access—which has been calculated for each airport. However, the resulting access changes are quite small because 1) there are many airports throughout the state, 2) employment tends to be located in urban areas near hub airports (though generally not located as close to the hubs as the prospective smart growth areas adjacent to these four airports), and 3) the four airports in question are of moderate size.
As a result, the TREDIS model predicted net effects from employment relocation to be universally less than $500,000 in 2040 Gross State Product (for all airports). Because of the small order of magnitude of these results (and in contrast to the significant impacts from “pure” economic density, discussed in the next section), these effects – though positive – are not “significant”. As such, the final results presented in Section 5.1 do not include airport accessibility effects and reflect impacts from agglomeration.
Predict Airport Density Impacts
As discussed in the introduction, although the productivity impacts from airport access may be small, airports can still have a large residual impact on the process of industrial clustering. This section presents the methodology used to estimate this density effect. The overall approach used was to develop and apply statistical relationships between sector-specific employment density and income at the zip code level.
The model used to calibrate the effect is based entirely on 2011 California zip code data: two-digit NAICS employment data compiled from LEHD, average zip code income compiled from County Business Patterns, and zip code land area compiled from Census TIGER files. This yields a raw dataset of roughly 1,500 California zip codes. For each zip code, we calculate sector-specific employment density values (e.g., retail jobs per square mile), and form a series of log-linear regressions with total zip code income. Figure E.1 shows the results in terms of California’s average income elasticity with respect to each industry’s
65 Weisbrod et al., 2012, page 6 [http://www.edrgroup.com/pdf/Alstadt-Weisbrod-
Market%20Access-TRB-2012.pdf].

Caltrans Airport Forecasting Study Appendix
E-8 Cambridge Systematics, Inc.
employment density66 (for those industries affected by the smart growth policy). Based on this analysis, elasticities range from roughly 0.4 to 0.6.
Figure E.1 California Average Income Elasticity with Respect to Sector-Specific Employment Density Jobs per Square Mile
For comparison, Figure E.2 shows the regression lines for Retail Trade (left) and Professional, Scientific, Technical Services (right)—the least and most sensitive, respectively. Each graph shows the distribution of zip codes in terms of sector-specific employment density (the horizontal axis) and average annual wage income per worker (the vertical axis). Each point on the charts represents a single zip code, and the line indicates the best log-linear fit. These figures emphasize that employment density for Professional, Scientific, & Technical Services has stronger leverage on personal income than Retail employment density.
66 An elasticity predicts the percent change in one variable from the percent change in
another. In the current analysis, each elasticity predicts the percent change in zip code average wage income based on a 1 percent change in sector-specific employment density (jobs per square mile).

Caltrans Airport Forecasting Study Appendix
Cambridge Systematics, Inc. E-9
Figure E.2 Comparison of Regression Results for Retail vs. Professional, Scientific, Technical Services
Next, the results of the zip code-level regressions are applied to the “baseline” and “smart growth” employment scenarios described above (Figure E.2) to determine the expected change in income for each zip code in California. The net income growth associated with these changes is summarized in Table E.5.
Table E.5 Summary of Employment Density Changes by Airport and Resulting Income Growth
Buchanan Santa Monica Fresno Gillespie
Zip Code 94520 90405 93727 92020
Zip Code Land Area (sq. mi.) 14.0 2.2 27.2 9.3
2011 Employment Density 2,796 7,247 727 3,027
2040 Baseline Employment Density 3,657 9,299 871 3,470
2040 Smart Growth Employment Density 4,386 12,495 1,393 4,423
California Direct Income Growth from Densification (mil.) $38.3 $23.9 $58.3 $28.3
Apply Multiplier Impacts
The final step in estimating the total economic impacts from smart growth policies is to calculate the secondary “multiplier” impacts resulting from the initial productivity gain. Multiplier impacts arise due to the increased output and income associated with the initial productivity gain. Those businesses that enjoy greater worker productivity end up purchasing more intermediate goods and services in the statewide economy. Further, the income gains bolster local economies through increased demand for consumer goods such as groceries and household services. Multiplier impacts, in this case, were calculated with a 2011 IMPLAN model of California. Total economic impacts (including direct and multiplier effects) from the smart growth policies are shown in Table E.6.
y = 32708x0.0428
R² = 0.1187
0
20,000
40,000
60,000
80,000
100,000
120,000
140,000
160,000
180,000
0 0 0 1 10 100 1,000 10,000 100,000
Average
Wage Income
Retail Emplyment per Square Mile (logorithmic scale)
y = 32796x0.0586
R² = 0.2541
0
20,000
40,000
60,000
80,000
100,000
120,000
140,000
160,000
180,000
0 0 0 1 10 100 1,000 10,000 100,000 1,000,000
Average
Wage Income
Prof., Scientific, Tech. Services Emplyment per Square Mile (logorithmic scale)

Caltrans Airport Forecasting Study Appendix
E-10 Cambridge Systematics, Inc.
Table E.6 Total Economic Impacts to California (2040)
Airport Employment Output
(Million Dollars) Value Added
(Million Dollars) Income
(Million Dollars)
Buchanan 1,225 $242.94 $151.90 $104.61
Santa Monica 855 $294.49 $130.48 $78.22
Fresno 2,009 $584.68 $285.58 $178.75
Gillespie 921 $211.00 $121.26 $80.04
Here, it is important to emphasize that the increased economic efficiency has the ultimate effect of increasing statewide employment (along with income and Gross State Product—GSP), even though the direct employment impacts of the smart growth policy are analytically constrained to be zero at the state level, through multiplier effects.
Detailed Results
In the following tables, the “direct” impact to California is based on the predicted net change in statewide income from the 1) increased employment density at each airport location, and 2) the relationships between zip code income and sector-specific employment density. The direct income change is converted to Value added and Output based on 2011 ratios, and multiplier impacts are estimated based on the resulting change in output67. Note that the direct employment effect is zero due to the assumption that the increased employment density at the four airport locations would be accounted for from other parts of the state, but that multiplier impacts include positive employment impacts.
67 Source: 2011 IMPLAN model of the state of California.

Caltrans Airport Forecasting Study Appendix
Cambridge Systematics, Inc. E-11
Table E.7 Economic Impacts to California from Buchanan Airport, by Sector
NAICS Sector Employment Output ($mil)
Value Added
($mil)
Income
($mil) Employment Output ($mil)
Value Added
($mil)
Income
($mil) Employment Output ($mil)
Value Added
($mil)
Income
($mil)
11 Agriculture 0 0.00 0.00 0.00 6 0.90 0.44 0.33 6 0.90 0.44 0.33
21 Mining 0 0.00 0.00 0.00 2 0.73 0.40 0.12 2 0.73 0.40 0.12
22 Utilities 0 0.00 0.00 0.00 1 1.35 0.65 0.21 1 1.35 0.65 0.21
23 Construction 0 0.46 0.28 0.24 11 1.45 0.86 0.76 11 1.91 1.14 1.00
31‐33 Manufacturing 0 14.61 4.41 2.08 43 26.67 8.05 3.81 43 41.28 12.46 5.89
42 Wholesale Trade 0 1.47 1.08 0.62 25 4.54 3.34 1.93 25 6.01 4.43 2.55
44‐45 Retail Trade 0 2.59 1.94 1.24 91 7.14 5.34 3.40 91 9.74 7.28 4.64
48‐49 Transportation & Warehousing 0 1.65 0.90 0.71 34 4.58 2.50 1.97 34 6.23 3.40 2.68
51 Information 0 0.00 0.00 0.00 14 5.46 3.22 1.79 14 5.46 3.22 1.79
52 Finance & Insurance 0 0.00 0.00 0.00 39 9.24 5.28 2.72 39 9.24 5.28 2.72
53 Real Estate & Leasing 0 7.25 5.54 0.83 68 13.18 10.07 1.51 68 20.43 15.61 2.34
54 Prof., Scientific, Tech. Services 0 29.13 21.23 17.24 253 36.43 26.55 21.56 253 65.55 47.78 38.80
55 Management of Companies 0 1.31 0.82 0.71 14 2.82 1.76 1.53 14 4.12 2.57 2.23
56 Administrative & Support Services 0 23.90 16.36 13.83 428 28.23 19.32 16.34 428 52.14 35.68 30.17
61 Educational Services 0 0.00 0.00 0.00 12 0.82 0.54 0.48 12 0.82 0.54 0.48
62 Health Care & Social Assistance 0 0.00 0.00 0.00 56 5.73 3.85 3.38 56 5.73 3.85 3.38
71 Arts, Entertainment, & Recreation 0 0.00 0.00 0.00 13 1.12 0.76 0.48 13 1.12 0.76 0.48
72 Accommodation & Food Services 0 1.92 1.11 0.75 75 5.02 2.91 1.96 75 6.94 4.02 2.71
81 Other Services 0 0.00 0.00 0.00 32 2.42 1.61 1.41 32 2.42 1.61 1.41
92 Government 0 0.09 0.08 0.07 7 0.73 0.71 0.61 7 0.82 0.79 0.68
Total 0.00 84.39 53.75 38.33 1,225 158.56 98.15 66.28 1,225 242.94 151.90 104.61
Total Impacts to CaliforniaDirect Impacts to California Multiplier Effects to California

Caltrans Airport Forecasting Study Appendix
E-12 Cambridge Systematics, Inc.
Table E.8 Economic Impacts to California from Santa Monica Airport, by Sector
NAICS Sector Employment Output ($mil)
Value Added
($mil)
Income
($mil) Employment Output ($mil)
Value Added
($mil)
Income
($mil) Employment Output ($mil)
Value Added
($mil)
Income
($mil)
11 Agriculture 0 0.00 0.00 0.00 16 2.22 1.08 0.82 16 2.22 1.08 0.82
21 Mining 0 0.00 0.00 0.00 5 2.05 1.11 0.34 5 2.05 1.11 0.34
22 Utilities 0 0.00 0.00 0.00 2 1.78 0.85 0.28 2 1.78 0.85 0.28
23 Construction 0 1.42 0.84 0.74 20 2.61 1.55 1.36 20 4.02 2.39 2.10
31‐33 Manufacturing 0 74.97 22.64 10.70 157 98.58 29.76 14.07 157 173.54 52.40 24.76
42 Wholesale Trade 0 6.99 5.15 2.97 67 12.23 9.01 5.19 67 19.23 14.16 8.16
44‐45 Retail Trade 0 1.02 0.76 0.49 63 4.93 3.69 2.35 63 5.95 4.45 2.83
48‐49 Transportation & Warehousing 0 10.65 5.82 4.59 113 15.21 8.30 6.55 113 25.86 14.12 11.14
51 Information 0 0.00 0.00 0.00 13 5.06 2.98 1.66 13 5.06 2.98 1.66
52 Finance & Insurance 0 0.00 0.00 0.00 33 7.68 4.39 2.26 33 7.68 4.39 2.26
53 Real Estate & Leasing 0 0.00 0.00 0.00 26 5.03 3.84 0.58 26 5.03 3.84 0.58
54 Prof., Scientific, Tech. Services 0 4.59 3.34 2.71 85 12.23 8.91 7.24 85 16.82 12.26 9.95
55 Management of Companies 0 0.00 0.00 0.00 16 3.39 2.11 1.83 16 3.39 2.11 1.83
56 Administrative & Support Services 0 1.34 0.92 0.77 71 4.71 3.22 2.73 71 6.05 4.14 3.50
61 Educational Services 0 0.00 0.00 0.00 10 0.67 0.44 0.39 10 0.67 0.44 0.39
62 Health Care & Social Assistance 0 0.00 0.00 0.00 46 4.69 3.15 2.77 46 4.69 3.15 2.77
71 Arts, Entertainment, & Recreation 0 0.00 0.00 0.00 10 0.87 0.59 0.37 10 0.87 0.59 0.37
72 Accommodation & Food Services 0 2.18 1.26 0.85 68 4.54 2.63 1.77 68 6.72 3.89 2.62
81 Other Services 0 0.00 0.00 0.00 28 2.12 1.40 1.23 28 2.12 1.40 1.23
92 Government 0 0.07 0.07 0.06 6 0.68 0.66 0.57 6 0.75 0.72 0.62
Total 0 103.22 40.79 23.87 855 191.27 89.69 54.34 855 294.49 130.48 78.22
Direct Impacts to California Multiplier Effects to California Total Impacts to California

Caltrans Airport Forecasting Study Appendix
Cambridge Systematics, Inc. E-13
Table E.9 Economic Impacts to California from Fresno Airport, by Sector
NAICS Sector Employment Output ($mil)
Value Added
($mil)
Income
($mil) Employment Output ($mil)
Value Added
($mil)
Income
($mil) Employment Output ($mil)
Value Added
($mil)
Income
($mil)
11 Agriculture 0 0.00 0.00 0.00 27 3.86 1.88 1.43 27 3.86 1.88 1.43
21 Mining 0 0.00 0.00 0.00 8 3.51 1.90 0.58 8 3.51 1.90 0.58
22 Utilities 0 0.00 0.00 0.00 4 3.44 1.64 0.54 4 3.44 1.64 0.54
23 Construction 0 1.83 1.08 0.95 33 4.18 2.48 2.18 33 6.01 3.56 3.13
31‐33 Manufacturing 0 123.13 37.18 17.57 264 165.28 49.91 23.59 264 288.41 87.08 41.16
42 Wholesale Trade 0 7.87 5.79 3.34 96 17.47 12.87 7.41 96 25.34 18.66 10.75
44‐45 Retail Trade 0 1.01 0.75 0.48 121 9.49 7.09 4.52 121 10.49 7.85 4.99
48‐49 Transportation & Warehousing 0 12.60 6.88 5.43 153 20.66 11.28 8.90 153 33.27 18.16 14.33
51 Information 0 0.00 0.00 0.00 28 10.92 6.44 3.58 28 10.92 6.44 3.58
52 Finance & Insurance 0 0.00 0.00 0.00 72 17.04 9.75 5.02 72 17.04 9.75 5.02
53 Real Estate & Leasing 0 7.11 5.43 0.82 94 18.08 13.82 2.07 94 25.19 19.25 2.89
54 Prof., Scientific, Tech. Services 0 25.57 18.64 15.13 289 41.54 30.27 24.58 289 67.11 48.91 39.72
55 Management of Companies 0 1.32 0.83 0.72 35 7.29 4.55 3.94 35 8.61 5.37 4.66
56 Administrative & Support Services 0 23.29 15.94 13.48 471 31.07 21.26 17.98 471 54.36 37.20 31.46
61 Educational Services 0 0.00 0.00 0.00 22 1.48 0.98 0.86 22 1.48 0.98 0.86
62 Health Care & Social Assistance 0 0.00 0.00 0.00 101 10.40 6.98 6.13 101 10.40 6.98 6.13
71 Arts, Entertainment, & Recreation 0 0.00 0.00 0.00 23 1.97 1.34 0.83 23 1.97 1.34 0.83
72 Accommodation & Food Services 0 0.92 0.53 0.36 95 6.33 3.66 2.47 95 7.25 4.20 2.83
81 Other Services 0 0.00 0.00 0.00 61 4.60 3.05 2.67 61 4.60 3.05 2.67
92 Government 0 0.07 0.07 0.06 13 1.36 1.31 1.12 13 1.43 1.37 1.18
Total 0 204.72 93.13 58.34 2,009 379.95 192.45 120.42 2,009 584.68 285.58 178.75
Direct Impacts to California Multiplier Effects to California Total Impacts to California

Caltrans Airport Forecasting Study Appendix
E-14 Cambridge Systematics, Inc.
Table E.10 Economic Impacts to California from Gillespie Airport, by Sector
NAICS Sector Employment Output ($mil)
Value Added
($mil)
Income
($mil) Employment Output ($mil)
Value Added
($mil)
Income
($mil) Employment Output ($mil)
Value Added
($mil)
Income
($mil)
11 Agriculture 0 0.00 0.00 0.00 7 1.03 0.50 0.38 7 1.03 0.50 0.38
21 Mining 0 0.00 0.00 0.00 2 0.87 0.47 0.14 2 0.87 0.47 0.14
22 Utilities 0 0.00 0.00 0.00 1 1.19 0.57 0.19 1 1.19 0.57 0.19
23 Construction 0 0.54 0.32 0.28 11 1.39 0.83 0.73 11 1.94 1.15 1.01
31‐33 Manufacturing 0 26.02 7.86 3.71 61 38.09 11.50 5.44 61 64.11 19.36 9.15
42 Wholesale Trade 0 1.29 0.95 0.55 23 4.25 3.13 1.80 23 5.54 4.08 2.35
44‐45 Retail Trade 0 0.36 0.27 0.17 50 3.93 2.94 1.87 50 4.29 3.21 2.04
48‐49 Transportation & Warehousing 0 0.09 0.05 0.04 19 2.52 1.37 1.08 19 2.60 1.42 1.12
51 Information 0 0.00 0.00 0.00 11 4.42 2.61 1.45 11 4.42 2.61 1.45
52 Finance & Insurance 0 0.00 0.00 0.00 31 7.27 4.16 2.14 31 7.27 4.16 2.14
53 Real Estate & Leasing 0 6.45 4.93 0.74 58 11.12 8.50 1.28 58 17.57 13.43 2.02
54 Prof., Scientific, Tech. Services 0 21.07 15.36 12.47 189 27.23 19.85 16.12 189 48.30 35.21 28.59
55 Management of Companies 0 0.41 0.26 0.22 10 2.06 1.29 1.12 10 2.48 1.54 1.34
56 Administrative & Support Services 0 17.22 11.79 9.97 313 20.64 14.13 11.95 313 37.86 25.91 21.91
61 Educational Services 0 0.00 0.00 0.00 9 0.64 0.42 0.37 9 0.64 0.42 0.37
62 Health Care & Social Assistance 0 0.00 0.00 0.00 43 4.47 3.00 2.63 43 4.47 3.00 2.63
71 Arts, Entertainment, & Recreation 0 0.00 0.00 0.00 10 0.87 0.59 0.37 10 0.87 0.59 0.37
72 Accommodation & Food Services 0 0.26 0.15 0.10 40 2.67 1.55 1.04 40 2.93 1.70 1.14
81 Other Services 0 0.00 0.00 0.00 26 1.91 1.27 1.11 26 1.91 1.27 1.11
92 Government 0 0.09 0.09 0.08 6 0.61 0.58 0.50 6 0.70 0.67 0.58
Total 0 73.81 42.02 28.33 921 137.19 79.25 51.71 921 211.00 121.26 80.04
Direct Impacts to California Multiplier Effects to California Total Impacts to California

Caltrans Airport Forecasting Study Appendix
Cambridge Systematics, Inc. E-15
E.2 ROLE 2. POTENTIAL PRODUCTIVITY IMPACTS GENERATED BY SMART GROWTH POLICIES The purpose of a Role 2 airport area (smart growth support hub) is to retain companies that could leave California without supportive land use and incentive policies. The hypothesis of this analysis is that manufacturing and industrial service companies would disinvest from their current locations because of inadequate local support, including infrastructure, land available for expansion, and population densities that view such companies as undesirable neighbors.
This analysis looks at potential outcomes for counties by 2040 if jobs are saved in airport smart growth areas. Four airports were selected as examples of Role 2 airport smart growth areas. The airports and the counties in which they are located are listed in Table E.11. The four Role 2 airport smart growth areas are illustrated in Figures E.3 and E.4 below.
Table E.11 Sample Role 2 Smart Growth Airport Areas
Airport County
Castle Airport (Castle Air Base) Merced
Santa Maria Public Airport Santa Barbara
Sonoma County Airport Sonoma
Yuba County Airport Yuba
Current employment by industry and total acreage of each site were estimated though ESRI Business Analyst Online, which combines a GIS system with an industry and employment database. The consultant team traveled to each area and completed driving surveys of the four project areas. Notes were compiled about key businesses, vacant land areas, infill sites, roadways, open space and potential environmental constraints. Combining the site visit observations and the existing employment in each area, the ESRI employment data were converted into employment by building types, and sorted into four land use categories: commercial retail, light industrial and general commercial, office, business park & R&D flex space, and warehouse space.
Three further steps are employed to calculate densities in each smart growth area. First, the employment by land use types are calculated from ESRI Business Analyst and the site visits are converted into built space using “square feet per employee” data, using ratios from the National Association for Industrial and Office Properties (NAIOP). Second, detailed reviews of Google Maps complement the driving surveys and yield estimates of the total acres by land use. Lastly, Floor Area Ratio (FAR) ranges are calculated using the following formula:
Total Square Feet by Land Use / (Acreage by Land Use * 43,560)

Caltrans Airport Forecasting Study Appendix
E-16 Cambridge Systematics, Inc.
Figure E.3 Prospective Castle Airport Smart Growth Area
Source: ESRI Business Analyst Online.

Caltrans Airport Forecasting Study Appendix
Cambridge Systematics, Inc. E-17
Figure E.4 Prospective Santa Maria Public Airport Smart Growth Area
Source: ESRI Business Analyst Online.

Caltrans Airport Forecasting Study Appendix
E-18 Cambridge Systematics, Inc.
Figure E.5 Prospective Sonoma County Airport Smart Growth Area
Source: ESRI Business Analyst Online

Caltrans Airport Forecasting Study Appendix
Cambridge Systematics, Inc. E-19
Figure E.6 Prospective Yuba County Airport Smart Growth Area
Source: ESRI Business Analyst Online.
Potential increases in development density for each smart growth area are calculated on the bases of: (1) increased floor to area ratio (FAR); and (2) allocation of currently vacant land for economic development. The levels of FAR increases and absorption of vacant land are based on reasonable assumptions based on site visits, current FAR (as estimated) and current land use. Note that the FAR used in this analysis is not as-of-right-zoning maximums, but are the effective building densities based on observation and research. Also, in all four cases, it was assumed that 62 percent to 85 percent of vacant land would remain vacant by 2040. Thus, much more development potential would remain in each smart growth area (see Table E.12)
As displayed in Table E.12 , a 50 percent increase in floor to area ratio is assumed for three of the four Role 2 airport smart growth areas to be in effect by 2040. The exception this is the Castle Airport smart growth area because the current effective FAR is exceptionally low, appearing significantly less than 0.1. Therefore, a future FAR of 0.3 is assumed for the Castle Airport area, which falls on the low end of the ranges of assumed future FARs shown for the other three airport areas.

Caltrans Airport Forecasting Study Appendix
E-20 Cambridge Systematics, Inc.
Table E.12 Density Changes Assumed for Smart Growth
Airport Smart Growth Area
Change in FAR Vacant Land Absorption
Percent Range Percent Acres
Castle Airport (Castle Air Base) N/A .30 15% 78
Santa Maria Public Airport 50% .24 - .76 25% 181
Sonoma County Airport 50% .31 - .38 38% 157
Yuba County Airport 50% .22 - .74 25% 108
County Employment Base: 2013 to 2040
The approach used to estimate the potential role of these four Role 2 smart growth areas is based on county- and industry-specific projections to 2040 by Moody’s Analytics adapted to three digit NAICS code. Summing all industries in the county economies shows that that Moody’s Analytics projects the total job base in county that houses a designated Role 2 airport smart growth area will increase between 2013 and 2040. The net overall job growth is expected to be between 14,000 and 114,000 jobs per county (Table E.13).
These projections encompass all sectors of county economies absent of smart growth incentives or other policies. Although, the four counties are expected to experience net job growth by 2040, each of the counties is projected to lose of manufacturing, warehousing and trucking jobs by 2040. The specific sectors that are expected to experience job losses will vary by county. Only sectors that are projected to lose ten or more jobs were counted—to distinguish job losses due to layoffs or minor efficiency gains with business relocation.68
There is a possibility that, with incentives, a portion of non-industrial jobs may migrate to smart growth areas, but is also possible that the service and knowledge based industries will continue to expand in areas where they are now located69. In addition, the Project Team began this study by assuming that the Role 2 smart growth areas would be prime sites for big-box retail. However, after visiting each site and reviewing local retail patterns, the Project Team concludes that each of the four Role 2 smart growth areas is not suitable as a big-box location for various reasons, which are discussed in the individual area case studies in Section 5.2.
68 This is admittedly a rough framework, which does not account for the churning of
multiple companies in a single sector growing, shrinking or relocating.
69 Note that these industries were at one time assumed to not migrate to the smart growth districts.

Caltrans Airport Forecasting Study Appendix
Cambridge Systematics, Inc. E-21
Table E.13 Total Job Growth Projected by County
County Projected Job Increase
Merced 8,895
Santa Barbara 113,720
Sonoma 63,452
Yuba 14,422
Source: Moody’s Analytics and EDR Group
Job migration to Role 2 smart growth areas are developed by the following steps. First projections by Moody’s Analytics are used to identify sectors at the three-digit NAICS level under manufacturing, warehousing and truck transportation divisions per county that are projected to lose ten or more jobs from 2013 through 2040. These are assumed to be the jobs that could be saved if they could be absorbed in smart growth areas. Total jobs projected to be lost per county and by sector (limited to sectors with losses of ten or more jobs) are shown on Table E.14. As can be seen, the total job losses in these industrial sectors range from 120 jobs in Yuba County to almost 4,300 jobs in Sonoma County.
These jobs could fit into the assumed expanded capacities of the Role 2 smart growth areas for three of the four (Merced, Santa Barbara and Yuba counties), after presuming adjustments in FAR and the development of vacant land. For Sonoma County, however, the jobs projected to be lost exceed the capacity presumed for the airport smart growth area. Although, assumptions could be made to further utilize vacant land or further expand FAR, the Project Team decided to scale back potential job relocation to match the assumptions based on the site visit and the 50 percent change in FAR (Table E.15).
To summarize, the hypothesis presented is that the Role 2 airport smart growth areas will serve to absorb potential industrial-related job losses projected in the directs’ host counties from 2013 to 2040. Job losses and company closings of course can stem from multiple causes, including: poor management, searches for dramatically lower wages, and loss of market shares. There is little that smart growth policies can do to mitigate these factors. However, if job dislocation is due to a lack of suitable land, or residential communities that do not want associated social/environmental impacts associated with industrial establishments, then smart growth areas may be an outlet to allow the counties to retain these jobs. For the purposes of this assessment, it is assumed that the development of the areas will be a means for job retention. The job levels assumed to be retained in 2040 due to these areas are shown in Table E.15.

Caltrans Airport Forecasting Study Appendix
E-22 Cambridge Systematics, Inc.
Table E.14 Manufacturing, Wholesale Trade and Truck Transportation Jobs Projected to be Lost by County
NAICS Code and Sector
Counties
Merced Santa Barbara Sonoma Yuba
311: Food Manufacturing (756) (128) (593)
312: Beverage & Tobacco Product Mfg (21) (347) (1,000) (11)
313: Textile Mills (10)
314: Textile Products Mfg (27) (47)
315: Apparel Mfg (13) (32) (64)
316: Leather & Allied Product Mfg
321: Wood Product Mfg (19) (25) (30)
322: Paper Mfg (23) (11)
323: Printing & Related Support Activities (199) (127) (141)
324: Petroleum and Coal Products Mfg (25)
325: Chemical Mfg (148) (73)
326: Plastics & Rubber Products Mfg (29) (139)
327: Nonmetal Mineral Product Mfg (38)
331: Primary Metal Mfg (11) (64)
332: Fabricated Metal Mfg (45) (108) (204) (19)
333: Machinery Mfg (25) (323)
334: Computer and Electronic Mfg (270)
335: Electrical Equipment & Appliance Mfg (11)
336: Transportation Equipment Mfg (219) (979) (66) (20)
337: Furniture and Home Furnishings Mfg (53) (163) (14)
339: Miscellaneous Mfg (63) (690) (789)
420: Wholesale Trade (713) (594) (26)
484: Truck Transportation (384) (375)
Totals (1,743) (4,156) (4,280) (120)
Source: Moody’s Analytics and EDR Group.

Caltrans Airport Forecasting Study Appendix
Cambridge Systematics, Inc. E-23
Table E.15 Adjusted Estimates to Accommodate Additional Capacity of Sonoma County Airport Smart Growth Area
NAICS Code and Sector Sonoma County Adjusted
Projected Job Losses
311: Food Manufacturing (593)
312: Beverage & Tobacco Product Mfg (1,000)
313: Textile Mills
314: Textile Products Mfg
315: Apparel Mfg
316: Leather & Allied Product Mfg
321: Wood Product Mfg
322: Paper Mfg
323: Printing & Related Support Activities (141)
324: Petroleum and Coal Products Mfg
325: Chemical Mfg
326: Plastics & Rubber Products Mfg (139)
327: Nonmetal Mineral Product Mfg
331: Primary Metal Mfg
332: Fabricated Metal Mfg (204)
333: Machinery Mfg (323)
334: Computer and Electronic Mfg
335: Electrical Equipment & Appliance Mfg
336: Transportation Equipment Mfg
337: Furniture and Home Furnishings Mfg (163)
339: Miscellaneous Mfg (338)
420: Wholesale Trade (126)
484: Truck Transportation
Total (3,026)
Source: Moody’s Analytics and EDR Group.
Econometric Analysis
Once the jobs and industries were identified, the Project Team employed the IMPLAN modeling package. IMPLAN was first used to estimate direct effects for personal income, value added and total output (equivalent to business sales/business revenues) that would be saved if businesses perceive the advantage of relocating to the airport smart growth areas by 2040 as opposed to leaving their 2013 county locations, and perhaps California. Secondly the “multiplier impacts” were calculated, which would be the retained economic

Caltrans Airport Forecasting Study Appendix
E-24 Cambridge Systematics, Inc.
activity in the each respective county generated by: (1) directly affected companies using a portion of its business revenue to purchase supplies and services (indirect impacts); and (2) spending of the wages earned by workers due to direct and indirect activities (induced impacts).
Impacts by county are presented in Table E.16, below, which represent the potential retention of jobs, personal income earned by workers, value added (contribution to gross state product) and economic output. The overarching assumption is that the companies represented by these projected job losses to the counties end up not leaving the counties because of the outlet provided by the airport smart growth areas located in the respective four counties, and thus continue to employ local workers and purchase business supplies and services in the respective county economies.
Direct impacts represent the industrial job losses projected by Moody’s Analytics per county from 2013 to 2040, and the dollars (in 2013 value) associated with those jobs in terms of personal income, value added to the economy and output (which is the business revenue that supports the jobs and includes personal income and value added). The multipliers embody the penetration of these direct activities in all sectors of the county economies. As an illustration of the breadth of these impacts, employment by three digit NAICS (North American Industrial Classification Sectors) are presented in Table E.17.
Table E.16 Direct, Indirect and Induced and Total Impacts by County Due to Jobs Saved in Airport Smart Growth Areas
County Impact Type Jobs
Labor Income Value Added Output
Dollars in $ Millions, 2013 Value
Merced Direct 1,743 $86 $123 $607
Indirect & Induced 1,259 $52 $95 $165
Total 3,004 $138 $218 $772
Santa Barbara Direct 4,159 $326 $549 $1,541
Indirect & Induced 4,288 $230 $370 $578
Total 8,447 $556 $919 $2,119
Sonoma Direct 3,026 $232 $357 $1,098
Indirect & Induced 3,907 $188 $321 $563
Total 6,934 $419 $678 $1,661
Yuba Direct 120 $8 $12 $35
Indirect & Induced 45 $2 $4 $6
Total 165 $11 $16 $41
Sources: Moody’s Analytics, IMPLAN, LLC and EDR Group.
Note: Columns may not add due to rounding.
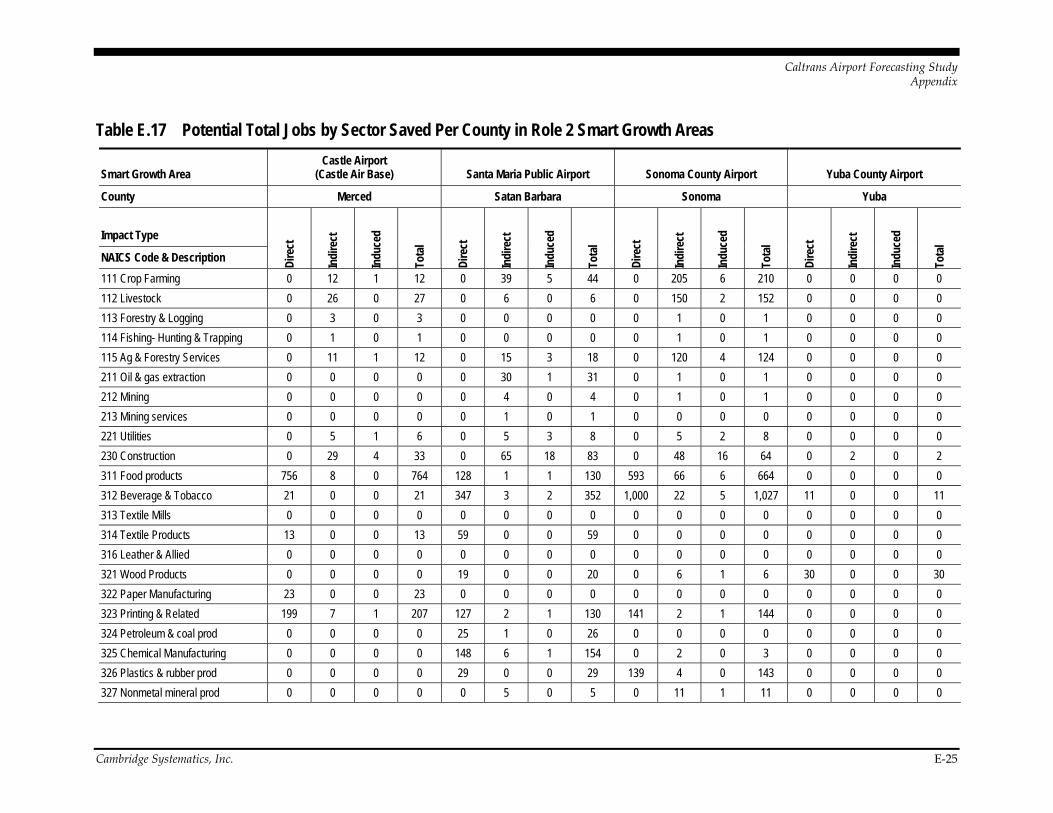
Caltrans Airport Forecasting Study Appendix
Cambridge Systematics, Inc. E-25
Table E.17 Potential Total Jobs by Sector Saved Per County in Role 2 Smart Growth Areas
Smart Growth Area Castle Airport
(Castle Air Base) Santa Maria Public Airport Sonoma County Airport Yuba County Airport
County Merced Satan Barbara Sonoma Yuba
Impact Type
Dire
ct
Indi
rect
Indu
ced
Tota
l
Dire
ct
Indi
rect
Indu
ced
Tota
l
Dire
ct
Indi
rect
Indu
ced
Tota
l
Dire
ct
Indi
rect
Indu
ced
Tota
l
NAICS Code & Description
111 Crop Farming 0 12 1 12 0 39 5 44 0 205 6 210 0 0 0 0
112 Livestock 0 26 0 27 0 6 0 6 0 150 2 152 0 0 0 0
113 Forestry & Logging 0 3 0 3 0 0 0 0 0 1 0 1 0 0 0 0
114 Fishing- Hunting & Trapping 0 1 0 1 0 0 0 0 0 1 0 1 0 0 0 0
115 Ag & Forestry Services 0 11 1 12 0 15 3 18 0 120 4 124 0 0 0 0
211 Oil & gas extraction 0 0 0 0 0 30 1 31 0 1 0 1 0 0 0 0
212 Mining 0 0 0 0 0 4 0 4 0 1 0 1 0 0 0 0
213 Mining services 0 0 0 0 0 1 0 1 0 0 0 0 0 0 0 0
221 Utilities 0 5 1 6 0 5 3 8 0 5 2 8 0 0 0 0
230 Construction 0 29 4 33 0 65 18 83 0 48 16 64 0 2 0 2
311 Food products 756 8 0 764 128 1 1 130 593 66 6 664 0 0 0 0
312 Beverage & Tobacco 21 0 0 21 347 3 2 352 1,000 22 5 1,027 11 0 0 11
313 Textile Mills 0 0 0 0 0 0 0 0 0 0 0 0 0 0 0 0
314 Textile Products 13 0 0 13 59 0 0 59 0 0 0 0 0 0 0 0
316 Leather & Allied 0 0 0 0 0 0 0 0 0 0 0 0 0 0 0 0
321 Wood Products 0 0 0 0 19 0 0 20 0 6 1 6 30 0 0 30
322 Paper Manufacturing 23 0 0 23 0 0 0 0 0 0 0 0 0 0 0 0
323 Printing & Related 199 7 1 207 127 2 1 130 141 2 1 144 0 0 0 0
324 Petroleum & coal prod 0 0 0 0 25 1 0 26 0 0 0 0 0 0 0 0
325 Chemical Manufacturing 0 0 0 0 148 6 1 154 0 2 0 3 0 0 0 0
326 Plastics & rubber prod 0 0 0 0 29 0 0 29 139 4 0 143 0 0 0 0
327 Nonmetal mineral prod 0 0 0 0 0 5 0 5 0 11 1 11 0 0 0 0

Caltrans Airport Forecasting Study Appendix
E-26 Cambridge Systematics, Inc.
Smart Growth Area Castle Airport
(Castle Air Base) Santa Maria Public Airport Sonoma County Airport Yuba County Airport
County Merced Satan Barbara Sonoma Yuba
Impact Type
Dire
ct
Indi
rect
Indu
ced
Tota
l
Dire
ct
Indi
rect
Indu
ced
Tota
l
Dire
ct
Indi
rect
Indu
ced
Tota
l
Dire
ct
Indi
rect
Indu
ced
Tota
l
NAICS Code & Description
331 Primary metal mfg 11 0 0 11 64 1 0 66 0 0 0 0 0 0 0 0
332 Fabricated metal prod 45 1 0 46 108 2 0 110 204 4 0 208 19 0 0 19
333 Machinery Mfg 0 0 0 0 25 0 0 25 323 1 0 324 0 0 0 0
334 Computer & other electronics 0 0 0 0 270 2 0 272 0 1 0 1 0 0 0 0
335 Electrical equipment & appliances
11 0 0 11 0 0 0 0 0 0 0 0 0 0 0 0
336 Transportation equipment 219 0 0 219 979 1 0 980 0 0 0 0 20 0 0 20
337 Furniture & related prod 0 0 0 0 53 0 0 53 163 0 0 163 14 0 0 14
339 Miscellaneous mfg 63 0 0 63 690 2 0 692 338 1 1 340 0 0 0 0
42 Wholesale Trade 0 39 8 47 713 98 34 846 126 140 48 314 26 2 1 29
441 Motor vehicle & parts dealers 0 2 12 14 0 6 39 45 0 4 34 38 0 0 0 0
442 Furniture & home furnishings 0 0 2 2 0 2 13 15 0 1 10 11 0 0 0 0
443 Electronics & appliances stores 0 0 3 3 0 2 13 15 0 2 10 11 0 0 0 0
444 Bldg materials & garden dealers 0 2 8 10 0 5 20 25 0 4 20 24 0 0 0 0
445 food & beverage stores 0 4 25 29 0 14 77 91 0 10 65 75 0 0 1 1
446 Health & personal care stores 0 1 7 8 0 6 30 36 0 3 20 23 0 0 0 0
447 Gasoline stations 0 0 5 5 0 1 12 13 0 1 11 12 0 0 0 0
448 Clothing & accessories stores 0 1 8 9 0 7 41 48 0 5 33 38 0 0 0 0
451 Sports- hobby- book & music stores
0 1 4 5 0 4 21 25 0 3 19 21 0 0 0 0
452 General merchandise stores 0 5 29 34 0 12 66 77 0 7 48 55 0 0 1 1
453 Misc retailers 0 1 9 11 0 8 42 50 0 6 37 43 0 0 0 0
454 Non-store retailers 0 1 10 11 0 4 32 36 0 4 35 38 0 0 0 0
481 Air transportation 0 0 0 0 0 2 2 4 0 2 3 5 0 0 0 0

Caltrans Airport Forecasting Study Appendix
Cambridge Systematics, Inc. E-27
Smart Growth Area Castle Airport
(Castle Air Base) Santa Maria Public Airport Sonoma County Airport Yuba County Airport
County Merced Satan Barbara Sonoma Yuba
Impact Type
Dire
ct
Indi
rect
Indu
ced
Tota
l
Dire
ct
Indi
rect
Indu
ced
Tota
l
Dire
ct
Indi
rect
Indu
ced
Tota
l
Dire
ct
Indi
rect
Indu
ced
Tota
l
NAICS Code & Description
482 Rail Transportation 0 2 0 2 0 3 0 4 0 0 0 0 0 0 0 0
483 Water transportation 0 0 0 0 0 0 0 0 0 1 0 1 0 0 0 0
484 Truck transportation 384 126 6 516 375 59 9 443 0 99 11 110 0 3 0 3
485 Transit & ground passengers 0 2 3 5 0 3 5 7 0 5 10 15 0 0 0 0
486 Pipeline transportation 0 0 0 0 0 0 0 0 0 0 0 0 0 0 0 0
487 Sightseeing transportation 0 4 0 5 0 20 4 24 0 33 7 40 0 1 0 1
492 Couriers & messengers 0 5 0 6 0 28 4 32 0 17 7 24 0 0 0 0
493 Warehousing & storage 0 19 1 21 0 40 5 45 0 10 2 12 0 0 0 0
511 Publishing industries 0 1 0 1 0 13 3 17 0 4 2 6 0 0 0 0
512 Motion picture & sound recording 0 0 1 1 0 1 5 6 0 1 4 5 0 0 0 0
515 Broadcasting 0 2 1 3 0 9 2 11 0 6 2 8 0 0 0 0
516 Internet publishing and broadcasting
0 0 0 0 0 2 1 3 0 1 0 1 0 0 0 0
517 Telecommunications 0 9 5 14 0 7 5 12 0 10 8 18 0 0 0 0
518 Internet & data process services 0 0 0 0 0 1 2 3 0 0 1 1 0 0 0 0
519 Other information services 0 0 0 0 0 0 0 1 0 0 0 0 0 0 0 0
521 Monetary authorities 0 9 5 14 0 25 28 53 0 27 24 51 0 0 0 1
522 Credit inmediation & related 0 2 1 3 0 4 5 10 0 9 11 20 0 0 0 0
523 Securities & other financial 0 7 4 11 0 54 53 106 0 57 62 119 0 1 0 1
524 Insurance carriers & related 0 2 3 6 0 8 22 31 0 6 26 32 0 0 0 0
525 Funds- trusts & other finance 0 0 0 0 0 0 16 16 0 0 9 9 0 0 0 0

Caltrans Airport Forecasting Study Appendix
E-28 Cambridge Systematics, Inc.
Smart Growth Area Castle Airport
(Castle Air Base) Santa Maria Public Airport Sonoma County Airport Yuba County Airport
County Merced Satan Barbara Sonoma Yuba
Impact Type
Dire
ct
Indi
rect
Indu
ced
Tota
l
Dire
ct
Indi
rect
Indu
ced
Tota
l
Dire
ct
Indi
rect
Indu
ced
Tota
l
Dire
ct
Indi
rect
Indu
ced
Tota
l
NAICS Code & Description
531 Real estate 0 9 24 33 0 48 192 239 0 49 156 205 0 0 1 1
532 Rental & leasing services 0 8 2 9 0 16 7 23 0 14 6 20 0 0 0 0
533 Lessor of nonfinance intangible assets
0 1 0 1 0 3 0 4 0 2 0 2 0 0 0 0
541 Professional- scientific & tech services
0 87 15 102 0 472 101 572 0 345 101 446 0 5 1 5
551 Management of companies 0 58 1 59 0 150 6 156 0 85 4 89 0 2 0 2
561 Admin support services 0 111 16 127 0 406 113 519 0 188 77 265 0 4 1 4
562 Waste mgmt & remediation services
0 4 1 6 0 7 5 12 0 7 5 12 0 0 0 0
611 Educational services 0 0 5 5 0 1 78 79 0 1 58 59 0 0 0 0
621 Ambulatory health care 0 0 44 44 0 0 191 191 0 0 132 132 0 0 1 1
622 Hospitals 0 0 17 17 0 0 95 95 0 0 58 58 0 0 2 2
623 Nursing & residential care 0 0 20 20 0 0 75 75 0 0 59 59 0 0 1 1
624 Social assistance 0 0 33 33 0 0 79 79 0 0 84 84 0 0 1 1
712 Performing arts & spectator sports
0 6 6 12 0 14 20 34 0 21 33 54 0 0 0 0
712 Museums & similar 0 0 0 0 0 0 4 4 0 0 2 2 0 0 0 0
713 Amusement- gambling & recreation
0 1 10 11 0 5 48 53 0 4 41 45 0 0 0 0
721 Accommodations 0 0 0 0 0 1 3 4 0 1 2 3 0 0 0 0
722 Food services & drinking places 0 26 57 83 0 78 255 333 0 61 205 267 0 1 2 3
811 Repair & maintenance 0 28 10 39 0 51 33 85 0 42 30 72 0 1 0 1

Caltrans Airport Forecasting Study Appendix
Cambridge Systematics, Inc. E-29
Smart Growth Area Castle Airport
(Castle Air Base) Santa Maria Public Airport Sonoma County Airport Yuba County Airport
County Merced Satan Barbara Sonoma Yuba
Impact Type
Dire
ct
Indi
rect
Indu
ced
Tota
l
Dire
ct
Indi
rect
Indu
ced
Tota
l
Dire
ct
Indi
rect
Indu
ced
Tota
l
Dire
ct
Indi
rect
Indu
ced
Tota
l
NAICS Code & Description
812 Personal & laundry services 0 1 8 9 0 6 48 54 0 3 44 47 0 0 0 0
813 Religious- grantmaking- & similar orgs
0 4 14 18 0 15 76 91 0 11 55 66 0 0 1 1
814 Private households 0 0 12 12 0 0 25 25 0 0 23 23 0 0 1 1
92 Government & non NAICs 0 79 21 100 0 208 70 279 0 97 53 149 0 3 1 5
Totals 1,743 774 486 3,004 4,159 2,120 2,168 8,447 3,026 2,061 1,846 6,934 120 27 19 165
Sources: Moody’s Analytics, IMPLAN, LLC and EDR Group.
Note: Columns may not add due to rounding.

Caltrans Airport Forecasting Study Appendix
E-30 Cambridge Systematics, Inc.
Site Visits and Interviews
The consultant team traveled to and drove through the project area for all eight airports included in the smart growth study. Photographs were taken and notes were compiled on the existing land uses, the business types in place and the conditions of vacant sites and land areas. Key people contacted via email or phones were asked questions about economic development, land use policies and their opinions about each project area’s smart growth potential. The persons interviewed listed in Table E.18 below, sorted by their airport location.
Table E.18 List of Persons Interviewed, by Airport Location
Buchanan Field
Carol Johnson City of Concord Planning Manager
John Montagh City of Concord Economic Development Director
Gillespie Field
Marie Jo Diamond San Diego East County Economic Development Council
Melanie Kush City of Santee Planning and Zoning Manager
Dana Quittner San Diego County Planning Department
Manjeet Ranu City of El Cajon Planning Manager
Santa Monica David Martin City of Santa Monica Planning Manager
Fresno-Yosemite Airport
Sophia Pagoulatos City of Fresno Supervising Planner
Jennifer Clark City of Fresno Department of Development & Resource Management Director
Dwight Kroll City of Clovis Planning Director

Caltrans Airport Forecasting Study Appendix
Cambridge Systematics, Inc. F-1
F. Rating and Categorizing Airports
This memorandum describes how we categorized the remaining airports for study by Smart Growth role and recommends a set for quantitative economic analysis and a set for qualitative analysis.
The 20 remaining airports for study are listed in Table F.1.
F.1 SMART GROWTH ROLES Previously, we identified four possible roles airports could play in supporting Smart Growth. These are:
1. Smart Growth Node: A limited number of airports are potential sites for Smart Growth. These airports have some competitive advantages compared to the surrounding region to attract Smart Growth. Given airport noise will be problematic for residential development, these airports will likely attract commercial and industrial Smart Growth.
2. Retainer and Attractor of Non-Smart Growth: Some airports have the potential to accommodate commercial or industrial development that does not conform to Smart Growth policies. In these situations, the retention and attraction of non-Smart Growth development at the airport would allow other parts of the region to pursue Smart Growth.
3. Transit Hub: Some airports may be located where a new or expanded transit or park-n-ride hub would encourage regional transit usage.
4. Land Banking: Some airports could serve as a land bank that would provide capacity for future Smart Growth.
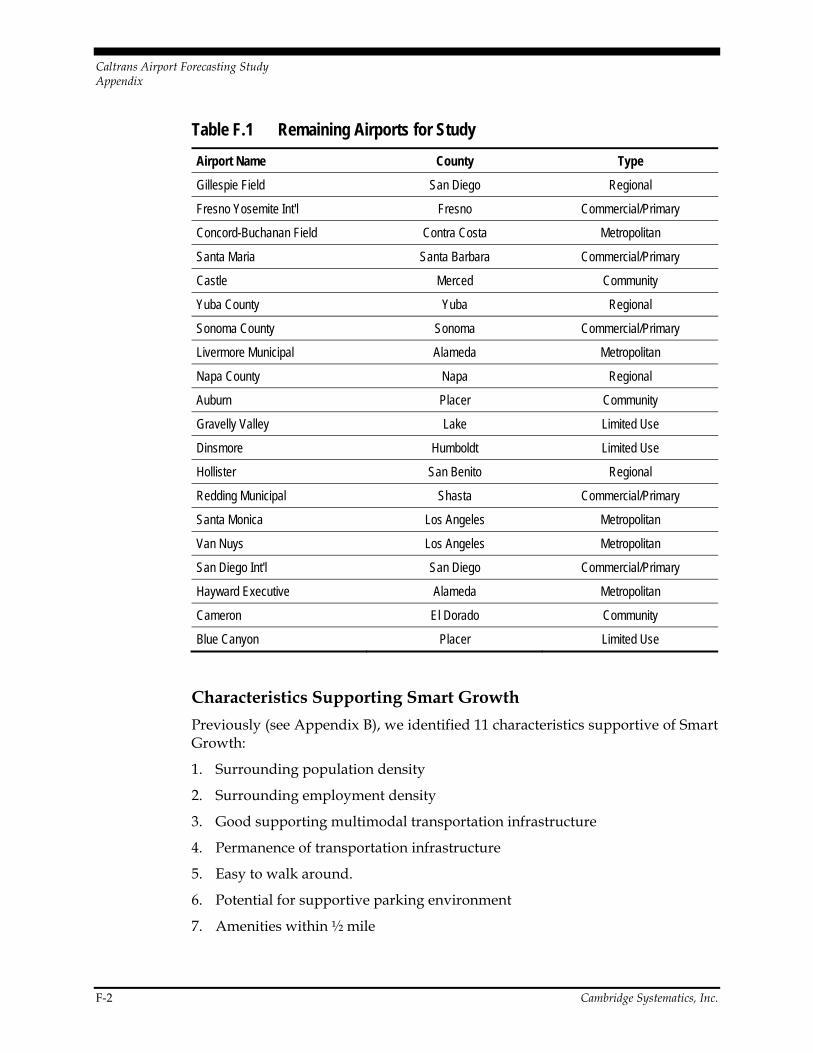
Caltrans Airport Forecasting Study Appendix
F-2 Cambridge Systematics, Inc.
Table F.1 Remaining Airports for Study
Airport Name County Type
Gillespie Field San Diego Regional
Fresno Yosemite Int'l Fresno Commercial/Primary
Concord-Buchanan Field Contra Costa Metropolitan
Santa Maria Santa Barbara Commercial/Primary
Castle Merced Community
Yuba County Yuba Regional
Sonoma County Sonoma Commercial/Primary
Livermore Municipal Alameda Metropolitan
Napa County Napa Regional
Auburn Placer Community
Gravelly Valley Lake Limited Use
Dinsmore Humboldt Limited Use
Hollister San Benito Regional
Redding Municipal Shasta Commercial/Primary
Santa Monica Los Angeles Metropolitan
Van Nuys Los Angeles Metropolitan
San Diego Int'l San Diego Commercial/Primary
Hayward Executive Alameda Metropolitan
Cameron El Dorado Community
Blue Canyon Placer Limited Use
Characteristics Supporting Smart Growth
Previously (see Appendix B), we identified 11 characteristics supportive of Smart Growth:
1. Surrounding population density
2. Surrounding employment density
3. Good supporting multimodal transportation infrastructure
4. Permanence of transportation infrastructure
5. Easy to walk around.
6. Potential for supportive parking environment
7. Amenities within ½ mile

Caltrans Airport Forecasting Study Appendix
Cambridge Systematics, Inc. F-3
8. Availability of land on or off airport for development
9. Suitability of land for development
10. Proximity to service infrastructure (e.g., water, sewer, fire, police)
11. Community stance on developing the surrounding area
Rating the Airports
Using research on each of the airports and interviews conducted with each of the airports, we rated each airport on each of the 11 characteristics. The ratings are shown in Table F.2.
For more details on the definitions of each of the ratings, see Table 3.
Categorizing the Airports
We used weighted scoring to identify airports for the four Smart Growth roles. The scores were developed by:
Assigning a numerical score to each of the ratings (see Table 4); and then
Assigning a weight to each of the 11 characteristics (see Table 5).
A score of -100 is assigned to the None rating, which is only used for the availability of land for development and suitability of land for development characteristics. This is because an airport with no available and suitable land for development (or redevelopment) is not a viable candidate for either of the two Smart Growth roles using these two characteristics.
Table F.2 Assignment of Scores to Ratings
Rating Score
None -100
n/a 0
Unknown 0
Poor 0
Potential 1
Redevelop 2
Modest 2
Good 3
Very Good 4

Caltrans Airport Forecasting Study Appendix
F-4 Cambridge Systematics, Inc.
For Role 1 (Smart Growth Node), all 11 characteristics come into play. The availability and suitability of land for development (or redevelopment) and the surrounding employment density are the most important, followed by the surrounding population density.
For Role 2 (Retainer and Attractor of Non-Smart Growth), six of the 11 characteristics come into play (i.e., the characteristics with non-zero weights in Table 5). Again, the availability and suitability of land for development (or redevelopment) are the most important. Surrounding population density and surrounding employment density play a role, but are not as critical as for Role 1. Many of the other characteristics do not come into play for Role 2 because they are not necessary for non-Smart Growth. For example, it is not important to have multimodal transportation infrastructure or nearby amenities to have non-Smart Growth.
For Role 3 (Transit Hub), the two multimodal transportation related characteristics come into play.
The resulting weighted scores for role 1 (Smart Growth Node) are shown in Table 6. The top eight airports in this table show potential to be a Smart Growth node. The four airports with the highest score (highlighted in light red) are recommended for quantitative economic analysis. The next four highest scores (highlighted in light green) are recommended for qualitative analysis.
The resulting weighted scores for Role 2 (Retainer and Attractor of Non-Smart Growth) are shown in Table F.7. The airports recommended for Role 1 quantitative economic analysis are greyed out. The top seven remaining airports in this table show potential to be a retainer and attractor of non-Smart Growth development. The four airports with the highest score (highlighted in light red) are recommended for quantitative economic analysis. The next three highest scores (highlighted in light green) are recommended for qualitative analysis.
The resulting weighted scores for Role 3 (Transit Hub) are shown in Table 8. The top four airports in this table show potential to be transit hubs. The four airports with the highest score (highlighted in light green) are recommended for qualitative analysis. We do not plan to conduct quantitative analysis for Role 3 airports.
The remaining airports (i.e., not highlighted in Tables 6, 7, or 8) are Role 4 (Land Bank) airports.

Caltrans Airport Forecasting Study Appendix
Cambridge Systematics, Inc. F-5
Appendix 1. Characteristics Rating and Categorizing Tables
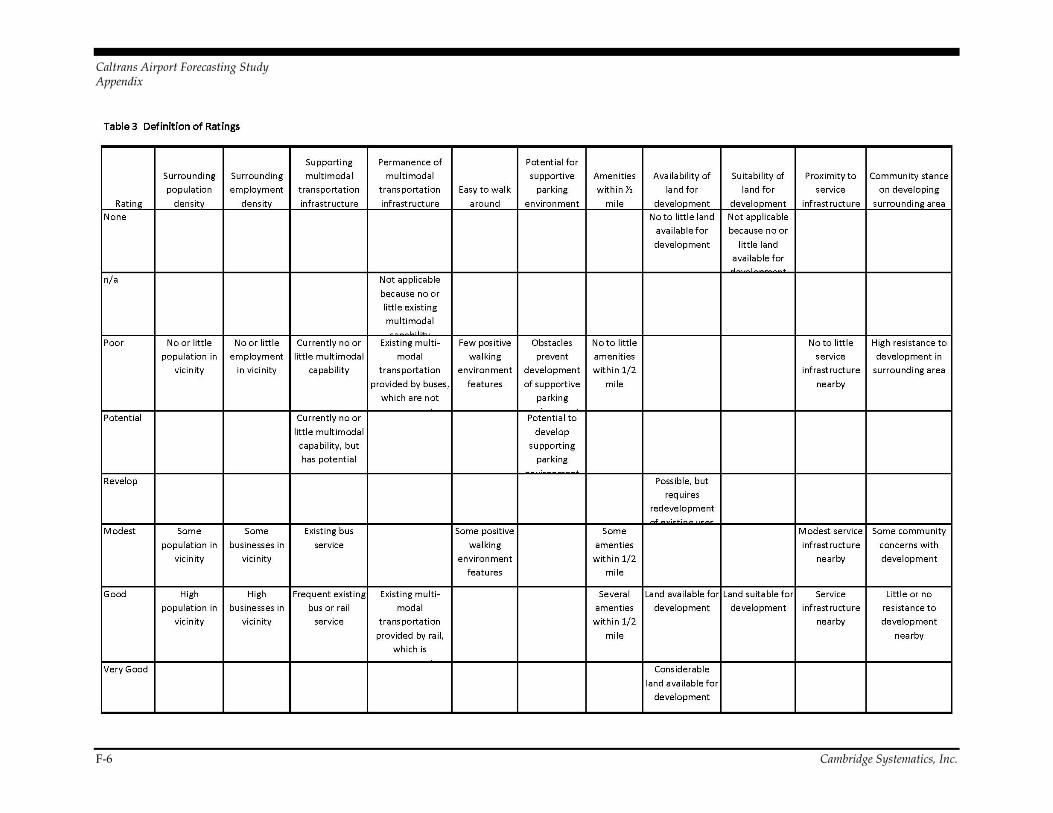
Caltrans Airport Forecasting Study Appendix
F-6 Cambridge Systematics, Inc.

Caltrans Airport Forecasting Study Appendix
Cambridge Systematics, Inc. F-7

Caltrans Airport Forecasting Study Appendix
F-8 Cambridge Systematics, Inc.

Caltrans Airport Forecasting Study References
Cambridge Systematics, Inc. F-9
Appendix 2 : Multimodal Transportation at Airports
The following are notes on multimodal transportation at the airports in Table 8 with score of two or greater.
Santa Monica Big Blue Bus, fairly frequent
Van Nuys FlyAway bus
Fresno Yosemite International Two FAX routes, each every 30 min
McClellan-Palomar Existing NCTD bus
Gillespie Field Green Line LRT at the corner of airport, somewhat removed from existing development
Santa Maria Existing SMAT bus