fpa capital fund - valuewalk · fpa capital fund first quarter 2015 commentary you should consider...
TRANSCRIPT

FPA Capital Fund
First Quarter 2015 Commentary
You should consider the Fund’s investment objectives, risks, and charges and expenses carefully before you
invest. The Prospectus details the Fund's objective and policies, charges, and other matters of interest to the
prospective investor. Please read this Prospectus carefully before investing. The Prospectus may be
obtained by visiting the website at www.fpafunds.com, by email at [email protected], toll-free by calling 1-
800-982-4372 or by contacting the Fund in writing.
Average Annual Total Returns
As of March 31, 2015
Fund/Index MTD YTD 1 Year 3 Years** 5 Years** 10 Years** 15 Years** 20 Years** Since 7/11/84**
FPA Capital -3.53 % -4.92 % -11.49 % 5.23 % 8.37 % 6.53 % 9.00 % 11.65 % 14.11 %
Russell 2500 1.33 % 5.17 % 10.07 % 17.13 % 15.48 % 9.62 % 8.26 % 11.09 % 12.00 %
** Annualized. Inception for FPA Management was July 11, 1984. A redemption fee of 2.00% will be imposed on redemptions within 90 days. Expense ratio calculated as of the date of the most recent prospectus is 0.83%.
Past performance is no guarantee of future results and current performance may be higher or lower than the
performance shown. This data represents past performance and investors should understand that
investment returns and principal values fluctuate, so that when you redeem your investment it may be worth
more or less than its original cost. Current month-end performance data may be obtained by calling toll-free,
1-800-982-4372.
To view portfolio holdings from the most recent quarter end, please refer to the end of this document or at
www.fpafunds.com.
Portfolio composition will change due to ongoing management of the fund. References to individual securities are for informational purposes only and should not be construed as recommendations by the Funds, Advisor or Distributor.
The views expressed and any forward-looking statements are as of the date of the publication and are those of the
portfolio managers and/or the Advisor. Future events or results may vary significantly from those expressed and are
subject to change at any time in response to changing circumstances and industry developments. This information
and data has been prepared from sources believed reliable. The accuracy and completeness of the information
cannot be guaranteed and is not a complete summary or statement of all available data.
The Russell 2500 Index consist of the 2,500 smallest companies in the Russell 3000 total capitalization universe
offers investors access to the small to mid-cap segment of the U.S. equity universe, commonly referred to as "smid"
cap. The Russell 2500 Value Index measures the performance of those Russell 2500 companies with lower price-to-
book-ratios and lower forecasted growth values.
Indices are unmanaged and investors cannot invest directly in an index. These indices do not reflect any
commissions or fees which would be incurred by an investor purchasing the stocks they represent. The performance
of the Fund and of the Averages is computed on a total return basis which includes reinvestment of all distributions.
S&P 500 Index includes a representative sample of 500 leading companies in leading industries of the U.S. economy.
The index focuses on the large-cap segment of the market, with over 80% coverage of U.S. equities, but is also
considered a proxy for the total market.

FPA Capital Fund
First Quarter 2015 Commentary
Fund Risks
Investments in mutual funds carry risks and investors may lose principal value. Stock markets are volatile and can decline significantly in response to adverse issuer, political, regulatory, market, or economic developments. The Fund may purchase foreign securities, including American Depository Receipts (ADRs) and other depository receipts, which are subject to interest rate, currency exchange rate, economic and political risks; this may be enhanced when investing in emerging markets. Small and mid cap stocks involve greater risks and they can fluctuate in price more than larger company stocks. Groups of stocks, such as value and growth, go in and out of favor which may cause certain funds to underperform other equity funds.
The FPA Funds are distributed by UMB Distribution Services, LLC, 235 W Galena Avenue, Milwaukee, WI 53212.

FPA Capital Fund
First Quarter 2015 Commentary Introduction Our Fellow Investors, There’s no easy way to put this, but the FPA Capital Fund got off to a poor start this year. We underperformed our benchmark by about 10% in the first quarter of 2015; notching a 4.92% loss, while the Russell 2500, our benchmark, recorded a 5.17% gain. While we are disappointed with our short-term results, we believe the investment process and philosophy that helped us deliver 14.11% outperformance over the last 30 years will allow us to achieve our stated goals, again, if we stay true to it. And that’s exactly what we intend to do. As we considered our performance this past quarter, we’re reminded of a simple truism from a 2006 Howard Marks memo, Dare to Be Great, “You can’t take the same actions as everyone else and expect to outperform.” It’s as true as it is obvious and that’s why our portfolio looks radically different than the benchmark we track. We are significantly more concentrated; we hold a high cash balance; and our companies tend to be higher quality, have better balance sheets, and are less expensive than the market average. We believe these differences have been key to our success historically and will ultimately drive our performance over the long run. But over the short run, these differences could drive periods of underperformance like we saw last quarter. In this quarterly letter, we will discuss and analyze what drove the market’s performance and talk about some specific components that impacted our results. Market Commentary Do investors know what they own (aka how did the market do?) Do the current market prices depict the fundamentals? After a lackluster start to the year, stock prices shot up in February. By the middle month of the first quarter 2015, the Russell 2500 index had increased by 3.79% and the S&P 500 index was up 2.57%. Based on the stock market’s strength, one might think that February was a great month for the US economy. The financial blog ZeroHedge compiled a list of all the macro data announcements during that month1: 38 readings were below expectations (personal spending, construction spending, ADP employment, retail sales, non-farm productivity to name a few) and only six were above expectations. By quarter’s end, the Russell 2500 was up 5.17% and S&P 500 was up 0.95%. CEO’s were bearish on their companies’ prospects but bullish on their stocks. According to an analysis by Bespoke, the delta2 between companies that are cutting profit forecasts versus those who are increasing guidance is at a six-year high. Bloomberg’s analysis of such guidance predicts a 2.1% year-over-year EPS decline in the S&P 500 for Q1’15 and a 1.1% decline in Q2’15 – compare that to the expectations at the end of 2014 for 3.3% growth for both the first and second quarters of 20153. Despite that, companies went ahead full steam with buybacks. In 2014, companies in the S&P 500 bought back $550 billion worth of stock and Russell 2000 companies repurchased $23 billion worth – the highest figure since 20074. The pace
1 http://www.zerohedge.com/news/2015-02-27/stocks-head-best-month-oct-2011-us-macro-crashes-12-month-lows
2 Delta refers to the change, or spread.
3 http://www.bloomberg.com/news/articles/2015-01-30/american-ceos-most-bearish-on-earnings-since-2008-crisis
4 Barron’s – 03/29/15
1

accelerated in 2015 with companies announcing $104 billion of purchases in February alone, bringing the total to around $2 trillion since 20095. At the end of the first quarter, the Russell 2500 was trading at 28.6x (based on trailing twelve months earnings, TTM) with the S&P 500 Index trading at 19.8x (TTM). Just like the dot-com era of the late 1990’s, today we believe many people are simply unaware of the individual stocks moving different indices. We wonder whether the investors that are pouring money in to the market are similarly complacent this time around. Morningstar published an article at the end of this quarter and stated that the mutual fund “at the nexus of both performance and trends” in the US during the first quarter of 2015 was a small cap growth fund with 56 positions, 25% of which had negative net income in the past 12 months. The top performing stocks came from biotechnology, life sciences, and pharmaceuticals. We briefly looked at the components of the Russell 2500 index to see what has moved these small and mid-cap stocks. At the end of the first quarter, there were 140 companies in the index that experienced price increases of over 30% (yes, in one quarter). The increases ranged from 32% (a company that is trading at 177x price to sales and -40% return on equity) to 155% (a company that is trading at 16x price to sales and -60% return on equity). A detailed look at these 140 companies showed that 71 of them had negative earnings, only two of the top 15 performers were profitable and 65 of them were either a pharmaceutical, biotech, healthcare equipment, healthcare provider or a life sciences company with only one of the top 15 performers not belonging to one of these groups. If you think that 2014 was simply one down year among many profitable for these companies, you would be mistaken – only 65 of the 140 companies have positive five-year cumulative net income. 35% of Russell 2500’s first quarter performance came from one of these groups6. What is an absolute value manager (yours truly) to do when markets are expensive and risky strategies are outperforming conservative ones? Many believe that what goes up will continue to go up and keep pouring money into the markets despite ever-increasing valuations. Should the markets turn, as they have done in all cycles past, many will get scared – particularly those who do not really know what they own (i.e. index investors) - and start selling (some will be forced to sell for liquidity reasons). Buying high and selling low has been a key reason that many investors’ returns have not kept up with the market over long periods. No wonder the annualized returns for the average equity fund investor over the past 20 years was 5.0% vs. 9.2% for S&P 5007. The US is not the only place we see these excesses. Let’s look at Europe, where about $2 trillion of sovereign debt offers negative yields. Was it not just a short while ago when Italy and Portugal were deemed to be in dire straits? Today, they can borrow at 1.2% and 1.6%, respectively, and no, not for one year paper, but ten. We have seen this movie before. The people that see all news as good news will point to the NASDAQ index hitting an all-time high figure in Q1’15. We would remind them that it took about 15 years to reclaim that territory. For those, who believe that a picture is worth more than 1,000 words, here is an indicator that Warren Buffett has talked about before8:
5 http://www.bloomberg.com/news/articles/2015-03-03/company-cash-bathes-stocks-as-monthly-buybacks-set-record. Please note
numbers in aforementioned paragraph are estimates. 6 Please note numbers in aforementioned paragraph are estimates.
7 http://grandwealth.com/files/DALBAR%20QAIB%202014.pdf
8 http://www.advisorperspectives.com/dshort/updates/Market-Cap-to-GDP.php
2

Portfolio Commentary It is always the darkest before dawn (aka how did we do?)
The short answer is we did poorly. Our portfolio was down 4.92%. The longer answer is we did not stray away from our philosophy and remain confident about the names in the portfolio: our companies are still quality companies and their balance sheets are still sound. What has changed is that the underlying value of our portfolio has become more attractive, now trading at 13x trailing twelve month earnings. This is not the first time we underperformed and it certainly will not be the last time. We strive to provide robust returns over full market cycles not just when the market goes up9. The Russell 2500 index appreciated every year since 2009 with the exception of a small loss in 2011. This period is not a market cycle but simply the “up” portion of it. Looking back, we underperformed the Russell 2500 index by almost 22% in the two years leading up to the March 2000 peak and by around 17% leading up to the 2007 peak10. We made up for that loss (and more) during the next two years, in each respective cycle (see charts below),because we did not stray away from our philosophy, were confident about the names in the portfolio and were able to deploy capital when others were either afraid or did not have the liquidity or both11.
9 Market Cycle Performance reflects two most recent market cycles (peak to peak) defined as a period that contains a decline of at
least 15% from the previous market peak over at least a two-month period and a rebound to establish a new peak above the previous one by S&P 500 Index.
10 Market peak 2000 was March 24, 2000 and market peak 2007 was October 9, 2007.
11 No market cycle performance data is provided for any period after 2009, because a full market cycle subsequent to 2009 has not
yet been defined. There is no assurance that any market cycle performance for any future period will have characteristics or results similar to the periods depicted in the two tables above, or that FPA will have performance results similar in any way to the periods reflected in the two tables. Dennis Bryan and Arik Ahitov have been co-portfolio managers in this strategy since November 2007
Contributors Detractors
Cimarex Energy Apollo Group
SM Energy DeVry
Centene Corporation Rowan
Helmerich & Payne Western Digital
Trinity Industries Rosetta Resources
3

Our long-term investors know that we look at our returns over rolling five-year periods because our goal has never been to perform well in any single calendar year but, rather, to do well over long time periods. The 5-year cumulative average return since inception was about 103% for our Fund vs. approximately 73% for S&P 500, and about 73% for Russell 2500. Factors impacting the Portfolio: Cash It is hard to keep up with a rising market when one has a disciplined absolute value investment approach. Our cash level has averaged approximately 30% since the beginning of 2012 with the Russell 2500 up about 20% on an annualized basis from the beginning of 2012 to the end of 2014. Approximately 30% of the portfolio earned 0% when the index increased by roughly 20% on an annualized basis. Why has our cash level been so high? Cash increases because we are, either, having a hard time identifying companies to include in the portfolio, or because we believe that “Mr. Market” is paying such high prices that we feel obligated to sell all or part of our positions given that the respective reward to risk ratio warrants this action. Or a combination of the two. We now address these possibilities:
What do we buy? We invest in in market leading companies that are profitable, have strong balance sheets, and are run by good management teams. Once we put these companies through a rigorous research process, we wait for them to get cheap. If not enough companies survive this process, we will not stretch the criteria just to put more names into the portfolio.
What do we sell? We sell when we make a mistake, when the investment thesis changes or when the valuation warrants us to do so.
What have we been doing? Our average holding period is 7 years and we hold
approximately 30 stocks in the portfolio so over the long-term we should average four
new names a year. Over the past 3 years, we put 11 new names into the portfolio
despite Russell 2500’s ever-increasing price to earnings ratio so the main cause of the
high cash balance was not that we failed to identify new investment ideas but, rather, the
and February 2014, respectively, and manage the strategy in a manner that is substantially similar to the prior portfolio manager, Robert Rodriguez. Mr. Rodriguez ceased serving as the strategy’s portfolio manager effective December 2010.
4

team’s decision to take advantage of these high valuations to harvest part of our gains,
husband our cash and wait for true bargains12. Today, we have dozens of companies in
our pipeline that are thoroughly researched with complete write-ups. We call this our
research inventory. These companies meet all our criteria but price. Bad businesses do
not often become good but good companies do become cheap. When the price is right,
we will be ready to act swiftly and commit money to these names. If not, we do not feel
the need to commit capital to marginal companies or expensive companies. The
resulting portfolio will only have our highest conviction ideas regardless of their industry
and our goal is to find companies that will stay in our portfolio for a long time. Our cash
percentage, at the end of Q1’15 was about 25%. A year ago, at the end of Q1’14, cash
was approximately at 31% of the portfolio. That percentage came down despite the fact
that we eliminated 7 positions and trimmed 12 others.
Energy Stocks We keep asking ourselves what we have missed. There were a few things:
1. We clearly failed to anticipate that oil prices could fall into the $40s in the absence of a macroeconomic shock to demand. Our premise was that prices would be anchored within a reasonable range around the fully-loaded marginal cost of supply, which we believed to be $80/bbl to $85/bbl. There has been a perfect storm of events. Since late 2013 it has become clear that many US shale producers were able to bring down their fully loaded costs. Meanwhile, Saudi Arabia decided to apply pressure to high cost producers around the world and drive them off the supply curve. Finally (in the last quarter of 2014), U.S. producers continued to drill and complete wells at an aggressive pace in spite of falling oil prices because they had already budgeted the capital and because they were well hedged in the short-term at high prices. Importantly, while we failed to anticipate the massive decline in oil prices to current levels, as long as spot prices experienced in Q1’15 are not permanent, the intrinsic value of our holdings will have fallen far less than the ~60% peak to trough drawdown in spot prices. This is perhaps best illustrated through the lens of one of our E&P companies. Rosetta Resources had over 1 billion barrels of oil equivalent resources at December 31, 2014, but only expects to produce 21.9 million barrels of oil equivalents in 2015, or 2.1% of their total resource base. What matters is the price of oil over an extended period of time, not just in a given year.
2. At the same time, the US Dollar has appreciated considerably against many currencies, which has further pressured the price of oil.
3. We also missed the non-economic reason. There are geopolitical implications of a low oil price. Perhaps Saudi Arabia decided to send a message to Iran and Russia for behaving poorly and jeopardizing the stability of the Kingdom.
The next obvious question is, “What will be the depth and duration of this weakness?” In the short-run the lower bound is set by cash variable production costs. There is a substantial amount of production that would become cash negative if prices fall much further (400,000 bbl/d at $45 and more than 5.5 million bbl/d at $30). U.S. shale capital expenditures are being ratcheted back to such an extent that production exit rates by the end of 2015 will actually be lower than they were at the end of 2014. If this level of reduced investment continues into 2016,
12
Price to Earnings ratio (P/E) is the price of a stock divided by its earnings per share. 5

shale production will begin to fall even faster due to the extremely high first year decline rates of shale wells, which often produce 50% to 80% less in their second year than they did in the first year. In other words, the source of recent production growth will naturally go into reverse much faster than sources of new supply in prior cycles. The supply outlook outside of the US is not much better with low prices. According to Schlumberger’s CEO, upstream capital expenditures will decline 10% to 15% internationally in 2015. He further believes that the industry will need to replace a third of 2014 global production by 202013. Moreover, Saudi Arabia holds the only meaningful amount of global spare capacity. They have approximately 2 million barrels which is not a big margin of safety. The mismatch between supply and demand is not that great; maybe 0.5 – 2.0 million barrels per day compared to approximately 90mm barrels of global daily production. Small cap E&P companies are truly out of favor but we believe we have the right companies. In our opinion, oil prices are likely to migrate back towards the fully loaded cost of marginal supply. Therefore, we believe that the current conditions present an opportunity, which is why we have been buying – recognizing that oil prices will not move up in a straight line. An example of a stock that has performed poorly but should weather the storm includes Rosetta Resources, which has publicly stated that its breakeven oil prices at the wellhead are $30 in the Eagle Ford basin and $45 in the Permian basin. Another example is SM Energy, whose Eagle Ford acreage happens to surround Rosetta’s. Our third E&P investment is in Cimarex Energy. All of their core assets are first class, but their 100,000 net acre joint development agreement area in Culberson County, Texas with Chevron is possibly the single best unconventional oil asset in the entire country. Investors are acutely focused on whether capital budget reductions by domestic independent producers will be enough to reign in supply and rebalance the market, but it is not clear to us that investors are paying attention to all the problems in Russia, Nigeria, and Venezuela, any one of which can have a meaningful negative impact to the oil supply picture. Moreover, Simmons & Co. estimates 2.8 million barrels per day supply from major international and offshore projects have already been deferred or cancelled, with another 2.2 million barrels per day expected to come online in 2018-2020 that have yet to be sanctioned14. Yes, U.S. oil shale supply has been strong and we are running out of aboveground storage capacity but industry-wide production is peaking as we are writing this letter. The continued robust supply is the outcome of substantial investments made in 2013 and 2014 but the days of heavy investments have come to an abrupt end. The industry is taking all the right steps. Companies are cutting their capital expenditure budgets significantly and the Baker Hughes oil-directed US land rig count is down roughly 50% since the OPEC meeting last Thanksgiving Day (yes, the announcement came when many in the US were watching football and quite a few investors did not have much appetite to eat turkey after hearing about it).
13
Company presentation – 03/23/15
14 Simmons – 03/12/15
6
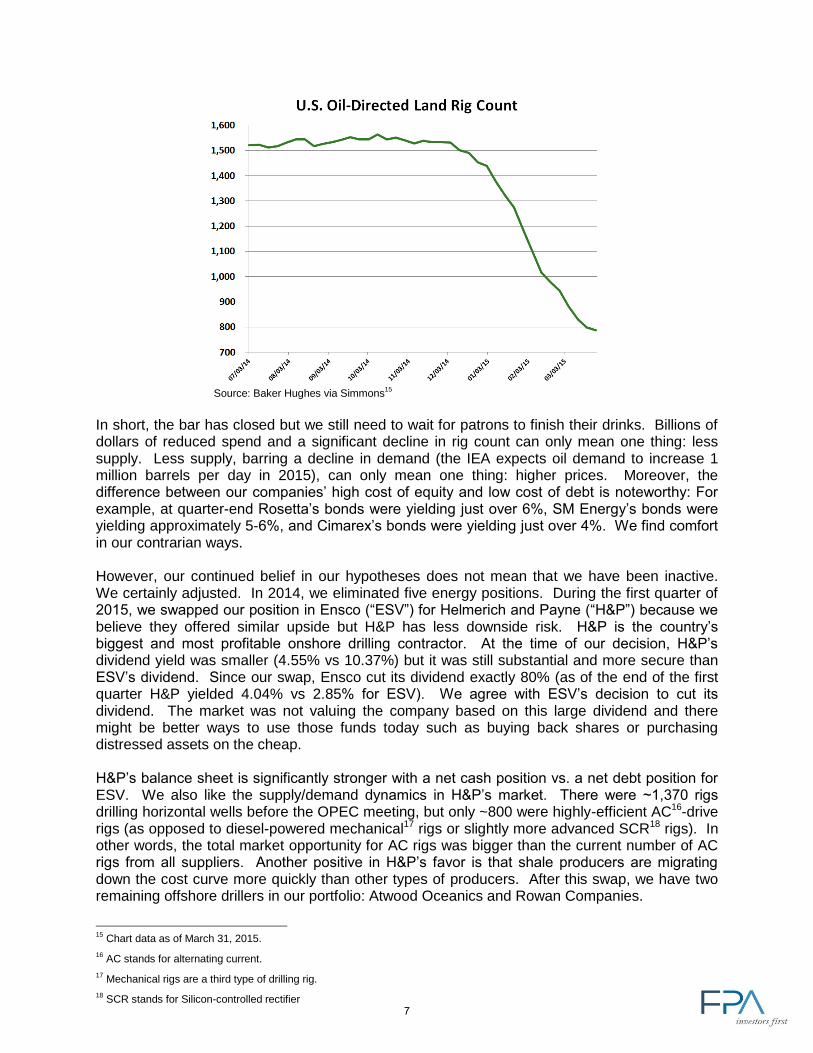
Source: Baker Hughes via Simmons
15
In short, the bar has closed but we still need to wait for patrons to finish their drinks. Billions of dollars of reduced spend and a significant decline in rig count can only mean one thing: less supply. Less supply, barring a decline in demand (the IEA expects oil demand to increase 1 million barrels per day in 2015), can only mean one thing: higher prices. Moreover, the difference between our companies’ high cost of equity and low cost of debt is noteworthy: For example, at quarter-end Rosetta’s bonds were yielding just over 6%, SM Energy’s bonds were yielding approximately 5-6%, and Cimarex’s bonds were yielding just over 4%. We find comfort in our contrarian ways. However, our continued belief in our hypotheses does not mean that we have been inactive. We certainly adjusted. In 2014, we eliminated five energy positions. During the first quarter of 2015, we swapped our position in Ensco (“ESV”) for Helmerich and Payne (“H&P”) because we believe they offered similar upside but H&P has less downside risk. H&P is the country’s biggest and most profitable onshore drilling contractor. At the time of our decision, H&P’s dividend yield was smaller (4.55% vs 10.37%) but it was still substantial and more secure than ESV’s dividend. Since our swap, Ensco cut its dividend exactly 80% (as of the end of the first quarter H&P yielded 4.04% vs 2.85% for ESV). We agree with ESV’s decision to cut its dividend. The market was not valuing the company based on this large dividend and there might be better ways to use those funds today such as buying back shares or purchasing distressed assets on the cheap. H&P’s balance sheet is significantly stronger with a net cash position vs. a net debt position for ESV. We also like the supply/demand dynamics in H&P’s market. There were ~1,370 rigs drilling horizontal wells before the OPEC meeting, but only ~800 were highly-efficient AC16-drive rigs (as opposed to diesel-powered mechanical17 rigs or slightly more advanced SCR18 rigs). In other words, the total market opportunity for AC rigs was bigger than the current number of AC rigs from all suppliers. Another positive in H&P’s favor is that shale producers are migrating down the cost curve more quickly than other types of producers. After this swap, we have two remaining offshore drillers in our portfolio: Atwood Oceanics and Rowan Companies.
15
Chart data as of March 31, 2015.
16 AC stands for alternating current.
17 Mechanical rigs are a third type of drilling rig.
18 SCR stands for Silicon-controlled rectifier
7

As we have expected, the market – after selling off energy names indiscriminately – has started sifting through the carnage to identify the long-term survivors. Three of the Fund’s top five contributors for the quarter were energy stocks. Needless to say, no one can predict exactly what the price of oil will be tomorrow (or five years from now). We discussed, in great detail, why we believe the supply/demand dynamics should result in higher prices over the long term. That said, even if oil were to settle at around a low level that we do not foresee as the long term price (e.g., $60 per barrel), we believe our energy holdings still represent compelling opportunities at their current share prices. For-profit Education Apollo (APOL) and DeVry (DV) were both poor performers in the quarter. There is no other way to say it, the second quarter numbers for Apollo were very disappointing – particularly the enrollment numbers. APOL has spent a lot of money on a new Learning Management System (LMS) for all University of Phoenix (UoP) students. This was a massive endeavor on the company’s part and will lead to a large differentiation experience for their students versus the competition. Unfortunately, like many new large software rollouts, the LMS rollout had a couple of bugs that needed to be fixed. For example, if your internet browser was updated to a new version, some of the automation links within LMS were not properly coded and the user experience diminished to the point where some students dropped out of the university. APOL believes the majority of the problems have been addressed and fixed, but management took its eye off the ball with respect to converting prospective students to new enrollees during the past quarter. Management indicated that they are now seeing an improvement in enrollments, but it is still very early in their fiscal third quarter to know for sure whether they have adequately addressed the problems. We are clearly focused on the U.S. business. However, it is important to note that the company’s global operations are in the process of turning around and will likely be generating positive operating cash flow in the second half of this year. With over $6 of net cash per share on the balance sheet and prospects to generate additional free cash flow for the remainder of the year, APOL has the resources to overcome these missteps and get back on track. For your reference, we bought most of our APOL stock between $16 and $19 per share and made it around a 3% position at around $20. When the stock hit $34, we sold over 25% of our position. The stock price is back to $20 and we are back to about a 3% position. What else do we own? Today, roughly, 25% of the portfolio is in cash, 25% in energy, 25% in technology, and 25% in everything else. We already discussed cash and energy in detail. A quick note on our technology investments might be useful. It is not common to see a deep value investor with such a high weighting in technology. FPA Capital has been investing in technology for decades. We have directed our attention to companies that would benefit from greater use of technology rather than to companies that are trail blazers. We do not know which companies will win in the fast changing technology race but we believe that technology will continue to play an integral role in our lives. Whatever the technology, it will have to be distributed and serviced. Therefore, we own Arrow and Avnet. Consumers will continue to demand faster bandwidth, more HD channels, and a better set top box experience (Arris). They will use handheld devices (InterDigital) and decorate their environments with LEDs (Veeco). Governments will run large public transportation systems and use technology to train their armed forces (Cubic). Companies and consumers will generate and store more data every day (Western Digital). The common thread of these companies is their leadership positions in their respective niches.
8

Conclusion Our collective capital. Investors do not need an active money manager when the market is going up. Unfortunately, no one will call investors right before the market takes a turn down. We are absolute value investors and what has distinguished us over the years has been our performance during down markets.
Your portfolio managers have meaningful portions of their wealth alongside you. We remain excited about the companies in our portfolio and have added to our investments. We thank you for your continued trust and confidence in our strategy. Respectfully submitted, Dennis Bryan Portfolio Manager
Arik Ahitov Portfolio Manager April 13, 2015
9

CUSIP TICKER
SHARES /
PRINCIPAL SECURITY MKT PRICE ($) MKT VALUE ($)
% OF NET
ASSET
VALUE
002535300 AAN 851,096 AARON'S INC 28.31 24,094,527.76$ 2.24%
001084102 AGCO 524,600 AGCO CORPORATION 47.64 24,991,944.00 2.32%
037604105 APOL 1,670,200 APOLLO GROUP INC.- CLASS A 18.92 31,600,184.00 2.93%
04269Q100 ARRS 2,269,163 ARRIS GROUP 28.895 65,567,464.89 6.09%
042735100 ARW 788,800 ARROW ELECTRONICS 61.15 48,235,120.00 4.48%
050095108 ATW 1,065,100 ATWOOD OCEANICS 28.11 29,939,961.00 2.78%
053807103 AVT 1,320,100 AVNET 44.5 58,744,450.00 5.46%
05615F102 BWC 711,400 BABCOCK & WILCOX CO. 32.09 22,828,826.00 2.12%
15135B101 CNC 121,200 CENTENE CORPORATION 70.69 8,567,628.00 0.80%
171798101 XEC 520,000 CIMAREX ENERGY 115.09 59,846,800.00 5.56%
229669106 CUB 272,700 CUBIC CORPORATION 51.77 14,117,679.00 1.31%
235825205 DAN 788,000 DANA HOLDING CORP 21.16 16,674,080.00 1.55%
251893103 DV 1,147,408 DEVRY, INC. 33.36 38,277,530.88 3.56%
314211103 FII 366,043 FEDERATED INVESTORS INC- CLASS B 33.89 12,405,197.27 1.15%
344849104 FL 286,600 FOOT LOCKER 63.00 18,055,800.00 1.68%
423452101 HP 651,635 HELMERICH + PAYNE 68.07 44,356,794.45 4.12%
45867G101 IDCC 954,700 INTERDIGITAL, INC. 50.74 48,441,478.00 4.50%
688239201 OSK 532,600 OSHKOSH TRUCK CORPORATION 48.79 25,985,554.00 2.41%
OTHER 7,922,987.50 0.73%
759509102 RS 186,608 RELIANCE STEEL & ALUMINIUM 61.08 11,398,016.64 1.06%
777779307 ROSE 2,565,802 ROSETTA RESOURCES 17.02 43,669,950.04 4.06%
779382100 RDC 2,759,300 ROWAN COMPANIES 17.71 48,867,203.00 4.54%
78454L100 SM 516,591 SM ENERGY COMPANY 51.68 26,697,422.88 2.48%
896522109 TRN 427,500 TRINITY INDUSTRIES 35.51 15,180,525.00 1.41%
922417100 VECO 241,700 VEECO 30.55 7,383,935.00 0.69%
958102105 WDC 573,500 WESTERN DIGITAL 91.01 52,194,235.00 4.85%
TOTAL EQUITIES: 806,045,294.31$ 74.88%
912796FE4 85,000,000 US TREASURY BILL 04/23/2015 100.00 84,999,413.50 7.90%
912828VU1 85,000,000 US TREASURY NOTE 08/31/2015 100.11 85,096,288.00 7.91%
TOTAL US GOVT AND AGENCIES: 170,095,701.50$ 15.80%
CASH & EQUIVALENTS (NET OF LIABILITIES): 100,332,688.87$ 9.32%
TOTAL NET ASSETS: 1,076,473,684.68$ 100.00%
NO. OF EQUITY POSITIONS 25
Portfolio Holding Submission Disclosure
FPA Capital Fund, Inc. Portfolio Holdings
3/31/15
10

Except for certain publicly available information incorporated herein, the information contained in these materials is our confidential and proprietary information
and is being submitted to you for your confidential use with the express understanding that, without our prior written permission, you will not release these
materials or discuss the information contained herein or make reproductions of or use these materials for any purpose other than evaluating a potential advisory
relationship with First Pacific Advisors.
You should consider the Fund’s investment objectives, risks, and charges and expenses carefully before you invest. The Prospectus details the Fund's objective
and policies, sales charges, and other matters of interest to the prospective investor. Please read this Prospectus carefully before investing. The Prospectus
may be obtained by visiting the website at www.fpafunds.com, by email at [email protected], toll-free by calling 1-800-982-4372 or by contacting the Fund in
writing.
Investments in mutual funds carry risks and investors may lose principal value. Stock markets are volatile and can decline significantly in response to adverse
issuer, political, regulatory, market, or economic developments. The Fund may purchase foreign securities including American Depository Receipts (ADRs) and
other depository receipts, which are subject to interest rate, currency exchange rate, economic and political risks; this may be enhanced when investing in
emerging markets. Small and mid- cap stocks involve greater risks and they can fluctuate in price more than larger company stocks. Groups of stocks, such as value
and growth, go in and out of favor which may cause certain funds to underperform other equity funds.
Portfolio composition will change due to ongoing management of the fund. References to individual securities are for informational purposes only and should not
be construed as recommendations by the Funds, Advisor or Distributor.
The FPA Funds are distributed by UMB Distribution Services, LLC, 235 W. Galena Street, Milwaukee, WI, 53212.
11