fourth quarter & fiscal year 2020 results
TRANSCRIPT

© 2020 Western Digital Corporation or its affiliates. All rights reserved.
Fourth Quarter & Fiscal Year 2020 Results
August 5, 2020
investor.wdc.com

©2020 Western Digital Corporation or its affiliates. All rights reserved. 2
Forward-Looking StatementsSafe Harbor | Disclaimers
This presentation contains forward-looking statements that involve risks and uncertainties, including, but not limited to, the company’s preliminary financial results for its fiscal fourth quarter ended July 3, 2020; the company’s business outlook for the fiscal first quarter of 2021; expectations regarding the impact of COVID-19; demand trends and market conditions; the company's product portfolio; the data storage ecosystem; the company’s strategic priorities; capital expenditure trends; capital allocation priorities; and expected future financial performance. Forward-looking statements should not be read as a guarantee of future performance or results, and will not necessarily be accurate indications of the times at, or by, which such performance or results will be achieved, if at all. Forward-looking statements are subject to risks and uncertainties that could cause actual performance or results to differ materially from those expressed in or suggested by the forward-looking statements.
Key risks and uncertainties include future responses to and effects of the COVID-19 pandemic; volatility in global economic conditions; business conditions and growth in the storage ecosystem; impact of restructuring activities and cost saving initiatives; impact of competitive products and pricing; market acceptance and cost of commodity materials and specialized product components; actions by competitors; unexpected advances in competing technologies; our development and introduction of products based on new technologies and expansion into new data storage markets; risks associated with acquisitions, divestitures, mergers and joint ventures; difficulties or delays in manufacturing; the outcome of legal proceedings; and other risks and uncertainties listed in the company’s filings with the Securities and Exchange Commission (the “SEC”) and available on the SEC’s website at www.sec.gov, including our most recently filed periodic report, to which your attention is directed. We do not undertake any obligation to publicly update or revise any forward-looking statement, whether as a result of new information, future developments or otherwise, except as required by law.
This presentation includes references to non-GAAP financial measures. Reconciliations of the differences between the non-GAAP measures provided in this presentation to the comparable GAAP financial measures are included in the appendix and in the Investor Relations section of our website. We have not fully reconciled our non-GAAP financial measure guidance to the most directly comparable GAAP measures because material items that impact these measures are not in our control and/or cannot be reasonably predicted. Accordingly, a full reconciliation of the non-GAAP financial measure guidance to the corresponding GAAP measures is not available without unreasonable effort.

©2020 Western Digital Corporation or its affiliates. All rights reserved. 3
Technology Innovation
Fiscal Year 2020 In Review
• Announced BiCS5, next generation 3D NAND with 112-layer technology; capital efficient node providing 40% more bits per wafer versus prior generation
• First in the industry to ship energy-assisted drives for mass production, including our 16- and 18-terabyte CMR drives and a 20-terabyte SMR drive
Financial Strategic and Operational
• Revenue totaled $16.7 billion
• Non-GAAP EPS of $3.04
• Generated operating cash flow of $824 million and free cash flow of $1.1 billion
• Total debt repayment of $982 million
• Returned $595 million in dividends to shareholders
• Focused on reducing debt; announced dividend suspension at Q3 earnings to support these efforts
• David Goeckeler announced as our new Chief Executive Officer in March 2020
• Managed COVID-19 impacts by taking action to protect health and safety of employees and deliver high-quality products to customers
• Designated as one of the 2020 World’s Most Ethical Companies by Ethisphere
• Received a perfect score with HRC Foundation’s Corporate Equality Index, recognized by Women’s Choice Award as a Best Company for Millennials and recognized by Avtar as one of the 100 Best Companies for WomenFor reconciliations of GAAP to non-GAAP financial measures, see the Appendix and Quarterly Fact Sheet.

©2020 Western Digital Corporation or its affiliates. All rights reserved. 4
Fourth Quarter 2020 Executive Summary
RESULTS
• Fourth quarter revenue of $4.3 billion, up 18% from the prior year period• Non-GAAP diluted net earnings per share (EPS) of $1.23, includes $96 million in costs
related to COVID-19• Generated operating cash flow of $172 million and free cash flow of $261 million
BUSINESS HIGHLIGHTS
• Flash• Another quarter of record client SSD revenue • Enterprise SSD revenue increased almost 70% sequentially• BiCS5 ramp is going very well with impressive yields
• Hard Drives• Customer interest in our 16- & 18-terabyte drives is very high
• Expect a strong ramp in fiscal second quarter of 2021• Demand for our 14-terabyte drives continues to be strong
For reconciliations of GAAP to non-GAAP financial measures, see the Appendix and Quarterly Fact Sheet.

©2020 Western Digital Corporation or its affiliates. All rights reserved. 5
Revenue Trends
Data Center Devices & Solutions Client SolutionsClient Devices
$-
$ 0.4
$ 0.8
$ 1.2
$ 1.6
$ 2.0
Q4F19 Q1F20 Q2F20 Q3F20 Q4F20
In billions
$-
$ 0.4
$ 0.8
$ 1.2
$ 1.6
$ 2.0
Q4F19 Q1F20 Q2F20 Q3F20 Q4F20
In billions
$-
$ 0.4
$ 0.8
$ 1.2
$ 1.6
$ 2.0
Q4F19 Q1F20 Q2F20 Q3F20 Q4F20
In billions
Revenue
$1.68 billionincreased 11% QoQincreased 32% YoY
Revenue
$1.92 billionincreased 5% QoQincreased 19% YoY
Revenue
$0.69 billiondecreased 16% QoQdecreased 9% YoY

©2020 Western Digital Corporation or its affiliates. All rights reserved. 6
Flash and Hard Drive Metrics
For reconciliations of GAAP to non-GAAP financial measures, see the Appendix.
Flash
Q4F20 Results
• Bit shipments: up 8% sequentially• ASP/Gigabyte: up 1% sequentially
Hard Drive
Q4F20 Results
• Total exabyte shipments: down 2% sequentially• ASP per drive increased to $87 • ~30% capacity enterprise exabyte shipment
growth from the prior year
0%
5%
10%
15%
20%
25%
30%
35%
$-
$ 0.4
$ 0.8
$ 1.2
$ 1.6
$ 2.0
$ 2.4
Q4F19 Q1F20 Q2F20 Q3F20 Q4F20
Revenue Non-GAAP GM %
In billions
0%
5%
10%
15%
20%
25%
30%
35%
$-
$ 0.4
$ 0.8
$ 1.2
$ 1.6
$ 2.0
$ 2.4
Q4F19 Q1F20 Q2F20 Q3F20 Q4F20
Revenue Non-GAAP GM %
In billions
Flash Revenue and Non-GAAP Gross Margin Hard Drive Revenue and Non-GAAP Gross Margin

©2020 Western Digital Corporation or its affiliates. All rights reserved. 7
Non-GAAP Financial Results
Q4F20 Q3F20 Q4F19
Revenue ($M) $ 4,287 $ 4,175 $ 3,634
Gross Margin % 28.9% 27.9% 24.2%
Operating Expenses ($M) $ 713 $ 738 $ 722
Operating Income ($M) $ 527 $ 427 $ 158
Interest and Other Expense, net ($M) $ 73 $ 91 $ 87
EPS $ 1.23 $ 0.85 $ 0.17
Operating Cash Flow ($M) $ 172 $ 142 $ 169
Free Cash Flow ($M) $ 261 $ 176 ($ 179)
QoQ YoY
$ 112 $ 653
1.0 ppt 4.7 ppt
($ 25) ($ 9)
$ 100 $ 369
($ 18) ($ 14)
$ 0.38 $ 1.06
$ 30 $ 3
$ 85 $ 440
For reconciliations of GAAP to non-GAAP financial measures, see the Appendix and Quarterly Fact Sheet.

©2020 Western Digital Corporation or its affiliates. All rights reserved. 8
$172$89
($63)
($150)
$57
Q3F20Cash & CashEquivalents
Operating CashFlow
Cash CapEx DebtRepayment
Dividend Other Q4F20Cash & CashEquivalents
Cash Flow Walk
(1) (3)
($63) Mandatory
1. Cash CapEx includes purchases of property, plant and equipment, net, and the activity related to Flash Ventures, net.2. This was the final dividend payment issued prior to the suspension of the dividend program.3. Other primarily consists of employee stock plans, net.
$3,048$2,943
• Quarterly debt repayment of $63 million
• Strong liquidity position of $5.3 billion, including $2.25 billion undrawn revolver
In millions
(2)

©2020 Western Digital Corporation or its affiliates. All rights reserved. 9
Owns and leases equipment for flash wafer production and R&D line
Purchases wafers from Kioxia at cost under foundry agreements
Sells wafers to Western Digital at cost plus a small markup
Charges expenses to Western Digital (including equipment depreciation and lease expense)
Repays loans for equipment purchases using excess operating cash flow
Co-develops flash (including process technology and memory design) with Kioxia and contributes IP for Flash Ventures’ use
Performs integral manufacturing and R&D functions at Flash Ventures’ manufacturing sites
Purchases Flash Ventures’ wafers at cost plus a small markup
Pays Flash Ventures’ expenses (including equipment depreciation and lease expense)
Funds Flash Ventures’ equipment purchases (via loans, equity and lease guarantees) in excess of Flash Ventures’ operating cash flow
Flash Ventures Framework
Western Digital Flash Ventures49.9% Owned by Western Digital

©2020 Western Digital Corporation or its affiliates. All rights reserved. 10
Capital Expenditure Framework
A. Cash Capital Expenditures includes purchases of property, plant and equipment, net, and notes receivable issuances to Flash Ventures, net.B. Flash Ventures Parent Loans, Flash Ventures Lease Financing, and Flash Ventures Net Operating Cash Flow are comprised only of Western Digital’s portions.C. Flash Ventures Net Operating Cash Flow is primarily generated from equipment depreciation payments.
Cash Capital Expenditures(A)
HDD CapExFlash
Non-Fab CapEx
Flash Ventures Parent Loans(B)
21
Gross Capital Expenditures
3
Flash Ventures Capital Expenditures
FY21F: ~$3.1B
FY21F: ~$1.3B
Flash Ventures Parent Loans(B)
Flash Ventures Lease
Financing(B)
Flash Ventures Net Operating Cash Flow(B)(C)
43 5
HDD CapExFlash
Non-Fab CapEx
Flash Ventures Parent Loans(B)
21 3 Flash Ventures Lease
Financing(B)
Flash Ventures Net Operating Cash Flow(B)(C)
4 5

©2020 Western Digital Corporation or its affiliates. All rights reserved. 11
Gross Capital Expenditure TrendsIn billions
A. FY21F: Gross Capital Expenditures of ~$3.1 billion, of which Cash Capital Expenditures = ~$1.3 billion.B. FY21F: Estimates may not total due to rounding.C. Cash Capital Expenditures includes purchases of property, plant and equipment, net, and the activity related to Flash Ventures, net, and notes receivable issuances to Flash Ventures, net. D. Flash Ventures Net Operating Cash Flow and Flash Ventures Lease Financing are comprised only of Western Digital’s portions.
$ 0.8
$ 1.6 $ 1.4
-$ 0.3
$ 1.3
$ 1.1
$ 1.0 $ 1.6
$ 2.0
$ 1.7
-$ 0.5
$ 0.0
$ 0.5
$ 1.0
$ 1.5
$ 2.0
$ 2.5
$ 3.0
$ 3.5
FY17 FY18 FY19 FY20 FY21FCash CapEx WD portion of: Flash Ventures Cash Flow + Flash Ventures Lease Financing
(C)
(A)(B)
(D)

©2020 Western Digital Corporation or its affiliates. All rights reserved. 12
Capital Allocation Priorities
Higher Priority
Reinvestment in the Company
Shareholder Return
Lower Priority
Reduce Debt
Shareholder return opportunities will be reevaluated(1)
Target 1x – 3.5x Debt-to-EBITDA
Strategically reinvest to continue driving technological innovation
Dividend Program
Share Repurchases
1. Dividend program was suspended as announced on April 30, 2020.

©2020 Western Digital Corporation or its affiliates. All rights reserved. 13
Business OutlookQ1F21 Guidance(1)
GAAP (2) NON-GAAP(2)
Revenue ($B) $3.7 - $3.9 $3.7 - $3.9
Gross Margin 21% - 23% 25% - 27%
Operating Expenses ($M) $820 - $840 $700 - $720
Interest and Other Expense, net ($M) $80 - $90 $70 - $80
Tax Rate N/A 22% - 26% (3)
EPS - Diluted N/A $0.45 - $0.65
Share Count – Diluted (in millions) ~ 304 ~ 304
1. Guidance as shown is as of August 5, 2020.2. Non-GAAP gross margin guidance excludes amortization of acquired intangible assets, stock-based compensation expense, and charges related to cost saving initiatives totaling approximately $150 million to $170 million. The
company’s non-GAAP operating expenses guidance excludes amortization of acquired intangible assets; stock-based compensation expense; employee termination, asset impairment and other charges; and charges related to cost saving initiatives totaling approximately $100 million to $120 million. The company's non-GAAP interest and other expense guidance excludes approximately $10 million of convertible debt activity. In the aggregate, non-GAAP diluted earnings per share guidance excludes these items totaling $260 million to $300 million. The timing and amount of these charges excluded from non-GAAP gross margin, non-GAAP operating expenses, non-GAAP interest and other expense, net and non-GAAP diluted earnings per share cannot be further allocated or quantified with certainty. Additionally, the timing and amount of additional charges the company excludes from its non-GAAP tax rate and non-GAAP diluted earnings per share are dependent on the timing and determination of certain actions and cannot be reasonably predicted. Accordingly, full reconciliations of non-GAAP gross margin, non-GAAP operating expenses, non-GAAP interest and other expense, non-GAAP tax rate and non-GAAP diluted earnings per share to the most directly comparable GAAP financial measures (gross margin, operating expenses, interest and other expense, tax rate and diluted earnings per share, respectively) are not available without unreasonable effort.
3. The non-GAAP tax rates provided are based on a percentage of non-GAAP pre-tax income.

©2020 Western Digital Corporation or its affiliates. All rights reserved. 14
Quarterly Fact SheetIn millions, except Average Selling Price (ASP),percentages, and working capital related metrics Q4F19 Q1F20 Q2F20 Q3F20 Q4F20
REVENUEClient Devices(1) $ 1,606 $ 1,616 $ 1,797 $ 1,831 $ 1,916
Data Center Devices & Solutions(1) 1,273 1,532 1,489 1,523 1,684 Client Solutions(1) 755 892 948 821 687
Total Revenue $ 3,634 $ 4,040 $ 4,234 $ 4,175 $ 4,287EXABYTE METRICS
Q/Q Change in HDD Exabytes Sold(2) 14% 23% (1%) (6%) (2%)Q/Q Change in Flash Exabytes Sold(2) (1%) 9% 24% 7% 8%
Q/Q Change in Total Exabytes Sold(2) 12% 22% 1% (5%) (1%)TECHNOLOGY
HDD Revenue $ 2,128 $ 2,408 $ 2,396 $ 2,114 $ 2,049Flash Revenue $ 1,506 $ 1,632 $ 1,838 $ 2,061 $ 2,238
HDD Non-GAAP Gross Margin(3) 28.1% 28.5% 30.8% 29.3% 27.2%Flash Non-GAAP Gross Margin(3) 18.7% 19.3% 19.5% 26.5% 30.5%Total Non-GAAP Gross Margin(3) 24.2% 24.8% 25.9% 27.9% 28.9%
CASHCash and Cash Equivalents $ 3,455 $ 3,248 $ 3,137 $ 2,943 $ 3,048
CASH FLOWSCash Flows provided by Operating Activities $ 169 $ 253 $ 257 $ 142 $ 172
Purchases of Property, Plant and Equipment, net (38) (145) (160) (127) (215) Activity Related to Flash Ventures, net (310) 186 280 161 304
Free Cash Flow(4) ($ 179) $ 294 $ 377 $ 176 $ 261 WORKING CAPITAL RELATED
Days Sales Outstanding 30 35 38 43 50Days Inventory Outstanding 94 98 86 89 87 Days Payables Outstanding (54) (67) (58) (63) (67)
Cash Conversion Cycle 70 66 66 69 70 FLASH METRICS
Q/Q Change in ASP/Gigabytes(2) (6%) 0% (8%) 5% 1%HDD METRICS
Client Compute Units(5) 12.3 12.9 11.8 9.1 9.4 Non-Compute Units(6) 9.2 8.9 10.3 8.0 6.9
Data Center Units(7) 6.2 7.5 7.1 7.3 6.8Total HDD Units(8) 27.7 29.3 29.2 24.4 23.1
HDD ASP(9) $ 75 $ 81 $ 81 $ 85 $ 87

©2020 Western Digital Corporation or its affiliates. All rights reserved. 15
Quarterly Fact Sheet Footnotes
FORMULAS
Days Sales Outstanding (DSO) = Accounts Receivable / (Revenue / # of days in quarter)Days Inventory Outstanding (DIO) = Inventories / (Cost of Revenue / # of days in quarter)
Days Payables Outstanding (DPO) = Accounts Payable (including Accounts Payable to Related Parties) / (Cost of Revenue / # of days in quarter)
Cash Conversion Cycle = DSO + DIO – DPO
FOOTNOTES
1. Client Devices is comprised of notebook and desktop HDD, consumer electronics HDD, client SSD, embedded, wafer sales and licensing and royalties. Data Center Devices and Solutions is comprised of enterprise HDD, enterprise SSD, data center software, data center solutions and licensing and royalties. Client Solutions is comprised of branded HDD, branded flash, removables and licensing and royalties.
2. Excludes licensing, royalties, and non-memory products. 3. For reconciliations of GAAP to non-GAAP financial measures, see the Appendix.4. Free cash flow is defined as cash flows provided by operating activities less purchases of property, plant and equipment, net of proceeds from sales of property, plant and equipment, and the activity related to Flash Ventures, net. The
company considers free cash flow generated in any period to be a useful indicator of cash that is available for strategic opportunities including, among others, investing in the company's business, making strategic acquisitions, repaying debt and strengthening the balance sheet.
5. Client compute products consist primarily of desktop and notebook HDDs, excluding those sold through retail channels.
6. Non-compute products consist of retail channel and consumer electronics HDDs.7. Data center products consist of enterprise HDDs (high-capacity and performance) and enterprise systems.8. HDD Unit volume excludes data storage systems and media.9. HDD ASP is calculated by dividing HDD revenue by HDD units. Data storage systems are excluded from this calculation, as data storage systems ASP is measured on a per system basis rather than a per drive basis.

©2020 Western Digital Corporation or its affiliates. All rights reserved. 16
Debt Tranches and Interest Rates
Debt Base Rate Maturity Principal Balance Outstanding as of Q4F20 ($M)
Applicable Rates(A)
Convertible Debt Due 2020(B) 0.500% October 15, 2020 $ 35 0.500%
Revolver drawn(C)(D) L+150 February 27, 2023 0 1.666%
Term Loan A-1(D) L+150 February 27, 2023 4,583 2.727%(E)
Term Loan B-4(D) L+175 April 29, 2023 1,693 1.916%
Convertible Debt Due 2024(F) 1.500% February 1, 2024 1,100 1.500%
Sr. Unsecured Notes Due 2026(G) 4.750% February 15, 2026 2,300 4.750%
TOTAL $ 9,711 2.918%(H)
A. All-in applicable rates as of July 3, 2020. Applicable spread for Term Loan A-1 and Revolver over LIBOR based on credit ratings as of July 3, 2020.B. Debt assumed in connection with the acquisition of SanDisk Corporation in May 2016.C. Revolver capacity: $2.25 billion, none of which was drawn as of July 3, 2020.D. Term Loan A-1, Term Loan B-4, and Revolver have a LIBOR floor of 0bps. E. Reflects impact of the interest rate swaps that effectively fix LIBOR on $2 billion of floating-rate debt at 2.60% through February 2023.F. Initial conversion price of $121.91 per share. Notes are callable beginning February 5, 2021.G. Notes are callable beginning November 15, 2025.H. Weighted average interest rate, including impact of interest rate swaps, based on principal balances outstanding as of July 3, 2020.

©2020 Western Digital Corporation or its affiliates. All rights reserved. 17
Credit Agreement Defined Leverage Ratio
1. EBITDA is defined as net income (loss) before income tax expense, interest and other expense, net, and depreciation and amortization.2. Adjusted EBITDA is defined as EBITDA (as defined above), adjusted to exclude certain expenses, gains and losses that the company believes are not indicative of its core operating results or because these exclusions are consistent
with the financial models and estimates published by many analysts who follow the company and its peers. For reconciliations of GAAP to non-GAAP financial measures, see the Appendix.3. Adjusted EBITDA is not intended to reflect measures used under the company’s debt agreements. 4. Total Debt is the total principal balance of debt outstanding as of the end of the applicable trailing 12-month period.5. Other Credit Agreement Adjustments include other income and expenses, special charges and expected future cost savings from cost reduction initiatives as provided under the company’s credit agreement applicable to Term
Loan A-1 and Revolver.6. Credit Agreement Defined Adjusted EBITDA is used to measure financial covenant compliance under the company’s credit agreement applicable to Term Loan A-1 and Revolver.7. Credit Agreement Defined Leverage Ratio is calculated as Total Debt divided by Credit Agreement Defined Adjusted EBITDA and is the Leverage Ratio as defined in the company’s credit agreement for purposes of one of the
financial covenants applicable to Term Loan A-1 and Revolver.
In millions; unaudited; trailing 12 months Q4F19 Q1F20 Q2F20 Q3F20 Q4F20NET INCOME (LOSS) ($ 754) ($ 1,541) ($ 1,193) ($ 595) ($ 250)
Income tax expense 467 434 (35) (110) 204Interest and other expense, net 374 379 374 398 381Depreciation and amortization 1,812 1,738 1,665 1,605 1,566
EBITDA(1) 1,899 1,010 811 1,298 1,901
Stock-based compensation expense 306 304 302 296 308 Employee termination, asset impairment and other charges 166 128 117 49 32Charges related to acquisitions and dispositions 0 5 7 9 9Charges related to cost saving initiatives 22 19 18 16 9Manufacturing underutilization charges 264 264 215 67 0Power outage charges 145 213 213 213 68Other 66 66 57 17 (8)
ADJUSTED EBITDA(2)(3) 2,868 2,009 1,740 1,965 2,319 TOTAL DEBT(4) $ 10,694 $ 10,374 $ 9,986 $ 9,774 $ 9,711 DEBT TO ADJUSTED EBITDA 3.7X 5.2X 5.7X 5.0X 4.2X
Flash Ventures equipment depreciation expenses 1,017 1,054 1,040 997 977Other Credit Agreement Adjustments(5) 728 641 533 265 125
CREDIT AGREEMENT DEFINED ADJUSTED EBITDA(6) $ 4,613 $ 3,704 $ 3,313 $ 3,227 $ 3,421 TOTAL DEBT(4) $ 10,694 $ 10,374 $ 9,986 $ 9,774 $ 9,711 CREDIT AGREEMENT DEFINED LEVERAGE RATIO(7) 2.3X 2.8X 3.0X 3.0X 2.8X

©2020 Western Digital Corporation or its affiliates. All rights reserved. 18
Net Income to Adjusted EBITDA Reconciliation
1. EBITDA is defined as net income (loss) before income tax expense, interest and other expense, net, and depreciation and amortization.2. Adjusted EBITDA is defined as EBITDA (as defined above), adjusted to exclude certain expenses, gains and losses that the company believes are not indicative of its core operating results or because these exclusions are consistent
with the financial models and estimates published by many analysts who follow the company and its peers. For reconciliations of GAAP to non-GAAP financial measures, see the Appendix.3. Adjusted EBITDA is not intended to reflect measures used under the company’s debt agreements.
In millions; unaudited Q4F19 Q1F20 Q2F20 Q3F20 Q4F20NET INCOME (LOSS) ($ 197) ($ 276) ($ 139) $ 17 $ 148
Income tax expense (277) 39 99 29 37Interest and other expense, net 93 108 90 107 76Depreciation and amortization 416 406 399 384 377
EBITDA(1) 35 277 449 537 638
Stock-based compensation expense 64 77 77 78 76 Employee termination, asset impairment and other charges 24 8 9 8 7Charges related to acquisitions and dispositions 0 5 2 2 0Charges related to cost saving initiatives 7 1 7 1 0Manufacturing underutilization charges 67 0 0 0 0Power outage charges 145 68 0 0 0Other 25 0 (8) 0 0
ADJUSTED EBITDA (2)(3) $ 367 $ 436 $ 536 $ 626 $ 721
Flash Ventures equipment depreciation expenses $ 259 $ 259 $ 241 $ 238 $ 239

©2020 Western Digital Corporation or its affiliates. All rights reserved. 19
Appendix
© 2020 Western Digital Corporation or its affiliates. All rights reserved.

©2020 Western Digital Corporation or its affiliates. All rights reserved. 20
GAAP to Non-GAAP Reconciliation
In millions; unaudited Q4F19 Q3F20 Q4F20GAAP GROSS PROFIT $ 465 $ 1,005 $ 1,083
Amortization of acquired intangible assets 166 145 144 Stock-based compensation expense 11 13 13Charges related to cost saving initiatives 4 2 -Manufacturing underutilization charges 67 - -Power outage charges 145 - -Other 22 __ - -
NON-GAAP GROSS PROFIT $ 880 $ 1,165 $ 1,240
GAAP OPERATING EXPENSES $ 846 $ 852 $ 822Amortization of acquired intangible assets (41) (40) (39)Stock-based compensation expense (53) (65) (63)Employee termination, asset impairment and other charges (24) (8) (7)Charges related to acquisitions and dispositions - (2) -Charges related to cost saving initiatives (3) 1 -Other _(3) - -
NON-GAAP OPERATING EXPENSES $ 722 $ 738 $ 713
GAAP OPERATING INCOME (LOSS) ($ 381) $ 153 $ 261Gross profit adjustments 415 160 157 Operating expense adjustments 124 114 109
NON-GAAP OPERATING INCOME $ 158 $ 427 $ 527
GAAP INTEREST AND OTHER EXPENSE, NET ($ 93) ($ 107) ($ 76)Convertible debt activity 7 7 7 Other _ (1) 9 (4)
NON-GAAP INTEREST AND OTHER EXPENSE, NET ($ 87) ($ 91) ($ 73)
©2020 Western Digital Corporation or its affiliates. All rights reserved. 21
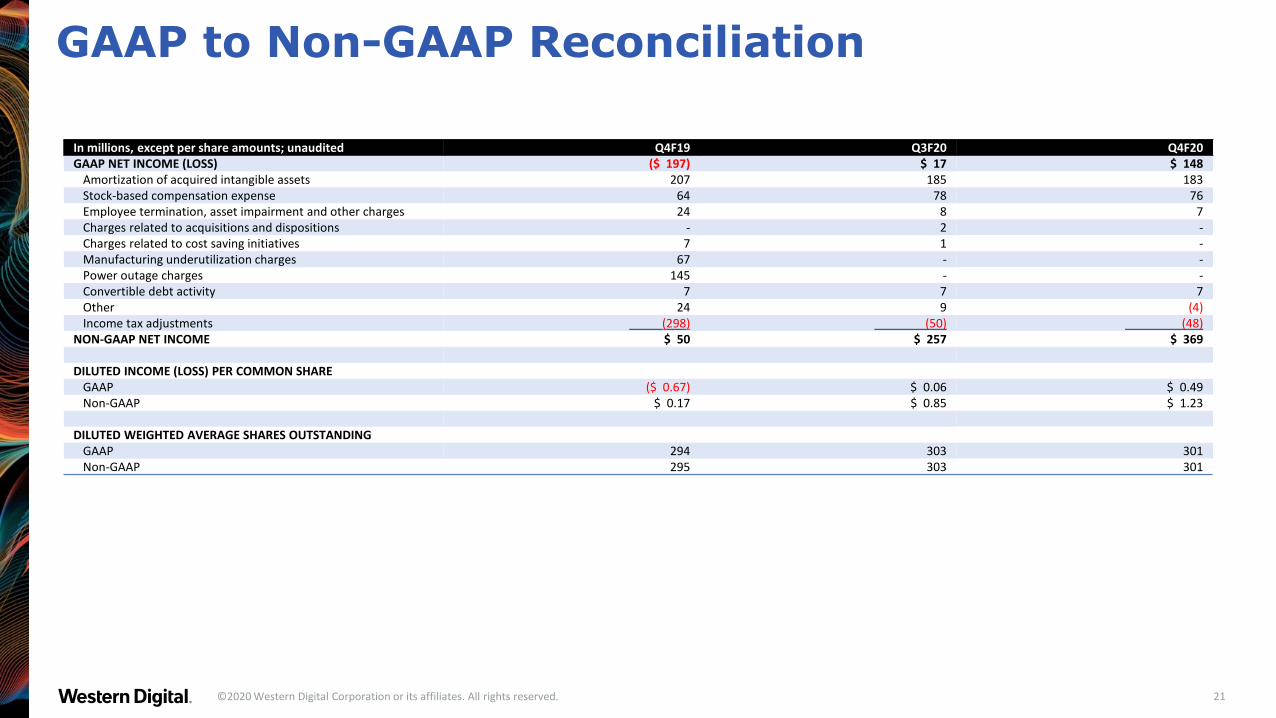
GAAP to Non-GAAP Reconciliation
In millions, except per share amounts; unaudited Q4F19 Q3F20 Q4F20GAAP NET INCOME (LOSS) ($ 197) $ 17 $ 148
Amortization of acquired intangible assets 207 185 183 Stock-based compensation expense 64 78 76 Employee termination, asset impairment and other charges 24 8 7Charges related to acquisitions and dispositions - 2 -Charges related to cost saving initiatives 7 1 -Manufacturing underutilization charges 67 - -Power outage charges 145 - -Convertible debt activity 7 7 7Other 24 9 (4)Income tax adjustments (298) (50) (48)
NON-GAAP NET INCOME $ 50 $ 257 $ 369
DILUTED INCOME (LOSS) PER COMMON SHAREGAAP ($ 0.67) $ 0.06 $ 0.49Non-GAAP $ 0.17 $ 0.85 $ 1.23
DILUTED WEIGHTED AVERAGE SHARES OUTSTANDINGGAAP 294 303 301 Non-GAAP 295 303 301

©2020 Western Digital Corporation or its affiliates. All rights reserved. 22
GAAP to Non-GAAP Reconciliation
1. Consolidated GAAP gross margin is calculated by dividing gross profit by total revenue.2. Consolidated non-GAAP gross margin is calculated by dividing total non-GAAP gross profit by total revenue.3. Non-GAAP HDD gross margin is calculated by dividing the portion of non-GAAP gross profit relating to the Company’s HDD products by HDD revenue.4. Non-GAAP Flash gross margin is calculated by dividing the portion of non-GAAP gross profit relating to the Company’s Flash products by Flash revenue.
In millions, except percentages; unaudited Q4F19 Q1F20 Q2F20 Q3F20 Q4F20GROSS PROFIT $ 465 $ 758 $ 935 $ 1,005 $ 1,083
Amortization of acquired intangible assets 166 164 157 145 144Stock-based compensation expense 11 12 13 13 13Charges related to cost saving initiatives 4 - 1 2 -Manufacturing underutilization charges 67 - - - -Power outage charges 145 68 - - -Other 22 - (8) - -
NON-GAAP GROSS PROFIT $ 880 $ 1,002 $ 1,098 $ 1,165 $ 1,240
NON-GAAP GROSS PROFIT BY PRODUCTHDD $ 599 $ 687 $ 739 $ 619 $ 557
Flash 281 315 359 546 683TOTAL NON-GAAP GROSS PROFIT $ 880 $ 1,002 $ 1,098 $ 1,165 $ 1,240
REVENUE BY PRODUCTHDD Revenue $ 2,128 $ 2,408 $ 2,396 $ 2,114 $ 2,049 Flash Revenue 1,506 1,632 1,838 2,061 2,238
TOTAL REVENUE $ 3,634 $ 4,040 $ 4,234 $ 4,175 $ 4,287
Consolidated GAAP gross margin(1) 12.8% 18.8% 22.1% 24.1% 25.3%Consolidated non-GAAP gross margin(2) 24.2% 24.8% 25.9% 27.9% 28.9%Non-GAAP HDD gross margin(3) 28.1% 28.5% 30.8% 29.3% 27.2%Non-GAAP Flash gross margin(4) 18.7% 19.3% 19.5% 26.5% 30.5%

©2020 Western Digital Corporation or its affiliates. All rights reserved. 23
Footnotes for GAAP to Non-GAAP ReconciliationThis presentation contains the following financial measures that are not in accordance with U.S. generally accepted accounting principles (“GAAP”): non-GAAP gross profit; non-GAAP gross margin; non-GAAP operating expenses; non-GAAP operating income; non-GAAP interest and other expense, net; non-GAAP net income; non-GAAP diluted income per common share; Adjusted EBTIDA; and Credit Agreement Defined Adjusted EBITDA (“Non-GAAP measures”). These Non-GAAP measures are not in accordance with, or an alternative for, measures prepared in accordance with GAAP and may be different from Non-GAAP measures used by other companies. The company believes the presentation of these Non-GAAP measures, when shown in conjunction with the corresponding GAAP measures, provides useful information to investors for measuring the company’s earnings performance and comparing it against prior periods. Specifically, the company believes these Non-GAAP measures provide useful information to both management and investors as they exclude certain expenses, gains and losses that the company believes are not indicative of its core operating results or because they are consistent with the financial models and estimates published by many analysts who follow the company and its peers. As discussed further below, these Non-GAAP measures exclude (as applicable) the amortization of acquired intangible assets, stock-based compensation expense, employee termination, asset impairment and other charges, charges related to acquisitions and dispositions, charges related to cost saving initiatives, manufacturing underutilization charges, convertible debt activity, other credit agreement adjustments, and income tax adjustments, and the company believes these measures along with the related reconciliations to the GAAP measures provide additional detail and comparability for assessing the company's results. EBITDA and adjusted EBITDA are not intended to reflect measures used under the company’s debt agreements. Credit Agreement Defined Adjusted EBITDA also is used to measure financial covenant compliance as defined under the company’s credit agreement applicable to Term Loan A-1 and Revolver. These Non-GAAP measures are some of the primary indicators management uses for assessing the company's performance and planning and forecasting future periods. These measures should be considered in addition to results prepared in accordance with GAAP, but should not be considered a substitute for, or superior to, GAAP results. As described above, the company excludes the following items from its Non-GAAP measures:Amortization of acquired intangible assets. The company incurs expenses from the amortization of acquired intangible assets over their economic lives. Such charges are significantly impacted by the timing and magnitude of the company's acquisitions and any related impairment charges. Stock-based compensation expense. Because of the variety of equity awards used by companies, the varying methodologies for determining stock-based compensation expense, the subjective assumptions involved in those determinations, and the volatility in valuations that can be driven by market conditions outside the company's control, the company believes excluding stock-based compensation expense enhances the ability of management and investors to understand and assess the underlying performance of its business over time and compare it against the company's peers, a majority of whom also exclude stock-based compensation from their Non-GAAP results.Employee termination, asset impairment and other charges. From time-to-time, in order to realign the company's operations with anticipated market demand or to achieve cost synergies from the integration of acquisitions, the company may terminate employees and/or restructure its operations. From time-to-time, the company may also incur charges from the impairment of intangible assets and other long-lived assets. These charges (including any reversals of charges recorded in prior periods) are inconsistent in amount and frequency, and the company believes they are not indicative of the underlying performance of its business.Charges related to acquisitions and dispositions. In connection with the company's business combinations or dispositions, the company incurs expenses which it would not have otherwise incurred as part of its business operations. These expenses include third-party professional service and legal fees, third-party integration services, severance costs, non-cash adjustments to the fair value of acquired inventory, contract termination costs, and retention bonuses. The company may also experience other accounting impacts in connection with these transactions. These charges and impacts are related to acquisitions and dispositions, are inconsistent in amount and frequency, and the company believes are not indicative of the underlying performance of its business. Charges related to cost saving initiatives. In connection with the transformation of the company's business, the company has incurred charges related to cost saving initiatives which do not qualify for special accounting treatment as exit or disposal activities. These charges, which the company believes are not indicative of the underlying performance of its business, primarily relate to costs associated with rationalizing the company's channel partners or vendors, transforming the company's information systems infrastructure, integrating the company's product roadmap, and accelerated depreciation of assets.Manufacturing underutilization charges. In response to flash business conditions, the company temporarily reduced its wafer starts during fiscal 2019 at its flash-based memory manufacturing facilities operated through its strategic partnership with Kioxia Corporation. The temporary abnormal reduction in output resulted in flash manufacturing underutilization charges which were expensed as incurred. These charges are consistent in amount and frequency, and the company believes these charges are not part of the ongoing operation of its business.Power outage charges. In June 2019, an unexpected power outage incident occurred at the flash-based memory manufacturing facilities operated through the company's strategic partnership with Kioxia Corporation in Yokkaichi, Japan. The power outage incident resulted in the write-off of damaged inventory and unabsorbed manufacturing overhead costs which are expensed as incurred. These charges are inconsistent in amount and frequency, and the company believes these charges are not part of the ongoing production operation of its business.Convertible debt activity. The company excludes non-cash economic interest expense associated with its convertible notes. These charges do not reflect the company's operating results, and the company believes they are not indicative of the underlying performance of its business. Other adjustments. From time-to-time, the company sells or impairs investments or other assets which are not considered necessary to its business operations, or incurs other charges or gains that the company believes they are not a part of the ongoing operation of its business. The resulting expense or benefit is inconsistent in amount and frequency.Other credit agreement adjustments. Other credit agreement adjustments include the company’s share of Flash Ventures’ equipment depreciation expense, other income and expenses, special charges and expected cost savings from cost reduction initiatives. The company’s share of Flash Ventures’ equipment depreciation expense was approximately 80% of Other Credit Agreement Adjustments for the trailing 12 months Q4F20.Income tax adjustments. Income tax adjustments include the difference between income taxes based on a forecasted annual Non-GAAP tax rate and a forecasted annual GAAP tax rate as a result of the timing of certain Non-GAAP pre-tax adjustments. The income tax adjustments include the company’s final adjustments for the tax effects of the Tax Cuts and Jobs Act allowed within the one-year measurement period that ended on December 22, 2018, as well as estimates related to the current status of the rules and regulations governing the transition to the Tax Cuts and Jobs Act. These adjustments are excluded because they are infrequent and the company believes that they are not indicative of the underlying performance of its business.