fourth quarter 2017 earnings - lyondellbasell.com fcc and 1 crude unit turnaround volume losses from...
TRANSCRIPT

www.lyondellbasell.com
Fourth Quarter 2017 Earnings
February 2, 2018
Company confidential
www.lyondellbasell.com
Cautionary Statement
2
The statements in this presentation relating to matters that are not historical facts are forward-looking statements. These forward-
looking statements are based upon assumptions of management which are believed to be reasonable at the time made and are
subject to significant risks and uncertainties. Actual results could differ materially based on factors including, but not limited to, the
business cyclicality of the chemical, polymers and refining industries; the availability, cost and price volatility of raw materials and
utilities, particularly the cost of oil, natural gas, and associated natural gas liquids; competitive product and pricing pressures; labor
conditions; our ability to attract and retain key personnel; operating interruptions (including leaks, explosions, fires, weather-related
incidents, mechanical failure, unscheduled downtime, supplier disruptions, labor shortages, strikes, work stoppages or other labor
difficulties, transportation interruptions, spills and releases and other environmental risks); the supply/demand balances for our
and our joint ventures’ products, and the related effects of industry production capacities and operating rates; our ability to achieve
expected cost savings and other synergies; our ability to successfully execute projects and growth strategies; legal and
environmental proceedings; tax rulings, consequences or proceedings; technological developments, and our ability to develop
new products and process technologies; potential governmental regulatory actions; political unrest and terrorist acts; risks and
uncertainties posed by international operations, including foreign currency fluctuations; and our ability to comply with debt
covenants and service our debt. Additional factors that could cause results to differ materially from those described in the forward-
looking statements can be found in the “Risk Factors” section of our Form 10-K for the year ended December 31, 2016, which can
be found at www.lyondellbasell.com on the Investor Relations page and on the Securities and Exchange Commission’s website at
www.sec.gov.
The illustrative results or returns of growth projects are not in any way intended to be, nor should they be taken as, indicators or
guarantees of performance. The assumptions on which they are based are not projections and do not necessarily represent the
Company’s expectations and future performance. You should not rely on illustrated results or returns or these assumptions as
being indicative of our future results or returns.
This presentation contains time sensitive information that is accurate only as of the date hereof. Information contained in this
presentation is unaudited and is subject to change. We undertake no obligation to update the information presented herein except
as required by law.

www.lyondellbasell.com
Information Related to Financial Measures
3
This presentation makes reference to certain “non-GAAP” financial measures as defined in Regulation G of the U.S. Securities
Exchange Act of 1934, as amended. The non-GAAP measures we have presented include income from continuing operations
excluding LCM, diluted earnings per share excluding LCM, EBITDA and EBITDA excluding LCM. LCM stands for “lower of cost or
market,” which is an accounting rule consistent with GAAP related to the valuation of inventory. Our inventories are stated at the
lower of cost or market. Cost is determined using the last-in, first-out (“LIFO”) inventory valuation methodology, which means that
the most recently incurred costs are charged to cost of sales and inventories are valued at the earliest acquisition costs. Market is
determined based on an assessment of the current estimated replacement cost and selling price of the inventory. In periods
where the market price of our inventory declines substantially, cost values of inventory may be higher than the market value, which
results in us writing down the value of inventory to market value in accordance with the LCM rule, consistent with GAAP. This
adjustment is related to our use of LIFO accounting and the decline in pricing for many of our raw material and finished goods
inventories. We report our financial results in accordance with U.S. generally accepted accounting principles, but believe that
certain non-GAAP financial measures, such as EBITDA and earnings and EBITDA excluding LCM, provide useful supplemental
information to investors regarding the underlying business trends and performance of the company's ongoing operations and are
useful for period-over-period comparisons of such operations. Non-GAAP financial measures should be considered as a
supplement to, and not as a substitute for, or superior to, the financial measures prepared in accordance with GAAP.
EBITDA, as presented herein, may not be comparable to a similarly titled measure reported by other companies due to differences
in the way the measure is calculated. We calculate EBITDA as income from continuing operations plus interest expense (net),
provision for (benefit from) income taxes, and depreciation & amortization. EBITDA should not be considered an alternative to
profit or operating profit for any period as an indicator of our performance, or as an alternative to operating cash flows as a
measure of our liquidity. We have also presented financial information herein exclusive of adjustments for LCM.
While we also believe that free cash flow (FCF) and free cash flow yield (FCF Yield) are measures commonly used by investors,
free cash flow and free cash flow yield, as presented herein, may not be comparable to similarly titled measures reported by other
companies due to differences in the way the measures are calculated. For purposes of this presentation, free cash flow means net
cash provided by operating activities minus capital expenditures and free cash flow yield means the ratio of free cash flow to
market capitalization.
Additionally, the ratio of total debt to EBITDA is a measure that provides an indicator of value to investors. For purposes of this
presentation, the ratio of total debt to EBITDA means total debt at period end divided by EBITDA.
Reconciliations for our non-GAAP measures can be found on our website at www.lyb.com/investorrelations

www.lyondellbasell.com
LyondellBasell in 2017
4
Delivering
ResultsAdvancing
Growth
Capturing
Opportunity
$ 7.1 billion
EBITDA(+8% vs 2016)
34%
Total Shareholder Return(1)
29%
Return on Invested Capital Investment in
Project
Management &
Execution
Technology
Innovation
Improving
Refinery
ReliabilityGroundbreaking
for 1.1 B lb
Hyperzone
HDPE
Final
Investment
Decision for
World’s Largest
PO/TBA Plant
New
Compounding
Plant in
Dalian, China
Premium
Polyolefin
Recycling JV
with Suez
8.4%
Free Cash Flow Yield
$ 4.9 billion
Income from Continuing
Operations
(1) Source: CapitalIQ

www.lyondellbasell.com
Maintaining leading performance in 2017
2016 ACC top decile safety, top quartile process incidents
5
(1) Includes employees and contractors and is based upon 200,000 hours worked.
Safety - Injuries per 200,000 Hours Worked(1)
Indexed Environmental Incidents
Indexed Process Safety Incidents(1)
Top Tier Safety Performance: A Core Value for LyondellBasell
0.1
0.2
0.3
0.4
0.5
0.6
0.7
0.8
2013 2014 2015 2016 2017
ACC Average
50%
100%
150%
200%
2013 2014 2015 2016 2017
50%
100%
150%
200%
250%
300%
2013 2014 2015 2016 2017
ACC Average

www.lyondellbasell.com
2017 EBITDA: FY17 +8% and 4Q17 +23% over prior year
6
(1) LCM stands for “lower of cost or market.” An explanation of LCM and why we have excluded it from our financial information in this presentation can be found on the third page of
this presentation under “Information Related to Financial Measures.”
Note: 3Q17 results include $103 million after-tax gain in Olefins and Polyolefins – Europe, Asia, and International for the sale of the Geosel interest. 4Q17 results include an $819
million one-time, non-cash benefit from changes in tax reform.
EBITDA(1) Diluted Earnings Per Share(1)
($ in millions, except per share data) 4Q16 3Q17 4Q17 FY 2016 FY 2017
EBITDA $1,406 $1,821 $1,726 $6,602 $7,134
Income from Continuing Operations $770 $1,058 $1,898 $3,847 $4,895
Diluted Earnings ($ / share) from Continuing Operations $1.89 $2.67 $4.80 $9.15 $12.28
As Reported As Reported
400
800
1,200
1,600
2,000
$2,400
4Q16 1Q17 2Q17 3Q17 4Q17
USD, millions As Reported Excluding LCM
0.00
1.00
2.00
3.00
4.00
$5.00
4Q16 1Q17 2Q17 3Q17 4Q17
USD per share As Reported Excluding LCM

www.lyondellbasell.com
8.0
9.0
10.0
11.0
12.0
2016 2017
lb, billions
8.0
10.0
12.0
14.0
16.0
2016 2017
lb, billions
Ethylene ProductionEthylene Derivative
Production(1) Crude Processing Rate
Volume Improvements Delivered in 2017
7
High reliability and expanded capacity
(1) Ethylene derivatives are polyethylene and ethylene oxide.
Harvey
HarveyHarvey
Corpus
Expansion
150
180
210
240
270
2016 2017
BPD, thousands
■ 4 crackers turnarounds, Corpus Christi expansion
■ PE limited by crackers, ethylene oxide turnaround
■ 1 crude unit turnaround, 1 coker turnaround, fire repairs
■ No cracker turnarounds
■ Refinery: FCC and 1 crude unit turnaround
■ Volume losses from Hurricane Harvey
2016 – Heavy Turnaround Schedule 2017 – Light Turnaround Schedule
www.lyondellbasell.com
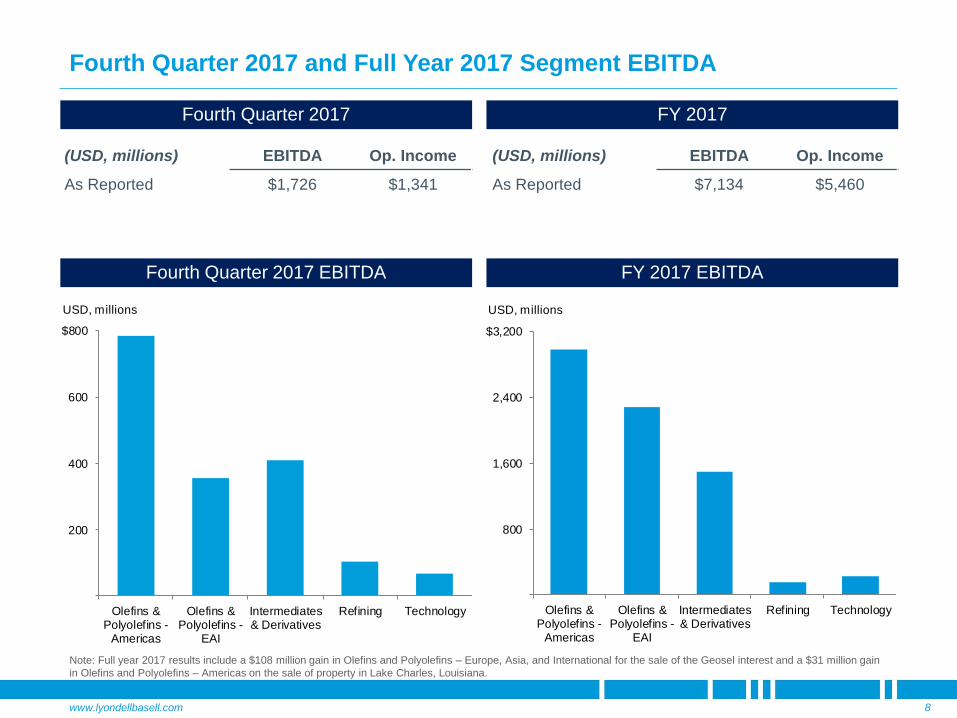
Fourth Quarter 2017 and Full Year 2017 Segment EBITDA
8
(USD, millions) EBITDA Op. Income
As Reported $1,726 $1,341
Fourth Quarter 2017
(USD, millions) EBITDA Op. Income
As Reported $7,134 $5,460
FY 2017
Fourth Quarter 2017 EBITDA FY 2017 EBITDA
200
400
600
$800
Olefins &Polyolefins -
Americas
Olefins &Polyolefins -
EAI
Intermediates& Derivatives
Refining Technology
USD, millions
800
1,600
2,400
$3,200
Olefins &Polyolefins -
Americas
Olefins &Polyolefins -
EAI
Intermediates& Derivatives
Refining Technology
USD, millions
Note: Full year 2017 results include a $108 million gain in Olefins and Polyolefins – Europe, Asia, and International for the sale of the Geosel interest and a $31 million gain
in Olefins and Polyolefins – Americas on the sale of property in Lake Charles, Louisiana.
www.lyondellbasell.com
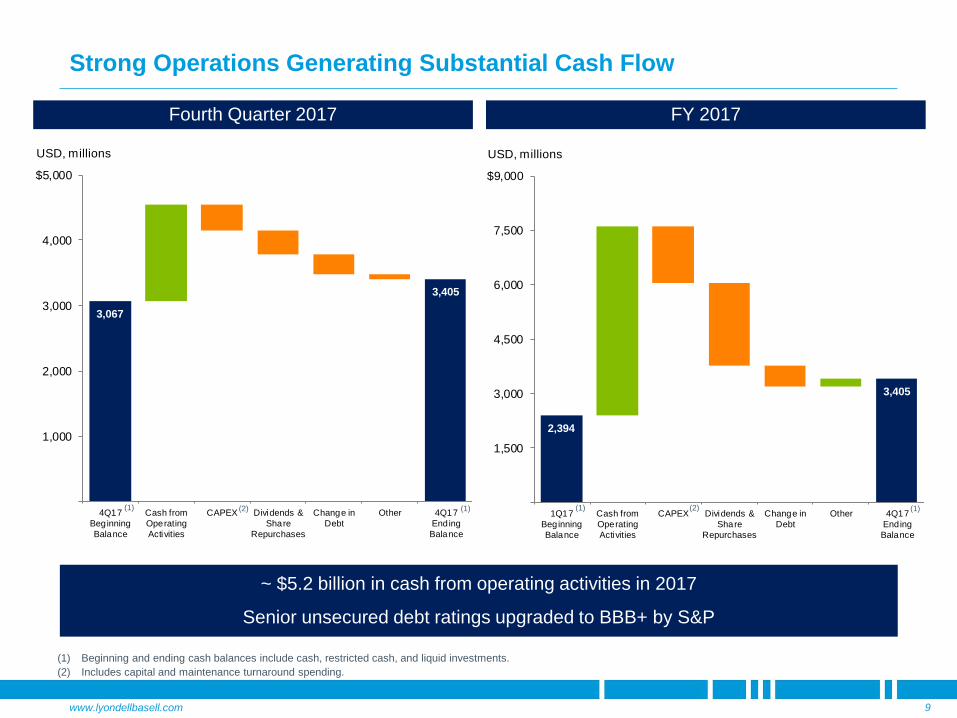
2,394
3,405
1,500
3,000
4,500
6,000
7,500
$9,000
1Q17
Beginning
Balance
Cash from
Operating
Activities
CAPEX Dividends &
Share
Repurchases
Change in
Debt
Other 4Q17
Ending
Balance
USD, millions
3,067
3,405
1,000
2,000
3,000
4,000
$5,000
4Q17
Beginning
Balance
Cash from
Operating
Activities
CAPEX Dividends &
Share
Repurchases
Change in
Debt
Other 4Q17
Ending
Balance
USD, millions
Strong Operations Generating Substantial Cash Flow
9
(1) Beginning and ending cash balances include cash, restricted cash, and liquid investments.
(2) Includes capital and maintenance turnaround spending.
Fourth Quarter 2017 FY 2017
(2) (1)(2) (1)(1) (1)
~ $5.2 billion in cash from operating activities in 2017
Senior unsecured debt ratings upgraded to BBB+ by S&P
www.lyondellbasell.com
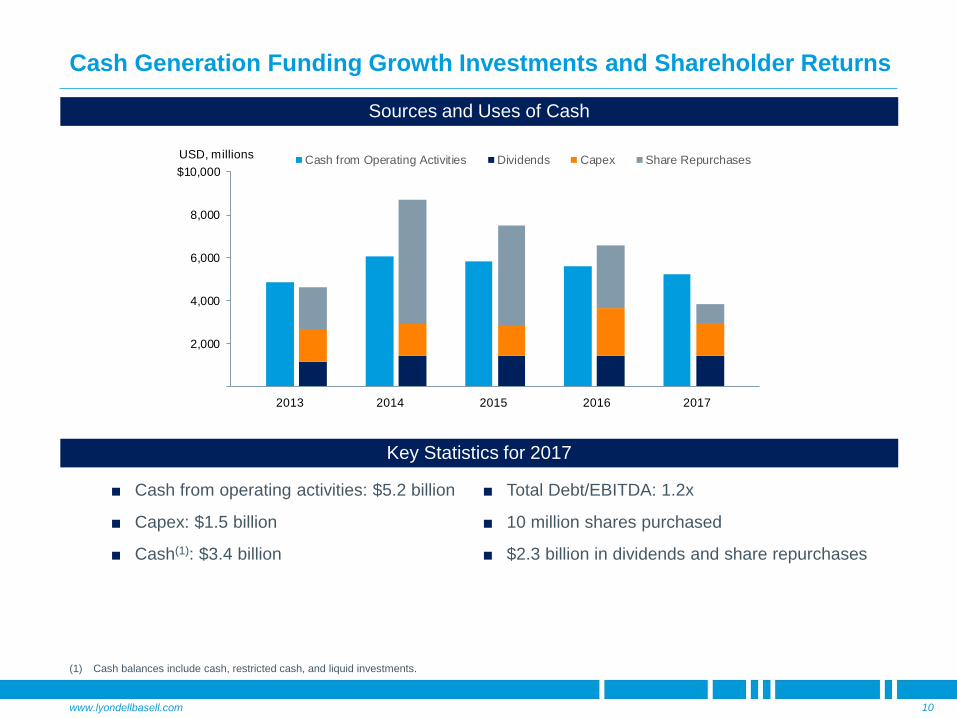
Cash Generation Funding Growth Investments and Shareholder Returns
10
Sources and Uses of Cash
■ Total Debt/EBITDA: 1.2x
■ 10 million shares purchased
■ $2.3 billion in dividends and share repurchases
Key Statistics for 2017
(1) Cash balances include cash, restricted cash, and liquid investments.
■ Cash from operating activities: $5.2 billion
■ Capex: $1.5 billion
■ Cash(1): $3.4 billion
2,000
4,000
6,000
8,000
$10,000
2013 2013 2014 2014 2015 2015 2016 2016 2017 20172013 2014 2015 2016 2017
USD, millions Cash from Operating Activities Dividends Capex Share Repurchases

www.lyondellbasell.com
56%
44%
Non-U.S. U.S.
25.8%
~ 21%
0%
30%
2017 2018
LyondellBasell Earnings Benefit from U.S. Tax Reform
11
4Q 2017 Benefit(1) Substantial U.S. Earnings Future Benefits
■ $819 million one-time, non-cash benefit from remeasurement of deferred tax assets and liabilities at lower tax rate
■ 4Q 2017 earnings benefit of $2.07/share
■ FY 2017 earnings benefit of $2.05/share
2017 Pre-tax Income
by Geography
$5.5 B
(1) 2017 benefit represents a provisional estimate of U.S. tax reform impact to be finalized no later than fourth quarter 2018.
(2) 2017 effective tax rate excludes benefits of remeasurement of U.S. deferred tax assets and liabilities due to U.S. tax reform.
LYB Effective Tax Rate(2)
■ No material impacts anticipated from deemed repatriation, interest deductibility limits or BEAT provision

www.lyondellbasell.com
EBITDA Margin Volume
Olefins and Polyolefins – AmericasTight Markets Persist Following Hurricane Harvey
12
U.S. Olefins
▪ Ethylene margin up 5 ¢/lb
▪ Volume up post Harvey
Polyethylene
▪ Spread up 2 ¢/lb
Polypropylene
U.S. Industry Ethylene Chain Margins(2)
EBITDA (ex. LCM) 4Q17 Performance vs. 3Q17(1)
U.S. Industry Polypropylene Margins(2)
(1) Arrow direction reflects our underlying business metrics.
(2) Source: Quarterly and January 29, 2018 month-to-date average IHS industry data.
4Q16 3Q17 4Q17 Jan ’18
200
400
600
800
$1,000
4Q16 1Q17 2Q17 3Q17 4Q17
USD, millions As Reported Excluding LCM
10
20
30
40
50
¢/lb Ethane Margin Naphtha Margin HDPE Margin
3
6
9
12
15
4Q16 3Q17 4Q17 Jan'18
¢/lb

www.lyondellbasell.com
Project delays and constrained supply due to Chinese reforms and Hurricane Harvey support a short and shallow downturn thesis
Industry Capacity Additions Serving Strong Global Demand Growth
13
Global Ethylene Supply & Demand(1)
(1) Source: IHS, Wood Mackenzie, LYB estimates, effective operating rate assuming 6% industry downtime. Based on 2017 updated balances.
Global Ethylene Supply & Demand Growth(1)
70%
75%
80%
85%
90%
95%
100%
200
250
300
350
400
450
500
550
lb, billions
Capacity
Demand
Effective Operating Rate - 1Q17 Forecast
Effective Operating Rate - 1Q18 Forecast
10
20
30
40
50
2012-2014 2015-2017 2018-2020Estimate
2021-2023Estimate
lb, billions
Capacity Growth Demand Growth
~7 Blb in excess capacity growth
results in ~2% drop in operating rate
www.lyondellbasell.com
EBITDA Margin Volume
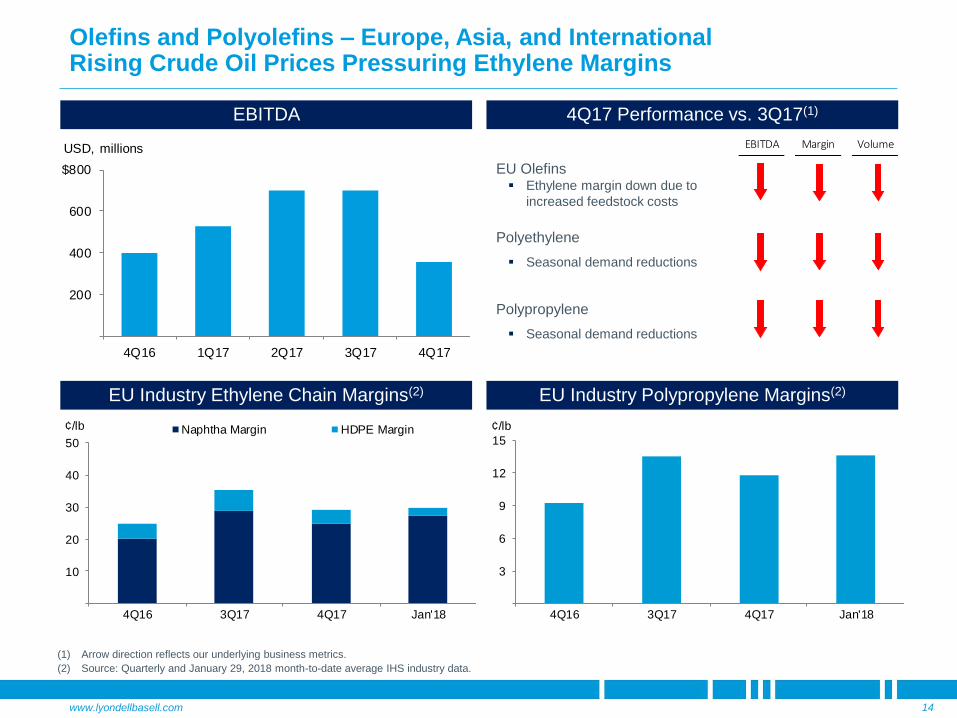
Olefins and Polyolefins – Europe, Asia, and InternationalRising Crude Oil Prices Pressuring Ethylene Margins
14
EU Olefins▪ Ethylene margin down due to
increased feedstock costs
Polyethylene
▪ Seasonal demand reductions
Polypropylene
▪ Seasonal demand reductions
EU Industry Ethylene Chain Margins(2)
EBITDA 4Q17 Performance vs. 3Q17(1)
EU Industry Polypropylene Margins(2)
(1) Arrow direction reflects our underlying business metrics.
(2) Source: Quarterly and January 29, 2018 month-to-date average IHS industry data.
200
400
600
$800
4Q16 1Q17 2Q17 3Q17 4Q17
USD, millions
10
20
30
40
50
4Q16 3Q17 4Q17 Jan'18
¢/lb Naphtha Margin HDPE Margin
3
6
9
12
15
4Q16 3Q17 4Q17 Jan'18
¢/lb

www.lyondellbasell.com
EBITDA Margin Volume
Intermediates and DerivativesStrong, Consistent Operations and Earnings
15
EBITDA
Propylene Oxide and Derivatives
▪ Margins and volume up post
Harvey
Intermediate Chemicals
Oxyfuels & Related Products
▪ Seasonal margin declines offset
volume improvements post Harvey
4Q17 Performance vs. 3Q17(1)
Raw Material Margins(3)Propylene Glycol Raw Material Margins(2)
(1) Arrow direction reflects our underlying business metrics.
(2) Source: ChemData January 2018 Report
(3) Source: IHS and Platts quarterly and January 29, 2018 month-to-date averages.
100
200
300
400
$500
4Q16 1Q17 2Q17 3Q17 4Q17
USD, millions
10
20
30
40
50
4Q16 3Q17 4Q17 1Q18E
¢/lb
20
40
60
10
20
30
4Q16 3Q17 4Q17 Jan'18
MTBE, ¢/galNA Styrene EU MTBEStyrene, ¢/lb
www.lyondellbasell.com
EBITDA Margin Volume
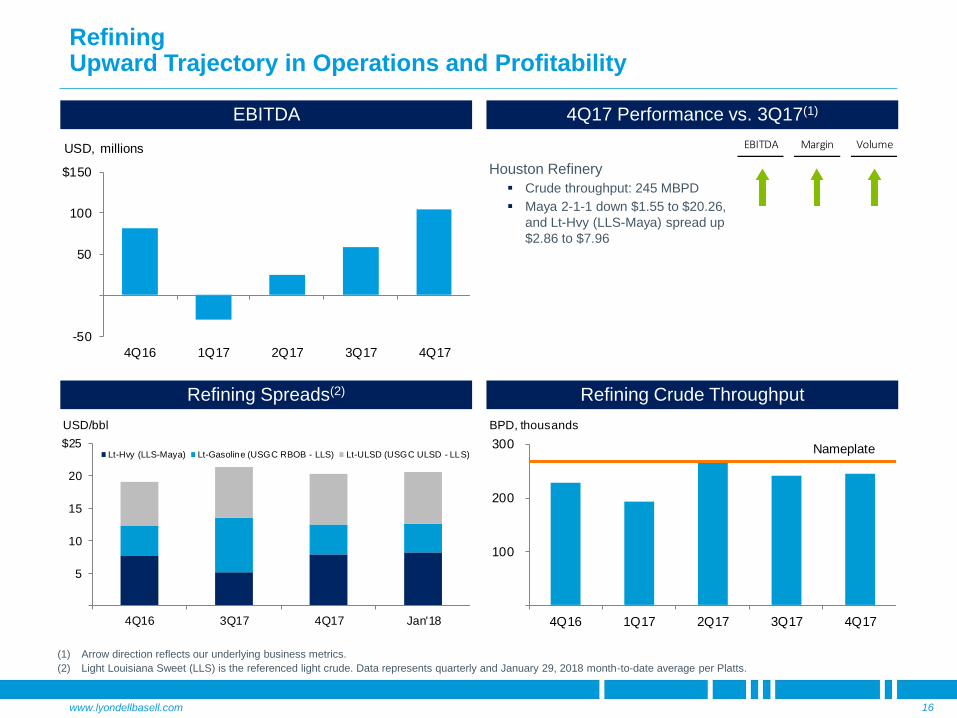
RefiningUpward Trajectory in Operations and Profitability
16
Houston Refinery
▪ Crude throughput: 245 MBPD
▪ Maya 2-1-1 down $1.55 to $20.26,
and Lt-Hvy (LLS-Maya) spread up
$2.86 to $7.96
EBITDA 4Q17 Performance vs. 3Q17(1)
(1) Arrow direction reflects our underlying business metrics.
(2) Light Louisiana Sweet (LLS) is the referenced light crude. Data represents quarterly and January 29, 2018 month-to-date average per Platts.
Refining Spreads(2) Refining Crude Throughput
-50
50
100
$150
4Q16 1Q17 2Q17 3Q17 4Q17
USD, millions
100
200
300
4Q16 1Q17 2Q17 3Q17 4Q17
BPD, thousands
Nameplate
5
10
15
20
$25
4Q16 3Q17 4Q17 Jan'18
USD/bbl
Lt-Hvy (LLS-Maya) Lt-Gasoline (USGC RBOB - LLS) Lt-ULSD (USGC ULSD - LLS)

www.lyondellbasell.com
Our Strategy Can Generate Value by Leveraging Skills and Strengths
17
FORMATION ESTABLISHMENT DEVELOPMENTSUSTAINABLE
GROWTH
Build on Success
and Skills
Rapid Capture of
Latent Opportunities
Optimize
Footprint
Establish and
Stabilize Culture
and Systems
Manage CostsIncrease
ProfitabilityIncrease Cash Flow Create Value
2010 2017 BEYOND
1. 2. 3. 4.

www.lyondellbasell.com
Po
ten
tia
l
Pro
jec
ts
Pro
jects
Un
derw
ay
North America PDH
North America PP
Propylene Oxide/TBA
Hyperzone HDPE
Europe PP
Scope
(MM lbs.)
Projected
Start-Up
CAPEX
($MM)
Estimated EBITDA(1)
($MM/year)
’15-’17 Avg. Margins
1,100 2019 ~$725 $150 - 200
1,000/2,200 2021 ~$2,400 $350 - 450
1,100 2022 - 2023 ~$650 - 750
1,600 2022 - 2023 ~$1,400 - 1,600
1,100 2023 - 2024 ~$650 - 750
Increasing Investment in LyondellBasell’s Organic Growth
18
(1) For the purpose of this slide, estimated EBITDA is volume times 2015-2017 average margins.
Channelview Ethylene 550 2020, 2024 ~$350 $100 - 150
North America PE 1,100 2024 - 2025 ~$700 - 800
Regular cadence of investment to drive earnings growth
$150 - 250
$250 - 400
$150 - 200
$150 - 250
www.lyondellbasell.com
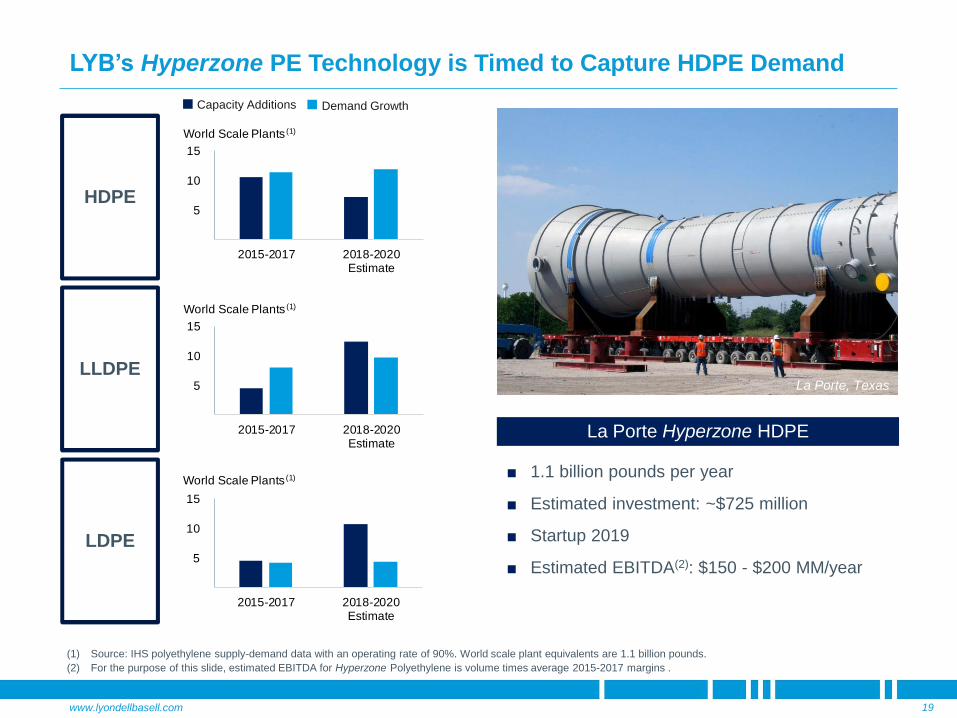
Demand GrowthCapacity Additions
LYB’s Hyperzone PE Technology is Timed to Capture HDPE Demand
19
5
10
15
2015-2017 2018-2020Estimate
World Scale Plants (1)
LDPE 5
10
15
2015-2017 2018-2020Estimate
World Scale Plants (1)
5
10
15
2015-2017 2018-2020Estimate
World Scale Plants (1)
La Porte Hyperzone HDPE
■ 1.1 billion pounds per year
■ Estimated investment: ~$725 million
■ Startup 2019
■ Estimated EBITDA(2): $150 - $200 MM/year
(1) Source: IHS polyethylene supply-demand data with an operating rate of 90%. World scale plant equivalents are 1.1 billion pounds.
(2) For the purpose of this slide, estimated EBITDA for Hyperzone Polyethylene is volume times average 2015-2017 margins .
LLDPE
HDPE
La Porte, Texas

www.lyondellbasell.com
Global PP Supply & DemandProjected PP Growth by Region
2018-2020
Global Polypropylene Market Growing Faster than Polyethylene
20
70%
75%
80%
85%
90%
95%
50
100
150
200
250
2015 2016 2017 2018 2019 2020
lb, billions
Capacity Demand Effective Operating Rate
Robust global demand growth led by China
Global demand growth requires at least 18 new world-scale PP plants 2018-2020
Source: IHS. World-scale plant equivalents are 1.1 billion pounds.
2018-2020
Capacity
Growth
(Blb.)
2018-2020
Demand
Growth
(Blb.)
Average
Annual
Demand
Growth
China 9.9 11.4 6%
North America 1.7 1.7 3%
Europe 0.0 0.1 0%
Rest of the World 8.4 9.8 7%
World 20.0 23.0 5%

www.lyondellbasell.com
■ Improved reliability increased operating rates and throughput during 2017
■ Increased profitability driven by strong diesel demand and improved heavy/light crude differentials
■ Full capability to meet Tier 3 gasoline sulfur specifications
■ Poised to benefit from the January 2020 IMO marine fuel oil sulfur regulations
Improved Refining Reliability Producing Results
21
EBITDA
Light-Heavy Crude Differential(1)
Refinery Outlook
Houston Refinery
-50
50
100
150
$200
2016 1Q17 2Q17 3Q17 4Q17 2017
USD, millions
(1) Light Louisiana Sweet (LLS) is the referenced light crude and Maya is the referenced heavy crude. Data represents annual, quarterly and January 29, 2018 month-to-date average per Platts.
2
4
6
8
10
$12
'12-'16 1Q17 2Q17 3Q17 4Q17 Jan'18
USD/bbl
www.lyondellbasell.com
4
8
12
16
$20
2,000
4,000
6,000
8,000
$10,000
2013 2014 2015 2016 20172013 2014 2015 2016 2017
EBITDAUSD, millions
EBITDA EPS LCM
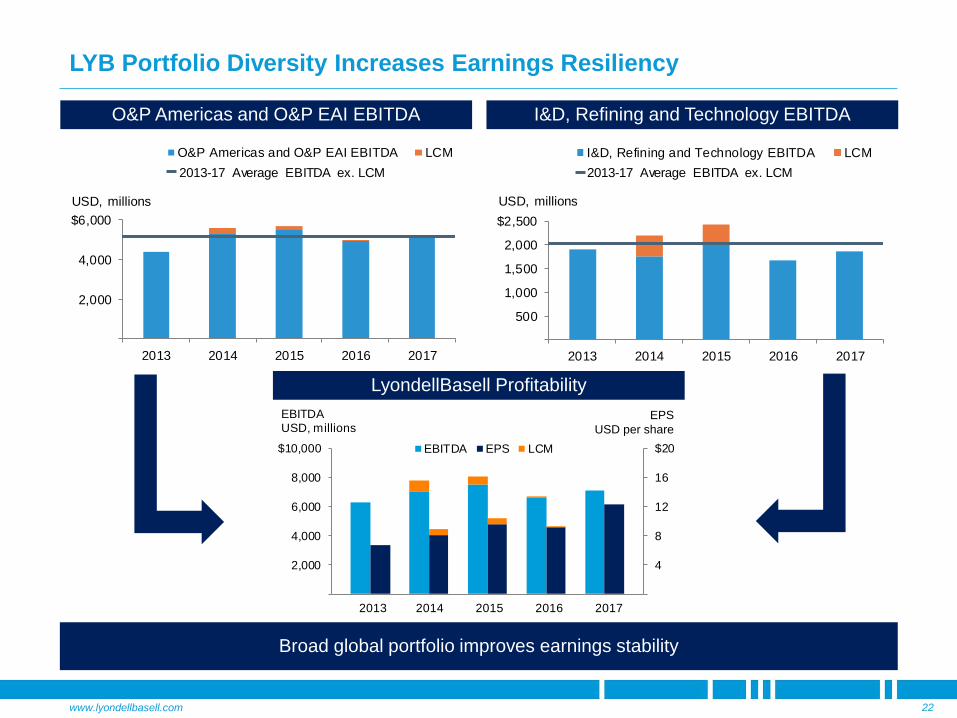
LYB Portfolio Diversity Increases Earnings Resiliency
22
EPS
USD per share
O&P Americas and O&P EAI EBITDA I&D, Refining and Technology EBITDA
LyondellBasell Profitability
Broad global portfolio improves earnings stability
2,000
4,000
$6,000
2013 2014 2015 2016 2017
USD, millions
O&P Americas and O&P EAI EBITDA LCM
2013-17 Average EBITDA ex. LCM
500
1,000
1,500
2,000
$2,500
2013 2014 2015 2016 2017
USD, millions
I&D, Refining and Technology EBITDA LCM
2013-17 Average EBITDA ex. LCM

www.lyondellbasell.com
Sources 2013-2017 Uses Priority
Cash From
Operating
Activities
Balance
Sheet
Capacity
Optional
Mandatory
Profitability Supports Reinvestment for Value-Driven Growth
23
Base
CAPEX
Dividends
Growth
CAPEX
Share
Repurchase
Balance
Sheet
Capacity
2018-2022 Uses
Base
CAPEX
Dividends
Growth
CAPEX
Share
Repurchase
Inorganic
Opportunities
Note: Graphic for illustrative purposes only.
www.lyondellbasell.com
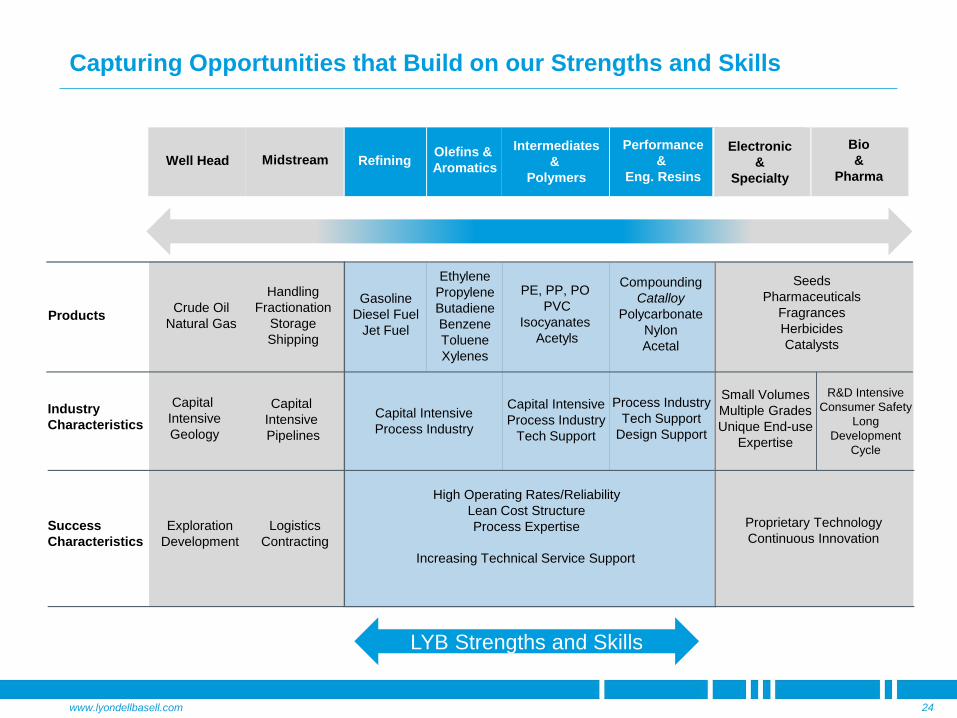
Capturing Opportunities that Build on our Strengths and Skills
24
Capital Intensive
Process Industry
RefiningOlefins &
Aromatics
Intermediates
&
Polymers
Performance
&
Eng. Resins
Gasoline
Diesel Fuel
Jet Fuel
Ethylene
Propylene
Butadiene
Benzene
Toluene
Xylenes
PE, PP, PO
PVC
Isocyanates
Acetyls
Compounding
Catalloy
Polycarbonate
Nylon
Acetal
Capital Intensive
Process Industry
Tech Support
Process Industry
Tech Support
Design Support
High Operating Rates/Reliability
Lean Cost Structure
Process Expertise
Increasing Technical Service Support
ProductsCrude Oil
Natural Gas
Handling
Fractionation
Storage
Shipping
Industry
Characteristics
Capital
Intensive
Geology
Capital
Intensive
Pipelines
Success
Characteristics
Exploration
Development
Logistics
Contracting
Small Volumes
Multiple Grades
Unique End-use
Expertise
R&D Intensive
Consumer Safety
Long
Development
Cycle
Seeds
Pharmaceuticals
Fragrances
Herbicides
Catalysts
Proprietary Technology
Continuous Innovation
Well Head MidstreamElectronic
&
Specialty
Bio
&
Pharma
LYB Strengths and Skills

www.lyondellbasell.com
50/50 JV with
■ ~ 75 million lbs. premium, recycled HDPE and PP
■ Suez supplies post-consumer raw materials
■ LyondellBasell marketing and customer service
Innovative Materials for Transportation
Serving the global market with products that:
■ Reduce vehicle weight for ICE fuel efficiency
■ Improve performance and range of EVs
■ Enable recycling of interior and exterior components
Increasing concentration in underhood applications
■ Lower temperatures in EVs enable substitution for heavier, higher-cost materials
Creating Opportunities with LyondellBasell’s Innovation
25
Leading Global Position in Polymer Compounding
Hyperzone HDPE: New Technology Platform
Target Applications
■ High growth markets
■ Differentiated properties
■ Weight reduction
Quality Circular Polymers (QCP)

www.lyondellbasell.com
Growth Guided by Strategic Goals
26
Leverage Core Strengths:▪ Safe & reliable operations
▪ Cost discipline
▪ Global reach and broad portfolio
Advance Profitable Growth:▪ Focus on advantaged and
differentiated products and
markets
Capture Opportunities:▪ Consistent with LYB strengths
▪ Create tangible value
Consistent
Top-Quartile
TSR
MAINTAIN INVESTMENT-GRADE CREDIT RATING
www.lyondellbasell.com
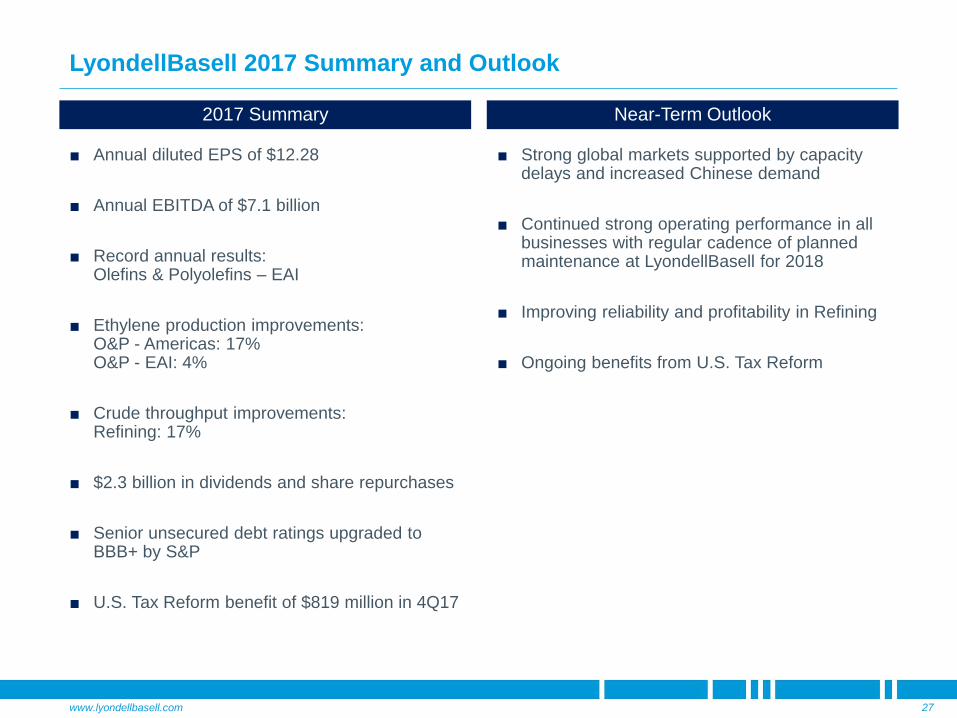
LyondellBasell 2017 Summary and Outlook
27
■ Annual diluted EPS of $12.28
■ Annual EBITDA of $7.1 billion
■ Record annual results: Olefins & Polyolefins – EAI
■ Ethylene production improvements: O&P - Americas: 17% O&P - EAI: 4%
■ Crude throughput improvements: Refining: 17%
■ $2.3 billion in dividends and share repurchases
■ Senior unsecured debt ratings upgraded to BBB+ by S&P
■ U.S. Tax Reform benefit of $819 million in 4Q17
2017 Summary Near-Term Outlook
■ Strong global markets supported by capacity delays and increased Chinese demand
■ Continued strong operating performance in all businesses with regular cadence of planned maintenance at LyondellBasell for 2018
■ Improving reliability and profitability in Refining
■ Ongoing benefits from U.S. Tax Reform
www.lyondellbasell.com
Investor Reception 2018: Save the Date
LyondellBasell will hold an Investor Reception on the evening of Wednesday March 21, 2018,
during the IHS World Petrochemical Conference in Houston.
This is a valuable opportunity to meet with members of our executive leadership team and have
informal conversations about LyondellBasell businesses.
Invitations and additional information to follow.
LYB Investor Reception | March 21,2018 | Houston, TX
28