fourier transform mass spectrometry for the molecular ...cdn.intechweb.org/pdfs/15157.pdf · 16...
TRANSCRIPT

16
Fourier Transform Mass Spectrometry for the Molecular Level Characterization of
Natural Organic Matter: Instrument Capabilities, Applications, and Limitations
Rachel L. Sleighter and Patrick G. Hatcher Old Dominion University
United States of America
1. Introduction
All living matter in the environment (i.e., animals, plants, microorganisms, etc.) eventually dies and decomposes into what is known as natural organic matter (NOM). NOM is formed from a vast variety of sources that have been chemically or microbially degraded in the environment where they arise, and NOM can be generally described as a complex mixture of organic compounds (Stevenson, 1994). Within this mixture, some compounds retain their individual reactivity and characteristics, while others tend to aggregate together and act as a polymeric unit. Overall, NOM can encompass a variety of natural biomolecules, such as lipids, peptides/protein, amino-sugars, carbohydrates, lignins, tannins, and condensed aromatics. Because NOM is a random assortment of organic constituents, its size, shape, concentration, and other physico-chemical properties vary greatly with location and season. For these reasons, the molecular level characterization of NOM continues to be one of the greatest challenges to modern analytical chemists. NOM is ubiquitously present in all natural waters, soils, sediments, and air, giving NOM a central role in numerous environmental processes. These processes are linked together by the global carbon cycle, which describes the storage and flux of carbon sources and sinks throughout the environment (Thurman, 1985; Eglinton and Repeta, 2003; Perdue and Ritchie, 2003). Special attention is generally paid to land-sea interfaces, atmosphere-sea interfaces, and long-term carbon burial/storage. NOM in soils affects the cation exchange capacity and water retention of soils, which has triggered studies by the agricultural communities. Furthermore, NOM in soils/sediments influences carbon sequestration and burial, and this carbon is altered over long periods of time and can be transformed to petroleum precursors. NOM in soils and rivers can affect the solubility, transport, and eventual fate of anthropogenic pollutants. These hydrophobic organic contaminants can interact and bind with NOM in the environment, making it difficult to trace throughout the river systems that eventually lead to the ocean. The amount of carbon in dissolved organic matter (DOM) in the ocean is approximately the same as that of atmospheric CO2 (Hedges, 1992; Eglinton and Repeta, 2003) and this exchange has been directly linked to climate change (Canadell et al., 2007; Sabine and Feely, 2007). NOM in the atmosphere can exist as an aerosol or particulate, which impacts human health, climate, and overall air quality. The
www.intechopen.com

Fourier Transforms - Approach to Scientific Principles
296
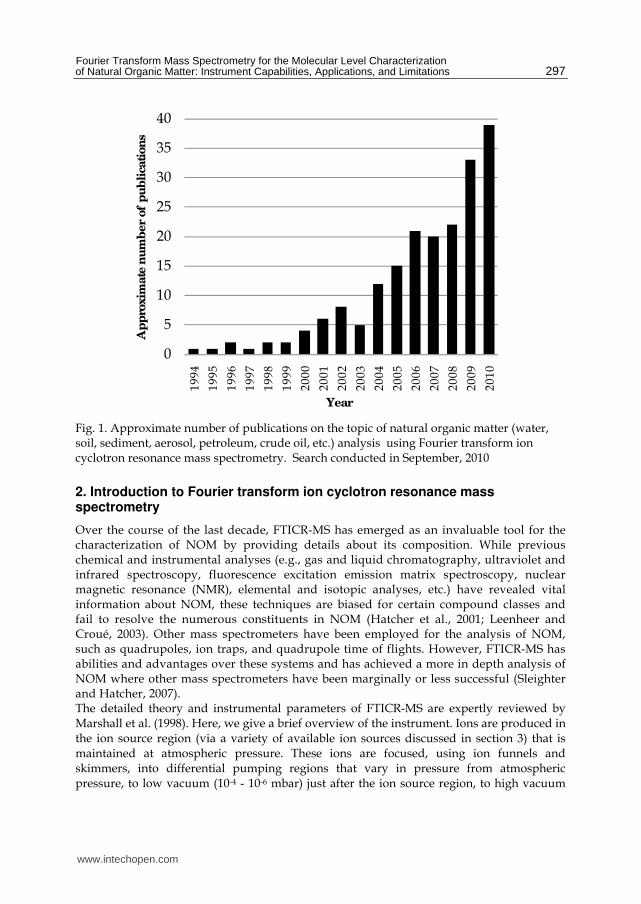
brief explanation of NOM, along with the short list of NOM implications given here, barely touches upon the large variety of important research that is ongoing within the NOM community. The significance of NOM in the environment and the numerous roles that NOM plays in the biogeochemical processes that mediate Earth’s ecosystems highlight the necessity for a more fundamental comprehension of NOM chemistry and composition. The characterization of NOM from different sources is a difficult task, simply because NOM does not have an exact composition or structure and occurs at aqueous concentrations that can vary by 3 orders of magnitude, depending on NOM type and location. Bulk characteristics of NOM can be identified by elemental analysis, ultraviolet and infrared spectroscopy, and traditional one-dimensional nuclear magnetic resonance (Hatcher et al., 2001). Much has been learned about NOM chemistry from these techniques, such as elemental compositions and ratios (%C, %N, %O, %S, C/N, etc.), specific functional groups that primarily exist in NOM, and general trends that occur amongst different NOM samples. Chromatographic techniques, such as gas and liquid chromatography coupled to various detectors (i.e., flame ionization detection, mass spectrometry, photodiode array detection) has also provided a wealth of structural information on various types of NOM. Two-dimensional nuclear magnetic resonance has more recently been utilized to characterize and understand the nature of both soluble and insoluble NOM beyond that of the one-dimensional approach, and this has led to the ability to link NOM to well known biopolymer classes. However, despite the abundance of data that has been acquired using the aforementioned techniques, NOM remains as an analytical challenge. Because NOM exists amongst a background matrix, it can be difficult to separate from water or inorganic matter, without losing or altering the NOM (Mopper et al., 2007; Dittmar et al., 2008). Sample preparation for NOM is an important consideration. Furthermore, NOM is not amenable to most instrumental analyses, because it is a low concentration of highly functionalized polymeric substances that do not have uniform behaviour. NOM has a wide size and volatility range, since portions are hydrophilic, allowing them to be water soluble, while other parts retain their hydrophobic nature. Overall, the goal of molecular level characterization of NOM continues be a daunting task. The advent of atmospheric pressure ionization (API) sources and Fourier transform ion cyclotron resonance mass spectrometry (FTICR-MS) has revolutionized our ability to analyze NOM. These methods were originally employed by the biochemical communities to elucidate the structure of biological macromolecules (proteins, metabolic products, DNA, etc.). The knowledge that has evolved from these studies has been applied to NOM, where the goal is to transfer polar analytes in solution to molecular ions that can be detected by mass spectrometry. With the exception of petroleum and crude oil samples, the first application and use of electrospray ionization (ESI) for studying NOM was by McIntyre et al. (1997), utilizing a triple quadrupole mass spectrometer to analyze organic acids. Not long after, Fievre et al. (1997) utilized ESI-FTICR-MS to investigate the size and composition of humic and fulvic acids. In the last 15 years, the utilization of FTICR-MS for the analysis of NOM samples has increased from year to year, and from 2000 to 2010, the number of publications has increased by nearly 900% (Fig. 1). Clearly, FTICR-MS is a powerful technique that has great promise in the field of NOM chemistry, with a rise in its use progressing every year. In this chapter, the spotlight lies in utilizing FTICR-MS specifically for the characterization of NOM, concentrating on particular instrumental capabilities, its application to a variety of different types of NOM, and limitations that exist for the acquisition and analysis of data.
www.intechopen.com
Fourier Transform Mass Spectrometry for the Molecular Level Characterization of Natural Organic Matter: Instrument Capabilities, Applications, and Limitations
297
0
5
10
15
20
25
30
35
40
19
94
19
95
19
96
19
97
19
98
19
99
20
00
20
01
20
02
20
03
20
04
20
05
20
06
20
07
20
08
20
09
20
10
Year
Ap
pro
xim
ate
nu
mb
er
of
pu
bli
cati
on
s
Fig. 1. Approximate number of publications on the topic of natural organic matter (water, soil, sediment, aerosol, petroleum, crude oil, etc.) analysis using Fourier transform ion cyclotron resonance mass spectrometry. Search conducted in September, 2010
2. Introduction to Fourier transform ion cyclotron resonance mass spectrometry
Over the course of the last decade, FTICR-MS has emerged as an invaluable tool for the characterization of NOM by providing details about its composition. While previous chemical and instrumental analyses (e.g., gas and liquid chromatography, ultraviolet and infrared spectroscopy, fluorescence excitation emission matrix spectroscopy, nuclear magnetic resonance (NMR), elemental and isotopic analyses, etc.) have revealed vital information about NOM, these techniques are biased for certain compound classes and fail to resolve the numerous constituents in NOM (Hatcher et al., 2001; Leenheer and Croué, 2003). Other mass spectrometers have been employed for the analysis of NOM, such as quadrupoles, ion traps, and quadrupole time of flights. However, FTICR-MS has abilities and advantages over these systems and has achieved a more in depth analysis of NOM where other mass spectrometers have been marginally or less successful (Sleighter and Hatcher, 2007). The detailed theory and instrumental parameters of FTICR-MS are expertly reviewed by Marshall et al. (1998). Here, we give a brief overview of the instrument. Ions are produced in the ion source region (via a variety of available ion sources discussed in section 3) that is maintained at atmospheric pressure. These ions are focused, using ion funnels and skimmers, into differential pumping regions that vary in pressure from atmospheric pressure, to low vacuum (10-4 - 10-6 mbar) just after the ion source region, to high vacuum
www.intechopen.com

Fourier Transforms - Approach to Scientific Principles
298
(10-9 - 10-10 mbar) in the ICR cell. Ions are steered through these regions and typically pass through a mass analyzer in the lower vacuum area where an initial sort and storage occurs. Commercial instruments vary in which type of mass analyzer is used; some are a combination of hexapoles and/or quadrupoles, while others are linear ion traps. In this first mass analyzer region, only ions of a certain mass to charge (m/z) range (typically 100-2000 m/z) are allowed to be accumulated for a designated time prior to their transfer to the detector. Once past this accumulation stage, the ions are guided through more pumping stages of the ion transfer optics region and are eventually transferred into the horizontal bore of a cryogenic magnet, where they are trapped in the ion cyclotron resonance cell. Modern commercial FTICR-MS instruments employ cryomagnets of various strengths (usually 7-15 T). Once ions are trapped in the ICR cell under the influence of a homogeneous magnetic field, they circulate at a frequency characteristic of their m/z value. Cyclotron frequency is inversely proportional to m/z, as shown below:
fc = B0(z/m) (1)
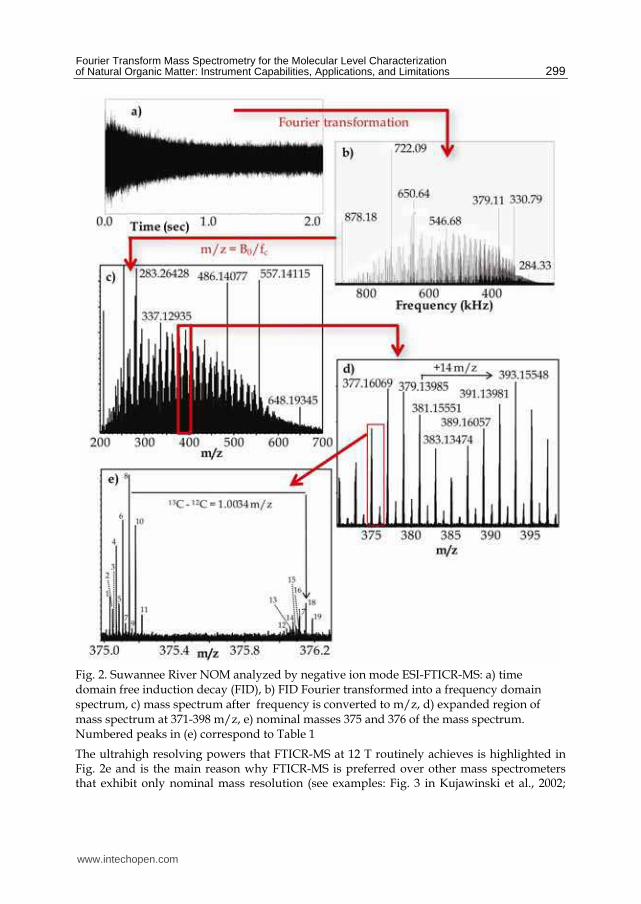
In equation 1, fc is the cyclotron frequency, B0 is the magnetic field strength, z is the charge of the ion, and m is the mass of the ion. Ions in orbit in the ICR cell are excited by a broadband RF pulse, which increases the radius of their orbit but not their frequency. The ions are now circulating closer to the detector plates, where the ion packets can induce an image current on the receiving electrode. Field inhomogeneities cause the ions to lose coherence and orbit radius, which leads to collapse of the ions to the central core of the ICR cell. This produces an image current trace that is called a free induction decay (FID), similar to what is observed for NMR signals. The time-domain FID signal (Fig. 2a) is digitized and Fourier transformed into a frequency domain signal (Fig. 2b), after acquiring and summing multiple FID spectra to build up signal-to-noise. The frequency domain data are then converted into mass spectra (Fig. 2c) by use of equation 1 and calibrated with compound mixtures having components with known m/z values. This sequence of data detection and conversion is shown in Fig. 2 for a sample of Suwannee River NOM. In our opinion, FTICR-MS is the only type of mass spectrometer that can achieve the
resolving powers that are necessary (those exceeding 105) for mass deconvolution of the
thousands of compounds that are present in a single NOM sample (Fig. 2c). Orbitrap mass
spectrometers (providing resolving powers of approximately 60,000) provide sufficient
resolution for evaluating elemental formulas of mixtures containing only C, H, and O
molecules (see section 5 and Fig. 8), but the inclusion of heteroatoms in the molecules (i.e.,
N, S, and P) requires the use of FTICR-MS to achieve assignment of exact elemental
formulas. Fig. 2d shows that the most intense peaks are detected at odd nominal masses,
indicating that they are composed of compounds with either 0 or an even number of
nitrogens (based on the nitrogen rule). Ions detected at even nominal masses contain an odd
number of nitrogens or are 13C isotopologues of the 12C compounds detected (Fig. 2e). Based
on the identification of the 12C and 13C isotopologues, one can determine the charge state of
the compound. If a compound is singly charged, then the 13C isotope peak will be observed
at 1.0034 mass units higher than the 12C peak, which is the mass difference between 12C and 13C. Doubly charged peaks have isotopes that appear at 0.5017 mass units higher, but
doubly charged peaks are rarely detected in NOM samples (Kujawinski et al. 2002; Stenson
et al., 2002; Kim et al., 2003). Generally, at least 10 peaks are detected at each individual
nominal mass, with upwards of 20-30 being observed in some cases.
www.intechopen.com
Fourier Transform Mass Spectrometry for the Molecular Level Characterization of Natural Organic Matter: Instrument Capabilities, Applications, and Limitations
299
Fig. 2. Suwannee River NOM analyzed by negative ion mode ESI-FTICR-MS: a) time domain free induction decay (FID), b) FID Fourier transformed into a frequency domain spectrum, c) mass spectrum after frequency is converted to m/z, d) expanded region of mass spectrum at 371-398 m/z, e) nominal masses 375 and 376 of the mass spectrum. Numbered peaks in (e) correspond to Table 1
The ultrahigh resolving powers that FTICR-MS at 12 T routinely achieves is highlighted in Fig. 2e and is the main reason why FTICR-MS is preferred over other mass spectrometers that exhibit only nominal mass resolution (see examples: Fig. 3 in Kujawinski et al., 2002;
www.intechopen.com

Fourier Transforms - Approach to Scientific Principles
300
Fig. 1 in Sleighter and Hatcher, 2007). The equation for calculating resolving power is shown below in equation 2, where RP is resolving power, m is mass, and FWHM is the full width at half maximum of the peak.
P = m/(FWHM) (2)
1 375.03585 15.0 0.00078 479014 C17H11O10- 375.035770 0.21
2 375.05110 10.7 0.00074 508681 C21H11O7- 375.051026 0.20
3 375.05444 3.1 0.00052 721130 C18H15O7S1- 375.054397 0.11
4 375.07227 33.4 0.00076 493629 C18H15O9- 375.072156 0.30
5 375.08755 12.4 0.00074 503478 C22H15O6- 375.087412 0.37
6 375.10864 43.2 0.00077 487137 C19H19O8- 375.108541 0.26
7 375.12390 5.4 0.00077 484204 C23H19O5- 375.123797 0.27
8 375.14491 59.2 0.00083 454710 C20H23O7- 375.144927 -0.05
9 375.16033 3.5 0.00115 326330 C24H23O4- 375.160183 0.39
10 375.18132 40.8 0.00082 459226 C21H27O6- 375.181312 0.02
11 375.21784 8.7 0.00060 625389 C22H31O5- 375.217698 0.38
12 376.03904 3.3 0.0006 629102 13C112C16H11O10
- 376.039125 -0.23
13 376.06734 3.2 0.00048 783961 C17H14N1O9- 376.067405 -0.17
14 376.07554 5.9 0.00066 569024 13C112C17H15O9
- 376.075510 0.08
15 376.09090 4.2 0.00057 662373 13C112C21H15O6
- 376.090767 0.35
16 376.10381 3.2 0.0007 538763 C18H18N1O8- 376.103790 0.05
17 376.11201 8.1 0.00065 576557 13C112C18H19O8
- 376.111896 0.30
18 376.14839 12.7 0.00085 443845 13C112C19H23O7
- 376.148282 0.29
19 376.18463 7.1 0.00085 444104 13C112C20H27O6
- 376.184667 -0.10
calculated
m/z
Error
(ppm)FWHMS/N
Resolving
Power
Peak
Number
measured
m/z
proposed
formula
FWHM: full width at half maximumError units = parts per million deviation of calculated m/z from the measured m/z
Table 1. Details of the peaks shown in Fig. 1e
Resolving power calculations are demonstrated in Table 1, which shows the molecular formula assignments to the peaks in Fig. 2e, along with measured details of each. Because the frequencies, at which ions orbit within the ICR cell, can be measured very accurately, m/z can also be calculated very accurately, usually to the fifth decimal place. With careful external and internal calibration (Sleighter et al., 2008), accurate m/z values can be calculated and utilized for the determination of unique molecular formulas. These can be confidently assigned with an error difference (between the measured m/z and the calculated exact m/z) of less than 0.5 ppm (or 500 ppb). Once molecular formulas are
www.intechopen.com
Fourier Transform Mass Spectrometry for the Molecular Level Characterization of Natural Organic Matter: Instrument Capabilities, Applications, and Limitations
301
assigned to the majority of the peaks in the mass spectrum, compositional make-up of the sample can be established.
3. FTICR-MS instrument capabilities and data acquisition
While FTICR-MS is a particularly impressive instrument and has the ability to provide molecular level details about NOM samples, there are many factors to take into account during data acquisition. It is important to consider the specific instrument’s design and capabilities, in order to optimize certain parameters and decide how the data should be acquired so that high quality, meaningful mass spectra are obtained. The first concern is for sample composition. There are several inherent difficulties with obtaining publishable mass spectra of NOM, particularly when the organic matter exists at a low concentration in the presence of a much higher concentration of inorganic matrix components. Salty samples are especially problematic, as emphasized in Fig. 3, which shows a NOM sample from the Elizabeth River that was analyzed by ESI-FTICR-MS before and after desalting by electrodialysis. An expanded region of the mass spectra acquired for the Elizabeth River NOM before desalting (Fig. 3a) shows high magnitude peaks with a high mass defect (0.7-0.8) and lower magnitude peaks at mass defects that are typical of organic matter (0.0-0.5) in this size range. Once the riverine NOM has been desalted (Fig. 3b), the high mass defect peaks attributed to salts are absent and the lower mass defect peaks are enhanced. Mass defect refers to the deviation of an m/z value from the exact nominal mass, and it is indicative of the type of compound present, based on the mass defect of atoms in organic compounds. The exact masses (in amu) of 12C, 1H, and 16O are 12.000000, 1.007825, and 15.994915, respectively. Hydrogen has a positive mass defect, while oxygen has a negative mass defect. Thus compounds that are oxygen-rich and/or hydrogen-poor will display peaks at a lower mass defect (ca. 0.0-0.2), while compounds that are hydrogen-rich and/or oxygen-poor give peaks with a higher mass defect (ca. 0.2-0.5). The composition of peaks detected at high mass defect in Fig. 3a has not been confidently determined, but they are inorganic compounds present amongst the NOM sample. Their magnitudes are intense because they have higher ionization efficiencies than the OM constituents. Compounds that exist as ions in solution will ionize much more readily by ESI than compounds that do not. ESI is a competitive ionization process, and the OM components simply cannot out-compete the inorganic compounds for the negative charge, hence explaining why OM peaks are detected at lower magnitudes than the inorganic compounds. Because the OM compounds are the analytes of interest, desalting techniques are utilized to remove the background of inorganic matrix. There is constant research being performed to determine the best method for desalting, isolating, and concentrating NOM samples. Traditionally, NOM was extracted from water, soils, and sediments as humic substances, which can be further categorized as fulvic acid, humic acid, and humin, depending on the pH at which they are soluble (Stevenson, 1994). Humic substances are extracted by well established acid/base laboratory protocols (Schnitzer and Khan, 1978; Thurman and Malcolm, 1981). More recently, DOM has been the focus of many studies interested in carbon cycling through groundwater, porewater, rivers, estuaries, and the ocean. Methods that are commonly employed to isolate the NOM from water are ultrafiltration, solid phase extraction, electrodialysis, and combined reverse osmosis electrodialysis. Each of these methods has certain problems associated, such as irreversible NOM sorption (lowering the NOM recovery of that technique), breakthrough
www.intechopen.com

Fourier Transforms - Approach to Scientific Principles
302
466.8 467.0 467.2 467.4m/z
a)
b)
a)
456.80785
466.75620
472.77303
478.78992
488.73797
494.74238
450 460 470 480 490 500m/z
459.23909
463.23407
475.23415
481.24480
489.24992b)
Magn
itu
de
Magn
itu
de
Fig. 3. Elizabeth River NOM analyzed by negative ion mode ESI-FTICR-MS before (a) and after (b) complete desalting by electrodialysis (expanded ranges are 450-500 m/z and 466.7-467.4 m/z). Peaks with high mass defects (0.7-0.9) are from incomplete desalting. More NOM peaks are detected when these compounds are not competing for a charge
www.intechopen.com

Fourier Transform Mass Spectrometry for the Molecular Level Characterization of Natural Organic Matter: Instrument Capabilities, Applications, and Limitations
303
contamination/bleeding, resin/membrane contamination of the NOM, and typically time consuming cleaning requirements (Simjouw et al., 2005; Mopper et al., 2007; Dittmar et al., 2008). These methods are biased by the chemical or physical properties that regulate the extraction procedure, and readers are referred to more in depth discussions of these desalting techniques, along with the pros and cons of each, in the references given above. In general, desalting and sample cleanup are important issues to consider when preparing samples for FTICR-MS. After the appropriate sample preparation is performed, the optimal ionization source should be identified. There are many different commercially available API sources for the application to NOM (Hoffmann and Stroobant, 2003), such as ESI (Bruins, 1991; Gaskell et al., 1997; Cech and Enke, 2001), chemical ionization (CI; Bruins, 1991; Harrison, 1992), and atmospheric pressure photoionization (APPI; Raffaelli and Saba, 2003; Bos et al., 2006; Purcell et al., 2007). Each method varies in its ionization mechanism, and, consequently, the analytical window for each is quite different. It is important to mention that non-ionizable compounds that exist in the NOM will be invisible to the mass spectrometer. This is important, because each ion source has its own innate bias and each can give a different resulting mass spectrum for the same NOM sample (Hockaday et al., 2009). The ionization methods mentioned above are known as ‘soft’, meaning that compounds are not fragmented (as they are in electron ionization) and molecular ions (M●+, M●-) or pseudomolecular ions, also known as molecular ion adducts [(M+H)+, (M+Na)+, (M-H)-, (M-Cl)-], are predominantly observed in the mass spectrum. Mechanistic studies of each of the ion sources are referenced above, but brief explanations of each are described here. CI introduces a reagent gas (methane is quite common, CH4) into the ion source to produce primary ions of the reagent gas (i.e., CH4●+) to collide with the molecule of interest. Through ion-molecule collisions, where the reagent gas ion acts as a Brønsted-Lowry acid and the analyte is a Brønsted-Lowry base, and proton transfer reactions, the analyte is ionized with minimal fragmentation. During ESI, the liquid sample is sprayed through a needle, and a high voltage difference between the spray needle and metal inlet induces a charge on the sprayed droplets. The charged droplet diminishes in size as the solvent is evaporated (by aid of heat or a drying gas), concentrating the charges held on the droplet. As charge-charge repulsions occur, the Rayleigh limit is exceeded, making the Coulombic repulsions greater than the surface tension of the droplet. The result is that the droplet bursts into many smaller droplets that can be completely desolvated, leaving only charged analyte ions in the gas phase for further introduction into the mass spectrometer. ESI operates in either positive or negative mode, depending on the functional group composition of the analyte. Functional groups that will readily lose a proton (such as alcohols, carboxylic acids, cyanides, peptides, nitric- and sulfonic- acids, and phosphates) are analyzed in negative ion mode. Basic functional groups that can easily gain a proton (i.e., amines, amides, peptides, and thiols) are analyzed in positive ion mode. By changing the pH of the sample solution (slightly basic for negative ion and slightly positive for positive ion), one can increase the ionization efficiencies for ESI. Another ion source of choice for analyzing less polar compounds is APPI, and APPI does not tend to suffer from charge competition with inorganic matrices, which is commonly observed in ESI. In APPI, ionization is initiated by supplying UV photons to the analyte molecule (typically via a krypton lamp). The analyte absorbs the photons and enters into an excited state. The analyte becomes ionized when the energy of the UV photons is greater than the ionization energy of the analyte. Dopants (such as toluene or tetrahydrofuran) are usually employed to act as intermediates between the
www.intechopen.com

Fourier Transforms - Approach to Scientific Principles
304
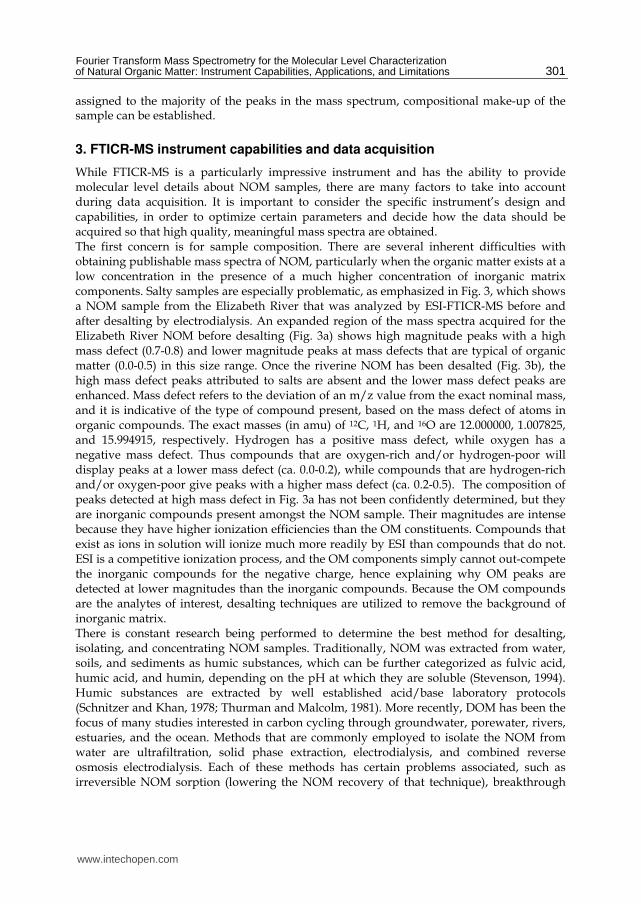
photons and analytes, so that charge exchange and proton transfer reactions can occur more readily, increasing the ionization of NOM molecules. Overall, before selecting an ion source, it is beneficial to know the bulk functional group composition of the sample (by previously obtained FTIR or NMR data), because then an informed decision can be made on which ion source(s) to employ for that specific sample. ESI and APPI are the most commonly used ion sources for the analysis of NOM, and Hockaday et al. (2009) performed a study to investigate which appeared to be optimal for a terrestrial sample obtained in the Dismal Swamp (Suffolk, VA, USA). They found that little overlap existed between the formulas assigned to APPI(+) and ESI(+ and -) mass spectral peaks, suggesting that data acquired from the two ion sources complemented each other greatly. Furthermore, APPI yielded formulas that were more aromatic and less polar than those from ESI, which is expected due to the ionization mechanism for each. Based on Hockaday et al. (2009) and the discussion of the types of compounds ionized by various ionization sources, many investigations of NOM do multiple-source FTICR-MS analyses to produce data that supplement each other, furthering the overall characterization of the NOM sample. Once the best ion source has been determined for a particular sample, the mass spectrometric parameters can be examined. The two main ways to acquire mass spectral data are either broadband mode or narrow scan mode. The vast majority of publications that analyze NOM by FTICR-MS utilize broadband mode, where all m/z values, across a wide range of generally 200-2000 m/z, are detected during the analysis. Narrow scan mode is commonly referred to as sequential selective ion accumulation (SSIA; Sleighter et al., 2009) or as selected ion monitoring (SIM; Kido Soule et al., 2010). During SSIA (or SIM), the initial mass analyzer [quadrupole for Sleighter et al. (2009) and linear ion trap for Kido Soule et al. (2010)] isolates ions within a narrow range of m/z values before transferring the ion packet to the ICR cell. The operator selects the range, and ions outside of this range will be eliminated by the initial mass analyzer, thus decreasing the total number of ions in the ICR cell simultaneously. Because there are fewer ions in the cell at the same time, space-charge effects are minimized, generally increasing the resolving power and selectively enhancing the S/N of the peaks. Using SSIA, the sample is analyzed multiple times, incrementally increasing the m/z range, so that the entire mass range is eventually covered. By this SSIA method, the m/z ranges are acquired in sequential ‘slices’, and these slices can be merged together to assemble the entire mass spectrum.
Whole water from the Dismal Swamp (Suffolk, VA, USA) was sterile filtered (0.2 μm) to remove particulates and bacteria and analyzed directly using both broadband and SSIA modes, as shown in Fig. 4. The colors in Fig. 4b show each ‘slice’ that was acquired, and the ‘slices’ overlap by approximately 30-40 m/z to ensure that no area is missed. The nominal mass region in Fig. 4 is shown in order to highlight the increase in S/N and resolving power. An S/N threshold of 3 is commonly used for peak-picking, and the increase in overall S/N using SSIA leads to a larger number of peaks detected. Table 2 gives details for the mass spectra shown in Fig. 4, parsed according to the m/z range that was acquired. This table shows that the increase in the number of peaks, S/N, and generally resolving power exists for SSIA across the entire mass range and is more substantial and pronounced at higher m/z values. The broadband analysis requires 20 minutes (1.0 sec ion accumulation and 200 co-added scans), while the SSIA analysis requires 30 minutes (1.0 sec ion accumulation and 50 co-added scans, for 6 separate m/z ranges). While the SSIA mode involves more time to acquire data, 2880 more peaks were detected during that time. It is important to note that while nearly 3000 more peaks were detected with SSIA, this does not
www.intechopen.com

Fourier Transform Mass Spectrometry for the Molecular Level Characterization of Natural Organic Matter: Instrument Capabilities, Applications, and Limitations
305
necessarily translate to 3000 more molecular formulas being assigned, because some of the extra peaks detected by SSIA are isotopic peaks.
540 580 620 660 700
425.0 425.1 425.2 425.3
250 300 350 400 450 500 550 600 650 m/z
425.0 425.1 425.2 425.3
540 580 620 660 700
Magn
itu
de
a)
b)
Fig. 4. Dismal Swamp whole water analyzed by negative ion mode ESI-FTICR-MS in broadband mode (a) and using sequential selective ion accumulation (b). The insets show expanded mass spectra at m/z 540-700 and 425.0-425.35, to show the peaks at higher m/z more clearly and to highlight the enhanced S/N achieved using SSIA
www.intechopen.com
Fourier Transforms - Approach to Scientific Principles
306
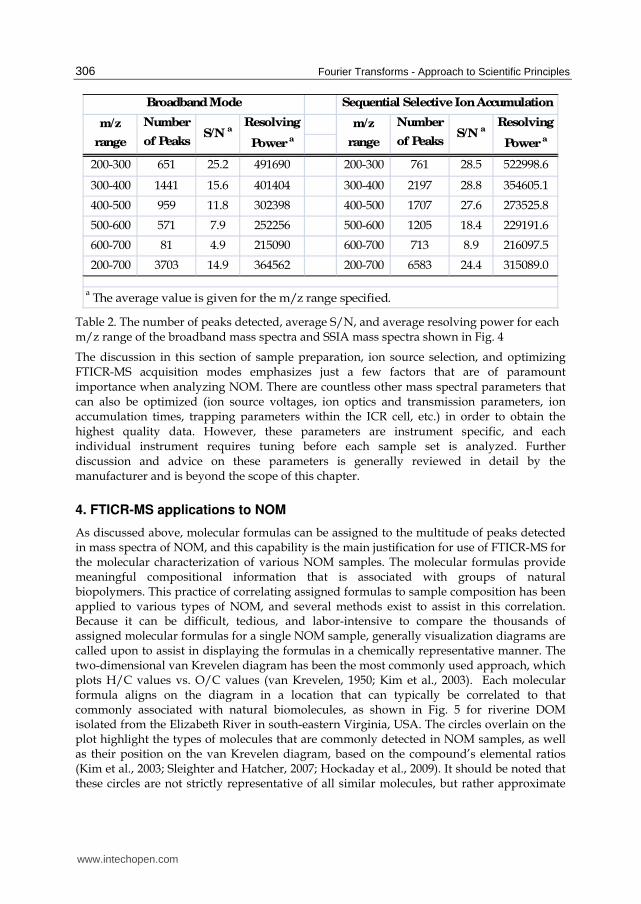
200-300 651 25.2 491690 200-300 761 28.5 522998.6
300-400 1441 15.6 401404 300-400 2197 28.8 354605.1
400-500 959 11.8 302398 400-500 1707 27.6 273525.8
500-600 571 7.9 252256 500-600 1205 18.4 229191.6
600-700 81 4.9 215090 600-700 713 8.9 216097.5
200-700 3703 14.9 364562 200-700 6583 24.4 315089.0
a The average value is given for the m/z range specified.
S/N a
Resolving
Power a
Broadband Mode Sequential Selective Ion Accumulation
Number
of Peaks S/N
aResolving
Power a
m/z
range
m/z
range
Number
of Peaks
Table 2. The number of peaks detected, average S/N, and average resolving power for each m/z range of the broadband mass spectra and SSIA mass spectra shown in Fig. 4
The discussion in this section of sample preparation, ion source selection, and optimizing FTICR-MS acquisition modes emphasizes just a few factors that are of paramount importance when analyzing NOM. There are countless other mass spectral parameters that can also be optimized (ion source voltages, ion optics and transmission parameters, ion accumulation times, trapping parameters within the ICR cell, etc.) in order to obtain the highest quality data. However, these parameters are instrument specific, and each individual instrument requires tuning before each sample set is analyzed. Further discussion and advice on these parameters is generally reviewed in detail by the manufacturer and is beyond the scope of this chapter.
4. FTICR-MS applications to NOM
As discussed above, molecular formulas can be assigned to the multitude of peaks detected in mass spectra of NOM, and this capability is the main justification for use of FTICR-MS for the molecular characterization of various NOM samples. The molecular formulas provide meaningful compositional information that is associated with groups of natural biopolymers. This practice of correlating assigned formulas to sample composition has been applied to various types of NOM, and several methods exist to assist in this correlation. Because it can be difficult, tedious, and labor-intensive to compare the thousands of assigned molecular formulas for a single NOM sample, generally visualization diagrams are called upon to assist in displaying the formulas in a chemically representative manner. The two-dimensional van Krevelen diagram has been the most commonly used approach, which plots H/C values vs. O/C values (van Krevelen, 1950; Kim et al., 2003). Each molecular formula aligns on the diagram in a location that can typically be correlated to that commonly associated with natural biomolecules, as shown in Fig. 5 for riverine DOM isolated from the Elizabeth River in south-eastern Virginia, USA. The circles overlain on the plot highlight the types of molecules that are commonly detected in NOM samples, as well as their position on the van Krevelen diagram, based on the compound’s elemental ratios (Kim et al., 2003; Sleighter and Hatcher, 2007; Hockaday et al., 2009). It should be noted that these circles are not strictly representative of all similar molecules, but rather approximate
www.intechopen.com

Fourier Transform Mass Spectrometry for the Molecular Level Characterization of Natural Organic Matter: Instrument Capabilities, Applications, and Limitations
307
guidelines for identifying compounds of similar composition. Relating formulas to compound classes in this manner has been exploited in many studies of various types of NOM over the years, and interested readers are referred to the literature for more details (Sleighter and Hatcher, 2007; Reemtsma, 2009; references therein).
0.0
0.5
1.0
1.5
2.0
2.5
0.0 0.2 0.4 0.6 0.8 1.0 1.2
H/C
O/C
lipidsproteins amino
sugars
carbohydrates
tannins
condensed aromatics
unsaturated hydrocarbons
lignin
Fig. 5. van Krevelen diagram for Elizabeth River NOM isolated by small-scale electrodialysis and subsequent analysis by negative ion mode ESI-FTICR-MS. Overlain circles are used as broad indicators of where biomolecules fall on the plot (Sleighter and Hatcher, 2008; Hockaday et al., 2009; Ohno et al., 2010)
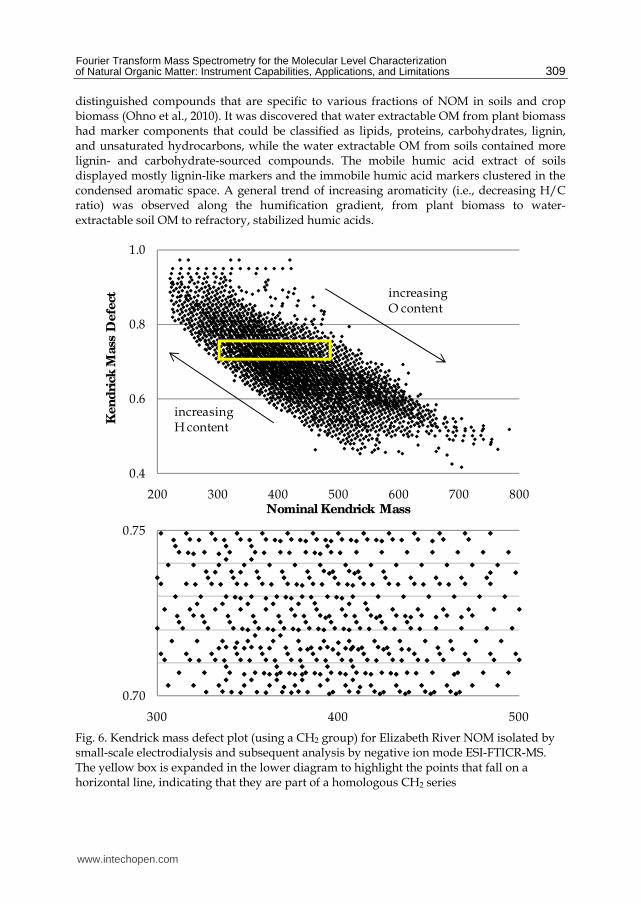
Another diagram that is often used for NOM characterization is the Kendrick mass defect (KMD) plot (Kendrick, 1963). KMD analysis converts m/z values to Kendrick mass values by multiplying the m/z value by the ratio of the nominal mass CH2 group (14.00000) to the exact mass of a CH2 group (14.01565), as shown below in equation 3. Then, KMD is determined by subtracting the nominal Kendrick mass (KM) from KM, as shown in equation 4. KMD values can then be plotted against their nominal KM values (as shown in Fig. 6), and formulas with the same KMD, those falling on a horizontal line, differ only by a CH2 group (or multiple CH2 groups). KMD values increase with the number of added H atoms, thus aliphatic compounds will have high KMD values and aromatic compounds will have lower KMD values. This coincides with mass spectral data expanded at individual nominal masses, where m/z values with low mass defects are hydrogen-poor and m/z values with higher mass defects are hydrogen-rich (as shown in Fig. 2e and Table 1).
Kendrick Mass (KM) = m/z value * (14.00000/14.01565) (3)
www.intechopen.com

Fourier Transforms - Approach to Scientific Principles
308
Kendrick Mass Defect (KMD) = KM – nominal KM (4)
Originally, KMD was utilized for assigning molecular formulas, by establishing homologous CH2 series that could be expanded from low m/z to high m/z (Stenson et al., 2003). Peaks at low m/z can more easily be assigned a molecular formula because fewer formulas exist within the selected error limit (usually 0.5 ppm). Generally, only 1 molecular formula exists within this error for peaks less than 500 m/z, but beyond this value, multiple formulas are possible. Once molecular formulas are unambiguously assigned to peaks of low m/z, peaks at high m/z values that have multiple formula choices can be related to formulas assigned at lower mass by assuming that they belong to a CH2 homologous series. If one of the formulas belongs to a homologous series, then it is very likely the correct formula, and the others can be eliminated. This approach to formula assignment is called ‘formula extension’ and can be performed manually or written into software designed to assist in formula assignment (Kujawinski and Behn, 2006; Grinhut et al., 2010). While CH2 is the most commonly used group, other functional groups can be utilized (i.e., OCH2, COO, O, H2O, H2, etc.) depending upon the make-up of the sample (Sleighter and Hatcher, 2007). Because of the recent growth in use of FTICR-MS for the analysis of NOM, articles have
been published summarizing the findings of these studies and making suggestions for
future work (Sleighter and Hatcher, 2007; Reemtsma, 2009). Most recently, multivariate
statistical analysis in combination with visualization diagrams have been utilized to
evaluate relationships among sample sets. Hierarchal cluster analysis (HCA) seeks
correlations among samples displayed in a data matrix and illustrates the results in a
hierarchical tree, or a dendrogram, where the branching reveals the similarity among the
samples. HCA has been utilized in numerous studies, one of which shows that there are no
significant differences between the formulas assigned to a depth profile of DOM from the
Weddell Sea (Koch et al., 2005). In other studies, Dittmar et al. (2007) compared DOM from
coastal mangrove forests (before and after photo-irradiation) to open ocean seawater. They
found that photo-degraded mangrove DOM becomes similar in composition to open ocean
seawater DOM. Koch et al. (2008) evaluated the various fractions of DOM collected from
reversed phase HPLC separations, and Schmidt et al. (2009) used HCA statistical
correlations to differentiate between pore water DOM and riverine DOM. While HCA is
very useful for grouping samples based on their similarity, it does not indicate the reasons
why the samples are similar or different. The variation between the samples is not
explained, and another method is required for this determination.
By combining HCA with another statistical method, the variance between samples can be elucidated. Kujawinski et al. (2009) employed HCA combined with both non-metric multi-dimensional scaling (NMS) and indicator species analysis (ISA) to optimize the a priori grouping of samples for subsequent ISA, where specific mass spectral m/z values can be identified as an indicator species for a certain group of samples. Once all the indicator species for the samples are identified, then molecular formulas were examined more closely. Indicator species for surface ocean DOM samples were speculated to be biologically-derived and to represent a more labile component of the marine DOM pool, while indicator species for riverine/estuarine DOM were found to be similar in composition to lignin-derived species that have been linked to terrestrially-sourced DOM. Bhatia et al. (2010) also used these multivariate statistical methods recently to characterize DOM from the Greenland ice sheet and were able to link subglacial, supraglacial, and proglacial DOM to various allochthonous and autochthonous sources and processes. Another recent study utilizing ISA
www.intechopen.com
Fourier Transform Mass Spectrometry for the Molecular Level Characterization of Natural Organic Matter: Instrument Capabilities, Applications, and Limitations
309
distinguished compounds that are specific to various fractions of NOM in soils and crop biomass (Ohno et al., 2010). It was discovered that water extractable OM from plant biomass had marker components that could be classified as lipids, proteins, carbohydrates, lignin, and unsaturated hydrocarbons, while the water extractable OM from soils contained more lignin- and carbohydrate-sourced compounds. The mobile humic acid extract of soils displayed mostly lignin-like markers and the immobile humic acid markers clustered in the condensed aromatic space. A general trend of increasing aromaticity (i.e., decreasing H/C ratio) was observed along the humification gradient, from plant biomass to water-extractable soil OM to refractory, stabilized humic acids.
0.4
0.6
0.8
1.0
200 300 400 500 600 700 800
increasing H content
increasing O content
0.70
0.75
300 400 500
Nominal Kendrick Mass
Ken
dri
ck M
ass
Defe
ct
Fig. 6. Kendrick mass defect plot (using a CH2 group) for Elizabeth River NOM isolated by small-scale electrodialysis and subsequent analysis by negative ion mode ESI-FTICR-MS. The yellow box is expanded in the lower diagram to highlight the points that fall on a horizontal line, indicating that they are part of a homologous CH2 series
www.intechopen.com

Fourier Transforms - Approach to Scientific Principles
310
By combining HCA with PCA, Hur et al. (2010) developed a method for comparing multiple petroleum samples that were analyzed by APPI-FTICR-MS. Using these multivariate statistical tools, twenty petroleum samples could be compartimentalized into numerous compositional groups, such as those enriched in hydrocarbons, oxygen series (O1, O2), nitrogen series (N1, N1O1), or sulfur series (S1, S2, O1S1). Sleighter et al. (2010) also employed a combined approach of HCA and PCA, but in this study the goal was to characterize 38 NOM samples along a terrestrial to marine transect of the lower Chesapeake Bay and coastal Atlantic Ocean, using samples that were prepared for mass spectral analysis by either sterile filtration only, solid phase C18 extraction, or small-scale electrodialysis. Not only were differences detected between NOM samples from various locations, but it was also found that the method of preparation for the same NOM sample changed its composition, as determined by ESI-FTICR-MS. Terrestrial samples contained lignin, tannin, and condensed aromatic structures in high relative magnitude, while marine DOM was composed more of aliphatic and lignin-like compounds, as well as compounds containing more heteroatom (NSP) functionalities. Samples desalted by electrodialysis retained the more polar compounds (tannins, carbohydrates, and those containing heteroatoms) that were eliminated during the C18 extraction procedure. Overall, these recent developments in NOM characterization, made by exploiting multivariate statistical analyses, highlight the direction in which the NOM community is progressing. It is very likely that statistical analyses will become more commonplace, especially as researchers continue to accumulate large sample sets that would be otherwise very difficult to analyze manually.
5. Limitations of FTICR-MS
A major concern regarding the use of FTICR-MS for NOM characterization in recent years has been establishing an appropriate instrumental/solvent blank, to evaluate the background peaks detected in the mass spectra. Most analytical techniques have a straightforward manner for nulling the blanks, such as a basic background subtraction of the blank analysis from the sample analysis. Unfortunately, this method cannot be applied so simply when using a competitive ionization source such as ESI. Most NOM samples are analyzed in a mixture of methanol and water, thus a clean solvent blank of methanol and water is typically evaluated before analyzing samples. However, any contaminants present within the instrument itself will not have any analyte molecules with which to compete for charge. Thus, these substances acquire most of the charge, giving them an enhanced magnitude in the mass spectra. Once a sample is introduced, the analyte molecules out-compete the contaminants for the charge in most cases, and then those contaminants are only observed at lower absolute and relative magnitudes, as shown for Mount Rainier humic acid in Fig. 7. The NOM sample is analyzed at various concentrations, to determine which concentration is sufficient to out-compete most (if not all) of the contaminants present in the FTICR-MS. For peaks that are detected in both the blank and the NOM sample, it is difficult to determine if that peak is actually in the sample or if it is due to contamination. In the case of Fig. 7, m/z 415.322 is detected at nearly a constant magnitude in the instrument/ solvent blank and at each concentration of Mount Rainier humic acid. Because the other contaminants (at 414.8–414.9 and 415.27) are nearly eliminated at 50 mg/L OM, it is likely that m/z 415.322 is present in the NOM sample, since it continues to be detected at all NOM concentrations. Nonetheless, some researchers err on the side of caution and argue that this peak should be removed from further analysis, since it is detected in the blank as well. Only 1 nominal mass region is highlighted in Fig. 7 as an example, but this trend in blank
www.intechopen.com
Fourier Transform Mass Spectrometry for the Molecular Level Characterization of Natural Organic Matter: Instrument Capabilities, Applications, and Limitations
311
dilution/elimination occurs across the entire mass spectral range of 200-800 m/z. Thus, it is common to question the existence of several hundred peaks that are detected in each NOM sample that also overlap with the peaks in the blank. There is not currently a standard protocol among researchers for determining when to remove peaks from analysis, but typically the most conservative approach is taken and overlapping peaks in the blank and sample are removed from consideration as analyte peaks. It is important, though, to understand the overlap between solvent blank and sample analysis, so that peaks that are important to the NOM composition are not considered artifacts of the instrument itself. Another concern, when analyzing samples as complex as NOM, is peak reproducibility. The vast majority of published studies only analyze each sample once, rather than in replicate. This is due to sample throughput and cost. However, more recently, there has been more concern for reproducibility in order to characterize NOM reliably. The sample must be analyzed, in either duplicate or triplicate, to ensure reproducibility. This facilitates comparison of solvent or instrument blanks to replicate injections, enabling decisions as to which peaks should be included for further data analysis. Kido Soule et al. (2009) discovered that broadband acquisitions offer the highest repeatability for peaks detected and peak height (along with highest throughput), when compared to SSIA (or SIM) acquisition. In a recent study, Hur et al. (2010) analyzed 20 petroleum samples by APPI in triplicate over the course of 2 consecutive days. They reported that the three mass spectra for each sample were quite consistent, showing standard deviations of less than 5% of the initial values. Sleighter et al. (2010) performed a study comparing a single sample analyzed on different days by replicate injections of Dismal Swamp (Suffolk, VA, USA) whole water over the course of 31 days. The mass spectra produced were visually very similar, and multivariate statistics was utilized to evaluate the reproducibility. Based on HCA and PCA, the different analyses were found to be virtually identical when compared to a variety of other samples. These three studies highlight that ESI-FTICR-MS has the potential to be very reproducible and reliable, when the same instrumental parameters are utilized. However, no studies have tested the repeatability for various instrument operators or for the same sample analyzed on different FTICR-MS instruments. Another unknown factor in the analysis is the fraction of the NOM that is identified by FTICR-MS. The ion sources described here for coupling to FTICR-MS are well known to exhibit biases for certain types of molecules, depending on the ionization mechanism and the ionization efficiency of the analyte in the midst of a complex matrix. If only 5% of the NOM is ‘observed’ by FTICR-MS, rather than 50% (or perhaps even higher), then the implications are enormous for complete characterization. Based on this concern, Hockaday et al. (2009) suggest that an internal standard be made widely available for spiking into NOM samples prior to FTICR-MS analysis. Using this approach, the ion source performance on various instruments could be assessed and compared. Furthermore, this standard could also used for internal calibration, making datasets acquired on different instruments by various operators more comparable. Once a high quality mass spectrum is obtained for a NOM sample, data analysis can proceed in order to obtain molecular level characterization. This characterization is performed by assigning the m/z values of peaks detected to molecular formulas, by using a molecular formula calculator. First, one must determine which atoms to consider for assignment. Typically C, H, O, N, and S are used, although some studies also include P, Na, and/or Cl. It is well known that the number of possible molecular formulas increases with increasing 1) permissible error difference between measured m/z and exact calculated m/z for the formula in question; 2) m/z value (higher m/z peaks are inherently less precisely measured); and 3) number of atoms used for formula assignment (Kim et al., 2006;
www.intechopen.com

Fourier Transforms - Approach to Scientific Principles
312
Kujawinski and Behn, 2006; Koch et al., 2007; Reemstma, 2009), as shown in Fig. 8. As one can see, increasing the allowable error and including more elements significantly increases the number of chemically possible formulas. The relationship between resolving power and the error difference between two formulas with slight differences in m/z values is reviewed in the four references given above, but Kim et al. (2006) reported that all theoretically possible elemental compositions of C,H,N,O,S up to 500 Da could be resolved at an accuracy of approximately 0.1 mDa (corresponding to a resolving power of 5,000,000 at m/z 500), allowing for a unique molecular formula to be assigned with confidence. While resolving powers of this magnitude are not currently routinely achieved during the analysis of NOM, it is likely that as technology continues to improve and FTICR-MS instruments at high magnetic fields are utilized, that these values will be achieved in the near future.
414.84494
415.26994415.32157
414.7 414.9 415.1 415.3 415.5m/z
414.84501
415.10343415.27011
415.32165
414.84546
415.10368
415.32185
415.10370
415.22012 415.32160
Magn
itu
de
415.06733415.14001
415.06732
415.14001
415.13974
a) Instrument /Solvent Blank
b) Mount Rainier humic acid,
5 mg/L
c) Mount Rainier humic acid,
25 mg/L
d) Mount Rainier humic acid,
50 mg/L
Fig. 7. Negative ion mode ESI-FTICR mass spectra of a) instrument/solvent blank (1:1 water:methanol with 0.1% ammonium hydroxide) and Mount Rainier humic acid dissolved at 5 (b), 25 (c), and 50 (d) mg/L organic matter in 1:1 water:methanol with 0.1% ammonium hydroxide. The broadband mass spectrum has been expanded at 414.7 – 415.5 m/z
www.intechopen.com

Fourier Transform Mass Spectrometry for the Molecular Level Characterization of Natural Organic Matter: Instrument Capabilities, Applications, and Limitations
313
0
5
10
15
20
25
30
35
40
0.1 0.5 1 2 3 5 8 10
Nu
mb
er of
Ch
em
icall
y
Poss
ible
Form
ula
s
Error (ppm)
C1-50; H1-100; O0-30
C1-50; H1-100; O0-30; N0-5; S0-3
C1-50; H1-100; O0-30; N0-5; S0-3; P0-2
Fig. 8. The number of chemically possible molecular formulas for hypothetical m/z 499.21257 at various error values for the different elemental compositions specified in the legend
The inherent complexity incurred while assigning a unique molecular formula to an individual m/z value is highlighted in Fig. 8, and this difficulty is amplified when the task at hand is to assign thousands of m/z values to formulas for a single NOM sample. This process can be very labor-intensive. However, by carefully calibrating the mass spectral data, lower error differences can be tolerated (0.5 ppm has become quite common in the literature), to minimize the number of formulas that match the measured mass within the selected error. There are also other methods to assist in the determination of molecular formulas, such as using KMD analysis and the ‘formula extension’ approach, as described above. Furthermore, establishing rules that the formulas must obey (as in Stubbins et al., 2010), to be assigned to a chemically relevant molecule, also helps to reduce the number of possible formulas. Formulas that are unlikely to be acceptable can be identified by examining the isotopic peak(s) as described by Koch et al. (2007) and featured in Fig. 9. Based on the natural abundance of 13C (1.1%), the number of carbons in the correct formula can be calculated from the relative magnitude of the 13C peak, eliminating incorrect formulas (Fig. 9a). In the case of Fig. 9b and 9c, C20H27O7- is determined to be the correct formula for the peak, because the predicted relative abundance of its 13C isotopologue is much closer to what is detected in Fig. 9a than it is for the formula C16H30N1O7P1- in Fig. 9c. For Fig. 9d, the peak at 487.30445 is not initially assigned a molecular formula, because Cl is not included in the formula assignment parameters. Upon closer inspection of the peak, the distinctive isotope pattern for Cl- adducts is observed and matches very closely to that of a simulated theoretical pattern for C23H48O8Cl1- (Fig. 9e). Koch et al. (2007) cautions that the S/N of the isotopic peak should be at least 25, otherwise the deviation (between the number of carbons in the proposed formula and that calculated from the relative magnitude) is too great to be a reliable tool for formula elimination. In general, by ensuring that an accurate
www.intechopen.com

Fourier Transforms - Approach to Scientific Principles
314
e) simulated
mass spectrum for C23H48O8Cl1
-
d) coastal marine DOM
Magn
itu
de
0.25 x 10⁷
0.75 x 10⁷
1.25 x 10⁷
1000
2000
487.0 488.0 489.0 490.0m/z
1
32
4
1
324
1 487.30445 13632822 1
2 488.30781 3337822 24.5%
3 489.30151 4399014 32.3%
4 490.30483 1128877 8.3%
Peak m/z Mag. Rel. Mag.
1 487.30432 2000 1 12C23H48O835Cl1
- -0.3
2 488.30775 515 25.8% 13C112C22H48O8
35Cl1- -0.1
3 489.30137 639 32.0% 12C23H48O837Cl1
- -0.3
4 490.30479 163 8.2% 13C112C22H48O8
37Cl1- -0.1
Peak ErrorFormulam/z Mag. Rel. Mag.
a) coastal marine DOM
b) simulated mass spectrum for C20H27O7-
c) simulated mass spectrum for C16H30N1O7P1-
1
21 x 106
2 x 10⁶
3 x 10⁶
1000
2000
1000
2000
379.0 379.4 379.8 380.2m/z
1
1
2
2
Magn
itu
de
1 379.17638 3655020 1
2 380.17976 797936 21.8%
Peak m/z Mag. Rel. Mag.
1 379.17623 2000 1 12C20H27O7- -0.4
2 380.17963 444 22.2% 13C112C19H27O7
- -0.3
Peak Formulam/z Mag. Rel. Mag. Error
1 379.17654 2000 1 12C16H30N1O7P1- 0.4
2 380.17996 358 17.9% 13C112C15H30N1O7P1
- 0.5
Peak Formulam/z Mag. Rel. Mag. Error
Fig. 9. Coastal marine DOM isolated by C18 solid phase extraction and subsequent analysis by negative ion mode ESI-FTICR-MS, expanded at 379.0-380.2 m/z (a) and 487.0-490.5 m/z (d), along with the simulated isotope patterns for the possible formulas specified (b, c, e). Error values are in ppm
www.intechopen.com

Fourier Transform Mass Spectrometry for the Molecular Level Characterization of Natural Organic Matter: Instrument Capabilities, Applications, and Limitations
315
calibration is achieved, setting a low error difference, utilizing KMD analysis and elemental ratio rules, and exploiting isotopic relative abundances, one can assign molecular formulas more easily and with additional confidence. Ideally, a generally accepted protocol should be established and each of these tools could be written into a standard software program, similar to that developed by Kujawinski and Behn (2006). Then data analysis consistency between samples would be more reliable, and human error introduced by different analysts could be minimized. This specific step has yet to be taken, but with emerging literature in which suggestions are made regarding formula assignment rules, some standardization will become reality in the near future. Even though data analysis of FTICR mass spectra of NOM can provide accurate molecular formulas for the peaks detected, structural information for these peaks, which is often the key to understanding the source of the NOM, still remains elusive. Previous FTICR-MS studies focused on molecular characterization of DOM from terrestrial and marine waters have found that a significant overlap of the mass spectra is observed, as approximately 30% of the assigned formulas are shared between the two different types of DOM (Koch et al., 2005; Sleighter and Hatcher, 2008). However, mass spectrometry cannot distinguish structural isomers of an elemental composition, so the possibility exists that identifying the same elemental formula in multiple samples does not necessarily mean that their molecular structures also correspond. For these reasons, tandem mass spectrometry (MS/MS) has been employed to isolate and fragment ions in the mass spectrometer, and this can provide structural information. Because the ions detected during the mass spectral analysis of NOM are predominantly singly charged, only neutral losses (i.e., H2O, COO, CO, and OCH2) have been observed by MS/MS using FTICR-MS (Stenson et al., 2003; Reemtsma et al., 2008; Witt et al., 2009; Liu et al., 2011) and other lower resolution mass spectrometers (Fievre et al., 1997; Plancque et al., 2001; Leenheer et al., 2001; McIntyre et al., 2002). Furthermore, the complexity of NOM samples and the proximity of peaks detected at each nominal mass makes it particularly difficult to isolate a single peak in the mass spectrometer for fragmentation and subsequent detection of those fragments. While it is possible to do this, as shown by Witt et al. (2009), fragmenting each peak detected at every nominal mass from approximately 200-800 m/z by FTICR-MS/MS is quite a daunting task, one that will be labor intensive and require long instrument run times. The mass of data that would be acquired during such a study would also require months (if not longer) to correlate and understand. Nonetheless, the wealth of information obtained from a very thorough study could perhaps answer many questions regarding the structures of overlapping molecular formulas, but it is more likely that MS/MS will be utilized in the near future for specific target compounds that have been found to be markers for particular samples.
6. Conclusions
FTICR-MS coupled to API sources is clearly a powerful technique for the examination of the complex composition of NOM and has facilitated the overall characterization of NOM from a variety of source materials. The advent of API sources has allowed for the ionization of large, nonvolatile compounds, and its application to the polar, polyelectrolytic NOM mixtures has made a significant contribution to the understanding of the composition and reactivity of NOM. The ultrahigh resolving powers of FTICR-MS, those in the range of 105, can separate and resolve the numerous peaks per nominal mass detected for NOM samples, making it the mass spectrometer of choice for investigations of NOM. Furthermore, the
www.intechopen.com
Fourier Transforms - Approach to Scientific Principles
316
accuracy of the instrument is capable of determining m/z values to the fifth decimal place, from which molecular formula assignments can be made fairly reliably. The ability to assign formulas to the multitude of peaks detected across the mass range of 200-1000 allows for the characterization of NOM at the molecular level. In this review, we have described the application of FTICR-MS to the analysis of NOM, discussed some important parameters for sample preparation and the acquisition of high quality data, reviewed some of the recent publications of NOM studies utilizing FTICR-MS, assessed the emergence and importance of recent statistical methods, and evaluated the current limitations of the instrument and subsequent data processing. All things considered, the precision, sensitivity, and ultrahigh resolution offered by FTICR-MS reveals molecular level details of NOM composition, which has transformed our knowledge of NOM chemistry. We are confident that as FTICR-MS technology continues to improve, that this instrumentation will be utilized more widely and will lead to significant advancements in not only the areas of analytical and environmental chemistry, but also for the NOM, chemical oceanography, and mass spectrometry communities.
7. References
Bhatia, M.P.; Das, S.B.; Longnecker, K.; Charette, M.A. & Kujawinski, E.B. (2010). Molecular characterization of dissolved organic matter associated with the Greenland ice sheet. Geochimica et Cosmochimica Acta, 74, 13, 3768-3784.
Bos, S.J.; van Leeuwen, S.M. & Karst, U. (2006). From fundamentals to applications: recent developments in atmospheric pressure photoionization mass spectrometry. Analytical and Bioanalytical Chemistry, 384, 1, 85-99.
Bruins, A.P. (1991). Mass spectrometry with ion sources operating at atmospheric pressure. Mass Spectrometry Reviews, 10, 1, 53-77.
Canadell, J.G.; Le Quéré, C.; Raupach, M.R.; Field, C.B.; Buitenhuis, E.T.; Ciais, P.; Conway, T.J.; Gillett, N.P.; Houghton, R.A. & Marland, G. (2007). Contributions to accelerating atmospheric CO2 growth from economic activity, carbon intensity, and efficiency of natural sinks. Proceedings of the National Academy of Sciences, 104, 47, 18866-18870.
Cech, N.B. & Enke, C.G. (2001). Practical implications of some recent studies in electrospray ionization fundamentals. Mass Spectrometry Reviews, 20, 6, 362-387.
Dittmar, T.; Whitehead, K.; Minor, E.C. & Koch, B.P. (2007). Tracing terrigenous dissolved organic matter and its photochemical decay in the ocean by using liquid chromatography/mass spectrometry. Marine Chemistry, 107, 3, 378-387.
Dittmar, T.; Koch, B.; Hertkorn, N. & Kattner, G. (2008). A simple and efficient method for the solid phase extraction of dissolved organic matter (SPE-DOM) from seawater. Limnology and Oceanography: Methods, 6, 230-235.
Eglinton, T.I. & Repeta, D.J. (2003). Organic matter in the contemporary ocean, In: Treatise on
Geochemistry, volume 6, H.D. Holland & K.K. Turekian (Eds.), 145-180, Elsevier, Morristown.
Fievre, A.; Solouki, T.; Marshall, A.G. & Cooper, W.T. (1997). High-resolution Fourier transform ion cyclotron resonance mass spectrometry of humic and fulvic acids by laser desorption/ionization and electrospray ionization. Energy and Fuels, 11, 3, 554-560.
www.intechopen.com

Fourier Transform Mass Spectrometry for the Molecular Level Characterization of Natural Organic Matter: Instrument Capabilities, Applications, and Limitations
317
Gaskell, S.J. (1997). Electrospray: principles and practice. Journal of Mass Spectrometry, 32, 7, 677-688.
Grinhut, T.; Lansky, D.; Gaspar, A.; Hertkorn, N.; Schmitt Kopplin, P.; Hadar, Y. & Chen, Y. (2010). Novel software for data analysis of Fourier transform ion cyclotron resonance mass spectra applied to natural organic matter. Rapid Communications in
Mass Spectrometry, 24, 19, 2831-2837. Harrison, A.G. (1992). Chemical ionization mass spectrometry, CRC Press, Boca Raton. Hatcher, P.G.; Dria, K.J.; Kim, S. & Frazier, S.W. (2001). Modern analytical studies of humic
substances. Soil Science, 166, 11, 770-794. Hedges, J.I. (1992). Global biogeochemical cycles: progress and problems. Marine Chemistry,
39, 1-3, 67-93. Hockaday, W.C.; Purcell, J.M.; Marshall, A.G.; Baldock, J.A. & Hatcher, P.G. (2009).
Electrospray and photoionization mass spectrometry for the characterization of organic matter in natural waters: a qualitative assessment. Limnology and
Oceanography: Methods, 7, 81-95. Hoffmann, E. & Stroobant, V. (2003). Mass Spectrometry: Principles and Applications, Wiley,
Chichester. Hur, M.; Yeo, I.; Park, E.; Kim, Y.; Yoo, J.; Kim, E.; No, M.; Koh, J. & Kim, S. (2010).
Combination of statistical methods and Fourier transform ion cyclotron resonance mass spectrometry for more comprehensive, molecular-level interpretations of petroleum samples. Analytical Chemistry, 82, 1, 211-218.
Kendrick, E. (1963). A mass scale based on CH2= 14.0000 for high resolution mass spectrometry of organic compounds. Analytical Chemistry, 35, 13, 2146-2154.
Kido Soule, M.C.; Longnecker, K.; Giovannoni, S.J. & Kujawinski, E.B. (2010). Impact of instrument and experiment parameters on reproducibility of ultrahigh resolution ESI FT-ICR mass spectra of natural organic matter. Organic Geochemistry, 41, 8, 725-733.
Kim, S.; Kramer, R.W. & Hatcher, P.G. (2003). Graphical method for analysis of ultrahigh-resolution broadband mass spectra of natural organic matter, the van Krevelen diagram. Analytical Chemistry, 75, 20, 5336-5344.
Kim, S.; Rodgers, R.P. & Marshall, A.G. (2006). Truly "exact" mass: Elemental composition can be determined uniquely from molecular mass measurement at similar to 0.1 mDa accuracy for molecules up to similar to 500 Da. International Journal of Mass
Spectrometry, 251, 2-3, 260–265. Koch, B.P.; Witt, M.; Engbrodt, R.; Dittmar, T. & Kattner, G. (2005). Molecular formulae of
marine and terrigenous dissolved organic matter detected by electrospray ionization Fourier transform ion cyclotron resonance mass spectrometry. Geochimica et Cosmochimica Acta, 69, 13, 3299-3308
Koch, B.P.; Dittmar, T.; Witt, M. & Kattner, G. (2007). Fundamentals of molecular formula assignment to ultrahigh resolution mass data of natural organic matter. Analytical
Chemistry, 79, 4, 1758-1763. Koch, B.P.; Ludwichowski, K.U.; Kattner, G.; Dittmar, T. & Witt, M. (2008). Advanced
characterization of marine dissolved organic matter by combining reversed-phase liquid chromatography and FT-ICR-MS. Marine Chemistry, 111, 3-4, 233-241.
Kujawinski, E.B.; Freitas, M.A.; Zang, X.; Hatcher, P.G.; Green-Church, K.B. & Jones, R.B. (2002). The application of electrospray ionization mass spectrometry (ESI MS) to the
www.intechopen.com
Fourier Transforms - Approach to Scientific Principles
318
structural characterization of natural organic matter. Organic Geochemistry, 33, 3, 171-180.
Kujawinski, E.B. & Behn, M.D. (2006). Automated analysis of electrospray ionization Fourier transform ion cyclotron resonance mass spectra of natural organic matter. Analytical Chemistry, 78, 13, 4363-4373.
Kujawinski, E.B.; Longnecker, K.; Blough, N.V.; Del Vecchio, R.; Finlay, L.; Kitner, J.B. & Giovannoni, S.J. (2009). Identification of possible source markers in marine dissolved organic matter using ultrahigh resolution mass spectrometry. Geochimica
et Cosmochimica Acta, 73, 15, 4384-4399. Leenheer, J.A.; Rostad, C.E.; Gates, P.M.; Furlong, E.T. & Ferrer, I. (2001). Molecular
resolution and fragmentation of fulvic acid by electrospray ionization/multistage tandem mass spectrometry. Analytical Chemistry, 73, 7, 1461-1471.
Leenheer, J.A. & Croué, J.P. (2003). Characterizing aquatic dissolved organic matter. Environmental Science and Technology, 37, 1, 18A-26A.
Liu, Z.; Sleighter, R.L.; Zhong, J.; & Hatcher, P.G. (2011). The chemical changes of DOM from black waters to coastal marine waters by HPLC combined with ultrahigh resolution mass spectrometry. Estuarine, Coastal and Shelf Science, in press.
Marshall, A.G.; Hendrickson, C.L. & Jackson, G.S. (1998). Fourier transform ion cyclotron resonance mass spectrometry: A primer. Mass Spectrometry Reviews, 17, 1, 1-35.
McIntyre, C.; Batts, B.D. & Jardine, D.R. (1997). Electrospray mass spectrometry of groundwater organic acids. Journal of Mass Spectrometry, 32, 3, 328–330.
McIntyre, C.; McRae, C.; Jardine, D. & Batts, B.D. (2002). Identification of compound classes in soil and peat fulvic acids as observed by electrospray ionization tandem mass spectrometry. Rapid Communications in Mass Spectrometry, 16, 16, 1604-1609.
Mopper, K.; Stubbins, A.; Ritchie, J.D.; Bialk, H.M. & Hatcher, P.G. (2007). Advanced instrumental approaches for characterization of marine dissolved organic matter: extraction techniques, mass spectrometry, and nuclear magnetic resonance spectroscopy. Chemical Reviews, 107, 2, 419-442.
Ohno, T.; He, Z.; Sleighter, R.L.; Honeycutt, C. & Hatcher, P.G. (2010). Ultrahigh resolution mass spectrometry and indicator species analysis to identify marker components of soil- and plant biomass- derived organic matter fractions. Environmental Science and
Technology, 44, 22, 8594-8600. Perdue, E.M. & Ritchie, J.D. (2003). Dissolved organic matter in freshwaters, In: In: Treatise
on Geochemistry, volume 5, 273-318, Elsevier. Plancque, G.; Amekraz, B.; Moulin, V.; Toulhoat, P. & Moulin, C. (2001). Molecular structure
of fulvic acids by electrospray with quadrupole time-of-flight mass spectrometry. Rapid Communications in Mass Spectrometry, 15, 10, 827-835.
Purcell, J.M.; Hendrickson, C.L.; Rodgers, R.P. & Marshall, A.G. (2007). Atmospheric pressure photoionization proton transfer for complex organic mixtures investigated by Fourier transform ion cyclotron resonance mass spectrometry. Journal of the
American Society for Mass Spectrometry, 18, 9, 1682-1689. Raffaelli, A. & Saba, A. (2003). Atmospheric pressure photoionization mass spectrometry.
Mass Spectrometry Reviews, 22, 5, 318-331. Reemtsma, T.; These, A.; Linscheid, M.; Leenheer, J. & Spitzy, A. (2008). Molecular and
structural characterization of dissolved organic matter from the deep ocean by
www.intechopen.com

Fourier Transform Mass Spectrometry for the Molecular Level Characterization of Natural Organic Matter: Instrument Capabilities, Applications, and Limitations
319
FTICR-MS, including hydrophilic nitrogenous organic molecules. Environmental
Science and Technology, 42, 5, 1430-1437. Reemtsma, T. (2009). Determination of molecular formulas of natural organic matter
molecules by (ultra-) high-resolution mass spectrometry: Status and needs. Journal
of Chromatography A, 1216, 18, 3687-3701. Sabine, C.L. & Feely, R.A. (2007). The oceanic sink for carbon dioxide, In: Greenhouse gas
sinks, D. Reay; C. Hewitt; K. Smith & J. Grace (Eds.), 31-49, CAB International, Oxfordshire.
Schmidt, F.; Elvert, M.; Koch, B.P.; Witt, M. & Hinrichs, K.U. (2009). Molecular characterization of dissolved organic matter in pore water of continental shelf sediments. Geochimica et Cosmochimica Acta, 73, 11, 3337-3358.
Schnitzer, M. & Khan, S.U. (1978). Soil Organic Matter, Elsevier, Amsterdam. Simjouw, J.P.; Minor, E.C. & Mopper, K. (2005). Isolation and characterization of estuarine
dissolved organic matter: Comparison of ultrafiltration and C18 solid-phase extraction techniques. Marine Chemistry, 96, 3-4, 219-235.
Sleighter, R.L. & Hatcher, P.G. (2007). The application of electrospray ionization coupled to ultrahigh resolution mass spectrometry for the molecular characterization of natural organic matter. Journal of Mass Spectrometry, 42, 5, 559-574.
Sleighter, R.L. & Hatcher, P.G. (2008). Molecular characterization of dissolved organic matter (DOM) along a river to ocean transect of the lower Chesapeake Bay by ultrahigh resolution electrospray ionization Fourier transform ion cyclotron resonance mass spectrometry. Marine Chemistry, 110, 3-4, 140-152.
Sleighter, R.L.; McKee, G.A.; Liu, Z. & Hatcher, P.G. (2008). Naturally present fatty acids as internal calibrants for Fourier transform mass spectra of dissolved organic matter. Limnology and Oceanography: Methods, 6, 246-253.
Sleighter, R.L.; McKee, G.A. & Hatcher, P.G. (2009). Direct Fourier transform mass spectral analysis of natural waters with low dissolved organic matter. Organic Geochemistry, 40, 1, 119-125.
Sleighter, R.L.; Liu, Z.; Xue, J. & Hatcher, P.G. (2010). Multivariate statistical approaches for the characterization of dissolved organic matter analyzed by ultrahigh resolution mass spectrometry. Environmental Science and Technology, 44, 19, 7576-7582.
Stenson, A.C.; Landing, W.M.; Marshall, A.G. & Cooper, W.T. (2002). Ionization and fragmentation of humic substances in electrospray ionization Fourier transform-ion cyclotron resonance mass spectrometry. Analytical Chemistry, 74, 17, 4397-4409.
Stenson, A.C.; Marshall, A.G. & Cooper, W.T. (2003). Exact masses and chemical formulas of individual Suwannee River fulvic acids from ultrahigh resolution electrospray ionization Fourier transform ion cyclotron resonance mass spectra. Analytical
Chemistry, 75, 6, 1275-1284. Stevenson, F.J. (1994). Humus Chemistry: Genesis, Composition, Reactions, John Wiley and Sons,
New York. Stubbins, A.; Spencer, R.G.M.; Chen, H.; Hatcher, P.G.; Mopper, K.; Hernes, P.J.; Mwamba,
V.L.; Mangangu, A.M.; Wabakanghanzi, J.N. & Six, J. (2010). Illuminated darkness: Molecular signatures of Congo River dissolved organic matter and its photochemical alteration as revealed by ultrahigh precision mass spectrometry. Limnology and Oceanography, 55, 4, 1467-1477.
www.intechopen.com

Fourier Transforms - Approach to Scientific Principles
320
Thurman, E.M. & Malcolm, R.L. (1981). Preparative isolation of aquatic humic substances. Environmental Science and Technology, 15, 4, 463-466.
Thurman, E.M. (1985). Organic Geochemistry of Natural Waters, Kluwer Academics, Boston. van Krevelen, D. (1950). Graphical – statistical method for the study of structure and
reaction process of coal. Fuel, 29, 269-284. Witt, M.; Fuchser, J. & Koch, B.P. (2009). Fragmentation studies of fulvic acids using collision
induced dissociation Fourier transform ion cyclotron resonance mass spectrometry. Analytical Chemistry, 81, 7, 2688-2694.
www.intechopen.com

Fourier Transforms - Approach to Scientific PrinciplesEdited by Prof. Goran Nikolic
ISBN 978-953-307-231-9Hard cover, 468 pagesPublisher InTechPublished online 11, April, 2011Published in print edition April, 2011
InTech EuropeUniversity Campus STeP Ri Slavka Krautzeka 83/A 51000 Rijeka, Croatia Phone: +385 (51) 770 447 Fax: +385 (51) 686 166www.intechopen.com
InTech ChinaUnit 405, Office Block, Hotel Equatorial Shanghai No.65, Yan An Road (West), Shanghai, 200040, China
Phone: +86-21-62489820 Fax: +86-21-62489821
This book aims to provide information about Fourier transform to those needing to use infrared spectroscopy,by explaining the fundamental aspects of the Fourier transform, and techniques for analyzing infrared dataobtained for a wide number of materials. It summarizes the theory, instrumentation, methodology, techniquesand application of FTIR spectroscopy, and improves the performance and quality of FTIR spectrophotometers.
How to referenceIn order to correctly reference this scholarly work, feel free to copy and paste the following:
Rachel L. Sleighter and Patrick G. Hatcher (2011). Fourier Transform Mass Spectrometry for the MolecularLevel Characterization of Natural Organic Matter: Instrument Capabilities, Applications, and Limitations,Fourier Transforms - Approach to Scientific Principles, Prof. Goran Nikolic (Ed.), ISBN: 978-953-307-231-9,InTech, Available from: http://www.intechopen.com/books/fourier-transforms-approach-to-scientific-principles/fourier-transform-mass-spectrometry-for-the-molecular-level-characterization-of-natural-organic-matt

© 2011 The Author(s). Licensee IntechOpen. This chapter is distributedunder the terms of the Creative Commons Attribution-NonCommercial-ShareAlike-3.0 License, which permits use, distribution and reproduction fornon-commercial purposes, provided the original is properly cited andderivative works building on this content are distributed under the samelicense.