four segmentation models for improved results€¦ · four segmentation models for improved...
TRANSCRIPT

2019 User’s Conference
Four Segmentation Models for Improved Results
Kristine Ziccardi
Mike Bryant
2019 User’s Conference
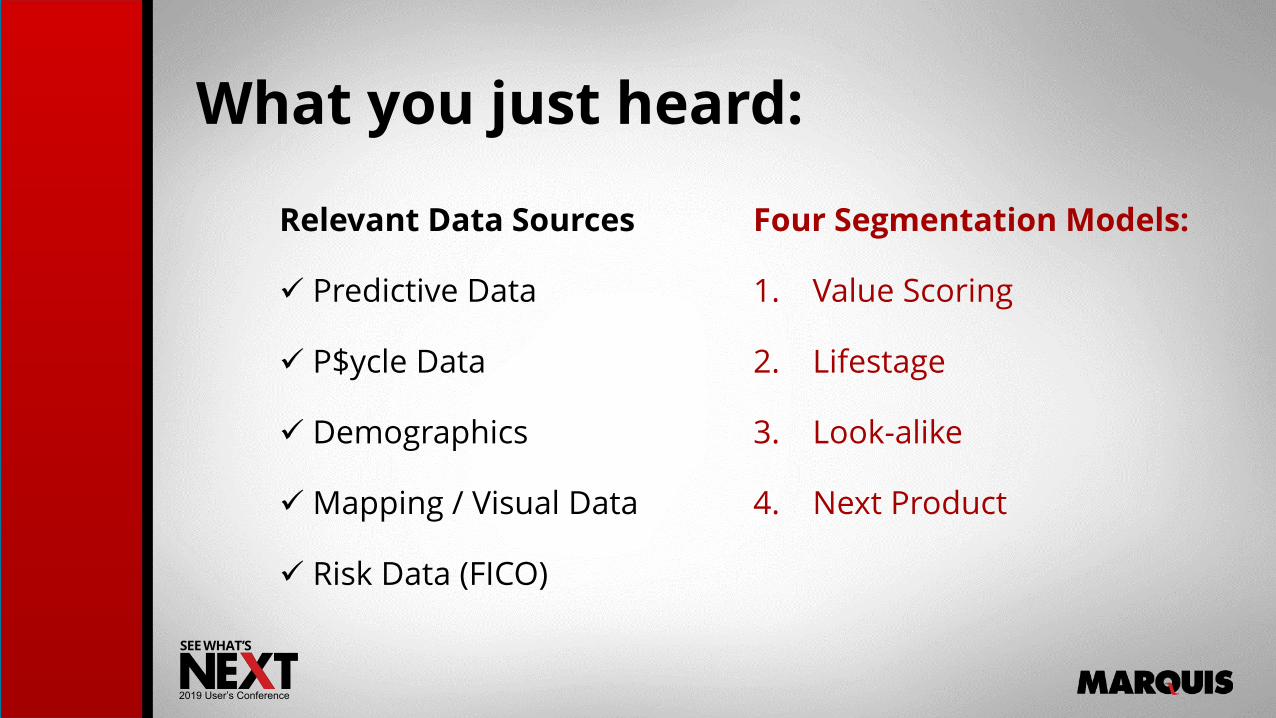
What you just heard:
Relevant Data Sources
Predictive Data
P$ycle Data
Demographics
Mapping / Visual Data
Risk Data (FICO)
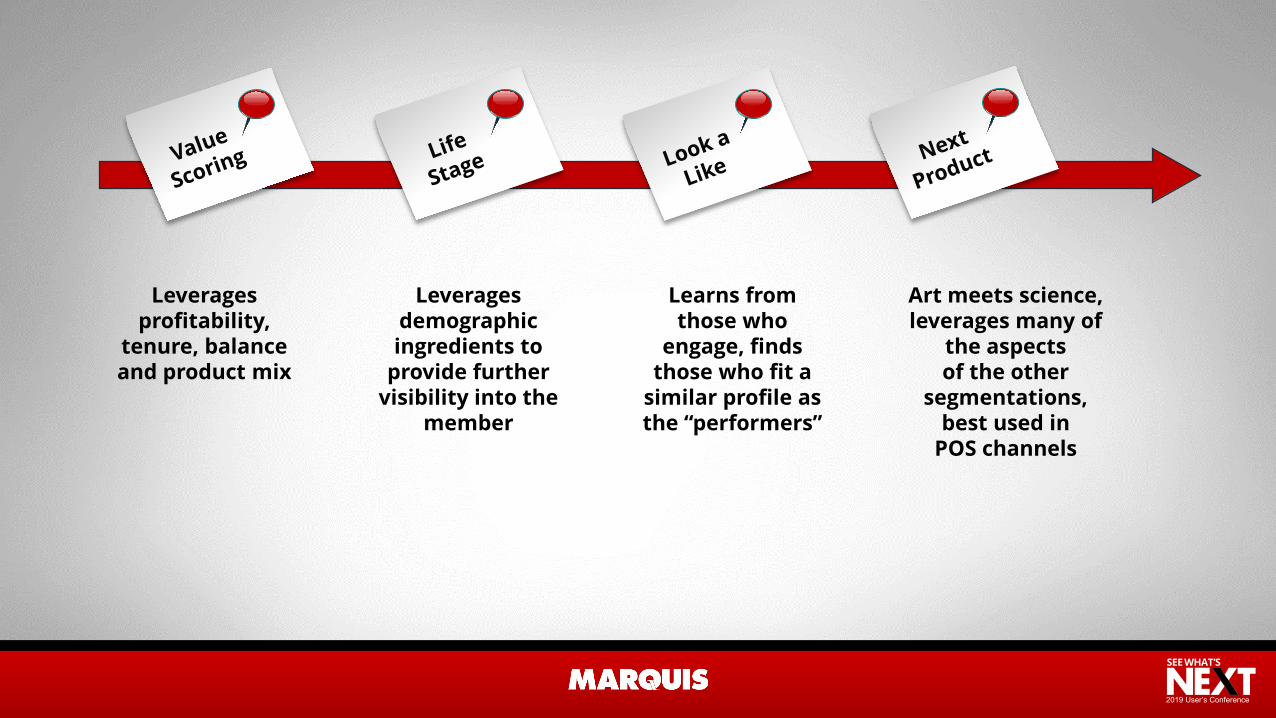
Four Segmentation Models:
1. Value Scoring
2. Lifestage
3. Look-alike
4. Next Product

2019 User’s Conference
Data Sources
Segmentation
Channels/Tactics
2019 User’s Conference
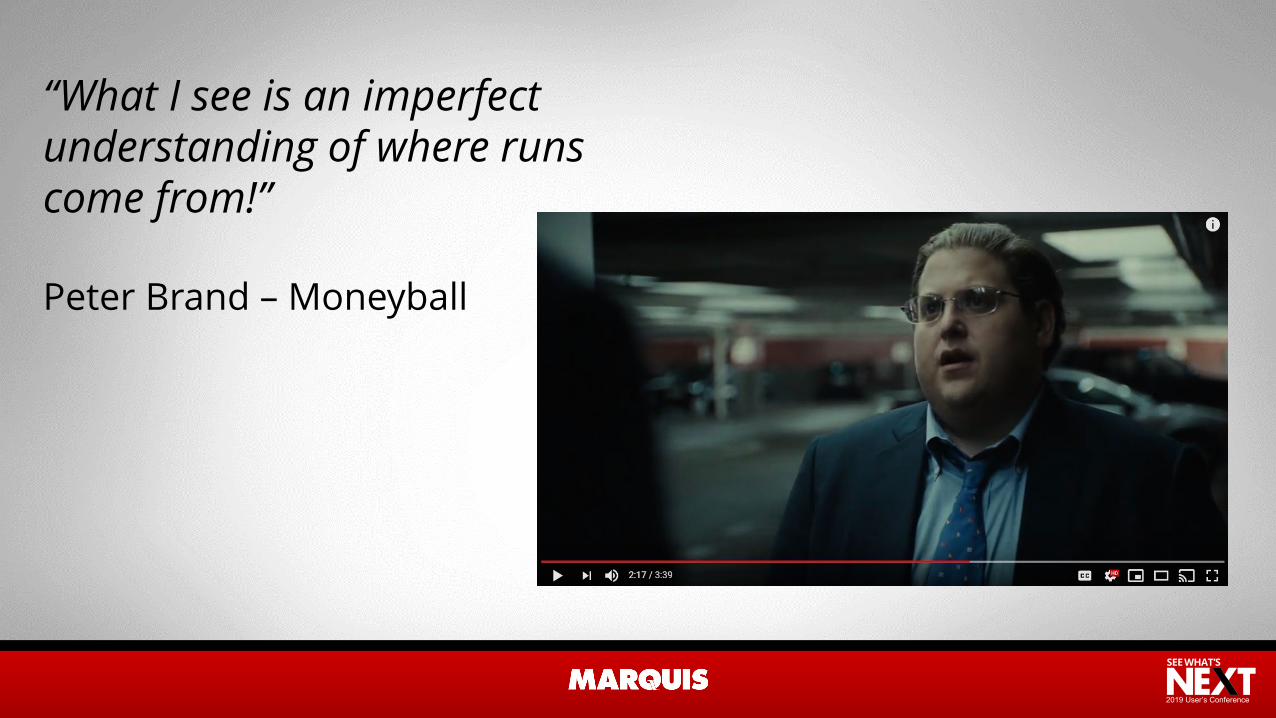
“What I see is an imperfect understanding of where runs come from!”
Peter Brand – Moneyball
2019 User’s Conference
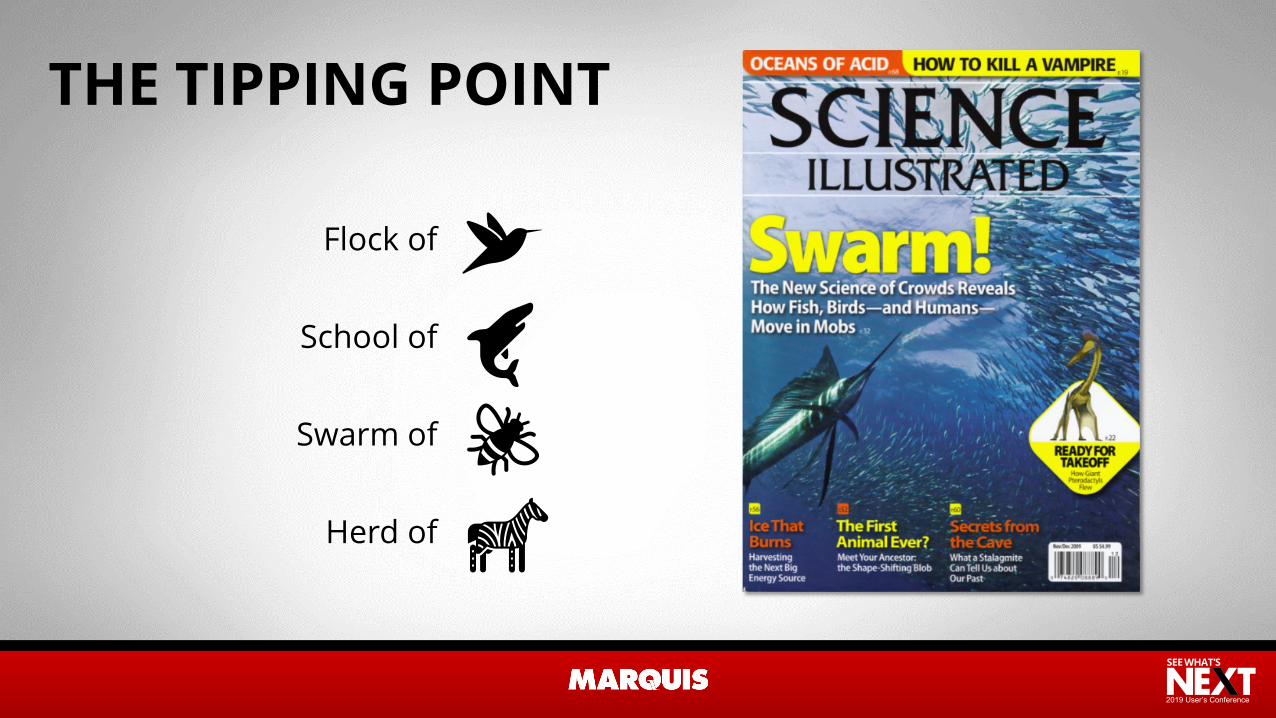
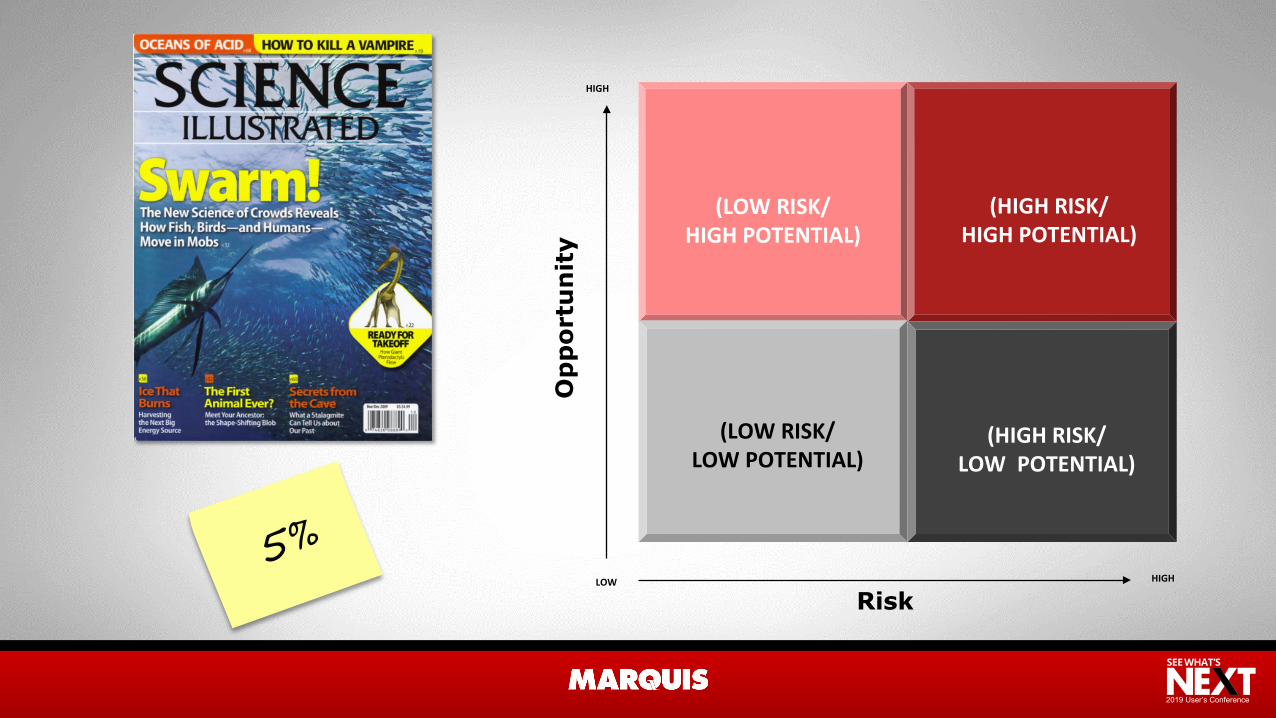
THE TIPPING POINT
Flock of
School of
Swarm of
Herd of
2019 User’s Conference
2019 User’s Conference
4 Segmentation Models
2019 User’s Conference
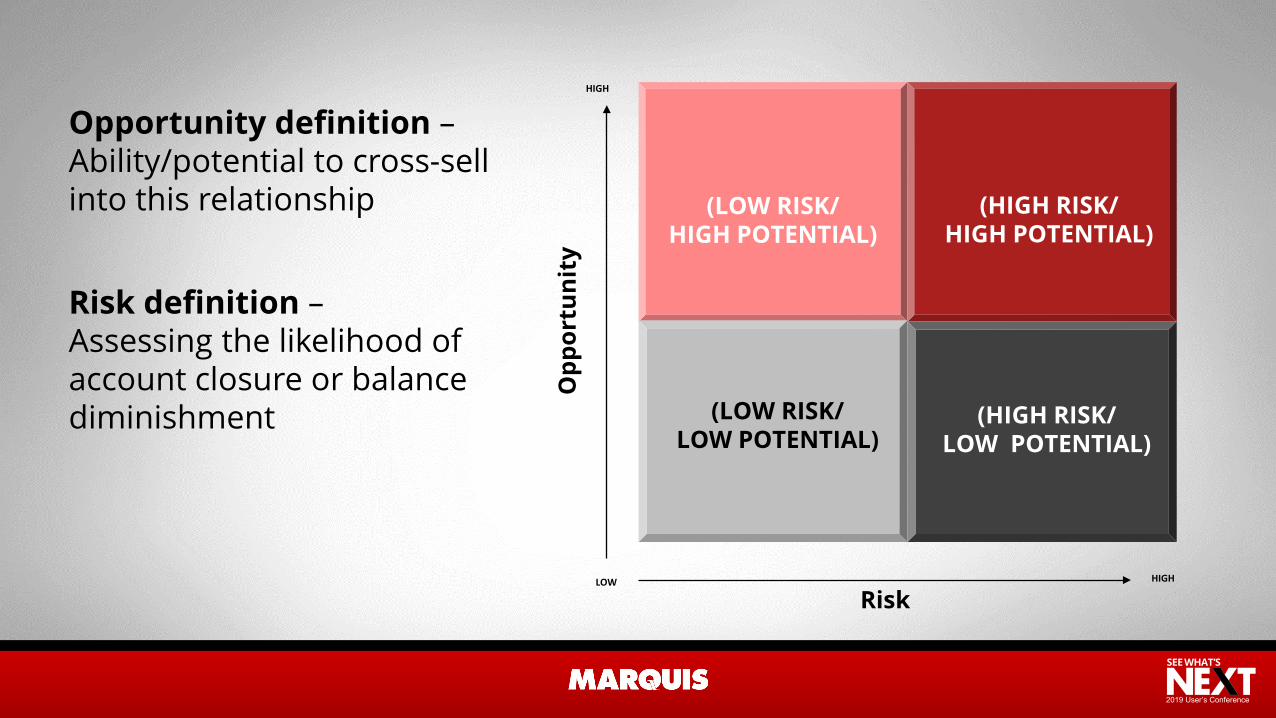
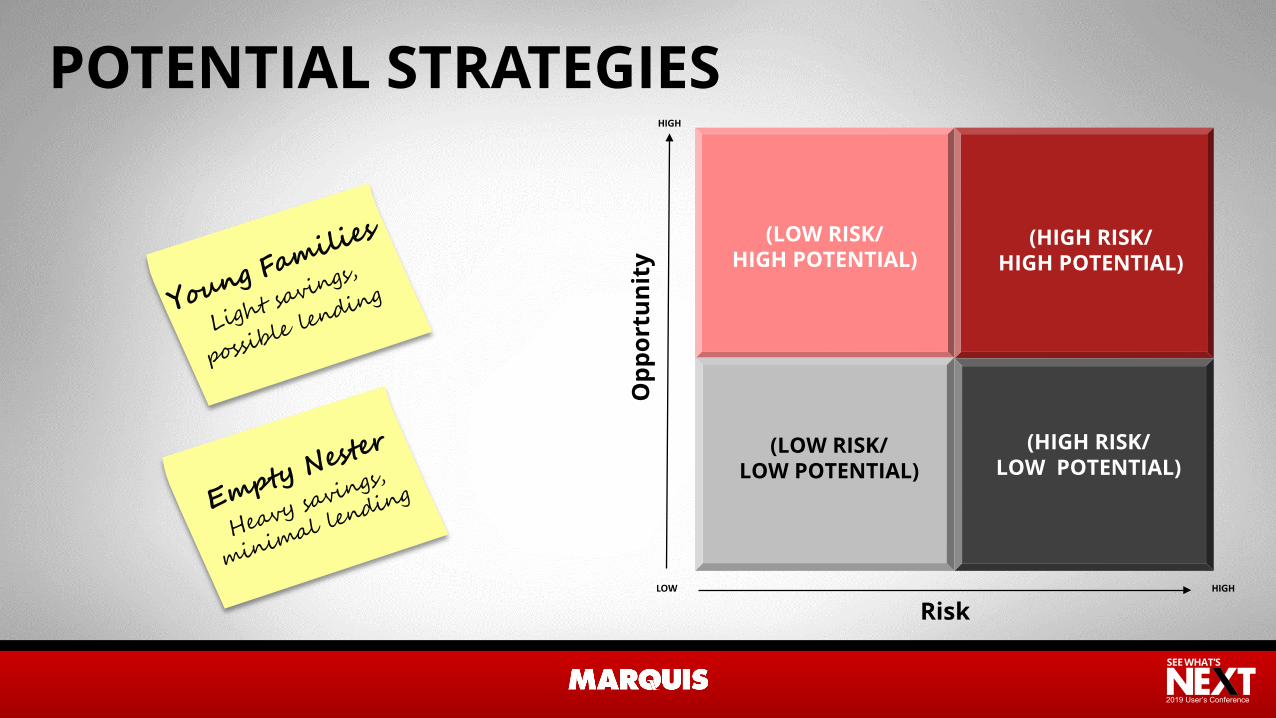
(LOW RISK/ HIGH POTENTIAL)
(HIGH RISK/ HIGH POTENTIAL)
(LOW RISK/ LOW POTENTIAL)
(HIGH RISK/LOW POTENTIAL)
HIGHO
ppor
tuni
tyRisk
HIGH
LOW
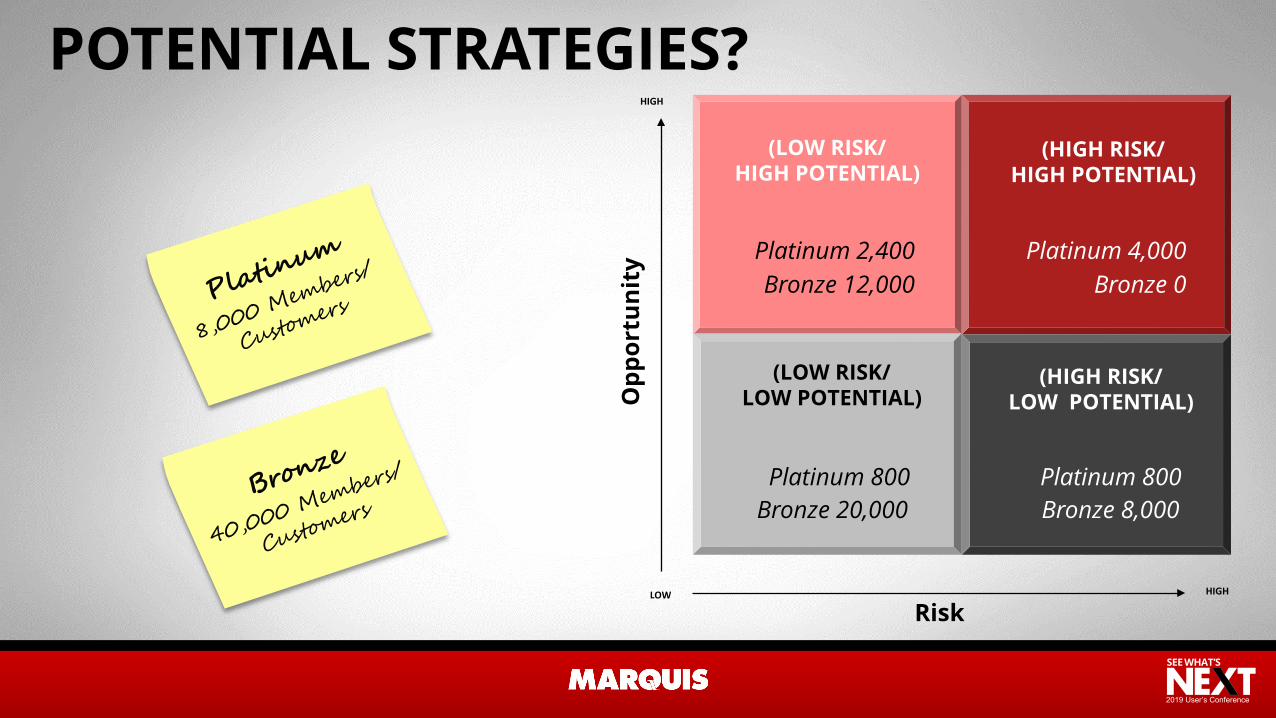
Opportunity definition –Ability/potential to cross-sell into this relationship
Risk definition –Assessing the likelihood of account closure or balance diminishment
2019 User’s Conference
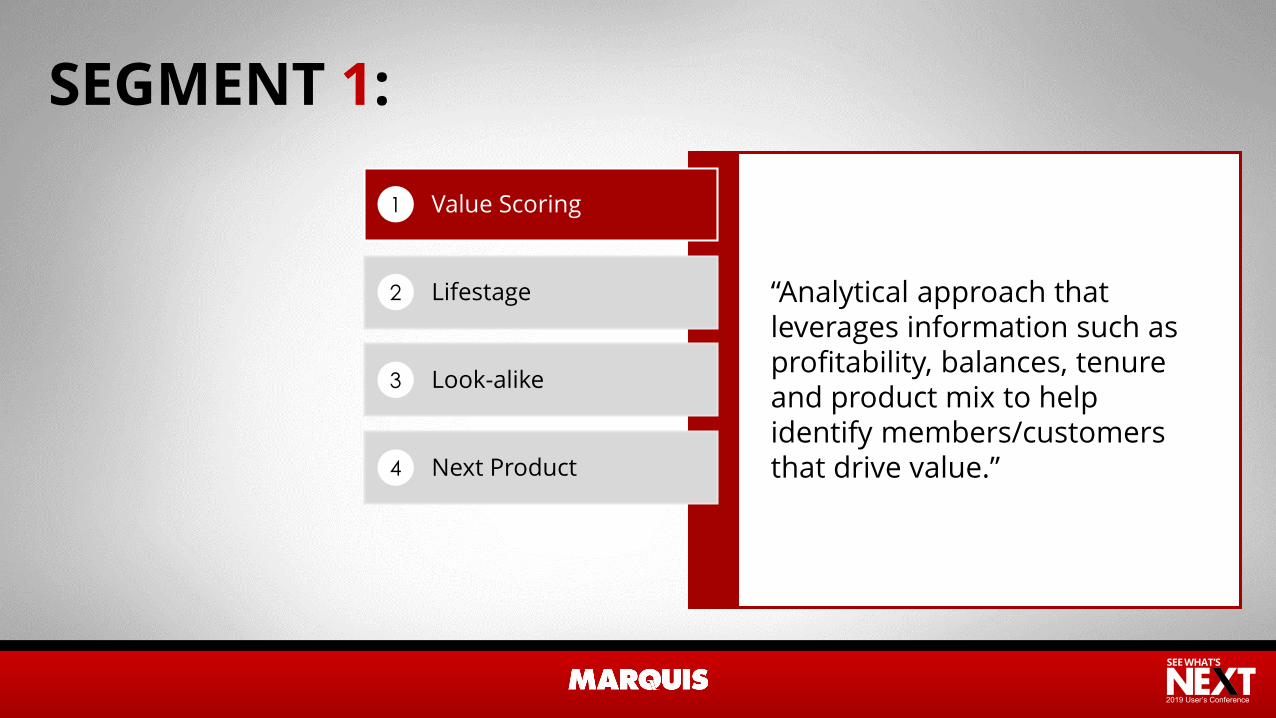
SEGMENT 1:
“Analytical approach that leverages information such as profitability, balances, tenure and product mix to help identify members/customers that drive value.”
Value Scoring1
Lifestage2
Look-alike3
Next Product4

2019 User’s Conference
0%
10%
20%
30%
40%
50%
60%
70%
80%
90%
100%
1 2 3 4 5 6 7 8 9 10
% o
f Res
pond
ers
Capt
ured
% Marketed
40% Marketed
Score Cumulative % of Households
Responders Captured
1 10% 42%
2 20% 65%
3 30% 83%
4 40% 93%
5 50% 95%
6 60% 97%
7 70% 98%
8 80% 98%
9 90% 99%
10 100% 100%
93% Responders
40% gets you 93%
60% gets you 7%
2019 User’s Conference
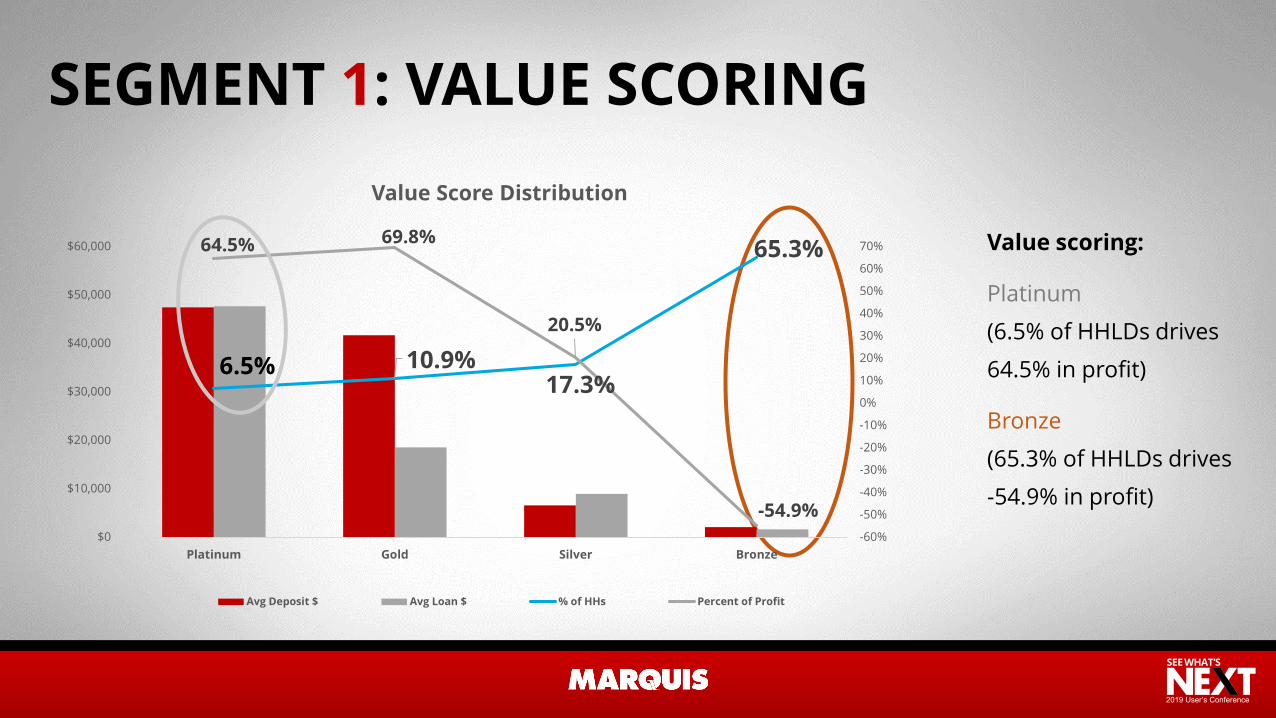
SEGMENT 1: VALUE SCORING
Value scoring:
Platinum
(6.5% of HHLDs drives
64.5% in profit)
Bronze
(65.3% of HHLDs drives
-54.9% in profit)
6.5% 10.9%17.3%
65.3%64.5% 69.8%
20.5%
-54.9%-60%
-50%
-40%
-30%
-20%
-10%
0%
10%
20%
30%
40%
50%
60%
70%
$0
$10,000
$20,000
$30,000
$40,000
$50,000
$60,000
Platinum Gold Silver Bronze
Value Score Distribution
Avg Deposit $ Avg Loan $ % of HHs Percent of Profit
2019 User’s Conference
(LOW RISK/ HIGH POTENTIAL)
(HIGH RISK/ HIGH POTENTIAL)
(LOW RISK/ LOW POTENTIAL)
(HIGH RISK/LOW POTENTIAL)
HIGH
Opp
ortu
nity
Risk
HIGH
LOW
Platinum 2,400 Platinum 4,000
Platinum 800 Platinum 800
Bronze 12,000 Bronze 0
Bronze 20,000 Bronze 8,000
POTENTIAL STRATEGIES?
2019 User’s Conference
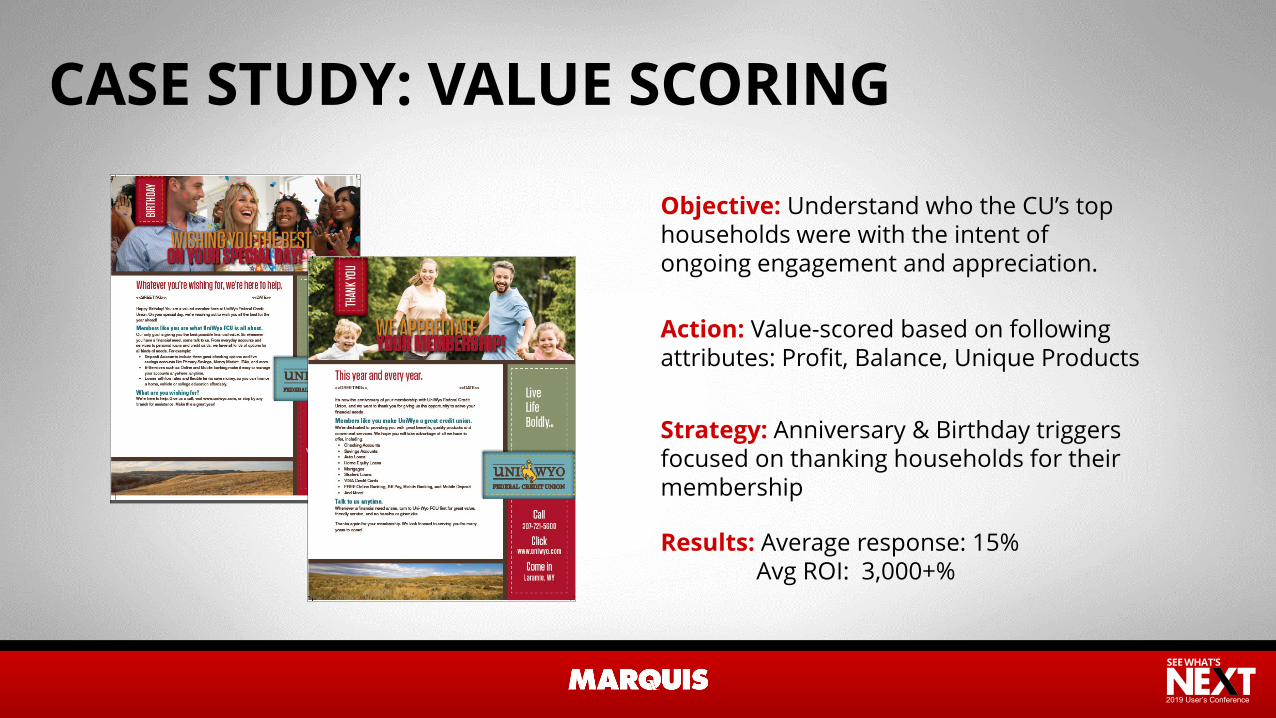
CASE STUDY: VALUE SCORING
Objective: Understand who the CU’s top households were with the intent of ongoing engagement and appreciation.
Action: Value-scored based on following attributes: Profit, Balance, Unique Products
Strategy: Anniversary & Birthday triggers focused on thanking households for their membership
Results: Average response: 15% Avg ROI: 3,000+%
2019 User’s Conference
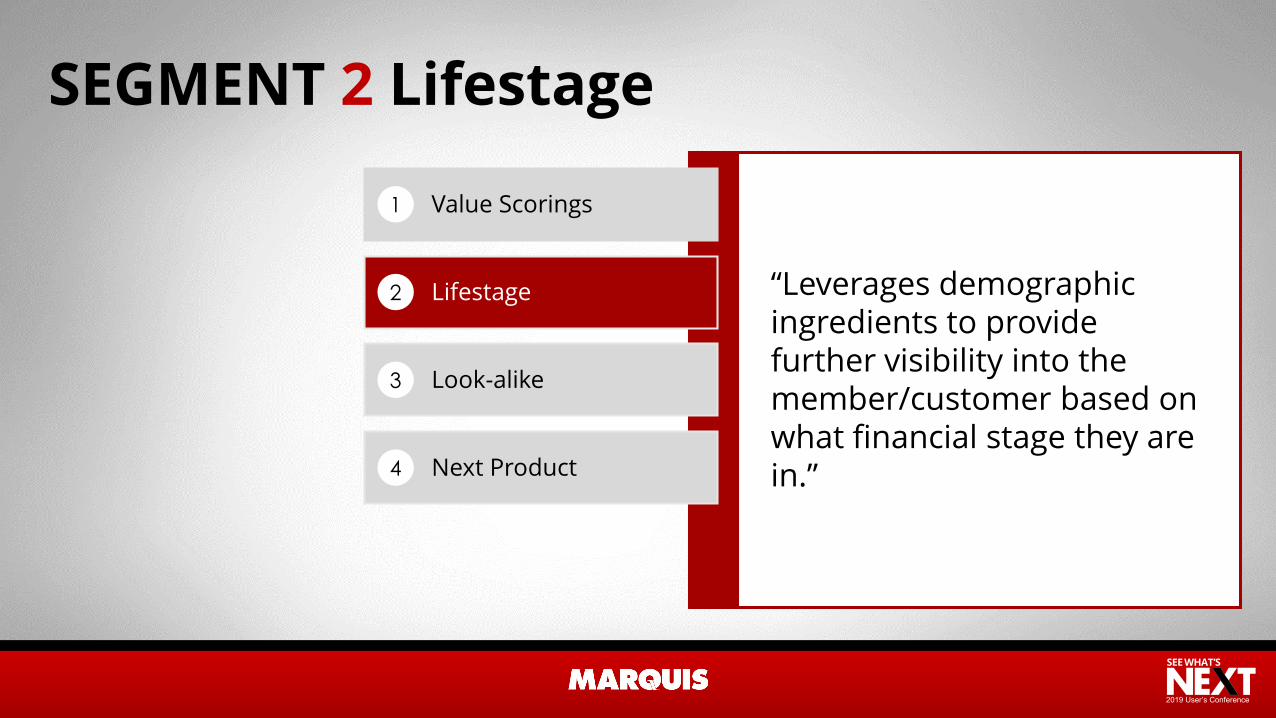
SEGMENT 2 Lifestage
“Leverages demographic ingredients to provide further visibility into the member/customer based on what financial stage they are in.”
Value Scorings1
Lifestage2
Look-alike3
Next Product4
2019 User’s Conference
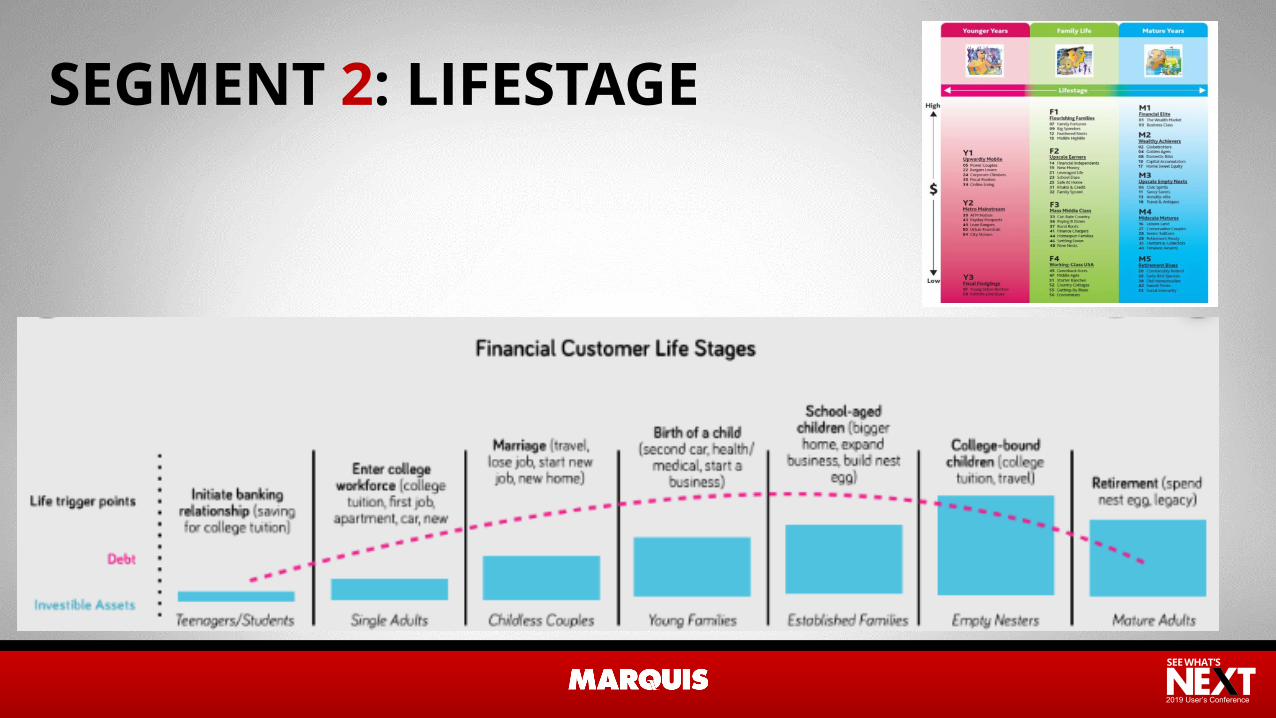
SEGMENT 2: LIFESTAGE
2019 User’s Conference
HIGH
(LOW RISK/ HIGH POTENTIAL)
(HIGH RISK/ HIGH POTENTIAL)
(LOW RISK/ LOW POTENTIAL)
(HIGH RISK/LOW POTENTIAL)
Opp
ortu
nity
Risk
HIGH
LOW
POTENTIAL STRATEGIES
2019 User’s Conference
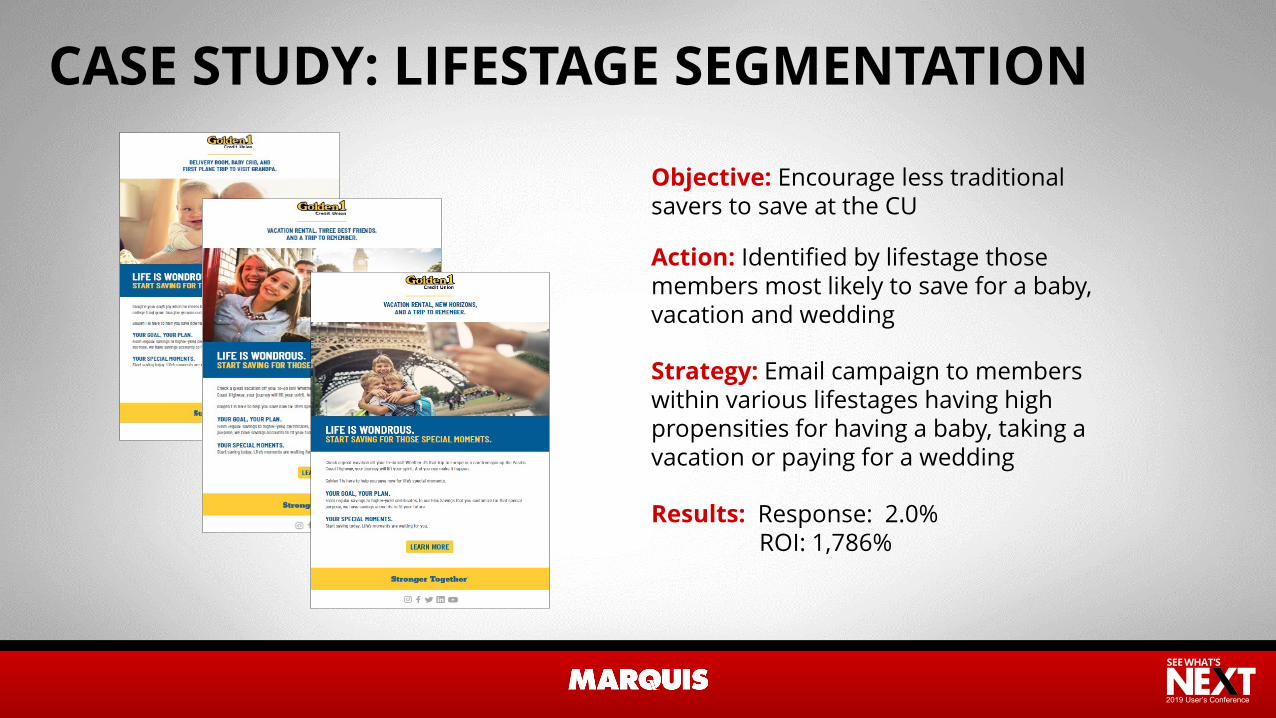
CASE STUDY: LIFESTAGE SEGMENTATION
Objective: Encourage less traditional savers to save at the CU
Action: Identified by lifestage those members most likely to save for a baby, vacation and wedding
Strategy: Email campaign to members within various lifestages having high propensities for having a baby, taking a vacation or paying for a wedding
Results: Response: 2.0% ROI: 1,786%

2019 User’s Conference
SEGMENT 3: LOOK-ALIKE
“Learns from those who engage, finds those who fit a similar profile as the performers”
Value Scorings1
Lifestage2
Look-alike3
Next Product4
2019 User’s Conference
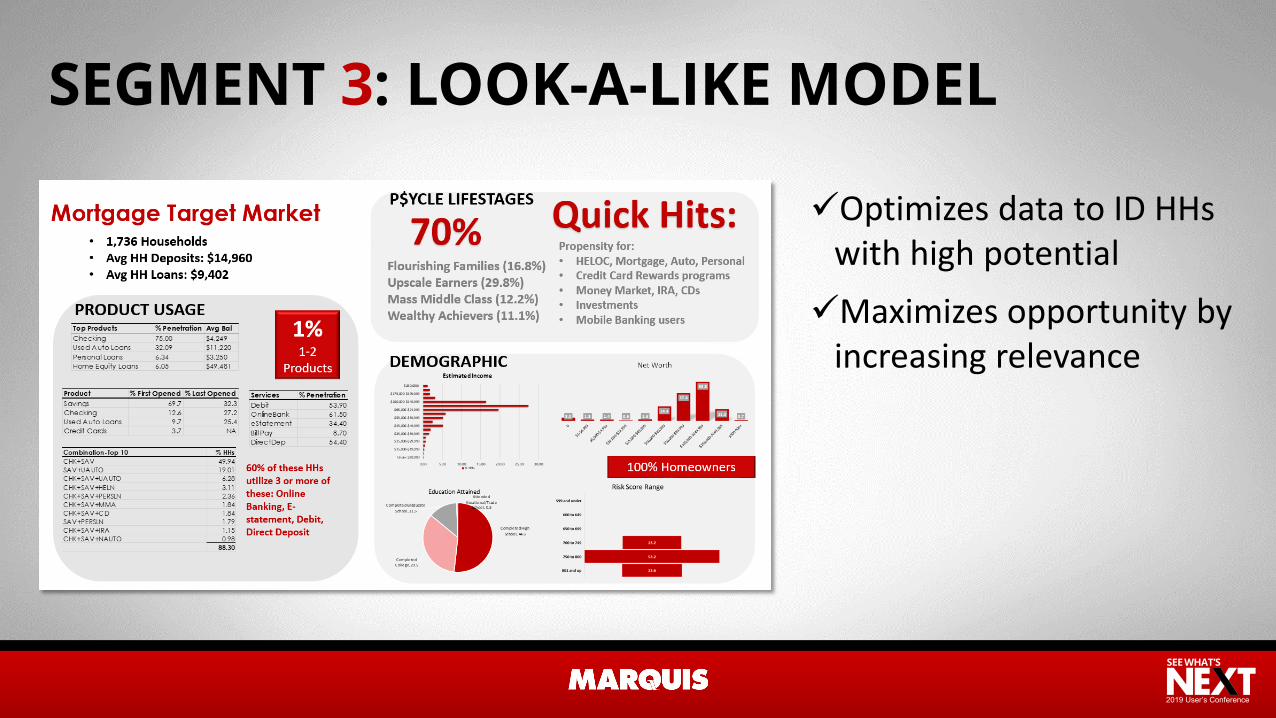
SEGMENT 3: LOOK-A-LIKE MODEL
Optimizes data to ID HHs with high potentialMaximizes opportunity by
increasing relevance
2019 User’s Conference
(LOW RISK/ HIGH POTENTIAL)
(HIGH RISK/ HIGH POTENTIAL)
(LOW RISK/ LOW POTENTIAL)
(HIGH RISK/LOW POTENTIAL)
HIGHO
pp
ortu
nit
yRisk
HIGH
LOW
2019 User’s Conference
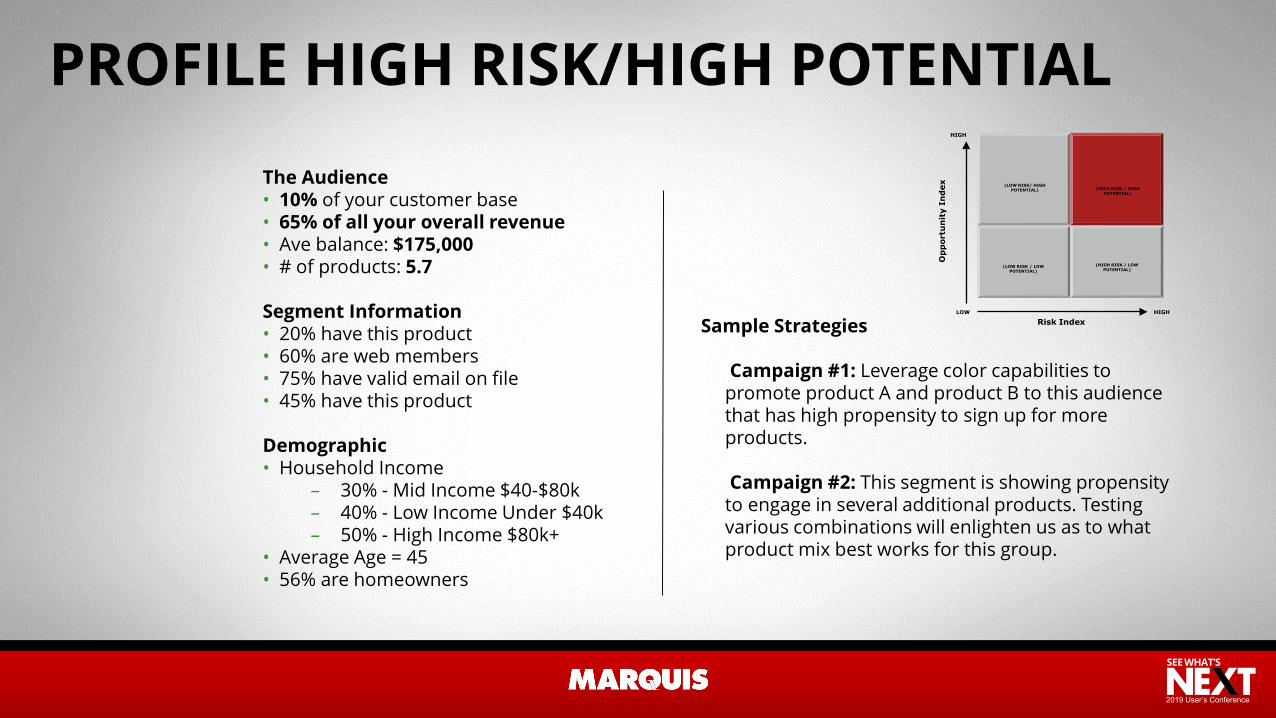
Sample Strategies
Campaign #1: Leverage color capabilities to promote product A and product B to this audience that has high propensity to sign up for more products.
Campaign #2: This segment is showing propensity to engage in several additional products. Testing various combinations will enlighten us as to what product mix best works for this group.
The Audience• 10% of your customer base• 65% of all your overall revenue• Ave balance: $175,000• # of products: 5.7
Segment Information• 20% have this product• 60% are web members• 75% have valid email on file• 45% have this product
Demographic• Household Income
– 30% - Mid Income $40-$80k– 40% - Low Income Under $40k– 50% - High Income $80k+
• Average Age = 45• 56% are homeowners
(LOW RISK/ HIGH POTENTIAL) (HIGH RISK / HIGH
POTENTIAL)
(LOW RISK / LOW POTENTIAL)
(HIGH RISK / LOW POTENTIAL)
HIGH
LOW
Op
por
tun
ity
Ind
ex
Risk IndexHIGH
PROFILE HIGH RISK/HIGH POTENTIAL
2019 User’s Conference
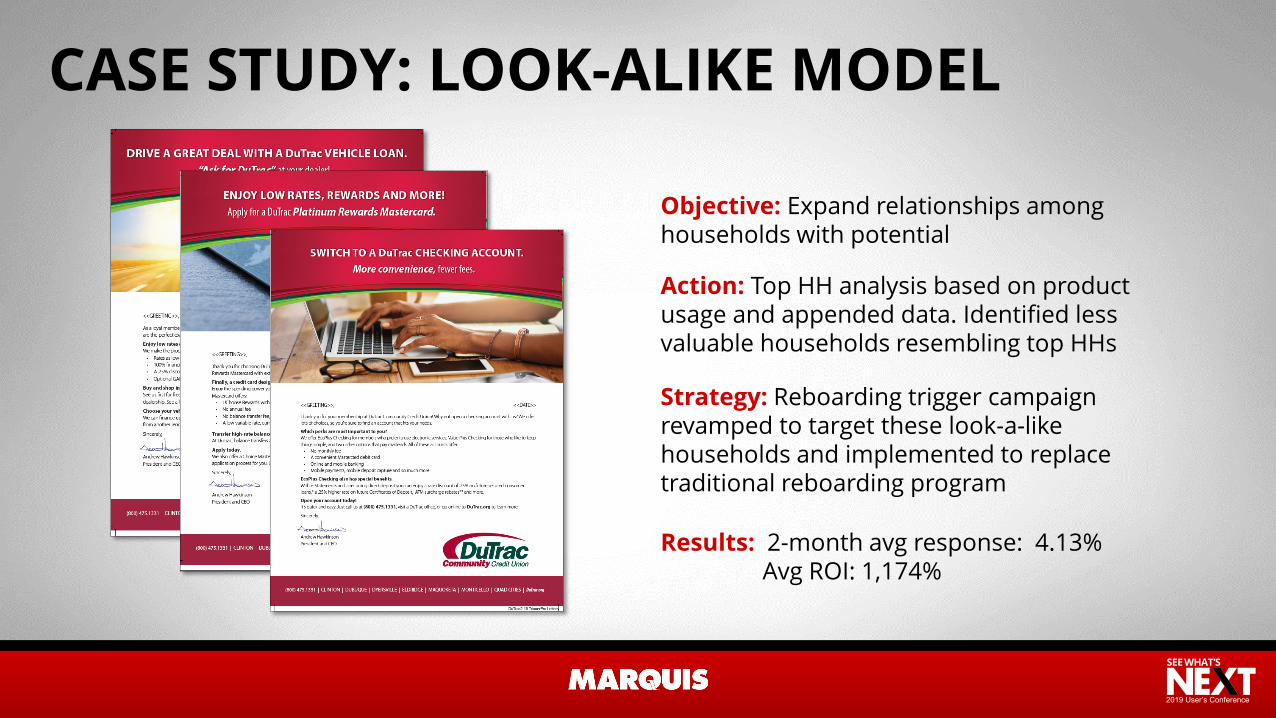
CASE STUDY: LOOK-ALIKE MODEL
Objective: Expand relationships among households with potential
Action: Top HH analysis based on product usage and appended data. Identified less valuable households resembling top HHs
Strategy: Reboarding trigger campaign revamped to target these look-a-like households and implemented to replace traditional reboarding program
Results: 2-month avg response: 4.13% Avg ROI: 1,174%
2019 User’s Conference
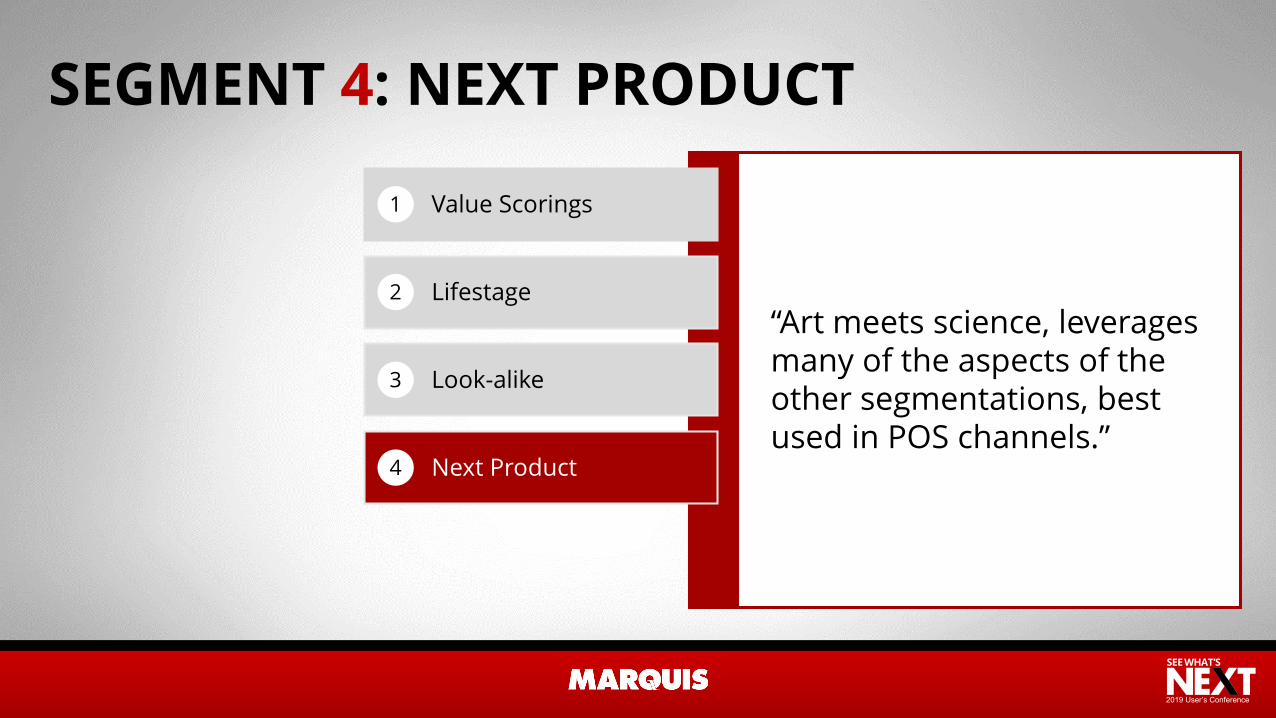
SEGMENT 4: NEXT PRODUCT
“Art meets science, leverages many of the aspects of the other segmentations, best used in POS channels.”
Value Scorings1
Lifestage2
Look-alike3
Next Product4
2019 User’s Conference
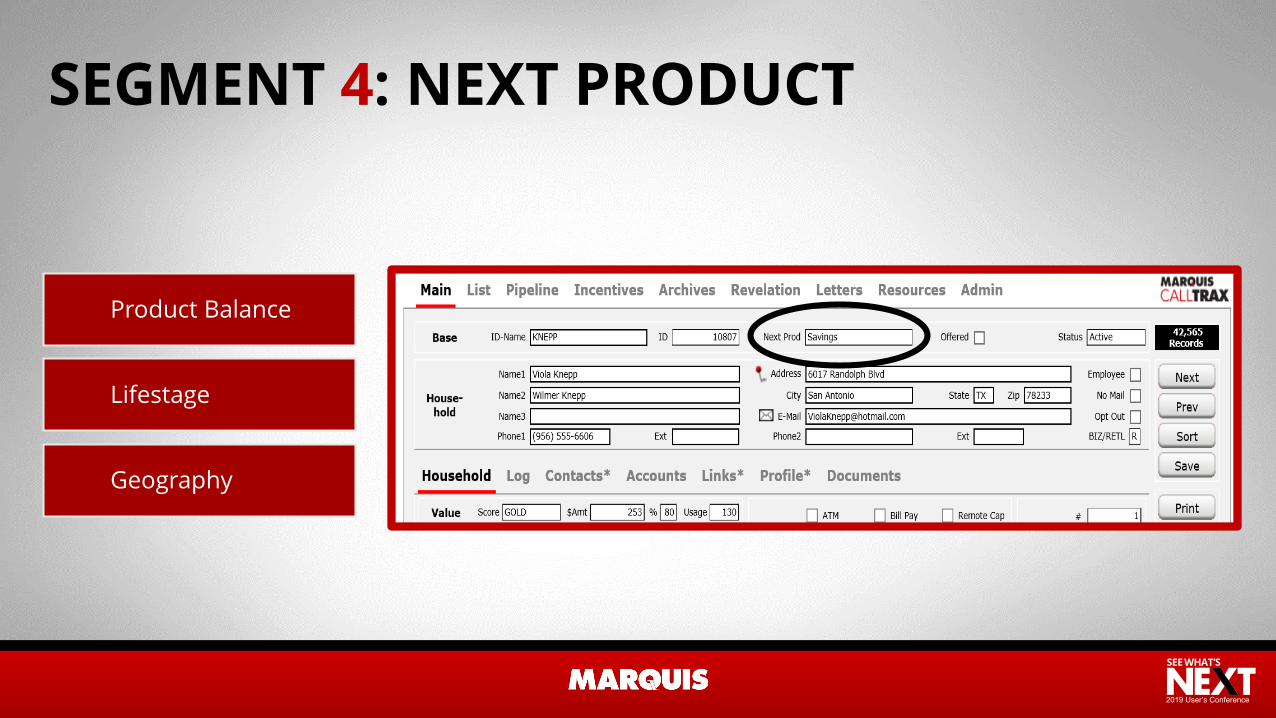
SEGMENT 4: NEXT PRODUCT
Product Balance
Lifestage
Geography
2019 User’s Conference
Leverages profitability,
tenure, balance and product mix
Leverages demographic ingredients to
provide further visibility into the
member
Learns from those who
engage, finds those who fit a
similar profile as the “performers”
Art meets science, leverages many of
the aspects of the other
segmentations, best used in
POS channels
2019 User’s Conference
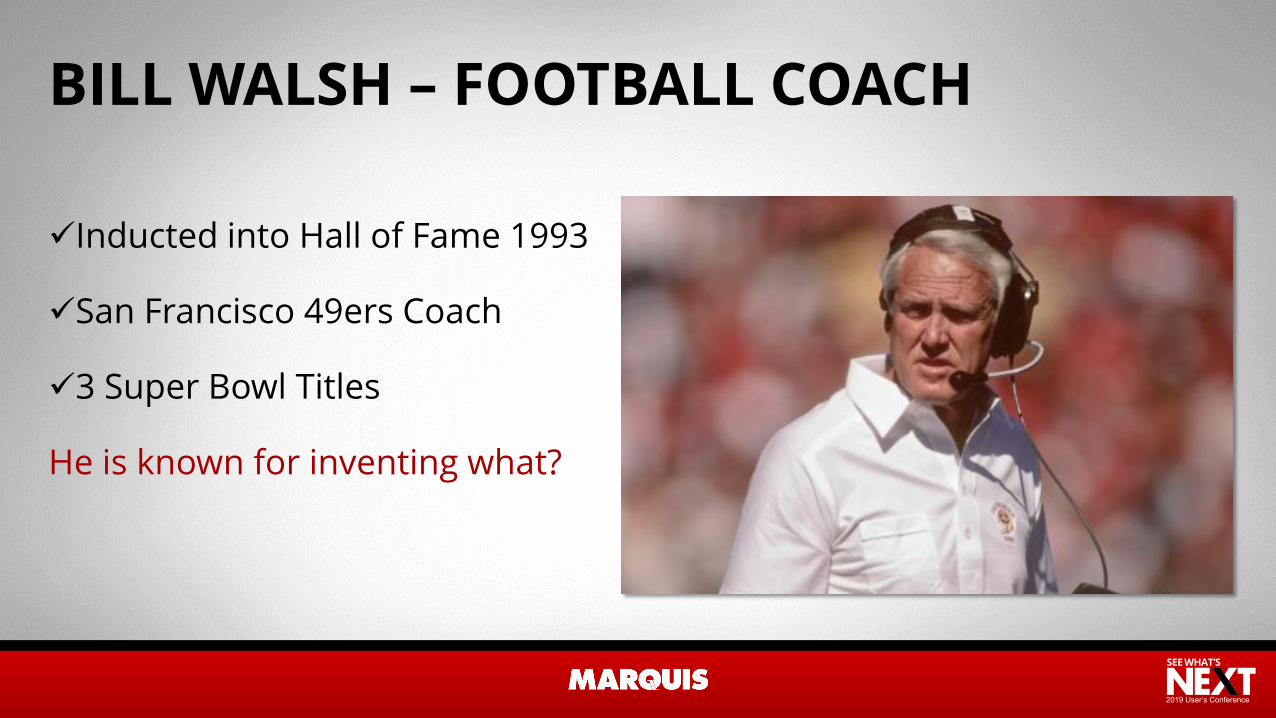
BILL WALSH – FOOTBALL COACH
Inducted into Hall of Fame 1993
San Francisco 49ers Coach
3 Super Bowl Titles
He is known for inventing what?
2019 User’s Conference
ANSWER: WEST COAST OFFENSE
2019 User’s Conference
On DeckPROSPECTING
Intelligent Farming Strategies
Jeanine Perrone & Christopher Ruscher
