four new bat species (rhinolophus hildebrandtii complex) reflect
TRANSCRIPT

Four New Bat Species (Rhinolophus hildebrandtiiComplex) Reflect Plio-Pleistocene Divergence of Dwarfsand Giants across an Afromontane ArchipelagoPeter J. Taylor1,2,5*, Samantha Stoffberg3, Ara Monadjem4, Martinus Corrie Schoeman5, Julian Bayliss6,7,
Fenton P. D. Cotterill8
1 Department of Ecology and Resource Management, University of Venda, Thohoyandou, South Africa, 2 Durban Natural Science Museum, Durban, South Africa,
3 Evolutionary Genomics Group, Department of Botany and Zoology, University of Stellenbosch, Stellenbosch, South Africa, 4 All Out Africa Research Unit, Department of
Biological Sciences, University of Swaziland, Kwaluseni, Swaziland, 5 School of Life Sciences, University of KwaZulu-Natal, Durban, South Africa, 6 Mulanje Mountain
Conservation Trust, Mulanje, Malawi, 7 Conservation Science Group, Department of Zoology, University of Cambridge, Cambridge, United Kingdom, 8 Africa Earth
Observatory Network, Geoecodynamics Research Hub, Department of Botany and Zoology, University of Stellenbosch, Stellenbosch, South Africa
Abstract
Gigantism and dwarfism evolve in vertebrates restricted to islands. We describe four new species in the Rhinolophushildebrandtii species-complex of horseshoe bats, whose evolution has entailed adaptive shifts in body size. We postulatethat vicissitudes of palaeoenvironments resulted in gigantism and dwarfism in habitat islands fragmented across easternand southern Africa. Mitochondrial and nuclear DNA sequences recovered two clades of R. hildebrandtii senso lato which areparaphyletic with respect to a third lineage (R. eloquens). Lineages differ by 7.7 to 9.0% in cytochrome b sequences. Clade 1includes R. hildebrandtii sensu stricto from the east African highlands and three additional vicariants that speciated across anAfromontane archipelago through the Plio-Pleistocene, extending from the Kenyan Highlands through the Eastern Arc,northern Mozambique and the Zambezi Escarpment to the eastern Great Escarpment of South Africa. Clade 2 comprisesone species confined to lowland savanna habitats (Mozambique and Zimbabwe). A third clade comprises R. eloquens fromEast Africa. Speciation within Clade 1 is associated with fixed differences in echolocation call frequency, and cranial shapeand size in populations isolated since the late Pliocene (ca 3.74 Mya). Relative to the intermediate-sized savanna population(Clade 2), these island-populations within Clade 1 are characterised by either gigantism (South African eastern GreatEscarpment and Mts Mabu and Inago in Mozambique) or dwarfism (Lutope-Ngolangola Gorge, Zimbabwe andSoutpansberg Mountains, South Africa). Sympatry between divergent clades (Clade 1 and Clade 2) at Lutope-NgolangolaGorge (NW Zimbabwe) is attributed to recent range expansions. We propose an ‘‘Allometric Speciation Hypothesis’’, whichattributes the evolution of this species complex of bats to divergence in constant frequency (CF) sonar calls. The origin ofspecies-specific peak frequencies (overall range = 32 to 46 kHz) represents the allometric effect of adaptive divergence inskull size, represented in the evolution of gigantism and dwarfism in habitat islands.
Citation: Taylor PJ, Stoffberg S, Monadjem A, Schoeman MC, Bayliss J, et al. (2012) Four New Bat Species (Rhinolophus hildebrandtii Complex) Reflect Plio-Pleistocene Divergence of Dwarfs and Giants across an Afromontane Archipelago. PLoS ONE 7(9): e41744. doi:10.1371/journal.pone.0041744
Editor: Axel Janke, BiK-F Biodiversity and Climate Research Center, Germany
Received January 6, 2012; Accepted June 28, 2012; Published September 12, 2012
Copyright: � 2012 Taylor et al. This is an open-access article distributed under the terms of the Creative Commons Attribution License, which permitsunrestricted use, distribution, and reproduction in any medium, provided the original author and source are credited.
Funding: This research was supported by logistic and financial support from the Darwin Initiative (Darwin Initiative Award 15/036: Monitoring and ManagingBiodiversity Loss in South-East Africa’s Montane Ecosystems), the Mulanje Mountain Conservation Trust, the African Butterfly Research Institute and the Institutode Investigacao Agraria de Mocambique to JB. PJT and SS received grants from the National Research Foundation of South Africa. SS was further supported by aClaude Leon Foundation Postdoctoral Fellowships. FPDC thanks the Bay Foundations for support over the period core data were collected. The funders had norole in study design, data collection and analysis, decision to publish, or preparation of the manuscript.
Competing Interests: The authors have declared that no competing interests exist.
* E-mail: [email protected]
Introduction
According to the ‘‘Island rule’’, adaptation to insular environ-
ments results in dwarfism in larger mammals such as ungulates
and carnivores, in contrast to gigantism in smaller mammals such
as rodents [1]. Although the universality of this rule in vertebrates
has been debated [2,3,4], several studies of Chiroptera have shown
a tendency for island species and subspecies to be considerably
smaller than continental relatives [5,6,7,8]. Although these
empirical studies have focussed on bats on true islands, the rule
was hypothesized to also apply to habitat islands. For example,
significant historical changes in body length of European
mammals over 175 years is attributed to recent habitat fragmen-
tation [9].
This paper presents the findings of a multi-disciplinary
taxonomic study of Rhinolophus hildebrandtii, initially motivated by
the discovery of distinct sonotypes in southern Africa within an
apparently monotypic species of horseshoe bat. Horseshoe bats
(Genus Rhinolophus Lacepede 1799) are the only extant members of
the family Rhinolophidae (Bell 1836) and their distribution is
restricted to the Old World. All members of this monogeneric
family are characterized by a horseshoe-shaped anterior noseleaf
(Fig. 1) and the different parts (lancet, connecting process, sella and
noseleaf) often differ in size and shape and can be diagnostic in
identifying species. Other characters often used in discriminating
PLOS ONE | www.plosone.org 1 September 2012 | Volume 7 | Issue 9 | e41744
rhinolophid species include forearm length, craniodental mea-
surements, the presence (or absence) and position of the anterior
upper premolar, the number of mental grooves in the lower lip
and peak echolocation frequency of the CF component. However,
in many instances there may be overlap in one or more of these
characters making molecular analysis an important tool in
confirming species identities.
Hildebrandt’s Horseshoe Bat (Rhinolophus hildebrandtii Peters,
1878; Fig. 1) is a large horseshoe bat (forearm length 60–67 mm)
distributed across the Afromontane Archipelago of Africa [10,11]
and easily distinguished from other African horseshoe bats on size
alone [12,13]. Similar, but slightly smaller species include the
Eloquent Horseshoe Bat (R. eloquens Anderson, 1905) and
Ruppell’s Horseshoe Bat (R. fumigatus Ruppell, 1842). All three
species belong to the fumigatus-group [12], are endemic to the
Afrotropical zoogeographic region, and overlap in forearm length.
Only R. eloquens and R. hildebrandtii overlap in craniodental
measurements [12] and both species possess a single mental
groove in the lower lip and long hairs on the sella [12]. Although
the distributions of both species overlap in Kenya, Rwanda,
Sudan, Tanzania, Uganda and Zaire [12], that of R. eloquens does
not extend into southern Africa whereas R. hildebrandtii is described
from DRC, Botswana, Zimbabwe, Malawi, Zambia, Mozambique
and the northern parts of South Africa [13,14]. Rhinolophus
hildebrandtii (33–46 kHz [13]) and R. fumigatus (53 kHz [13]) can be
distinguished using echolocation call frequency; that of R. eloquens
is unknown.
Echolocation frequency is often used to identify bats, especially
morphologically similar species, and has helped to reveal cryptic
species [15]. Horseshoe bats are high-duty cycle echolocators (long
call duration relative to the interval between consecutive calls) and
have calls that are dominated by a long constant-frequency (CF)
component. Growing evidence suggests that R. hildebrandtii as
currently recognised is a species complex, which is not necessarily
monophyletic [13,16]. Several discrete sonotypes exist with peak
frequencies at 42 kHz (from Masai Mara National Reserve to
Taita-Kasegau Wildlife Corridor in Kenya), both 37 and 46 kHz
(occurring sympatrically at the Lutope-Ngolangola Gorge in NW
Zimbabwe), 35–37 kHz (at several localities in Mozambique),
44 kHz (at Pafuri in the Kruger National Park in the extreme
north of South Africa) and 33 kHz (at Sudwala and Barberton in
the Mpumalanga Province in the northeast of South Africa) (Table
S1). Similarly, two distinct sonotypes within R. hildebrandtii have
been recorded in Mozambique that are also morphologically
distinct [13]. Although peak frequency of the CF component in
rhinolophid bats can vary with geography, sex or age [16],
acoustic divergence (variation in peak frequency) has been
associated with speciation in Rhinolophus [17] and in species in
the sister family of bats, the Hipposideridae [17,19] and peak
frequency is strongly associated with species recognition and the
facilitation of intraspecific communication [20].
The aim of this study was to resolve the phylogenetic
relationships and species limits of R. hildebrandtii using a
multidisciplinary approach (DNA sequences, acoustic data and
cranial, noseleaf and bacular morphology) based on recent
collections (Fig. 2; Table S1) from Mozambique, South Africa
and Zimbabwe. In order to test monophyly and to accurately
delimit the species boundaries, we included R. eloquens (the species
morphologically most similar to R. hildebrandtii) in our analyses. We
included samples of R. hildebrandtii from the Taita-Taveta District,
Kenya which is the type locality for R. hildebrandtii, in the
molecular analyses and included skull measurements from type
series of both R. hildebrandtii (from Ndi, Taita District, Kenya) and
R. eloquens (from Entebbe, Uganda). Finally we discuss the adaptive
nature of patterns of variation in echolocation frequency, body size
and cranial morphology.
Materials and Methods
Collection of samplesTissue samples and morphological descriptions and measure-
ments came both from historical museum collections, as well as
from more recent biodiversity surveys which have been reported
elsewhere [13,16,21,22] (Table S1). Specimens from Zimbabwe
(reported in 13,16) were collected during routine surveys
conducted by FPDC under the authority of (and employed by)
the National Museums of Zimbabwe and did not require permits.
Specimens from Mozambique were collected by JB [22] and AM
[21] with permission from Instituto de Investigacao Agraria de
Mocambique (IIAM), for unprotected areas, which also required
the permission of landowners, and the Sociedade para a Gestao e
Desenvolvimento da Reserva Do Niassa, Maputo (SRN) for a
formally protected area (permission letter to AM dated 6
September 2006). Voucher specimens were deposited as required
both in the Museu de Historia Natural, Maputo as well as the
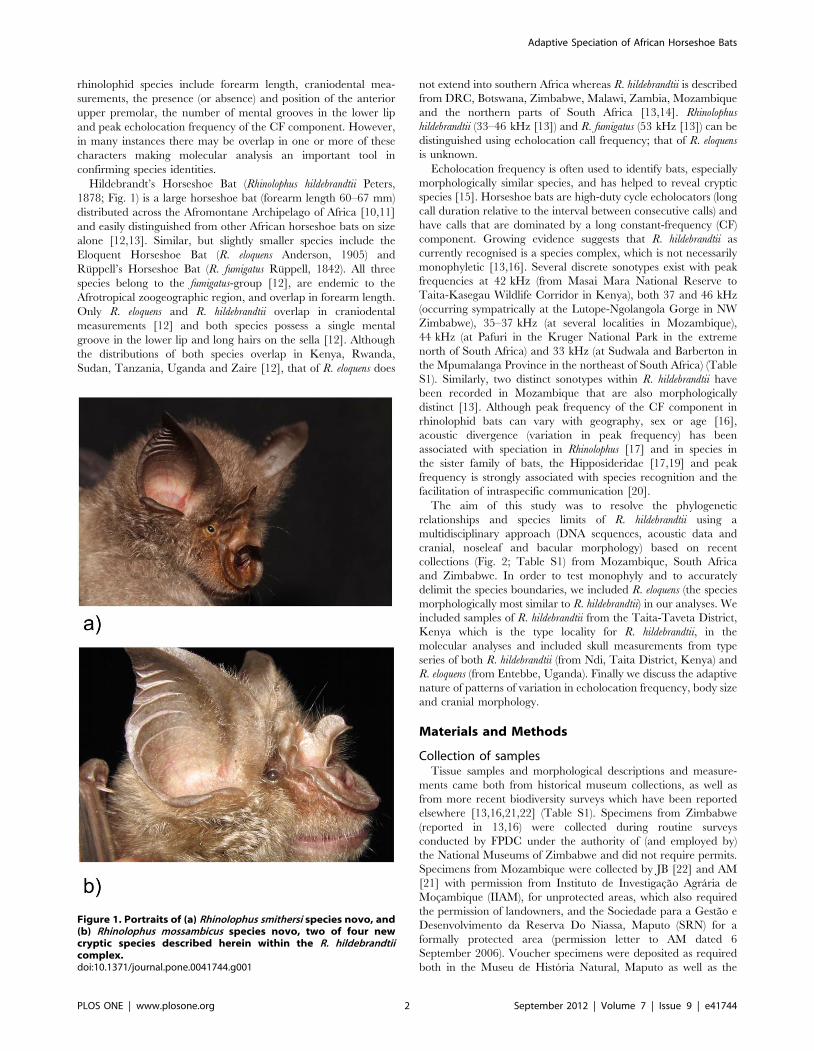
Figure 1. Portraits of (a) Rhinolophus smithersi species novo, and(b) Rhinolophus mossambicus species novo, two of four newcryptic species described herein within the R. hildebrandtiicomplex.doi:10.1371/journal.pone.0041744.g001
Adaptive Speciation of African Horseshoe Bats
PLOS ONE | www.plosone.org 2 September 2012 | Volume 7 | Issue 9 | e41744
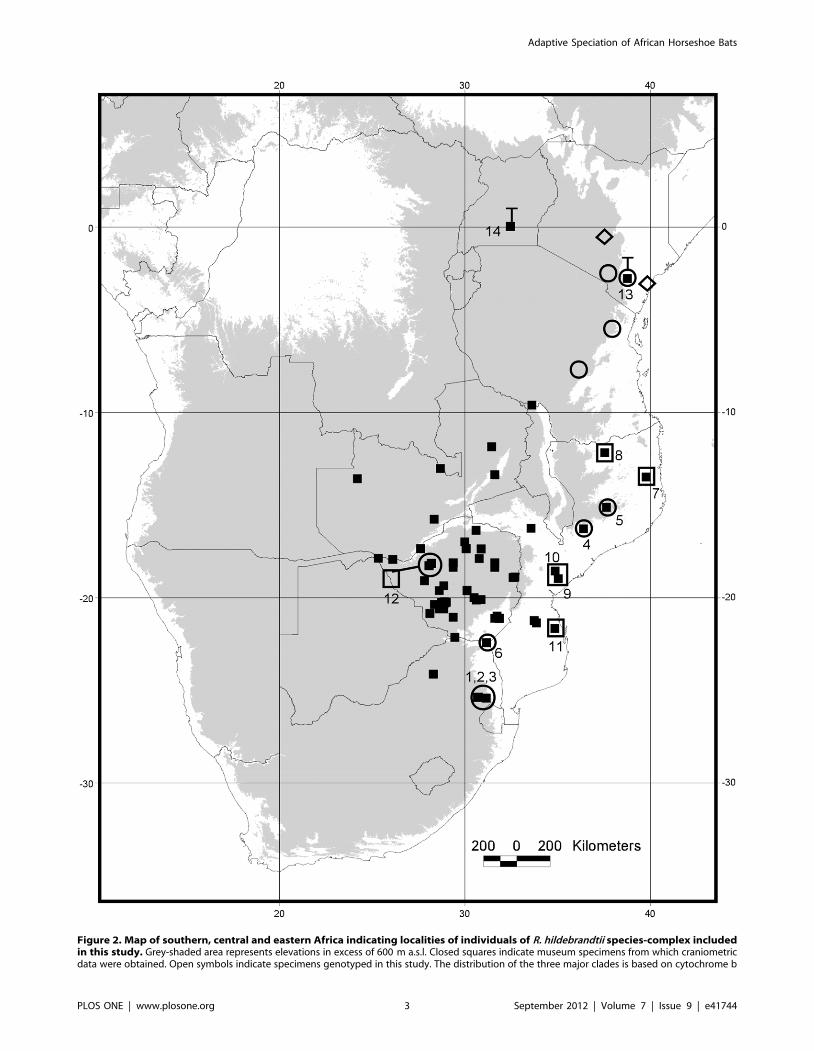
Figure 2. Map of southern, central and eastern Africa indicating localities of individuals of R. hildebrandtii species-complex includedin this study. Grey-shaded area represents elevations in excess of 600 m a.s.l. Closed squares indicate museum specimens from which craniometricdata were obtained. Open symbols indicate specimens genotyped in this study. The distribution of the three major clades is based on cytochrome b
Adaptive Speciation of African Horseshoe Bats
PLOS ONE | www.plosone.org 3 September 2012 | Volume 7 | Issue 9 | e41744
Durban Natural Science Museum. Specimens from South Africa
were collected with the permission and cooperation from the
Mpumalanga Tourism and Parks Agency (MTPA) and from local
landowners; collecting was conducted on private land (no permit
needed) as well as a formally protected area under the
management of the MTPA (P1 permit number MPB 8621) and
voucher specimens were deposited as required in the Durban
Natural Science Museum.
Molecular systematicsSampling, DNA extraction and nucleotide
sequencing. Tissue samples or wing biopsy punches from 37
individuals (Table S1) were sequenced. Sequenced taxa include 27
representatives of R. hildebrandtii sensu lato (based on keys in [12])
from Kenya, Mozambique, South Africa, Tanzania and Zim-
babwe; five individuals of R. eloquens from Kenya; and five
individuals of R. clivosus from Mozambique and South Africa.
Total genomic DNA was extracted using either the WizardH SV
Genomic DNA Purification System (Promega, Madison, Wiscon-
sin, USA) or the DNeasy Blood and Tissue Kit (Qiagen, Hilden,
Germany) following manufacturer’s recommendations.
Three mitochondrial DNA (mtDNA) gene fragments were
amplified: 1) a section of the control region (N777 and DLH1;
[23]); 2) a section of the 12S rRNA gene (12S AL and 12S BH;
[24] and 3) a 535 bp section of the cytochrome b gene using the
primers RhinoCytbF 59 CTA CCC TTC ATT ATC GCA GC 39
and RhinoCytbR 59 CCT GCA AGT GGT ATT AGG AC 39 (J.
M. Bishop, unpublished). We also amplified a section of the
nuclear intron from the nucleosome remodelling factor gene
(Chd1) using the primers and polymerase chain reaction (PCR)
thermal profile described in [25]. PCR thermal conditions for
mtDNA genes were an initial 5 min denaturation at 95uC,
followed by 35 cycles of 30 s at 94uC, 45 s annealing at 50uC(54uC for cytochrome b), 45 s at 72uC, and a final extension cycle
at 72uC for 10 min. All PCR reactions included a negative (all
reagents, but no template) to check for possible contamination. A
subsample of PCR products were visualized on 1.0% agarose gel
containing ethidium bromide. The remaining product was sent to
the Core Sequencing Facility, Stellenbosch University, South
Africa, where the PCR products were cleaned and cycle
sequencing performed using BigDye chemistry (Applied Biosys-
tems, Perkin Elmer). Sequencing products were then analysed on
an ABI 3100 (Applied Biosystems, Perkin Elmer) automated
sequencer.
Sequence Analyses. Chromatograms were visualized and
aligned using BioEdit v7.0.1 [26]. The resultant datasets
comprised: 1) control region - 33 taxa and 525 bp (101 bp
parsimony-informative); 2)12S - 27 taxa and 368 bp (23 bp
parsimony-informative); 3) cytochrome b - 20 taxa and 535 bp;
and 4) Chd1 - 20 taxa and 778 bp (15 bp parsimony-informative).
Sequences were deposited in GenBank under the following
accession numbers: JQ929202–JQ929301. Not all individuals
would amplify for all gene fragments resulting in many missing
sequences. Thus the datasets were not combined, but analysed
separately. Phylogenetic hypotheses were estimated using both
parsimony and Bayesian analyses for the control region, 12S and
Chd1 data sets. Parsimony analysis was done using the heuristic
search option, with all site changes weighted equally [27] in
PAUP* 4.0b10 [28]. Tree-bisection-reconnection (TBR) branch
swapping was used and starting trees were obtained via 100
random stepwise additions. Bootstrap support [29] was calculated
using 1000 replicates. Calculation of uncorrected (not based on a
particular model of evolution) pairwise genetic distances for each
gene was conducted using PAUP* 4.0b10.
The most appropriate model of molecular evolution was
determined for each gene fragment using the Akaike Information
Criterion (AIC) and Bayesian Information Criterion (BIC) as
implemented in jModelTest 0.1.1 [30]. The model parameters for
each dataset were used in subsequent analyses.
Bayesian analyses (BA) were conducted using Mr Bayes 3.1.2
[31]. Four incrementally heated chains were run for three million
generations, with parameters sampled every 1000 generations.
Convergence of the MCMC chains was assessed by inspecting
whether the standard deviation of split frequencies approached
zero and the potential scale reduction factor (PSRF) reached 1.0
for all parameters. We also investigated the convergence using
Tracer v 1.4.1 [32]. A 25% burnin was used and the 50% majority
rule consensus tree was constructed from the remaining tree data.
Molecular dating. To estimate divergence dates, the cyto-
chrome b data set was analysed in BEAST 1.4 [29]. We included
additional R. hildebrandtii sequences from Pafuri [33] and Tanzania
(EU436676, [34]) as well as other African Rhinolophus species
downloaded from GenBank: R. darlingi (EU436675); R. eloquens
(EU436677); R. fumigatus (FJ457614); R. landeri (EU436668,
FJ457612) and R. ruwenzorii (EU436679 and FJ185203). In order
to be able to use fossil calibration points we incorporated
sequences downloaded from GenBank for six species in the family
Hipposideridae, sister to the Rhinolophidae: H. armiger
(DQ865345), H. caffer (EU934461), H. cyclops (EU934466), H. gigas
(EU934469), H. pratti (EF544427) and H. ruber (EU934485).
jModelTest [30] was used to determine the most appropriate
model of evolution. BEAUTi was used to set model parameters
and the monophyly of the ingroup (Rhinolophus) was constrained
during analysis. We used the HKY model with empirical base
frequencies and the substitution rate was not fixed. The Yule
speciation process was used as the tree prior and a relaxed
uncorrelated lognormal molecular clock model was selected. A
normal distribution for the tree prior for the node delimiting time
to the most recent common ancestor was selected. As calibration
points we followed Teeling et al. (2003) and Eick et al. (2005) and
used a minimum of 37 Mya and maximum of 55Mya for the split
between the Rhinolophidae and the Hipposideridae [35,36]. The
MCMC chain was run for 20 million generations, with parameters
logged every 1000 generations.
Results were evaluated using Tracer v1.4.1 [32]. The Effective
Sample Size (ESS) values were .200 for all parameters, suggesting
the MCMC run was sufficient and independent samples were
incorporated to obtain valid parameter estimates [32]. Trees were
collated using TreeAnnotator 1.6 where mean heights and a
burnin of 10% were selected.
Acoustic recordings and an analysis of echolocationfrequency predictors
Values for peak frequency (which in this study includes
‘maximum’ frequency from frequency-division bat detectors) of
the CF component of echolocation calls of R. hildebrandtii were
obtained from the literature [13,16,37,38]. Additional recordings
were obtained from Mozambique, South Africa and Zimbabwe
(see Figure 2): open circles = Clade 1; open squares = Clade 2; open diamonds = Clade 3. Closed squares enclosed in open symbols indicate localitieswhere both molecular and morphological data were available for selected specimens. Numbers refer to respective localities listed in Table S1. ‘‘T’’indicates the type localities of R. eloquens in Uganda and R. hildebrandtii in Kenya, respectively.doi:10.1371/journal.pone.0041744.g002
Adaptive Speciation of African Horseshoe Bats
PLOS ONE | www.plosone.org 4 September 2012 | Volume 7 | Issue 9 | e41744
(Tables S1 and S2) using an ANABAT II bat detector (Titley
Electronics, Ballina, Australia), Avisoft UltraSoundGate 116
(Avisoft Bioacoustics, Berlin, Germany) or a Pettersson D2406or D980 bat detector (Pettersson Electronik AB, Uppsala,
Sweden). Echolocation recordings from ANABAT recordings
were analysed with ANALOOK (Chris Corben, version 4.8), and
Pettersson recordings with either Raven Pro version 1.3 (R. A.
Charif, A. M. Waack, and L. M. Strickman — Cornell Laboratory
of Ornithology), or with BatSound Pro v3.20 (Pettersson
Electronik AB, Uppsala, Sweden) software. For ANABAT
recordings, we defined peak echolocation frequency as F(max)
[39]. For time expansion recordings, peak frequency was
measured from the peak of the power spectrum [40]. It was
assumed that values of peak frequency determined with time-
expansion detectors [16,38] and frequency division detectors (i.e.
ANABAT detector; [21]; Monadjem, unpublished data) would be
close enough to make meaningful comparisons for the purpose of
the present study.
We developed linear models in R2.13.1 (R Development Core
Team, Vienna; http://www.r-project.org) to test the significance
of various predictors of the peak frequency of the echolocation call.
Based on a sample of 36 individuals with known frequency
(specimens with recorded frequencies listed in Table S1, excluding
the two Kenyan hildebrandtii s.s. individuals), we tested up to ten
independent variables in R with hierarchical nested linear models
of increasing complexity. The predictor variables included forearm
length, five cranial variables (defined below: CCL, ZYW, NL,
NW, NH), two environmental variables, altitude (obtained from
www.worldclim.org) and relative humidity (obtained from U.S.
National Aeronautics and Space Administration (NASA), Surface
meteorology and Solar Energy (SSE) programme, release 6.0:
http://eosweb.larc.nasa.gov/sse/), and two categorical variables,
sex and molecular clade membership (Clade 1 or Clade 2). The
simplest models included just skull length (CCL) and altitude.
Because of the potential effect of altitude on body (and therefore
cranial) size (Bergman’s Rule) we included altitude-group (lowland
,600 m; highland .600 m) as a co-variate both with (CCL*Alti-
tude; Model 1) and without (CCL+Altitude, Model 2) interaction.
The interaction term for CCL and altitude in Model 1
(b= 20.7402) was not significant (p.0.05), and the Log-
Likelihood Ratio test did not find a significant difference between
Models 1 and 2. Thus, later models did not allow interaction.
Model 3 was similar to Model 2 but used altitude as a continuous
rather than categorical variable. Based on Akaike Information
Criteria (AIC) values, Model 3 was inferior to Model 2 and thus
the categorical variable for altitude performed better and was used
in later models. Model 4 included all five cranial variables,
forearm length and the two environmental variables mentioned
above (altitude and relative humidity). Model 5 included all these
variables in addition to two additional categorical variables, sex
and clade. Model fit of each model was assessed inter alia by
inspecting plots of residuals for fit to normal distribution. Relative
performance of models was assessed using likelihood ratio tests and
AIC values.
MorphologySpecimens. Since our objective was to compare multiple
datasets (molecular, acoustic and morphological) for the same
critical samples, we focussed on recent collections of skins and
skulls for which molecular and acoustic data were available
(localities indicated by open symbols in Fig. 2) from Zimbabwe,
South Africa and Mozambique in the collections of the National
Museums of Zimbabwe (NMZB; Bulawayo), Durban Natural
Science Museum (DM) and Ditsong National Natural History
Museum (formerly Transvaal Museum; TM) (Table S1; Fig. 2). An
additional seven skulls were added to the analysis, representing
type series of R. eloquens (n = 5; Natural History Museum, London;
BM) and R. hildebrandtii (n = 2; Zoologisches Museum, Berlin;
ZMB). One additional damaged skull of the co-type from the
Natural History Museum in London (BM) was examined but not
included in the final morphometric analysis. We had access to a
database of cranial measurements from a much larger collection of
both eloquens and hildebrandtii from the following museum
collections: DM, Harrison Zoological Museum (HZM; Sevenoaks,
UK), NMZB, BM, ZMB and TM. Since preliminary principal
component analyses (PCA) showed the Zimbabwe R. hildebrandtii
sample to be relatively homogenous craniometrically, we used a
sample of 109 R. hildebrandtii skulls from Zimbabwe to test for the
presence of significant sexual dimorphism in this species.
To investigate further the species limits and morphological
diagnosability of lineages defined by genetic and acoustic data, we
analysed variation in the larger sample of 255 intact skulls using six
craniometric variables (GLS, CCL, ZW, MW, M3M3, CM3; see
definitions below). Since preliminary analyses of non-geographic
variation (available from PJT) detected significant sexual dimor-
phism, males and females were analysed separately and only those
for males (n = 171) were presented. Samples were grouped to pool
biogeographically-similar localities into Operational Taxonomic
Units (OTUs). Exploratory PCA analyses of individuals were used
to test morphological homogeneity of defined OTUs. Due to
scarcity of available samples, specimens from East Africa were
grouped into single OTUs (for both R. eloquens and R. hildebrandtii)
and specimens of R. hildebrandtii from Zambia and Malawi were
combined. Specimens of R. hildebrandtii from Zimbabwe were
grouped into four OTUs (north, central, east and south).
Specimens from lowland savanna localities in Mozambique (Tete
and Zinave) were assigned to the biogeographically continuous
‘‘south’’ OTU from the southeastern ‘‘lowveld’’ of Zimbabwe.
Other Mozambican and South African localities for which
molecular data were available were assigned to either Clade 1 or
Clade 2 or to lineages as defined by molecular analysis (see
Results).
Morphological and morphometric analyses. In additional
to morphometric analysis of continuous characters, we scored the
following qualititative, craniodental characters: the presence,
position (external or within toothrow) and relative size (small or
‘‘tiny’’) of the small anterior upper premolar and the relative
height of the anterior nasal swelling and sagittal crest in lateral
view.
For morphometric analysis, adult rhinolophids were selected
based on degree of tooth wear, and extent of ossification of
epiphyses in the finger bones. We used two morphometric
approaches: analysis of traditional linear measurements as well
as landmarks placed on dorsal and lateral images of crania.The
following 12 cranial measurements were taken to the nearest
0.01 mm using Mitutoyo digital callipers with accuracy of
0.01 mm: greatest length of skull measured dorsally from occiput
to anterior point of skull (GSL); condylo-incisive length from
occipital condyles to front of incisors (CIL); condylocanine length
from occipital condyles to front of canines (CCL); zygomatic
width, the greatest distance across the zygoma (ZW); mastoid
width, the greatest distance across the lateral projections of the
mastoid processes (MW); width of maxilla between outer edges of
M3 (M3M3); braincase width measured at dorsal surface of
posterior root of zygomatic arches (BCW); least interorbital width
between orbits (IOW); upper toothrow length from anterior
surface of C to posterior surface of M3 (CM3); greatest width
across anterior lateral nasal inflations (NW); length from occipital
Adaptive Speciation of African Horseshoe Bats
PLOS ONE | www.plosone.org 5 September 2012 | Volume 7 | Issue 9 | e41744
condyles to front of nasal inflations (NL); and height of nasal
inflation directly above the anterior cingulum of M2 (NH) [12,41].
Principal component analysis (PCA) and canonical variates
analysis (CVA) was carried out on log-transformed variables using
the programme XLSTAT version 2008.2.03 [42].
A Sony Cybershot DSC-H2 digital camera (6 megapixel; 126optical zoom and 62 converter; macro function), mounted on a
tripod at a fixed distance of 20 cm from the skull (which was
always mounted on graph paper), was used to take dorsal and
lateral images for 22 skulls from the same sample used for linear
measurements.
Landmark placement and further analyses were performed
using the thin plate spline (TPS) series of programmes. The
programme tpsDig version 2.1 [43] was used to capture landmarks
in two dimensions for dorsal (13 landmarks) and lateral (12
landmarks) views (see Figs. 6 and 7 for position of landmarks on
lateral and dorsal images respectively). The programme tpsRelw
version 1.42 [44] was used to conduct a Generalised Procrustes
Analysis or GPA (Generalised Least Squares, GLS, [45]), which
serves to translate, rotate and scale the landmark configurations,
and produces a consensus configuration for the entire suite of
specimens in the analysis via a series of iterations. GPA residuals
are further decomposed into both non-uniform (non-affine), and
uniform (affine) shape components. Non-affine shape expresses
localized shape changes, and is represented by the weights matrix,
W, of partial warp scores. Affine shape expresses shape changes
that affect the entire configuration (i.e. dilation or sheer), and this
component is represented by two vectors, U1 and U2. Together,
U+W represent total shape. Relative warps analysis performs a
PCA of the covariance matrix of the total shape matrix (U+W).
For introductions to geometric morphometrics and its applica-
tion to mammalian systematics see [46,47,48,49,50].
Morphology of noseleaf. Noseleafs of alcohol-preserved
specimens were photographed in lateral and frontal views.
Maximum noseleaf width was measured in 44 specimens included
in this study.
Morphology of baculum. Preparation of 12 R. hildebrandtii
bacula from males from six localities (Niassa Game Reserve,
Gorongosa Caves and Mt Mabu in Mozambique, and Barberton
Tunnels, Sudwala Mines and Mayo Mines in Mpumalanga
Province of South Africa) followed standard procedures
[51,52,53]: penial tissue was macerated in 5% KOH and the
baculum stained with alizarin red followed by dissection of the
baculum and clearing with glycerine. Bacula were stored in 100%
glycerine with a crystal of thymol to prevent fungal growth. Each
baculum was photographed in dorsal, ventral and lateral view and
total baculum length (TBL), measured along the axis of the shaft,
was recorded using Mitutoyo digital callipers viewed under a
dissecting microscope. All bacular photographs were taken against
a background of graph paper to facilitate scale drawings of the
bacula.
Nomenclatural actsThe electronic version of this document does not represent a
published work according to the International Code of Zoological
Nomenclature (ICZN), and hence the nomenclatural acts
contained in the electronic version are not available under that
Code from the electronic edition. Therefore, a separate edition of
this document was produced by a method that assures numerous
identical and durable copies, and those copies were simultaneously
obtainable (from the publication date noted on the first page of this
article) for the purpose of providing a public and permanent
scientific record, in accordance with Article 8.1 of the Code. The
separate print-only edition is available on request from PLoS by
sending a request to PLoS ONE, 1160 Battery Street, Suite 100,
San Francisco, CA 94111, USA along with a check for $10 (to
cover printing and postage) payable to ‘‘Public Library of
Science’’.
In addition, this published work and the nomenclatural acts it
contains have been registered in ZooBank, the proposed online
registration system for the ICZN. The ZooBank LSIDs (Life
Science Identifiers) can be resolved and the associated information
viewed through any standard web browser by appending the LSID
to the prefix ‘‘http://zoobank.org/’’. The LSID for this
publication is: urn:lsid:zoobank.org:pub:90004C93-59CE-484B-
949A-66B98EAC94B2.
Digital archives where PLoS articles are deposited are
PubMedCentral (http://www.pubmedcentral.nih.gov/) and
LOCKSS (http://www.lockss.org/).
Results
Molecular systematicsResults from both parsimony and Bayesian analyses show
similar topologies. For all four genes analysed, three well-
supported, monophyletic clades are recovered: 1) Clade 1
comprising R. hildebrandtii from Mpumalanga Province in South
Africa, Pafuri in the extreme northern region of Kruger National
Park, Mts Mabu and Inago in Mozambique, Lutope-Ngolangola
Confluence (Gorge) in Zimbabwe and Tanzania and Kenya
(including topotypic samples of R. hildebrandtii from Taita District,
Kenya); 2) Clade 2 comprising R. cf. hildebrandtii specimens from
Mozambique and Zimbabwe, and 3) Clade 3 consisting of R.
eloquens individuals from Kenya (Fig. 2; Fig. 3; Fig. S1).Within the
R. hildebrandtii Clade 1, four lineages were recognized (1a, 1b, 1c
and 1d/e based on the cytochrome b ultrametric tree in Fig. 3,
and the 12S tree in Fig. S1 {1d and 1e are regarded on other
characters to belong to the same species; see below}). These
lineages correspond to broad or narrow geographical areas as
follows: 1a) Sudwala Mine, Barberton and Mayo Mine, Mpuma-
langa Province of South Africa; 1b) Mts Mabu and Inago,
northern Mozambique; 1c) Kenya and Tanzania; 1d/e) individ-
uals from Pafuri, South Africa and the Lutope-Ngolangola Gorge,
Zimbabwe (Fig. 3; Fig. S1).
Uncorrected pairwise sequence distances (p) for the four gene
fragments are provided in Table 1, 2. Because of the high degree
of variation in distances within clades and lineages, the values
between individuals used in the control region dataset are
provided in Table S2. On average, genetic distances between
the three main clades were similar with the R. cf hildebrandtii
individuals (Clade 2) being as different from R. hildebrandtii (Clade
1) as they were from R. eloquens (Clade 3). For cytochrome b, Clade
1 differs from Clades 2 and 3 by 7.7 to 9.3% and Clades 2 and 3
differ by ca 7%, whilst sub-lineages within Clade 1 varied from 0.6
to 1.1% (Table 1).
Bayesian divergence estimates suggest that divergence among
the deeper lineages within the Rhinolophidae occurred during the
Miocene. The most recent common ancestors for each of the three
lineages representing R. hildebrandtii (Clade 1; ca 3.27 Mya), R. cf
hildebrandtii (Clade 2; ca 2.54 Mya) and R. eloquens (Clade 3; ca 2.18
Mya) were present during the late Pliocene (Fig. 3). Within R.
hildebrandtii, East African bats (Lineage 1c) diverged from Sudwala
and surrounds (Lineage 1a) and Mt Inago (Lineage 1b) bats during
the late Pliocene (ca 3.27 Mya; Fig. 3), with Lineages 1a and 1b
diverging during the Pleistocene (ca 1.67 Mya; Fig. 3).
Adaptive Speciation of African Horseshoe Bats
PLOS ONE | www.plosone.org 6 September 2012 | Volume 7 | Issue 9 | e41744

Acoustic recordings and analysisData for peak echolocation frequency for different populations
surveyed are summarised in Table 3. Estimates of peak frequency
within R. hildebrandtii sensu lato varied from 32 to 46 kHz (Table 3).
Where larger sample sizes were available, e.g., Sudwala and
surrounds, Mpumalanga, South Africa (n = 7) and Lutope-
Ngolangola Gorge, Zimbabwe (n = 15), standard deviations were
very low indicating minimal intra-population variation. An
obvious exception was the sympatric occurrence of two divergent
sonotypes (37 and 46 kHz) at Lutope-Ngolangola Gorge (Table 3).
Figure 3. Consensus tree for the cytochrome b dataset for representative genotyped specimens of the Rhinolophus hildebrandtiicomplex. The topology represents the consensus topology from a 20 million MCMC run implemented in BEAST. Estimates of divergence times(million years ago; Mya) are indicated adjacent to nodes or above branches and grey bars indicate 95% HPD values. The split between theHipposideridae and Rhinolophidae was used as the calibration point. Taxa names include museum/field numbers which correspond to Appendix S1or GenBank accession numbers and abbreviations are: RcfH - R. cf. hildebrandtii, RD - R. darlingi, RE - R. eloquens, RF - R. fumigatus, RH - R. hildebrandtiis.l., RL - R. landeri and RR - R. ruwenzorii. Localities, where available, are provided, abbreviations include SA - South Africa, MZ - Mozambique, and ZW -Zimbabwe, and the numbers in parentheses correspond with place names in Table S1 and Fig. 2 for Clade 1 and 2 individuals.doi:10.1371/journal.pone.0041744.g003
Table 1. ‘Uncorrected p’ pairwise sequence distances for the 12S gene below the diagonal and Chd1 gene above the diagonal forthe clades (1, 2, 3) and some lineages (1a, 1b, 1c) identified in the molecular analyses of the Rhinolophus hildebrandtii complex.
1a (cohenae sp.nov.)
1b (mabuensissp. nov.
1c (hildebrandtiis.s.)
2 (mossambicus sp.nov.) 3 (eloquens) Outgroup
1a 0.000/0.000 0.003 0.001 0.006 0.010 0.013
1b 0.005–0.011 ,/0.003–0.011 0.001 0.006 0.010 0.013
1c 0.008 0.011–0.016 0.000/0.000 0.005 0.009 0.012
2 0.022–0.027 0.022–0.030 0.025–0.030 0.000/0.000–0.008 0.006 0.009
3 0.027–0.030 0.033–0.038 0.025–0.027 0.027–0.035 0.000/0.000–0.003 0.013
Outgroup 0.030–0.033 0.038–0.041 0.030 0.033–0.041 0.033–0.036 0.000/0.000
Values in bold refer to within-clade distances for the 12S gene and values in italics refer to the within-clade distances for the Chd1 gene. Because of the high level ofvariation, no values are provided for the outgroup Rhinolophus and Hipposideros species for cytochrome b. Revised taxon names for molecular lineages are given inparentheses in the column headings (see Taxonomic Conclusions).doi:10.1371/journal.pone.0041744.t001
Adaptive Speciation of African Horseshoe Bats
PLOS ONE | www.plosone.org 7 September 2012 | Volume 7 | Issue 9 | e41744
Of the five linear models of increasing complexity, the most
complex model (Model 5) which included all ten variables,
performed best (AIC 122.58), followed by Model 4 having eight
variables (AIC 150.89), and Models 2 (AIC 161.79), 1 (AIC
163.50) and 3 (AIC 163.62) which all had two variables (CCL and
altitude) but differed in whether altitude was allowed to interact
with CCL (Model 1) or not (Model 2) and whether altitude was
treated as continuous (Model 3) or categorical (all other models).
Model 5 had residuals conforming closely to the normal
distribution and explained 93% of variation in peak frequency of
the CF component. Based on relative importance (using the ‘‘lmg’’
metric in R), two skull size parameters (CCL: 17.0%; NL: 19.0%)
and altitude (17.5%) explained most of the variation, followed by
forearm length (8.5%), relative humidity (6.2%), rostral chamber
height (6.1%), zygomatic width (5.7%), rostral chamber width
(5.6%), clade (5.2%), and sex (2.4%) (Fig. S3). CCL accounts for
68.3% of variation in peak frequency according to the regression
equation: CF frequency = 142.59 - 4.29*CCL (Fig. S3a). Altitude
(,600 m or .600 m) alone explains 35.3% of variation with
populations from low elevations having significantly higher peak
frequencies than high elevation populations (Fig. S3b). A positive
and significant correlation also exists between altitude and CCL
(R2 = 0.247; p,0.01; CCL = 23.73+0.0021*altitude); however we
found no significant interaction between CCL and altitude
(categorical variable) in our Model 2 (interaction b= 20.74;
t = 20.51, p.0.05). When ten variables were considered simul-
taneously in a complex model, two cranial length variables (CCL
and NL) and altitude had a relative importance (.17%) much
greater than that for other variables (,10%). Forearm length (with
relative importance of 8.5%) was significantly negatively correlated
with peak frequency (R2 = 0.371; p,0.01; frequency = 101.17 -
1.006*FL), as was relative humidity (RH; relative importance
6.2%; R2 = 0.146, p = 0.02; frequency = 50.52 -0.245*RH).
MorphologyCranial morphometrics. Firstly, we analysed external and
cranial morphometric differences associated with two sympatric
sonotypes (37 kHz and 46 kHz) from the Lutope-Ngolangola
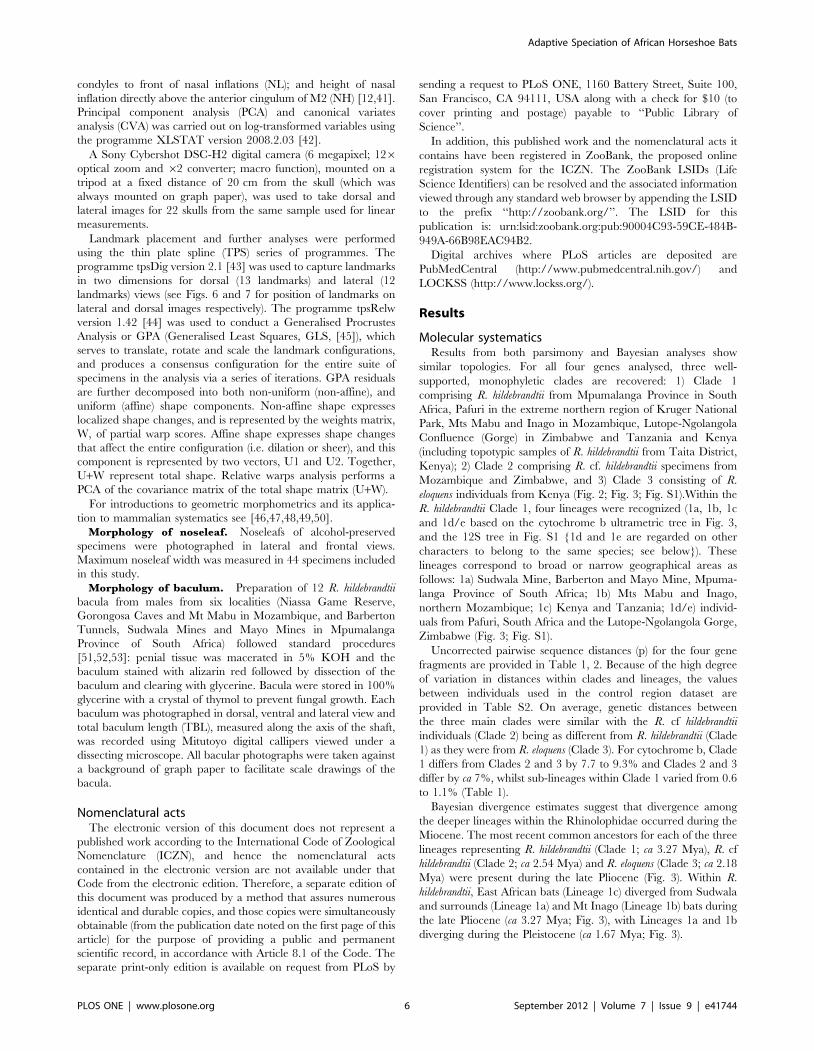
Table 2. ‘Uncorrected p’ pairwise sequence distances for the control region below the diagonal and cytochrome b gene above thediagonal for the clades (1, 2, 3) and some lineages (1a, 1b, 1c) identified in the molecular analyses of the Rhinolophus hildebrandtiicomplex.
1a (cohenaesp. nov.)
1b (mabuensis sp.nov. 1c (hildebrandtii s.s.) 2 (mossambicus sp. nov.) 3 (eloquens) Outgroup
1a 0.000/0.000 0.006 0.009–0.011 0.082 0.090–0.093
1b 0.027–0.029 ,/0.013 0.009–0.011 0.077–0.080 0.088–0.090
1c 0.032–0.040 0.029–0.036 0.000–0.006/0.000–0.023 0.077–0.080 0.088–0.090
2 0.092–0.103 0.084–0.099 0.088–0.101 0.000–0.009/0.000–0.023 0.071–0.075
3 0.082–0.094 0.073–0.086 0.073–0.086 0.080–0.096 0.000–0.009/0.000–0.034
Outgroup 0.098–0.117 0.095–0.116 0.101–0.120 0.111–0.128 0.084–0.105 ,/0.019–0.071
Bold values indicate within-clade distance for control region and values in italics indicate within-clade distances for cytochrome b. Because of the high level of variation,no values are provided for the outgroup Rhinolophus and Hipposideros species for cytochrome b. Revised taxon names for molecular lineages are given in parenthesesin the column headings (see Taxonomic Conclusions).doi:10.1371/journal.pone.0041744.t002
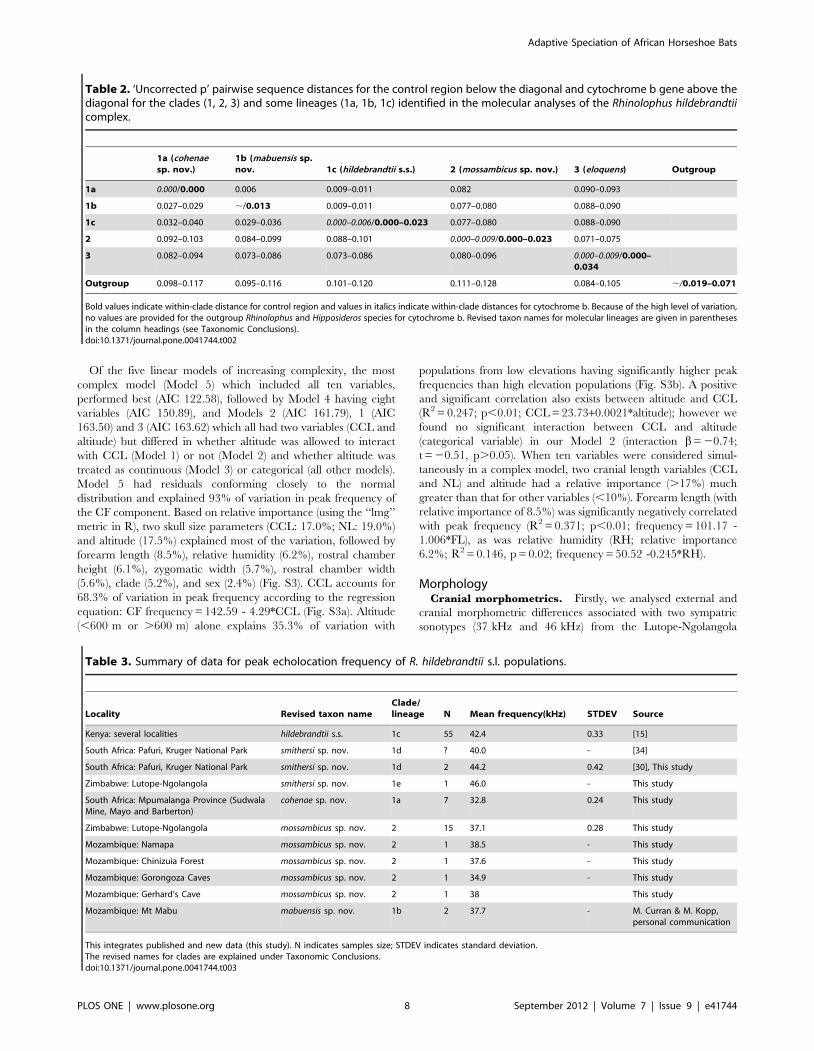
Table 3. Summary of data for peak echolocation frequency of R. hildebrandtii s.l. populations.
Locality Revised taxon nameClade/lineage N Mean frequency(kHz) STDEV Source
Kenya: several localities hildebrandtii s.s. 1c 55 42.4 0.33 [15]
South Africa: Pafuri, Kruger National Park smithersi sp. nov. 1d ? 40.0 - [34]
South Africa: Pafuri, Kruger National Park smithersi sp. nov. 1d 2 44.2 0.42 [30], This study
Zimbabwe: Lutope-Ngolangola smithersi sp. nov. 1e 1 46.0 - This study
South Africa: Mpumalanga Province (SudwalaMine, Mayo and Barberton)
cohenae sp. nov. 1a 7 32.8 0.24 This study
Zimbabwe: Lutope-Ngolangola mossambicus sp. nov. 2 15 37.1 0.28 This study
Mozambique: Namapa mossambicus sp. nov. 2 1 38.5 - This study
Mozambique: Chinizuia Forest mossambicus sp. nov. 2 1 37.6 - This study
Mozambique: Gorongoza Caves mossambicus sp. nov. 2 1 34.9 - This study
Mozambique: Gerhard’s Cave mossambicus sp. nov. 2 1 38 This study
Mozambique: Mt Mabu mabuensis sp. nov. 1b 2 37.7 - M. Curran & M. Kopp,personal communication
This integrates published and new data (this study). N indicates samples size; STDEV indicates standard deviation.The revised names for clades are explained under Taxonomic Conclusions.doi:10.1371/journal.pone.0041744.t003
Adaptive Speciation of African Horseshoe Bats
PLOS ONE | www.plosone.org 8 September 2012 | Volume 7 | Issue 9 | e41744

Gorge in NW Zimbabwe. In a sample of 14 individuals of known
peak echolocation frequency for which we had complete
morphometric data, a single female with peak echolocation
frequency of 46 kHz displayed the second-lowest forearm length
but the second-highest noseleaf width (disproportionately wide
noseleaf comprising 23.7% of forearm length) compared to 13
individuals (one female and 12 males) recorded at 37 kHz (noseleaf
comprised 19.7–22.9% of forearm length; Fig. 4a). The same
46 kHz individual was much smaller in cranial size (lower scores
on PC1) than all other 37 kHz members of the population (Fig. 4b).
Of three individuals sequenced from this Lutope-Ngolangola
sample, two have peak frequencies of 37 kHz (NMZB 33644 and
NMZB 33648) and belong to Clade 2 whilst a third (NMZB
33652) belonged to Clade 1 (Fig. 3; Fig. S1). Although the
echolocation call of the latter was not recorded in the field, it was
noticeably small in cranial size and in fact grouped closely with the
individual NMZB 33647 which had a peak frequency of 46 kHz
(Fig. 4b). Albeit based on very small sample sizes, this correspon-
dence between molecular, morphological and acoustic data
suggests that the two acoustic sonotypes occurring sympatrically
at Lutope-Ngolangola are also genetically and morphologically
divergent, belonging to the two major clades defined by
mitochondrial and nuclear sequences.
Secondly, using five cranial variables, we examined craniomet-
ric variation in a sample combining the above population with (1)
recently collected voucher specimens from northern South Africa
and Mozambique included in molecular and acoustic studies and
(2) type series of R. hildebrandtii and R. eloquens from East Africa
(Fig. 5b; Table 3). Based on PCA, the small-sized Clade 1
individual from Zimbabwe is clearly the smallest R. hildebrandtii s.l.
individual from southern Africa (Fig. 5a; situated far to the left on
PC1) but crania from the type series of R. eloquens from Entebbe,
Uganda were much smaller than all other populations, including
this small-sized R. hildebrandtii. The holotype and cotype of R.
hildebrandtii fell within the range of variation of the population of
37 kHz R. hildebrandtii from Lutope-Ngolangola in Zimbabwe
(Fig. 5a).
Members of Clade 1 displayed both extremes in cranial size
relative to the moderately-sized Clade 2 sample. For example,
whilst some members of Clade 1 (Lineage 1a from Sudwala and
surrounds and Lineage 1b from Mts Mabu and Inago) could be
clearly distinguished on the basis of their larger size (separation on
PC1 and PC2 axes; Fig. 5b), individuals from Pafuri (Lineage 1d)
and the small individual from Lutope-Ngolangola (Lineage 1e)
were distinctly smaller in cranial size than most Clade 2 members
of R. hildebrandtii from Mozambique lowlands and the 37 kHz
individuals from Lutope-Ngolangola (which we also assigned to
Clade 2; see above). Members of Clade 2 were intermediate-sized
and varied considerably in skull size with some overlapping
marginally with the Pafuri sample and others just bordering the
lower end of the range of variation of the Sudwala sample (Fig. 5b).
PCA indicated a clear-cut separation between the Sudwala sample
and Mt Mabu and all other populations on PC2, with the former
group having disproportionately narrow maxillae in relation to
mastoid width (Fig. 5b, Table 3).
The trends mentioned above were confirmed by CVA of ten
variables in five pre-defined groups (Fig. 5a) based on molecular
clades and sub-clades (lineages) defined in Fig. 2 and Fig. S1: 1)
Lineage 1a (Sudwala); 2) Lineage 1b (Mts Mabu and Inago); 3)
Lineage 1d (Pafuri); 4) Clade 2 (Mozambique); 5) Clade 2 (Lutope-
Ngolangola; 37 kHz individuals) (Fig. 5a). Based on CVA, 96% of
individuals were assigned to their correct a priori group, all of
Groups 1, 3 and 5 defined above but only one of two individuals of
Group 2 and five of six individuals (83%) of Group 4 (Clade 2).
Due to small sample sizes, Lineages 1c and 1e were not included in
the CVA analysis.
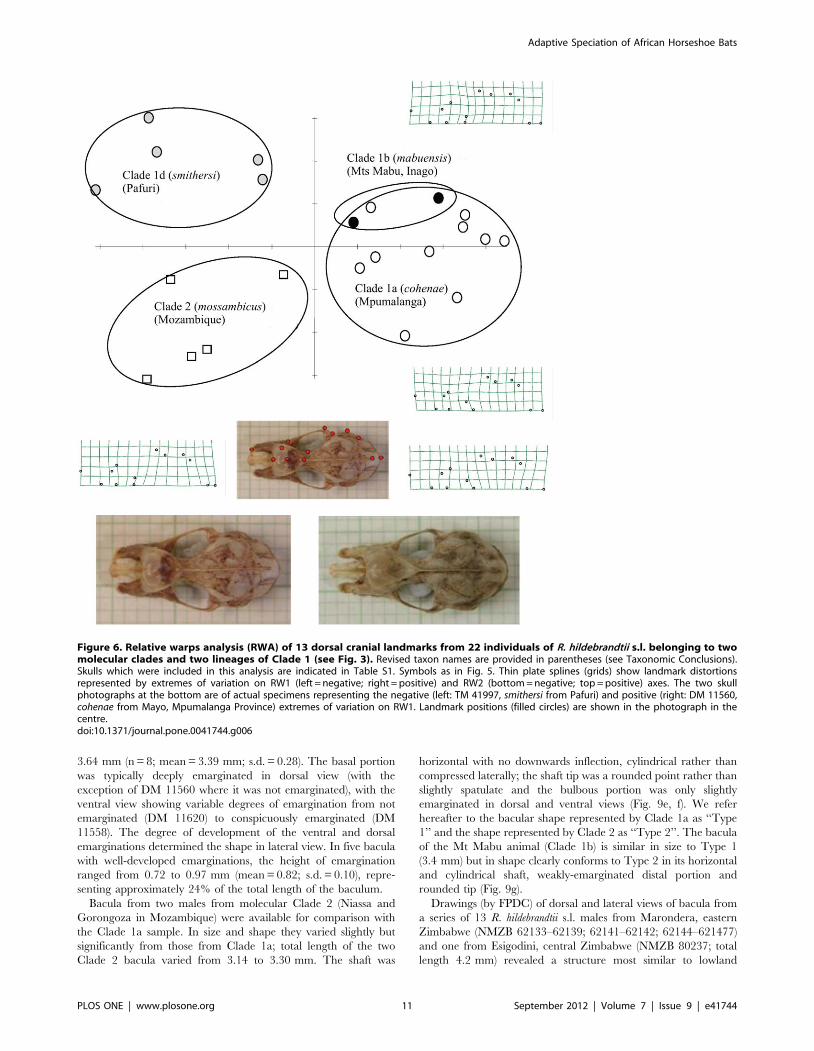
To investigate possible subtle cranial shape differences between
molecularly defined clades, the third step in our morphometric
analysis was to analyse landmark data from dorsal (Fig. 6) and
lateral (Fig. 7) cranial images. Relative warps analysis (RWA) of
both dorsal and lateral landmarks distinguished the same three
Figure 4. Morphometric variation in a series representing the R.hildebrandtii complex from Lutope-Ngolangola, Zimbabwe: a)biplot of forearm length versus noseleaf width and b) PCA offive craniometric variables (M3M3, CM3, IOC, NW, NH) in 26individuals of known (37 or 46 kHz) and unknown (?)frequency. Females indicated by open circles, males by closed circlesor crosses or asterisk. Voucher specimens for molecular sequencingstudy indicated by asterisk (Clade 1e: = smithersii sp. nov.; seeTaxonomic Conclusions) and crosses (Clade 2: = mossambicus sp.nov.; see Taxonomic Conclusions). Hereafter, all individuals with afrequency of 37 kHz were assumed to belong to Clade 2 (mossambicussp. nov.) and the 46 kHz individual was assumed to belong to Clade 1e(smithersi sp. nov.).doi:10.1371/journal.pone.0041744.g004
Adaptive Speciation of African Horseshoe Bats
PLOS ONE | www.plosone.org 9 September 2012 | Volume 7 | Issue 9 | e41744

groups comprising: (1) Lineages 1a and 1b comprising populations
from Sudwala and Mts Mabu and Inago; (2) the Pafuri population
representing Lineage 1d; and (3) Clade 2 (lowland Mozambique)
(Figs. 6, 7). In both dorsal and lateral analyses the first relative
warp (RW1) distinguished the first group from the other two whilst
RW2 distinguished groups 2 (Lineage 1d) and 3 (Clade 2). Thin
plate splines (deformation grids) indicated shape differences
associated with RW1 and RW2 (Figs. 6, 7). In dorsal view
(Fig. 6), shape variation was associated with the relative position of
the junction between the two supraorbital ridges and the sagittal
crest, which shifted from anterior (Lineages 1d, 2) to posterior
(Lineages 1a, b) resulting in a poorly- to well-developed V-shaped
basin (‘‘frontal depression’’ [12]) respectively behind the nasal
inflation. Another cranial difference relates to the length of the
sagittal crest (shorter in Pafuri and lowland Mozambique; longer
in Sudwala, Mt Mabu and Mt Inago). These two above-
mentioned characters (frontal depression and sagittal crest) are
linked because they share a point. Based on the thin plate spline
for RW2 in Fig. 6, Pafuri (Lineage 1d) was distinguished from
lowland Mozambique (Clade 2) by having a partially developed
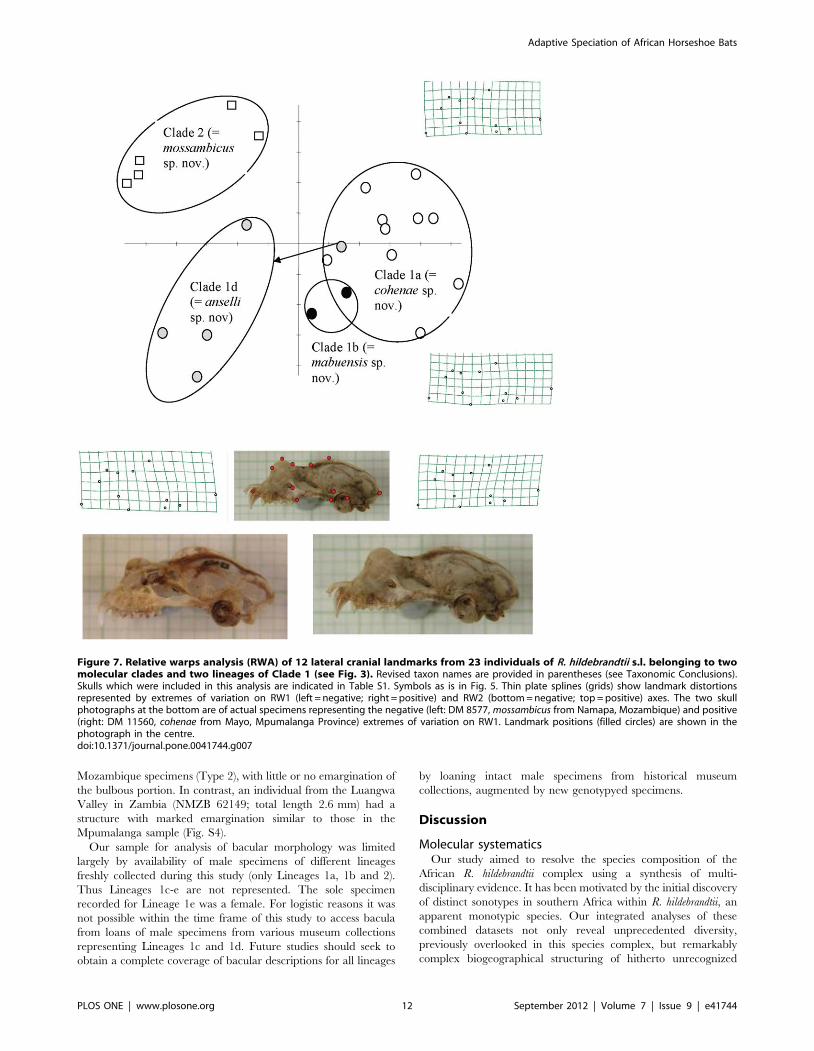
frontal depression (intermediate condition). In lateral view (Fig. 7),
the main differences (along RW1) related to the development (and
relative height) of the nasal inflation in relation to the sagittal crest.
In individuals from Pafuri and lowland Mozambique the sagittal
crest was prominently developed and clearly rises above the nasal
inflation in lateral view whilst in Sudwala, Mt Mabu and Mt Inago
the sagittal crest was noticeably less developed and did not rise
appreciably above the line of the well developed nasal inflation.
Based on RW2 in Fig. 7, Pafuri was distinguished from lowland
Mozambique in having a noticeably smaller nasal inflation in
lateral view and a generally flatter lateral profile.
Fourthly, we used PCA to analyse a large sample derived from
museum collections in relation to the above-mentioned voucher
specimens (Fig. S2). Due to significant sexual dimorphism detected
by provisional analyses, we limited our analysis to 109 males of R.
hildebrandtii s.l. and R. eloquens s.l. from seven countries throughout
the range of both species. Apart from Clade 1a (from Sudwala)
which separates from all other populations on its larger size, and
type series of R. eloquens which are mostly separated from R.
hildebrandtii s.l., all other OTUs of R. hildebrandtii overlap
considerably. There is a tendency for northern Zimbabwe
individuals to plot above those from the remainder of Zimbabwe
on PC2, and for specimens from Zambia, Malawi and East Africa
to plot within the northern Zimbabwe group. Two males from
lowland Mozambique belonging to Clade 2 are slightly larger in
size (higher PC 1 scores) and group just to the right of the northern
Zimbabwe group. Thus, morphometric analysis at this continental
scale is uninformative, because it cannot diagnose nor delimit the
clades revealed by molecular data.
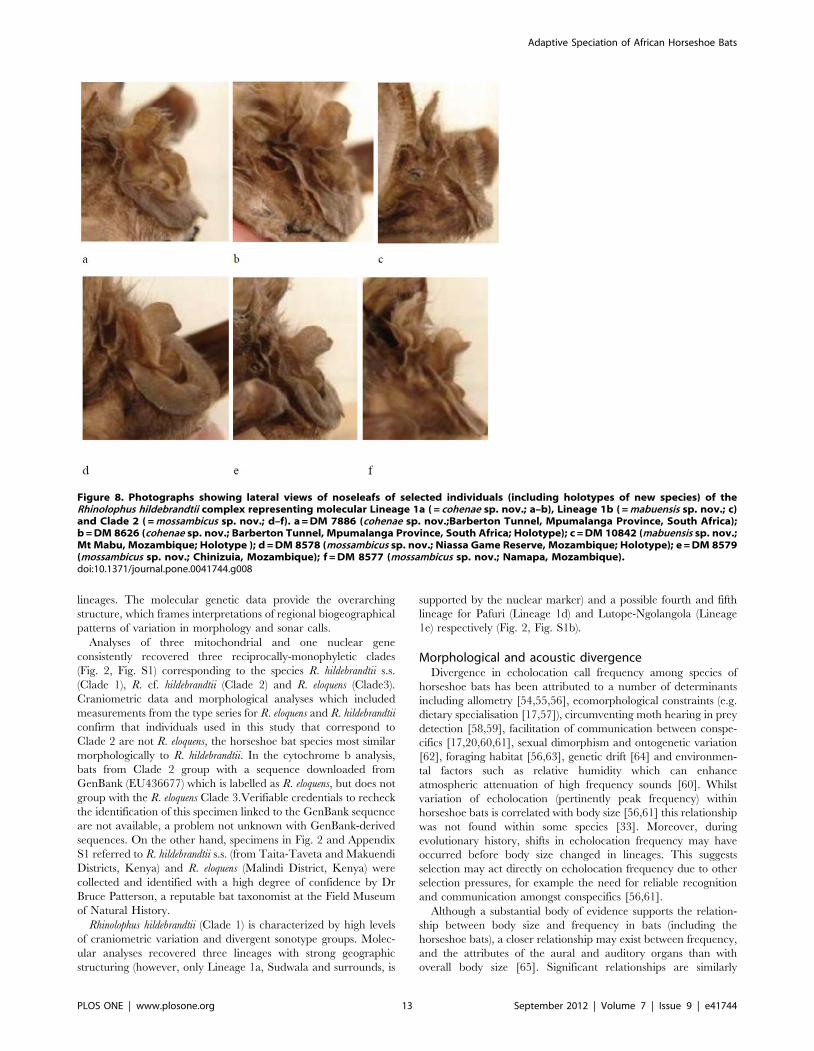
Noseleaf. Considerable variation exists in noseleaf shape as
exemplified by representative lateral photographs of six individuals
shown in Fig. 8. While the more typical low, rounded shape [12] is
apparent to some degree in Figs. 8a, b, d, e, the specimen from Mt
Mabu (Fig. 8c) had a very distinctive and atypical shape
comprising a small rounded bump. Another specimen from
Namapa, Mozambique (Fig. 8f) also had an atypical shape in
lateral profile (more high and rounded). Our sample of noseleafs is
limited to material collected from live animals during this study, so
it does not represent all lineages; however, our aim was to
demonstrate the variability of this character even within lineages,
hence its unreliability for characterising the molecular clades
recognised by this study. Such variability has also been detected
based on studies of very large series of museum specimens of this
species (FPDC, unpublished data).
Baculum. All bacula observed were symmetrical (in dorsal
and ventral views) and buccinate (trumpet-shaped) with a long,
narrow, slightly laterally-compressed shaft and a well-developed
bulbous basal portion (Fig. 9). Examination of a series of intact
bacula from eight males collected from three closely spaced roosts
from Sudwala and surrounds (Lineage 1a) revealed subtle intra-
population variation (Fig. 9a–d). Total length varied from 2.76 to
Figure 5. Canonical variates analysis (CVA) (a) of 10 cranialvariables in five groups of the Rhinolophus hildebrandtiicomplex defined by molecular analysis; and PCA (b) of fivecranial variables for sample in (a) with type series ofhildebrandtii (‘‘H*’’) and eloquens (‘‘E*’’) added. Open circle-s = Clade 1a ( = cohenae sp. nov.); closed circles = Clade 1b ( = mabuensissp. nov.); shaded circles = Clade 1d ( = smithersi sp. nov.; Pafuri); asteriskenclosed in circle = Clade 1e ( = smithersi sp. nov.; Zimbabwe); opensquares = Clade 2 (mossambicus sp. nov.; Mozambique); shadedsquares = Clade 2 (mossambicus sp. nov.; Lutope, Zimbabwe); opendiamonds = R. eloquens type series (Clade 3); crosses in circles = R.hildebrandtii type and co-type (Clade 1c).doi:10.1371/journal.pone.0041744.g005
Adaptive Speciation of African Horseshoe Bats
PLOS ONE | www.plosone.org 10 September 2012 | Volume 7 | Issue 9 | e41744
3.64 mm (n = 8; mean = 3.39 mm; s.d. = 0.28). The basal portion
was typically deeply emarginated in dorsal view (with the
exception of DM 11560 where it was not emarginated), with the
ventral view showing variable degrees of emargination from not
emarginated (DM 11620) to conspicuously emarginated (DM
11558). The degree of development of the ventral and dorsal
emarginations determined the shape in lateral view. In five bacula
with well-developed emarginations, the height of emargination
ranged from 0.72 to 0.97 mm (mean = 0.82; s.d. = 0.10), repre-
senting approximately 24% of the total length of the baculum.
Bacula from two males from molecular Clade 2 (Niassa and
Gorongoza in Mozambique) were available for comparison with
the Clade 1a sample. In size and shape they varied slightly but
significantly from those from Clade 1a; total length of the two
Clade 2 bacula varied from 3.14 to 3.30 mm. The shaft was
horizontal with no downwards inflection, cylindrical rather than
compressed laterally; the shaft tip was a rounded point rather than
slightly spatulate and the bulbous portion was only slightly
emarginated in dorsal and ventral views (Fig. 9e, f). We refer
hereafter to the bacular shape represented by Clade 1a as ‘‘Type
1’’ and the shape represented by Clade 2 as ‘‘Type 2’’. The bacula
of the Mt Mabu animal (Clade 1b) is similar in size to Type 1
(3.4 mm) but in shape clearly conforms to Type 2 in its horizontal
and cylindrical shaft, weakly-emarginated distal portion and
rounded tip (Fig. 9g).
Drawings (by FPDC) of dorsal and lateral views of bacula from
a series of 13 R. hildebrandtii s.l. males from Marondera, eastern
Zimbabwe (NMZB 62133–62139; 62141–62142; 62144–621477)
and one from Esigodini, central Zimbabwe (NMZB 80237; total
length 4.2 mm) revealed a structure most similar to lowland
Figure 6. Relative warps analysis (RWA) of 13 dorsal cranial landmarks from 22 individuals of R. hildebrandtii s.l. belonging to twomolecular clades and two lineages of Clade 1 (see Fig. 3). Revised taxon names are provided in parentheses (see Taxonomic Conclusions).Skulls which were included in this analysis are indicated in Table S1. Symbols as in Fig. 5. Thin plate splines (grids) show landmark distortionsrepresented by extremes of variation on RW1 (left = negative; right = positive) and RW2 (bottom = negative; top = positive) axes. The two skullphotographs at the bottom are of actual specimens representing the negative (left: TM 41997, smithersi from Pafuri) and positive (right: DM 11560,cohenae from Mayo, Mpumalanga Province) extremes of variation on RW1. Landmark positions (filled circles) are shown in the photograph in thecentre.doi:10.1371/journal.pone.0041744.g006
Adaptive Speciation of African Horseshoe Bats
PLOS ONE | www.plosone.org 11 September 2012 | Volume 7 | Issue 9 | e41744
Mozambique specimens (Type 2), with little or no emargination of
the bulbous portion. In contrast, an individual from the Luangwa
Valley in Zambia (NMZB 62149; total length 2.6 mm) had a
structure with marked emargination similar to those in the
Mpumalanga sample (Fig. S4).
Our sample for analysis of bacular morphology was limited
largely by availability of male specimens of different lineages
freshly collected during this study (only Lineages 1a, 1b and 2).
Thus Lineages 1c-e are not represented. The sole specimen
recorded for Lineage 1e was a female. For logistic reasons it was
not possible within the time frame of this study to access bacula
from loans of male specimens from various museum collections
representing Lineages 1c and 1d. Future studies should seek to
obtain a complete coverage of bacular descriptions for all lineages
by loaning intact male specimens from historical museum
collections, augmented by new genotypyed specimens.
Discussion
Molecular systematicsOur study aimed to resolve the species composition of the
African R. hildebrandtii complex using a synthesis of multi-
disciplinary evidence. It has been motivated by the initial discovery
of distinct sonotypes in southern Africa within R. hildebrandtii, an
apparent monotypic species. Our integrated analyses of these
combined datasets not only reveal unprecedented diversity,
previously overlooked in this species complex, but remarkably
complex biogeographical structuring of hitherto unrecognized
Figure 7. Relative warps analysis (RWA) of 12 lateral cranial landmarks from 23 individuals of R. hildebrandtii s.l. belonging to twomolecular clades and two lineages of Clade 1 (see Fig. 3). Revised taxon names are provided in parentheses (see Taxonomic Conclusions).Skulls which were included in this analysis are indicated in Table S1. Symbols as is in Fig. 5. Thin plate splines (grids) show landmark distortionsrepresented by extremes of variation on RW1 (left = negative; right = positive) and RW2 (bottom = negative; top = positive) axes. The two skullphotographs at the bottom are of actual specimens representing the negative (left: DM 8577, mossambicus from Namapa, Mozambique) and positive(right: DM 11560, cohenae from Mayo, Mpumalanga Province) extremes of variation on RW1. Landmark positions (filled circles) are shown in thephotograph in the centre.doi:10.1371/journal.pone.0041744.g007
Adaptive Speciation of African Horseshoe Bats
PLOS ONE | www.plosone.org 12 September 2012 | Volume 7 | Issue 9 | e41744
lineages. The molecular genetic data provide the overarching
structure, which frames interpretations of regional biogeographical
patterns of variation in morphology and sonar calls.
Analyses of three mitochondrial and one nuclear gene
consistently recovered three reciprocally-monophyletic clades
(Fig. 2, Fig. S1) corresponding to the species R. hildebrandtii s.s.
(Clade 1), R. cf. hildebrandtii (Clade 2) and R. eloquens (Clade3).
Craniometric data and morphological analyses which included
measurements from the type series for R. eloquens and R. hildebrandtii
confirm that individuals used in this study that correspond to
Clade 2 are not R. eloquens, the horseshoe bat species most similar
morphologically to R. hildebrandtii. In the cytochrome b analysis,
bats from Clade 2 group with a sequence downloaded from
GenBank (EU436677) which is labelled as R. eloquens, but does not
group with the R. eloquens Clade 3.Verifiable credentials to recheck
the identification of this specimen linked to the GenBank sequence
are not available, a problem not unknown with GenBank-derived
sequences. On the other hand, specimens in Fig. 2 and Appendix
S1 referred to R. hildebrandtii s.s. (from Taita-Taveta and Makuendi
Districts, Kenya) and R. eloquens (Malindi District, Kenya) were
collected and identified with a high degree of confidence by Dr
Bruce Patterson, a reputable bat taxonomist at the Field Museum
of Natural History.
Rhinolophus hildebrandtii (Clade 1) is characterized by high levels
of craniometric variation and divergent sonotype groups. Molec-
ular analyses recovered three lineages with strong geographic
structuring (however, only Lineage 1a, Sudwala and surrounds, is
supported by the nuclear marker) and a possible fourth and fifth
lineage for Pafuri (Lineage 1d) and Lutope-Ngolangola (Lineage
1e) respectively (Fig. 2, Fig. S1b).
Morphological and acoustic divergenceDivergence in echolocation call frequency among species of
horseshoe bats has been attributed to a number of determinants
including allometry [54,55,56], ecomorphological constraints (e.g.
dietary specialisation [17,57]), circumventing moth hearing in prey
detection [58,59], facilitation of communication between conspe-
cifics [17,20,60,61], sexual dimorphism and ontogenetic variation
[62], foraging habitat [56,63], genetic drift [64] and environmen-
tal factors such as relative humidity which can enhance
atmospheric attenuation of high frequency sounds [60]. Whilst
variation of echolocation (pertinently peak frequency) within
horseshoe bats is correlated with body size [56,61] this relationship
was not found within some species [33]. Moreover, during
evolutionary history, shifts in echolocation frequency may have
occurred before body size changed in lineages. This suggests
selection may act directly on echolocation frequency due to other
selection pressures, for example the need for reliable recognition
and communication amongst conspecifics [56,61].
Although a substantial body of evidence supports the relation-
ship between body size and frequency in bats (including the
horseshoe bats), a closer relationship may exist between frequency,
and the attributes of the aural and auditory organs than with
overall body size [65]. Significant relationships are similarly
Figure 8. Photographs showing lateral views of noseleafs of selected individuals (including holotypes of new species) of theRhinolophus hildebrandtii complex representing molecular Lineage 1a ( = cohenae sp. nov.; a–b), Lineage 1b ( = mabuensis sp. nov.; c)and Clade 2 ( = mossambicus sp. nov.; d–f). a = DM 7886 (cohenae sp. nov.;Barberton Tunnel, Mpumalanga Province, South Africa);b = DM 8626 (cohenae sp. nov.; Barberton Tunnel, Mpumalanga Province, South Africa; Holotype); c = DM 10842 (mabuensis sp. nov.;Mt Mabu, Mozambique; Holotype ); d = DM 8578 (mossambicus sp. nov.; Niassa Game Reserve, Mozambique; Holotype); e = DM 8579(mossambicus sp. nov.; Chinizuia, Mozambique); f = DM 8577 (mossambicus sp. nov.; Namapa, Mozambique).doi:10.1371/journal.pone.0041744.g008
Adaptive Speciation of African Horseshoe Bats
PLOS ONE | www.plosone.org 13 September 2012 | Volume 7 | Issue 9 | e41744

demonstrated between call frequency and noseleaf width [66],
skull length and associated cranial characters [33]. Here, we show
that skull size (and to a lesser extent body size as measured by
forearm length) is inversely and significantly correlated with peak
frequency within the R. hildebrandtii s.l. complex in concordance
with the allometry hypothesis (Fig. S3). Most of the variation in
peak frequency can be explained by differences in CCL (68.3%).
However, other variables including noseleaf width, forearm length,
relative humidity, and altitude may also contribute to divergence
of echolocation call frequencies. Altitude and CCL are signifi-
cantly correlated and altitude may influence CCL through
Bergman’s Rule whereby higher-altitude populations have larger
body size. Thus we cannot exclude the possibility of altitude
exerting an indirect negative influence on peak frequency through
its positive correlation with skull size.
Although character divergence could reflect the outcome of drift
in vicariant populations, drift alone does not adequately explain
the origins of these dwarf and giants in divergent Rhinolophus
clades. Morphometric analyses in this study reveal extreme
divergence in cranial size and shape among the lineages
comprising Clade 1, with giants occurring in habitat islands at
higher-elevation (.600 m) on Mts Mabu and Inago (northern
Figure 9. Dorsal (D), ventral (V) and lateral (L) view of bacula (tips on right) from four individuals (a–d) from Mpumalanga (Clade1a = cohenae sp. nov.), two (e–f) from lowland sites in Mozambique (Clade 2 = mossambicus sp. nov.) and one (g) from Mt Mabu inMozambique (Clade 1b = mabuensis sp. nov.). a = DM 11558 (Sudwala); b = DM 11620 (Barberton Tunnel; Topotype of cohenae);c = DM 11560 (Mayo); d = DM 11618 (Barberton Tunnel); e = DM 8580 (Gorongosa); f = DM 8578 (Niassa GR; Holotype ofmossambicus); g = DM 10842 (Mt Mabu; Holotype of mabuensis). Bacula of Clade 1a (cohenae sp. nov.) have spatulate tip (rounded in Clades 2(mossambicus sp. nov.) and 1b (mabuensis sp. nov.)), typically emarginated basal portion (less so in Clades 2 and 1b) and shaft laterally compressed(cylindrical in Clades 2 and 1b) and sloping downwards in lateral view (horizontal in Clades 2 and 1b).doi:10.1371/journal.pone.0041744.g009
Adaptive Speciation of African Horseshoe Bats
PLOS ONE | www.plosone.org 14 September 2012 | Volume 7 | Issue 9 | e41744

Mozambique), and the northern Drakensberg Range (Mpuma-
langa, South Africa), and dwarfs represented by the low-lying
Pafuri population in the Limpopo Valley of northeastern South
Africa (300 m) and the 46 kHz individual from the Lutope-
Ngolangola Confluence in Zimbabwe (1000 m) which occurs
sympatrically with larger-bodied 37 kHz individuals. Given the
proximity of Lutope-Ngolangola to the lower-elevation Zambezi
Valley, and the association between altitude, skull size and peak
frequency, it is possible that the small-sized 46 kHz population
(Lineage 1e) speciated within the lower-lying Zambezi Valley, and
has subsequently expanded its range marginally onto the Zambezi
Escarpment.
Biogeographical ReconstructionOur molecular dates constrain founding divergence events
within the Rhinolophidae to the Oligocene and early Miocene
(Fig. 2). The origin of these deeper lineages is consistent with
previous studies [56,67], which constrain the Old World radiation
of the Rhinolophidae into their various species-groups during the
mid-Cenozoic. It is noteworthy that the main lineages in other
chiropteran radiations are also constrained as early Miocene (e.g.
Myotis [68]; Phyllostomidae [69]). Global cooling that began in the
middle Miocene [70] increased aridity across Africa, with
subsequent contraction of forests, and the expansion of savanna
woodlands and grasslands [71,72,73,74].
Furthermore, a persuasive body of evidence testifies to late
Miocene uplift of Africa, with its pronounced focus elevating the
south-central and eastern regions [75,76,77,78,79,80]. This
represents the Plio-Pleistocene extension of the East African Rift
System across southern and central Africa [79]. Thus the
interacting determinants of uplift and climate accentuated
topographic relief across the Afromontane Archipelago through
the late Neogene [75,78]. This paleo-climatic and tectonic forcing
is invoked as the ultimate cause of allopatric speciation in these
African horseshoe bats.
The East African lineages of the R. hildebrandtii complex
diverged from the southern African bats during the late Pliocene
(ca 3.27 Mya), whilst divergence within the southern African bats
(between Lineages 1a, 1b and the Pafuri and Lutope-Ngolangola
individuals) occurred during the Pleistocene (Figure 2). Individuals
in Lineage 1b (Mts Mabu and Inago) diverged in the late Neogene
(Plio-Pleistocene), when seasonal woodland/forest habitats were
being replaced by more open woodland [81] and may have
become isolated from other low-lying populations. Similarly, the
lineage leading to 1a (Sudwala-Mpumulanga) and 1c (east African
individuals) diverged at the beginning of the Pliocene, and
populations may have been isolated due to changes in habitat.
Climate driven forest-dynamics during this time period can be
invoked to have driven species-level diversification in both forest
and savanna adapted species. Indeed, Pliocene dynamics of
African forests have been a primary driver of African bird
speciation, with significant events across the Eastern Arc
Mountains [82,83].
Studies in a chronobiogeographical context [84,85], with a
focus on east African biodiversity, include herpetofauna [86,87],
birds [82] and mammals [88,89,90,91,92] including Rhinolophus
[this study]. Congruence in their signatures support a late
Neogene pulse of diversification across the Afromontane Archi-
pelago [10,11], which further concurs with botanical evidence
[93].
Differentiation of plant and animal communities occupying
scarp and montane forests along the southeastern escarpment of
South Africa has been attributed to habitat fragmentation, during
glacial maxima, when vicariance of subtropical forests isolated
ancestral populations [94]. These palaeoclimatic dynamics also
appear to explain lineage diversification patterns in the molossid
bat, Chaerephon pumilus [95]. In addition to the tectonic forcing
mentioned above, similar paleo-environmental forcing linked to
older (Plio-Pleistocene) glacial maxima could explain cladogenesis
in these Rhinolophus. Vicariance of forest habitats into climatically
distinct ancestral refugia explains the enigmatic sister relationship
between the dwarfs (Lineages 1d, Pafuri, and 1e, Zimbabwe) and
giants (Lineage 1b, Mts Mabu and Inago, northern Mozambique).
We propose that the postulated origin of these lineages during the
late Pliocene and Early Pleistocene (Fig. 2) resulted in dwarfism in
isolated relic (island) populations trapped in lower-elevation
refugia in the Limpopo and Zambezi Valleys, and gigantism in
island populations presumably trapped on higher-elevation
escarpments and mountains. It is possible that coastal, low-lying
populations became extinct during glacial maxima. A remarkably
similar scenario invokes the upper reaches of major Malagasy
rivers serving as retreat-dispersion corridors during glacial maxima
when extinction occurs along lower reaches. This process may
explain the biogeographic evolution of centres of microendemism
in Madagascar’s fauna [96].
With respect to inter-glacials, we invoke the earlier suggestion
[94] that tropical forest species expanded their ranges southwards,
pertinently in the prolonged mesic, warmer conditions of Marine
Isotope Stage (MIS) 11 in the Mid-Pleistocene [97,98]. This
mechanism accounts for range expansion by the founding
populations of Clade 2. After divergence from their sister lineage
(represented today by R. fumigatus in East Africa during the late
Neogene), Clade 2 lineages expanded southwards and westwards
through lowland savanna habitats to establish secondary contact
with Clade 1 (as evident at Lutope-Ngolangola Gorge on the
Zambezi Escarpment). Although R. cf fumigatus (genotyped from
Senegal) represents the sister clade to Clade 2, the phylogenetic
affinities of the R. fumigatus complex remain unclear [13] and only
further research can establish affinities among representatives of
this species complex in eastern and southern Africa. We further
note that the published genotype attributed to R. fumigatus from
Tanzania [56] (Genbank Accession number for cytochrome b:
FJ185197) (WTS 1533) actually represents R. deckenii (F.P.D.
Cotterill unpublished data).
In summary, geomorphic and climatic evolution events across
the Afromontane archipelago of eastern and southern Africa has
had significant impacts on the evolution of these horseshoe bats.
We hypothesize that Clades 1, 2 and 3 diverged in the early
Miocene in response to tectonism forging the East African Rift
Valley and associated relief, and regional climate-forcing; Clade 1
(hildebrandtii s.l.) became associated with montane forests, whilst
Clade 2 (mossambicus) radiated into lower-lying savannas extending
into SE Africa. Clade 3 (eloquens) has remained restricted to the
forested highlands of the Eastern Arc and East African Rift. We
postulate that tectonism and/or climate-forcing fragmented the
widespread forests of the Miocene, isolating populations within
Clade 1.
An allometric speciation hypothesisWe suggest that speciation in these Rhinolophus involved an
interesting mechanism of allometrically linked character diver-
gence, which evolved as an effect of allopatry caused by paleo-
environmental changes. It can be argued that genetic drift was
important in vicariants (smaller effective population size), and
selection also acted on dichopatric isolates in Afromontane
habitats. Here, lower ambient temperature at higher altitudes
selected for larger body size in Afromontane populations (invoking
Bergman’s Rule) to result in pronounced divergence in skull size.
Adaptive Speciation of African Horseshoe Bats
PLOS ONE | www.plosone.org 15 September 2012 | Volume 7 | Issue 9 | e41744

Significantly, the decrease in peak frequency of sonar calls of these
Afromontane horseshoe bats constitutes allometric character
divergence – the effect of increased skull length. Thus divergence
in the CF sonar system was an indirect result of ecophysiological
adaptation. The evolutionary consequences are represented in
populations distributed across major river valleys (Zambezi and
Limpopo), where R. smithersi sp. nov. is characterized by small
body size (‘‘dwarfism’’) and higher echolocation frequency. In
contrast, populations confined at higher elevations evolved larger
size (‘‘giants’’) and lower echolocation frequencies (R. mabuensis sp.
nov. restricted to mountains in northern Mozambique, and R.
cohenae sp. nov. on the northern Great Escarpment of South
Africa).
In summary, this Allometric Speciation Hypothesis attributes
speciation in this species-complex of Rhinolophus to divergence in
CF calls associated with adaptive shifts of body size in ancestral
populations, which responded directly to Neogene habitat
vicariance across the Afromontane Archipelago. Our evidence
endorses Cracraft’s argument that speciation is an effect of lower-
level processes [99], because allometrically linked characters
(notably sonar call structure) evolved indirectly to ecophysiological
adaptation, pertinently larger body size. The mode of speciation in
these horseshoe bats, in allopatry, was incidental to organismal
adaptation [41,100], shaped by the causal cascade initiated by
palaeoenvironmental forcing. Pertinently, divergence in CF sonar-
calls in respective lineages explains how Specific-Mate-Recogni-
tion Systems (SMRS) evolved in allopatry [41,100,101]. It is
noteworthy that these SMRS have subsequently maintained
lineage cohesion where geographical ranges of lineages expanded
into sympatry.
In light of recent interest in understanding how the tempo and
mode of macroevolution has shaped speciose clades
[101,102,103,104,105], this ‘‘Allometric Speciation Hypothesis’’
explains the interplay between historical causes and effects. In
Rhinolophus, peak echolocation frequency is of focal evolutionary
relevance amongst the organismal traits comprising the CF sonar
complex, because repeated shifts in this trait can explain why
species richness has increased in this chiropteran clade. This
mechanism points to a propensity for palaeoenvironmental
vicariance to elevate speciation rates in Rhinolophus (and CF bats
in general). The Allometric Speciation Hypothesis, proposed here,
has interesting implications for the ‘harmonic-hopping’ [17]
invoked to explain CF call divergence of Rhinolophus [17,20] and
Hipposideros [18,19] across southeast Asia. Here their vicariant
distributions [mapped in 12,106] point to ultimate control by the
tectonism that radically reshaped landmasses across this region
[107,108,109].
This Allometric Speciation Hypothesis can be tested by: 1)
identifying the molecular determinants (pertinently in transcrip-
tomes) differentiating the species-specific behavioural and mor-
phological traits comprising the CF sonar system, 2) behavioural-
response experiments on CF bats, and 3) comparing the tempo
and mode of macroevolutionary trends in FM versus CF bats. The
latter should reveal higher rates of lineage diversification as an
effect of SMRS evolution in allopatry.
Taxonomic conclusionsTable 5 summarizes diagnostic traits and biogeographical
features of five lineages within hildebrandtii s.l. diagnosed in this
study. These lineages are recognised under the Evolutionary
Species Concept as recognisably distinct species, as operationa-
lized by the Phylogenetic Species Concept and additionally the
Recognition Species Concept [41,100,110,111]. We do not
advocate the Genetic Species Concept [112] which would only
recognize Clades 1, 2, and 3 (not sub-clades of Clade 1) due to
arbitrary thresholds of genetic distance (ca 5% cytochrome b
divergence). Recent studies of Afro-Malagasy molossid bats have
shown that ‘‘good’’ morphological species occur in sympatry with
congeneric species, yet exhibit cytochrome b divergences of as little
as 1.3% (Chaerephon pusillus) to 2.3% (C. leucogaster) from respective
congeners [113]. Further we reject the notion of subspecies to be
an arbitrary construct associated with the Biological Species
Concept (see [41] for criticism of the polytypic Biological Species
Concept as applied to rhinolophid taxonomy). Thus, we regard as
good species those allopatrically isolated lineages with diagnosable
differences in characters, including characters likely selected for
mate recognition and/or reproductive compatibility. Such perti-
nent characters include distinct sonar calls and bacula morphol-
ogy.
Rhinolophus cohenae new speciesurn:lsid:zoobank.org:act:D0E1C9DD-7D36-4C01-AE0D-
60AD474960A0
Cohen’s Horseshoe Bat
Fig. 4, 4, Fig. S1, Table 3, 4, Table S1, Appendix S1
Holotype. DM 8626; adult male, alcohol skin, skull and
prepared baculum (Fig. 9f), collected by L. Cohen, 28 September
2004. Skull and mandible in good condition.Type locality. Barberton, Mountainland Nature Reserve,
68 km SE Sudwala, Mpumalanga Province, South Africa, 25u 439
80S; 31u 159 580 E; elevation 690 m asl.Diagnosis. Lowest recorded peak frequency (33.0 kHz in the
holotype; mean 32.860.24 kHz, n = 7 in type series) which
immediately distinguishes this species from all others. Noseleaf
extremely wide, 13.5–16.3 mm (15.5 mm in holotype), exceeding
the previously described range (12–15) for the species [12]. Body
size and cranial size very large (Table 5; FL 66–68 mm; holotype
65.9 mm; GSL 29–30 mm; CCL 24–26 mm; holotype 29.9 mm
and 25.6 mm respectively). In body and cranial size this species
overlaps with mabuensis; however the latter species has a distinct
echolocation frequency (ca 38 kHz) and a distinct baculum (‘‘Type
2’’). Anterior upper premolar conspicuous and located within
tooth row or entirely absent. In the holotype and in three
additional specimens, the anterior premolar is prominent and
located within the toothrow. In another three specimens, the
anterior premolar is absent (and the canine and posterior premolar
in contact). In another specimen the prominent anterior premolar
is situated in the toothrow on the right side but absent on the left
side, leaving a small gap between canine and posterior premolar.
In no cases were specimens found to have small anterior premolars
situated external to the toothrow, thus distinguishing this species
Table 4. Eigenvectors for PCA of recently collected voucherspecimens of the Rhinolophus hildebrandtii complexassociated with molecular and acoustic analyses, whichincludes type specimens of R. hildebrandtii and R. eloquens(see Fig. 5a).
PC1 PC2 PC3
CCL 0.492 20.119 20.356
ZW 0.472 0.041 0.762
MW 0.445 20.486 0.162
M3M3 0.309 0.865 20.009
C1M3 0.491 20.025 20.517
doi:10.1371/journal.pone.0041744.t004
Adaptive Speciation of African Horseshoe Bats
PLOS ONE | www.plosone.org 16 September 2012 | Volume 7 | Issue 9 | e41744

from hildebrandtii s.s. [12]. The baculum (total length 3.5 mm in
holotype) has a unique shape (‘‘Type 1’’; Fig. 9) characterised by
narrow, laterally compressed and ventrally deflected shaft,
emarginated distal portion and spatulate tip, which is not found
in other species of the hildebrandtii complex in which the baculum
has been described (mossambicus and mabuensis). Genotypes of R.
cohenae are members of Clade 1a (Fig. 2).
Paratypes. DM 7886 (adult male, alcohol skin and skull,
collected by L. Cohen on 27 September 2004 from type locality),
DM11620, DM 11919, DM 11918 (adult males, alcohol skin and
skull, collected by S. Stoffberg and L. Cohen on 27 September
2009).
Description. Dorsal and ventral colour similar to R.
hildebrandtii s.s., but larger in noseleaf, skull and external
dimensions as described above. The noseleaf shows the typical
low, rounded shape of the connecting process in lateral view, in the
holotype (Fig. 8b) and in other specimens examined (e.g. Fig. 8a).
Lower lip with single mental groove. The robust skull is
represented in the mean cranial dimensions (Table 5; Fig. 5). In
lateral view the skull has a prominent rostral chamber that extends
to the same height as the sagittal crest; albeit the cranium is
distinctly elongated and flattened in lateral profile (Fig. 6). In
dorsal view the V-shaped inter-orbital basin formed by the
supraorbital ridges is very prominent, with the anterior root of the
sagittal crest displaced posteriorly (Fig. 6).
Distribution. Known only from three closely-spaced locali-
ties in Mpumalanga Province of South Africa in the vicinity of
Nelspruit.
Ecology. The type locality of Barberton is located in the
Savanna Biome [114] at 690 m, close to the border of the
Grassland Biome. Two nearby additional localities (Sudwala and
Mayo Mines) are located in the Grassland Biome (Mesic Highveld
Grassland) at altitudes between 900 and 1100 m.
Etymology. We selected the specific epithet to recognize
Lientjie Cohen who collected the type specimen. She has
contributed significantly to the conservation of bats in South
Africa, particularly in Mpumalanga Province. The species name
combines the surname Cohen and genitive singular case-ending
‘‘ae’’ indicative of feminine gender.
Specimens examined. See Table S1.
Rhinolophus mabuensis new speciesurn:lsid:zoobank.org:act:C205928E-D72C-40D5-9647-
FDC9391CB1A6
Mount Mabu Horseshoe Bat
Fig. 4, 4, Fig. S1, Table 3, 4, Table S1, Appendix S1
Holotype. DM 10842; adult male, alcohol skin, skull and
prepared baculum, collected by M. Curran and M. Kopp, 13
October 2008.
Type locality. Mt Mabu, northern Mozambique, 16u 179
20S; 36u 239 530E; elevation 1043 m asl. Diagnosis. Peak
frequency of 37.5 and 37.9 kHz for two animals captured and
released in sub-montane and montane forests at 550 m and
1000 m respectively on Mt Mabu (Curran and Kopp, personal
communication). The echolocation call frequencies of the holotype
from Mt Mabu and the paratype from Mt Inago were not
measured. Body, cranium and noseleaf very large (FL 66.1 mm in
holotype, 69.0 in paratype; GSL 29.7 mm in holotype; 30.3 mm
in paratype; CCL 25.2 mm in holotype, 25.9 mm in paratype;
NLW 15.0 mm in holotype, 15.3 mm in paratype; Table 5); size
and position of anterior upper premolar variable; either relatively
largeand situated partially within the toothrow, with gap between
canine and posterior premolar (paratype) or small and located
external to the toothrow (holotype). Much larger than all other
members of the R. hildebrandtii complex, except for R. cohenae from
which mabuensis can be distinguished by echolocation frequency
(33 kHz in R. cohenae; ca38 kHz in R. mabuensis) and baculum shape
(Type 2 in mabuensis; Type 1 in cohenae; Fig. 9). Genotypes of R.
mabuensis are members of Clade 1b (Fig. 2).
Paratype. DM 11485 (adult female, alcohol skin and skull,
collected J. Bayliss on 5 September 2009 from Mt Inago).
Description. External and noseleaf description and colour
similar to R. hildebrandtii s.s., but larger in skull and external
dimensions (see above). Lower lip with single mental groove.
Noseleaf shape variable with profile of connecting process forming
a continuous arch as typical for R. hildebrandtii [12] in the
individual from Mt Inago, but highly distinctive in the Mt Mabu
specimen, representing a small rounded bump (Fig. 8). The robust
skull is reflected in the large means recorded for most cranial
dimensions (Table 5). In lateral view the skull has a prominent
rostral chamber which extends to the same height as the relatively
weak sagittal crest. In dorsal view the V-shaped inter-orbital basin
(frontal depression [12]) formed by the supraorbital ridges is very
prominent and deep, and the anterior root of the sagittal crest is
displaced posteriorly.
Distribution. Known only from two mountains in northern
Mozambique but quite possibly extending to nearby Mts. Namuli,
Chiperone, Mulanje and the Malawi Rift.
Ecology. All known specimens were associated with montane
or sub-montane forest on the two mountains where they were
collected.
Etymology. We selected the specific epithet to draw attention
to the serious threats to the unique biodiversity isolated on the
montane forest islands in northern Mozambique – notably Mts
Mabu and Inago. None of these landforms lie within formally
protected areas, and all are undergoing major habitat degradation
and destruction from ever-increasing human activities - hunting,
fires, timber harvesting and expanding agriculture [22]. The
conservation status of this threatened biodiversity on Mts Mabu
and Inago is highlighted by R. mabuensis, alongside recently
discovered species of butterflies, crabs, snakes and chameleons
[22;115,116,117,118].
Specimens examined. See Table S1.
Rhinolophus hildebrandtii Peters, 1878Hildebrandt’s Horseshoe Bat
Fig. 4, 4, Fig. S1, Table 3, 4, Table S1, Appendix S1
Holotype. ZMB 5378 (male collected by S. Hildebrandt in
July 1877 from Ndi, Taita, Kenya). Cotype ZMB 5379 (male
collected by S. Hildebrandt in July 1877 from Ndi, Taita, Kenya).
Type locality. Ndi, Taita, Kenya, 2u 469 430S; 38u 469 180E;
elevation 390 m asl.
Diagnosis. Individuals from two localities in Kenya, includ-
ing the type locality of Taita District, had a peak frequency of
42 kHz [15]. Intermediate in body and cranial size, with the type
and co-type overlapping in cranial dimensions with members of
Clade 2 from which they are however easily distinguished
genetically based on sequences from three mitochondrial and
one nuclear gene (cytochrome b uncorrected genetic divergence
7.7–9.0%). Although there is minor overlap in individual cranial
and forearm variables (Table 5), they can be distinguished
completely by PCA of cranial dimensions from other members
of Clade1 which are distinctly smaller (Lineages 1d, 1e) or larger
(Lineages 1a, 1b) (Fig. 5b). The anterior upper premolar, when
present is moderate-sized but situated external to the toothrow
(with the canine and P4 in contact) [12]. In this respect, they are
distinguished from cohenae which have relatively conspicuous
anterior premolars within the toothrow and smithersi in which the
Adaptive Speciation of African Horseshoe Bats
PLOS ONE | www.plosone.org 17 September 2012 | Volume 7 | Issue 9 | e41744
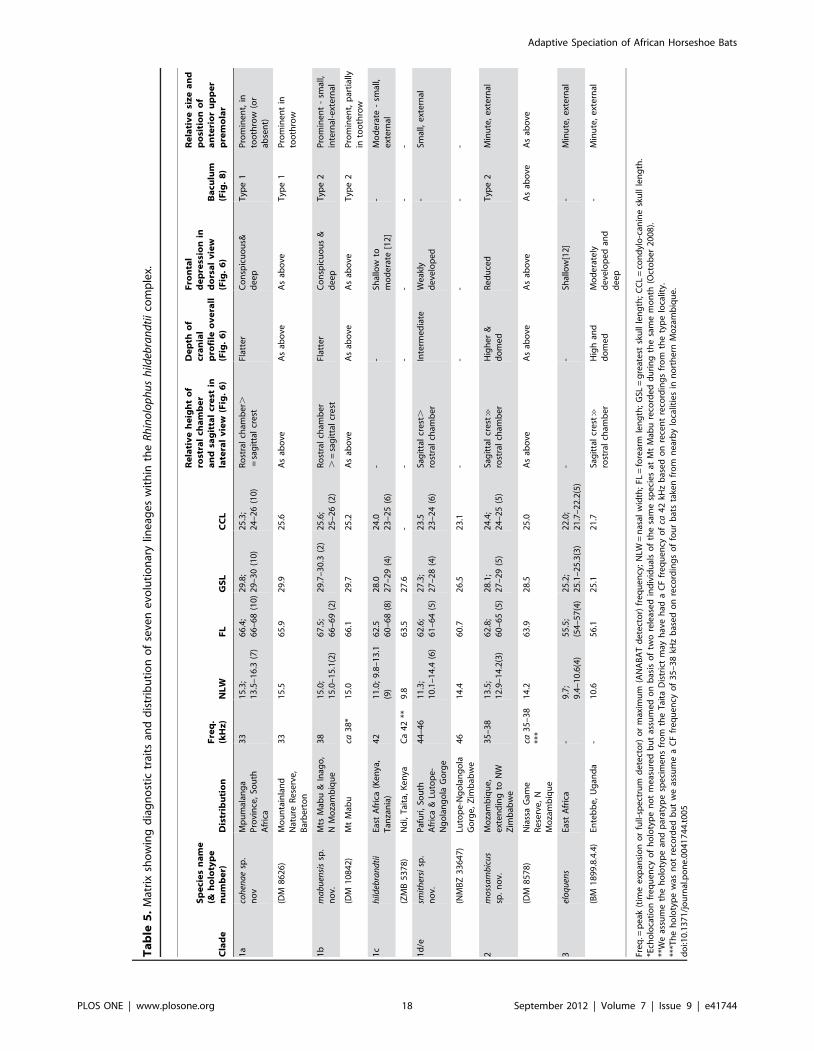
Ta
ble
5.
Mat
rix
sho
win
gd
iag
no
stic
trai
tsan
dd
istr
ibu
tio
no
fse
ven
evo
luti
on
ary
line
age
sw
ith
inth
eR
hin
olo
ph
us
hild
ebra
nd
tii
com
ple
x.
Cla
de
Sp
eci
es
na
me
(&h
olo
typ
en
um
be
r)D
istr
ibu
tio
nF
req
.(k
Hz
)N
LW
FL
GS
LC
CL
Re
lati
ve
he
igh
to
fro
stra
lch
am
be
ra
nd
sag
itta
lcr
est
inla
tera
lv
iew
(Fig
.6
)
De
pth
of
cra
nia
lp
rofi
leo
ve
rall
(Fig
.6
)
Fro
nta
ld
ep
ress
ion
ind
ors
al
vie
w(F
ig.
6)
Ba
culu
m(F
ig.
8)
Re
lati
ve
siz
ea
nd
po
siti
on
of
an
teri
or
up
pe
rp
rem
ola
r
1a
coh
ena
esp
.n
ov
Mp
um
alan
ga
Pro
vin
ce,
Sou
thA
fric
a
33
15
.3;
13
.5–
16
.3(7
)6
6.4
;6
6–
68
(10
)2
9.8
;2
9–
30
(10
)2
5.3
;2
4–
26
(10
)R
ost
ral
cham
be
r.=
sag
itta
lcr
est
Flat
ter
Co
nsp
icu
ou
s&d
ee
pT
ype
1P
rom
ine
nt,
into
oth
row
(or
abse
nt)
(DM
86
26
)M
ou
nta
inla
nd
Nat
ure
Re
serv
e,
Bar
be
rto
n
33
15
.56
5.9
29
.92
5.6
As
abo
veA
sab
ove
As
abo
veT
ype
1P
rom
ine
nt
into
oth
row
1b
ma
bu
ensi
ssp
.n
ov.
Mts
Mab
u&
Inag
o,
NM
oza
mb
iqu
e3
81
5.0
;1
5.0
–1
5.1
(2)
67
.5;
66
–6
9(2
)2
9.7
–3
0.3
(2)
25
.6;
25
–2
6(2
)R
ost
ral
cham
be
r.
=sa
git
tal
cre
stFl
atte
rC
on
spic
uo
us
&d
ee
pT
ype
2P
rom
ine
nt
-sm
all,
inte
rnal
-ext
ern
al
(DM
10
84
2)
Mt
Mab
uca
38
*1
5.0
66
.12
9.7
25
.2A
sab
ove
As
abo
veA
sab
ove
Typ
e2
Pro
min
en
t,p
arti
ally
into
oth
row
1c
hild
ebra
nd
tii
East
Afr
ica
(Ke
nya
,T
anza
nia
)4
21
1.0
;9
.8–
13
.1(9
)6
2.5
60
–6
8(8
)2
8.0
27
–2
9(4
)2
4.0
23
–2
5(6
)-
-Sh
allo
wto
mo
de
rate
[12
]-
Mo
de
rate
-sm
all,
ext
ern
al
(ZM
B5
37
8)
Nd
i,T
aita
,K
en
yaC
a4
2**
9.8
63
.52
7.6
--
--
--
1d
/esm
ith
ersi
sp.
no
v.P
afu
ri,
Sou
thA
fric
a&
Luto
pe
-N
go
lan
go
laG
org
e
44
–4
61
1.3
;1
0.1
–1
4.4
(6)
62
.6;
61
–6
4(5
)2
7.3
;2
7–
28
(4)
23
.52
3–
24
(6)
Sag
itta
lcr
est
.
rost
ral
cham
be
rIn
term
ed
iate
We
akly
de
velo
pe
d-
Smal
l,e
xte
rnal
(NM
BZ
33
64
7)
Luto
pe
-Ng
ola
ng
ola
Go
rge
,Z
imb
abw
e4
61
4.4
60
.72
6.5
23
.1-
--
--
2m
oss
am
bic
us
sp.
no
v.M
oza
mb
iqu
e,
ext
en
din
gto
NW
Zim
bab
we
35
–3
81
3.5
;1
2.9
–1
4.2
(3)
62
.8;
60
–6
5(5
)2
8.1
;2
7–
29
(5)
24
.4;
24
–2
5(5
)Sa
git
tal
cre
st&
rost
ral
cham
be
rH
igh
er
&d
om
ed
Re
du
ced
Typ
e2
Min
ute
,e
xte
rnal
(DM
85
78
)N
iass
aG
ame
Re
serv
e,
NM
oza
mb
iqu
e
ca3
5–
38
***
14
.26
3.9
28
.52
5.0
As
abo
veA
sab
ove
As
abo
veA
sab
ove
As
abo
ve
3el
oq
uen
sEa
stA
fric
a-
9.7
;9
.4–
10
.6(4
)5
5.5
;(5
4–
57
(4)
25
.2;
25
.1–
25
.3(3
)2
2.0
;2
1.7
–2
2.2
(5)
--
Shal
low
[12
]-
Min
ute
,e
xte
rnal
(BM
18
99
.8.4
.4)
Ente
bb
e,
Ug
and
a-
10
.65
6.1
25
.12
1.7
Sag
itta
lcr
est&
rost
ral
cham
be
rH
igh
and
do
me
dM
od
era
tely
de
velo
pe
dan
dd
ee
p
-M
inu
te,
ext
ern
al
Fre
q.=
pe
ak(t
ime
exp
ansi
on
or
full-
spe
ctru
md
ete
cto
r)o
rm
axim
um
(AN
AB
AT
de
tect
or)
fre
qu
en
cy;
NLW
=n
asal
wid
th;
FL=
fore
arm
len
gth
;G
SL=
gre
ate
stsk
ull
len
gth
;C
CL
=co
nd
ylo
-can
ine
sku
llle
ng
th.
*Ech
olo
cati
on
fre
qu
en
cyo
fh
olo
typ
en
ot
me
asu
red
bu
tas
sum
ed
on
bas
iso
ftw
ore
leas
ed
ind
ivid
ual
so
fth
esa
me
spe
cie
sat
Mt
Mab
ure
cord
ed
du
rin
gth
esa
me
mo
nth
(Oct
ob
er
20
08
).**
We
assu
me
the
ho
loty
pe
and
par
atyp
esp
eci
me
ns
fro
mth
eT
aita
Dis
tric
tm
ayh
ave
had
aC
Ffr
eq
ue
ncy
of
ca4
2kH
zb
ase
do
nre
cen
tre
cord
ing
sfr
om
the
typ
elo
calit
y.**
*Th
eh
olo
typ
ew
asn
ot
reco
rde
db
ut
we
assu
me
aC
Ffr
eq
ue
ncy
of
35
–3
8kH
zb
ase
do
nre
cord
ing
so
ffo
ur
bat
sta
ken
fro
mn
ear
by
loca
litie
sin
no
rth
ern
Mo
zam
biq
ue
.d
oi:1
0.1
37
1/j
ou
rnal
.po
ne
.00
41
74
4.t
00
5
Adaptive Speciation of African Horseshoe Bats
PLOS ONE | www.plosone.org 18 September 2012 | Volume 7 | Issue 9 | e41744

anterior premolar is small to minute and external to the toothrow.
Genotypes of R. hildebrandtii are members of Clade 1c (Fig. 2).
Paratype. BM 79.1.21.1, Taita (un-sexed individual collected
in 1877 by S. Hildebrandt).
Description. Follows the general description for the species
[12]; however, hildebrandtii s.s. as defined here (restricted to East
Africa) is intermediate-sized in most external and cranial
dimensions and varies from the range of values reported previously
for R. hildebrandtii s.l. [12], for example noseleaf width in nine East
African specimens examined varied from 10–14 mm, rather than
12–15 mm given by previous description [12].
Distribution. As here defined, and based only on limited
material examined from Kenya and Tanzania in the Natural
History Museum, London and Berlin Museum in this study
(n = 11; mensural data reported in Table 5), we restrict the
distribution of hildebrandtii s.s. to East Africa, whilst recognising that
northern populations in Democratic Republic of Congo, Ethiopia
and southern Sudan (now South Sudan) are possibly referable to
this species (as discussed by Koopman 1975, [13]. Moreover, given
that two individuals with peak frequency of 37 kHz from Lutope-
Ngolangola in NW Zimbabwe grouped genetically with individ-
uals from coastal Mozambique assigned to Clade 2, it seems
probable that hildebrandtii as here defined (coinciding with the
divergent Lineage 1c) does not occur in southern Africa.
Nevertheless, the taxonomic affinities of material from Zambia
and Malawi remain unclear as craniometric analysis was unable to
differentiate molecular clades and lineages at this scale (Fig. S2).
Future studies need to incorporate molecular and bacular data
from central, equatorial and northeastern Africa (particularly
Zambia, Malawi, DRC and Ethiopia) to test the species limits of
hildebrandtii. It is possible that yet more cryptic species remain to be
discovered.
Ecology. This species was recorded from montane and
submontane forests in the Usambara Mountains of the Eastern
Arc Range in Tanzania; means and ranges given for external and
cranial measurements for four individuals from this population
conform very closely to our data [119].
Rhinolophus smithersi new speciesurn:lsid:zoobank.org:act:E78B0F44-7534-4991-975A-
F176CB668DDE
Smithers’s Horseshoe Bat
Fig. 4, Fig. S1, Table 3, 4, Table S1, Appendix S1
Holotype. NMZB 33647, alcohol and cleaned skull. Collector
Number FWC 4764. Female collected 26 October 2000 by F. P.
D. Cotterill and P. J. Taylor. Skull and mandible in good
condition.
Type locality. Ngolangola Gorge at confluence with Lutope
River, Sebungwe District, Gokwe Communal Land, NW
Zimbabwe; 18u 179050S; 28u 059 000E; elevation 1000 m asl.
Diagnosis. Peak echolocation frequency at 44–46 kHz which
is considerably higher than all other members of this species-
complex (33–42 kHz). Very small-cranium (mean CCL 23.4 mm;
23.0–24.3 mm; n = 6; 23.2 mm in holotype), the holotype having
a disproportionately wide noseleaf (14 mm; 53% of skull length)
(although this is not as pronounced in the series from Pafuri, NE
South Africa; mean noseleaf width 10.7 mm; 39% of skull length),
it is immediately distinguishable from other members of the R.
hildebrandtii complex on size and peak frequency (Figs. 3; 4;
Table 5). Genotypes of R. smithersi are members of Clades 1d and
1e (Fig. 2, Fig. S1).
Paratype. NMZB 33652, male alcohol and cleaned skull,
Collector Number FWC 4769. Collected 26th October 2000 by
F.P.D. Cotterill and P.J. Taylor from Lutope-Ngolangola Gorge,
Zimbabwe.
Description. Apart from its distrinctly smaller size, conform-
ing generally to the keys and published description for R.
hildebrandtii s.l. [12], i.e. a relatively large-sized (forearm length
60.7 mm in holotype) bat with medium or large ears, wide
horseshoe (10–14 mm) covering the muzzle, sella constricted at its
proximal third, almost parallel-sided above and having long hairs,
lancet relatively long and straight-sized, lower lip with single
median groove, upper parts greyish-brown, with individual hairs
long and unicoloured, underparts same colour or very slightly
paler, skull large and heavily built. Lower lip with single mental
groove. The sagittal crest is very well developed in relation to the
nasal inflation and the rostral depression is weakly developed. The
anterior premolar is small-sized and external to the toothrow
(Table 5).
Distribution. Known from Lutope-Ngolangola Gorge south
of the Zambezi Escarpment in NW Zimbabwe and also from
Pafuri in the Limpopo Valley in the foothills of the Soutpansberg
Mountains of northern Limpopo Province, South Africa but likely
more widespread across savanna woodlands of the Limpopo and
Zambezi valleys, and their escarpments (the Gwembe horst, and
the Soutpansberg and Waterberg Mountains, respectively). Accu-
rate delimitation of this species’ range is subject to further
collecting and reappraisal of existing museum material. This
applies to papers by M.B. Fenton and co-workers based on
intensive studies of the bat fauna, which included populations of
this species complex in the Sengwa Wildlife Research Area, only
,5 km north of the type locality of R. smithersi
[120,121,122,123,124,125,126]. These all reported the largest
rhinolophid studied as R. hildebrandtii, but these data would refer to
both R. mossambicus and R. smithersi.
Ecology. Poorly known; this species occurs sympatrically with
R. mossambicus at one locality in miombo savanna on Karoo
Sandstone, dominated by trees of Brachystegia glaucescens, and
including large specimens of baobabs, Adansonia digitata; albeit
much of the landscape has been converted to cotton fields. More
diverse riparian woodland fringes the Lutope and Ngolanola rivers
as well as along the Limpopo River at Pafuri. Daylight roosts were
not located but these bats could use caves in the sandstone cliffs
and/or hollows in baobabs.
Etymology. We selected the specific epithet in recognition of
the late Reay Henry Noble Smithers (1907–1987), former Director
of the National Museums of Zimbabwe, prodigious collector and
researcher of mammals including bats, and author of important
regional texts on the mammalogy of Botswana, Zimbabwe and
Mozambique, notably his definitive monograph – The Mammals of
the Southern African Subregion subsequently updated and revised
[127]. The species name combines the surname Smithers and
genitive singular case-ending ‘‘i’’ indicative of masculine gender.
Specimens examined. See Table S1.
Rhinolophus mossambicus new speciesurn:lsid:zoobank.org:act:0D97DC39-F9CD-415E-A7AE-
4DCF70C807B4
Mozambican Horseshoe Bat
Fig. 4, 4, Fig. S1, Table 3, 4, Table S1, Appendix S1
Holotype. DM8578, male, alcohol skin, skull and baculum,
collected by A. Monadjem on 1 July 2006. Skull and mandible in
good condition.
Type locality. Niassa Game Reserve (Maputo Camp),
northern Mozambique, 12u 109560S; 37u 339 000E; elevation
489 m asl.
Adaptive Speciation of African Horseshoe Bats
PLOS ONE | www.plosone.org 19 September 2012 | Volume 7 | Issue 9 | e41744
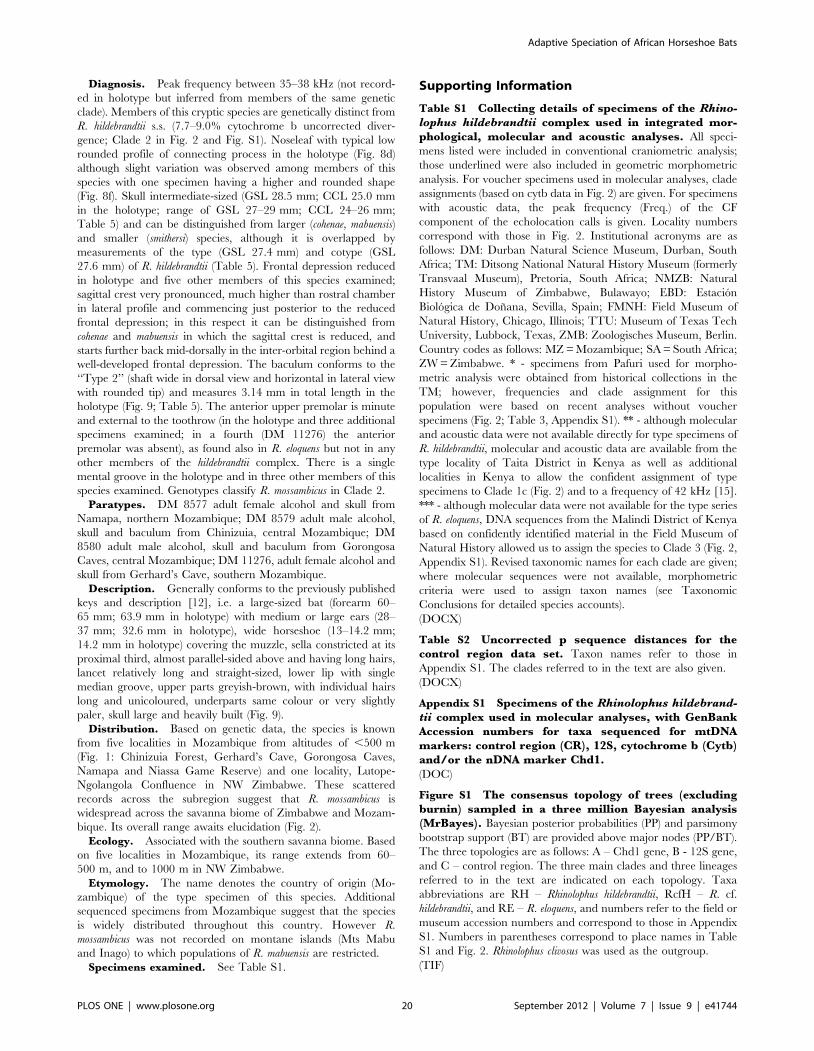
Diagnosis. Peak frequency between 35–38 kHz (not record-
ed in holotype but inferred from members of the same genetic
clade). Members of this cryptic species are genetically distinct from
R. hildebrandtii s.s. (7.7–9.0% cytochrome b uncorrected diver-
gence; Clade 2 in Fig. 2 and Fig. S1). Noseleaf with typical low
rounded profile of connecting process in the holotype (Fig. 8d)
although slight variation was observed among members of this
species with one specimen having a higher and rounded shape
(Fig. 8f). Skull intermediate-sized (GSL 28.5 mm; CCL 25.0 mm
in the holotype; range of GSL 27–29 mm; CCL 24–26 mm;
Table 5) and can be distinguished from larger (cohenae, mabuensis)
and smaller (smithersi) species, although it is overlapped by
measurements of the type (GSL 27.4 mm) and cotype (GSL
27.6 mm) of R. hildebrandtii (Table 5). Frontal depression reduced
in holotype and five other members of this species examined;
sagittal crest very pronounced, much higher than rostral chamber
in lateral profile and commencing just posterior to the reduced
frontal depression; in this respect it can be distinguished from
cohenae and mabuensis in which the sagittal crest is reduced, and
starts further back mid-dorsally in the inter-orbital region behind a
well-developed frontal depression. The baculum conforms to the
‘‘Type 2’’ (shaft wide in dorsal view and horizontal in lateral view
with rounded tip) and measures 3.14 mm in total length in the
holotype (Fig. 9; Table 5). The anterior upper premolar is minute
and external to the toothrow (in the holotype and three additional
specimens examined; in a fourth (DM 11276) the anterior
premolar was absent), as found also in R. eloquens but not in any
other members of the hildebrandtii complex. There is a single
mental groove in the holotype and in three other members of this
species examined. Genotypes classify R. mossambicus in Clade 2.
Paratypes. DM 8577 adult female alcohol and skull from
Namapa, northern Mozambique; DM 8579 adult male alcohol,
skull and baculum from Chinizuia, central Mozambique; DM
8580 adult male alcohol, skull and baculum from Gorongosa
Caves, central Mozambique; DM 11276, adult female alcohol and
skull from Gerhard’s Cave, southern Mozambique.
Description. Generally conforms to the previously published
keys and description [12], i.e. a large-sized bat (forearm 60–
65 mm; 63.9 mm in holotype) with medium or large ears (28–
37 mm; 32.6 mm in holotype), wide horseshoe (13–14.2 mm;
14.2 mm in holotype) covering the muzzle, sella constricted at its
proximal third, almost parallel-sided above and having long hairs,
lancet relatively long and straight-sized, lower lip with single
median groove, upper parts greyish-brown, with individual hairs
long and unicoloured, underparts same colour or very slightly
paler, skull large and heavily built (Fig. 9).
Distribution. Based on genetic data, the species is known
from five localities in Mozambique from altitudes of ,500 m
(Fig. 1: Chinizuia Forest, Gerhard’s Cave, Gorongosa Caves,
Namapa and Niassa Game Reserve) and one locality, Lutope-
Ngolangola Confluence in NW Zimbabwe. These scattered
records across the subregion suggest that R. mossambicus is
widespread across the savanna biome of Zimbabwe and Mozam-
bique. Its overall range awaits elucidation (Fig. 2).
Ecology. Associated with the southern savanna biome. Based
on five localities in Mozambique, its range extends from 60–
500 m, and to 1000 m in NW Zimbabwe.
Etymology. The name denotes the country of origin (Mo-
zambique) of the type specimen of this species. Additional
sequenced specimens from Mozambique suggest that the species
is widely distributed throughout this country. However R.
mossambicus was not recorded on montane islands (Mts Mabu
and Inago) to which populations of R. mabuensis are restricted.
Specimens examined. See Table S1.
Supporting Information
Table S1 Collecting details of specimens of the Rhino-lophus hildebrandtii complex used in integrated mor-phological, molecular and acoustic analyses. All speci-
mens listed were included in conventional craniometric analysis;
those underlined were also included in geometric morphometric
analysis. For voucher specimens used in molecular analyses, clade
assignments (based on cytb data in Fig. 2) are given. For specimens
with acoustic data, the peak frequency (Freq.) of the CF
component of the echolocation calls is given. Locality numbers
correspond with those in Fig. 2. Institutional acronyms are as
follows: DM: Durban Natural Science Museum, Durban, South
Africa; TM: Ditsong National Natural History Museum (formerly
Transvaal Museum), Pretoria, South Africa; NMZB: Natural
History Museum of Zimbabwe, Bulawayo; EBD: Estacion
Biologica de Donana, Sevilla, Spain; FMNH: Field Museum of
Natural History, Chicago, Illinois; TTU: Museum of Texas Tech
University, Lubbock, Texas, ZMB: Zoologisches Museum, Berlin.
Country codes as follows: MZ = Mozambique; SA = South Africa;
ZW = Zimbabwe. * - specimens from Pafuri used for morpho-
metric analysis were obtained from historical collections in the
TM; however, frequencies and clade assignment for this
population were based on recent analyses without voucher
specimens (Fig. 2; Table 3, Appendix S1). ** - although molecular
and acoustic data were not available directly for type specimens of
R. hildebrandtii, molecular and acoustic data are available from the
type locality of Taita District in Kenya as well as additional
localities in Kenya to allow the confident assignment of type
specimens to Clade 1c (Fig. 2) and to a frequency of 42 kHz [15].
*** - although molecular data were not available for the type series
of R. eloquens, DNA sequences from the Malindi District of Kenya
based on confidently identified material in the Field Museum of
Natural History allowed us to assign the species to Clade 3 (Fig. 2,
Appendix S1). Revised taxonomic names for each clade are given;
where molecular sequences were not available, morphometric
criteria were used to assign taxon names (see Taxonomic
Conclusions for detailed species accounts).
(DOCX)
Table S2 Uncorrected p sequence distances for thecontrol region data set. Taxon names refer to those in
Appendix S1. The clades referred to in the text are also given.
(DOCX)
Appendix S1 Specimens of the Rhinolophus hildebrand-tii complex used in molecular analyses, with GenBankAccession numbers for taxa sequenced for mtDNAmarkers: control region (CR), 12S, cytochrome b (Cytb)and/or the nDNA marker Chd1.
(DOC)
Figure S1 The consensus topology of trees (excludingburnin) sampled in a three million Bayesian analysis(MrBayes). Bayesian posterior probabilities (PP) and parsimony
bootstrap support (BT) are provided above major nodes (PP/BT).
The three topologies are as follows: A – Chd1 gene, B - 12S gene,
and C – control region. The three main clades and three lineages
referred to in the text are indicated on each topology. Taxa
abbreviations are RH – Rhinolophus hildebrandtii, RcfH – R. cf.
hildebrandtii, and RE – R. eloquens, and numbers refer to the field or
museum accession numbers and correspond to those in Appendix
S1. Numbers in parentheses correspond to place names in Table
S1 and Fig. 2. Rhinolophus clivosus was used as the outgroup.
(TIF)
Adaptive Speciation of African Horseshoe Bats
PLOS ONE | www.plosone.org 20 September 2012 | Volume 7 | Issue 9 | e41744

Figure S2 Canonical variates analysis of six craniomet-ric variables in ten Operational Taxonomic Units(OTUs) based on a sample of 171 adult male skulls ofR. hildebrandtii and R. eloquens. Clades and lineages
defined on molecular grounds indicated by 1a (Clade 1:
Mpumalanga Province, SA), 1c (Clade 1: Pafuri, Kruger NP,
SA) and 2a (Clade 2). Codes indicate species and OTUs as follows:
q = R. eloquens (including type series); balance of OTUs represent
R. hildebrandtii: s = southern Zimbabwe; c = central Zimbabwe;
e = eastern Zimbabwe; n = northern Zimbabwe; za = Zambia+-Malawi; ea = Kenya and Tanzania (including type and co-type
from Kenya). 95% confidence ellipses shown for each group.
(TIF)
Figure S3 Plots of peak frequency of the CF componentof echolocation calls versus condylo-canine skull length(CCL) (a) and altitude (b); and (c) means and 95%confidence limits of relative importance after 1000bootstrap replications (using ‘‘lmg’’ method in R) forten predictor variables used in complex linear model(Model 5 in text) to explain variation in CF frequency inR. hildebrandtii. Alt = altitude group (,600 m or .600 m);
CCL = condylocanine skull length; FL = forearm length; Clade = -
membership of molecular clades and subcaldes (Fig. 3);
NH = height of rostral chamber; NW = width of rostral chamber;
NL = length of skull from occiput to anterior of rostral chamber;
RH = relative humidity.
(TIF)
Figure S4 Drawings of bacula from: (a) Marondera,Zimbabwe (NMZB 62133–62139; 62141–62142; 62144–621477; except where noted otherwise, top = dorsal;bottom = lateral), Esigodeni, Zimbabwe (b; NMZB80237; total length = 4.6 mm) and Luangwa, Zambia (c;
NMZB 62149; total length = 2.6 mm). In (b) top = dorsal,
middle = lateral and bottom = ventral and (c) top = dorsal, mid-
dle = ventral and bottom = lateral.
(TIF)
Acknowledgments
Lientjie Cohen provided invaluable support with collection of samples from
Mpumalanga Province. Michael Curran and Mirjam Kopp collected one
of the specimens from Mt Mabu and kindly provided acoustic data of two
individuals from Mt Mabu – both were working under the the British
government funded Darwin Initiative project ‘Monitoring and Managing
Biodiversity Loss on South-East Africa’s Montane Ecosystems’ (Award 15/
036). This collaborative project, led by the Royal Botanic Gardens, Kew,
also included BirdLife International, the Instituto de Investigacao Agraria
de Mocambique, the Mulanje Mountain Conservation Trust, Malawi, and
the Forest Research Institute of Malawi. April Reside and Julien Cornut
assisted with the capture of Mozambican specimens. Leigh Richards
(Durban Natural Science Museum) and Teresa Kearney (Ditsong National
Natural Science Museum) provided invaluable assistance with loans of
specimens and queries about specimens. Alick Ndlovu, Kith Mkwananzi
and John Minshull enthustiastically helped with successful collecting in
Zimbabwe. MCS and SS are very grateful to Pieter Malan, Gerhard
Groenewald and the Toyota Enviro Outreach for logistical support. AM
received financial and logistic support from All Out Africa. We are grateful
to Dr J.M. Bishop for the use of unpublished cytochrome b primers.
Support from Africa Earth Observatory Network (AEON) enabled
geobiological inputs into the present paper. This is AEON Publication
No. 105.
Author Contributions
Conceived and designed the experiments: PJT SS AM JB MCS FPDC.
Performed the experiments: PJT SS AM MCS FPDC. Analyzed the data:
PJT SS. Contributed reagents/materials/analysis tools: JB SS FPDC.
Wrote the paper: PJT SS AM MCS FPDC.
References
1. Van Valen LM (1973) Pattern and the balance of nature. Evolutionary Theory
1: 31–49.
2. Lomolino MV (2005) Body size evolution in insular vertebrates: generality of
the island rule. Journal of Biogeography 32: 1683–1699.
3. Meiri S, Dayan T, Simberloff D (2006). The generality of the island rule re-
examined. Journal of Biogeography 33: 1571–1577.
4. Meiri S, Cooper N, Purvis A (2008) The island rule: made to be broken?
Proceedings of the Royal Society Series B Biological Sciences 275(1631): 141–
148.
5. Jacobs DS (1996) Morphological divergence in an insular bat, Lasiurus cinereus
semotus. Functional Ecology 10: 622–630.
6. Palmeirim JM (1991) A morphometric assessment of the systematic position of
the Nyctalus from Azores and Madeira (Mammalia: Chiroptera). Mammalia 55:
381–388.
7. McNab BK, Bonaccorso JK (2001) The metabolism of New Guinean
pteropodid bats. Journal of Comparative Physiology B 171: 201–214.
8. Juste J, Ferrandez A, Fa JE, Masefield W, Ibanez C (2007) Taxonomy of little
bent-winged bats (Miniopterus, Miniopteridae) from the African islands of Sao
Tome, Grand Comoro and Madagascar, based on mtDNA. Acta Chiropter-
ologica 9: 27–37.
9. Schmidt NM, Jensen PM (1993) Changes in mammalian body length over 175
Years—adaptations to a fragmented landscape? Conservation Ecology 7(2): 6.
[online] URL: http://www.consecol.org/vol7/iss2/art6. Accessed 2012 July 7.
10. White F (1981) The history of the Afromontane archipelago and the scientific
need for its conservation. African Journal of Ecology 19: 33–54.
11. White F (1983) The Afromontane archipelago-like regional centre of endemism
and the Afroalpine archipelago-like region of extreme floristic impoverishment.
In: The Vegetation of Africa. A descriptive memoir to accompany the
UNESCO/AETFAT/UNSO vegetation map of Africa. Natural Resources
Research No. 20. Unesco, Paris. pp 161–169.
12. Csorba G, Ujhelyip P, Thomas N (2003) Horseshoe Bats of the World
(Chiroptera: Rhinolophidae). Shropshire: Alana books.
13. Monadjem A, Taylor PJ, Cotterill FPD, Schoeman MC (2010a) Bats of
Southern and Central Africa: A Biogeographic and Taxonomic Synthesis.
Johannesburg: Wits University Press.
14. Simmons NB (2005) Order Chiroptera. In Wilson DE Reeder DM (eds.)
Mammal Species of the World: A Taxonomic and Geographic Reference (3rd
edition). Baltimore: The John Hopkins University Press, 313–529.
15. Jones G, Van Parijs SM (1993) Bimodal echolocation in pipistrelle bats: are
cryptic species present? Proceedings of the Royal Society Series B Biological
Sciences 251: 119–1258.
16. Taylor PJ, Geiselman C, Kabochi P, Agwanda B, Turner S (2005) Intraspecific
variation in the calls of some African bats (Order Chiroptera). Durban Museum
Novitates 30: 24–37.
17. Kingston T, Rossiter SJ (2004) Harmonic hopping in Wallacea’s bats. Nature
429: 654–657.
18. Kingston T, Lara MC, Jones G, Zubaid A, Kunz TH, et al. (2001) Acoustic
divergence in two cryptic Hipposideros species: a role for social selection?
Proceedings of the Royal Society Series B Biological Sciences 268: 1381–1386.
19. Thabah A, Rossiter SJ, Kingston T, Zhang S, Parsons S, et al. (2006) Genetic
divergence and echolocation call frequency in cryptic species of Hipposideros
larvatus s.l . (Chiroptera: Hipposideridae) from the Indo-Malayan region.
Biological Journal of the Linnean Society 88: 119–130.
20. Russo D, Mucedda M, Bello M, Biscardi S, Pidinchedda E, et al. (2007)
Divergent echolocation frequencies in insular rhinolophids (Chiroptera): a case
of character displacement. Journal of Biogeography 34: 2129–2138.
21. Monadjem A, Schoeman MC, Reside A, Pio DV, Stoffberg S, et al. (2010) A
recent inventory of the bats of Mozambique with documentation of seven new
species to the country. Acta Chiropterologica 12: 371–391.
22. Bayliss J, Monteiro J, Fishpool L, Congdon C, Bampton I, Bruessow C,
Matimele H, Banze A, Timberlake JR (2010) Biodiversity and Conservation of
Mount Inago, Mozambique. Report produced under Darwin Initiative Award
15/036. Mulanje Mountain Conservation Trust, Malawi. 32 pp.
23. Aplers DL, Van Vuuren BJ, Arctander T, Robinson TJ (2004) Population
genetics of the roan antelope (Hippotragus equinus) with suggestions for
conservation. Molecular Ecology 13: 1771–1784. doi: 10.1111/j.1365-
294X.2004.02204.x.
24. Palumbi S, Martin A, Romano S, McMillian WO, Stice L, et al. (1991) The
simple fool’s guide to PCR. Honolulu: University of Hawaii, 46pp.
25. Mao XG, Zhu GJ, Zhang S, Rossiter SJ (2010) Pleistocene climatic cycling
drives intra-specific diversification in the intermediate horseshoe bat (Rhinolo-
Adaptive Speciation of African Horseshoe Bats
PLOS ONE | www.plosone.org 21 September 2012 | Volume 7 | Issue 9 | e41744

phus affinis) in southern China. Molecular Ecology 19: 2754–2769. doi:10.1111/
j.1365-294X.2010.04704.x.
26. Hall TA (1999) BioEdit: a user-friendly biological sequence alignment editor
and analysis program for Windows 95/98/NT. Nucleic Acids Symposium
Series 41: 95–98.
27. Kjer KM, Swigonova Z, LaPolla JS, Broughton RE (2007) Why weight?Molecular Phylogenetics and Evolution 43: 999-1004.doi:10.1016/j.ym-
pev.2007.02.028.
28. Swofford DL (2002) PAUP* Phylogenetic Analysis Using Parsimony (*and
other methods). Version 4.0b10 for Macintosh. Sunderland, Massachusetts:
Sinauer Associates, Inc.
29. Felsenstein J (1985) Confidence limits on phylogenies: an approach using the
bootstrap. Evolution 39: 783–791.
30. Posada D (2008) jModelTest: Phylogenetic Model Averaging. MolecularBiology and Evolution 25: 1253–1256. doi:10.1093/molbev/msn083.
31. Ronquist F, Huelsenbeck JP (2003) MrBayes 3: Bayesian phylogenetic
inference under mixed models. Bioinformatics 19: 1572–1574. doi: 10.1093/
bioinformatics/btg180.
32. Drummond AJ, Rambaut A (2007) BEAST: Bayesian evolutionary analysis by
sampling trees. BMC Evolutionary Biology 7: 214.
33. Stoffberg S (2007) Molecular phylogenetics and the evolution of high-frequency
echolocation in horseshoe bats (Genus Rhinolophus). Unpublished PhD
dissertation. Cape Town: University of Cape Town.
34. Zhou Z-M, Guillen-Servent A, Lim BK, Eger JL, Wang Y-X, et al. (2009) A
new species from southwestern China in the Afro-palearctic lineage of the
horseshoe bats (Rhinolophus). Journal of Mammalogy 90: 57–73.
35. Teeling EC, Madsen O, Murphy WJ, Springer MS, O’Brien SJ (2003) Nucleargene sequences confirm ancient link between New Zealand’s short-tailed bat
and South American noctilionoid bats. Molecular Phylogenetics and Evolution
28: 308–319.
36. Eick GN, Jacobs DS, Matthee CA (2005) A nuclear DNA phylogenetic
perspective on the evolution of echolocation and historical biogeography ofextant bats (Chiroptera). Molecular Biology and Evolution 22: 1869–1886.
37. Aldridge HDJN, Rautenbach IL (1987) Morphology, echolocation and
resource partitioning in insectivorous bats. Journal of Animal Ecology 56:
763–778.
38. Schoeman MC, Jacobs DS (2008) The relative influence of competition and
prey defenses on the phenotypic structures of insectivorous bat ensembles in
southern Africa. PLoS ONE 3 (11): e3715. doi:10.1371/journal.pone.0003715.
39. Monadjem A, Reside A, Lumsden L (2007) Echolocation calls of rhinolophidand hipposiderid bats in Swaziland. South African Journal of Wildlife Research
37: 9–15.
40. Obrist MK (1995) Flexible bat echolocation: the influence of individual, habitat
and conspecifics on sonar signal design. Behavioural Ecology and Sociobiology
36: 207–219.
41. Cotterill FPD (2002) A new species of horseshoe bat (Microchiroptera:
Rhinolophidae) from south-central Africa: with comments on its affinities and
evolution, and the characterization of rhinolophid species. Journal of Zoology,
London 256: 165–179.
42. Addinsoft (2007) XLSTAT, Version 2007.5. New York: Addinsoft.
43. Rohlf FJ (2009) tpsDig version 2.14. State University of New York at Stony
Brook. Available at: http://life.bio.sunysb.edu/morph/. Accessed 2009 Dec
20.
44. Rohlf FJ (2008). tpsRelw version 1.48. State University of New York at Stony
Brook. Available: http://life.bio.sunysb.edu/morph/. Accessed 2008 Nov 19.
45. Rohlf FJ, Slice D (1990) Extensions of the Procrustes method for the optimal
superimposition of landmarks. Systematic Zoology 39: 40–59.
46. Corti M (1993) Geometric morphometrics: an extension of the revolution.
Trends in Ecology and Evolution 8: 302–303.
47. Marcus LF, Corti M (1996) Overview of the new, or geometric morphometrics.
In: Marcus LF, Corti M, Loy A, Naylor GJP, Slice DE, Eds. Advances inmorphometrics. New York: Plenum Press 1–13.
48. Rohlf FJ (1998) On applications of geometric morphometrics to studies of
ontogeny and phylogeny. Systematic Biology 47: 147–158.
49. Rohlf FJ, Marcus LF (1993) A revolution in morphometrics. Trends in Ecologyand Evolution 8: 129–132.
50. Rohlf FJ (2002) Geometric morphometrics in phylogeny. In: Macleod N, Forey
PL, eds. Morphology, shape and phylogenetics. Systematic Association Special
Volume Series 64. London: Francis & Taylor, 175–193.
51. Hill JE, Harrison DL (1987) The baculum in the Vespertilionidae (Chiroptera:
Vespertilionidae) with a systematic review, a synopsis of Pipistrellus and Eptesicus,
and the descriptions of a new genus and subgenus. Bulletin of the British
Museum (Natural History) Zoology Series 52: 225–305.
52. Lidicker WR (1968) A phylogeny of New Guinea rodent genera based on
phallic morphology. Journal of Mammalogy 49: 609–643.
53. Kearney T, Volleth M, Contrafatto G, Taylor PJ (2002) Systematic
implications of chromosome GTG-band and bacula morphology for southern
African Eptesicus and Pipistrellus and several other species of Vespertilionidae(Chiroptera: Vespertilionidae). Acta Chiropterologica 4: 55–76.
54. Jones G (1996) Does echolocation constrain the evolution of body size in bats?
Symposium of the Zoological Society London 69: 111–128.
55. Jones G (1999) Scaling of echolocation call parameters in bats. Journal ofExperimental Biology 202: 3359–3367.
56. Stoffberg S, Jacobs DS, Mackie IJ, Matthee CA (2011) Molecular phylogenetics
and historical biogeography of Rhinolophus bats. Molecular Phylogenetics and
Evolution 54: 1–9. doi:10.1016/j.ympev.2009.09.021.
57. Houston RD, Boonman AM, Jones G (2004) Do echolocation signal
parameters restrict bats’ choice of prey? In Thomas JA, Moss CF, Vater M
(eds). Echolocation in Bats and Dolphins. Chicago: University of Chicago
Press. pp 339–345.
58. Fenton MB, Fullard JH (1979) The influence of moth hearing on bat
echolocation strategies. Journal of Comparative Physiology A 132: 77–86.
59. Jones G (1992) Bats vs moths: studies on the diets of rhinolophid and
hipposiderid bats support the allotonic frequency hypothesis. In: Horaceck I,
Vohralik V (eds.) Prague Studies in Mammalogy. Prague (Czech Republic),
Charles University Press. pp. 87–92.
60. Heller KG, von Helversen O (1989) Resource partitioning of sonar frequency
bands in rhinolophoid bats. Oecologia 80: 178–186.
61. Jacobs DS, Barclay RMR, Walker MH (2007) The allometry of echolocation
call frequencies of insectivorous bats: why do some bats deviate from the
pattern? Oecologia 152: 583–594.
62. Siemers BM, Beedholm K, Dietz C, Dietz I, Ivanova T (2005) Is species
identity, sex, age or individual quality conveyed by echolocation call frequency
in European horseshoe bats? Acta Chiropterologica 7: 259–274.
63. Jones G, Barlow KE (2004) Cryptic species of echolocating bats. In Thomas JA,
Moss CF, Vater M (eds.) Echolocation in Bats and Dolphins, Chicago:
University of Chicago Press, pp. 345–349.
64. Chen S-F, Jones G, Rossiter SJ (2009) Determinants of echolocation call
frequency variation in the Formosan lesser horseshoe bat (Rhinolophus monoceros).
Proceedings of the Royal Society Series B Biological Sciences 276: 3901–3909.
65. Francis CM, Habersetzer J (1998) Interspecific and intraspecific variation in
echolocation frequency and morphology of horseshoe bats, Rhinolophus and
Hipposideros. In Kunz TH, Racey PA (eds.) Bat Biology and Conservation.
Washington DC: Smithsonian Institution Press, pp. 169–179.
66. Robinson MF (1996) A relationship between echolocation calls and noseleaf
widths in bats of the genera Rhinolophus and Hipposideros. Journal of Zoology
239:389–393.
67. Guillen Servent A, Francis CM, Ricklefs RE (2003) Phylogeny and
biogeography of the horseshoe bats. In: Csorba G, Ujhelyi P, Thomas N
(eds.) Horseshoe Bats of the World (Chiroptera: Rhinolophidae). Shropshire,
UK: Alana Books, pp. xii–xxiv.
68. Stadlmann B, Jacobs DS, Schoeman C, Ruedi M (2004) Phylogeny of African
Myotis bats (Chiroptera, Vespertilionidae) inferred from cytochrome b
sequences. Acta Chiropterologica 6: 177–192.
69. Datzmann T, von Helversen O, Mayer F (2010) Evolution of nectarivory in
phyllostomid bats (Phyllostomidae Gray, 1825, Chiroptera: Mammalia). BMC
Evolutionary Biology 10:65. doi:10.1186/1471-2148-10-165.
70. Zachos J, Pagani M, Sloan L, Thomas E, Billups K (2001) Trends, rhythms,
and aberrations in global climate 65 Ma to Present. Science 292: 686–693.
71. Janis CM (1993) Tertiary mammal evolution in the context of changing
climates, vegetation, and tectonic events. Annual Review of Ecology and
Systematics 24: 467–500.
72. deMenocal PB (2004) African climate change and faunal evolution during the
Pliocene-Pleistocene. Earth and Planetary Science Letters 220: 3–24.
73. National Research Council (2010) Understanding Climate’s Influence on
Human Evolution. National Academies Press, Washington, DC.
74. deMenocal PB (2011) Climate and human evolution. Science 331: 540–542.
doi:10.1126/science.1190683.
75. Speigel C, Kohn BP, David X, Belton DX, Gleadow AJW (2010)
Morphotectonic evolution of the central Kenya rift flanks: implications for
late Cenozoic environmental change in East Africa. Geology 35: 427–430. doi:
10.1130/G23108A.
76. Bauer FU, Glasmacher UA, Ring U, Schumann A, Nagudi B (2010) Thermal
and exhumation history of the central Rwenzori Mountains, Western Rift of
the East African Rift System, Uganda. International Journal of Earth Science
99: 1575–1597. doi:10.1007/s00531-010-0549-7.
77. Abebe T, Balestrieri ML, Bigazzi G (2010) The Central Main Ethiopian Rift is
younger than 8 Ma: confirmation through apatite fission-track thermochronol-
ogy. Terra Nova 22: 470–476. doi:10.1111/j.1365-3121.2010.00968.x
78. Partridge TC (2010) Tectonics and geomorphology of Africa during the
Phanerozoic. In: L. Werdelin L and Sanders WJ (eds), Cenozoic Mammals of
Africa. University of California Press, Berkeley, 3–26.
79. Cotterill FPD, de Wit MJ (2011) Geoecodynamics and the Kalahari
Epeirogeny: linking its genomic record, tree of life and palimpsest into a
unified narrative of landscape evolution. South African Journal of Geology 114:
489–514.
80. Goodier SAM, Cotterill FPD, O’Ryan C, Skelton PH, de Wit MJ (2011)
Cryptic diversity of African tigerfish (Genus Hydrocynus) reveals palaeogeo-
graphic signatures of linked Neogene geotectonic events. PLoS ONE 6(12):
e28775. doi:10.1371/journal.pone.0028775
81. Cerling TE, Wynn JG, Andanje SA, Bird MI, Kimutai Korir D, Levin NE,
Mace W, Macharia AN, Quade J, Remien CH (2011) Woody cover and
hominin environments in the past 6 million years. Nature 476: 51–56.
82. Fjeldsa J, Bowie RCK (2008) New perspectives on the origin and diversification
of Africa’s forest avifauna. African Journal of Ecology 46: 235–247.
Adaptive Speciation of African Horseshoe Bats
PLOS ONE | www.plosone.org 22 September 2012 | Volume 7 | Issue 9 | e41744

83. Voelker G, Outlaw RK, Bowie RCK (2010) Pliocene forest dynamics as a
primary driver of African bird speciation. Global Ecology and Biogeography19: 111–121.
84. Hunn CA, Upchurch P (2001) The importance of time/space in diagnosing the
causality of phylogenetic events: towards a ‘‘Chronobiogeographical’’ para-digm? Systematic Biology 50: 391–407.
85. Crisp MD, Trewick SA, Cook LG (2011) Hypothesis testing in biogeography.Trends in Ecology and Evolution 26: 66–72.
86. Blackburn DC, Measey GJ (2009) Dispersal to or from an African biodiversity
hotspot? Molecular Ecology 18: 1904–1915. doi: 10.1111/j.1365-294X.2009.04156.x.
87. Lawson L (2010) The discordance of diversification: evolution in the tropical-montane frogs of the Eastern Arc Mountains of Tanzania. Molecular Ecology
19: 4046–4060. doi: 10.1111/j.1365-294X.2010.04788.x.88. Nicolas V, Querouil S, Verheyen E, Verheyen W, Mboumba JF, Dillen M,
Colyn M (2006) Mitochondrial phylogeny of African wood mice, genus
Hylomyscus (Rodentia, Muridae): implications for their taxonomy andbiogeography. Molecular Phylogenetics and Evolution 38: 779–793.
89. Taylor PJ, Maree S, van Sandwyk J, Kerbis Peterhans JC, Stanley WT,Verheyen E, Kaliba P, Verheyen W, Kaleme P, Bennett NC (2009) Speciation
mirrors geomorphology and palaeoclimatic history in African laminate-toothed
rats (Muridae: Otomyini) of the Otomys denti and O. lacustris species-complexes inthe ‘‘Montane Circle’’ of East Africa. Biological Journal of the Linnean Society
96: 913–941.90. Taylor PJ, Lavrenchenko LA, Carleton MD, Verheyen E, Bennett N,
Oosthuisen C, Maree S (2011) Specific limits and emerging diversity patternsin east African populations of laminate-toothed rats, genus Otomys (Muridae:
Murinae: Otomyini): revision of the Otomys typus complex. Zootaxa 3024: 1–66.
91. Stanley WT, Olson LE (2005) Phylogeny, phylogeography, and geographicvariation of Sylvisorex howelli (Soricidae), an endemic shrew of the Eastern Arc
Mountains, Tanzania. Journal of Zoology, London 266: 341–354.92. Stanley WT, Esselstyn JA, (2010) Biogeography and diversity among montane
populations of mouse shrew (Soricidae: Myosorex) in Tanzania. Biological
Journal of the Linnean Society 100: 669–680.93. Galley G, Bytebier B, Bellstedt DU, Linder HP (2007) The Cape element in the
Afrotemperate flora: from Cape to Cairo? Proceedings of the Royal SocietySeries B Biological Sciences 2007 274, 535–543. doi: 10.1098/rspb.2006.0046.
94. Lawes MJ, Eeley HAC, Findlay NJ, Forbes D (2007) Resilient forest faunalcommunities in South Africa: a legacy of palaeoclimatic change and extinction
filtering? Journal of Biogeography 34: 1246–1264.
95. Taylor PJ, Lamb J, Reddy D, Naidoo T, Ratrimomanarivo F, et al. (2009)Cryptic lineages of little free-tailed bats, Chaerephon pumilus (Chiroptera:
Molossidae) from southern Africa and the western Indian Ocean islands.African Zoology 277: 317–332.
96. Wilme L, Goodman SM, Ganzhorn JU (2006) Biogeographic evolution of
Madagascar’s microendemic biota. Science 312: 1063–1065.97. Droxler AW, Poore RZ, Burckle LH (eds.) (2003) Earth’s Climate and Orbital
Eccentricity: the Marine Isotope Stage 11 Question. Geophysical Monograph.American Geophysical Union, Washington, DC, 240 pp.
98. Rohling EJ, Braun K, Grant K, Kucera M, Roberts AP, Siddall M, TrommerG (2010) Comparison between Holocene and Marine Isotope Stage-11 sea-
level histories. Earth and Planetary Science Letters 291: 97–105.
99. Cracraft J (1989) Species as entities of biological theory. In M . Ruse (Ed.).What the Philosophy of Biology is - Essays for David Hull. Kluwer, The
Netherlands. pp 33–54.100. Cotterill FPD (2003) Species concepts and the real diversity of antelopes. In
Plowman A (Ed.) Proceedings of the Ecology and Conservation of Mini-
antelope: An International Symposium on Duiker and Dwarf Antelope inAfrica. Filander Verlag: Fuurth. pp. 59–118.
101. Paterson HEH (1985) The recognition concept of species. In Species andspeciation. Transvaal Museum Monograph No. 4. pp. 21–29. Vrba E S (ed.).
Pretoria: Transvaal Museum.
102. Grantham TA (1995) Hierarchical approaches to macroevolution - recent workon species selection and the effect hypothesis. Annual Reviews of Ecology and
Systematics 26:301–21103. Prendini L (2001) Substratum specialization and speciation in southern African
scorpions: the effect hypothesis revisited. In: Fet V, Selden PA (eds.) Scorpions
2001: In Memoriam Gary A. Polis. The British Arachnological Society,
Burnham Beeches, UK. pp. 113–138.104. Rabosky DL, McCune AR (2010) Reinventing species selection with molecular
phylogenies. Trends in Ecology and Evolution 25: 68–74.
105. Eastman JM, Storfer A (2011) Correlations of life-history and distributional-range variation with salamander diversification rates: evidence for species
selection. Systematic Biology 60: 503–518. doi:10.1093/sysbio/syr020.106. Bates PJ, Harrison D. (1997) Bats of the Indian Subcontinent. Sevenoaks,
Harrison Zoological Museum.
107. Hall R (2002) Cenozoic geological and plate tectonic evolution of SE Asia andthe SW Pacific: computer-based reconstructions, model and animations.
Journal of Asian Earth Sciences 20: 353–431.108. Quigley MC, Clark D Sandiford M (2010) Tectonic geomorphology of
Australia. In P Bishop P, Pillans B (eds.) Australian Landscapes. GeologicalSociety, London, Special Publications 346: 243–265. doi:10.1144/SP346.13.
109. Baldwin SL, Fitzgerald PG, Webb LE (2012) Tectonics of the New Guinea
Region. Annual Review of Earth and Planetary Sciences 40: 495–520doi:10.1146/annurev-earth-040809-152540.
110. Groves CP (2001) Primate Taxonomy. Smithsonian Institution Press,Washington DC, 350pp.
111. Groves CP, Grubb P (2011) Ungulate Taxonomy. John Hopkins University
Press, Baltimore. 317 pp.112. Baker RJ, Bradley RD (2006) Speciation in mammals and the genetic species
concept. Journal of Mammalogy 87: 643–662.113. Goodman SM, Buccas W, Naidoo T, Ratrimomanarivo F, Taylor PJ, Lamb J
(2010) Patterns of morphological and genetic variation in western IndianOcean members of the Chaerephon ‘pumilus’ complex (Chiroptera: Molossidae),
with the description of a new species from Madagascar. Zootaxa 2551: 1–36.
114. Mucina L, Rutherford MC (2006) The Vegetation of South Africa, Lesothoand Swaziland. Strelitzia 19, South African National Biodiversity Institute,
Pretoria.115. Branch WR, Bayliss J (2009) A new species of Atheris (Serpentes: Viperidae)
from northern Mozambique. Zootaxa 2113: 41–54.
116. Branch WR, Tolley KA (2010) A new species of chameleon (Sauria:Chamaeleonidae: Nadzikambia) from Mount Mabu, central Mozambique.
African Journal of Herpetology 59: 157–172.117. Congdon C, Collins S, Bayliss J (2010) Butterflies of south east Africa’s
mountains (Mozambique and Malawi). Metamorphosis 21: 45–107.118. Daniels S, Bayliss J (2011). Unexplored refugia of biodiversity: mountainous
regions in Mozambique and Malawi yield two novel freshwater crab species
(Potamonautidae: Potamonautes). Zoological Journal of the Linnean Society 164:498–509.
119. Stanley WT, Goodman SM (2011) Small mammal inventories in the east andwest Usambara and south Pare Mountains, Tanzania. 3. Chiroptera. Fieldiana
Life and Earth Sciences 4: 34–52.
120. Fenton MB (1985) The feeding behaviour of insectivorous bats: echolocation,foraging strategies, and resource partitioning. Transvaal Museum Bulletin 21:
5–16.121. Fenton MB, Thomas DW (1980) Dry-season overlap in activity patterns,
habitat use, and prey selection by sympatric African insectivorous bats.Biotropica 12: 81–90.
122. Fenton MB, Boyle NGH, Harrison TM, Oxley DJ (1977) Activity patterns,
habitat use, and prey selection by some African insectivorous bats. Biotropica 9:73–85.
123. Fenton MB, Bell GP (1981) Recognition of species of insectivorous bats by theirecholocation calls. Journal of Mammalogy 62: 233–243.
124. Fenton MB (1975) Observations on the biology of some Rhodesian bats,
including a key to the Chiroptera of Rhodesia. Life Sciences Contributions tothe Royal Ontario Museum 104.
125. Hartley DJ, Suthers RA, (1988) The acoustics of the vocal tract in thehorseshoe bat, Rhinolophus hildebrandti. Journal of the Acoustical Society of
America 84: 1201–1213.
126. Suthers RA, Hartley DJ, Wenstrup JJ (1988) The acoustic role of trachealchambers and nasal cavities in the production of sonar pulses by the horseshoe
bat, Rhinolophus hildebrandti. Journal of Comparative Physiology A 162: 799–813.127. Smithers RHN (1983) The Mammals of the Southern African Subregion.
Pretoria: University of Pretoria Press. 736 p.
Adaptive Speciation of African Horseshoe Bats
PLOS ONE | www.plosone.org 23 September 2012 | Volume 7 | Issue 9 | e41744