four model validation - shodhgangashodhganga.inflibnet.ac.in/bitstream/10603/8964/9/09_chapter...
TRANSCRIPT

12
136
CHAPTER
FOUR SITE SELECTION FOR
MODEL VALIDATION
4.0 INTRODUCTION
God commanded: “Let the water below the sky come together in one place, so that the
land will appear” and it was done. He named the land “Earth”, and the water, which
comes together, He named “Sea”. And God was pleased with what He saw….. (Genesis
1:9,10).[61]
Unfortunately, God probably would not be pleased if He looks at the current status of
the seas. Rivers have become universal sewers that carry away the waste of people and
the seas have become ultimate sink for these wastes. For many years, it was believed
that the oceans are immense and theoretically capable of diluting all waste inputs into
undetectable levels. But in reality, it is not so because these waste loads are not
uniformly spread over the oceans. Rather, they are almost invariable concentrated in
the coastal waters.
The coastal waters, estuaries, backwaters, lagoons and mangroves serve as breeding
ground for many special and have rich in species diversity representing 32 animal phyla.
Of these, 15 have no representative in land. The coastal problems due to destructive
oil spills, marine organisms contaminated by heavy metals, pesticides, pathogenic
organisms, massive algal blooms caused by nutrients present sewage discharged into

12
137
marine waters, unsightly beaches caused by solid waste and petroleum materials
washed up on the shore, are wide spread in many countries. Even the high seas face
the threat of pollution through crude oil and hazardous chemicals. Fortunately, many
of the incidents are short duration and have localized effect. Unfortunately, we are
not aware that what the long-term efforts of them may be. We may be permanently
despoiling our most essential natural asset.[61]
Oil pollution of the Sea attracts great public attention because it is visible and most
people encounter it. Most of the oil spills occurred is mainly due to negligent attitude
of shipping lines and the accidents may become very spectacular. About 5 million
tonnes of petroleum hydrocarbons reach the world seas every year. About 40% of
Crude oil[61] from the major production areas is transported in the routes of Indian
Ocean, Arabian Sea and Bay of Bengal. Petroleum hydrocarbons are introduced in the
marine environment by the variety of pathways including natural seepage from the sea
bed, tanker accidents, tanker ballast discharges, oil-well blowout and leaks, land run-
off, refineries, sewage effluents, disposal of spent lubricants, motor boat activity and
fall out of air born hydrocarbons.
India has an EEZ (Exclusive Economic Zone) of 2.04 million sq km out of its coastline
of 7516 km and out of its one billion[13] population, nearly 25% live in the coastal areas.
[13, 14] Many highly populated & industrialized cities, like Mumbai, Chennai, Kolkata,
Cochin, Visakhapattnam, are located along/ near the coastal areas. There are 11 major
ports & a number of minor ports handling shipping to various degrees of intensity. The
coastline of the main land falls under the divisions of 9 States & 2 Union Territories.
The coastline of islands belongs to Andaman, Nicobar & Lakshadweep (Luccadive) group
of islands. The details of its population, area, etc. are given in table-4.1. Along the
Indian coastline, the brackish water areas including marshes, backwaters, mangroves,
inter- & sub-tidal, measures about 1 416 300 hectares. These areas act as feeding &
nursery grounds for a variety of commercially important fishes, prawns & crabs, and
media for inland transportation, fishing, etc.[14]
12
138
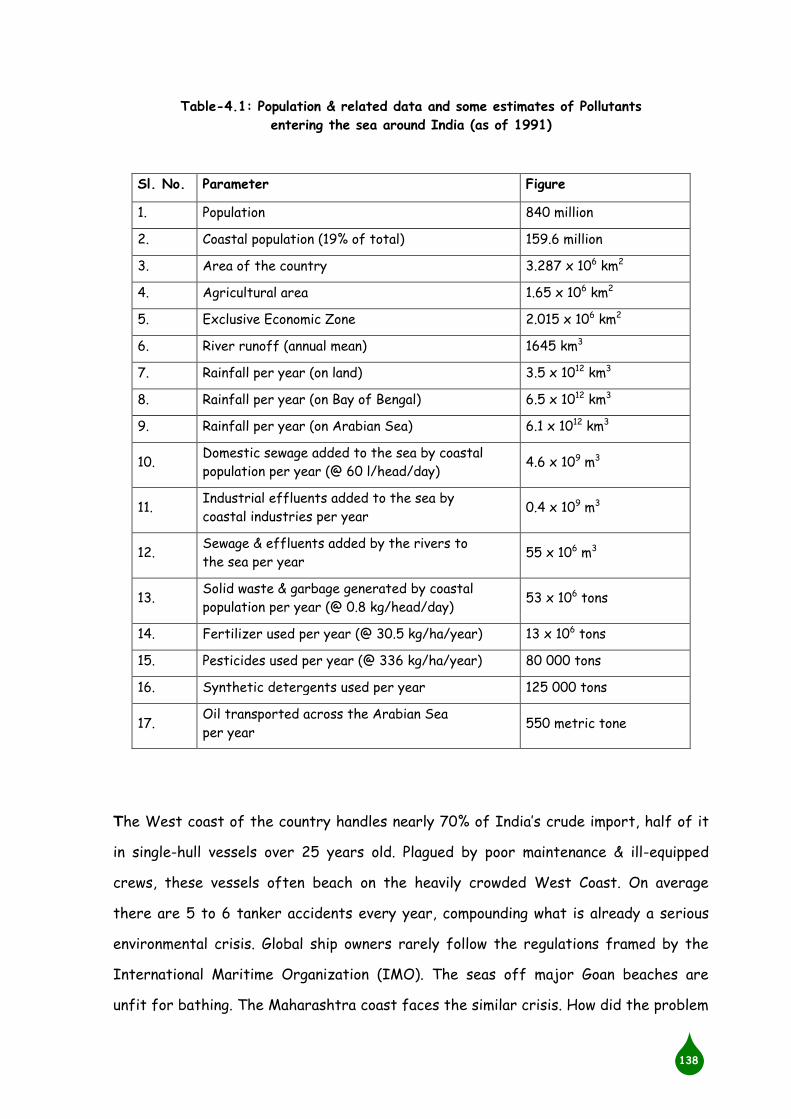
Table-4.1: Population & related data and some estimates of Pollutants
entering the sea around India (as of 1991)
Sl. No. Parameter Figure
1. Population 840 million
2. Coastal population (19% of total) 159.6 million
3. Area of the country 3.287 x 10⁶ km2
4. Agricultural area 1.65 x 10⁶ km2
5. Exclusive Economic Zone 2.015 x 10⁶ km2
6. River runoff (annual mean) 1645 km3
7. Rainfall per year (on land) 3.5 x 10¹² km3
8. Rainfall per year (on Bay of Bengal) 6.5 x 10¹² km3
9. Rainfall per year (on Arabian Sea) 6.1 x 10¹² km3
10.
Domestic sewage added to the sea by coastal
population per year (@ 60 l/head/day) 4.6 x 10⁹ m3
11.
Industrial effluents added to the sea by
coastal industries per year 0.4 x 10⁹ m3
12.
Sewage & effluents added by the rivers to
the sea per year 55 x 106 m3
13.
Solid waste & garbage generated by coastal
population per year (@ 0.8 kg/head/day) 53 x 106 tons
14. Fertilizer used per year (@ 30.5 kg/ha/year) 13 x 106 tons
15. Pesticides used per year (@ 336 kg/ha/year) 80 000 tons
16. Synthetic detergents used per year 125 000 tons
17.
Oil transported across the Arabian Sea
per year 550 metric tone
The West coast of the country handles nearly 70% of India’s crude import, half of it
in single-hull vessels over 25 years old. Plagued by poor maintenance & ill-equipped
crews, these vessels often beach on the heavily crowded West Coast. On average
there are 5 to 6 tanker accidents every year, compounding what is already a serious
environmental crisis. Global ship owners rarely follow the regulations framed by the
International Maritime Organization (IMO). The seas off major Goan beaches are
unfit for bathing. The Maharashtra coast faces the similar crisis. How did the problem
12
139
get aggravated? “The region’s proximity to West Asia and large movement of oil
tankers on the route have aggravated the crisis”, remarks Sudhir Mulji, Director of
the Great Eastern Shipping.[15]
Indian Maritime Institute president, K. Chidambaram, feels governments of coastal
states should take a lesson from the recent incident of the fully laden 31 068 DWT
tanker Castor, which suffered damages in the Mediterranean Sea en route Lagos,
Nigeria. “Immediately after the accident, the American certifying agency withdrew all
certificates from the company so as to prevent a recurrence. Indian states must also
enforce international laws with an iron hand”, says Chidambaram. Till that happens,
environmental tensions on the western coast are set to escalate.[15]
The Indian Ocean, north of the Equator, comprising of the Arabian Sea, the Bay of
Bengal, the Andaman & Luccadive Seas, in addition to the equatorial region, comes
under the monsoon gyre. However, the hydrographical & hydrochemical characteristics
are widely different in different parts of this gyre itself owing to the diverse
meteorological & geographical factors characteristic of each area.
The Arabian Sea is bordered on the northern, eastern & western sides by the
landmasses of Asia & Africa. A 50m deep sill at the Hormuz Strait connects it to the
Gulf through the Gulf of Oman. Similarly, a 125 m deep sill at the Strait of Bab-el-
Mandab separates the Red Sea from the Arabian Sea through the Gulf of Aden. The
Arabian Sea is an area of negative water balance where evaporation exceeds
precipitation and runoff. The excess of evaporation over precipitation is maximum (100
– 150 cm) off the Arabian coast and decreases steadily towards the southeast. A
slight excess of precipitation over evaporation (<20 cm) occurs annually off the
southwest coast of India. The high rate of evaporation results in the formation of
several high-salinity water masses. The Arabian Sea high-salinity water, formed in the
northwestern Arabian Sea, flows southward and can be traced as a tongue of high-
salinity within the surface layer. The high-salinity water in the Gulf, characterized by

12
140
a sigma value of 26.6, flows through the Hormuz Strait & the Gulf of Oman into the
Arabian Sea and maintains the density level at about 300 m depth. This water-mass
flows south, mostly east of 63˚E longitude, and loses its characteristics in the
southern Arabian Sea. The Red Sea water enters the Arabian Sea through the Strait
of Bab-el-Mandab & the Gulf of Aden along sigma 27.2 at the surface. This water-mass
is generally confined to south of about 17˚N latitude.[14]
Occasionally, the sub-surface high-salinity water-masses originating in the Gulf & the
Red Sea form a thick layer, which is vertically of almost uniform salinity, although the
individual layers can still be recognized as weak salinity maxims. The whole-layer is
called the North Indian high-salinity intermediate water. The deep & bottom waters
are of circumpolar origin, probably transported by a deep western boundary current
through a chain of basins. They are called the North Indian Deep Water & North
Indian Bottom Water.
Surface circulation in the Arabian Sea undergoes biannual reversal associated with the
southwest (SW) & northeast (NE) monsoons. The NE monsoon is weak in this region,
but the SW monsoon is very intense. Strong winds blowing with the Somali and the
Arabian coasts to the left cause intense upwelling off these coasts during the SW
monsoon period. Moderate upwelling also occurs off the southwest coast of India,
partly due to the cyclonic motion in the neighborhood of the Maldives & the
Luccadive.[14]
In contrast to the Arabian Sea, the Bay of Bengal is a region of positive water balance.
The average annual excess of precipitation is of the order of 70cm. The total annual
river runoff in the Bay of Bengal has been estimated to be about 2000 km3. The high
excess of precipitation over evaporation and the massive river runoff result in low
surface salinities, especially in the northern Bay of Bengal. The salinity, lower at any
level in the Bay of Bengal as compared to the Arabian Sea, increase steeply within the
thermocline / pycnocline and a weak salinity maximum may be observed at a depth of

12
141
about 500 m. The salinity thereafter decreases monotonously with depth. The SW
monsoon current probably carries the North Indian high salinity intermediate water
from the Arabian Sea and fills the Bay of Bengal at intermediate depths, resulting in
the salinity maximum. The deep water is of circumpolar origin probably derived from
the Central Indian basin.[14]
As in the Arabian Sea, the surface circulation in the Bay of Bengal changes its the
monsoon cycle. The NE monsoon is much more intense here as compared to the Arabian
Sea. Induced by favorable currents & winds, moderate upwelling occurs along the coast
of India during SW monsoon, even though the runoff from the rivers may partially
compensate for the offshore movement of surface waters.
4.1 SITE SELECTION
The coastal waters from Kanyakumari to Bangladesh border unto a distance of about
25km from the shoreline along the pre-determined transects was monitored. These
transects were selected on the basis of (a) location of industries, (b) Ecologically
Sensitive areas, and (c) location of urban establishments, and (d) based on earlier
baseline survey. Accordingly, 78 locations have been selected and the details of these
locations are given below:[14]
Gujarat: Kandla, Poshitra, Vadinar, Okha*, Dwarks, Porbandar*, Verabal*,
Hazira.
Diu, Daman,
Maharashtra: Trombay*, Bassein*, Mahim*, Thane*, Bombay Harbour*,
Verrova*, Ulhas creek*, Murud, Thai, Ratnagiri, Reddy.
Goa: Mandovi, Zuari, Marmagao*.
Karnataka: Karwar, Honawar, Calicut, Ponnani, Kochi*, Alleppey, Kayamkulam,
Paravur, Quilon*, Veli*.

12
142
Tamil Nadu: Kanyakumari, Koodankulam, Arumuganeri*, Tuticorin*, Vaiparu
estuary, Gundaru estuary, Mandapam (Palk Strait), Mandapam
(Gulf of Mannar), Uchipulli, Thondi, Nagapattinam, Cuddalore*,
Cooum*, Madras Harbour*, Ennore*.
Pondicherry: Pondicherry*, Karaikal, Yanam (Gautam-Godavari).
Andhra Pradesh: Krishnapatnam, Nizampatnam, Machilipatnam, Kakinada Bay*,
Visakhapattnam Harbour, Visakhapattnam Steel Plant,
Kalingapatnam.
Orissa: Dhamra, Gopalpur*, Paradip*, Puri*, Konark, Chandipur.
West Bengal: Saptamukhi, Digha, Sandheads*, Diamond Harbour, Holiday
Island, Dalhousie Point, Sunderbans, Indo-Bangladesh Border*.
Andaman &
Nicobar Islands: Port Blair
Lakshadweep: Kavaratti.*
It has been estimated that the annual transport of Oil through marine routes is about
1.3 billion tons of which nearly 579 million tons of oil is shipped from the Gulf
countries alone. The main routes are across the Arabian Sea. Studies on the floating
petroleum residues along the tanker routes in the Indian Ocean has revealed that
fairly high concentration of residues could be seen at times. In the Arabian Sea it was
1.52 mg/m2. The oil tanker route in the Arabian Sea during 1981 showed 12.7 mg/m2.
Similarly, in the North Atlantic Ocean it ranged from 0.02 to 0.64 mg/m2. In the
northwestern Pacific it ranged from 0.12 to 13.0 mg/m2. This clearly indicates that the
tanker routes in the northern Indian Ocean region are as polluted as other routes
(Qasim, 1991). It has also been estimated that about 35% of total oil transported
across the Arabian Sea goes through the Bay of Bengal route and 1.0% of the total
input ends up as floating tar. The amount of oil on the seas around India is estimated
to be about 0.36% of the flow and the residence time of tar in the northern Indian
Ocean ranges from 33 to 38 days (Qasim, 1991). The concentrations of petroleum
* Intensively monitored as an area of concern/ definite source of pollution
12
143
hydrocarbons observed in the coastal waters of India during 1996 to 2000 varied
between not detectable to 116.20μg/l, which are well within the prescribed limits for
coastal water quality.[2, 49]
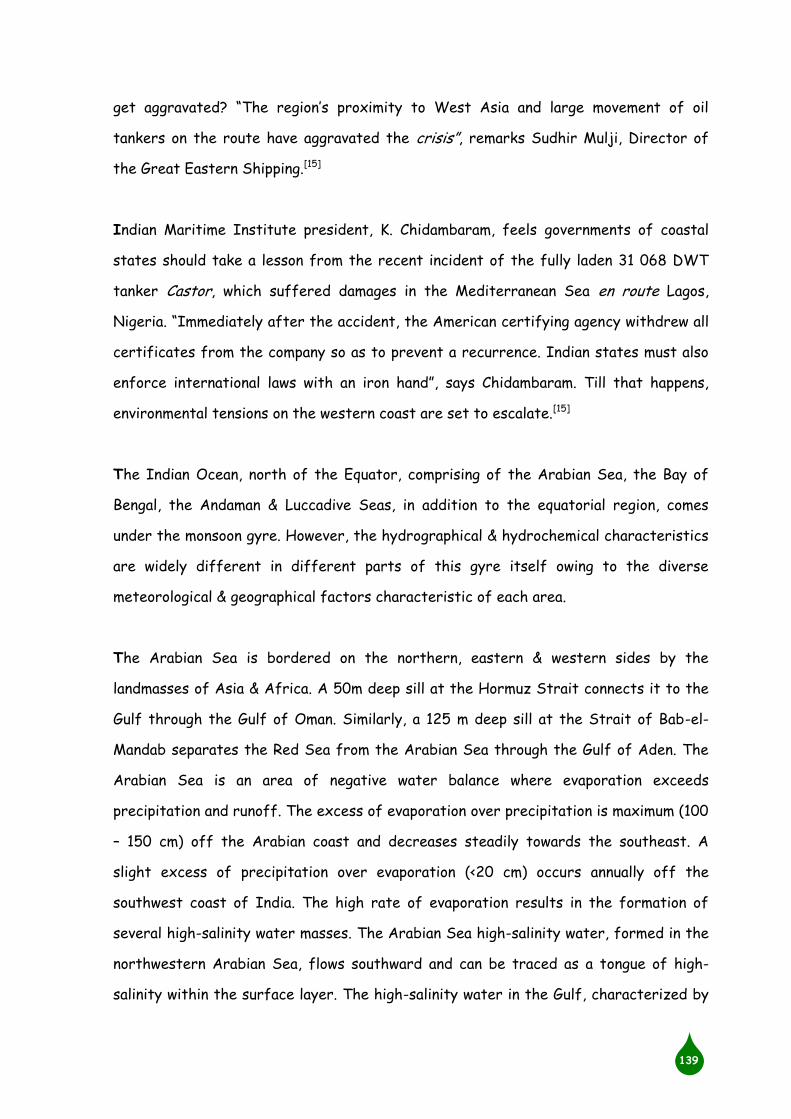
The World’s proved reserve of oil at the end of 1999 was 140400 million tonnes, out of
which 65.4% come from Middle East countries, while India’s contribution is only 0.5%.
This indicates the strong hold of Middle East countries in the World of oil sector. Now
on examination of the decadal trend of global oil production (table-4.2), i.e., from 1989
to 1999 it is seen that there is a gradual increase in production. The world oil
production in 1989 was 3096.30 million tones, which has increased to 3533.10 million
tones in 1998, while the production has declined by 2.3%, i.e. the production has
touched 3452.20 million tones in 1999. Further it was seen that the major contributor
to the world oil production is the Middle East countries, accounting 25.6% in 1989 to
31.0% in 1998. In 1991 it has reduced to 30.5%. On the other hand, India’s
contribution is around 1.0% throughout the decade, ranging between 29 & 37 million
tones.[49]
Table-4.2: Trend of world Oil production, shares of Middle East & India
during 1989 – 99 (million tones/ Year)
Year 1989 1990 1991 1992 1993 1994 1995 1996 1997 1998 1999
Total World
production 3096.3 3164.1 3151.9 3184.1 3184.2 3225.2 3272.0 3370.9 3468.5 3533.1 3452.2
Middle East
countries 792.2 846.8 835.9 909.6 46.8 960.8 970.8 994.8 1037.1 1096.2 1052.0
India’s
contribution 35.0 34.8 33.1 30.2 29.0 33.2 37.1 36.2 37.1 36.4 36.2
12
144
0
200
400
600
800
1000
1200
1400
1600
1800
2000
197
0
197
2
197
4
197
6
197
8
198
0
198
2
198
4
198
6
198
8
Worldwide trade movement Share of Middle East countries
0
500
1000
1500
2000
2500
1989
1990
1991
1992
1993
1994
1995
1996
1997
1998
1999
Year
Qua
ntity in
million
ton
nes
Worldwide trade movement Share of Middle East countries
A.
Year
Qua
ntity in
million
ton
nes
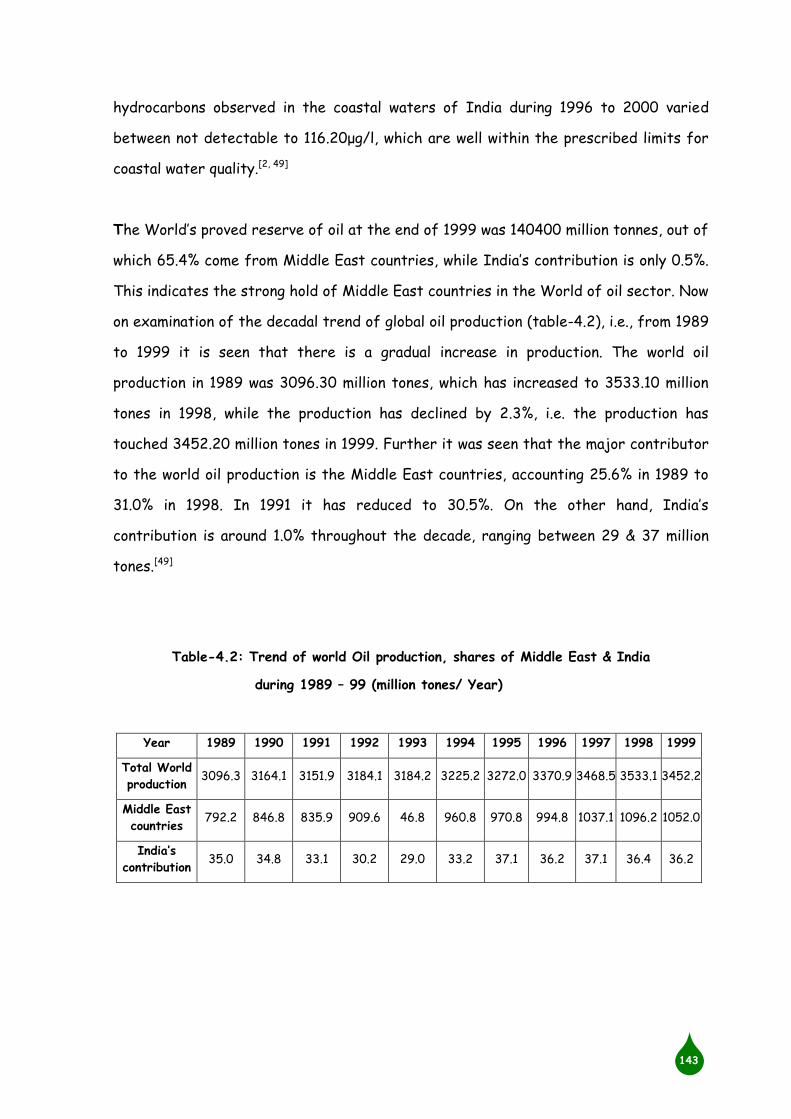
Figure-4.1: Decadal trend of worldwide trade movement of oil and the
share of Middle East countries (Million tonnes) – A. from
1970 to 1989 & B. from 1989 to 1999
B.

12
145
The worldwide trade movement of Oil & the share of Middle East countries from 1970
to 1999 are depicted in figure-4.1. The trade movement of oil from Middle East
constitute about 45% of the total movement out of which almost 95% is transported
through marine environment via two main oil tanker routes leading to various
destinations throughout the World as shown in figures-2.2 & 2.3. The decadal global
growth of oil trade movement is 30.5% while from Middle East countries it is 29%. As
mentioned earlier, the major oil tanker routes originating from Gulf countries and
passes through Arabian Sea. One of the main international tanker routes passes
through India’s Exclusive Economic Zone that is close to Luccadive Islands in the
Arabian Sea, adjoining peninsular India, round Sri Lanka across the Bay of Bengal close
proximity to Andaman & Nicobar Islands. While the other route is through the
Mozambique Channel round South Africa to Europe & America. From the figure-4.1 it is
clear that, the Global transport reached a peak in 1979 (1572 metric ton) after which
it was on the decline till 1983 (1100 metric ton), a reduction of one-third. Middle East
transport also showed a similar trend. However, the global as well as Middle East
transport increased considerably from 1985 onwards. On average 40 super tankers
pass through Indian waters daily. This is followed by increasing oil exploration and
development of oil transfer facilities in this region makes the Indian Ocean more
vulnerable to oil pollution. Besides, Indian ports & harbors both on the west & east
coasts handle about 3810 tankers carrying about 84 million tonnes of petroleum/ oil/
lubricant (POL) every year. Followings are the major oil fields/ Ports from where
Crude is imported in India:[49, 62, 63]
1. Knarg Island Terminal, Iran.
2. Adnoc Terminal, Abu Dhabi
3. Basra Terminal, Iraq
4. Al-Fateh/ Yan Bu Terminal, Saudi Arabia
5. SNP Singapore Port
6. Rotterdam, Netherlands

12
146
7. Shetland Oil Field, UK
8. Black Sea Port, Russia
9. National Oil Terminal, Mexico
10. Qua-Iboe Port Terminal, Nigeria
11. Libyan Oil Terminal, Alexandria
In view of the growing oil demand of Indian economy and considering other geo-
political factors, tankage cover of the Indian Oil security is required to be
significantly enlarged. Presently, demand cover of only 40 days is available. A total of
nearly 25-30 million K1 additional tankage cover has been planned to be built-up during
the coming 10 years. It will create a demand cover of additional 45 days over the
present facilities, especially for the states of Himachal Pradesh, Punjab, Jammu &
Kashmir and the North-Eastern States. At the same time, the infrastructure facilities
for handling import/ export of oil & gas product at the Indian sea ports need to be
reinforced and expanded. At present, the port facilities for handling crude oil &
petroleum products are available in the ports at Kandla, Vadinar, Mumbai, Cochin,
Tuticorin, Chennai, Vizag, and Paradip & Haldia. The facilities at the new ports are in
the process development. These ports are at Hazira, Nhava Sheva, Ennore, Kakinada
and a few other minor ports, like Cambay (for Reliance Industries Ltd.). The fig-4.1
depicts all the oil handling ports in India. IOCL utilizes various port locations in the
country for handling POL. The locations are as follows:
Southern Region: Mangalore, Cochin, Tuticorin, Chennai & Vishakhapatnam.
Western Region: Vasco, Mumbai, Kandla, Okha & Vadinar.
Eastern Region: Haldia, Paradip, Port Blair & Calcutta.
Certain port locations, like Kakinada & Pondicherry, are under development. IOC –
Marketing has more than one location at certain ports, such as Mumbai, Chennai &
Calcutta.[64, 65]

12
147
Oil Industry in India is poised for rapid growth to meet the ever-growing demand for
petroleum products. As per the estimated projection, the demand will be well above
100 MMTPA by the end of Ninth Five Year Plan. With limited indigenous crude
production, dependence on imported crudes & to some extent on products will be on
the increase. The total quantum of oil produced from the offshore Wells of Oil &
Natural Gas Corporation (ONGC), India along the western coast of India is
approximately 30 million tones per year. This oil is transported mainly through the
pipelines & the oil tankers. Besides approximately 30 million tones of crude oil
imported to India from foreign countries as mentioned above, is being handled at
major ports is about 50 million tonnes per year at present and is likely to increase in
near future. Tankers & Ships carry this crude oil with a total number exceeding 1600
per year. In addition, offshore oil exploration & production activities, transfer
operations of oil at SBM stations, as well as in lightering operation & during bunkering
operations in the major ports, also cause spillage of oil, particularly during accidents.
Therefore, oil enters into the Indian Ocean predominantly through operational/
intentional discharges, oil well blowouts, and accidental spillages from offshore
activities and natural seepage from the seabed. Also, the character of a coastal area is
the function of the existing coastal materials and the dynamic processes acting upon
those materials, which in turn influence the oil spilled in the coastal areas as well as
the oil reaching the coastal areas from offshore spills.
Now, oil traffic at different ports will increase substantially. Total traffic of crude &
POL, including for power production, is anticipated to reach a level of around 190
mmtpa during 2001-02 at Kandla, Vadinar, Mumbai, JNPT, Goa, Mangalore, Cochin,
Tuticorin, Chennai, Vizag, Paradip, Haldia & Calcutta ports. Maximum traffic is
envisaged at Kandla & Vadinar at the Gulf of Kutch (around 82 mmtpa together),
followed by Mumbai with a load of around 25 mmtpa. Mangalore, Cochin, Chennai, Vizag,
Paradip & Haldia are expected to handle individually traffic in the range of 10-16

12
148
mmtpa by 2001-02. Goa & Calcutta each will be handling around 2 mmtpa and at
Tuticorin, it will be 0.5 mmtpa.[49, 62, 65]
Therefore, in view of the above facts & figures and with the objective as stated in
section-3.2 in consideration, the present research work has been undertaken to
validate the result obtained from the developed numerical model with the available oil
spill data used in Environment Impact Analysis (EIA) study for Vadinar Port (figure-
4.2) in the Gulf of Kutch in the Western Coast of the country. This site has been
chosen for the study as because:[15, 22]
[Source: Sengupta & Deshmukh, “Coastal &
: VADINAR Marine Environment of Gujarat”]
Figure-4.2: Location Map of Vadinar
12
149
(a) The west coast handles nearly 70% of India’s crude import, half of it in single-
hull vessels. There are 5 to 6 accidents every year. Global ship owners rarely
follow regulations framed by the International Maritime Organization (IMO).
The seas off major Goa beaches are unfit for bathing. The Maharashtra coast
also faces a similar crisis.
(b) Indian Maritime Institute President, K. Chidambaram feels that, governments
of coastal states should take a lesson from the recent incident of the fully
laden 31068 DWT tanker Castor, which suffered damages in the Mediterranean
Sea en route Lagos, Nigeria. “Immediately after the accident, the American
certifying Agency withdrew all certificates from the company so as to prevent
a recurrence. Indian states must also enforce international laws with an iron
hand”, says Chidambaram. Until that happens, environmental tensions on the
western coast are set to escalate.
(c) Out of the various sites in India, Gulf of Kutch has the maximum tidal ranges
of around 11 meters and annual average of around 6 meters, wherein, Vadinar is
one of the largest oil handling port having two Single Point Mooring (SPM)
Platforms popularly called Single Buoy Mooring (SBM) as shown in figure-4.3.
Vadinar port is handling more than 25 mmtpa crude oil cargo in large VLCC
tankers (imported as well as indigenous) for meeting the highest crude
processing capacity of the three Refineries in the country.
4.2 AN OVERVIEW OF THE SITE SELECTED
4.2.1 BRIEF REPORT ON GULF OF KUTCH
4.2.1.0 DESCRIPTION OF AREA

12
150
The Gulf of Kutch in the state of Gujarat of the Country, which occupies an area of
7300 sq km, abounds in marine wealth and with its diversified flora & fauna of coral as
well as mangrove ecosystems is considered one of the richest biotic habitats along the
west coast of India. This high density and diversity of life demands special attention &
measures for preventing degradation of the Gulf several areas of which are protected
under the Marine National Park & the Marine Sanctuary (MNP&MS).[66]
Figure-4.3: A typical SBM with connected submarine Pipelines
The actual fairway in the outer Gulf is obstructed by the presence of several shoals.
The high tidal influx covers the lying areas of about 1500 sq. km. comprising a network
of creeks and alluvial marshy tidal flats in the interior regions. The creek system
consists of 3 main creeks: Nakti, Kandla, & Hansthal and the Little Gulf of Kutch
12
151
interconnecting through several major & minor creeks. All along the coast a few rivers
drain into the Gulf and they carry only a small quantity of fresh-water except during
monsoon. They are broad valleys and the riverbeds are mostly composed of coarse sand
& gravel.
The topography of the outer Gulf is more ragged as compared to the inner Gulf. The
southern shore has numerous islands & inlets covered with mangroves & surrounded by
coastal reefs. The northern shore is predominantly sandy or muddy confronted by
numerous shoals.[21]
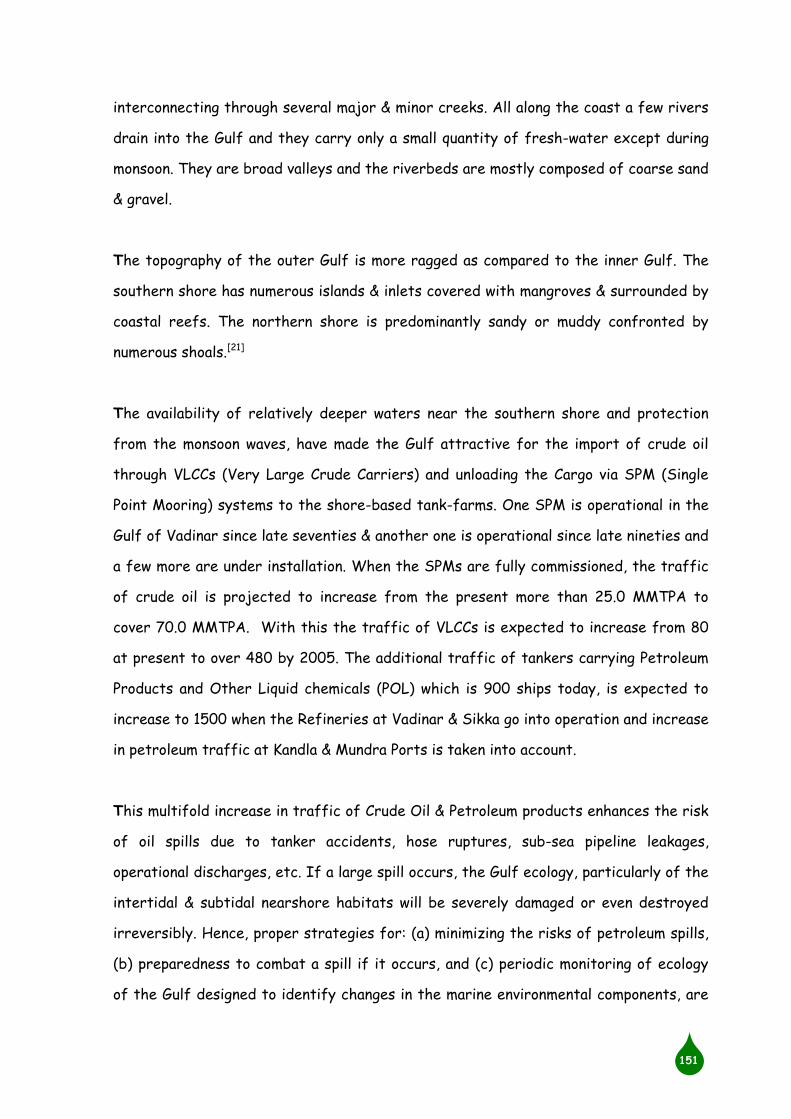
The availability of relatively deeper waters near the southern shore and protection
from the monsoon waves, have made the Gulf attractive for the import of crude oil
through VLCCs (Very Large Crude Carriers) and unloading the Cargo via SPM (Single
Point Mooring) systems to the shore-based tank-farms. One SPM is operational in the
Gulf of Vadinar since late seventies & another one is operational since late nineties and
a few more are under installation. When the SPMs are fully commissioned, the traffic
of crude oil is projected to increase from the present more than 25.0 MMTPA to
cover 70.0 MMTPA. With this the traffic of VLCCs is expected to increase from 80
at present to over 480 by 2005. The additional traffic of tankers carrying Petroleum
Products and Other Liquid chemicals (POL) which is 900 ships today, is expected to
increase to 1500 when the Refineries at Vadinar & Sikka go into operation and increase
in petroleum traffic at Kandla & Mundra Ports is taken into account.
This multifold increase in traffic of Crude Oil & Petroleum products enhances the risk
of oil spills due to tanker accidents, hose ruptures, sub-sea pipeline leakages,
operational discharges, etc. If a large spill occurs, the Gulf ecology, particularly of the
intertidal & subtidal nearshore habitats will be severely damaged or even destroyed
irreversibly. Hence, proper strategies for: (a) minimizing the risks of petroleum spills,
(b) preparedness to combat a spill if it occurs, and (c) periodic monitoring of ecology
of the Gulf designed to identify changes in the marine environmental components, are

12
152
necessary for efficient management of the Gulf environment. A comprehensive study
for predicting the oil slick spreading and behavior of a probable spill based on reliable
long-term field data is necessary for effective combating and to identify areas to be
selectively protected in the event of an oil spill.[10, 66]
4.2.1.1 GEOMORPHOLOGY
The ecology of offshore Kutch basin is an extension of inland Kutch basin, which forms
a part of the foreland shelf of Indus-Baluchistan geosynclines. A thick sequence of
Jurassic-cretaceous (about 2400 m) and a complete tertiary sequence (about 700 m)
separated by about 600 m Decan trap. Volcanoes are exposed in the Southwestern
part of Kutch, peninsula adjoining offshore basin. This basin is separated from the
Bombay offshore basin by a prominent arch of the level of Eocene & Miocene
sediments. The difference between the Bombay offshore basin and the Kutch basin
lies in the absence of Mesozoic rocks in the former. While the presence in the latter
which are not only present, but also quite wide & thick.
A number of prominent shoals (Ranwara, Lushington, Gunur, Samiyan), which are
present in the Gulf, could have resulted from the resistant rock capping on
topographic high-remnants from an earlier phase of terrestrial erosion or the
structural highs in the bedrock or combination of both.
Several major geomorphic features are identified in the Gulf. The prominent among
these is an elongated ENE-ESW depression with very steep slopes and very rough to
rugged surface extending from the entrance to the Ranwara shoal. West of the Kutch
peninsula, the depth gradually increases to 40 m at the Kori Great Bank in Arabian Sea,
130 km away from the coast. The seabed is mostly sandy & muddy. Depth ranges from
20 m at the head to 60 m at the mouth of the Gulf of Kutch. The topography is very
irregular at the mouth and central part of the Gulf with pinnacles and scraps ranging in
height from 6m to 32m. These scraps are considered to have formed due to tectonic
instability during quaternary sea-level fluctuations, later accentuated by tidal scour.
12
153
In addition to these, other prominent geomorphic features observed are extensive
eroded terraces with relatively flat floor, dormal smooth surfaces and sharp pinnacles
of 10 m to 25 m height.
Decan Traps and older Jurassic formations are exposed in the interior Saurashtra and
Kutch areas. Tertiary rocks are exposed between the older interior formations and
Pliocene formations, namely Dwarka beds, which are exposed in certain portions along
the western & northern Saurashtra coasts. On the low energy southern side of the
Gulf wide tidal flats with patches of corals occurring 2-7m above in the inter-tidal &
sub-tidal zones are present. The origin is considered to be due to the coastal uplift.
Incidentally, the Gulf & the surrounding region are highly active seismically with a
number of recorded earthquakes. Due to great earthquakes of 1789, the Indus River
then traversing the delta, changed its course and found its way to the sea at the
western extremity of Kutch and brought sudden depression of a large portion of the
Rann north of Lakhpat and caused elevation of Allah Bund.[21, 37, 67]
4.2.1.2 HYDRODYNAMICS
Tides in the Gulf are of mixed, semi-diurnal with large diurnal inequality and varying
amplitude, dominating all along the Gujarat coast. The tidal front enters the Gulf from
westerly direction and due to the shallow inner regions & narrowing cross-section, the
tidal amplitude increases as the front approaches the inner Gulf. The mean-high water
spring increases from 3.04 m at Kori Creek to 5.64 m at Mundra and to the maximum
of 7.31 m at Navalkhi – gradually decreasing to 3.47 m at Okha (Table-4.3). As the
tidal front advances through the Gulf, the high tide is first felt at Okha, then at
Vadinar, Sikka, Kandla & Navalkhi in that order. The phase-lag between Okha & Kandla
is 2 hrs to 3 hrs 45 minute while between Okha & Navalkhi it is 3 hrs to 3 hrs 20
minute. Due to high tidal ranges, vast stretches of mud flats and coastal low lands,
which get submerged during high tide, are fully exposed during low tide.[21, 67]

12
154
The currents that are strong in all seasons, are largely tide induced, influenced by
wind & thermal gradients. The currents are bimodal with two prominent directions –
one during flood tide and the other during ebb tide. These directions depend on the
local bathometry & general topography of the area. Around the mouth region the
currents are moderate with speeds of 75 cm/s to 125 cm/s. The speed increases
considerably in the mid-Gulf to 200 cm/s to 250 cm/s. The speeds of around 100 cm/s
occur off Vadinar with northeasterly flood direction and southwesterly direction
during ebb. Strong currents normally occur during mid tide, i.e. 2 hrs. to 3 hrs before
& after low tide & high tide. The speeds however, decrease considerably near-shore &
in creeks and tidal inlets. Out of the various sites in India, Gulf of Kutch has the
maximum tidal ranges of 11 m & annual average of around 6 m.[21, 22]
Table-4.3: Tidal Elevation (m) in the Gulf
Station MLWS MLWN MSL MHWN MHWS
Okha +0.41 +1.20 +2.04 2.96 +3.47
Sikka +0.71 +0.71 +3.04 +4.35 +5.38
Kandla +0.78 +1.81 +3.88 +5.71 +6.66
Navalkhi +0.78 +2.14 +4.15 +6.16 +7.31
MLWS = Mean Low-Water Spring
MSL = Mean Sea Level
MHWS = Mean High-Water Spring
MLWN = Mean Low-Water Neap
MHWN = Mean High-Water Neap
4.2.1.3 WATER QUALITY
Water balance in the Gulf of Kutch is negative with evaporation being the dominant
control over the sum of rainfall & river runoff. Residence/ turnover time varies from 8
to 51 days decreasing upstream. The prevalent tidal oscillations cannot flush out the
gulfs completely leaving behind parcels of perennially undulating water, whose
residence time will continuously increase with increasing number of oscillations. Such
residual tidal effects will control the environmental impact of all the pollutants. The
12
155
prograding sediments of river Indus regulate sediment movement in the Gulf of Kutch.
These accumulate only on the northern shores. Movement of the southern shores is
hindered by the dynamic tidal barrier existing in between.[21]
The quality of water of the Gulf in general is assessed on the basis of investigations
undertaken between 1985 & 1994 by NIO (National Institute of Oceanography), Goa.
Temperature in the Gulf varies in accordance with the air temperature are
considerably smoothened, as expected. The inner Gulf in general, has marginally lower
temperature (20.2 – 27.8C)[21] under the influence of local air temperature as
compared with the outer Gulf. The water temperature in the outer Gulf generally
varies between 23C & 29C with occasional maxima of around 30C at inshore areas.
Shallow depths, medium to high tidal amplitudes, moderately strong tidal currents with
associated turbulence create a perennially homogenous one-layer water mass all along
the Gujarat coast. The Gulf receives negligible freshwater inflow during dry season.
Thus, the evaporation exceeds precipitation leading to salinities higher than the
typical seawater salinity especially, during the pre-monsoon & post-monsoon periods.
The inner Gulf in particular, sustains high salinities & values exceeding 39 ppt are quite
common off Kandla & Navalkhi. Salinities as high as 50 ppt have been recorded in some
creeks of the Little Gulf of Kutch under the influence of monsoon runoff; the impact
of this decrease in the Gulf proper is small. In general, high salinity (35 – 40 ppt), high
dissolved oxygen (5 – 8 mg/l), fairly low nutrient concentrations (PO4-P: 0.7 – 1.5
µmol/l; NO3-N: 0.8 – 7.0 µmol/l); low BOD5 values (<3 mg/l) lend a near-pristine water
quality to the Gulf of Kutch. On the west Saurashtra coast water quality is good,
except near discharge points of wastewater. The swift tidal movements keep the
water well mixed vertically & there is no stratification. The pH of seawater
throughout the Gulf is fairly constant & seldom deviates from the typical range (7.9 –
8.3) for seawater. Toxic trace metals concentrations are high at or in the vicinity of
such discharge points. Sabarmati is the worst polluted of all the Indian rivers where
industrial effluents comprises of 4.6% of its annual runoff. Because of the cumulative

12
156
effect of all these dissolved oxygen in this Gulf often decreases to 0.4 – 0.5 mg/l at
bottom associated with high nutrients concentration near the head region, in spite of
strong tidal flashings twice every day. Under such conditions, the residual tidal effect
should play a significant role in the Environmental Impact Assessment (EIA) of any or
all pollutants.[21, 67]
4.2.1.4 MARINE ECOLOGY
Primary production in the Gulf of Kutch is moderate with 31 genera and 41 species of
phytoplankton. Off the west coast of Saurashtra 28 genera and 71 species were
recorded. In all the three areas of Gulf, as usual, the primary production exhibited
temporal & spatial variability with seasons and tidal phases. Diatoms constituted the
major bulk of phytoplankton everywhere.[67]
In all the three areas, zooplankton-standing stocks are moderate to fairly high.
Species diversity is quite good everywhere. The compositions of zooplankton are
diverse. Dominant groups are copepods & decapods. Fish-eggs & larvae are rich &
abundant everywhere. Crustacean fauna are rich at places providing good feeding
grounds for prawns & fish. In short, all the 3 areas appeared to have good fishery
resources and recruiting grounds for fisheries. Temporal & spatial variations also
exist.
Gujarat tops the list of the 10 littoral states of India in marine fish production
accounting for 23.1% of the National total. In 1997-98 the State exported 17.9% of
its marine catch, which was 32.5% of National export. But, due to over-fishing, the
quantity & size of catches in several prized varieties, like Jumbo prawns, Lobsters,
Dara, Karkara, Koth, Ghol & Wam off the Gujarat-Maharashtra coast, are decreasing.
So, these can be classified as endangered to critically endangered species.
12
157
Benthic fauna are moderate to good in the Gulf of Kutch with good biomass and
population density of both micro & meiobenthos. Foraminifera, polychaetes, gastropods
& crustaceans dominate population of both. The sub-tidal macro-faunal population
density off west Saurashtra indicates high fertility of the region.
Vast inter-tidal expanse, gentle slope & mostly coralline sub-stratum make the coast
of the Gulf of Kutch very conducive for algal growth with number of species varying
from 40-89 at various locations. Dominating species are the green algae: Ulva,
Ernodesemis, Struvea & Microdictyon; brown algae: Padina, Dictyota, Colpomenia,
Iyengaria; red algae: Kjellimania, Halimenia, Griffithsia in the various inter-tidal zones.
Sub-tidal regions are dominated by Sargassum, Turbinaria & Kjellimania. Several
seaweed species are being harvested for production as Agarophytes, Alginophytes &
Carragenophytes. Several marine algae can be exploited for their pharmacological
properties. A few seagrass species are observed to grow in sub-tidal regions of some
islands in the Gulf of Kutch.
The Gulf of Kutch region alone has mangrove vegetation covering 954 km2 out of the
state Gujarat’s total covering of 991 km2. Maximum part of this cover, 836 km2 is in
the Kutch district of which over 800 km2 borders the Kori Creek with a dense patch of
about 640 km2. The coast of Jamnagar district covers 118 km2. Species diversity is
dominated by Avicennia marina, through small stray patches of other species do exist.
Due to high salinity, grazing & cutting pressure their growth is stunted (1-2 m). In
areas free from human interference, e.g. Kori Creek, Pirotan Island, they grow fairly
tall (~10 m) with good girth of their trunks. State Forest Department of Gujarat has
undertaken monospecies (A. Marina) afforestation around the Gulf of Kutch. Mangrove
vegetation is sparse in the semi-arid Junagadh coast. Mangrove trees are very
important to maintain shore stability and protection of the coast from natural
disasters, like cyclones, etc. Several commercially important marine fish breed & spend
a part of their life cycles in this environment.[67]
12
158
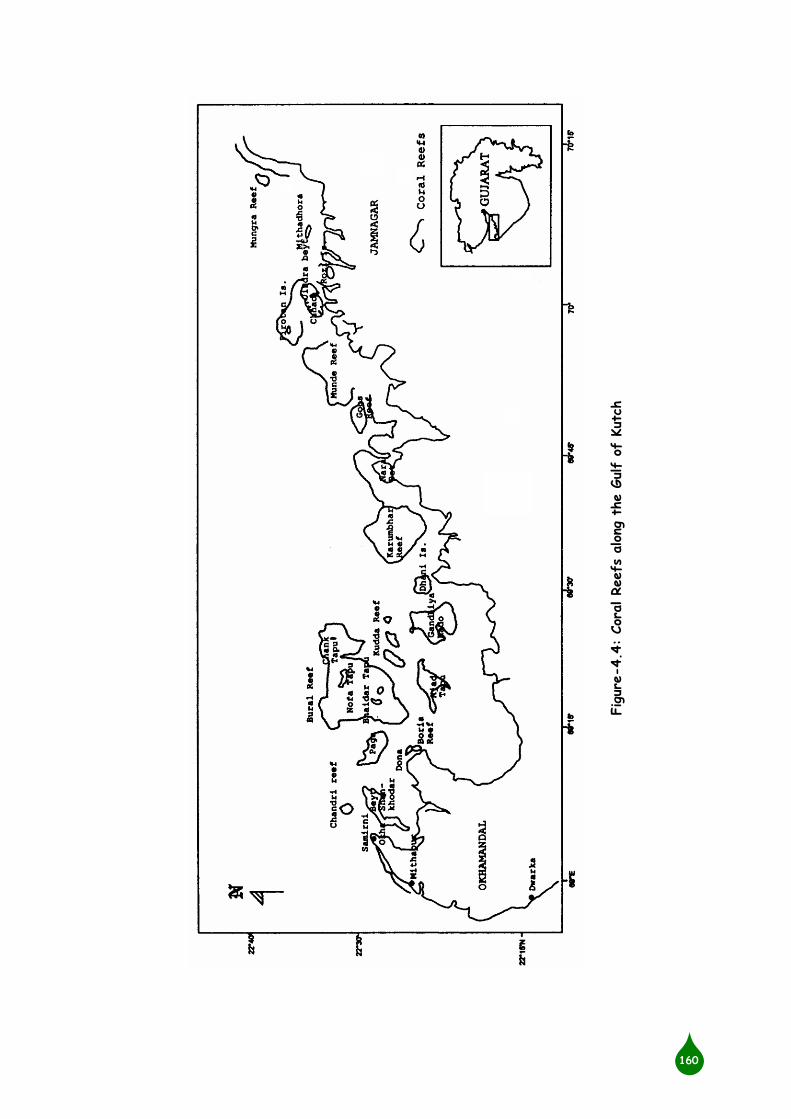
The Gulf of Kutch is the only area in Gujarat where corals exist. This Gulf has 42
islands, 34 of which have coral reefs on one side or more. Satellite imageries indicated
that the total reef area of the Gulf was 217 km2 in 1975, in the inter-tidal zone, which
reduced to 118 km2 in 1985 & 123 km2 in 1986. The core area of the Marine National
Park was 116 km2 in 1975, which was reduced to 83 km2 in 1982, & 53 km2 in 1985.
Between 1985 & 1991 a net improvement from 53 to 85 km2 was noted. Siltation was
concluded to be the main cause for the coral decay from the imageries. A total of 44
species of Scleractinian corals (stony corals) & 12 species of soft corals were reported
from inter-tidal observations. Most of these corals are hermatypes (reef forming)
[figure-4.4] while a few are ahermatypes. Subsequently, in 1999, a video graphic
survey of sub-tidal reefs of 4 islands revealed fantastic mosaics of stony corals, 7
species of soft corals, 28 species of benthic marine algae & 23 species of benthic
fauna have been videographed from these underwater gardens teeming with life. Sub-
tidal zones of all these coral reefs can be expected to reveal similar pictures, revising
upwards the existing concept of 20-30% live corals in these reefs. Coral reefs protect
the coast, increase its stability & help to create sheltered harbors. Because of the
existence of these coral reefs, the northern coast of Saurashtra is protected from
erosion & storm surges. This surely has been helping the ongoing industrial
developments along the Gulf coast of the Jamnagar district. Existence of live coral
patches off Mungra reef on the east & off Mundra (Adani Port) and off Mandovi on
the north in the Gulf of Kutch (figure-4.5)[67] have been confirmed for the first time
in February 2000. The southern shores of the Gulf of Kutch in Jamnagar district have
been demarcated as Marine National Park & Sanctuary (MNP&S) between 1980 & 1982.
4.2.1.5 POLLUTION THREAT
Threats to marine ecology of the state of Gujarat are from the fast growing
industrialization and its associated urbanization. The Gulf of Kutch region (figure-4.5)
is being aggressively developed for economical import of crude oil & its products from
the Middle East countries, transporting a part of these overland to Refineries inland

12
159
and establishing huge grass-root Refineries for petroleum & petrochemicals. Cement,
Soda-Ash & Salt industries also contribute to these threats together with growing
urbanization. Accidental &/ or operational oil spills and release of industrial & urban
wastewater are potential threats to the fragile & unique ecology of the MNP&S. The
threat may be aggravated by allowing industries to discharge wastewater to the Gulf
while Refineries are, rightfully, forbidden to do so. Indiscriminate collections of
marine flora & fauna for scientific research and commercial purposes may endanger
them leading to their ultimate extinction. The only saving grace in the coastal waters
of Gulf (i.e. in Gujarat) is the semi-diurnal tide with large amplitude, which flush the
sea twice everyday. But the residual tidal effect will have its impact on the
environment. The country needs industrial development for its growth. But also Plans
for conservation and management of the environment aiming at Sustainable
Development with Symbiotic Coexistence need to be worked out.[67]
12
160
Figur
e-4.4
: Cor
al Reefs
along
the G
ulf
of K
utch

12
161
Figur
e-4.5
: Cor
al pa
tches
on t
he n
orth
ern
& e
ast
ern
shor
e s
of
the G
ulf
of K
utch
12
162
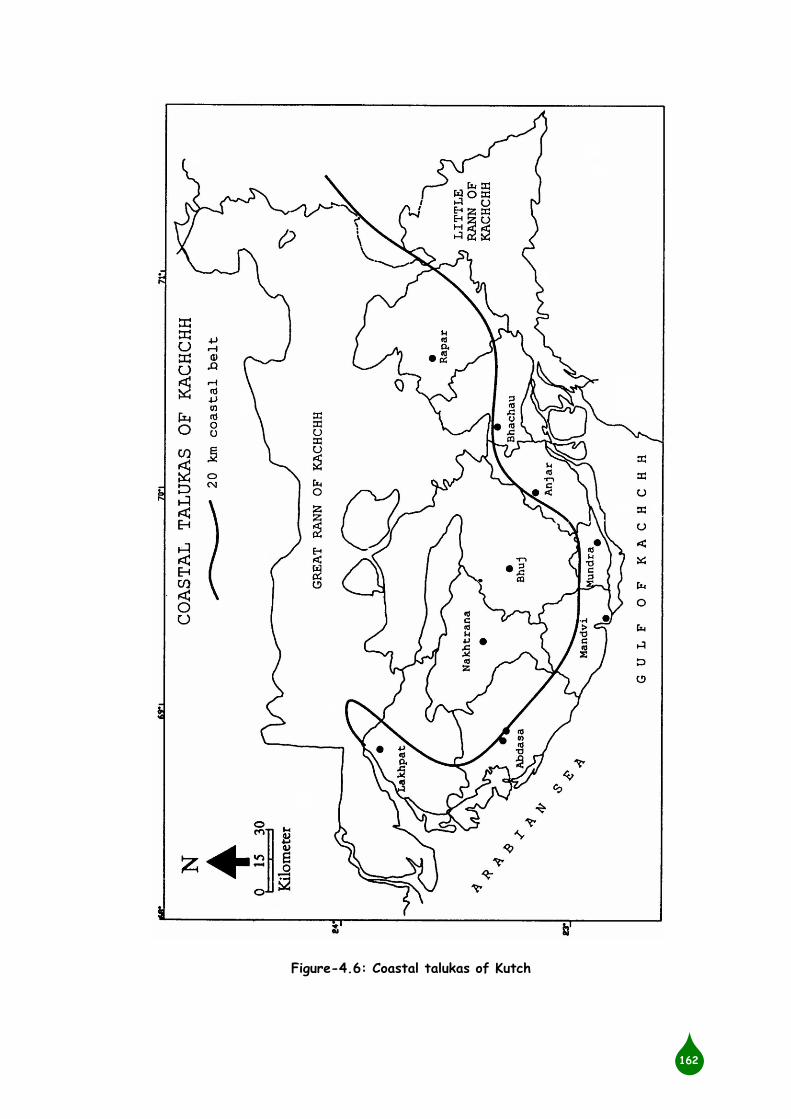
Figure-4.6: Coastal talukas of Kutch
12
163
4.2.2 A BRIEF REPORT ON VADINAR OIL PORT
4.2.2.1 DESCRIPTION OF AREA
Vadinar oil Port is located in the outer Gulf of Kutch in the western coast of the state
of Gujarat in India and the Gujarat is the western boundary of the country. The
approach from the Arabian Sea to the terminal (at SBM) is through a 125 km long
navigation channel maintained by Kandla Port Trust (KPT) & Gujarat Maritime Board
(GMB). The water depths of 30-40 m[21] are available for about 60% of the length. Two
Mooring platforms, known as SBM are there at Salya (i.e. Vadinar) for receiving
Imported & Bombay High crude oils required to meet the highest crude processing
capacity of the 3 biggest Refineries of Indian Oil Corporation Limited (IOCL). Vadinar
is the 2nd largest oil handling port after Kandla and is one & only one to have two SBMs.
Presently, it is handling more than 25 mmtpa oil-cargo.
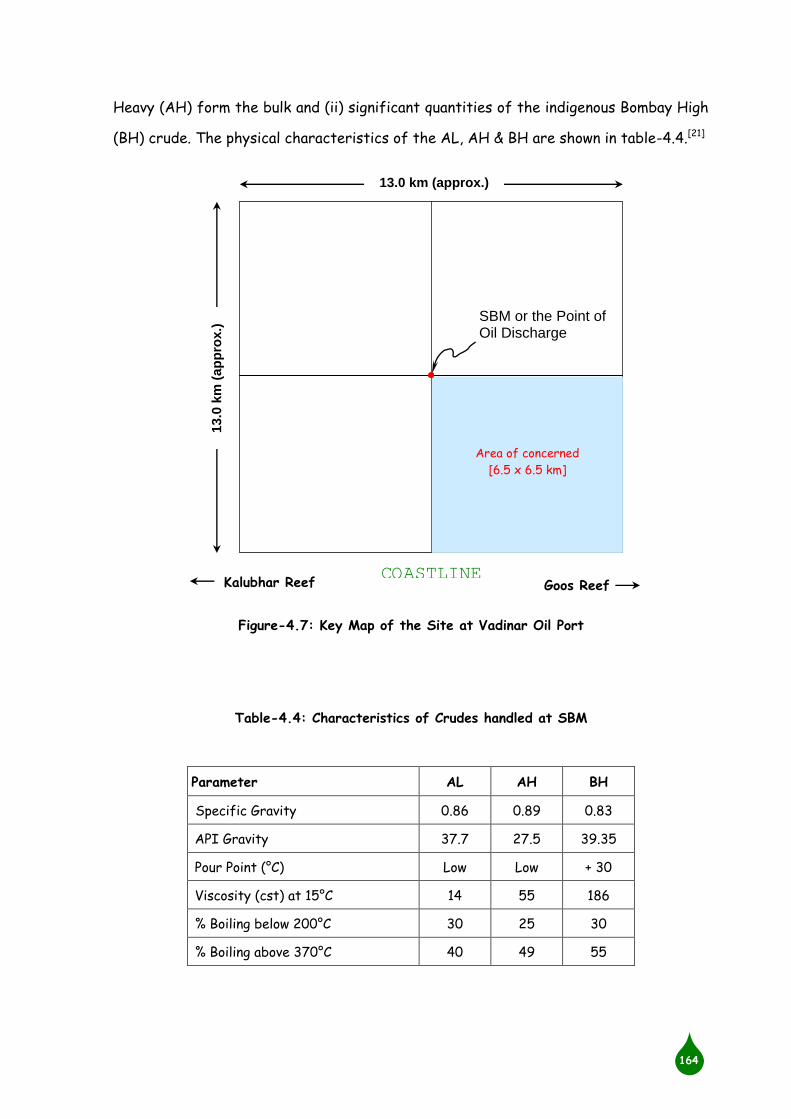
The Single Point Mooring (SPM) System or SBM, which is considered as point of oil
discharge/ spill, is located on the offshore at the latitude 22˚30'14. 36" North & the
longitude 69˚43'27. 33" East of the Gulf of Kutch. The crude received, is transported
to IOCL’s terminal station at Vadinar through 6.4 km which is taken as 6.5 km for
simplicity of calculation in the subject study (figure-4.7), submarine pipeline and
thereafter 5.7 km long twin onshore pipelines for further transportation to its 3
Refineries.
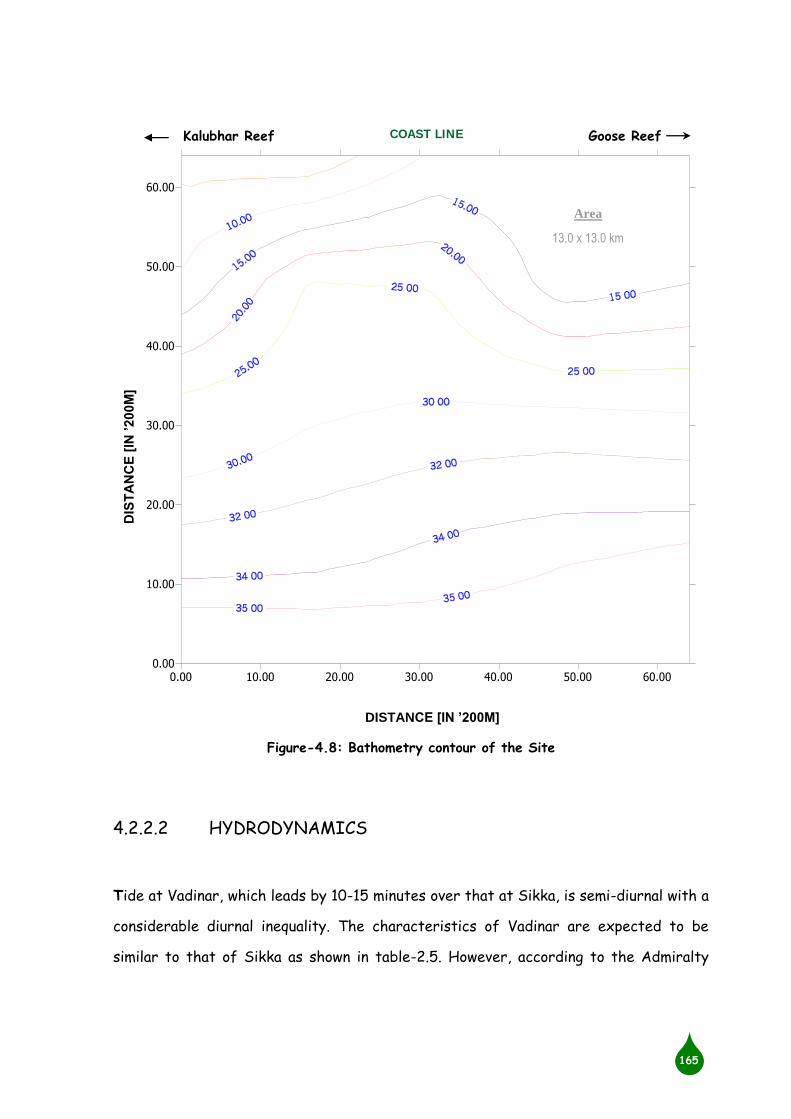
An water depth of around 32 m is available at the SBM (Bathometry contour from the
SBM up to the shore is shown in figure-4.8. The datum of the surroundings as
recorded by the Naval Hydrographic Office, Dehradun (India), is the chart datum,
which is 3.04 m below Indian Mean Sea Level. Two types of Crude oil are handled at
the SBMs at Vadinar: (i) Imported Crude oils of which Arabian Light (AL) & Arabian
12
164
Heavy (AH) form the bulk and (ii) significant quantities of the indigenous Bombay High
(BH) crude. The physical characteristics of the AL, AH & BH are shown in table-4.4.[21]
Table-4.4: Characteristics of Crudes handled at SBM
Parameter AL AH BH
Specific Gravity 0.86 0.89 0.83
API Gravity 37.7 27.5 39.35
Pour Point (°C) Low Low + 30
Viscosity (cst) at 15°C 14 55 186
% Boiling below 200°C 30 25 30
% Boiling above 370°C 40 49 55
Goos Reef
13.0 km (approx.)
13
.0 k
m (
ap
pro
x.)
SBM or the Point of Oil Discharge
Kalubhar Reef
Figure-4.7: Key Map of the Site at Vadinar Oil Port
Area of concerned
[6.5 x 6.5 km]
COASTLINE
12
165
0.00 10.00 20.00 30.00 40.00 50.00 60.000.00
10.00
20.00
30.00
40.00
50.00
60.00
COAST LINE
4.2.2.2 HYDRODYNAMICS
Tide at Vadinar, which leads by 10-15 minutes over that at Sikka, is semi-diurnal with a
considerable diurnal inequality. The characteristics of Vadinar are expected to be
similar to that of Sikka as shown in table-2.5. However, according to the Admiralty
DIS
TA
NC
E [
IN ’
20
0M
]
DISTANCE [IN ’200M]
Goose Reef Kalubhar Reef
Area
13.0 x 13.0 km
Figure-4.8: Bathometry contour of the Site

12
166
Tide Tables, UK the normal tidal range in the area under the study ranges from 1.8 m
(neap) to 6.0 m (spring) within the following mean tidal variations:[21]
Mean High Water Springs (MHWS) : + 6.2 m
Mean High Water Neaps (MHWN) : + 4.1 m
Mean Low Water Neaps (MLWN) : + 0.3 m
Mean Low Water Springs (MHWS) : + 0.2 m
Based on the IMODCO International Inc., USA Study report regarding wave & current
measurement at the Site under study, the normal wind peak is in the Southwest
Monsoon. The normal wind speed frequency based on ships reported wind data by
Indian Meteorological department for the period 1961-69 is as shown in the Table
given below. The yearly peak wind is estimated to be about 75 kmph. During cyclonic
period sustained hourly winds are as high as 111 kmph have been experienced.[21]
Table-4.5: Normal wind speed at Vadinar
Wind Conditions Normal wind speed (Km/hr)
39 50 62
North East Monsoon
(Nov.-Feb.) 0.4% - -
Spring Transition
(March-April) 1.0% - -
South West Monsoon
(May-Aug.) 8.9% 1.7% 0.5%
Autumn Transition
(Sep.-Oct.) 1.4% 0.7% -
Annual Summary 3.5% 0.7% 0.2%
According to Indian Meteorological Deptt, a cyclone occurred in the vicinity of the
site between 21st & 23rd October 1975. An observatory at Jamnagar has reported
hourly-sustained winds of 170 kmph during the cyclone. The same observatory
12
167
recorded instantaneous wind speeds of up to 200 kmph during the cyclone on
instruments with capability of recording a maximum wind speed of 200 kmph.[21]
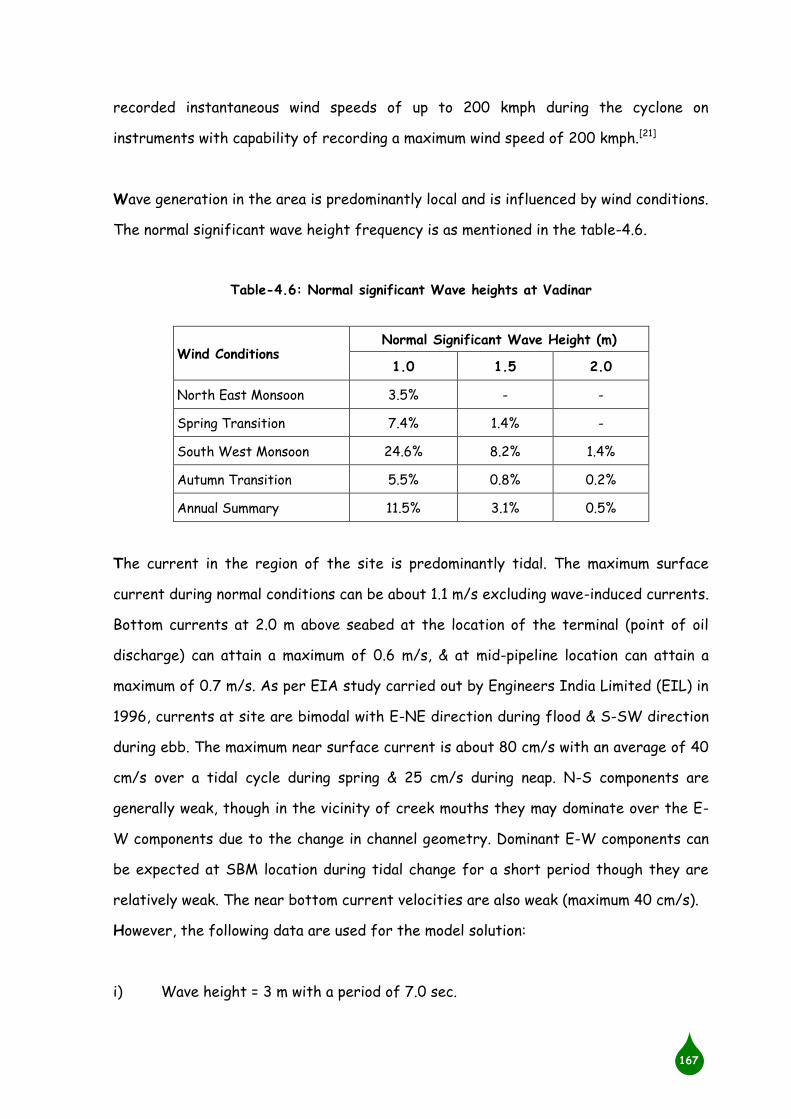
Wave generation in the area is predominantly local and is influenced by wind conditions.
The normal significant wave height frequency is as mentioned in the table-4.6.
Table-4.6: Normal significant Wave heights at Vadinar
Wind Conditions Normal Significant Wave Height (m)
1.0 1.5 2.0
North East Monsoon 3.5% - -
Spring Transition 7.4% 1.4% -
South West Monsoon 24.6% 8.2% 1.4%
Autumn Transition 5.5% 0.8% 0.2%
Annual Summary 11.5% 3.1% 0.5%
The current in the region of the site is predominantly tidal. The maximum surface
current during normal conditions can be about 1.1 m/s excluding wave-induced currents.
Bottom currents at 2.0 m above seabed at the location of the terminal (point of oil
discharge) can attain a maximum of 0.6 m/s, & at mid-pipeline location can attain a
maximum of 0.7 m/s. As per EIA study carried out by Engineers India Limited (EIL) in
1996, currents at site are bimodal with E-NE direction during flood & S-SW direction
during ebb. The maximum near surface current is about 80 cm/s with an average of 40
cm/s over a tidal cycle during spring & 25 cm/s during neap. N-S components are
generally weak, though in the vicinity of creek mouths they may dominate over the E-
W components due to the change in channel geometry. Dominant E-W components can
be expected at SBM location during tidal change for a short period though they are
relatively weak. The near bottom current velocities are also weak (maximum 40 cm/s).
However, the following data are used for the model solution:
i) Wave height = 3 m with a period of 7.0 sec.

12
168
ii) Induced wave angle = 30° with the shore
iii) Tidal current = 1.1 m/s with an angle of 10° to the shore
iv) Wind speed = 14.0 m/s with an angle of 10° to the shore for 72 hours after oil
spill occurs
v) Volume of spill = 100 m3 of Arabian Heavy crude having specific gravity of 0.890
vi) Duration of discharge = 100 minutes.
4.2.2.3 WATER QUALITY
The water quality off Vadinar-Sikka was investigated during 1993-94. The water
temperature varies from 24.0°C to 29.5°C in the coastal waters of Vadinar-Sikka with
a mean of below 29°C. The values are comparable to those observed for the outer Gulf.
The coastal waters are well mixed with absence of any thermal stratification. The
mean pH of water varies from 7.8 to 8.5, which is within the range expected for
coastal tropical seas.
The salinities of the region (semi-arid) often exceed 38 ppt during premonsoon and
during post monsoon these are considerably low (33-35 ppt). The nearshore
premonsoon high salinities (39.2-40.5 ppt) are mainly due to the drainage of high saline
waters from tide pools, intertidal regions & saltpans, into the coastal system.
The suspended particulate matter (9-74 mg/l) is uniformly distributed throughout the
area within the natural availability inherent to a dynamic coastal environment.
Relatively high-suspended load is associated with the bottom waters, which is largely
inorganic in nature. The mean DO value (7.7-8.7 mg/l) observed in the water indicates
good oxidizing conditions. The BOD varies in a narrow range of negligible to 4.5 mg/l &
the average values are below 2.5 mg/l. The overall low BOD indicates that the dead
organic matter is effectively consumed and that there is no gross influence of existing
anthropogenic oxidisable matter inputs to the Gulf.
12
169
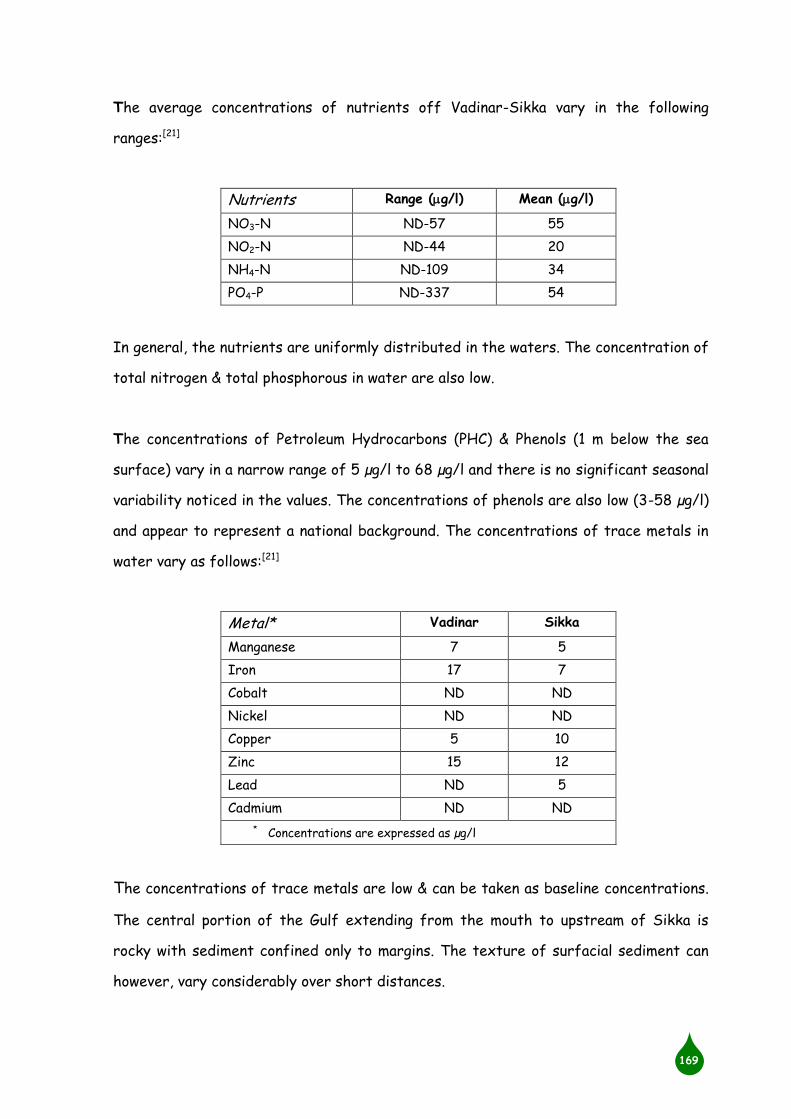
The average concentrations of nutrients off Vadinar-Sikka vary in the following
ranges:[21]
Nutrients Range (g/l) Mean (g/l)
NO3-N ND-57 55
NO2-N ND-44 20
NH4-N ND-109 34
PO4-P ND-337 54
In general, the nutrients are uniformly distributed in the waters. The concentration of
total nitrogen & total phosphorous in water are also low.
The concentrations of Petroleum Hydrocarbons (PHC) & Phenols (1 m below the sea
surface) vary in a narrow range of 5 µg/l to 68 µg/l and there is no significant seasonal
variability noticed in the values. The concentrations of phenols are also low (3-58 µg/l)
and appear to represent a national background. The concentrations of trace metals in
water vary as follows:[21]
Metal* Vadinar Sikka
Manganese 7 5
Iron 17 7
Cobalt ND ND
Nickel ND ND
Copper 5 10
Zinc 15 12
Lead ND 5
Cadmium ND ND
* Concentrations are expressed as µg/l
The concentrations of trace metals are low & can be taken as baseline concentrations.
The central portion of the Gulf extending from the mouth to upstream of Sikka is
rocky with sediment confined only to margins. The texture of surfacial sediment can
however, vary considerably over short distances.
12
170
4.2.2.4 MARINE ECOLOGY
Prevailing biological potential is evaluated largely based on the investigations during
1993-94[21] pertaining to phytoplankton, zooplankton, benthos, intertidal fauna, fishes,
seaweeds, corals, mangroves, reptiles & mammals. The concentration of chlorophyll a.
varies widely from 0.5 mg/m3 to 6.4 mg/m3 (average: 1.6 mg/m3) indicating moderate to
high primary productivity, which is comparable with available data for the Gulf. The
concentration of phaeophytin: 0.1-3.1 mg/m3 (average: 1.0 mg/m3) is lower than that of
chlorophyll as expected, revealing a healthy balance between the growth & mortality of
algae. The phytoplankton cell counts vary from 4 x 10³/l to 1702 x 103/l (average: 118 x
103/l) with maximum during post-monsoon period. More than 60 species of
phytoplankton are identified in the coastal water. Among them Chaetocerose socialis &
Chaetocerose sp. are the most dominant. Other major species are: Nitzschia sp.,
Thalassiosira sp., Navicula sp., Coscinodiscus sp., Nitzschia clostarium, N. seriata and
Biddulphia sinnensis.
The zooplankton standing stock in terms of biomass (0.5-93.1 ml/100 m3) & population
(0.7 x 10³ - 109 x 103/100 m3) vary widely. Overall the region is moderately rich in
zooplankton with frequent occurrence of high standing stock of organisms. The
varieties of zooplankton are mainly of: decapods, copepods, gastropods, mysids, Lucifer
sp., chaetognaths and Fish eggs & larvae. The average intertidal macro faunal standing
stock in terns of population (325-62400 per m2) and biomass (0.1-126.7 g/m2) vary
widely in the regions. The total number of faunal groups in the intertidal area varies
from 9 to 12 (average; 6). Polychaetes, copepods, amphipods, isopods, ostracods,
caprila, tanaidaceans, cumacenas, decapods, brachyurang, mollusks, echinoderms,
pycnogonids, foraminifera, numertines, Crustacean larvae, Insects & Fish eggs, mainly
constitute the fauna. Polychaetes, foraminifera, crustaceans & mollusks in the area
dominate the fauna.
12
171
The subtidal macrofaunal stock in terms of population & biomass vary from 25/m2 to
246000/m2 & 0.1 g/m2 to 66.7 g/m2 respectively. The faunal diversity is comparable.
However, a significant difference in the numerical abundance of individual faunal
groups between pre- & post-monsoon is evident. About 98% of the subtidal macrofauna
is contributed by polychaetes (57%), foraminifera (19%), crustaceans (14%) & mollusks
(7%).
Landings at Vadinar-Sikka reveal a fluctuating trend, which contribute meager 1% to
the total landings of Jamnagar district. The composition of fish catch indicates
incidence of 27 different groups. The common groups are: small Scianeids, Perches,
Mullets, Catfishes, Prawns, Pomfrets, Jew fishes & Shrimps. Overall, 47 species of
fishes, 5 species of prawns, 3 species of crabs, one species of squilla, loligo & sepia
each have been encountered in the catch. Secutor insidiator, Pelates quadrillineatus,
Pristipoma maculatum & Ilish megalopetra dominate the region. The other common
species are Paramonocanthus sp., Johnius glaucus, Pseudotricanthus strigilifer,
Anodontoshtoma chacunda, Cynoglossus arel, & Trichiurus haumela. Out of 47 species
of fishes, 31 species are recorded during post-monsoon and 27 species during pre-
monsoon with 8 species common during both the seasons. Percentage contribution of
prawns is fairly high during the post-monsoon with Metapanaeopsis stridulens &
Penaeus indicus dominating the catch.
All along the creeks & reef environments around Vadinar, the mangroves are seen
crowded with Grey Herons, Pond Herons, Painted Storks, large & small Egrets,
Darters, Cormorant, etc. Along with receding a hectic activity of various Gulls,
Avocets, Whimbrel, Curlew, term & elegant Crabs, Plovers, etc. is a common sight. The
marine mammals, like Dolphin (Dolphinus delphis), Whale (Balanoptera spp.) & Dugong
(Dugong dugon) and the marine reptiles, like Leatherback turtle (Dermochelys
coriacea), Green turtle (Chelonia mydas) and Olive Redley (Lepidochelys olivacea) are
common in the region.

12
172
Vast stretches of intertidal areas around Vadinar such as Narara reef, Kalubhar
(Karumber) reef & Dhani reef are protected under MNP&MS because of their rich bio-
diversity. The southwest region of Kalubhar reef is heavily silted & sustains extensive
mudflats dominated by mangroves. Heavy siltation is also observed in southeast region
of this island causing the coral death except for a few sturdy coral colonies. However,
northeast region of the island is very rich in marine biota, particularly corals &
seaweeds. The density of corals is in reducing trend from the reef slope & the reef
flat towards further upstream. Toward the high-tide area, the reef is totally dead.
Entire Kalubhar reef is reach in marine algae dominated by Digenea simplex, Graciloria
corticata, G. crassa, Padina gymnospora, Hydroclathrus spp., Ulva lactuca, U. reticulata
& Hypnea species. The corals are represented by 35 species and dominated by genera,
like Goniastrea, Gonipora, Porites, Turbinaria, Favia & Favites – commonly occurring
elsewhere also in the Gulf. The dominating species in mangrove zone of the island are:
Avicennia marina, Ceripos tagal, Salvadora persica, Salicornia brachiata & Sueda
fruiticosa. Large number of birds & jackals are observed in the mangrove regions.
Major species of seagrasses, like Halophila ovata, Halodula univervis & Halophila
beccarii are also observed.
Overall assessment indicates that the entire Narara reef is relatively rich in coral
populations compared to the nearby reefs & island. The dominant forms of coral are:
Goniastrea aspera, Porites lutea, Montipora striata, Gonipora stokisi & Favites species.
The seaweed flora though well represented qualitatively, abundance is poor, which
could be due to their seasonal occurrence. The algal zone of the reef is of great
potential for economically important seaweeds such as, Graciloria & Sargassum species.
The common species of seagrasses recorded are: Halophila beccarii, Halophila ovata,
Sargassum, Cystoseira, Hydroclathrus. Other major varieties of algae are of Padina
tetrastromatica, Enteromorpha, Dictyota, & Cladophora species. Monospecific stands
of mangrove, particularly Avicennia marina, are quite common. The open mud flats
devoid of mangroves are potential sites for mangroves nurseries & afforestation. The
dominating coral species in the island are: 15 species of Scleractinian. However, the

12
173
dominant forms are: Goniastrea aspera, Porites lutea, Montipora striata, Gonipora
stokisi & Favites species. The destruction of corals is evident all over the reef. Live
corals, particularly in the algal zones are under severe stress from heavy
sedimentation.
4.2.2.5 POLLUTION THREAT
Populations and community structure of the marine biota are subject to considerable
natural fluctuations due to changes in climatic & hydrographic conditions and the
availability of food. Hence, it is difficult to assess the effect of an oil spill and to
distinguish changes caused by the oil from those due to natural variability. Moreover,
different life-stages of species may show widely different tolerances to oil pollution
depending on their physiogeneric, ecophysiological & biochemical adaptations to varying
environmental conditions. Usually the eggs, larval & juvenile stages are more
susceptible than the adults. Even moderate spills up to 100 m3 may cause large-scale
mortality of plankton & eggs, larvae & juveniles due to a multifold increase in
concentrations of PHC in water soon after the spill. However, under the dynamic Gulf
environment rapid dilution of naturally dispersed oil and soluble components is
expected, soon restoring pre-spill conditions & continuity structure are expected to be
restored fairly soon. Many tropical marine species have very high fecundity that
provides a reservoir to compensate for any extreme losses due to adverse local
conditions. These facts make it unlikely that any localized losses of eggs or larvae
caused by a moderate oil spill will have discernible effect on the size or health of
future adult populations. However, populations of long life, and slowly maturing species
with low fecundity rates may take many years to recover their populations and age
structures, particularly if large areas are affected by oil for a prolonged period. The
major dangers of an oil-spill in the marine environment are:[2, 10, 21, 67]
When oil is spilled on a calm water-surface, only soluble components in the oil
affect organisms in the underlying water. Most waters however, are not calm

12
174
and waves & currents mix oil into the underlying water due to which the water
is unable to absorb oxygen necessary for the living organisms under the surface
of water. Besides this, the growth of marine organisms depends on the quantity
& quality of the primary production of phytoplankton (algae). Apart from the
toxic effects of oil, marine micro-fauna can experience indirect food effects
since algae production can be changed after an oil-spill.
As the oil enters shallow waters during its shoreward transport, oil in water
may reach the bottom particularly during periods of rough weather. This may
cause local damage to benthic organisms. However, it is unlikely that lethal
concentrations will be reached to cause widespread damage except in nearshore
subtidal regions. The impact however, may be particularly severe when large
areas of mudflats, coral reefs, mangrove swamps, saltpans; rocky & sandy
shores are exposed to oil. Depending on the tidal range & topography, the
floating oil may be transported to the shallow interior regions and with the fall
in water level during low tide the oil will form a layer on the exposed inter-tidal
regions destroying the rich inter-tidal fauna of the affected areas. The animals
may be killed by toxic oil components or physically smothered by viscous and
weathered oils & emulsions. The stranded oil may remain for long periods and
recolonization & establishment of normal community structure may take years.
More widespread damage can occur from repeated contamination or if the oil
penetrates into the sediment where it may persist for several years. Due to
weathering & tidal action the part of the oil may get mixed with sediment,
eventually forming tar balls which may subsequently be transported to far away
places and deposited on clean areas. Such tar balls however, do not cause
significant damage to biota.
Salt marshes are extremely valuable components of many estuaries &
coastlines. Salt/ marsh environments are extremely productive & provide
nursery grounds for fisheries and are major energy sources in many coastal
estuaries. Marshes control tidal erosion, buffer the impact of the coastal
storms and act as an interface between the land & sea. This last role prompts

12
175
concern for the vulnerability of marshes when inundated with crude oil or
refined petroleum products.
Large swimming animals, such as squids, fishes, turtles & dolphins are highly
mobile and rarely affected in offshore waters even in major oil-spills. In coastal
areas, some marine mammals, such as seals and reptiles, such as turtles, may
particularly vulnerable to adverse effects from oil contamination because of
their need to surface to breathe & to have the water to breed. Adult fish living
in nearshore waters and juveniles in shallow water nursery grounds may also be
at risk from exposure to dispersed or dissolved oil. It has been observed that,
fish crustaceans & mollusks under prolonged exposure to concentrations of oil
may acquire an objectionable oily odour or tainting. Consumption of such oil
affected fishes may cause vomiting, nausea, etc.
Animals depending on fur or hair for thermal insulation (sea otters, fur seals,
polar bears) suffer loss of body temperature when their hair is fouled with oil.
Moreover, loss of waterproofing reduces the insulation and can result in chilling,
hypothermia & death.
The effects of oiling on sea-birds may be twofold:
External effects associated with oiling of plumage.
Internal effects associated with the pathological effects of ingested
oil.
Oil destroys the waterproofing and insulating properties of the plumage. The
birds will suffer from chilling and it is often unable to fly or remain afloat in
the water. The bird has difficulty in obtaining food or escaping predators. On
internal effects, oil aspiration pneumonia is common in oiled birds. Visceral gout
due to kidney damage as a direct toxic effect of oil or due to dehydration has
been documented. Oil from the feathers of an incubating bird may pass through
the pores in eggshells & either kill the embryos or induce abnormalities.

12
176
Mangroves show greater sensitivity to fresh light crude or light refined
products than weathered oils. Of the four mangrove species, the red mangrove
is the most seaward in occurrence and makes up nearly all of the fringing
forest. The labyrinthine prop roots of red mangroves serve as a firm substrate
that supports a number of plants & animals. After the spill, the mangrove trees
in oiled areas become defoliated & the leaves yellow. Moreover, if the roots
decompose then there is a potential threat to nearby corals & other organisms
that are intolerant to Siltation.
The proportion of toxic components in oil, the duration of exposure as well as
the degree of other stresses largely determine the effects of oil on corals &
their associated biota. Coral reefs are important in supporting coastal fisheries,
protecting tropical coastlines from wave action & erosion and providing a basis
for tourism & recreation. Coral reefs along the Gulf are usually submerged but
get exposed briefly to air at low tide. The oil floating above corals may not
cause severe damage but if it settles on them during low tide may be severely
affected. Oil spills cause substantial mortality among fish and invertebrates
(including lobsters, crabs, gastropods, bivalves, octopus, sea urchins, sea stars
& sea cucumbers) in inter-tidal areas, on the surfaces and margins of coastal
fringing reef platforms, and in adjacent shallow sub-tidal areas. Numerous
colonies of shallow water corals were dead or dying at a depth of 1 - 2 m in
heavily oiled areas. The proportion of dead or dying colonies averaged between
17% & 30% on oiled reefs.
Other problems include accidental poisoning by ingesting oil, blindness from oil
exposure, liver damage and other disabilities. Any animals that come into
contact with this oil will likely be poisoned.
Contamination of coastal amenity areas is a common feature of many oil spills
leading to public disquiet and interference with recreational activities such as
bathing, boating, angling and diving. Hotel & restaurant owners and others who
gain their livelihood from the tourist trade can also be affected. However, the
disturbance to coastal areas and to recreational pursuits from a single oil spill is

12
177
comparatively short-lived and any effect on tourism is largely a question of
restoring public confidence once cleanup is completed.
Industries that rely on a continuous supply of clean seawater for their normal
operations can be adversely affected by oil spills. Power stations, in particular,
are often located close to the coast in order to have access to the very large
quantities of water required for cooling purposes. If substantial quantities of
oil are drawn through intakes, contamination of condenser tubes may result,
requiring a reduction in output or total shutdown whilst cleaning is carried out.
Similarly, the normal operation of desalination plants may be disrupted by oil,
causing water supply problems for consumers.
The following data will show the effect of oil spills on the lives of the sea birds:[2, 68]
Sl. Spill No. of sea birds died
1. Cap Tourmente, Fall 1963 Contaminated the habitat of snow geese. 2. Arrow, February 1970 More than 4800 - mostly Murres & Dovekie;
Inshore: more than 2400 including diving Ducks,
Grebes & Murres.
3. Irving Whale, March 1970 Around 5000 - mostly Eiders. 4. Eastern Lake Erie, Dec. 1975 2800 - mostly diving Ducks. 5. Kurdistan, March 1979 4000 - mostly Murres & Dovekie. 6. Nestucca, Dec. 1988 Around 40 000 - mostly Murres & Auklets. 7. Exxon Valdez, March 1989 More than 30 000 - mostly diving Ducks, Auks &
Pelicans.
The above data shows its devastating effect on the lives of the sea birds in the area
where the oil spill happens, but in the ecosystem there are not only birds but a large
number of other living organisms like fishes, turtles, otters, whales, etc., as the oil
spill during the 1991 Gulf War killed 400 to 500 tons of fish.
12
178
As per EIA study, the spill movements’ predictions indicate, the spill reaching the
Kalubhar & Goos reefs. Hence, even a moderate spill of 100 - 200 m3 may cause a
considerable damage to the reef-ecology of these islands. A large spill of 3000 m3 will
produce a devastating effect on nearshore subtidal & intertidal ecosystems at a
considerable stretch of the coastline. As a result, the intertidal mudflats, sandy
beaches, mangrove areas & saltpans will suffer severe damage and recovery will be a
slow process.