foundation analysis and design - university of...
TRANSCRIPT

4-1
4FOUNDATION ANALYSIS AND DESIGN
Michael Valley, P.E.
This chapter illustrates application of the 2000 Edition of the NEHRP Recommended Provisions to thedesign of foundation elements. Example 4.1 completes the analysis and design of shallow foundations fortwo of the alternate framing arrangements considered for the building featured in Example 5.2. Example4.2 illustrates the analysis and design of deep foundations for a building similar to the one highlighted inChapter 6 of this volume of design examples. In both cases, only those portions of the designs necessaryto illustrate specific points are included.
The force-displacement response of soil to loading is highly nonlinear and strongly time dependent. Control of settlement is generally the most important aspect of soil response to gravity loads. However,the strength of the soil may control foundation design where large amplitude transient loads, such as thoseoccurring during an earthquake, are anticipated.
Foundation elements are most commonly constructed of reinforced concrete. As compared to design ofconcrete elements that form the superstructure of a building, additional consideration must be given toconcrete foundation elements due to permanent exposure to potentially deleterious materials, less preciseconstruction tolerances, and even the possibility of unintentional mixing with soil.
Although the application of advanced analysis techniques to foundation design is becoming increasinglycommon (and is illustrated in this chapter), analysis should not be the primary focus of foundation design.Good foundation design for seismic resistance requires familiarity with basic soil behavior and commongeotechnical parameters, the ability to proportion concrete elements correctly, an understanding of howsuch elements should be detailed to produce ductile response, and careful attention to practicalconsiderations of construction.
Although this chapter is based on the 2000 Provisions, it has been annotated to reflect changes made tothe 2003 Provisions. Annotations within brackets, [ ], indicate both organizational changes (as a result ofa reformat of all of the chapters of the 2003 Provisions) and substantive technical changes to the 2003Provisions and its primary reference documents. While the general concepts of the changes aredescribed, the design examples and calculations have not been revised to reflect the changes to the 2003Provisions. The most significant change to the foundation chapter in the 2003 Provisions is the additionof a strength design method for foundations. Another change was made to introduce guidance for theexplicit modeling of foundation load-deformation characteristics. Where they affect the design examplesin this chapter, other significant changes to the 2003 Provisions and primary reference documents arenoted. However, some minor changes to the 2003 Provisions and the reference documents may not benoted.

FEMA 451, NEHRP Recommended Provisions: Design Examples
4-2
In addition to the 2000 NEHRP Recommended Provisions and Commentary (referred to herein asProvisions and Commentary), the following documents are either referenced directly or provide usefulinformation for the analysis and design of foundations for seismic resistance:
ACI 318 American Concrete Institute. 1999 [2002]. Building Code Requirements andCommentary for Structural Concrete.
ASCE 7 American Society of Civil Engineers. 1998 [2002]. Minimum Design Loads forBuildings and Other Structures.
Bowles Bowles, J. E. 1988. Foundation Analysis and Design. McGraw-Hill.
Brown 1987 Brown, D. A., L. C. Reese, and M. W. O’Neill. 1987. “Cyclic Lateral Loadingof a Large-Scale Pile Group,” Journal of Geotechnical Engineering, Vol. 113,No. 11 (November). ASCE.
Brown 1988 Brown, D. A., C. Morrison, and L. C. Reese. 1988. “Lateral Load Behavior ofPile Group in Sand.” Journal of Geotechnical Engineering, Vol 114, No. 11,(November). ASCE.
CRSI Concrete Reinforcing Steel Institute. 1996. CRSI Design Handbook. ConcreteReinforcing Steel Institute.
FEMA 356 ASCE. 2000. Prestandard and Commentary for the Seismic Rehabilitation ofBuildings, FEMA 356, prepared by the American Society of Civil Engineers forthe Federal Emergency Management Agency.
GROUP Reese, L. C., and S. T. Wang. 1996. Manual for GROUP 4.0 for Windows. Ensoft.
Kramer Kramer, S. L. 1996. Geotechnical Earthquake Engineering. Prentice Hall.
LPILE Reese, L. C., and S. T. Wang. 1997. Technical Manual for LPILE Plus 3.0 forWindows. Ensoft.
Martin Martin, G. R., and I. PoLam. 1995. “Seismic Design of Pile Foundations:Structural and Geotechnical Issues.” Proceedings: Third InternationalConference on Recent Advances in Geotechnical Earthquake Engineering andSoil Dynamics.
Pender Pender, M. J. 1993. “Aseismic Pile Foundation Design Analysis.” Bulletin ofthe New Zealand National Society for Earthquake Engineering, Vol. 26, No. 1(March).
PoLam PoLam, I., M. Kapuskar, and D. Chaudhuri. 1998. Modeling of Pile Footingsand Drilled Shafts for Seismic Design, MCEER-98-0018. MultidisciplinaryCenter for Earthquake Engineering Research.
Wang & Salmon Wang, C.-K., and C. G. Salmon. 1992. Reinforced Concrete Design . HarperCollins.

Chapter 4, Foundation Analysis and Design
4-3
Youd Youd, T. L., Idriss, I. M., and et al. 2001. “Liquefaction Resistance of Soils:Summary Report from the 1996 NCEER and 1998 NCEER/NSF Workshops onEvaluation of Liquefaction Resistance of Soils.” Journal of Geotechnical andGeoenvironmental Engineering (October). ASCE.
Several commercially available programs were used to perform the calculations described in this chapter. RISA: 3D is used to determine the shears and moments in a concrete mat foundation; LPILE, in theanalysis of laterally loaded single piles; and PCACOL, to determine concrete pile section capacities.

FEMA 451, NEHRP Recommended Provisions: Design Examples
4-4
127'
-4"
25'-0
"25
'-0"
25'-0
"25
'-0"
25'-0
"1'
-2"
1'-2
"
1'-2" 25'-0" 25'-0" 25'-0" 25'-0" 25'-0" 25'-0" 25'-0" 1'-2"
177'-4"
N
Figure 4.1-1 Typical framing plan.
4.1 SHALLOW FOUNDATIONS FOR A SEVEN-STORY OFFICE BUILDING, LOSANGELES, CALIFORNIA
This example features the analysis and design of shallow foundations for two of the three framingarrangements for the seven-story steel office building described in Sec. 5.2 of this volume of designexamples. Refer to that example for more detailed building information and for the design of thesuperstructure; because Chapter 4 was completed after Chapter 5, some values may differ slightlybetween the two chapters.
4.1.1 Basic Information
4.1.1.1 Description
The framing plan in Figure 4.1-1 shows the gravity-load-resisting system for a representative level of thebuilding. The site soils, consisting of medium dense sands, are suitable for shallow foundations. Table4.1-1 shows the design parameters provided by a geotechnical consultant. Note the distinction madebetween bearing pressure and bearing capacity. If the long-term, service-level loads applied tofoundations do not exceed the noted bearing pressure, differential and total settlements are expected to bewithin acceptable limits. Settlements are more pronounced where large areas are loaded, so the bearingpressure limits are a function of the size of the loaded area. The values identified as bearing capacity arerelated to gross failure of the soil mass in the vicinity of loading. Where loads are applied over smallerareas, punching into the soil is more likely.

Chapter 4, Foundation Analysis and Design
4-5
Because bearing capacities are generally expressed as a function of the minimum dimension of the loadedarea and are applied as limits on the maximum pressure, foundations with significantly non-square loadedareas (tending toward strip footings) and those with significant differences between average pressure andmaximum pressure (as for eccentrically loaded footings) have higher calculated bearing capacities. Therecommended values are consistent with these expectations.
[The 2003 Provisions discuss the settlement and strength limit states in Sec. 7.2.2.2 using slightlydifferent nomenclature.]
Table 4.1-1 Geotechnical Parameters
Parameter Value
Basic soil properties Medium dense sand(SPT) N = 20γ = 125 pcfangle of internal friction = 33 deg
Net bearing pressure(to control settlement due tosustained loads)
# 4000 psf for B # 20 ft# 2000 psf for B $ 40 ft (may interpolate for intermediate dimensions)
Bearing capacity(for plastic equilibrium strengthchecks with factored loads)
2000 B psf for concentrically loaded square footings3000 B' psf for eccentrically loaded footings where B and B' are in feet, B is the footing width and B' is an average width for the compressed area.Resistance factor, φ = 0.6[In the 2003 Provisions, the φ factor for cohesionless soilis explicitly defined; the value is set at 0.7 for vertical,lateral, and rocking resistance.]
Lateral properties Earth pressure coefficients Active, KA = 0.3 At-rest, K0 = 0.46 Passive, KP = 3.3“Ultimate” friction coefficient at base of footing = 0.65Resistance factor, φ = 0.8 [In the 2003 Provisions, the φ factor for cohesionless soilis explicitly defined; the value is set at 0.7 for vertical,lateral, and rocking resistance.]
The structural material properties assumed for this example are:
f'c = 4,000 psify = 60,000 psi
4.1.1.2 Provisions Parameters
The complete set of parameters used in applying the Provisions to design of the superstructure isdescribed in Sec. 5.2.2.1 of this volume of design examples. The following parameters, which are usedduring foundation design, are duplicated here.
Site Class = DSDS = 1.0

FEMA 451, NEHRP Recommended Provisions: Design Examples
4-6
Seismic Design Category = D
4.1.1.3 Design Approach
4.1.1.3.1 Selecting Footing Size and Reinforcement
Most foundation failures are related to excessive movement rather than loss of load-carrying capacity. Settlement control should be addressed first. In recognition of this fact, settlement control should be thefirst issue addressed. Once service loads have been calculated, foundation plan dimensions should beselected to limit bearing pressures to those that are expected to provide adequate settlement performance. Maintaining a reasonably consistent level of service load bearing pressures for all of the individualfootings is encouraged as it will tend to reduce differential settlements, which are usually of more concernthan are total settlements.
When a preliminary footing size that satisfies serviceability criteria has been selected, bearing capacitycan be checked. It would be rare for bearing capacity to govern the size of footings subjected to sustainedloads. However, where large transient loads are anticipated, consideration of bearing capacity maybecome important.
The thickness of footings is selected for ease of construction and to provide adequate shear capacity forthe concrete section. The common design approach is to increase footing thickness as necessary to avoidthe need for shear reinforcement, which is uncommon in shallow foundations.
Design requirements for concrete footings are found in Chapters 15 and 21 of ACI 318. Chapter 15provides direction for the calculation of demands and includes detailing requirements. Section capacitiesare calculated in accordance with Chapters 10 (for flexure) and 11 (for shear). Figure 4.1-2 illustrates thecritical sections (dashed lines) and areas (hatched) over which loads are tributary to the critical sections. For elements that are very thick with respect to the plan dimensions (as at the pile caps), these criticalsection definitions become less meaningful and other approaches (e.g., strut-and-tie modeling) should beemployed. Chapter 21 provides the minimum requirements for concrete foundations in Seismic DesignCategories D, E, and F, which are similar to those provided in prior editions of the Provisions.
For shallow foundations, reinforcement is designed to satisfy flexural demands. ACI 318 Sec. 15.4defines how flexural reinforcement is to be distributed for footings of various shapes.
Sec. 10.5 of ACI 318 prescribes the minimum reinforcement for flexural members where tensilereinforcement is required by analysis. Provision of the minimum reinforcement assures that the strengthof the cracked section is not less than that of the corresponding unreinforced concrete section, thuspreventing sudden, brittle failures. Less reinforcement may be used as long as “the area of tensilereinforcement provided is at least one-third greater than that required by analysis.” Sec. 10.5.4 relaxesthe minimum reinforcement requirement for footings of uniform thickness. Such elements need onlysatisfy the shrinkage reinforcement requirements of Sec. 7.12. Sec. 10.5.4 also imposes limits on themaximum spacing of bars.
4.1.1.3.2 Additional Considerations for Eccentric Loads
The design of eccentrically loaded footings follows the approach outlined above with one significantaddition – consideration of overturning stability. Stability calculations are sensitive to thecharacterization of soil behavior. For sustained eccentric loads a linear distribution of elastic soil stressesis generally assumed and uplift is usually avoided. If the structure is expected to remain elastic whensubjected to short-term eccentric loads (as for wind loading), uplift over a portion of the footing isacceptable to most designers. Where foundations will be subjected to short-term loads and inelastic

Chapter 4, Foundation Analysis and Design
4-7
d/2 (all sides)
(c) Critical sectionfor two-way shear
(b)Critical sectionfor one-way shear
(a)Critical sectionfor flexure
Outside face of concretecolumn or line midwaybetween face of steelcolumn and edge ofsteel base plate (typical)
extent of footing(typical)
d
Figure 4.1-2 Critical sections for isolatedfootings.
(a)Loading
(b)Elastic, no uplift
(c)Elastic, at uplift
(d)Elastic, after uplift
(e)Some plastification
(f)Plastic limit
M
P
Figure 4.1-3 Soil pressure distributions.
response is acceptable (as for earthquake loading), plastic soil stresses may be considered. It is mostcommon to consider stability effects on the basis of statically applied loads even where the loading isactually dynamic; that approach simplifies the calculations at the expense of increased conservatism. Figure 4.1-3 illustrates the distribution of soil stresses for the various assumptions. Most textbooks onfoundation design provide simple equations to describe the conditions shown in parts b, c, and d of thefigure; finite element models of those conditions are easy to develop. Simple hand calculations can beperformed for the case shown in part f. Practical consideration of the case shown in part e would requiremodeling with inelastic elements, but offers no advantage over direct consideration of the plastic limit. (All of the discussion in this section focuses on the common case in which foundation elements may beassumed to be rigid with respect to the supporting soil. For the interested reader, Chapter 4 of FEMA 356provides a useful discussion of foundation compliance, rocking, and other advanced considerations.)
4.1.2 Design for Gravity Loads
FEMA 451, NEHRP Recommended Provisions: Design Examples
4-8
Although most of the examples in the volume do not provide detailed design for gravity loads, it isprovided in this section for two reasons. First, most of the calculation procedures used in designingshallow foundations for seismic loads are identical to those used for gravity design. Second, a completegravity design is needed to make the cost comparisons shown in Sec. 4.1.5 below meaningful.
Detailed calculations are shown for a typical interior footing. The results for all three footing types aresummarized in Sec. 4.1.2.5.
4.1.2.1 Demands
Dead and live load reactions are determined as part of the three-dimensional analysis described in Sec. 5.2of this volume of design examples. Although there are slight variations in the calculated reactions, thefoundations are lumped into three groups (interior, perimeter, and corner) for gravity load design and themaximum computed reactions are applied to all members of the group, as follows:
Interior: D = 387 kipsL = 98 kips
Perimeter: D = 206 kipsL = 45 kips
Corner: D = 104 kipsL = 23 kips
The service load combination for consideration of settlement is D + L. Considering the loadcombinations for strength design defined in Sec. 2.3.2 of ASCE 7, the controlling gravity loadcombination is 1.2D + 1.6L. Because ASCE 7 load combinations are employed, the alternate strengthreduction factors found in ACI 318 Appendix C must be used. [The 2003 Provisions refer to ACI 318-02, in which the basic resistance factors have been revised to be consistent with the load combinations inASCE 7. These new resistance factors (not those found in the ACI 318 Appendix) are used for seismicdesign. This change would affect slightly the results of the example calculations in this chapter .]
4.1.2.2 Footing Size
The preliminary size of the footing is determined considering settlement. The service load on a typicalinterior footing is calculated as:
P = D + L = 387 kips + 98 kips = 485 kips.
Since the footing dimensions will be less than 20 ft, the allowable bearing pressure (see Table 4.1-1) is4000 psf. Therefore, the required footing area is 487,000 lb/4000 psf = 121.25 ft2.
Check a footing that is 11'-0" by 11'-0":
Pallow = 11 ft(11 ft)(4000 psf) = 484,000 lb = 484 kips . 485 kips (demand). OK
The strength demand is:
Pu = 1.2(387 kips) + 1.6(98 kips) = 621 kips.
As indicated in Table 4.1-1, the bearing capacity (qc) is 2000 B = 2000 × 11 = 22000 psf = 22 ksf.

Chapter 4, Foundation Analysis and Design
4-9
The design capacity for the foundation is:
φPn = φqcB2 = 0.6(22 ksf)(11 ft)2 = 1597 kips o 621 kips. OK
For use in subsequent calculations, the factored bearing pressure qu = 621 kips/(11 ft)2 = 5.13 ksf.
4.1.2.3 Footing Thickness
Once the plan dimensions of the footing are selected, the thickness is determined such that the sectionsatisfies the one-way and two-way shear demands without the addition of shear reinforcement. Becausethe demands are calculated at critical sections (see Figure 4.1-2) that depend on the footing thickness,iteration is required.
Check a footing that is 26 in. thick:
For the W14 columns used in this building, the side dimensions of the loaded area (taken halfwaybetween the face of the column and the edge of the base plate) are about 16 in. Accounting for cover andexpected bar sizes, d = 26 - (3 + 1.5(1)) = 21.5 in.
One-way shear:
.( )161211 21.511 5.13 172kips
2 12uV−⎛ ⎞
= − =⎜ ⎟⎝ ⎠
> 172 kips. OK( ) ( )( )( )110000.75 2 4000 11 12 21.5 269kipsn cV Vφ φ= = × =
Two-way shear:
.( ) ( )216 21.512621 5.13 571kipsuV += − =
> 571 kips. OK( ) ( ) ( )( )110000.75 4 4000 4 16 21.5 21.5 612kipsn cV Vφ φ= = ⎡ × + ⎤ =⎣ ⎦
4.1.2.4 Footing Reinforcement
Footing reinforcement is selected considering both flexural demands and minimum reinforcementrequirements. The following calculations treat flexure first because it usually controls:
.( ) ( )216
12111 11 5.13 659 ft-kips2 2uM
−⎛ ⎞= =⎜ ⎟
⎝ ⎠
Try 10 #8 bars each way. The distance from the extreme compression fiber to the center of the top layerof reinforcement, d = t - cover - 1.5db = 26 - 3 - 1.5(1) = 21.5 in.
T = As fy = 10(0.79)(60) = 474 kips.
Noting that C = T and solving the expression C = 0.85 f'c b a for a produces a = 1.06 in.
> 659 ft-kips. OK( ) ( )( )( )1.06 12 2 120.80 474 21.5 663ft-kipsa
nM T dφ φ= − = − =

FEMA 451, NEHRP Recommended Provisions: Design Examples
4-10
The ratio of reinforcement provided ρ = 10(0.79)/[(11)(12)(21.5)] = 0.00278. The distance between barsspaced uniformly across the width of the footing s = [(11)(12)-2(3+0.5)]/(10-1) = 13.9 in.
According to ACI 318 Sec. 7.12, the minimum reinforcement ratio = 0.0018 < 0.00278. OK
and the maximum spacing is the lesser of 3 × 26 in. or 18 = 18 in. > 13.9 in. OK
4.1.2.5 Design Results
The calculations performed in Sec. 4.1.2.2 through 4.1.2.4 are repeated for typical perimeter and cornerfootings. The footing design for gravity loads is summarized in Table 4.1-2; Figure 4.1-4 depicts theresulting foundation plan.
Table 4.1-2 Footing Design for Gravity Loads
Location Loads Footing Size and Reinforcement; Soil Capacity
Critical Section Demands and Design Strengths
Interior D = 387 kipL = 98 kip
P = 485 kipPu = 621 kip
11'-0" × 11'-0" × 2'-2" deep10-#8 bars each way
Pallow = 484 kipφPn = 1597 kip
One-way shear: Vu = 172 kipφVn = 269 kip
Two-way shear: Vu = 571 kipφVn = 612 kip
Flexure: Mu = 659 ft-kipφMn = 663 ft-kip
Perimeter D = 206 kipL = 45 kip
P = 251 kipPu = 319 kip
8'-0" × 8'-0" × 1'-6" deep10-#6 bars each way
Pallow = 256 kipφPn = 614 kip
One-way shear: Vu = 88.1 kipφVn = 123 kip
Two-way shear: Vu = 289 kipφVn = 302 kip
Flexure: Mu = 222 ft-kipφMn = 230 ft-kip
Corner D = 104 kipL = 23 kip
P = 127 kipPu = 162 kip
6'-0" × 6'-0" × 1'-2" deep7-#5 bars each way
Pallow = 144 kipφPn = 259 kip
One-way shear: Vu = 41.5 kipφVn = 64.9 kip
Two-way shear: Vu = 141 kipφVn = 184 kip
Flexure: Mu = 73.3 ft-kipφMn = 80.2 ft-kip
[Use of the new resistance factors in ACI 318-02 would change these results.]

Chapter 4, Foundation Analysis and Design
4-11
Corner:6'x6'x1'-2" thick
Perimeter:8'x8'x1'-6" thick
Interior:11'x11'x2'-2" thick
Figure 4.1-4 Foundation plan for gravity-load-resisting system.
4.1.3 Design for Moment-Resisting Frame System
Framing Alternate A in Sec. 5.2 of this volume of design examples includes a perimeter moment resistingframe as the seismic-force-resisting system. A framing plan for the system is shown in Figure 4.1-5. Detailed calculations are provided in this section for a combined footing at the corner and focus onoverturning and sliding checks for the eccentrically loaded footing; settlement checks and design ofconcrete sections would be similar to the calculations shown in Sec. 4.1.2. The results for all footingtypes are summarized in Sec. 4.1.3.4.

FEMA 451, NEHRP Recommended Provisions: Design Examples
4-12
5 at
25'
-0"
7 at 25'-0"
N
Figure 4.1-5 Framing plan for moment resisting frame system.
4.1.3.1 Demands
A three-dimensional analysis of the superstructure, in accordance with the requirements for the equivalentlateral force (ELF) procedure, is performed using the RAMFRAME program. Foundation reactions atselected grids are reported in Table 4.1-3.
Table 4.1-3 Demands from Moment-Resisting Frame SystemLocation Load Rx Ry Rz Mxx Myy
A-5 D -203.8L -43.8Ex -13.8 4.6 3.8 53.6 -243.1Ey 0.5 -85.1 -21.3 -1011.5 8.1
A-6 D -103.5L -22.3Ex -14.1 3.7 51.8 47.7 -246.9Ey 0.8 -68.2 281.0 -891.0 13.4
Note: Units are kips and feet. Load Ex is for loads applied toward the east, including appropriately amplifiedcounter-clockwise accidental torsion. Load Ey is for loads applied toward the north, including appropriatelyamplified clockwise accidental torsion.
Sec. 5.2.3.5 of this volume of design examples outlines the design load combinations, which include theredundancy factor as appropriate. Considering two senses of accidental torsion for loading in eachdirection and including orthogonal effects results in a large number of load cases. The detailedcalculations presented here are limited to two primary conditions, both for a combined foundation forcolumns at Grids A-5 and A-6: the downward case (1.4D + 0.5L + 0.32Ex + 1.11Ey) and the upward case

Chapter 4, Foundation Analysis and Design
4-13
(0.7D + 0.32Ex + 1.11Ey). [Because the redundancy factor is changed substantially in the 2003Provisions, the factors in these load combinations would change.]
Before loads can be computed, attention must be given to Provisions Sec. 5.4.5 [5.2.5]. That sectionpermits “foundations of structures . . . to be designed for three-fourths of the foundation overturningdesign moment, Mf.” Because the overturning moment in question is the global overturning moment forthe system, judgment must be used in determining which design actions may be reduced. If the seismic-force-resisting system consists of isolated shear walls, the shear wall overturning moment at the base bestfits that description. For a perimeter moment-resisting frame, most of the global overturning resistance isrelated to axial loads in columns. Therefore, in this example column axial loads (Rz) from load cases Exand Ey will be multiplied by 0.75 and all other load effects will remain unreduced.
4.1.3.2 Downward Case (1.4D + 0.5L + 0.32Ex + 1.11Ey)
In order to perform the overturning checks a footing size must be assumed. Preliminary checks (notshown here) confirmed that isolated footings under single columns were untenable. Check overturningfor a footing that is 10 ft wide by 40 ft long by 5 ft thick. Further, assume that the top of the footing is2 ft below grade (the overlying soil contributes to the resisting moment). (In these calculations the0.2SDSD modifier for vertical accelerations is used for the dead loads applied to the foundation but not forthe weight of the foundation and soil. This is the author’s interpretation of the Provisions. The footingand soil overburden are not subject to the same potential for dynamic amplification as the dead load of thesuperstructure, and it is not common practice to include the vertical acceleration on the weight of thefooting and the overburden. Furthermore, for footings that resist significant overturning, this issue makesa significant difference in design.) Combining the loads from columns at Grids A-5 and A-6 andincluding the weight of the foundation and overlying soil produces the following loads at the foundation-soil interface:
P = applied loads + weight of foundation and soil= 1.4(-203.8 - 103.5) + 0.5(-43.8 - 22.3) +0.75[0.32(3.8 + 51.8) + 1.11(-21.3 + 281)] - 1.2[10(40)(5)(0.15) + 10(40)(2)(0.125)]= -714 kips.
Mxx = direct moments + moment due to eccentricity of applied axial loads= 0.32(53.6 + 47.7) + 1.11(-1011.5 - 891.0) + [1.4(-203.8) + 0.5(-43.8) + 0.75(0.32)(3.8) + 0.75(1.11)(-21.3)](12.5) + [1.4(-103.5) + 0.5(-22.3) + 0.75(0.32)(51.8) + 0.75(1.11)(281)](-12.5)= -7258 ft-kips.
Myy = 0.32(-243.1 - 246.9) + 1.11(8.1 + 13.4)= -133 ft-kips. (The resulting eccentricity is small enough to neglect here, which simplifies the problem considerably.)
Vx = 0.32(-13.8 - 14.1) + 1.11(0.5 + 0.8)= -7.49 kips.
Vy = 0.32(4.6 + 3.7) + 1.11(-85.1 -68.2)= -167.5 kips.
Note that the above load combination does not yield the maximum downward load. Reversing thedirection of the seismic load results in P = -1173 kips and Mxx = 3490 ft-kips. This larger axial load doesnot control the design because the moment is so much less that the resultant is within the kern and nouplift occurs.

FEMA 451, NEHRP Recommended Provisions: Design Examples
4-14
The soil calculations that follow use a different sign convention than that in the analysis results notedabove; compression is positive for the soil calculations. The eccentricity is:
e = |M/P| = 7258/714 = 10.17 ft.
Where e is less than L/2, a solution to the overturning problem exists; however, as e approaches L/2, thebearing pressures increase without bound. Since e is greater than L/6 = 40/6 = 6.67 ft, uplift occurs andthe maximum bearing pressure is:
max2 2(714) 4.84ksf
403 3(10) 10.172 2
PqLB e
= = =⎛ ⎞ ⎛ ⎞− −⎜ ⎟ ⎜ ⎟⎝ ⎠ ⎝ ⎠
and the length of the footing in contact with the soil is:
.403 3 10.17 29.5ft2 2LL e⎛ ⎞ ⎛ ⎞′ = − = − =⎜ ⎟ ⎜ ⎟
⎝ ⎠ ⎝ ⎠
The bearing capacity qc = 3000 B' = 3000 × min(B, L'/2) = 3000 × min(10, 29.5/2) = 30,000 psf = 30 ksf. (L'/2 is used as an adjustment to account for the gradient in the bearing pressure in that dimension.)
The design bearing capacity φqc = 0.6(30 ksf) = 18 ksf > 4.84 ksf. OK
The foundation satisfies overturning and bearing capacity checks. The upward case, which follows, willcontrol the sliding check.
4.1.3.3 Upward Case (0.7D + 0.32Ex + 1.11Ey)
For the upward case the loads are:
P = -346 kipsMxx = -6240 ft-kipsMyy = -133 ft-kips (negligible)Vx = -7.5 kipsVy = -167 kips
The eccentricity is:
e = |M/P| = 6240/346 = 18.0 ft.
Again, e is greater than L/6, so uplift occurs and the maximum bearing pressure is:
max2(346) 11.5ksf
403(10) 18.02
q = =⎛ ⎞−⎜ ⎟⎝ ⎠
and the length of the footing in contact with the soil is:
.403 18.0 6.0ft2
L ⎛ ⎞′ = − =⎜ ⎟⎝ ⎠

Chapter 4, Foundation Analysis and Design
4-15
The bearing capacity qc = 3000 × min(10, 6/2) = 9,000 psf = 9.0 ksf.
The design bearing capacity φqc = 0.6(9.0 ksf) = 5.4 ksf < 11.5 ksf. NG
Using an elastic distribution of soil pressures, the foundation fails the bearing capacity check (although stability is satisfied). Try the plastic distribution. Using this approach, the bearing pressure over theentire contact area is assumed to be equal to the design bearing capacity. In order to satisfy verticalequilibrium, the contact area times the design bearing capacity must equal the applied vertical load P. Because the bearing capacity used in this example is a function of the contact area and the value of Pchanges with the size, the most convenient calculation is iterative.
By iteration, the length of contact area L' = 4.39 ft.
The bearing capacity qc = 3000 × min(10, 4.39) = 13,170 psf = 13.2 ksf. (No adjustment to L' is neededas the pressure is uniform.)
The design bearing capacity φqc = 0.6(13.2 ksf) = 7.92 ksf.
(7.92)(4.39)(10) = 348 kips . 346 kips, so equilibrium is satisfied; the difference is rounded off.
The resisting moment, MR = P (L/2-L'/2) = 346 (40/2 - 4.39/2) = 6160 ft-kip . 6240 ft-kip. OK
Therefore, using a plastic distribution of soil pressures, the foundation satisfies overturning and bearingcapacity checks.
The calculation of demands on concrete sections for strength checks should use the same soil stressdistribution as the overturning check. Using a plastic distribution of soil stresses defines the upper limitof static loads for which the foundation remains stable, but the extreme concentration of soil bearing tendsto drive up shear and flexural demands on the concrete section. It should be noted that the foundationmay remain stable for larger loads if they are applied dynamically; even in that case, the strength demandson the concrete section will not exceed those computed on the basis of the plastic distribution.
For the sliding check, initially consider base traction only. The sliding demand is:
.2 2 2 2( 7.49) ( 167) 167.2kipsx yV V V= + = − + − =
As calculated previously, the total compression force at the bottom of the foundation is 346 kips. Thedesign sliding resistance is:
φVc = φ × friction coefficient × P = 0.8(0.65)(346 kips) = 180 kips > 167.2 kips. OK
If base traction alone had been insufficient, resistance due to passive pressure on the leading face could beincluded. Sec. 4.2.2.2 below illustrates passive pressure calculations for a pile cap.
4.1.3.4 Design Results
The calculations performed in Sec. 4.1.3.2 and 4.1.3.3 are repeated for combined footings at middle andside locations. Figure 4.1-6 shows the results.

FEMA 451, NEHRP Recommended Provisions: Design Examples
4-16
Corner:10'x40'x5'-0" w/top of footing2'-0" below grade
Middle:5'x30'x4'-0"
Side:8'x32'x4'-0"
Figure 4.1-6 Foundation plan for moment-resisting frame system.
Figure 4.1-7 Framing plan for concentrically braced frame system.
One last check of interest is to compare the flexural stiffness of the footing with that of the steel column,which is needed because the steel frame design was based upon flexural restraint at the base of thecolumns. Using an effective moment of inertia of 50 percent of the gross moment of inertia and alsousing the distance between columns as the effective span, the ratio of EI/L for the smallest of thecombined footings is more than five times the EI/h for the steel column. This is satisfactory for thedesign assumption.
4.1.4 Design for Concentrically Braced Frame System

Chapter 4, Foundation Analysis and Design
4-17
Framing Alternate B in Sec. 5.2 of this volume of design examples employs a concentrically braced framesystem at a central core to provide resistance to seismic loads. A framing plan for the system is shown inFigure 4.1-7.
4.1.4.1 Check Mat Size for Overturning
Uplift demands at individual columns are so large that the only practical shallow foundation is one thatties together the entire core. The controlling load combination for overturning has minimum verticalloads (which help to resist overturning), primary overturning effects (Mxx) due to loads applied parallel tothe short side of the core, and smaller moments about a perpendicular axis (Myy) due to orthogonal effects. Assume mat dimensions of 45 ft by 95 ft by 7 ft thick with the top of the mat 3'-6" below grade. Combining the factored loads applied to the mat by all eight columns and including the weight of thefoundation and overlying soil produces the following loads at the foundation-soil interface:
P = -7,849 kipsMxx = -148,439 ft-kipsMyy = -42,544 ft-kipsVx = -765 kipsVy = -2,670 kips
Figure 4.1-8 shows the soil pressures that result from application in this controlling case, depending onthe soil distribution assumed. In both cases the computed uplift is significant. In Part a of the figure thecontact area is shaded. The elastic solution shown in Part b was computed by modeling the mat in RISA3D with compression only soil springs (with the stiffness of edge springs doubled as recommended byBowles). For the elastic solution the average width of the contact area is 11.1 ft and the maximum soilpressure is 16.9 ksf.
The bearing capacity qc = 3000 × min(95, 11.1/2) = 16,650 psf = 16.7 ksf.
The design bearing capacity φqc = 0.6(16.7 ksf) = 10.0 ksf < 16.9 ksf. NG

FEMA 451, NEHRP Recommended Provisions: Design Examples
4-18
(a)Plasticsolution
(b)Elastic solutionpressures (ksf)
0481216
12.2 ksf
~
Figure 4.1-8 Soil pressures for controlling bidirectional case.
As was done in Sec. 4.1.3.3 above, try the plastic distribution. The present solution has an additionalcomplication as the off-axis moment is not negligible. The bearing pressure over the entire contact area isassumed to be equal to the design bearing capacity. In order to satisfy vertical equilibrium, the contactarea times the design bearing capacity must equal the applied vertical load P. The shape of the contactarea is determined by satisfying equilibrium for the off-axis moment. Again the calculations are iterative.
Given the above constraints, the contact area shown in Figure 4.1-8 is determined. The length of thecontact area is 4.46 ft at the left side and 9.10 ft at the right side. The average contact length, for use indetermining the bearing capacity, is (4.46 + 9.10)/2 = 6.78 ft. The distances from the center of the mat tothe centroid of the contact area are
5.42 ft18.98 ft
xy
==
The bearing capacity qc = 3000 × min(95, 6.78) = 20,340 psf = 20.3 ksf.
The design bearing capacity φqc = 0.6(20.3 ksf) = 12.2 ksf.
(12.2)(6.78)(95) = 7,858 kips . 7,849 kips, confirming equilibrium for vertical loads.(7,849)(5.42) = 42,542 ft-kips . 42,544 ft-kips, confirming equilibrium for off-axis moment.
The resisting moment, >148,439 ft-kips. OK, 7849(18.98) 148,974ft-kipsR xxM P y= = =
So, the checks of stability and bearing capacity are satisfied. The mat dimensions are shown in Figure4.1-9.

Chapter 4, Foundation Analysis and Design
4-19
Mat:45'x95'x7'-0"with top of mat3'-6" below grade
Figure 4.1-9 Foundation plan for concentrically braced frame system.
4.1.4.2 Design Mat for Strength Demands
As was previously discussed, the computation of strength demands for the concrete section should use thesame soil pressure distribution as was used to satisfy stability and bearing capacity. Because dozens ofload combinations were considered and “hand calculations” were used for the plastic distribution checks,the effort required would be considerable. The same analysis used to determine elastic bearing pressuresyields the corresponding section demands directly. One approach to this dilemma would be to computean additional factor that must be applied to selected elastic cases to produce section demands that areconsistent with the plastic solution. Rather than provide such calculations here, design of the concretesection will proceed using the results of the elastic analysis. This is conservative for the demand on theconcrete for the same reason that it was unsatisfactory for the soil: the edge soil pressures are high (that is,we are designing the concrete for a peak soil pressure of 16.9 ksf, even though the plastic solution gives12.2 ksf).
[Note that Sec. 7.2.3 of the 2003 Provisions requires consideration of parametric variation for soilproperties where foundations are modeled explicitly. This example does not illustrate such calculations.]
Concrete mats often have multiple layers of reinforcement in each direction at the top and bottom of theirthickness. Use of a uniform spacing for the reinforcement provided in a given direction greatly increasesthe ease of construction. The minimum reinforcement requirements defined in Sec. 10.5 of ACI 318 werediscussed in Sec. 4.1.1.3 above. Although all of the reinforcement provided to satisfy Sec. 7.12 of ACI318 may be provided near one face, for thick mats it is best to compute and provide the amount ofrequired reinforcement separately for the top and bottom halves of the section. Using a bar spacing of 10in. for this 7-ft-thick mat and assuming one or two layers of bars, the section capacities indicate in Table4.1-4 (presented in order of decreasing strength) may be precomputed for use in design. The amount of

FEMA 451, NEHRP Recommended Provisions: Design Examples
4-20
reinforcement provided for marks B, C, and D are less than the basic minimum for flexural members, sothe demands should not exceed three-quarters of the design strength where those reinforcement patternsare used. The amount of steel provided for Mark D is the minimum that satisfies ACI 318 Sec. 7.12.
Table 4.1-4 Mat Foundation Section Capacities
Mark Reinforcement As (in.2 per ft) φMn (ft-kip/ft) 3/4φMn (ft-kip/ft)
A 2 layers of #10 bars at 10 in. o.c.
3.05 899 not used
B 2 layers of #9 bars at 10 in. o.c.
2.40 not used 534
C 2 layers of #8 bars at 10 in. o.c.
1.90 not used 424
D #8 bars at 10 in. o.c.
0.95 not used 215
Note: Where the area of steel provided is less than the minimum reinforcement for flexural members asindicated in ACI 318 Sec. 10.5.1, demands are compared to 3/4 of φMn as permitted in Sec. 10.5.3.
To facilitate rapid design the analysis results are processed in two additional ways. First, the flexural andshear demands computed for the various load combinations are enveloped. Then the enveloped resultsare presented (see Figure 4.1-10) using contours that correspond to the capacities shown for thereinforcement patterns noted in Table 4.1-4.

Chapter 4, Foundation Analysis and Design
4-21
(a)M positivex
CL
(b)M negativex
(c)M positivey
(d)M negativey
CL
CLCL
B
CD B
B
C C DD
B
C
D
B
C
CC B
B +669
+881
BB
BB
C
C
C
D
DD
D
D
D
+884
444+
Figure 4.1-10 Envelope of mat foundation flexural demands.
Using the noted contours permits direct selection of reinforcement. The reinforcement provided within acontour for a given mark must be that indicated for the next higher mark. For instance, all areas withinContour B must have two layers of #10 bars. Note that the reinforcement provided will be symmetricabout the centerline of the mat in both directions. Where the results of finite element analysis are used inthe design of reinforced concrete elements, averaging of demands over short areas is appropriate. InFigure 4.1-11, the selected reinforcement is superimposed on the demand contours. Figure 4.1-12 showsa section of the mat along Gridline C.

FEMA 451, NEHRP Recommended Provisions: Design Examples
4-22
CL CL
(a)E-W bottomreinforcement
(b)E-W topreinforcement
(c)N-S bottomreinforcement
(d)N-S topreinforcement
CLCL
A B A B C D C D
A B
A
B
A
B
8'-4" 3'-4"10'-0" 5'-0" 2'-6"7'-6"
4'-2
"4'
-2"
4'-2
"4'
-2"
Figure 4.1-11 Mat foundation flexural reinforcement.

Chapter 4, Foundation Analysis and Design
4-23
3" clear(typical)
8"8"
Figure 4.1-12 Section of mat foundation.
Figure 4.1-13 presents the envelope of shear demands. The contours used correspond to the designstrengths computed assuming Vs = 0 for one-way and two-way shear. In the hatched areas the shear stressexceeds and in the shaded areas it exceeds . The critical sections for two-way shear (as4 cfφ ′ 2 cfφ ′discussed in Sec. 4.1.1.3 also are shown. The only areas that need more careful attention (to determinewhether they require shear reinforcement) are those where the hatched or shaded areas are outside thecritical sections. At the columns on Gridline D, the hatched area falls outside the critical section, socloser inspection is needed. Because the perimeter of the hatched area is substantially smaller than theperimeter of the critical section for punching shear, the design requirements of ACI 318 are satisfied.
One-way shears at the edges of the mat exceed the criterion. Note that the high shear stresses are2 cfφ ′not produced by loads that create high bearing pressures at the edge. Rather they are produced by loadsthat created large bending stresses parallel to the edge. The distribution of bending moments and shears isnot uniform across the width (or breadth) of the mat, primarily due to the torsion in the seismic loads andthe orthogonal combination. It is also influenced by the doubled spring stiffnesses used to model the soilcondition. However, when the shears are averaged over a width equal to the effective depth (d), thedemands are less than the design strength.
In this design, reinforcement for punching or beam shear is not required. If shear reinforcement cannot beavoided, bars may be used both to chair the upper decks of reinforcement and provide resistance to shearin which case they may be bent thus: .

FEMA 451, NEHRP Recommended Provisions: Design Examples
4-24
(a) Vx
y(b) V
Critical section(typical)
Figure 4.1-13 Critical sections for shear and envelope ofmat foundation shear demands.
4.1.5 COST COMPARISON
Table 4.1-5 provides a summary of the material quantities used for all of the foundations required for thevarious conditions considered. Corresponding preliminary costs are assigned. The gravity-only conditiondoes not represent a realistic case because design for wind loads would require changes to thefoundations; it is provided here for discussion. It is obvious that design for lateral loads adds cost ascompared to a design that neglects such loads. However, it is also worth noting that braced frame systemsusually have substantially more expensive foundation systems than do moment frame systems. Thiscondition occurs for two reasons. First, braced frame systems are stiffer, which produces shorter periodsand higher design forces. Second, braced frame systems tend to concentrate spatially the demands on the

Chapter 4, Foundation Analysis and Design
4-25
foundations. In this case the added cost amounts to about $0.80/ft2, which is an increase of perhaps 4 or 5percent to the cost of the structural system.
Table 4.1-5 Summary of Material Quantities and Cost Comparison
Design Condition Concrete at GravityFoundations
Concrete at LateralFoundations Total Excavation Total Cost
Gravity only(see Figure 4.1-4)
310 cy at $150/cy = $46,500
310 cy at $15/cy = $4,650
$ 51,150
Moment frame(see Figure 4.1-6)
233 cy at $150/cy = $34,950
537 cy at $180/cy = $96,660
800 cy at $15/cy = $12,000
$143,610
Braced frame(see Figure 4.1-9)
233 cy at $150/cy = $34,950
1108 cy at $180/cy = $199,440
1895 cy at $15/cy = $28,425
$262,815

FEMA 451, NEHRP Recommended Provisions: Design Examples
4-26
Figure 4.2-1 Design condition: column of concrete moment resisting framesupported by pile cap and cast-in-place piles.
4.2 DEEP FOUNDATIONS FOR A 12-STORY BUILDING, SEISMIC DESIGNCATEGORY D
This example features the analysis and design of deep foundations for a 12-tory reinforced concretemoment-resisting frame building similar to that described in Chapter 6 of this volume of design examples.
4.2.1 Basic Information
4.2.1.1 Description
Figure 4.2-1 shows the basic design condition considered in this example. A 2×2 pile group is designedfor four conditions: for loads delivered by a corner and a side column of a moment-resisting frame systemfor Site Classes C and E. Geotechnical parameters for the two sites are given in Table 4.2-1.

Chapter 4, Foundation Analysis and Design
4-27
Table 4.2-1 Geotechnical Parameters
Depth Class E Site Class C Site
0 to 3 ft Loose sand/fill
γ = 110 pcfangle of internal friction = 28 degsoil modulus parameter, k = 25 pci
neglect skin frictionneglect end bearing
Loose sand/fill
γ = 110 pcfangle of internal friction = 30 degsoil modulus parameter, k = 50 pci
neglect skin frictionneglect end bearing
3 to 30 ft Soft clay
γ = 110 pcfundrained shear strength = 430 psfsoil modulus parameter, k = 25 pcistrain at 50 percent of maximum stress,
ε50 = 0.01
skin friction (ksf) = 0.3neglect end bearing
Dense sand (one layer: 3 to 100 ft depth)
γ = 130 pcfangle of internal friction = 42 degsoil modulus parameter, k = 125 pci
skin friction (ksf)* = 0.3 + 0.03/ft # 2end bearing (ksf)* = 65 + 0.6/ft # 150
30 to 100 ft Medium dense sand
γ = 120 pcfangle of internal friction = 36 degsoil modulus parameter, k = 50 pci
skin friction (ksf)* = 0.9 + 0.025/ft # 2end bearing (ksf)* = 40 + 0.5/ft # 100
Pile capresistance
300 pcf, ultimate passive pressure 575 pcf, ultimate passive pressure
Resistance factor for capacity checks (φ) = 0.75.Safety factor for settlement checks = 2.5.
[In the 2003 Provisions, φ factors forcohesive and cohesionless soils areexplicitly defined; for vertical, lateral androcking resistance, the values would be 0.8for the clay layer and 0.7 for the sandlayers.]
*Skin friction and end bearing values increase (up to the maximum value noted) for each additional foot of depthbelow the top of the layer. (The values noted assume a minimum pile length of 20 ft.)
The structural material properties assumed for this example are as follows:
f'c = 3,000 psify = 60,000 psi
4.2.1.2 Provisions Parameters
Site Class = C and E (both conditions considered in this example)SDS = 0.9Seismic Design Category = D (for both conditions)

FEMA 451, NEHRP Recommended Provisions: Design Examples
4-28
4.2.1.3 Demands
The unfactored demands from the moment frame system are shown in Table 4.2-2.
Table 4.2-2 Gravity and Seismic Demands
Location Load Rx Ry Rz Mxx Myy
Corner D -351.0
L -36.0
Vx 40.7 0.6 142.5 4.8 439.0
Vy 0.8 46.9 305.6 489.0 7.0
ATx 1.2 2.6 12.0 27.4 12.9
ATy 3.1 6.7 31.9 70.2 33.0
Side D -702.0
L -72.0
Vx 29.1 0.5 163.4 3.5 276.6
Vy 0.8 59.3 18.9 567.4 6.5
ATx 0.1 3.3 8.7 31.6 1.3
ATy 0.4 8.4 22.2 80.8 3.4Note: Units are kips and feet. Load Vx is for loads applied toward the east. ATx is the correspondingaccidental torsion case. Load Vy is for loads applied toward the north. ATy is the corresponding accidentaltorsion case.
Using ASCE 7 Load Combinations 5 and 7, E as defined in Provisions Sec. 5.2.7 [4.2.2] (with 0.2SDSD =0.18D and taking ρ = 1.0), considering orthogonal effects as required for Seismic Design Category D, andincluding accidental torsion, the following 32 load conditions must be considered. [Although theredundancy factor is changed substantially in the 2003 Provisions, it is expected that this system wouldstill satisfy the conditions needed for ρ = 1.0, so these load combinations would not change.]
1.38D + 0.5L ± 1.0Vx ± 0.3Vy ± max(1.0ATx, 0.3ATy)1.38D + 0.5L ± 0.3Vx ± 1.0Vy ± max(0.3ATx, 1.0ATy)0.72D ± 1.0Vx ± 0.3Vy ± max(1.0ATx, 0.3ATy)0.72D ± 0.3Vx ± 1.0Vy ± max(0.3ATx, 1.0ATy)
4.2.1.4 Design Approach
For typical deep foundation systems resistance to lateral loads is provided by both piles and pile cap. Figure 4.2-2 shows a simple idealization of this condition. The relative contributions of these piles andpile cap depend on the particular design conditions, but often both effects are significant. Resistance tovertical loads is assumed to be provided by the piles alone regardless of whether their axial capacity isprimarily due to end bearing, skin friction, or both. Although the behavior of foundation andsuperstructure are closely related, they typically are modeled independently. Earthquake loads areapplied to a model of the superstructure, which is assumed to have fixed supports. Then the supportreactions are seen as demands on the foundation system. A similar substructure technique is usuallyapplied to the foundation system itself, whereby the behavior of pile cap and piles are consideredseparately. This section describes that typical approach.

Chapter 4, Foundation Analysis and Design
4-29
Passive resistance(see Figure 4.2-5)
p-y springs(see Figure 4.2-4)
Pilecap
Pile
Figure 4.2-2 Schematic model of deep foundation system.
Pgroup
PpPp
+=
Pgroup
PotPot
M
Mgroup
Vgroup
Mgroup
Vgroup
Vpassive
M
VO
Figure 4.2-3 Pile cap free body diagram.
4.2.1.4.1 Pile Group Mechanics
With reference to the free body diagram (of a 2×2 pile group) shown in Figure 4.2-3, demands onindividual piles as a result of loads applied to the group may be determined as follows:
and M = V × R, where R is a characteristic length determined from analysis of a4
group passiveV VV
−=
laterally loaded single pile.
, where s is the pile spacing, h is the height of the pile cap,4
2group group p passive
otV h M M h V
Ps
+ + −=
and hp is the height of Vpassive above Point O.
and P = Pot + Pp4group
pP
P =
FEMA 451, NEHRP Recommended Provisions: Design Examples
4-30
Site Class E, depth = 10 ftSite Class E, depth = 30 ftSite Class C, depth = 10 ftSite Class C, depth = 30 ft
0.01
Soil
resi
stan
ce, p
(lb/
in.)
10
100
1,000
10,000
0.2 0.1 0.3 Pile deflection, y (in.)
0.4 0.5 0.6
0.7
100,000
0.90.8 1.0
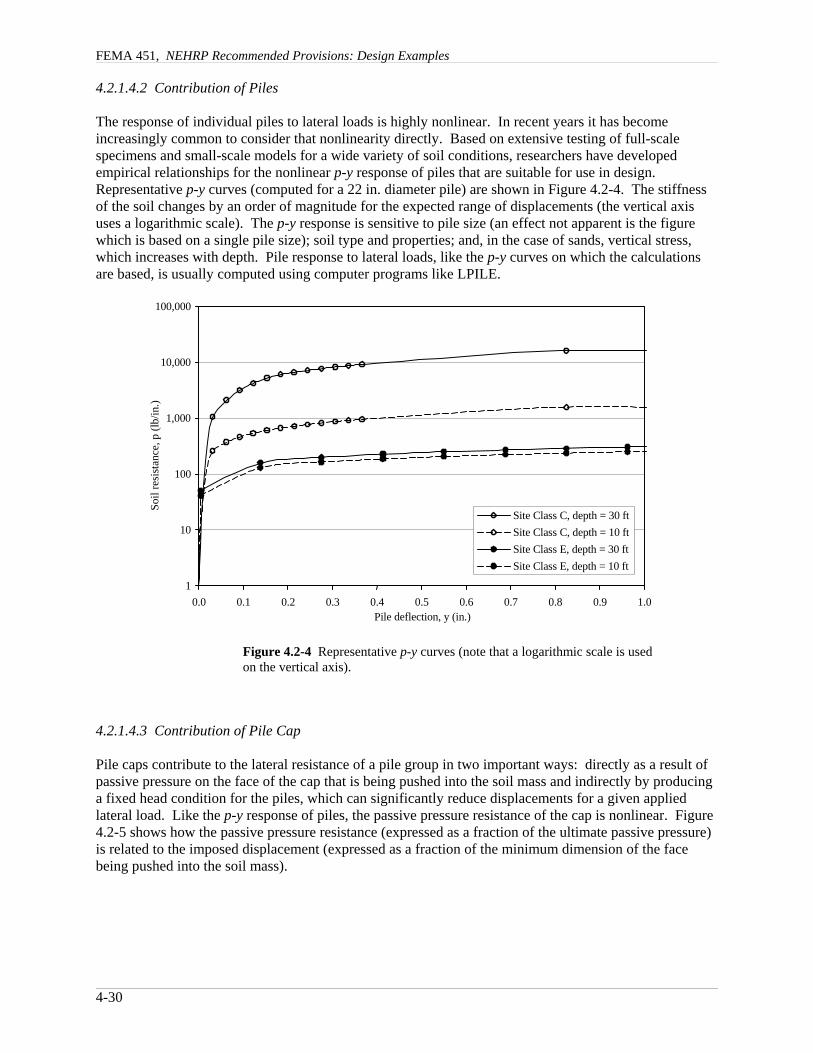
Figure 4.2-4 Representative p-y curves (note that a logarithmic scale is usedon the vertical axis).
4.2.1.4.2 Contribution of Piles
The response of individual piles to lateral loads is highly nonlinear. In recent years it has becomeincreasingly common to consider that nonlinearity directly. Based on extensive testing of full-scalespecimens and small-scale models for a wide variety of soil conditions, researchers have developedempirical relationships for the nonlinear p-y response of piles that are suitable for use in design. Representative p-y curves (computed for a 22 in. diameter pile) are shown in Figure 4.2-4. The stiffnessof the soil changes by an order of magnitude for the expected range of displacements (the vertical axisuses a logarithmic scale). The p-y response is sensitive to pile size (an effect not apparent is the figurewhich is based on a single pile size); soil type and properties; and, in the case of sands, vertical stress,which increases with depth. Pile response to lateral loads, like the p-y curves on which the calculationsare based, is usually computed using computer programs like LPILE.
4.2.1.4.3 Contribution of Pile Cap
Pile caps contribute to the lateral resistance of a pile group in two important ways: directly as a result ofpassive pressure on the face of the cap that is being pushed into the soil mass and indirectly by producinga fixed head condition for the piles, which can significantly reduce displacements for a given appliedlateral load. Like the p-y response of piles, the passive pressure resistance of the cap is nonlinear. Figure4.2-5 shows how the passive pressure resistance (expressed as a fraction of the ultimate passive pressure)is related to the imposed displacement (expressed as a fraction of the minimum dimension of the facebeing pushed into the soil mass).

Chapter 4, Foundation Analysis and Design
4-31
0.05
0.6
0.2
0
0.1
0.00.01
P/P ul
t
0.5
0.4
0.3
1.0
0.9
0.8
0.7
0.03 0.02 0.04δ/H
0.06
Figure 4.2-5 Passive pressure mobilization curve (after FEMA 356).
4.2.1.4.4 Group Effect Factors
The response of a group of piles to lateral loading will differ from that of a single pile due to pile-soil-pileinteraction. (Group effect factors for axial loading of very closely spaced piles may also be developed,but are beyond the scope of the present discussion.) A useful discussion of this “group effect” may befound in PoLam Sec. 2.6.4, from which the following observations are taken:
The pile group effect has been a popular research topic within the geotechnical community foralmost 50 years. At present, there is no common consensus on the approach for group effects. Full-size and model tests by a number of authors show that in general, the lateral capacity of a pilein a pile group versus that of a single pile (termed “efficiency”) is reduced as the pile spacing isreduced. . . .
[The experimental research reported in Brown 1987, Brown 1988, and other publications] . . .yielded information that largely corroborated each other on the following aspects:
(1) Most of these experiments first used the single pile data to verify the validity of the widely usedReese’s and Matlock’s benchmark p-y criteria and all concluded that the Reese and Matlock p-y criteriaprovide reasonable solutions.
(2) The observed group effects appeared to be associated with shadowing effects and the variousresearchers found relatively consistent pile group behavior in that the leading piles would be loaded moreheavily than the trailing piles when all piles are loaded to the same deflection. ... All referenced researchersrecommended to modify the single pile p-y curves by adjusting the resistance value on the single pile p-ycurves (i.e. p-multiplier). . . .
The experiments reported by McVay also included data for pile center-to-center spacing of 5Dwhich showed p-multipliers of 1.0, 0.85, and 0.7 for the front, middle and back row piles,respectively. For such multipliers, the group stiffness efficiency would be about 95% and groupeffects would be practically negligible.
FEMA 451, NEHRP Recommended Provisions: Design Examples
4-32
The basis of the calculation procedure for group effect factors that is shown below is described in Chapter6 of GROUP. In these expressions, D is the pile diameter and s is the center-to-center spacing betweenthe piles in question. In the equation for each efficiency factor, where s/D equals or exceeds the notedupper limit, the corresponding value of β is 1.0.
For piles that are side by side with respect to the applied load, a factor to reflect the reduction inefficiency, βa, may be calculated as:
.0.5659
0.5292 for 1 3.28as sD D
β ⎛ ⎞= ≤ <⎜ ⎟⎝ ⎠
For piles that are in-line with respect to the applied load, a factor to reflect the reduction in efficiency (βb)may be calculated as follows:
Leading piles: .0.2579
0.7309 for 1 3.37bLs sD D
β ⎛ ⎞= ≤ <⎜ ⎟⎝ ⎠
Trailing piles: .0.3251
0.5791 for 1 5.37bTs sD D
β ⎛ ⎞= ≤ <⎜ ⎟⎝ ⎠
For piles that are skewed (neither in line nor side by side) with respect to the applied load, a factor toreflect the reduction in efficiency (βs) may be calculated as:
2 2 2 2cos sins a bβ β θ β θ= +
where βa and βb are calculated as defined above using s equal to the center-to-center distance along theskew and setting θ equal to the angle between the direction of loading and a line connecting the two piles.
If a group contains more than two piles, the effect of each pile on each other pile must be considered. Ifthe effect of pile j on pile i is called βji and it is noted that βji = 1.0 when j = i (as this is a single pilecondition), the p-reduction factor for any given pile i is
.1
n
mi jij
f β=
= ∏
Because the direction of loading varies during an earthquake and the overall efficiency of the group is theprimary point of interest, the average efficiency factor is commonly used for all members of a group inthe analysis of any given member. In that case, the average p-reduction factor is:
.1 1
1 nn
m jii j
fn
β= =
= ∑∏
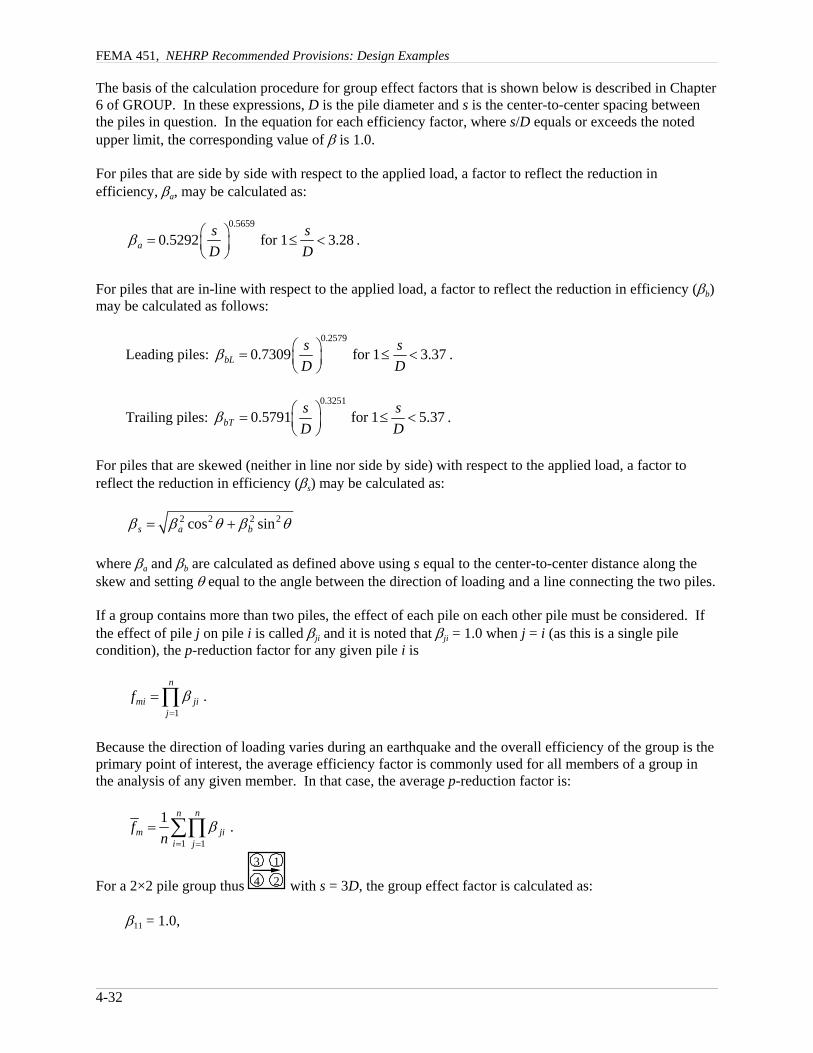
For a 2×2 pile group thus with s = 3D, the group effect factor is calculated as:
3 14 2
β11 = 1.0,

Chapter 4, Foundation Analysis and Design
4-33
1
0.0
0.2
2
Gro
up e
ffec
t fac
tor
0.4
0.6
0.8
1.0
5 3Group size (piles per side)
4
s = 1.5 D
s = 2 D
s = 3 D
s = 4 D
Figure 4.2-6 Calculated group effect factors.
,0.5659
2130.5292 1.0 0.9851a bβ β β ⎛ ⎞= = × =⎜ ⎟
⎝ ⎠
, and0.2579
3131.0 0.7309 0.9701a bβ β β ⎛ ⎞= = × =⎜ ⎟
⎝ ⎠
β41 = βa βb = (1.0)(1.0) = 1.0 (because s/D = 4.24).
Thus, fm1 = β11 × β21 × β31 × β41 = (1.00)(0.985)(0.970)(1.00) = 0.955 . 0.96.
By similar calculations, fm2 = 0.96, fm3 = 0.79, and fm4 = 0.79.
And finally, .0.96 0.96 0.79 0.79 0.874mf
+ + += =
Figure 4.2-6 shows the group effect factors that are calculated for square pile groups of various sizes withpiles at several different spacings.
4.2.2 Pile Analysis, Design, and Detailing
4.2.2.1 Pile Analysis
For this design example it is assumed that all piles will be fixed-head, 22-in.-diameter, cast-in-place pilesarranged in 2×2 pile groups with piles spaced at 66 inches center-to-center. The computer programLPILE Plus 3.0 is used to analyze single piles for both soil conditions shown in Table 4.2-1 assuming a

FEMA 451, NEHRP Recommended Provisions: Design Examples
4-34
30
25
20
15
10
5
0
-5 0 5 10 15Shear, V (kip)
Dep
th (f
t)
Site Class C
Site Class E
Figure 4.2-7 Results of pile analysis – shear versus depth (applied lateral load is 15 kips).
30
25
20
15
10
5
0
-1000 -500 0 500Moment, M (in.-kips)
Dep
th (f
t)
Site Class C
Site Class E
Figure 4.2-8 Results of pile analysis – moment versusdepth (applied lateral load is 15 kips).
length of 50 ft. Pile flexural stiffness is modeled using one-half of the gross moment of inertia because ofexpected flexural cracking. The response to lateral loads is affected to some degree by the coincidentaxial load. The full range of expected axial loads was considered in developing this example, but in thiscase the lateral displacements, moments, and shears were not strongly affected; the plots in this sectionare for zero axial load. A p-multiplier of 0.87 for group effects (as computed at the end of Sec. 4.2.1.4) isused in all cases. Figures 4.2-7, 4.2-8, and 4.2-9 show the variation of shear, moment, and displacementwith depth (within the top 30 ft) for an applied lateral load of 15 kips on a single pile with the groupreduction factor. It is apparent that the extension of piles to depths beyond 30 ft for the Class E site (orabout 25 ft for the Class C site) does not provide additional resistance to lateral loading; piles shorter thanthose lengths would have reduced lateral resistance. The trends in the figures are those that should beexpected. The shear and displacement are maxima at the pile head. Because a fixed-head condition isassumed, moments are also largest at the top of the pile. Moments and displacements are larger for thesoft soil condition than for the firm soil condition.

Chapter 4, Foundation Analysis and Design
4-35
30
25
20
15
10
5
0
-0.1 0.0 0.1 0.2 0.3Displacement (in.)
Dep
th (f
t)
Site Class C
Site Class E
Figure 4.2-9 Results of pile analysis – displacementversus depth (applied lateral load is 15 kips)
The analyses performed to develop Figures 4.2-7 through 4.2-9 are repeated for different levels of appliedlateral load. Figures 4.2-10 and 4.2-11 show how the moment and displacement at the head of the pile arerelated to the applied lateral load. It may be seen from Figure 4.2-10 that the head moment is related tothe applied lateral load in a nearly linear manner; this is a key observation. Based on the results shown,the slope of the line may be taken as a characteristic length that relates head moment to applied load. Doing so produces the following:
R = 46 in. for the Class C siteR = 70 in. for the Class E site

FEMA 451, NEHRP Recommended Provisions: Design Examples
4-36
00 5 20 25
Applied lateral load, V (kip)
Hea
d m
omen
t, M
(in-
kip)
Site Class C
Site Class E
10 15 30
400
800
1200
1600
Figure 4.2-10 Results of pile analysis – appliedlateral load versus head moment.
Site Class C
Site Class E
0.00
0.2 0.4 0.6 0.8Head displacement, ∆ (inch)
App
lied
late
ral l
oad,
V (k
ip)
5
10
15
20
25
30
Figure 4.2-11 Results of pile analysis –head displacement versus applied lateralload.
A similar examination of Figure 4.2-11 leads to another meaningful insight. The load-displacementresponse of the pile in Site Class C soil is essentially linear. The response of the pile in Site Class E soilis somewhat nonlinear, but for most of the range of response a linear approximation is reasonable (anduseful). Thus, the effective stiffness of each individual pile is:
k = 175 kip/in. for the Class C sitek = 40 kip/in. for the Class E site
4.2.2.2 Pile Group Analysis
The combined response of the piles and pile cap and the resulting strength demands for piles arecomputed using the procedure outlined in Sec. 4.2.1.4 for each of the 32 load combinations discussed inSec. 4.2.1.3. Assume that each 2×2 pile group has a 9'-2" × 9'-2" × 4'-0" thick pile cap that is placed 1'-6"below grade.
Check the Maximum Compression Case under a Side Column in Site Class C
Using the sign convention shown in Figure 4.2-3, the demands on the group are:
P = 1097 kipMyy = 93 ft-kipsVx = 10 kipsMyy = 659 ft-kipsVy = 69 kips
From preliminary checks, assume that the displacements in the x and y directions are sufficient tomobilize 15 percent and 30 percent, respectively, of the ultimate passive pressure:
( )1, 1000
18 48 48 1100.15(575) 11.0kips12 2(12) 12 12passive xV
⎛ ⎞⎛ ⎞⎛ ⎞= + =⎜ ⎟⎜ ⎟⎜ ⎟⎝ ⎠⎝ ⎠⎝ ⎠
and
( )1, 1000
18 48 48 1100.30(575) 22.1kips12 2(12) 12 12passive yV
⎛ ⎞⎛ ⎞⎛ ⎞= + =⎜ ⎟⎜ ⎟⎜ ⎟⎝ ⎠⎝ ⎠⎝ ⎠
Chapter 4, Foundation Analysis and Design
4-37
and conservatively take hp = h/3 = 16 in.
Since Vpassive,x > Vx, passive resistance alone is sufficient for this case in the x direction. However, in orderto illustrate the full complexity of the calculations, reduce Vpassive,x to 4 kips and assign a shear of 1.5 kipsto each pile in the x direction. In the y direction the shear in each pile is:
.69 22.1 11.7 kips4
V −= =
The corresponding pile moments are:
M = 1.5(46) = 69 in.-kips for x-direction loading
and
M = 11.7(46) = 538 in.-kips for y-direction loading.
The maximum axial load due to overturning for x-direction loading is:
10(48) 93(12) 4(69) 16(4) 13.7 kips2(66)otP + + −
= =
and for y-direction loading (determined similarly) Pot = 98.6 kips.
The axial load due to direct loading is Pp = 1097/4 = 274 kips.
Therefore the maximum load effects on the most heavily loaded pile are:
Pu = 13.7 + 98.6 + 274 = 386 kips
.2 2(69) (538) 542in.-kipsuM = + =
The expected displacement in the y direction is computed as:
δ = V/k = 11.7/175 = 0.067 in., which is 0.14% of the pile cap height (h).
Reading Figure 4.2-5 with δ/H = 0.0014, P/Pult . 0.34, so the assumption that 30 percent of Pult would bemobilized was reasonable.
4.2.2.3 Design of Pile Section
The calculations shown in Sec. 4.2.2.2 are repeated for each of the 32 load combinations under each ofthe four design conditions. The results are shown in Figures 4.2-12 and 4.2-13. In these figures, circlesindicate demands on piles under side columns and squares indicate demands on piles under cornercolumns. Also plotted are the φP-φM design strengths for the 22-in.-diameter pile sections with variousamounts of reinforcement (as noted in the legends). The appropriate reinforcement pattern for eachdesign condition may be selected by noting the innermost capacity curve that envelops the correspondingdemand points. The required reinforcement is summarized in Table 4.2-4, following calculation of therequired pile length.

FEMA 451, NEHRP Recommended Provisions: Design Examples
4-38
-300
-200
-100
0
100
200
300
400
500
600
700
800
0 500 1000 1500 2000 2500
Moment, M (in-kip)
Axi
al lo
ad, P
(kip
)8-#78-#66-#66-#5SideCorner
Figure 4.2-12 P-M interaction diagram for Site Class C.
-300
-200
-100
0
100
200
300
400
500
600
700
800
0 500 1000 1500 2000 2500
Moment, M (in-kip)
Axi
al L
oad,
P (k
ip)
8-#78-#66-#66-#5SideCorner
Figure 4.2-13 P-M interaction diagram for Site Class E.

Chapter 4, Foundation Analysis and Design
4-39
4.2.2.4 Pile Length for Axial Loads
For the calculations that follow, recall that skin friction and end bearing are neglected for the top threefeet in this example. (In these calculations, the pile cap depth is ignored – effectively assuming that pilesbegin at the ground surface. Because the soil capacity increases with depth and the resulting pile lengthsare applied below the bottom of the pile cap, the results are slightly conservative.)
4.2.2.4.1 Length for Settlement
Service loads per pile are calculated as P = (PD + PL)/4.
Check pile group under side column in Site Class C, assuming L = 47 ft:
P = (702 + 72)/4 = 194 kips.
Pskin = average friction capacity × pile perimeter × pile length for friction = 0.5[0.3 + 0.3 + 44(0.03)]π(22/12)(44) = 243 kips.
Pend = end bearing capacity at depth × end bearing area= [65 + 44(0.6)](π/4)(22/12)2 = 241 kips.
Pallow = (Pskin + Pend)/S.F. = (243 + 241)/2.5 = 194 kips = 194 kips (demand). OK
Check pile group under corner column in Site Class E, assuming L = 43 ft:
P = (351 + 36)/4 = 97 kips.
Pskin = [friction capacity in first layer + average friction capacity in second layer] × pile perimeter = [27(0.3) + (13/2)(0.9 + 0.9 + 13[0.025])]π(22/12) = 126 kips.
Pend = [40 + 13(0.5)](π/4)(22/12)2 = 123 kips.
Pallow = (126 + 123)/2.5 = 100 kips > 97 kips. OK
4.2.2.4.2 Length for Compression Capacity
All of the strength-level load combinations (discussed in Sec. 4.2.1.3) must be considered.
Check pile group under side column in Site Class C, assuming L = 50 ft:
As seen in Figure 4.1-12, the maximum compression demand for this condition is Pu = 390 kips.
Pskin = 0.5[0.3 + 0.3 + 47(0.03)]π(22/12)(47) = 272 kips.
Pend = [65 + 47(0.6)](π/4)(22/12)2 = 246 kips.
φPn = φ(Pskin + Pend) = 0.75(272 + 246) = 389 kips . 390 kips. OK
Check pile group under corner column in Site Class E, assuming L = 64 ft:
As seen in Figure 4.2-13, the maximum compression demand for this condition is Pu = 340 kips.

FEMA 451, NEHRP Recommended Provisions: Design Examples
4-40
Pskin = [27(0.3) + (34/2)(0.9 + 0.9 + 34[0.025])]π(22/12) = 306 kips.
Pend = [40 + 34(0.5)](π/4)(22/12)2 = 150 kips.
φPn = φ(Pskin + Pend) = 0.75(306 + 150) = 342 kips > 340 kips. OK
4.2.2.4.3 Length for Uplift Capacity
Again, all of the strength-level load combinations (discussed in Sec. 4.2.1.3) must be considered.
Check pile group under side column in Site Class C, assuming L = 5 ft:
As seen in Figure 4.2-12, the maximum tension demand for this condition is Pu = -1.9 kips.
Pskin = 0.5[0.3 + 0.3 + 2(0.03)]π(22/12)(2) = 3.8 kips.
φPn = φ(Pskin) = 0.75(3.8) = 2.9 kips > 1.9 kips. OK
Check pile group under corner column in Site Class E, assuming L = 52 ft.
As seen in Figure 4.2-13, the maximum tension demand for this condition is Pu = -144 kips.
Pskin = [27(0.3) + (22/2)(0.9 + 0.9 + 22[0.025])]π(22/12) = 196 kips.
φPn = φ(Pskin) = 0.75(196) = 147 kips > 144 kips. OK
4.2.2.4.4 Graphical Method of Selecting Pile Length
In the calculations shown above, the adequacy of the soil-pile interface to resist applied loads is checkedonce a pile length is assumed. It would be possible to generate mathematical expressions of pile capacityas a function of pile length and then solve such expressions for the demand conditions. However, a morepractical design approach is to precalculate the capacity for piles for the full range of practical lengths andthen select the length needed to satisfy the demands. This method lends itself to graphical expression asshown in Figures 4.2-14 and 4.2-15.

Chapter 4, Foundation Analysis and Design
4-41
80
70
60
50
40
30
20
10
0
0 100 200 300 400 500 600 700
Design resistance (kip)
Pile
dep
th (f
t)
CompressionTension
Figure 4.2-14 Pile axial capacity as a function of length for Site Class C.
80
70
60
50
40
30
20
10
0
0 100 200 300 400 500 600 700
Design resistance (kip)
Pile
dep
th (f
t)
CompressionTension
Figure 4.2-15 Pile axial capacity as a function of length for Site Class E.
4.2.2.4.5 Results of Pile Length Calculations

FEMA 451, NEHRP Recommended Provisions: Design Examples
4-42
Detailed calculations for the required pile lengths are provided above for two of the design conditions. Table 4.2-3 summarizes the lengths required to satisfy strength and serviceability requirements for allfour design conditions.
Table 4.2-3 Pile Lengths Required for Axial Loads
Piles Under Corner Column Piles Under Side Column
Condition Load Min Length Condition Load Min Length
Site Class C
Compression 331 kip 43 ft Compression 390 kip 50 ft
Uplift 133 kip 40 ft Uplift 1.9 kip 5 ft
Settlement 97 kip 19 ft Settlement 194 kip 47 ft
Site Class E
Compression 340 kip 64 ft Compression 400 kip 71 ft
Uplift 144 kip 52 ft Uplift 14.7 kip 14 ft
Settlement 97 kip 43 ft Settlement 194 kip 67 ft
4.2.2.5 Design Results
The design results for all four pile conditions are shown in Table 4.2-4. The amount of longitudinalreinforcement indicated in the table is that required at the pile-pile cap interface and may be reduced atdepth as discussed in the following section.
Table 4.2-4 Summary of Pile Size, Length, and Longitudinal Reinforcement
Piles Under Corner Column Piles Under Side Column
Site Class C22 in. diameter by 43 ft long 22 in. diameter by 50 ft long
8-#6 bars 6-#5 bars
Site Class E22 in. diameter by 64 ft long 22 in. diameter by 71 ft long
8-#7 bars 6-#6 bars
4.2.2.6 Pile Detailing
Provisions Sec. 7.4.4 and 7.5.4, respectively, contain special pile requirements for structures assigned toSeismic Design Category C or higher and D or higher. In this section, those general requirements and thespecific requirements for uncased concrete piles that apply to this example are discussed. Although thespecifics are affected by the soil properties and assigned site class, the detailing of the piles designed inthis example focuses on consideration of the following fundamental items:
1. All pile reinforcement must be developed in the pile cap (Provisions Sec. 7.4.4).
2. In areas of the pile where yielding might be expected or demands are large, longitudinal andtransverse reinforcement must satisfy specific requirements related to minimum amount andmaximum spacing.
3. Continuous longitudinal reinforcement must be provided over the entire length resisting designtension forces (ACI 318 Sec. 21.8.4.2 [21.10.4.2]).

Chapter 4, Foundation Analysis and Design
4-43
The discussion that follows refers to the detailing shown in Figures 4.2-16 and 4.2-17.4.2.2.6.1 Development at the Pile Cap
Where neither uplift nor flexural restraint are required, the development length is the full developmentlength for compression (Provisions Sec. 7.4.4). Where the design relies on head fixity or whereresistance to uplift forces is required (both of which are true in this example), pile reinforcement must befully developed in tension unless the section satisfies the overstrength load condition or demands arelimited by the uplift capacity of the soil-pile interface (Provisions Sec. 7.5.4). For both site classesconsidered in this example, the pile longitudinal reinforcement is extended straight into the pile cap adistance that is sufficient to fully develop the tensile capacity of the bars. In addition to satisfying therequirements of the Provisions, this approach offers two advantages. By avoiding lap splices to field-placed dowels where yielding is expected near the pile head (although such would be permitted byProvisions Sec. 7.4.4), more desirable inelastic performance would be expected. Straight development,while it may require a thicker pile cap, permits easier placement of the pile cap’s bottom reinforcementfollowed by the addition of the spiral reinforcement within the pile cap. Note that embedment of theentire pile in the pile cap facilitates direct transfer of shear from pile cap to pile, but is not a requirementof the Provisions.

FEMA 451, NEHRP Recommended Provisions: Design Examples
4-44
(4) #5
#4 spiral at9 inch pitch
(6) #5
#4 spiral at9 inch pitch
(6) #5
#4 spiral at4.5 inch pitch
4" pile embedment
Section A
Section B
Section CC
B
A
21'-0
"23
'-0"
6'-4
"
Figure 4.2-16 Pile detailing for Site Class C (under side column).

Chapter 4, Foundation Analysis and Design
4-45
(4) #7
#4 spiral at9 inch pitch
(6) #7
#5 spiral at3.5 inch pitch
(8) #7
#5 spiral at3.5 inch pitch
4" pile embedment
Section A
Section B
Section C
C
B
A
32'-0
"20
'-0"
12'-4
"
Figure 4.2-17 Pile detailing for Site Class E (under corner column).

FEMA 451, NEHRP Recommended Provisions: Design Examples
4-46
4.2.2.6.2 Longitudinal and Transverse Reinforcement Where Demands Are Large
Requirements for longitudinal and transverse reinforcement apply over the entire length of pile wheredemands are large. For uncased concrete piles in Seismic Design Category D at least four longitudinalbars (with a minimum reinforcement ratio of 0.005) must be provided over the largest region defined asfollows: the top one-half of the pile length, the top 10 ft below the ground, or the flexural length of thepile. The flexural length is taken as the length of pile from the cap to the lowest point where 0.4 times theconcrete section cracking moment (see ACI 318 Sec. 9.5.2.3) exceeds the calculated flexural demand atthat point. [A change made in Sec. 7.4.4.1 of the 2003 Provisions makes it clear that the longitudinalreinforcement must be developed beyond this point.] For the piles used in this example, one-half of thepile length governs. (Note that “providing” a given reinforcement ratio means that the reinforcement inquestion must be developed at that point. Bar development and cutoff are discussed in more detail inChapter 6 of this volume of design examples.) Transverse reinforcement must be provided over the samelength for which minimum longitudinal reinforcement requirements apply. Because the piles designed inthis example are larger than 20 in. in diameter, the transverse reinforcement may not be smaller than 0.5in. diameter. For the piles shown in Figures 4.2-16 and 4.2-17 the spacing of the transverse reinforcementin the top half of the pile length may not exceed the least of: 12db (7.5 in. for #5 longitudinal bars and10.5 in. for #7 longitudinal bars), 22/2 = 11 in., or 12 in.
Where yielding may be expected, even more stringent detailing is required. For the Class C site, yieldingcan be expected within three diameters of the bottom of the pile cap (3D = 3 × 22 = 66 in.). Spiralreinforcement in that region must not be less than one-half of that required in ASCE 318 Sec. 21.4.4.1(a)of ACI 318 (since the site is not Class E, F, or liquefiable) and the requirements of Sec. 21.4.4.2 and21.4.4.3 must be satisfied. Note that Sec. 21.4.4.1(a) refers to Eq. (10-6) [10-5], which often will govern. In this case, the minimum volumetric ratio of spiral reinforcement is one-half that determined using ACI318 Eq. (10-6) [10-5]. In order to provide a reinforcement ratio of 0.01 for this pile section, a #4 spiralmust have a pitch of no more than 4.8 in., but the maximum spacing permitted by Sec. 21.4.4.2 is 22/4 =5.5 in. or 6db = 3.75 in., so a #4 spiral at 3.75 in. pitch is used.
For the Class E site, the more stringent detailing must be provided “within seven diameters of the pile capand of the interfaces between strata that are hard or stiff and strata that are liquefiable or are composed ofsoft to medium-stiff clay” (Provisions Sec. 7.5.4). The author interprets “within seven diameters of . . .the interface” as applying in the direction into the softer material, which is consistent with the expectedlocation of yielding. Using that interpretation, the Provisions does not indicate the extent of suchdetailing into the firmer material. Taking into account the soil layering shown in Table 4.2-1 and the pilecap depth and thickness, the tightly spaced transverse reinforcement shown in Figure 4.2-17 is providedwithin 7D of the bottom of pile cap and top of firm soil and is extended a little more than 3D into the firmsoil. Because the site is Class E, the full amount of reinforcement indicated in ACI 318 Sec. 21.4.4.1must be provided. In order to provide a reinforcement ratio of 0.02 for this pile section, a #5 spiral musthave a pitch of no more than 3.7 in. The maximum spacing permitted by Sec. 21.4.4.2 is 22/4 = 5.5 in. or6db = 5.25 in., so a #5 spiral at 3.5 in. pitch is used.
4.2.2.6.3 Continuous Longitudinal Reinforcement for Tension
Table 4.2-3 shows the pile lengths required for resistance to uplift demands. For the Site Class Econdition under a corner column (Figure 4.2-17), longitudinal reinforcement must resist tension for atleast the top 52 ft (being developed at that point). Extending four longitudinal bars for the full length andproviding widely spaced spirals at such bars reflect the designer’s judgment (not specific requirements ofthe Provisions). For the Site Class C condition under a side column (Figure 4.2-16), design tension dueto uplift extends only about 5 ft below the bottom of the pile cap. Therefore, a design with Section C ofFigure 4.2-16 being unreinforced would satisfy the Provisions requirements, but the author has decided toextend very light longitudinal and nominal transverse reinforcement for the full length of the pile.

Chapter 4, Foundation Analysis and Design
4-47
(2) #6 top bars
(3) #6 bottom bars
#4 ties at 7" o.c.
2" clearat sides
3" clear attop and bottom
Figure 4.2-18 Foundation tie section.
4.2.3 Other Considerations
4.2.3.1 Foundation Tie Design and Detailing
Provisions Sec. 7.4.3 requires that individual pile caps be connected by ties. Such ties are often gradebeams, but the Provisions would permit use of a slab (thickened or not) or calculations that demonstratethat the site soils (assigned to Site Class A, B, or C) provide equivalent restraint. For this example, a tiebeam between the pile caps under a corner column and a side column will be designed. The resultingsection is shown in Figure 4.2-18.
For pile caps with an assumed center-to-center spacing of 32 ft in each direction, and given Pgroup = 1121kips under a side column and Pgroup = 812 kips under a corner column, the tie is designed as follows.
As indicated in Provisions Sec. 7.4.3, the minimum tie force in tension or compression equals the productof the larger column load times SDS divided by 10 = 1121(0.90)/10 = 101 kips.
The design strength for five # 6 bars is φAs fy = 0.8(5)(0.44)(60) = 106 kips > 101 kips. OK
According to ACI 318 Sec. 21.8.3.2 [21.10.3.2], the smallest cross-sectional dimension of the tie beammust not be less than the clear spacing between pile caps divided by 20 = (32'-0" - 9'-2")/20 = 13.7 in. Use a tie beam that is 14 in. wide and 16 in. deep. ACI 318 Sec. 21.8.3.2 [21.10.3.2] further indicates thatclosed ties must be provided at a spacing of not more than one-half the minimum dimension = 14/2 = 7 in.
Assuming that the surrounding soil provides restraint against buckling, the design strength of the tie beamconcentrically loaded in compression is:
φPn = 0.8φ[0.85f'c(Ag - Ast) + fyAst] = 0.8(0.65)[0.85(3)(16)(14) + 60(5)(0.44)] = 366 kips > 101 kips. OK
4.2.3.2 Liquefaction
For Seismic Design Categories C, D, E and F, Provisions Sec. 7.4.1 requires that the geotechnical reportaddress potential hazards due to liquefaction. For Seismic Design Categories D, E and F, Provisions Sec.7.5.1 and 7.5.3 [7.5.1 and 7.5.2] further require that the geotechnical report describe the likelihood andpotential consequences of liquefaction and soil strength loss (including estimates of differentialsettlement, lateral movement, and reduction in foundation soil-bearing capacity) and discuss mitigationmeasures. [In the 2003 Provisions, Sec. 7.5.2 also requires that the geotechnical report describe lateralloads on foundations, increases in lateral pressures on retaining walls, and flotation of embedded

FEMA 451, NEHRP Recommended Provisions: Design Examples
4-48
structures.] During the design of the structure, such measures (which can include ground stabilization,selection of appropriate foundation type and depths, and selection of appropriate structural systems toaccommodate anticipated displacements [and forces in the 2003 Provisions]) must be considered. Commentary Section 7.4.1 contains a calculation procedure that can be used to evaluate the liquefactionhazard, but readers should refer to Youd for an update of the methods described in the Commentary. [Sec. 7.4.1 of the 2003 Commentary has been updated to reflect Youd and other recent references.]
4.2.3.3 Kinematic Interaction
Piles are subjected to curvature demands as a result of two different types of behavior: inertial interactionand kinematic interaction. The term inertial interaction is used to describe the coupled response of thesoil-foundation-structure system that arises as a consequence of the mass properties of those componentsof the overall system. The structural engineer’s consideration of inertial interaction is usually focused onhow the structure loads the foundation and how such loads are transmitted to the soil (as shown in the piledesign calculations that are the subject of most of this example) but also includes assessment of theresulting foundation movement. The term kinematic interaction is used to describe the manner in whichthe stiffness of the foundation system impedes development of free-field ground motion. Considerationof kinematic interaction by the structural engineer is usually focused on assessing the strength andductility demands imposed directly on piles by movement of the soil. Although it is rarely done inpractice, the first two sentences of Provisions Sec. 7.5.4 require consideration of kinematic interaction forfoundations of structures assigned to Seismic Design Category D, E, or F. Kramer discusses kinematicand inertial interaction and the methods of analysis employed in consideration of those effects, anddemonstrates “that the solution to the entire soil-structure interaction problem is equal to the sum of thesolutions of the kinematic and inertial interaction analyses.”
One approach that would satisfy the requirements of the Provisions would be as follows:
1. The geotechnical consultant performs appropriate kinematic interaction analyses consideringfree-field ground motions and the stiffness of the piles to be used in design.
2. The resulting pile demands, which generally are greatest at the interface between stiff and softstrata, are reported to the structural engineer.
3. The structural engineer designs piles for the sum of the demands imposed by the vibratingsuperstructure and the demands imposed by soil movement.
A more practical, but less rigorous, approach would be to provide appropriate detailing in regions of thepile where curvature demands imposed directly by earthquake ground motions are expected to besignificant. Where such a judgment-based approach is used, one must decide whether to provide onlyadditional transverse reinforcement in areas of concern to improve ductility or whether additionallongitudinal reinforcement should also be provided to increase strength. The third sentence of ProvisionsSec. 7.5.4, which defines a specific instance in which this second method is to be employed to defineareas requiring additional transverse reinforcement, helps to make an argument for general application ofthis practical approach.
4.2.3.4 Design of Pile Cap
Design of pile caps for large pile loads is a very specialized topic for which detailed treatment is beyondthe scope of this volume of design examples. CRSI notes that “most pile caps are designed in practice byvarious short-cut rule-of-thumb procedures using what are hoped to be conservative allowable stresses.” Wang & Salmon indicates that “pile caps frequently must be designed for shear considering the memberas a deep beam. In other words, when piles are located inside the critical sections d (for one-way action)

Chapter 4, Foundation Analysis and Design
4-49
or d/2 (for two-way action) from the face of column, the shear cannot be neglected.” They go on to notethat “there is no agreement about the proper procedure to use.” Direct application of the specialprovisions for deep flexural members as found in ACI 318 is not possible as the design conditions aresomewhat different. CRSI provides a detailed outline of a design procedure and tabulated solutions, butthe procedure is developed for pile caps subjected to concentric vertical loads only (without appliedoverturning moments or pile head moments). Strut-and-tie models (as described in Appendix A of the2002 edition of ACI 318) may be employed, but their application to elements with important three-dimensional characteristics (such as pile caps for groups larger than 2×1) is so involved as to precludehand calculations.
4.2.3.5 Foundation Flexibility and Its Impact on Performance
4.2.3.5.1 Discussion
Most engineers routinely use fixed-base models. Nothing in the Provisions prohibits that commonpractice; the consideration of soil-structure interaction effects (Provisions Sec. 5.8 [5.6]) is “permitted”but not required. Such fixed-base models can lead to erroneous results, but engineers have long assumedthat the errors are usually conservative. There are two obvious exceptions to that assumption: soft soilsite-resonance conditions (e.g., as in the 1985 Mexico City earthquake) and excessive damage or eveninstability due to increased displacement response.
Site resonance can result in significant amplification of ground motion in the period range of interest. Forsites with a fairly long predominant period, the result is spectral accelerations that increase as thestructural period approaches the site period. However, the shape of the general design spectrum used inthe Provisions does not capture that effect; for periods larger than T0, accelerations remain the same ordecrease with increasing period. Therefore, increased system period (as a result of foundation flexibility)always leads to lower design forces where the general design spectrum is used. Site-specific spectra mayreflect long-period site-resonance effects, but the use of such spectra is required only for Class F sites.
Clearly, an increase in displacements, caused by foundation flexibility, does change the performance of astructure and its contents – raising concerns regarding both stability and damage. Earthquake-inducedinstability of buildings has been exceedingly rare. The analysis and acceptance criteria in the Provisionsare not adequate to the task of predicting real stability problems; calculations based on linear, staticbehavior cannot be used to predict instability of an inelastic system subjected to dynamic loading. WhileCommentary Sec. 5.2.8 [4.5.1]indicates that structural stability was considered in arriving at the“consensus judgment” reflected in the drift limits, such considerations were qualitative. In point of fact,the values selected for the drift limits were selected considering damage to nonstructural systems (and,perhaps in some cases, control of structural ductility demands). For most buildings, application of theProvisions is intended to satisfy performance objectives related to life safety and collapse prevention, notdamage control or post-earthquake occupancy. Larger design forces and more stringent drift limits areapplied to structures assigned to Seismic Use Group II or III in the hope that those measures will improveperformance without requiring explicit consideration of such performance. Although foundationflexibility can affect structural performance significantly, the fact that all consideration of performance inthe context of the Provisions is approximate and judgment-based has made it difficult to define how suchchanges in performance should be characterized. Explicit consideration of performance measures alsotends to increase engineering effort substantially, so mandatory performance checks are often resisted bythe user community.
The engineering framework established in FEMA 356 is more conducive to explicit use of performancemeasures. In that document (Sec. 4.4.3.2.1 and 4.4.3.3.1), the use of fixed-based structural models isprohibited for “buildings being rehabilitated for the Immediate Occupancy Performance Level that are

FEMA 451, NEHRP Recommended Provisions: Design Examples
4-50
sensitive to base rotations or other types of foundation movement.” In this case the focus is on damagecontrol rather than structural stability.
4.2.3.5.2 Example Calculations
To assess the significance of foundation flexibility, one may compare the dynamic characteristics of afixed-base model to those of a model in which foundation effects are included. The effects of foundationflexibility become more pronounced as foundation period and structural period approach the same value.For this portion of the example, use the Site Class E pile design results from Sec. 4.2.2.1 and consider thenorth-south response of the concrete moment frame building located in Berkeley (Sec. 6.2) asrepresentative for this building.
Stiffness of the Structure. Calculations of the effect of foundation flexibility on the dynamic response ofa structure should reflect the overall stiffness of the structure (e.g., that associated with the fundamentalmode of vibration), rather than the stiffness of any particular story. Table 6-2 shows that the total weightof the structure is 36,462 kips. Table 6-5 shows that the calculated period of the fixed-base structure is2.50 seconds, and Table 6-4 indicates that 80.2 percent of the mass participates in that mode. Using theequation for the undamped period of vibration of a single-degree-of-freedom oscillator, the effectivestiffness of the structure is:
( )22
2 2
4 (0.802)36, 462 386.14 478 kip/in.2.50
MKT
ππ= = =
Foundation Stiffness. As seen in Figure 6-1 there are 36 moment frame columns. Assume that a 2×2 pilegroup supports each column. As shown in Sec. 4.2.2.1, the stiffness of each pile is 40 kip/in. Neglectingboth the stiffness contribution from passive pressure resistance and the flexibility of the beam-slab systemthat ties the pile caps, the stiffness of each pile group is 4 × 40 = 160 kip/in. and the stiffness of the entirefoundation system is 36 × 160 = 5760 kip/in.
Effect of Foundation Flexibility. Because the foundation stiffness is more than 10 times the structuralstiffness, period elongation is expected to be minimal. To confirm this expectation the period of thecombined system is computed. The total stiffness for the system (springs in series) is:
1 1 441 kip/in.1 1 1 1478 5760
combined
structure fdn
K
K K
= = =+ +
Assume that the weight of the foundation system is 4000 kips and that 100 percent of the correspondingmass participates in the new fundamental mode of vibration. The period of the combined system is
[ ](0.802)(36, 462) (1.0)(4000) 386.12 2 2.78 sec
441MTK
π π+
= = =
which is an 11percent increase over that predicted by the fixed-base model. For systems responding inthe constant-velocity portion of the spectrum, accelerations (and thus forces) are a function of 1/T andrelative displacements are a function of T. Therefore, with respect to the fixed-based model, thecombined system would have forces that are 10 percent smaller and displacements that are 11 percentlarger. In the context of earthquake engineering, those differences are not significant.