foundation analysis and design sample
TRANSCRIPT

8/6/2019 Foundation Analysis and Design Sample
http://slidepdf.com/reader/full/foundation-analysis-and-design-sample 1/32
RECOMMENDED RESIDENTIAL CONSTRUCTION FOR THE GULF COAST D-
D.FoundationAnalysis andDesignExamplesChapter 3 described the types o loads considered in this manual. This
appendix demonstrates how these loads are calculated using a sample building and oundation. The reactions rom the loads imposed on the
example building are calculated, the loads on the oundation elements
are determined, and the total loads are summed and applied to the
oundation.
There is a noteworthy dierence between the approach taken or designing the oundationsincluded in this manual and the analyses that a designer may undertake or an individualbuilding. The analyses used or the designs in this manual were based on the “worst case” load-ing scenario or a “range o building sizes and weights.” This approach was used to provide

8/6/2019 Foundation Analysis and Design Sample
http://slidepdf.com/reader/full/foundation-analysis-and-design-sample 2/32
D- Building on strong and safe foundations
D foundation analysis and design examples
designers and contractors with some exibility in selecting the home ootprint and characteris-tics or which these pre-engineered oundations would apply. This also makes application o thepre-engineered oundations simpler, reducing the number o pre-engineered oundations, andresults in conservative designs.
For example, the designs presented were developed to resist uplit and overturning or a rela-tively light structure with a at roo (worst case uplit and overturning) while gravity loads werebased on a relatively heavy structure to simulate worst case gravity loads. Sliding orces were de-termined or a relatively deep home with a steep roo to simulate the largest lateral loads. Therange o building weights and dimensions applicable to the designs are listed in Appendix C.
Since the designs are inherently conservative or some building dimensions and weights, a localdesign proessional may be consulted to determine i reanalyzing to achieve a more efcient de-sign is warranted. I a reanalysis is determined to be cost-eective, the sample calculations willaid the designer in completing that analysis.
D.1 SampleCalculations
The sample calculations have been included to show one method o determining and calculat-ing individual loads, and calculating load combinations.
TypeofBuilding
The sample calculation is based on a two-story home with a 8-oot by 4-oot ootprint anda mean roo height o 6 eet above grade. The home is located on Little Bay in HarrisonCounty, Mississippi, approximately .5 miles southwest o DeLisle (see Figure D-). The site islocated on the Harrison County Flood Recovery Map in an area with an Advisory Base FloodElevation (ABFE) o 8 eet, located between the .5-oot wave contour and the 3-oot wavecontour (Coastal A Zone). The local grade elevation is 5 eet North American Vertical Datum(NAVD). The calculations assume short- and long-term erosion will occur and the ground eleva-tion will drop oot during the lie o the structure. This places the home in a Coastal A Zone with the ood elevation approximately 4 eet above the eroded exterior grade. Based on ASCE7-0, the 3-second gust design wind speed at the site is 8 miles per hour (mph) Exposure Cat-egory C. To reduce possible damage and or greater resistance to high winds, the home is beingdesigned or a 40-mph design wind speed.
The home has a gabled roo with a 3: roo pitch. The home is wood-ramed, contains no brickor stone veneer, and has an asphalt shingled roo. It has a center wood beam supporting the frst oor and a center load bearing wall supporting the second oor. Clear span trusses rame theroo and are designed to provide a -oot overhang. No vertical load path continuity is assumedto exist in the center supports, but vertical and lateral load path continuity is assumed to exist elsewhere in the structure.

8/6/2019 Foundation Analysis and Design Sample
http://slidepdf.com/reader/full/foundation-analysis-and-design-sample 3/32
D-3RECOMMENDED RESIDENTIAL CONSTRUCTION FOR THE GULF COAST
foundation analysis and design examples D
The proposed oundation or the home is a system o steel pipe piles, a reinorced concretegrade beam, and concrete columns extending rom the grade beam to the elevated structure.
Methodology
. Determine the loads based on the building’s parameters (Section D..)
. Calculate wind and ood loads using ASCE 7-0 (Section D..)
3. Consider the structure as a rigid body, and use orce and moment equilibrium equations todetermine reactions at the perimeter oundation elements (Section D.)
FigureD-1.
StarindicatesthelocationofthesamplecalculationhomeonLittleBayinHarrisonCounty,Mississippi,
approximately1.5milessouthwestofDeLisle.Insetontheleft(fromthemap)isenlarged.

8/6/2019 Foundation Analysis and Design Sample
http://slidepdf.com/reader/full/foundation-analysis-and-design-sample 4/32
D-4 Building on strong and safe foundations
D foundation analysis and design examples
D.1.1 DeterminingIndividualLoadsonaStructure
Building Dimensions and Weights (pulled rom the text o the example problem)
B = 4 Building width (t)
L = 8 Building depth (t)
F = 0 First oor height (t)
F = 0 Second oor height (t)
r = 3 3: roo pitch
Wovhg = Width o roo overhang (t)
Dead Loads
WrDL = Roo dead load including upper level ceiling fnish (inpounds per square oot [ps])
WstDL = 8 First oor dead load (ps)
WndDL = 0 Second oor dead load, including frst oor ceiling fnish (ps)
W wlDL = 9 Exterior wall weight (ps o wall area)
Live Loads
WstLL = 40 First oor live load (ps)
WndLL = 30 Second oor live load (ps)
WrLL = 0 Roo live load (ps)
Wind Loads
Building Geometry
h/L =
L/B = 0.7
8/6/2019 Foundation Analysis and Design Sample
http://slidepdf.com/reader/full/foundation-analysis-and-design-sample 5/32
D-5RECOMMENDED RESIDENTIAL CONSTRUCTION FOR THE GULF COAST
foundation analysis and design examples D
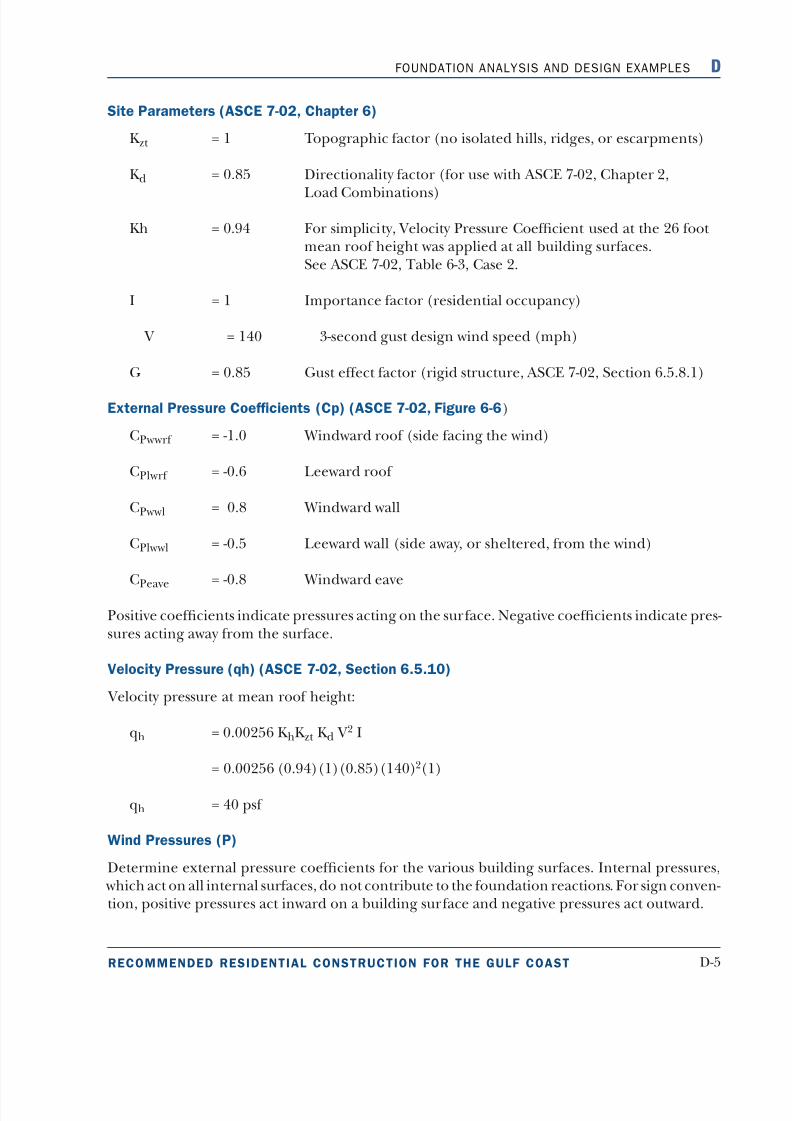
Site Parameters (ASCE 7-02, Chapter 6)
K zt = Topographic actor (no isolated hills, ridges, or escarpments)
K d = 0.85 Directionality actor (or use with ASCE 7-0, Chapter ,
Load Combinations)
Kh = 0.94 For simplicity, Velocity Pressure Coefcient used at the 6 oot mean roo height was applied at all building suraces.See ASCE 7-0, Table 6-3, Case .
I = Importance actor (residential occupancy)
V = 40 3-second gust design wind speed (mph)
G = 0.85 Gust eect actor (rigid structure, ASCE 7-0, Section 6.5.8.)
External Pressure Coefcients (Cp) (ASCE 7-02, Figure 6-6)
CPwwr = -.0 Windward roo (side acing the wind)
CPlwr = -0.6 Leeward roo
CPwwl = 0.8 Windward wall
CPlwwl = -0.5 Leeward wall (side away, or sheltered, rom the wind)
CPeave
= -0.8 Windward eave
Positive coefcients indicate pressures acting on the surace. Negative coefcients indicate pres-sures acting away rom the surace.
Velocity Pressure (qh) (ASCE 7-02, Section 6.5.10)
Velocity pressure at mean roo height:
qh = 0.0056 K hK zt K d V I
= 0.0056 (0.94)()(0.85)(40)()
qh = 40 ps
Wind Pressures (P)
Determine external pressure coefcients or the various building suraces. Internal pressures, which act on all internal suraces, do not contribute to the oundation reactions. For sign conven-tion, positive pressures act inward on a building surace and negative pressures act outward.

8/6/2019 Foundation Analysis and Design Sample
http://slidepdf.com/reader/full/foundation-analysis-and-design-sample 6/32
D-6 Building on strong and safe foundations
D foundation analysis and design examples
P wwrV = qh GCpwwr Windward roo
= (40)(0.85)(-)
P wwrV = -34 ps
Likewise
PlwrV = qh GCplwr Leeward roo
PlwrV = -0 ps
P wwwl = qh GCpwwwl Windward wall
P wwwl = 7 ps
Plwwl = qh GCplwwl Leeward wall
Plwwl = -7 ps
P wweave = qh GCpeave Windward roo overhang
P wweave = -7 ps - eave
= -34 ps - upper surace
= -6 ps - total
Wind Forces (F) (on a 1-oot wide section o the home)
F wwrV = P wwrV L/ Windward roo vertical orce
= (-34 ps)(4 s/l)
= -476 lb/l
FlwrV = PlwrV L/ Leeward roo vertical orce
= (-0 ps)(4 s/l)
= -80 lb/l
F wwrH = P wwrH L/ (r/) Windward roo horizontal orce= (-34 ps)(4 s/l)(3/)
= -9 lb/l
FlwrH = PlwrH L/ (r/) Leeward roo horizontal orce
= (-0 ps)(4 s/l)(3/)
= -70 lb/l

8/6/2019 Foundation Analysis and Design Sample
http://slidepdf.com/reader/full/foundation-analysis-and-design-sample 7/32
D-7RECOMMENDED RESIDENTIAL CONSTRUCTION FOR THE GULF COAST
foundation analysis and design examples D
F wwwlst = P wwwl (F) Windward wall on frst oor
= (7 ps)(0 s/l)
= 70 lb/l
F wwwlnd = P wwwl (F) Windward wall on second oor
= (7 ps)(0 s/l)
= 70 lb/l
Flwwlst = Plwwl (F) Leeward wall on frst oor
= (-7 ps)(0 s/l)
= -70 lb/l
Flwwlnd = Plwwl (F) Leeward wall on second oor
= (-7 ps)(0 s/l)
= -70 lb/l
F wweave = P wweave wowhg Eave vertical orce (lb)
= -(6 ps)( s/l) horizontal projected areas is negligible so horizontal orce is neglected
= - lb/l
D.1.2 CalculatingReactionsfromWind,andLiveandDeadLoads
Sum overturning moments (M wind) about the leeward corner o the home. For sign convention,consider overturning moments as negative. Since vertical load path continuity is assumed not tobe present above the center support, the center support provides no resistance to overturning(see Figure D-).
M wind = (-476 lb/l)( t) + (-80 lb/l)(7 t) + (9 lb/l)(.75 t) +(-70 lb/l)(.75 t) + (-70 lb/l)(5 t) + (-70 lb/l)(5 t) +(-70 lb/l)(5 t) + (-70 lb/l)(5 t) + (- lb/l)(9 t)
= -3,88 t-lb/l
Solving or the windward reaction, thereore:
W wind = M wind ÷ L
W wind = -3,8 t (lb/l ÷ 8 t)
W wind = -830 lb/l

8/6/2019 Foundation Analysis and Design Sample
http://slidepdf.com/reader/full/foundation-analysis-and-design-sample 8/32
D-8 Building on strong and safe foundations
D foundation analysis and design examples
The leeward reaction is calculated by either summing vertical loads or by summing momentsabout the windward oundation wall. Leeward reaction equals -48 lb/l.
Lateral Wind Loads
Sum horizontal loads (Flat) on the elevated structure (Forces to the let are positive. See FigureD-).
Flat = (-9 lb/l) + (70 lb/l) + (70 lb/l) + (70 lb/l) + (70 lb/l) + (70 lb/l)
= 83 lb/l
FigureD-2.Pathsfor
wind,live,anddead
loads
-20 psf
Wind, Live and Dead Loads
-17 psf
4'M+BFE
Lowest HorizontalMember18” Sq. Concrete
Column Pilecapand Driven Pile
2'
28'
10'
-34 psf-61 psf
312
27 psf
Second Floor
First Floor
Ground Elevation
ErodedGround Elevation
V = 140 mph
Roof 20 psf LL12 psf DL
30 psf LL10 psf DL
Second Floor
Clear Span Trusses
40 psf LL8 psf DL
First Floor
Bearing Wall
10'

8/6/2019 Foundation Analysis and Design Sample
http://slidepdf.com/reader/full/foundation-analysis-and-design-sample 9/32
D-9RECOMMENDED RESIDENTIAL CONSTRUCTION FOR THE GULF COAST
foundation analysis and design examples D
Dead Loads
In this example, dead load reactions (Wdead) are determined by summing loads over the tribu-tary areas. Since the roo is ramed with clear-span trusses and there is a center support in thehome, each exterior oundation wall supports ½ o the roo load, all o the exterior wall load,
and ¼ o the frst and second oor loads. This approach to analysis is somewhat conservativesince it does not consider the entire dead load o the structure to resist overturning. Standardengineering practice oten considers the entire weight o the structure (i.e., not just the portionsupported by the perimeter oundation walls) available to resist overturning. The closed oun-dations in this guidance were developed considering only the tributary dead load to resist uplit.The open oundations were developed considering all dead loads to resist uplit.
Wdead = L/ (wrDL)+ L/4 (wstDL + wndDL) + (F + F) w wlDL
= [4 s/l ( ps)] + [7 s/l (8ps + 0 ps)] + [(0 s/l + 0 s/l) 9 ps]
= 474 lb/l
Live Loads
Floor
Live loads (Wlive) are calculated in a similar ashion
Wlive = L/4(WstLL + WndLL)
= (7 sq t/l)(40 + 30) ps
= 490 lb/l
Roof
Wliveroo = L/(WrLL)
= (4 sq t/l)(0 ps)
= 80 lb/l
D.2 DeterminingLoadCombinations
Combine loads as specifed in Chapter o ASCE 7-0. For this example, an allowable stress de-sign approach was used. A strength-based design is equally valid.
Other loads (such as snow, ice, and seismic) are listed in the ASCE 7-0 Load Combinations,but were considered to be too rare in the Gul Coast o the United States to be consideredin the design. ASCE 7-0 also lists rain loads that are appropriate or the Gul Coast region.Since a minimum roo slope ratio o 3: was assumed or the homes, rain loading was not considered.

8/6/2019 Foundation Analysis and Design Sample
http://slidepdf.com/reader/full/foundation-analysis-and-design-sample 10/32
D-0 Building on strong and safe foundations
D foundation analysis and design examples
TableD-1.DesignReactionsonBaseofElevatedHome
ASCE7-02LoadCombination Vertical(lb/lf) Horizontal(lb/lf)
#1 D 474 --
#2 D + L 964 --#3 D + L 754 --
#4 D + 0.75(L) + 0.75(L) {1,052} --
#5 D + W -356 831
#6 D + 0.75(W) + 0.75(L) + 0.75(L ) 1,016 623
#7 0.6D + W {-546} {831}
#8 0.6D 284 --
Where
D = Dead LoadL = Live Load
Lr = Roo Live Load
W = Wind Load
NOTE: Critical loads are in bold and with brackets ({ }).
Flood Load Eects on a Foundation
In this example, since the oundation selected is a system o steel pipe piles, the equations used
to calculate ood loads are based on open oundations. Some o the equations used to calculateood loads will be dierent i the building has a closed oundation system.
Many ood calculations depend on the stillwater ooding depth (ds). While not listed on FIRMs,ds can be calculated rom the BFE by knowing that the breaking wave height (Hb) equals 78percent o the stillwater depth and that 70 percent o the breaking wave exists above the stillwa-ter depth (see Figure -3 o FEMA 55). Stated algebraically:
BFE = GS + ds + 0.70 Hb
= GS + ds + 0.70(0.78 ds)
= GS + .55 ds
GS = 5 t NAVD (initial elevation) – t (short- and long- term erosion)
= 4 t NAVD
ds = (BFE – GS) ÷ .55
= (8 eet NAVD – 4 eet NAVD)÷ .55

8/6/2019 Foundation Analysis and Design Sample
http://slidepdf.com/reader/full/foundation-analysis-and-design-sample 11/32
D-RECOMMENDED RESIDENTIAL CONSTRUCTION FOR THE GULF COAST
foundation analysis and design examples D
= 4 t ÷.55
= .6 t
Hydrostatic Loads
Hydrostatic loads act laterally and vertically on all submerged oundation elements. On openoundations, lateral hydrostatic loads cancel and do not need to be considered but vertical hy-drodynamic orces (buoyancy) remain. The buoyancy orces reduce the eective weight o theoundation by the weight o the displaced water and must be considered in uplit calculations.For example, normal weight concrete which typically weighs 50 lb/t 3 only weighs 86 lb/t 3 when submerged in saltwater (slightly more in reshwater).
In this example, calculations are based on an 8-inch square normal weight concrete columnthat extends 4 eet above eroded ground elevation. The column weighs ,350 pounds dry ((.5t)(.5 t)(4 t)(50 lb/t 3). Under ood conditions, the column displaces 9 t 3 o saltwater that,
at 64 lb/t 3, weighs 576 pounds so the column weighs only 774 pounds when submerged.
Hydrodynamic Loads
Flood Velocity
Since a Coastal A Zone is close to the ood source, ood velocity is calculated using the ASCE7-0 Equation C5-:
V = (g ds)/ Upper bound ood velocity
Where
g = Gravitational acceleration (3. t/sec)
ds = Design stillwater depth (t)
Hence
V = [(3.)(.6)]/
= 9.5 eet per second (ps)
Hydrodynamic Forces
A modifed version o ASCE 7-0 Equation C5-4 can be used to calculate the hydrodynamicorce on a oundation element as
Fdyn = ½ Cd ρ V A
Where
Fdyn = Hydrodynamic orce (lb) acting on the submerged element

8/6/2019 Foundation Analysis and Design Sample
http://slidepdf.com/reader/full/foundation-analysis-and-design-sample 12/32
D- Building on strong and safe foundations
D foundation analysis and design examples
Cd = .0 Drag coefcient (equals .0 or a square or rectangular column)
ρ = Mass density o salt water (slugs/cubic oot)
A = .5 ds Surace area o obstruction normal to ow (t )
For open oundation, “A” is the area o pier or column perpendicular to food direction (calculated or an 18-inch square column).
Hence
Fdyn = (½) ()()(9.5)(.5)(.6)
= 653 lb/column
The orce is assumed to act at a point ds/ above the eroded ground surace.
The ormula can also be used or loads on oundation walls. The drag coefcient, however, isdierent. For oundation walls, Cd is a unction o the ratio between oundation width and oun-dation height or the ratio between oundation width and stillwater depth. For a building withdimensions equal to those used in this example, Cd or a closed oundation would equal .5 orull submersion (4 eet by 4 eet) or .3 i submersed only up to the .6-oot stillwater depth.
Dynamic loads or submersion to the stillwater depth or a closed oundation are as ollows:
Fdyn = ½ Cd ρ V A
Fdyn = (½) (.3)()(9.5)()(.6)
= 83 lb/l o wall
Floodborne Debris Impacts
The loads imposed by oodborne debris were approximated using ormula -9 contained inFEMA 55.
The Commentary o ASCE 7-0 contains a more sophisticated approach or determining debrisimpact loading, which takes into account the natural period o the impacted structure, local de-bris sources, upstream obstructions that can reduce the velocity o the oodborne debris, etc.
For ease o application and consistency, debris loads in this example have been calculated usingthe guidance contained in FEMA 55 that are based on ASCE 7-98, not the 00 version o ASCE7. It is suggested that designers o coastal oundations review the later standards to determine i they are more appropriate to use in their particular design.
The FEMA 55 Formula .9 estimates debris impact loads as ollows:
Fi = wV ÷ (g Δ t)

8/6/2019 Foundation Analysis and Design Sample
http://slidepdf.com/reader/full/foundation-analysis-and-design-sample 13/32
D-3RECOMMENDED RESIDENTIAL CONSTRUCTION FOR THE GULF COAST
foundation analysis and design examples D
Where
Fi = impact orce (lb)
w = weight o the oodborne debris (lb)
V = velocity o oodborne debris (t/sec)g = gravitational constant = 3. t/sec
Δt = impact duration (sec)
Floodborne debris velocity is assumed to equal the velocity o the moving oodwaters and act-ing at the stillwater level. For debris weight, FEMA 55 recommends using ,000 pounds whenno other data are available. The impact duration depends on the relative stiness o the ounda-tion and FEMA 55 contains suggested impact durations or wood oundations, steel oundations,and reinorced concrete oundations. For this example, the suggested impact duration o 0.second was used or the reinorced concrete column oundation.
Fi = wV ÷ gt
Fi = [,000 lb (9.5 t/sec)] ÷ [(3. t/sec)(0. sec)]
Fi = ,84 lb
Breaking Wave Loads
When water is exposed to even moderate winds, waves can build quickly. When adequate windspeed and upstream etch exist, oodwaters can sustain wave heights equal to 78 percent o their stillwater depths. Depending on wind speeds, maximum wave height or the stillwater
depth at the site can be reached with as little as to miles o upwind etch.
Breaking wave orces were calculated in this example using ASCE 7-0 ormulae or wave orceson continuous oundation walls (ASCE 7-0 Equations 5-5 and 5-6) and on vertical pilings andcolumns (ASCE 7-0 Equation 5-4).
The equation or vertical pilings and columns rom ASCE 7-0 is
Fbrkp = ½ Cdb γ DHb
Where
Fbrkp = Breaking wave orce (acting at the stillwater level) (lb)
Cdb = Drag coefcient (equals .5 or square or rectangular piles/columns)
γ = Specifc weight o water (64 lb/t 3 or saltwater)
D = Pile or column diameter in t or circular sections, or or a square pile or col-umn, .4 times the width o the pile or column (t). For this example, sincethe column is 8-inch square, D = (.4)(.5t) = . t

8/6/2019 Foundation Analysis and Design Sample
http://slidepdf.com/reader/full/foundation-analysis-and-design-sample 14/32
D-4 Building on strong and safe foundations
D foundation analysis and design examples
Hb = Breaking wave height (0.78 ds)(t) = (0.78)(.6) = .03 t
Note: The critical angle o a breaking wave occurs when the wave travels in a direction perpen-dicular to the surace o the column. Waves traveling at an oblique angle (α) to the surace o the waves are attenuated by the actor sinα.
Fbrkp = ½ Cdb γ DHb
= ½ (.5)(64 lb/t 3)(. t)(.03 t)
= 63 lb
For closed oundations, use equations in Section 5.3.3.4. o ASCE 7-0 to calculate Fbrkp. FEMA 55 contains the ollowing two equations or calculating loads on closed oundations:
brkw = . Cp ρ ds + .4 γ ds
Case
and
brkw = . Cp ρ ds + .9 γ ds
Case
Where γ and ds are the specifc weights o water and design stillwater depths as beore. C p is the dynamic pressure coefcient that depends on the type o structure. Cp equals .8 orresidential structures, 3. or critical and essential acilities, and .6 or accessory structures where there is a low probability o injury to human lie. The term brkw is a distributed lineload and equals the breaking wave load per oot o wall length where brkw is assumed to act at the stillwater elevation.
Case o Formula .6 represents a condition where oodwaters are not present on the interioro the wall being designed or analyzed. Case is appropriate or oundation walls that lack ood vents (see Figure D-3). The less stringent Case is appropriate or walls where NFIP requiredood vents are in place to equalize hydrostatic loads and reduce orces (see Figure D-4).
In non-Coastal A Zones, the maximum wave height is .5 eet. This corresponds to a stillwa-ter depth (ds) o approximately eet (i.e., .5 oot/0.78 or a depth limited wave). For closedoundations in coastal areas with ood vents, a .5-oot breaking wave creates ,80 lbs per lin-ear oot o wall and ,400 lbs per linear oot o wall on oundations that lack ood vents.
Wind Load on Columns
Wind loads have been calculated per ASCE 7-0, Section 6.5.3 (Wind Loads on Open Build-ings and Other Structures). The velocity pressure (qh) calculated previously was used, althoughthis is a conservative fgure based on the 6-oot mean roo height. The orce coefcient (C ) was determined rom ASCE 7-0, Figure 6-9 (chimneys, tanks, and other structures); ASCE 7-0, Figure 6-0 (walls and solid signs) could have been used as well.

8/6/2019 Foundation Analysis and Design Sample
http://slidepdf.com/reader/full/foundation-analysis-and-design-sample 15/32
D-5RECOMMENDED RESIDENTIAL CONSTRUCTION FOR THE GULF COAST
foundation analysis and design examples D
From ASCE 7-0 Equation 6-5:
F wind = qz G C A
= 40 ps (0.85)(.33*)(.5 t)(4 t)
= 70 lb*Interpolated C
Wind loads on the oundation elements are not considered in combination with ood loadssince the elements are submerged during those events.
Flood Load Combinations
Section .6. o FEMA 55 provides guidance on combining ood loads. In Coastal A Zones,FEMA 55 suggests two scenarios or combining ood loads. Case involves analyzing breaking wave loads on all vertical supports and impact loading on one corner or critical support and
Case involves analyzing breaking wave loads applied to the ront row o supports (row closest to the ood source), and hydrodynamic loads applied to all other supports and impact loads onone corner or critical support.
Depending on the relative values or dynamic and breaking waves, Case oten controls or de-signing individual piers or columns within a home. Case typically controls or the design o theassemblage o piers or columns working together to support a home. Because o the magnitudeo the load, it is not always practical to design or impact loads. As an alternative, structural re-dundancy can be provided in the elevated home to allow one pier or column to be damaged by oodborne debris impact without causing collapse or excessive deection.
FigureD-3.Case1.
Normallyincident
breakingwave
pressuresagainsta
verticalwall(space
behindverticalwall
isdry)
Source: ASce 7-02

8/6/2019 Foundation Analysis and Design Sample
http://slidepdf.com/reader/full/foundation-analysis-and-design-sample 16/32
D-6 Building on strong and safe foundations
D foundation analysis and design examples
For the sample calculations, Case was used (see Figure D-5) with a breaking wave load o 63pounds applied to a non-critical column. The loads were then determined and summarized.Since the calculations must combine distributed loads on the elevated structure and discreteloads on the columns themselves, a column spacing o 7 eet is assumed in the calculations.For lateral loads on the structure, calculations are based on three rows o columns sharinglateral loads.
FigureD-4.Case2.
Normallyincident
breakingwave
pressuresagainsta
verticalwall(stillwater
levelequalonboth
sidesofwall)
Source: ASce 7-02
FigureD-5.
FloodloadsFlood Loads
BFE (4')
18'' Sq.Column
Ground Elevation
ErodedGround Elevation
0.7 HbHb
0.3 HbFi = 2,842#
FBRKP = 623#
ds = 2.6’
½ds
ds
FSTAT=576#
Fdyn = 653#
ds = stillwater depth (ft)
Hb = breaking wave depth (ft)
FBRKP = breaking wave load (#)
Fi = impact load (#)
FSTAT = buoyancy force for a fully
submerged 18” Sq. 4’ tall
column

8/6/2019 Foundation Analysis and Design Sample
http://slidepdf.com/reader/full/foundation-analysis-and-design-sample 17/32
D-7RECOMMENDED RESIDENTIAL CONSTRUCTION FOR THE GULF COAST
foundation analysis and design examples D
TableD-2.LoadsonColumnsSpaced7FeetonCenter(forthreerowsofcolumns)
ASCE7-02LoadCombination Vertical(lb) Horizontal(lb)
#1 D + F 1,350 + [7(474]) = 4,668 --
#2 D + F + L 1,350 + [7(964)] = 8,098 --
#3 D + F + L 1,350 + [7(754)] = 6,628 --
#4 D + F + 0.75(L) + 0.75(L) 774 + 7(1,052) = {8,138} --
#5 D + F + W + 1.5(Fa) 774 + [7(474 - 48)] = 3,756[(1/3)7(831)] + [1.5(623)]
= {2,874}
#6 D + F + 0.75(W) + 0.75(L) +0.75(L) + 1.5(Fa)
774 + 7[474 + 0.75
(-48+490+280)]= 7,883
[(1/3)7(0.75)(831)] + [1.5(623)]= 2,388
#7 0.6D + W + 1.5(Fa)0.6[774 + 7(474)] + [7(-830)]= {-3,555}
[(1/3)7(831)] + [1.5(623)]= {2,874}
#8 0.6D [0.6(1,350)] + [7(306)] = 3,000 --
Where
D = Dead Load
F = Load due to uids with well-defned pressures and maximum heights(see Section D. or additional inormation)
Fa = Flood Load
L = Live Load
Lr = Roo Live Load
W = Wind Load
Note: Critical loads are in bold with brackets ({ }).
Results
Each perimeter column needs to support the ollowing loads:
Vertical Load = 8,38 lb
Uplit = 3,555 lb
Lateral Load = ,874 lb
With the critical loads determined, the oundation elements and their connections to the homecan be designed.
The ollowing two examples are to demonstrate designs using inormation provided in thismanual. The frst example is based on a closed oundation; the second example is based on anopen oundation.

8/6/2019 Foundation Analysis and Design Sample
http://slidepdf.com/reader/full/foundation-analysis-and-design-sample 18/32
D-8 Building on strong and safe foundations
D foundation analysis and design examples
D.3 ClosedFoundationExample
A structure to be supported by the closed oundation is identical to the structure analyzed inthe example rom Section D.. The site, however, is dierent. For the closed oundation de-
sign, the structure is to be placed in a non-Coastal A Zone where breaking waves are limited to.5 eet. The design stillwater depth is eet, and the BFE is 3 eet above exterior grade. Whilethe structure could be placed on a 3-oot oundation, the property owner requested additionalprotection rom ooding and a 4-oot tall oundation is to be built. Since the home elevation isidentical to that in the example, the loads and load combinations listed in Table D- are identi-cal. However, since the oundation is closed, ood orces must frst be analyzed.
Like the previous analysis example, ood orces consist o hydrodynamic loads, debris loads,and breaking wave loads. Since the home is located in a non-Coastal A Zone, it is appropriate touse lower bound ood velocities. This will signifcantly reduce hydrodynamic and debris loads.From FEMA 55, the ollowing equation is used:
V lower = ds
= t/sec
Hydrodynamic Loads
Fdyn = ½ Cd ρ V A
= ½ Cd ρ V () ds
Fdyn = (½) (.4)()()()()
= lb/l o wall
Where Cd o .4 is or a (width o wall/ds) ratio o (4 t/ t)
(From FEMA 55, Table .)
The hydrodynamic load can be considered to act at the mid-depth o the stillwater elevation.The hydrodynamic load is less than the 7 ps wind load on the windward wall.
Debris Loads
Fi
= wV ÷ gt
Fi = [,000 lb ( t/sec)] ÷ [(3. t/sec)(0. sec)]
Fi = 60 lb
Due to load distribution, the impact load will be resisted by a section o the wall. Horizontalshear reinorcement will increase the width o the section o wall available to resist impact. Forthis example, a 3-oot section o wall is considered to be available to resist impact. The debrisimpact load becomes

8/6/2019 Foundation Analysis and Design Sample
http://slidepdf.com/reader/full/foundation-analysis-and-design-sample 19/32
D-9RECOMMENDED RESIDENTIAL CONSTRUCTION FOR THE GULF COAST
foundation analysis and design examples D
Fiwall = (/3) 60 lb
Fiwall = 0 lb/t
Breaking Wave Loads
The home is to be constructed in a SFHA; hence, the NFIP required ood vents will be installed.The breaking wave load can be calculated using ormulae or equalized ood depths (Case ).
brkw = . Cp γ ds + .9 γ ds
brkw = γ ds (. Cp + .9)
brkw = (64)(){(.)(.8) + .9}
brkw = ,80 lb/l
The breaking wave load can be considered to act at the -oot stillwater depth (d s) above the
base o the oundation wall.
The oundation must resist the loads applied to the elevated structure plus those on the oun-dation itsel. Chapter o ASCE 7-0 directs designers to include 75 percent o the ood loadin load combinations 5, 6, and 7 or non-Coastal A Zones. Table D- lists the actored loads onthe elevated structure.
Critical loads rom Table D- include 546 lb/l uplit, ,05 lb/l gravity, and 83 lb/l lateralrom wind loading. The uplit load needs to be considered when designing oundation wallsto resist wind and ood loads and when sizing ootings to resist uplit; the gravity load must beconsidered when sizing ootings and the lateral wind and ood loads must be considered in de-
signing shear walls.
Extending reinorcing steel rom the ootings to the walls allows the designer to consider the wall as a propped cantilever fxed at its base and pinned at the top where it connects to the wood-ramed oor raming system. The oundation wall can also be considered simply supported(pinned at top and bottom). The analysis is somewhat simpler and provides conservative results.
The ,80 lb/l breaking wave load is the controlling ood load on the oundation. The prob-ability that oodborne debris will impact the oundation simultaneously with a design breaking wave is low so concurrent wave and impact loading is not considered. Likewise, the dynamicload does not need to be considered concurrently with the breaking wave load and the 7 lb/s
wind load can not occur concurrently on a wall submerged by oodwaters.
The breaking wave load is analyzed as a point load applied at the stillwater level. When sub- jected to a point load (P), a propped cantilevered beam o length (L) will produce a maximummoment o 0.97 (say 0.) PL. The maximum moments occur when “P” is applied at a distance0.43L rom the base. For the 4-oot tall wall, maximum moment results when the load is appliednear the stillwater level (ds). In this example, the ASCE 7-0 required ood load o 75 percent o the breaking wave load will create a bending moment o

8/6/2019 Foundation Analysis and Design Sample
http://slidepdf.com/reader/full/foundation-analysis-and-design-sample 20/32
D-0 Building on strong and safe foundations
D foundation analysis and design examples
M = (0.) brkw (L)
= (0.)(0.75)(,80 lb/t) (4 t)
= 768 t-lb/l or
= 9,00 in-lb/l
The reinorced masonry wall is analyzed as a tension-compression couple with moment arm“jd,” where “d” is the distance rom the extreme compression fber to the centroid o the rein-orcing steel, and “j” is a actor that depends on the reinorcement ratio o the masonry wall. While placing reinorcing steel o center in the wall can increase the distance (d) (and reducethe amount o steel required), the complexity o o-center placement and the inspections re-quired to veriy proper placement make it disadvantageous to do so. For this design example,steel is considered to be placed in the center o the wall and “d” is taken as one hal o the wallthickness. For initial approximation, “j” is taken as 0.85 and a nominal 8-inch wall with a thick-ness o 7-5/8 inches is assumed.
Solving the moment equation is as ollows:
M = T (jd)
T = M/(jd) = Tension orce
= M/(j)(t/) (t = thickness o wall)
T = (9,00 in-lbs/l) ÷ {(0.85)(7.63 in)(0.5)}
= ,837 lb/l
For each linear oot o wall, steel must be provided to resist ,837 pounds o bending stress and546 pounds o uplit.
Fsteel = ,837 lbs/l (bending) + 546 lbs/l (uplit)
= 3,383 lbs/l
The American Concrete Institute (ACI) 530 allows 60 kips per square inch (ksi) steel to be stressedto 4 ksi so the reinorcement needed to resist breaking wave loads and uplit is as ollows:
A steel = 3,383 lbs/l ÷ 4,000 lb/in
= 0.4 in
/l
Placing #5 bars (at 0.3 in/bar) at 4 inches on centers will provide the required reinorce-ment. To complete the analysis, the reinorcement ratio must be calculated to determine theactual “j” actor and the stresses in the reinorcing steel need to be checked to ensure the limitsdictated in ACI 530 are not exceeded. The wall design also needs to be checked or its ability toresist the lateral orces rom ood and wind.

8/6/2019 Foundation Analysis and Design Sample
http://slidepdf.com/reader/full/foundation-analysis-and-design-sample 21/32
D-RECOMMENDED RESIDENTIAL CONSTRUCTION FOR THE GULF COAST
foundation analysis and design examples D
Footing Sizing
The oundation walls and ootings must be sized to prevent overturning and resist the 546 lb/l uplit. ASCE 7-0 load combination 6 allows 60 percent o the dead load to be considered inresisting uplit. Medium weight 8-inch masonry cores grouted at 4 inches on center weigh 50
lb/s or, or a 4-oot tall wall, 00 lbs/l. Sixty percent o the wall weight (0 lb/l) reduces theamount o uplit the ooting must resist to 46 lb/l. At 90 lb/t 3 (60 percent o 50 lb/t 3 ornormal weight concrete), the ooting would need to have a cross-sectional area o 4.7 squareeet. Grouting all cores increases the dead load to 68 lb/s and reduces the required ootingarea to 4.5 square eet. The bearing capacity o the soils will control ooting dimensions. Stron-ger soils can allow narrower ooting dimensions to be constructed; weaker soils will require wider ooting dimensions.
The design also needs to be checked to confrm that the ootings are adequate to prevent slid-ing under the simultaneous action o wind and ood orces. I marginal riction resistanceexists, ootings can be placed deeper to beneft rom passive soil pressures.
D.4 OpenFoundationExample
For this example, the calculations are based on a two-story home raised 8 eet above grade withan integral slab-grade beam, mat-type oundation and a 8-oot by 4-oot ootprint. The homeis sited approximately 800 eet rom the shore in a Coastal A Zone with a calculated DFE o 6eet above the eroded exterior grade (6 inches below top o slab). The DFE was determined by subtracting an estimated grade elevation, shown on advisory topographic map ms-g5, rom the ABFE elevation indicated on advisory ood map ms-g5. It is important to note, however, that
submittal o an elevation certifcate and construction plans to local building code and ood-plain ofcials in many jurisdictions will require that the elevation be confrmed by a licensedsurveyor reerencing an established benchmark elevation.
The wood-ramed home has a 3: roo pitch with a mean roo height o 30 eet, a center woodbeam supporting the frst oor, and a center load bearing wall supporting the second oor.Clear span trusses rame the asphalt-shingled roo and are designed to provide a -oot over-hang. This home is a relatively light structure that contains no brick or stone veneers.
The surrounding site is at, gently sloping approximately oot in 50 eet. The site and sur-rounding property have substantial vegetation, hardwood trees, concrete sidewalks, and streets.
A our-lane highway and a massive concrete seawall run parallel to the beach and the estab-lished residential area where the site is located. The beach has been replenished several times inthe last 50 years. Areas to the west o the site that have not been replenished have experiencedbeach erosion to the ace o the seawall. The ASCE 7-0, 3-second gust design wind speed is 40mph and the site is in an Exposure Category C.
The proposed oundation or the home incorporates a monolithic carport slab placed integrally with a system o grade beams along all column lines (see Figure D-6). The dimensions o the

8/6/2019 Foundation Analysis and Design Sample
http://slidepdf.com/reader/full/foundation-analysis-and-design-sample 22/32
D- Building on strong and safe foundations
D foundation analysis and design examples
grade beam were selected to provide adequate bearing support or gravity loads, resistance tooverturning and sliding, and mitigate the potential o undermining o the grade beams and slabdue to scour action. The home is supported by concrete columns, extending rom the top o the slab to the lowest member o the elevated structure, spaced at 4 eet on center (see FigureD-7).
FigureD-6.
LayoutofOpenFoundationExample
1 4 ' - 0 "
M a x i m u m
3 ' - 0 "
3'-0"5'-6"
Critical Areaof Grade Beam
6" Concrete Slab
Grade Beam36" Wde x 48" Deep
16"x16"Column
FigureD-7.
LoadingDiagram
forOpenFoundationExample
21 psf
18 psf
6'
DFE
M+
Lowest HorizontalMember
Ground Elevation(Eroded Ground Elevation)
2'
28'
10'
-36 psf
65 psf
312
34 psf
Second Floor
First Floor
Flow of
Wind and Flood
Grade Beams
16” SquareConcreteColumns
V = 140 mph
Roof 12 psf DL20 psf LL
30 psf LL10 psf DL
Second Floor
Clear Span Trusses
40 psf LL8 psf DL
First Floor10'

8/6/2019 Foundation Analysis and Design Sample
http://slidepdf.com/reader/full/foundation-analysis-and-design-sample 23/32
D-3RECOMMENDED RESIDENTIAL CONSTRUCTION FOR THE GULF COAST
foundation analysis and design examples D
Lateral Wind Loads
Sum horizontal loads (Flat ) on the elevated structure (orces to the let are positive)
Flat = (-6 lb/l) + (74 lb/l) + (80 lb/l) + (80 lb/l) + (80 lb/l) + (80 lb/l)
= 868 lb/l Dead Loads
Dead load reactions (Wdead) are determined by summing loads over the tributary areas. Forthe anterior columns:
Wdead = L/ (wrDL)+ L/4 (wstDL + wndDL) + (F + F) w wlDL
= [4 s/l ( ps)] + [7 s/l (8ps + 0 ps)] + [(0 s/l + 0 s/l) 9 ps]
= 474 lb/l
Live Loads
Floor
Live loads (Wlive) are calculated in a similar ashion
Wlive = L/4(WstLL + WndLL)
= (7 sq t/l)(40 + 30) ps
= 490 lb/l
Roof
Wliveroo = L/(WrLL)
= (4 sq t/l)(0 ps)= 80 lb/l
A minimum roo slope o 3: was assumed or the homes; rain loading was not considered.
Flood Eects
Since the oundation selected is a system o concrete columns, the equations used to calculateood loads are based on open oundation. The stillwater ooding depth (ds) is as ollows:
ds = DFE ÷ .55
= 6 t ÷ .55= 3.9 t
Hydrostatic Loads
Calculations are based on a 6-inch square normal weight concrete column that extends 8 eet above the concrete slab.

8/6/2019 Foundation Analysis and Design Sample
http://slidepdf.com/reader/full/foundation-analysis-and-design-sample 24/32
D-4 Building on strong and safe foundations
D foundation analysis and design examples
The column weighs ,3 pounds dry ((.33 t)(.33 t)(8 t)(50 lb/t 3).
Under ood conditions, the column displaces 0.6 t 3 o saltwater which, at 64 lb/t 3, weighs 679pounds so the column weighs ,444 pounds when submerged.
Hydrodynamic Loads
Flood Velocity
Since a Coastal A Zone is close to the ood source, ood velocity is calculated using the ASCE7-0 Equation C5- as ollows:
V = [(3. t/sec)(3.9 t)]/
= . eet per second (ps)
Flood Force
ASCE 7-0 Equation C5-4 is as ollows:
Fdyn = ½ Cd ρ V A
= (½) ()()(.ps)(.33t)(3.9t)
= ,303 lb/column
Floodborne Debris Impact
The ood debris impact can be estimated, per FEMA 55 Formula .9, as ollows:
Fi = wV ÷ gt
= [,000 lb (. t/sec)] ÷ [(3. t/sec)(0. sec)]
= 3,478 lb
Breaking Wave Load
The equation or vertical pilings and columns rom ASCE 7-0 is as ollows:
Fbrkp = ½ Cdb γ DHb
= ½ (.5)(64 lb/t 3)(.8 t)(3.04t *)
= , lb
Wind Load on Columns
For a load case combining both wind and ood orces, the column would be almost completely submerged; thereore, the wind load on the column shall not be included.
* A wave height o 3.04 t suggests a V Zone but, in this example, the depth o water is increased by erosion which is not considered in
mapping A Zones. The deeper water supports a bigger wave, which in this case exceeds the V Zone wave height minimum.

8/6/2019 Foundation Analysis and Design Sample
http://slidepdf.com/reader/full/foundation-analysis-and-design-sample 25/32
D-5RECOMMENDED RESIDENTIAL CONSTRUCTION FOR THE GULF COAST
foundation analysis and design examples D
Calculating Reactions rom Wind, Live, and Dead Loads
Sum overturning moments (M wind) and (Mood) about the leeward corner o the mat ounda-tion. For sign convention, consider overturning moments as negative. Note in this example thehome is slightly higher above grade and hence the wind loads are slightly higher.
M wind = (-504 lb/l)( t) + (-94 lb/l)(7 t) + (6 lb/l)(.75 t) + (-74 lb/l)(.75t) + (-80 lb/l)(3 t) + (-80 lb/l)(3 t) + (-80 lb/l)(3 t) + (-80 lb/l)(3 t) + (-30 lb/l)(9 t)
= -3,84 t-lb/l
The vertical components o the reaction caused by the wind overturning moment is:
R x = 3,84 lb ÷ 8 t = +/- ,37 lb/t
Mood = .5[((-,lb)(3.9t)) + ((-,303lb)(3.9t/)) + ((-3,478lb)(3.9t))] = 35,053t-lb/t
The vertical component o the reaction caused by the ood overturning moment is:
R x = 35,053 lb ÷ 8 t = +/- ,5 lb outboard columns
Load Combinations
TableD-3.LoadsatBaseofColumnsSpaced14FeetonCenter(forthreerowsofcolumnsperbay)
ASCE7-02LoadCombination Vertical(lb) Horizontal(lb)
#1 D + F 1,444 + 14(474) = 8,080 --
#2 D + F + L 1,444 + 14(964) = 14,940 --
#3 D + F + L 1,444 + 14(754) = 12,000 --
#4 D + F + 0.75(L) + 0.75(L) 8,080 + (.75)[(14)(490+280)] =
16,165--
#5 D + F + W + 1.5(Fa) 8,080 +/- 14(1,137) +/- 1,252 =
25,876; -9,716 windwad; lwadwind + (1.5)[Fdyn + Fi][(14(868)(1/3)] + (1.5)[(1,303+3,478)] = 11,222
#6 D + F + 0.75(W) + 0.75(L) +
0.75(L) + 1.5(Fa)
8,080 +/- (.75)(14)(1,137)
+(.75)(14)([(490+280)] +/- 1,252 =2,348; 29,982 windwad; lwad
(.75) wind + (1.5)[Fdyn + Fi]
[(0.75)(14)(868)(1/3)] +(1.5)[(1,303+3,478)] = 10,210
#7 0.6D + W + 1.5(Fa) 0.6 [2,123+14(474)] +/- 14(1,137)
+/- (1.5)1,252 = -12,541; 23,051windwad; lwad
wind + (1.5)[Fdyn + Fi][(14(868)(1/3)] + (1.5)
[(1,303+3,478)] = 11,222
#8 0.6D [0.6((2,123) + 14(474))] = 5,255 --
citial lads a in bld.
8/6/2019 Foundation Analysis and Design Sample
http://slidepdf.com/reader/full/foundation-analysis-and-design-sample 26/32
D-6 Building on strong and safe foundations
D foundation analysis and design examples
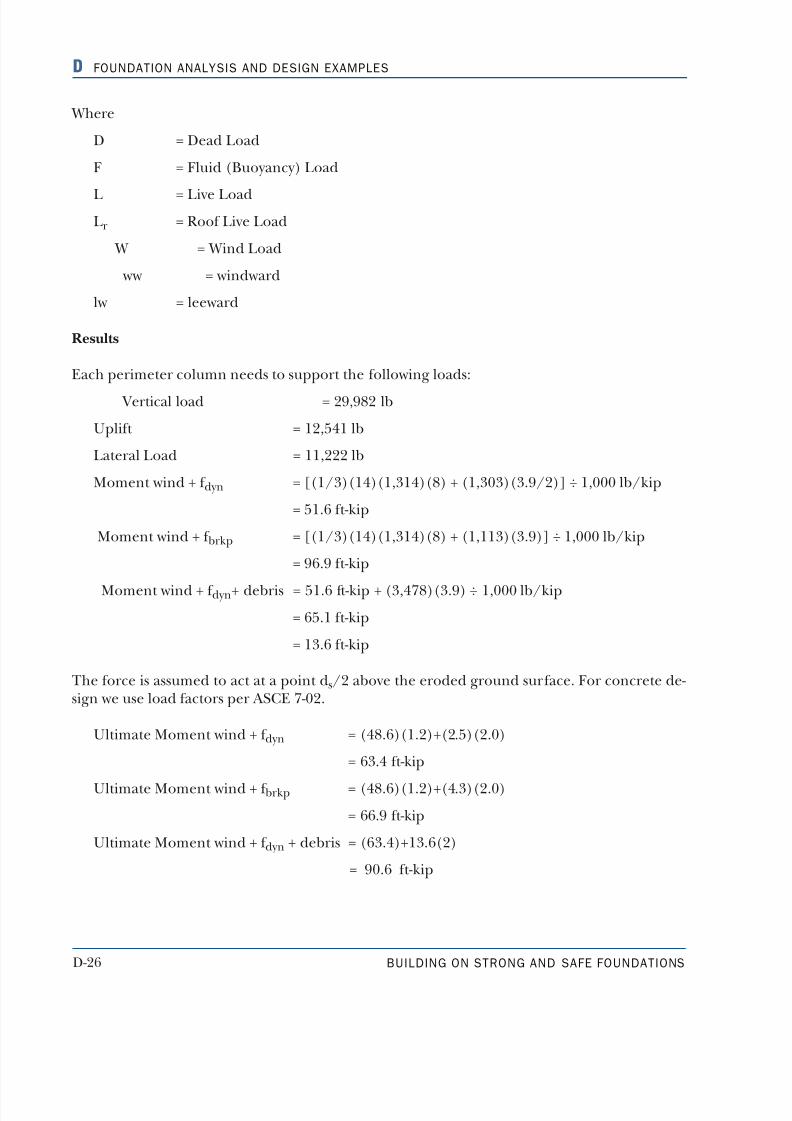
Where
D = Dead Load
F = Fluid (Buoyancy) Load
L = Live LoadLr = Roo Live Load
W = Wind Load
ww = windward
lw = leeward
Results
Each perimeter column needs to support the ollowing loads:
Vertical load = 9,98 lb
Uplit = ,54 lb
Lateral Load = , lb
Moment wind + dyn = [(/3)(4)(,34)(8) + (,303)(3.9/)] ÷ ,000 lb/kip
= 5.6 t-kip
Moment wind + brkp = [(/3)(4)(,34)(8) + (,3)(3.9)] ÷ ,000 lb/kip
= 96.9 t-kip
Moment wind + dyn+ debris = 5.6 t-kip + (3,478)(3.9) ÷ ,000 lb/kip
= 65. t-kip
= 3.6 t-kip
The orce is assumed to act at a point ds/ above the eroded ground surace. For concrete de-sign we use load actors per ASCE 7-0.
Ultimate Moment wind + dyn = (48.6)(.)+(.5)(.0)
= 63.4 t-kip
Ultimate Moment wind + brkp = (48.6)(.)+(4.3)(.0)
= 66.9 t-kip
Ultimate Moment wind + dyn + debris = (63.4)+3.6()
= 90.6 t-kip

8/6/2019 Foundation Analysis and Design Sample
http://slidepdf.com/reader/full/foundation-analysis-and-design-sample 27/32
D-7RECOMMENDED RESIDENTIAL CONSTRUCTION FOR THE GULF COAST
foundation analysis and design examples D
Foundation Design
Overturning
The overturning moment due to wind with a typical bay o 4 eet wide is as ollows:
M wind = (-3,84t-lb/l)(4 t)= -445,774 t-lb
MFa (.5) = (.5)[(,lb)(3.9 t) + ()(,303 lb)(3.9 t/)]
= -4,707 t-lb
Mo = -445,774 t-lb - 4,707 t-lb
= -460,48 t-lb
In this example, it is assumed that the home and the oundation slab are reasonably symmetri-cal and uniorm; thereore, it is assumed the center o gravity or the dead loads is at the center
o the bay.
Dead Load at perimeter columns
Dext = (474 lb/t)(4 t)( columns)
= 3,7 lb
Dead Load at an interior column:
Dint = (4 t)(4 t)(8 ps)
= ,568 lb
Dead Load o 3 columns: (3)(8 t)(.33 t x .33 t)(50) lb cubic t
= 6,368 lb
Assume that only the grade beams are sufciently reinorced to resist overturning (neglect weight o slab)
Dead Load o the grade beams (area)(depth) (density o concrete)[(8 t x3t) +(3)(( t)(3 t)](4 t)(50 lb cubic t) = 09,800 lb
Summing the Dead Loads = 3,7+,568+6,368+09,800 = 3,008 lb
Allowable Dead Load Moment o 60%
Md = (0.6)( 3,008 lb)(4 t)
= ,00,476 t-lb
Since Mot = 460,48 t-lb is very much less than 0.6 Md = ,00,476 t-lb, the oundation can beassumed to resist overturning.

8/6/2019 Foundation Analysis and Design Sample
http://slidepdf.com/reader/full/foundation-analysis-and-design-sample 28/32

8/6/2019 Foundation Analysis and Design Sample
http://slidepdf.com/reader/full/foundation-analysis-and-design-sample 29/32

8/6/2019 Foundation Analysis and Design Sample
http://slidepdf.com/reader/full/foundation-analysis-and-design-sample 30/32
D-30 Building on strong and safe foundations
D foundation analysis and design examples
Reinorced with (4) #8 bars, grade 60 reinorcing, with ½-inch clear cover
Note: ,000 lbs = .0 kip
Assume that the total wind load distributed through the oor uniormly to 3 columns.
Check combined axial and bending strength:
Ultimate Moment wind + dyn = (.6)[(8 ft)((4 ft)(868 lb/ft)/(3))] + (.0)[(3.9 ft/)(,303)
lb)]
= 5,849 t-lb + 5,08 t-lb
= 56,93 t-lb ÷ ,000 lb/kip = 56.9 t-kip
Ultimate Moment wind + brkp = (5,849 t-lb) + (.0)[(, lb)(3.9 t)]
= 6,95 t-lb ÷ ,000 lb/kip = 6.3 t-kip
Ultimate Moment wind + brkp + debris = 6.3 t-kip + (.0)(3.5 kip)(3.9 t)
= 88,6 t-kip
Maximum Factored Moment = 88.6 t-kip = ,063 in kip
Reer to Table D-3, conservatively assume ood load actor o .0 or all axial loads
Maximum actored Axial Compression = (.0)(30.0 kip) = 60.0 kip
Maximum actored Axial Tension = (.0)(.5 kip) = 5.0 kip
Based on a chart published by the Concrete Reinorced Steel Institute (CRSI), the maximum al-lowable moment or the column = ,09 in kip or 0 axial load and ,407 in kip or 0 kip axialload; thereore, the column is adequate.
Check Shear strength:
Critical Shear = wind + Fdyn + Fi
Ultimate Shear = V u = [(4 t)(.868 kip)(/3)](.6) + [(.3 kip)+(3.5 kip](.0)
= V u = 6.0 kips
As the maximum unit tension stress is only 5.0 kips/6 in x6 in = .098 kip/in and the maxi-mum axial compression stress is only 60.0 kips/6 in x 6 in = .34 kip/in, we can conservatively treat the column as a exural member or beam. The allowable shear o the concrete sectionthen, per ACI-38-0 .3.., .3..3, and .5.5. with minimum shear reinorcing (tie/stir-rup), would be as ollows.
Allowable Shear = V c = (0.75)(6 in-.5 in)(6 in )()(4,000 psi)/ (/,000) = 0.5 kips

8/6/2019 Foundation Analysis and Design Sample
http://slidepdf.com/reader/full/foundation-analysis-and-design-sample 31/32
D-3RECOMMENDED RESIDENTIAL CONSTRUCTION FOR THE GULF COAST
foundation analysis and design examples D
The shear strength o the column is adequate with minimum shear reinorcement.
The minimum area o shear, A v , per ACI 38-0, .5.5.3 would be:
A v = (50)(width o member)(spacing o reinorcing)/yield strength
o reinorcing= (50)(6 in)(6 in)/(60,000 psi) = . in
pieces o # 4 bar A s = ()(.) = .40 in
Use o #4 bar or column ties (shear reinorcement) is adequate.
Check spacing per ACI -38-0, 7.0.4
6 diameter o vertical reinorcing bar = (6)( in) = 6 in
48 diameter o column tie bar = (48)(/ in) = 4 in
Least horizontal dimension = 6 in
Thereore, #4 ties at 6 inch on center are adequate.
The column design is adequate.
Grade Beam Design
The size o the grade beam was confgured to provide adequate bearing area, resistance touplit, a reasonable measure o protection rom damaging scour, and to provide a actor o re-dundancy and reserve strength should the oundation be undermined. A grade beam 36-inches wide and 48-inches deep was selected.
Maximum Bearing Pressure = ,63 ps = . ks (kip/square oot)
Assume a combined load actor o .0 (or ood)
Check Shear strength:
Maximum Factored Uniorm Bearing Pressure = wu = (.0) (3.0 t )(. ks) = 7. kips/t
Maximum Factored Shear = V u = (7. kips/t)(4 t/) = 50.0 kips
Allowable Shear without minimum shear reinorcing (stirrups) = V c/
V c/= (0.75)(36 in)(48 - 3.5 in)(63 psi)(/,000) = 75.7 kips
Use nominal #4 two leg stirrups at 4-inch on center
Check exural strength: Assume simple span condition
Maximum Factored Moment = Mu = (7. kips/t)(4 t) (/8) = 76 t-kip

8/6/2019 Foundation Analysis and Design Sample
http://slidepdf.com/reader/full/foundation-analysis-and-design-sample 32/32
D foundation analysis and design examples
Concrete strength = 4,000 psi
Reinorcement grade = 60,000 psi
Try (4) #6 reinorcing bar continuous top and bottom
A s = (4)(0.44 in) = .76 in top or bottom
total A s = ()(.76) = 3.5 in
Reinorcement ratio (ρ)
ρ = A s ÷ [(section width)(section depth- clear cover- ½ bar diameter)]
ρ = A s ÷ [(b w)(d)]
ρ = (.76 in) ÷ [(36)(48 - 3 - 0.375)]
ρ = 0.0096
One method o calculating the moment strength o a rectangular beam, or a given section andreinorcement, is illustrated in the 00 edition o the CRSI Design Handbook. Reerencingpage 5-3 o the handbook, the ormula or calculating the moment strength can be written asollows:
ΦMn = (Φ)[((A s)( y )(d)) – (((A s)( y )) ÷ ((0.85)( 'c)(width o member)()))]
ΦMn = (0.9)[((.76)(60000)(44.63)) – (((.76)(60,000)) ÷ ((0.85)(4,000)(36)()))]
= 4,4,634 in lb ÷ 000 = 353 t-kip
Φ = 0.9
Area o reinorcing steel (A s) minimum exural
= (0.0033)(4)(44.63)
= 3.6 in
or
(.33) (A s required by analysis) = ΦMn is much greater than Mu
Area o steel or shrinkage and temperature required = (.008)(48)(36) = 3. in
Total Area o steel provided = (8) #6 = (8)(0.44) = 3.5 in adequate
Thereore, the grade beam design is adequate, use (4) #6 reinorcing bar continuous on the topand bottom with #4 stirrups at 4-inch spacing.