foundaries at the interface - ut proceedings
TRANSCRIPT

Managing the essential Strategic entrepreneurial
Production resource for the 21st Century:
Foundaries at the Interface
BY
Mr. Robert Tierney [email protected]
& Dr. Steven T. Walsh*
Black Professor of Entrepreneurship University of New Mexico
Anderson School of Business [email protected]
& Dr. Jonathan Linton
Power Corporation Professor for the Management of Technological Enterprises
Telfer School of Management University of Ottawa
*Corresponding author

2
Abstract Twenty first century economies are increasingly being fueled by regional
entrepreneurial and intreprepreneurial solutions to global problems such as water purity,
global warming, health care, energy, and nutrition. However, the tradition al single
technology or “Silo” approach to solving one of these problems while negatively
affecting others are increasingly being eschewed. Multi technology solution sets, often
comprised of both emerging and more established technologies, are increasingly
embraced. Many utilizing these types of solution bases seek to leverage the more
established management practices centered on the established technologies in order to
manage their entire production process. Yet is this approach appropriazte?
One such multi technology solution set is comprised of the more emergent
technology basis of nanotechnology and micromachining (MEMS) combined with the
more established semiconductor microfabrication. This “Small Tech” solution base is
seen by many as theb next “Shumpeterian Wave” of economic development. Yet they
require costly “Foundaries at the Interface” or Multi Technology, High Product Mix, Low
Volume fabrication facilities (MT-HMLV). These fabrications facilities have adopted for
the most part the more established management practices of High Volume Semiconductor
Faciltiy (HVSF) management proacticeses. We show that the results practice have been
less than optimum. Our case study effort shows that these facilities use of taditonbal
HVSF managment practices do not convey the strategic value of a MT-HMLV, nor do
they adequately assist in their operational management. These facilities often funded by
governmental action are essential to regional and firm based economic growth are now at
risk. If this is so there is cause for concern.

3
Abstract Keywords (R&D, Technology, entrepreneurship, Innovation, Nanotechnology, Metrics, MEMS, economic development, technology transfer, Government)
I. Introduction
The complexity of 21st century problems have hastened 21st century entrepreneurs
and intrepreneurs to embrace solutions based on complimetary technology sets rather
than the traditonal technology “silo” approach. Many seek to address regional problems
concerned with water, health care, nutition, energy, and global warming that have global
implications. Thesecomplementary technology sets are comprised of established
technologies as well as emergent ones. These entrepreneurs and regional production
facilties often seek to leverage as much knowledge centered on the established
technology based operations.
One such set of technologies that are forming the basis of a great number of 21st
century innovations is “Small Technology.” Small Technology based innovations are
those created at the interface of; Semiconductor Micro-fabrication, Micromachining
(MEMS) and Nanotechnologies. Many see innovations based small technology as the
harbinger of the next Schumpeter’s wave critical to 21st century firm and regional
economic success.
Why? Firms and other entities based on these technologies are starting to solve
commercial and governmental problems in a uniquely valuable manner and without
contributing to other global problems as they persue their focused solutions [59], [36],
[3], [60], [12]. While these innovations are being increasing valued. This valuen is being

4
developed b y new necessary competencies which for the basis of new industri2rfqfq es
while creatively destroying others. The Schumpetarian Wave is building.
Yet the production facilities from which these innovations will spring,
“Foundaries at the Interface” or more specifically in this case Multi Technology High
Mix Low Volume fabrication facilities (MT-HMLV) [47], [48] are costly and under an
increasing amount of operational and strategic scrutiny. The global answer to this
scrutiny has been to utilize the “Best Practice” production facility management practice
of the most established production base - semiconductor microfabrication.
Multitechnology solution set managers often seek to leverage the most established
technology basis managerial practice. Yet is this practice acceptable or do these existing
practices lack managerial approaches that adequately address operation effectiveness or
express value to their stakeholders?
There are factors that further complicate the use of semiconductor based
managerial practices that rely heavily on a metrics management approach:
1) Semiconductor manufacturing facilities are moving from more the
more developed economies of North America and Europe to the big
emerging economies of Asia.
2) Money for these facilities once more freely flowing is being more
harsley scruntinized during a period of recession.
3) These “Fondary at the interface” facilties are often too costly for any
one firm to sustain and increasingly seeking support from various
governmental bodies seeking to support economic development

5
4) The “Small Tech” foundaries of the future have often grown from
purely research facilities with little or no operationa scrutiny.
5) The successful use of metrics management based on semiconductor
microfabrication, especially those developed for the highly successful
High Volume Semiconductor Fabrication (HVSF) has made the
metrics management approach the methodology of choice, both
operationally and strategically for any semiconductor like facility.
Many of these facilities are perceived as extensions of High Volume
Semiconductor Facilities (HVSF). The “Defacto” standard for HVSF management, both
operational and strategic is metrics. However, simply applying HVSF based metrics to
this group of MT-HMLV facilities is proving ineffectual. MT-HMLV’s are fraught with
ineffective operations and strategic management practice. Current management practices
for these incubation facilities are barrowed from the metric management approach
endemic of single technology high volume production facilities. The result is that these
“foundaries at the interface” are iin trouble. But do they suffer from an operational and
strategic mangemt practice that while greatly suited for the semiconductor
microfabrication industry is not well suited for a small tech “foundary at the interface?
We focus on a groups of “Foundations at the interface,” or MT-HMLV’s. They
are liken by many to semiconductor fabrication facilities as far as processes are
concerned.Yet, HVSF metrics unfettered use in MT-HMLV facilities have proved
inadequate. We seek to ascertain why HVSF metrics management has failed. We start
this by first investigating the literature.
6
We initiate our investigation through a literature review on three subjects. They
are the nature of MT-HMLV’s, the large base of operational metrics developed for HVSF
and finally the operational and the strategic value of R&D metrics. First, we expand on
earlier work of Myers [47] and Naughton [48] to provide a definition of MT-HMLV
facilities that meets the current reality of these facilities. Then we review global and
local HSVF metrics with an eye toward their use for MT-HMLV facilities. Finally, we
address the lack of strategic value in currently applied HVSF metrics to MT-HMLV
facilities through the inclusion of selected R&D metrics, which focus on innovation.
This value is perhaps most succinctly put by Michelin and Berg [43] in their seminal
piece “ROI is not enough.” This is directly opposed to the nature of HVSF metrics,
which imply that, not only is ROI an important consideration, but it is indeed the only
consideration.
We utilize the case study method to ferret out both the differing natures of HVSF
and MT-HMLV facilities and to define the state of operational and strategic metric use in
MT-HMLV facilities. We found that metrics, meant to guide the efficiency of large
volume foundries were not easily applied to MT-HMLV facilities. Further, we find that
even through smaller than their HVSF cousins, semiconductor like MT-HMLV facilities
are defined by greater complexity. Finally, that MT-HMLV’s have a more arduous
pathway to demonstrate value to stakeholders and posses less well defined operational
characteristics.
MT-HMLV facilities metrics usage has meet with varied operational success.
Indeed some are so frustrated with their initial spans that they use none at all. Even those
MT-HMLV facilities that use some subset of the established metric base developed for
7
HVSF’s use them reluctantly. This conundrum has provided an environment where
managers of MT-HMLV faculties are not able to effectively use even a minimum
common set of metrics. Managers making strategic decisions to invest or disinvest see
this as problematic. They seek to operate their facilities effectively and to do so with a
metrics management approach. We take knowledge from literature and case studies to
develop a Metric Selection Model.
If we do not have a method for effective operational management tools nor a
direct method for effectively communicating their strategic value compounded occurring
in a time of recession and increased globalization, then these facilities are at risk. If they
are truly the harbingers of the next economy and these facilities have ineffective
management practice that dissuade many to invest in them then there is cause for
concern.
In order to use the “Small Tech” solution set effectively one resource intensive
asset is required – a fabrication facility. Many agree that innovations created at the
interface of micro-technology semiconductor micro-fabrication and nanotechnologies are
critical to 21st century firm and regional economic success. We provide the model, which
is designed to meet the strategic and operational requirements of a MT-HMLV facility.
This model allows a metrics approach designed to meet the needs of the diversified group
that is MT-HMLV facilities stakeholder group. Finally, we suggest future research to test
the findings to other MT-HMLV manufacturing facilities.
II. Literature Review

8
We developed a literature review to ascertain the state of knowledge of
operational and strategic metrics for MT-HMLV facilities. Furthermore, we focus on
metrics as a management tool. Finally, we find gaps in the literature and practices that
need to be included in this investigation and form the basis for our model.
We initiate our literature review with a discussion of metrics categorization.
Many researchers have noted the differences between product and process metrics [21].
Others have noted the differences between continuous processes (i.e. semiconductors)
and more job shop like operations like Micro and nanotechnologies [13]. These two
concepts provide great value to our discussion of effective metrics for MT-HMLV
facilities and help build a connection to our metric selection model. MT-HMLV
managerial practices suffer from the direct application of metrics developed for facilities
with are intrinsically different in nature and provide radically different outcomes. We
address this inequality with use of Hayes and Wheelwright [24] process product metrics
approach, which helps to explain the correlation between product and processes. To date
these ideas have not been applied to the MT-HMLV facility.
Metrics developed for commercial high volume semiconductor facilities are
efficient centric whereas MT-HMLV’s are job shop intensive. Using this model, we see
MT-HMLV facilities are job shop intensive, whereas HSVF are categorized as
commercial. Trying to apply metrics from one extreme, transferring to the other has not
proved effective. For example in HSVF, research has shown that wafer starts and yield
proves to be the universal metrics and added to that is the push towards automation [21].
MT-HMLV facilities are characterized by high product mix and low volume.
Their products and processes are unique in nature. This creates the need of a more

9
flexible factory environment. Hence, high volume, low mix metrics cease to be an
effective measure of operational and strategic success. Moreover, when innovation is
emphasized in semiconductor like facilities, lot moves become the more defining metric
[21]. No wonder the unfettered application of HVSF metrics to MT-HMLV facilities is
so problematic.
Understanding the fundamental differences between MT-HMLV and HSVF
provides a starting point for effective management. We focus on three literature streams
to assist us in developing our model. We seek first to derive value from metrics
developed for traditional MT-HMLV facilities, then continue with: HVSF metrics and
finally analyze relevant R&D Metrics literature.
II.1 Multi Technology High Mix Low Volume Facilities (MT-HMLV)
Myers introduced the term Multi-Technology High Mix Low Volume in 2000
[47]. Others have expanded this semiconductor centric original use to include the
research and development aspects of facilities that emphasize not only semiconductor
micro fabrication, but also Nanotechnologies [48]. Still others suggest that MEMS and
Nanotechnology facilities differ greatly in operation and strategic value to a firm when
compared to HVSF facilities [64].
Here Naughton demonstrated the difference in tool alignment between HSVF and MT-
HMLV facilities [48]. Naughton provides evidence that shows provides that that the
nature of the MT-HMLV facility workflow differs from HVSF and these tools must
mimic these needs. Naughton also suggested than any product produced in quantities of
less than 1 million should be consider low volume. However in today’s MT-HMLV
facilities, even the LV portion of this acronym has changed greatly. Now LV or low

10
volume can mean tens of thousand of parts, but for the large majority of their MT-HMLV
product efforts, they are more likely to be at the 1000 quantity range and for a R&D
intensive environment an order of magnitude less than that [66].
This work together with Walsh’s earlier effort, which focuses on the operational
and strategic management problems firms endure when converting older semiconductor
fabrication facilities for MEMS and Nanotechnology utility [66]. These efforts provide
the confirmation for the inclusiveness of MEMS and Nanotechnology in MT-HMLV.
Furthermore, the investigations illustrate even more greatly the differences between
HVSF and MT-HMLV facilities.
Further, we use the High Mix (HM) portion of the acronym to mean not only
many differing semiconductor products, but also tasks of product and process maturation,
innovation, design validation and many other types of efforts that are not centered on a
product production utilizing a matured process [51]. Is it any wonder that HVSF based
metrics that did not fit the earlier form of MT-HMLV facilities would now even be
further off the mark? Another basic difference in our uses of the term MT-HMLV is
found in the MT portion of this acronym. Earlier works for the most part used the MT
portion to mean differing semiconductor technologies, whereas we use this portion to
mean three distinctly differing technology bases. They are semiconductor micro
fabrication, nanotechnologies and MEMS. Here Nano and MEMS technologies are
technology platform on their own and not necessarily simply extensions to semiconductor
micro fabrication [29]. There is a much larger difference between these base
technologies and differing forms of Semiconductor micro fabrication than just the
material usage and processes.
11
.
II.2 HVSF Metrics
Metrics have become the “defacto” operations management performance standard
for HVSF facilities. The era of metrics management in semiconductor micro fabrication
was introduced during the semiconductor micro fabrication industry transition from
grown junction semiconductor technology of the 1940’s to semiconductor surface
technologies in the late 1950’s [55], [30], [44]. Today, most semiconductor chips are
silicon based and fall into well-defined product areas. The ITRS roadmap has broadly
categorized these into four categories: microprocessors/microcontrollers, memory devices
(RAM, ROM EPROM), power and smart power [26]. The semiconductor industry
produces well over $261.2 billion in commercial products and is found in nearly every
aspect of our life [56]. Counterintuitive too many, despite this success, the number of
semiconductor micro fabrication facilities worldwide is shrinking. This is due to
processing convergence, the advent of huge facilities, the exceptionally large facility
investments required to build modern fabrication facilities and the resultant volume
requirements for its efficient production. These facilities are simply out of the resource
scope and product quantity requirements of most firms.
These capital intensive, large diameter silicon based semiconductor micro
fabrication facilities, are managed through metrics designed to maintain both cost
effectiveness and yield efficiency. The modern production of semiconductors follows a
two-step process: front end and back end and are customarily performed in separate
facilities [26]. But even here, there is more influence of back end than front end
processing for metrics. We will investigate the HVSF metrics usefulness to operation

12
and strategic management of MT-HMLV’s. We then build on Sattlers’ [52] and others
semiconductor metrics classification schemes. We do this by bifurcating these metrics
into those focused on an entire process or “global” metrics and those more focused on
specific process steps or tools or “local” metrics [37].
II.2.1 HVSF Global Metrics
Many global HVSF metrics focus on productivity and yield, but not all. For
example, Goldrat in “The Goal” discussed metrics dealing with throughput and lot moves
[23]. Some measure of lot moves due to the high mix and low volume nature of MT-
HMLV facilities are essential metric. We provide a selected list of global metrics in
Table 1 below. First we will discuss the utility of HVSF yield and wafer start metrics in
a MT-HMLV environment. Next, we will address the utility of Cycle Time (CT) and
Work in Process (WIP) measures [52]. Finally, we discuss the information, simulation
automation, clustering and facilities upgrade project targets in the landscape of MT-
HMLV facilities.
One of the first set of metrics utilized by HVSF facilities leveraged the concept of
benchmarking HVSF stated capacity versus actual wafer starts and focused their efforts
by the year, month, week and day [7]. This was furthered investigated by Leachman,
who linked yield to actual wafer starts as a facility approached capacity [34]. Sattler
improved this concept by adding product mix and the required number of process steps
[52]. In order for these types of measures to be useful in MT-HMLV facilities, the
product mix effect would have to be modified with the addition of differing types of

13
efforts in the fab and differing types of technologies. This would lead to a greatly modify
model that would recognize lower wafer capacity.
CT measures are essential to HVSF operation management and many of these
focuses on traditional bottleneck processes. A common methodology for this type of
global metrics is found in lithography layers per stepper per day [26]. Jacobs stated that
by reducing bottleneck processes, stagnation time’s leads to the reduction of cycle time
[28]. Both Dietrich and Maynard further this concept by stating the solution of a
bottleneck is not simply tool redundancy, but rather lies in tool and facility understanding
[14], [38].
These metrics are based on a deep understanding of HVSF facilities and simply
do not translate well to the realities of MT-HMLV facilities. The related WIP papers of
first Sattler, Fallon and then Bonal are exceptional measures for very low mix facilities.
The idea of streamlining processes for a singular product does not meet the realties of
MT-HMLV facilities where flexible high mix and large process scope is essential [52],
[17], [8].
We next discuss metrics developed around computer-aided efforts. Many of these
applications hold promise for MT-HMLV facilities due to the nature of parameters or
bound shifts. For example, modeling is used to define bottlenecks for HVSF and
modifications to this process might make it applicable to MT-HMLV facilities [22]. Wu
discussed the focus change in a re-facilitation effort. He described a transitioning from
300mm efforts to 450mm [68]. Tool clustering metrics must be developed along scope
of process than one process. Many of the MT-HMLV facilities are older semiconductor
facilities, which have been refocused. Given this fact, Goodall along similar lines

14
discussed tool re-clustering for high volume facilities [24]. If the switch from a narrow to
a more open production environment, then in order to use this concept in MT-HMLV
facilities, we must switch the discussion from a narrow to more open production
environment. Finally, the exploration of limiting information flow in order to streamline
efforts was accomplished and was shown to be effective for HVSF [27]. This type of
metric is exceptional for HVSF, but proves less than useful on efforts that are not well
defined.

15
Table 1. Global
Metrics
II.2.2 HVSF Local Metrics
Modern HVSF facilities produce products that routinely exceed 500 individual
process steps. Yield and efficiency originate at the tool base or local metrics level.
HVSF routinely achieve overall yields of over 90%. This means the process steps must
yield perfectly [4], [5]. We provide a selected group of HVSF local metrics in Table 2
below.

16
We have provided four distinct groupings that are representative of the local
metrics used in HVSF. The first group is focused on labor contribution. The second
group’s concentration is local tool temporal contribution to Work in Process and Cycle
Time. The third group focal point is a group of metrics that focuses degree of tool base
process’s latitude over the diameter of a wafer or uniformity. Finally, the fourth group is
a set of metrics that focus on a tools contribution to the capital structure of the fab based
on reinvestment, tool lifetime measures and contribution to maintenance.
One of the labor contributions metrics is driven by automation versus a more
labor-intensive fabrication and was discussed by Appleyard and Brown [4]. Even though
less than 10% of the production cost of any fab based product is found in labor
contribution, the cost is of concern for HVSF facilities [5]. The crossover point holds
great significance for HVSF, but is not very attractive to the more labor-intensive MT-
HMLV facilities. Croft furthers this discussion by suggesting that production facilities
should all embrace automation at some level [11]. This again provides limits on insights
for the production nature of the MT-HMLV facilities.
Another important local metric for HVSF’s is for a given tool, temporal
contribution to work in process cycle time. Meyersdorf and Taho [40] showed that
individual tools temporal performance could be improved by use of the proper metrics.
Carrying forward this notion was Konopka and Trybula [32] through the use of Work in
Progress (WIP) based metrics. Finally, Foster and Nugent [18] linked individual tools
temporal metrics to overall HVSF profitability. While these measures are exceptionally
useful for a HVSF, the temporal performance measures must be modified to be applicable

17
to MT-HMV facilities. Here, the transference of wafer starts to lot moves would provide
value to the MT-HMLV facility.
Next, metrics are used to provide overall wafer process uniformity often focusing
on the process latitude of a particular tool over the diameter of the wafer. Mozumder,
Saxena and Taylor [45] found process uniformity across the diameter of a wafer in a
particular tool setting had profound overall yield implications. Smith [57] repeated the
study on larger diameter wafers finding similar results. The scope of tool processes in
MT-HMLV facilites creates problems for the user of this metric. Here we suggest a lot
yield metric.
The final group of HVSF local metrics focuses on a tool contribution to the
capital structure of the fab based on reinvestment, tool lifetime measures and contribution
to maintenance. Hallas [19] discusses the tool contribution to overall cost of the fab
while Miller [42] analyses tool performance and reinvestment. Limanond [35] and Kim
[31] focus their investigations on specific tool processing such as etching, metallization
and lithographic tools and then discuss the overall contribution to cost of a HVSF.
However, HVSF tool selection is focused not on design performance factors such as
flexibility of processing, but on their effectiveness of one single process or product
platform. The result is a tool of limited with a process capability. Here again a tool for
MT-HMLV should be chosen for scope capability. Unfortunately due to the extreme
nature of MT-HMLV fabs these measures often lead to poor tool choices whereas
flexibility of a particular tool is a critical dimension.

18
Table 2: HVSF Local Metrics
II.3 Research and Development Metrics
MT-HMLV facilities act as engines of innovation, centers of new product and
process creation, developers of proof of concept and innovation and invention centers at
the interface of converging technologies [65]. These tasks diverge greatly from the
modern HVSF facility and are much more in line with the strategic and tactical roles
found in R&D and commercialization organizations. HVSF facilities provide no metrics
focused on this core aspect of MT-HMLV facilities. Here the authors investigate the
plethora of R&D and innovation based metrics as to their potential application to these
facilities.
We provide in Table 3 a review of potentially interesting innovation metrics. We
categorize them by decision-making, product and applications, process focused and a
discussion of metrics on metrics evaluation. We begin with the review of R&D metrics
focused on decision-making. Secondly, metrics focused on products and the applications
are examined. Thirdly, the R&D process and metrics is scrutinized. Next, R&D

19
performance versus value literature is reviewed and finally, the evaluation of metrics by
using metrics in a R&D setting.
Innovation management has utilized metrics for decision making for many years
[1]. The potential of metrics to condition data and information in a manner that provides
knowledge in a very useful and compact nature was studied by Pich [50]. Pich stated that
metrics proves easily assimilated knowledge, that easily provides assimilated knowledge,
which is useful. Drongelen [15] further suggests that metric selection for maximum
utility is paramount to their effective use. Adams introduced a framework for innovation
based decision-making processes using metrics [2]. While this basic knowledge is
important, the sufficiency of data and the correct application of information are essential
to the managerial supervision of a MT-HMLV facility.
The focus of a R&D based innovation center is to transfer knowledge, re-invent
the corporation, provide new technology product paradigm platforms and make existing
technology product lines better faster and cheaper [65]. Yet all MT-HMLV facilities
have differing focuses. Meyer suggests tailoring metric use to innovation and R&D
facilities activities [39]. He suggests differing metrics for those facilities that revolve
around basic research versus core technology exploration and finally applied market
research. Chen and Chen evolved this concept by further investigation into the parallel
use of metrics in both R&D and marketing efforts [10]. The multi-faceted nature of MT-
HMLV facilities suggests a specialized set of metrics that encompasses their mission
scope.
Metrics utility in managing a firm’s innovation modus operadi has been
extensively investigated. Szakonyi [58] proved the necessity of metrics for the effective

20
management of a R&D process. Schumann duplicated this work [54]. Multiple objective
and subjective methods for applied metrics in R&D situations was explored by Werner
and Souder [67] and directly correlates too many of the MT-HMLV facilities. Hauser
[23] for example, suggested differing metrics sets for facilities focused on research,
development or engineering. The efficacy of R&D activities by firm industrial leaders
showed by increasing funding in R&D for these facilities increased their market
dominance [49]. When there are different mixtures of R&D, primarily in the private
sector, it is extremely difficult to choose one or a set of metrics for a MT-HMLV facility
due the ever-evolving product lines. Projects may be shelved for a period of time or even
extended, which makes the use of applied metrics that much more challenging.
The use of metrics can also be used to convey a performance attribute for a firm
and Bagieri [6] surveyed this concept. Using stakeholders instead of shareholders the
fundamental contribution of R&D in a firm was examined. While metrics are a necessary
managerial decision-making tool to operate a facility efficiently, the use of metrics to
provide a framework of information to stakeholders is extremely difficult at best.
External stakeholders tend to lack the specific knowledge about MT-HMLV facilities to
understand their importance. Internal stakeholders are predisposed to their prejudices,
which affect the interpretation of those chosen metrics.
The last section that the authors investigated encompasses using metrics to
examine the metrics of a firm. Mihm [41] investigated this idea by examining system
design metrics and by using local metrics. He found by using local metrics as an
integrated knowledge base, a complex system could be devised and improved. Another
concept of looking at metrics was investigated by Chen [9]. Here, they used a data

21
framework, Data Evaluation Analysis (DEA), to evaluate R&D performance and found
that a semiconductor R&D performance can be improved. Since the understanding of
metrics and their applications are under investigation, the use of another metric upon a
metric seems redundant. . The investigation of metrics based literature and the nature of
MT-HMLV facilities, provides us with the foundation to build the Metric Selection
Model (MSM)
Table 3: R&D Metrics
III Methodology
We employ a case analysis methodology to generate an understanding of the
differing imperatives, nature and metric utilization of MT-HMLV ad HVSF facilities. .
We utilize the case method to investigate potentials of the case study depict differences
not only between HVSF and MT xx but also between differing MTHMLV facilities. We

22
have utilized Yin [69] and Eisenhardt [15] case study techniques to interview and analyze
our four MT-HMLV facilities and one HSVF facility.
We provide the finding from our case study analysis section table 4. IN figure we
discuss the Section 3.1. We further our case study by administrating a structured survey
to all five firms. The survey probes the firm’s metric utilization and we provide results
in table 5 Section 3.2 detailing
III.1 Initial Case study Results
Our case study analysis focused on 21 characteristics of fabrication facilities. The
range of these characteristics range from basic technologies to more specific subjects
such as the degree of automation in the facility. We segments our characteristics into
four groups The first group is the number and nature of technologies in use in a
particular fab The second group deal with the relative mix of products at high mix
facilities. Included in this is measure is the number of products, processes developed,
innovation efforts embraced and research efforts taken at a specific fab. The third group
speaks directly to facility utilization and includes measures such as number of wafer
starts and use of tool capacity. Finally the fourth group was developed during our case
study data gather and is far more specific in nature and include measures such as metric
usage, tool availability, engineering holds, changes in tool setup, tool scope and amount
of automation in a particular facility..
We initial the discussion with group 1 found in Table 4. Here we focus on three
technologies platforms; semiconductor fabrication, MEMS and Nanotechnology.
A fabrication facility is said to have a semiconductor micro fabrication capability if it has
a Bipolar or CMOS front-end process. A foundry having MEMS capability has a full

23
front-end process for one of the three types of MEMS Process basis (sacrificial surface,
bulk silicon micro-machining or high aspect ratio MEMS. A facility is said to have a
nanotechnology capability if they have a bottom up or top down nanotechnology
capability. We examined four MT-HMLV facilities and one HVSF in order to develop
an understanding of their differing nature of HSVF and MT-HMLV. Further this allows
us to illustrate the differences within MT-HMLV facility community and their respective
differences. The results of our investigation are found in the first three rows of Table 4
Next we looked at the High Mix portion of the MT-xxx definition. We
operationalized through the number of different products produced at a single facility ,
the amount of research versus product production lot starts, the number of processes run,
the number projects completed, the inclusion of an innovation mission and the inclusion
of a research mission. They are found in rows 4 through 9 in table 4. We also defined
volume in rows ten and 11 by the categories of number of wafer starts and tool capacity.
The final nine characteristics are in group 4 and are much more specific and found under
in table 4.
There are major differences between our 5 case study facilities. When looking at
group 1 characteristics, for example, all of the MT-HMLV facilities have three major
technology platforms whereas HVSF’s have only one product platform. When
examining group 2 characteristics the difference between HVSF and MTHMLV facilities
are stark. Yet the number of products produced by these facilities range from hundreds to
50. Further there exists a slight but significant difference in relative use of the facility for
production versus research.

24
Table 4: Case Study Results
Again when we examine group three characteristics we see dramatic difference
between HVSF and the MTHMLV facilities. Yet here again there are significant
difference between the MTHMLV facilities. These facilities run from 10,000 to less than
1,000 wafer starts. Finally in group 4 we see again an extreme difference between
MTHMLV facilities and the HVSF facility. Further there are significant differences
within the MTHMLV community of facilities.
25
We see visually that multiple root technologies greatly increase production line
complexity and generate huge tool compatibility and flexibility issues. This creates a
work environment where tool scope rather than tool efficiency when used in any single
technology process becomes the dominant characteristic for tool selection. Further, all
HVSF firms use some form of metrics, including many that are tool based or local
metrics. Moreover a recurring theme in all the MT-HMLV facilities was the view that a
global wafer starts metric so important for HVSF facilities provided them no or little
value. Finally, lot moves usually not seen as exceptionally important for HVSF facilities
were seen as providing exceptional value to the operation of MTHMLV facilities.
The MT-HMLV facilities focused on flexibility, rather than standard product
manufacturing efficiency like their HVSF counterparts. MT-HMLV individual
processing steps are just as critical as those in HVSF but their integration measures take
on new dimensions. For example, MEMS process times are often longer due to their use
of silicon and other materials in both a structural and electrical manner rather than just
electrically as in HVSF. Finally, the vary nature of structural material changes in bottom
up nanotechnology provide process complexity issue never encountered in a HVSF
facility.
The case study analysis showed us that the very nature of MTHMLV facilities
were so far afield from HVSF that the simple transference of metrics utilized to operate
HVSF were not going to be effective in MTHMLV facilities. More interestingly we
found a great diversity of mission, scope and process activities within the MTHMLV
facility. A characteristic we did not expect to find. We decided to further our
understanding MTHMLV facilities through a directed questionnaire. We developed the

26
questionnaire using Fowler [CC] questionnaire protocol in order to more deeply
understand their utilization of metrics.
III.2 Questionnaire development and results
We developed a metrics based questionnaire with 16 quires and sent them to
selected individuals at all four pre screened MT-HMLV and one HVSF facilities. We
sent them to the HVSF facility as a matter of completeness. All of the respondents
remain anonymous due to the sensitivity of their work assignments. We provide our
survey results in Table 5.
The first question acted as a general introductory inquiry into the subject of
metrics in a MT-HMLV and HVSF facilities. Four out of the five interviewees responded
that they strongly agree with the use of metrics is an enormous benefit to the management
of the facility. The lone stand out was neutral in the subject area and came from a
MTHMLV facility. The second question asked if MT-HMLV metrics are highly
borrowed from the HSVF industry. All of the respondents agreed or strongly agreed to
the question. The third question inquired into the percentage of HVSF metrics that apply
to their particular situation. Two MTHMLV respondents stated that the percentage of
useful to them HVSF metrics were from 0 to 25%. The other two MTHMLV
respondents answered with 26% to 50% and 51% to 75% and 100% respectively.
The next question concerned actual metric use and their effectiveness for the
efficient operation of their MT-HMLV and HVSF facilities. Three MTHMLV
respondents stated that they strongly believed little value was gained from their use, one
MTHMLV responded with a statement that any metrics were better than no metrics at all
and of course the HVSF was quite pleased with their use.. The next question is a sidebar

27
of the previous in that it relates the application of metrics to establish value to the
stakeholders of the facility. Again, the results mirrored the previous question with one
disagree.
The next set of questions was designed to introduce the concept of global and
local metrics. Question number six asked if HVSF metrics emphasized wafer movers.
Four individuals strongly agreed with the statement, with one individual disagreeing.
Question seven asked about lot moves and it was agreed and strongly agreed to that lot
moves were used as a better performing metric than wafer moves in MT-HMLV
facilities. Questions eight and nine dealt with HVSF’s and the how the metrics stifle
technology experimentation and how the HVSF’s focus is metrics on single processes. In
both cases, all five respondents agreed and strongly agreed to the proposed question.
The next two questions inquire about MT-HMLV’s strategic intent and the need
for new metrics when dealing with these facilities. All respondents agreed strongly to the
strategic intent of a MT-HMLV are a multi-technology, multi-product, low wafer start
facility. In respect to the need of new operational and strategic metrics, three out of the
four agreed strongly to question, with the fourth individual also agreeing.
The next question was a departure from the previous style of inquiry. Each
individual was asked to pick from a list or provide examples of their metrics that are non-
traditional and used in their facility. Each respondent provided a different of answers to
the question. The first individual reported that lot moves and the number of multi-
technology based products were how their MT-HMLV measured performance. This is in
correlation to the next respondent whom also mentioned lot moves, but added that
process steps metrics were also important. The third respondent placed fab utility as a

28
metric, whereas fab utility is the percentage of the facility that is being utilized to full
capacity. The fourth respondent answered that patents and the number of research papers
produced was a principal metric for the organization. The HSVF response was that wafer
starts and yield is the most important metric.
Table 5: Metrics Comparison
The next array of questions asked for a numerical value for the global and local
metrics that each MT-HMLV used. For global (integrated) metrics, one individual
answered 0 to 2 metrics were used; one had a response of 3 to 5 metrics. Very few global
or integrated process metrics are being used by those interviewed with the exception of
the HVSF, yet they all state a necessity for one that is accurate. Most suggested a metric
move from wafer starts to lot moves. All five stated once more that they employ local or
tool based metrics. Two of the fabrication facilities stated they utilized 16 or greater
local metrics.

29
One of the individuals interviewed, listed the number of papers that are published
and the patents that are applied for as their global metric. Some facilities still use these
metrics over local or global style metrics. It is apparent that some MT-HMLV facilities
still prefer this method of a performance metric. With patent or bibliometrics style
measures, they do count for global or local metric measures and are difficult to place a
value on for stakeholders. This is in direct contrast to the last question of whether or not
global metrics would benefit the MT-HMLV and the stakeholders.
We have shown that MT-HMLV’s and HVSF’s are different by nature and
require different metrics to operate efficiently. Further, we have shown that a great
variety of metrics exists in the nature of the MT-HMLV facilities. The leads us to the
development of not the right set of metrics for an MTHMLV facility but rather a model
where a set of metrics are presented to MT-HMLV facilities managers from which they
can select the metrics the meet the mission an operational realities of their facility. A
model we name the MTHMLV facility Metric Selection Model.
IV. Model Development
All of the MTHMLV respondents recognize the importance of a metrics based
management system for their facilities but stressed the need for a new and fresh
approach. A metrics approach designed to both assess the strategic and operational
effectiveness of a MT-HMLV facility and convey that assessment to others. We start this
approach with the knowledge that metrics follow the nature of a fabrication facility and
that fabrication facilities can be thought of in terms of capacity and capabilities. It is

30
exactly in the capabilities and capacity realm that HVSF and MTHMLV facilities are so
vastly different.
The misalignment of facilities based capacity and capabilities are at the crux of
the problem of simply transferring HVSF metrics to MTHMLV facilities. MT-HMLV
respondents recognize that direct application of HVSF to their facilities did not assist in
improved operational effectiveness. Nor did they effectively convey their strategic value
to their stakeholders. In fact, in many cases, the use of HVSF metrics at MTHMLV
facilities actually hampered their ability to obtain resources from stakeholders as well as
run their “shop” effectively. Further due to the wide variety in mission and operational
capability in MTHMLV facilities it seemed doubtful that one set of metrics would be the
varied needs of these facilities.
Indeed, MTHMLV success cannot be measured by the HVSF rubric of yield. Yet
yield is always important in these facilities and often getting any yield might be
considered a success. Yield must be seen in the light of the mission, capabilities and
capacity of the facility. The value of MT-HMLV facilities lies in their ability to produce
new products and processes, critical products, provide a facility that embraces iterative
lot runs utilizing nontraditional process technologies and becoming the cradle of
innovation at the convergence of technologies. Their ability to prove out product design
through design iterations based on real manufacturing feedback and their ability to take
an embryonic technological process and create a stable manufacturing platform. Indeed
ROI is not enough.
Throughput measures are important for any manufacturing facility. Wafer starts
are the “Defacto” throughput standard for HVSF yet the more effective throughput
31
measure for the vast majority of MTHMLV facilities is Lot moves. Lots are the true unit
of analysis in the MTHMLV facility where each lot will require tool recalibration and
differing WIP routing. Lots in these facilities can be comprised of a little as a single
wafer fragment. Yet to say that wafer starts are not valuable to MTHMLV facilities
would be in error.
Indeed, MTHMLV success cannot be measures by the HVSF rubric of yield. Yet
yield is always important in these facilities but often getting any yield might be
considered a success in the MTHMLV facility. Yield must be seen in the light of the
mission and capabilities of the facility. The value of MT-HMLV facilities lies in their
ability to produce new products and processes, critical products, provide a facility that
embraces iterative lot runs utilizing nontraditional process technologies and becoming the
cradle of innovation at the convergence of technologies. Their ability to prove out
product design through design iterations based on real manufacturing feedback and their
ability to take an embryonic technological process and create a stable manufacturing
platform. Indeed ROI is not enough.
These realities suggest the development of a number of metrics from which a
subset can be utilized for the specific needs of a particular MTHMLV facility.
MTHMLV specific metrics designed to directly support the managerial requirements
generated by the desperate missions and capabilities of MTHMLV facilities. We have
developed a model, the MTHMLV Metrics Selection Model, which is designed to assist
these facilities to accurately assess their operational and strategic effectiveness and value
based on the mission and capabilities inhering in their facility. Our model builds on
Hayes and Wheelwright separation of manufacturing facilities into 4 distinct categories.

32
The realties in the MT-HMLV world is that these facilities are not distinctly in any of
these categories. Rather MT-HMLV facilities occupy more of a continuum role where
they provide value in all of these sectors. They require a metrics management approach
that is flexible enough to meet the needs of all 4 types of facilities.
We have developed a 3 factor approach for a firm’s investment and operation of a
MT-HMLV facility. Those factors are mission focus, capability scope, and capacity. We
operationalize each of the factors in accordance with the nature of MT-HMLV facilities.
33
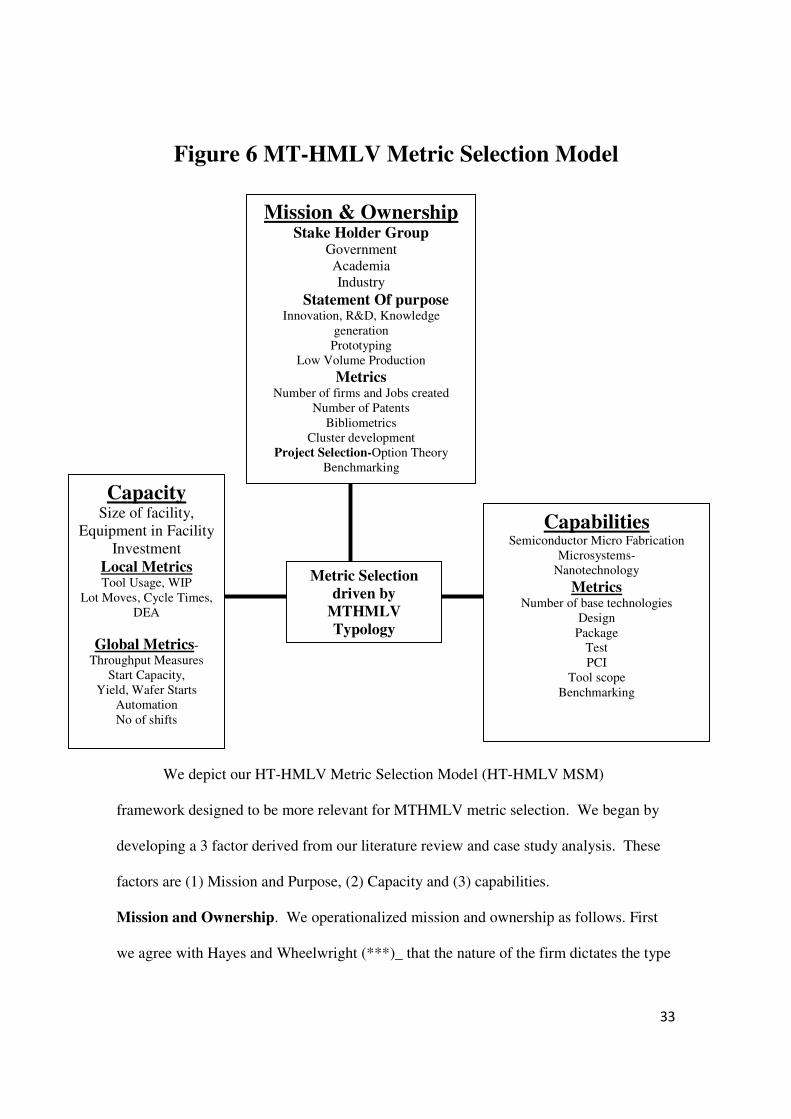
Figure 6 MT-HMLV Metric Selection Model
We depict our HT-HMLV Metric Selection Model (HT-HMLV MSM)
framework designed to be more relevant for MTHMLV metric selection. We began by
developing a 3 factor derived from our literature review and case study analysis. These
factors are (1) Mission and Purpose, (2) Capacity and (3) capabilities.
Mission and Ownership. We operationalized mission and ownership as follows. First
we agree with Hayes and Wheelwright (***)_ that the nature of the firm dictates the type
Metric Selection
driven by
MTHMLV
Typology
Mission & Ownership Stake Holder Group
Government Academia Industry
Statement Of purpose Innovation, R&D, Knowledge
generation Prototyping
Low Volume Production
Metrics Number of firms and Jobs created
Number of Patents Bibliometrics
Cluster development Project Selection-Option Theory
Benchmarking
Capacity Size of facility,
Equipment in Facility Investment
Local Metrics Tool Usage, WIP
Lot Moves, Cycle Times, DEA
Global Metrics- Throughput Measures
Start Capacity, Yield, Wafer Starts
Automation No of shifts
Capabilities Semiconductor Micro Fabrication
Microsystems- Nanotechnology
Metrics Number of base technologies
Design Package
Test PCI
Tool scope Benchmarking

34
of managerial metrics required Then, we define these facilities nature through its
mission and ownership. Next we develop a set of metrics that might be selected to
demonstrate strategic value of the facility through a variety of metrics that meet the stated
mission and speaks to the ownership group.
Our MTHM:LV facility are tasked with a variety of mission including; increased
innovation, job and regional wealth creation, R&D, Prototyping, and low volume
production. We individually operationalize these factors. We use bibleometirc measures
as the metric for R&D, knowledge generation and innovation. The bibleometric units are
Innovation awards, journal articles, citation rates and licenses as their metrics. Further
some MTHMLV facilities are tasked with the necessity to produce low volume products
usually tied to a specific stakeholder group. Here we utilize capacity measures. Fineally
most ownership is focused on regional development, jpob and wealth creation. Here
metrics are numbers. Number of employees, firm attraction and spinouts.
Capacity
We considered and cataloged the different types of business units into three
distinct, but separate groups in the model. The first group is industry partners. They
include commercial, for- profit research and development labs. The group also includes
R&D division of a firm. The focus of both entities is to create innovative products for the
commercialization in a timely and cost effective manner. Next are governmental
partnership faculties. These include federally fund national labs, NASA and Department
of Defense Research Labs. Their ambition is to seek new approaches to challenging
technical issues and produce a product using nonstandard methods in extremely low
volumes. Last, are those labs, which are in academic situation. Each of these units

35
requires a distinct managerial style, which influences the outcome of the HT-HMLV
MSM. The management approach of a federal funded national lab is quite different than
a profit research and development MT-HMLV facility. Thus internal corresponding
variables must be taken into consideration.
The inclusive mission of each group is unique also. Government relies on the
number of patents, job formation and strategically, a firm and stable foundation on which
to base new applications of gain knowledge. Academia is different in the fact that it
revolves around knowledge creation and education of future engineers and technologists.
In this situation, patents are a primary metric for them, with economic outcomes being
secondary. Industry is different from both previous entities in that fact that business units
seek stable processes in order to generate products. Examples of such metrics would
include project selection and lot moves.
Next is the block containing the term Statement of Purpose. The use of the
expression Statement of Purpose is linked to the modified Hayes and Wheelwright
model. The model shows the relationship between type of inquiry and the production of
products or services. As the progression from pure research to applications to product
takes place, there are divergent methodologies that are used in HT-HMLV facilities and
thus differing metrics. For example, an applications element differs from a R&D unit.
Moving diagonally down the line, a different approach is used in prototyping and entirely
different tactic in low volume production. Each of the four steps in the modified
Hayes/Wheelwright model requires an individual structure of metrics in order to achieve
the desired outcome and success.

36
The area of Strategic Metrics is perhaps the best known and also the most studied.
As MT-HMLV facilities act as engines of innovation centers of new product and process
creation, these centers are at the forefront of cutting edge technology. To provide support
for the decision making process that are occurring in these centers, the proper use of
metrics are needed. We have identified three core metrics for the block. They are
decision-making processes, application of metrics and metric evaluation. The first step
here is the decision-making processes. Project selection permits both a macro view of the
venture into manageable part quantities and a temporal value placed on the project. The
use of option theory can be used to an advantage in R&D operations. Options provide not
only a monetary value, but a temporal assignment to objectives, which must be meet or
the project is terminated. If the objectives are met, then the project continues to the next
phase. Using option theory also provides additional value since the approach attempts to
provide a technological outlook for the future, thus projects can be accelerated or slowed
to fit the outlook. Once a project is selected, specific global and local metrics can be
chosen and adopted to fit the requirements of the each individual endeavor. Intertwined
with project selection is the choice and evaluation of metrics. As the project evolves, the
metrics must evolve also. Metric selection and evaluation should be consistent and
diligent during the process.
The block adjacent to strategic metrics is Operational Metrics. These are the best
known, but least understood classification of metrics. Operational metrics are bifurcated
into the Global and Local metrics portions of the model. Starting with the Global portion,
the approach for MT-HMLV is founded on the Lot Move concept rather than the Wafer
Start Concept. Cycle times and the subset metric of Lot Moves are best used in MT-

37
HMLV faculties. These metrics best describe the performance nature of the project.
Trying to predict a schedule in an unpredictable situation is difficult at best. With
numerous incidences as engineering holds, hot lots and project termination accounts for
temporal disturbances. Lot Moves provide information in numerous methods.
Completion of a particular section of a project, time to complete and holds are all
accounted for in lot moves, as well as tool breakdowns. Cycle times can be used,
however they provided less information as they describe only the temporal added value
input to an output to an individual process.
One of the universally used metrics in HVSF’s is start capacity. Start capacity is
the measurement of wafers that can be started in a particular time, usually at the
beginning of a tool operation. This metrics helps locate bottlenecks in tool operation,
while increasing throughput. However in HT-HMLV operations, nothing is standardized
and each operation is different. The use of this metric is not suitable for HT-HMLV due
to the lack of standardization of products, lack of automation and re-tooling after specific
operations.
The Local Metrics portion of Operational Metrics is the management approach is
based on tool scope rather that tool efficiency. We must trade efficiency for scope, which
provides an efficient low volume production facility with metrics, whereas high volume
foundries metrics are so inefficient. The difficult portion is not the identification of
metrics, however the correct metric for the application. A common approach is the use of
one single metric. One metric for the entire operation is not practical and provides
information to operations. The single metric approach is by human nature the one that
provides the greatest self-satisfaction with the least amount of input. Countering this is
38
the diligence use of numerous metrics, which tend to cloud the purpose of metrics and
does not convey information in a distinct and clear way.
The Local Metric approach we have chosen for MT-HMLV’s are founded on tool
usage and tool capacity. The ability to use one tool for different operations is imperative
to the operation. Flexibility is the underlying principle and effects key metrics. In MT-
HMLV facilities the flexibility of tools is crucial to the operation stability. The ability to
change or re-tool for explicit operation is a normal in day-to-day operations. The metric
thus chosen here is tool usage. Even though tools have to be flexible in the environment,
the operational throughput for each tool has to be recognized and account for. Tool
Usage allows flexibility, but there still a need for whether or not a tool is operating at
peak efficiency. Here the metric chosen is tool capacity. Tool capacity allows operations
management to view if the processes that are required are meeting expectations
Yield is a critical dimension in HVSF’s. The operations that are performed must
achieve a particular yield in order for the HVSF to remain competitive in today’s market
place. With large capital investment and the decreasing price for standard
semiconductors chips, the need for yield is critical in high volume situations. However,
the use of yield is problematic in MT-HMLV facilities. With the design of new products,
comes an engineering challenge that must be overcome. The use of yield in such a
situation would be misleading to the stakeholders involved. Perhaps a better
measurement of outcome is the application of a Process Capability Index. Process
Capability Index (PCI). PCI is best described as using a sigma style process. Using the
desired specifications as a norm, the project can be mapped using three or six sigma for

39
yield and/ or quality control. Once the mapping takes place, outliers can be identified
and if the situation warrants, corrections made.
Both the operation and strategic metrics can make use simple statistics.
Choosing of what works and what does not, is the foundation of metrics and their
applications. However, there still is a requirement to compare individual processes and
their outcomes. The Metric Selection Model is based on a Data Envelope Analysis
methodology. The use of Data Envelope Analysis (DEA) was conceived for business
applications, but can be adapted to other applications. The basic premise for DEA is to
create a framework of Decision-Making Units that are benchmarked either internally or
externally. In metrics and the use of statistics in those metrics, a statistical approach is
characterized as a central tendency approach and it evaluates producers relative to an
average producer. In contrast, DEA is an extreme point method and compares each
producer with only the "best" producers. Those above the limit are efficient and those
below the parameter line are losing efficiency.
The strengths of DEA include that it can handle a multitudes if inputs and outputs
and doesn’t require an assumption of functional form relating inputs to outputs. Also,
with input and output variables, they do not have to be necessary related in function. This
provides a simple weighted formula to measure parameters. In regard to MT-HMLV
facilities, both internal and external practices can be examined and reviewed. The
limitations of DEA are an extreme point technique and “noise” can cause fluctuations in
measurement. DEA is able to estimate the relative efficiency of a DMU, but converges
slowly to an absolute. Lastly large problems are difficult without specific software and
statistical hypothesis tests are difficult.

40
With a DEA analysis, both the maximum and minimum performance parameters
are identified and plotted. Once this is occurs, then that metric can be intergraded into a
larger model for each process or tool use. The idea is to keep the system simple and
clear. All three categories of metrics: Operational and Strategic metrics can be measured
and placed into the framework of the model. Once each tier is measured they can be
compared to others. The beauty of DEA is that it can be used internally or externally for
measurement.
The HT-HMLV facilities block deal with three core areas: investment, size of the
facility and number of personal involved or more specifically the number of shifts. The
term investment deals with the amount of financial resources that were allocated. The
more allocations that are made toward a facility usually means that more advanced
processes that can be achieved. More importantly, than just square footage is the capital
investment of the current lineage of tools and equipment to perform the needed work
involve. As the search for technology advance, there must be a continuous investment in
those tools. Size of facility was another factor that was considered. With larger facilities
comes the convenience of more tools and the duplication of tools. This allows the
practice of parallel procedures that reduce WIP times greatly. The last item involved is
the number of personal that are employed at the MT-HMLV facility. As the number of
personal grows, which include engineers and technicians, the capability of the business
unit also grows.
Competencies are the principal areas in which the business unit is involved. We listed
three areas’ of which MT-HMLV facilities are involved with. Those areas are
semiconductors fabrication, micro mechanical electrical systems (MEMS) manufacturing

41
and nano technology development. Each business unit requires a different approach to the
subject of metrics. A semiconductor R&D facility and its process are going to be
different that those that are involved with nano technology. Whereas, semiconductor and
MEMS fabrication have similar attributes, although the MEMS creation takes multiple of
steps that the semiconductor process does not have to perform.
Using the Metric Selection Model is simple and forward. By knowing the
organization, how it operates and the mission of the institution, the model provides a
foundation on which to build a managed approach to the problem of metrics in MT-
HMLV facilities. For example, innovation and design centers are focused on creation of
processes. By using advanced materials and techniques, these centers are attempting to
solve tomorrow’s problems. However, by holding these centers to the same metrics as
HVSF or even prototyping MT-HMLV facilities are consistent with the model.
Innovation and design centers require tool flexibility and the metric lot moves. Research
and development overlays the innovation centers in the fact that lot moves and tool
flexibility remains the chosen metrics. However, the search for a stable process is on
going, which leads to prototyping. While lot moves is metric that is used here,
consideration must be made to breath of capacity. Low production facilities are going to
use lot moves and tool usage, since the transition has been made though innovation to
production. Each stage of the process and facility, must realize their own managed
approach to metrics.
VI. Conclusions

42
Building upon the current literature, we examined the differences in metrics for
Multi Technology, High Mix, Low Volume (MT-HMLV) and High Volume Silicon Fab
(HVSF) facilities. Most of the metrics in place now in MT-HMLV facilities are based
upon those of their counterparts. While these metrics work well under the automated
processes that are universally used in semiconductor facilities, they don’t fit the essential
needs for MT-HMLV facilities. Given the information that was proved by the
questionnaire, MT-HMLV’s prefer to use lot moves as the primary metric in their fabs.
All respondents also mentioned that given the current set of metrics under use today that
innovation is stifled and this subject is critical to the continuing improvement of
technology.
Using the questionnaire as a foundation for our research, we constructed a
framework of a managerial systemic approach to the use of metrics in MT-HMLV
facilities. The model known as the Metric Selection Model (MSM) provides a
framework for a systemic approach to metrics. By classifying the competencies,
organizational type and purpose of each business unit, different metrics and their
subsequent structure and methodology can be utilized. By separating the uses of metrics
in three classifications: R&D, Local and Global, different metrics can be used for the
situation. Option theory for project selection, tool usage and lot moves are considered the
best metrics to use. With the use of DEA and PCI, individual operations can also be
scrutinized. We also looked at the use of some common metrics for HVSF’s such as
wafer start and yield and showed the ineffectiveness in R&D settings. It is the hope of
this report that further investigation is undertaken into the area of metrics for MT-HMLV
facilities.

43
Bibliography
[1] Abby, Augustus and J. Dickson, “R&D Work Climate and Innovation in Semiconductors.” Academy of Management Journal vol. 26-2, June 1983 pp.362-368.
[2] Adams, J.D., E.P. Chiang, and J.L. Jensen ''The Influence of Federal Laboratory
R&D on Industrial Research,'' Review of Economics and Statistics, vol.85, November 2003 pp.1003–1020.
[3] Anson, S., M Kautt, S.T. Walsh, K. Bittner, “Academic Infrastructure and
Competence Centers for a potentially evolving Nano-manufacturing industry.” International Journal of Technology Transfer and Commercialization, vol 7-4, 2008 pp. 436-455
[4] Appleyard, M. M. and C Brown, “The Influence of Employment Practices on
Manufacturing Performance in the Semiconductor Industry.” Industrial Relations.
Summer 2001, pp. 1-43. [5] Appleyard, M. M. and C. Brown, “Employment Practices and Semiconductor
Manufacturing Performance.” Industrial Relations: A journal of Economy and
Society. December 2002, vol. 40-3. pp. 436-471. [6] Baglieri, E., V. Chiesa, A. Grando, R. Manzini, “Evaluating Intangible Assets: The
Measurement of R&D Performance.” March 2001 Research Division Working Paper No. 01-49.
[7] Benson, R. F., S. P. Cunningham and R. C. Leachman, “Benchmarking Manufacturing Performance in the Semiconductor Industry” Production and
Operations Management, vol. 4-3, Summer 1995, pp. 201-216.
[8] Bonal, J., C. Ortega, L. Rios, S. Aparico, M. Ferndndez, A. Sdnchez and S. Malvar,
“Overall Fab Efficiency” Advanced Semiconductor Manufacturing Conference IEEE
1996, pp. 49-52

44
[9] Chen, C., L. M. Han “Using DEA to Evaluate R&D Performance in the Integrated Semiconductor Firm.” International Journal of the Computer, Internet and
Management, Sept/Dec. 2006, pp. 50-59. [10] Chen, H., J. Chen, S. Li and Z. Wei, “Double Dimension Control Method for
Performance Measure on R&D Process.” Wireless Communications, Network and
Mobile Computering, September 2007, pp. 6209-6214. [11] Croft, T., H. Toeante and T. Baker, “Labor Modeling In Dynamic Environment.”
IEEE. 2001, pp. 513-515. [12] Corbett, J., P.A.McKeown, G.N. Peggs and P. Whatmore, “ Nanotechnology:
International Developments and Emerging Products.” Manufacturing Technology
49-2 (2000) pp. 523-545. [13] Cordero, Rene S. Walsh, B. Kirchhoff, “Motivating Performance in Innovative
Manufacturing Plants.” Journal of High Technology Management Research vol. 16-1, September 2005, pp.88-89.
[14] Dietrich, J. M. “Life Cycle Process Management for Environmentally Sound and
Cost Effective Semiconductor manufacturing.” IEE, 2004 pp.168-172 [15] Drongelen K., C. Inge and J. Bilderbeek,. “R&D Performance pp. Measurement;
More than choosing a set of Metrics.” R&D Management, vol. 29-1 1999, 35-46. [16] Eisenhardt, K. M. “Building Theories from Case Study Research.” The Academy of
Management Review, vol. 14-4 October 1989, pp. 532-550. [17] Fallon, M., A.J. Walton, M.I. Newsam, V. Axelrad, and Y. Granik, “Integration of
Costing, Yield and Performance Metrics into the TCAD Environment through the Combination OF DOE and RSM.” International Symposium On Semiconductor
Manufacturing, 1995, pp.266-270. [18] Foster, J. and T. Nugent, “Implantation of Best Known Methods” Advanced
Semiconductor manufacturing Conference. 2000 IEEE/SEMI pp.181-186 [19] Goldratt, E. M. and J. Cox, The Goal North River Press, 3rd ed. (November 2004) [20] Goodall R., D. Fandel, A. Allan, P. Lander and H. Huff, “Long Term Productivity
Mechanisms of the Semiconductor Industry.” American Electrochemical Society
Semiconductor Silicon 20002, 9th Ed. May 2002. pp. 125 [21] Guidi, R. L., D.E. Paradis, M.T. Whitfiel, F. D. Poag and D.P.Jenson, “ Strategy and
Metrics for Wafer handling Automation In Legacy Semiconductor Fab.” IEEE

45
Transactions on Semiconductor Manufacturing, vol 12-1 February 1999, pp.102-108.
[22] Hallas, J. F., J.D. Kim and C.T. Mosier, “An investigation of operating Methods of
0.25 micron Semiconductor manufacturing.” Proceedings of the 1996 Winter
Stimulation Conference, pp. 1023-1030.
[23] Hauser, J.R. and F. Zettelmeyer, “Metrics to Evaluate R, D&E” Research
Technology Management, vol.40-4, 1997, pp. 32-38.
[24] Hayes, R. H., S. C. Wheelwright, “Link Manufacturing Process and Product Life
Cycles.” Harvard Business Review, January-February 1979, pp.133-140. [25] Herrmann, J. W., B.F. Conaghan, L.H.Lecordier, P. Mellacheruvu, M.Q. Nguyen,
G.W. Rubloff, R.Z. Shi, “ Understanding the impact and Process Changes with a Heterogeneous Semiconductor manufacturing Simulation Environment.” Proceedings of the 2000 Winter Simulation Conference, pp. 1491-1498.
[26] International Technology Roadmap for Semiconductors, “2008 Update” pp. 79.
[27] Ishii, Y. and S. Watanabe, “Research and development of Production Control
Information System Tool.” The Ninth International Symposium on Semiconductor
Manufacturing, pp. 351-354. [28] Jacobs, J.H., L.F.P. Etman, J.E. Rooda and E.J. Van Campen, “Quantifying
Operational Time Variability: the Missing Parameter for Cycle Time Reduction.” Advanced Manufacturing Conference. IEEE/SEMI, 2001, pp. 1-10.
[29] Kautt, M. S. Walsh, K. Bittner, “Global distribution of micro–nano technology and
fabrication centers: A portfolio analysis approach,” Technology Forecasting and
Social Change, vol. 74 2007, pp.1697-1717 [30] Kilby, J., “Turning Potential into Realities: The Invention of the Integrated Circuit”
(Nobel Lecture) ChemPysChem 2-8/9 pp. 482 – 489
[31] Kim, J.H., T. E. Lee, “Schedule Stabilization and Robust Timing Control for Time-Constrained Cluster Tools.” International Conference on Robotics and Automation.
IEEE, 2003, pp. 1039-1044.

46
[32] Konopka, J. and W. Trybula, “Overall Equipment Effectiveness (OEE) and Cost Measurement.” International Electronics Manufacturing Technology Symposium
IEEE/CPMT, 1998, pp. 137-140.
[33] Leachman, R C. and D. A. Hodges, “Benchmarking Semiconductor Manufacturing” Semiconductor Manufacturing, IEEE Transactions vol. 9-2, May 1996, pp.158-169
[34] Leachman, R. C. and D.A. Hodges, “Benchmarking Semiconductor manufacturing.” IRW Final Report, 1997.
[35] Limanond S., J. Si, K. Tsakalis, “Monitoring and Control of Semiconductor
manufacturing Processes.” IEEE Control Systems, 1998, pp.46-58. [36] Linton, J. and S. Walsh, S. “A theory of innovation for process-based innovations
such as nanotechnology.” Technological Forecasting and Social Change vol.75-5, June 2008, pp. 583-594.
[37] Lockamy A. and J.F. Cox, “ An Empirical study of Division and Plant Performance
Measurement System in selected World Class Manufacturing Firms: Linkages for Competitive Advantage.” International Journal of Production Research, vol. 33-1 1995, pp.221-226.
[38] Maynard, D. N., D. S. Kerr and C. Whiteside, “Cost of Yield.” Advanced
manufacturing Conference IEEE/SEMI (2003) pp. 165-170. [39] Meyers, M.H., P. Tertzakian and J.M. Uttback, “ Metrics for Managing Research
and Development in the Context of the Product Family.” Management Science vol. 43-1, January 1997, pp. 88-111.
[40] Meyersdorf, D. and T. Yang, “Cycle Time Reduction for Semiconductor wafer
Fabrication Facilities. Advanced Semiconductor manufacturing Conference. 1997 IEEE/SEMI, pp. 418-423.
[41] Mihm, J. and C. Loch, “Problem Solving Oscillations in Complex Projects.”
Management Science, June 2003, pp. 733-750. [42] Miller, D. “Semiconductor Capital Equipment Manufacturers.” Industry Report,
August 24, 2004, pp. 1-22.
[43] Michelin, G. and D. Berg, “Evaluating Research –ROI is not enough” Harvard
Business Review 28-3 May/ June 1985, pp 15-22.
[44] Moore, G. “Lithography and the future of Moore's law” Proc. SPIE, vol. 24-39,
2 (1995); DOI: 10.1117/12.209195
47
[45] Mozumder, P.K., S. Saxena and K. Taylor, “Simultaneous Control for Multiple Nonuniformity Metrics Using Site Models and Monitor wafer Controls.” Advanced
Manufacturing Conference. IEEE/SEMI, 1994, pp. 205-208. [46] Mozumder P.K. and L.M. Loewenstein, “Method for Semiconductor Process
Optimization Using Functional Representations of Spatial Variation and Selectivity.” IEEE Transactions on Components, Hybrids and Manufacturing
Technology, vo1. 5-3, June 1992, pp. 311-316. [47] Myers, D.R. “Implications of Intelligent Microsystems for Product Design and
Development.” Engineering Management Society 2000, pp. 325-330 [48] Naughton A. B. “Aligning Tool Set Metrics for Operation in a Multi Technology
High Mix Low Volume Manufacturing Environment.” MIT Thesis, June 2005. [49] Ofek, E. and M. Sarvary, “R&D, Marketing and the Success of the Next Generation
Products.” Marketing Science, vol. 22-3, Summer 2003, pp.355-370. [50] Pich, M. T., C. H. Loch and A. Meyer, “On uncertainty, Ambiguity and Complexity
in Project Management.” Management Science, vol. 48-8, August 2002, pp. 1008-1027.
[51] Romig, A., A. Baker, J. Johannes, T. Zipperian, K. Eijkel, B. Kirchhoff, H. S. Mani,
C.N.R. Rao, and S. Walsh, “An introduction to nanotechnology policy: Opportunities and constraints for emerging and established economies” Technological Forecasting and Social Change vol. 74-9, 2007, pp.1634-1642
[52] Sattler, L and R. Schlueter, “ Semiconductor metrics: conflicting goals or increasing Opportunities.” IEEE/SEMI, 1998, pp.55-60.
[53] Sattler, L., R.C. Glassey and B.I. Saeed, “ Benchmarking Semiconductor manufacturing Performance Using a Pairwise-Comparision Method.” IEEE
Transactions on Semiconductor Manufacturing, vol.10-2, May 1997, pp. 317-321. [54] Schumann, P. A., D. L. Ransley and D. C. Prestwood, ” Measuring
R&D Performance,” Research Technology Management, vol. 38-3 1995, pp.45-55 [55] Shockley, W. “The path to the Conception of the Junction Transistor” Electron
Devices, IEEE Transactions, vol. 23-7, July 1976, pp. 597-620
[56] Silicon Industry Association (SIA) “Semiconductor Sales Slowing” November 19, 2008.

48
[57] Smith, T., D. Boning, S. Fang, F. Simon, G. Shinn and J. Stefani, “A Study of
Within-Wafer Non-Uniformity Metrics.” International workshop on Statistical
Metrology. 4th Ed. 1999, pp. 46-49.
[58] Szakonyi, R. “Measuring R&D Effectiveness-I.” Research Technology Management
vol. 37-2, 1994, pp. 27.
[59] Thukral, I., J. Von Ehr, S. Walsh, A. Greon, P. Van de Sijd and A.K. Akmaliah Adham, (2008), Entrepreneurship, Emerging Technologies, Emerging Markets, International Small Business Journal, vol. 26, February 2008, pp.101 - 116.
[60] Tierney, R. and S. Walsh, “A strategic model for firms who seek to embrace nano—manufacturing” International Journal of Technology Transfer and
Commercialization, Vol.7-2/3, 2008, pp 171-182. [61] Wagner, L. C. “Failure Analysis Challenges.” IEEE. 2001, pp. 36-41.
[62] Walsh, S. “Portfolio Management for the Commercialization of Advanced
Technologies” Engineering Management Journal, vol.13-1, March 2001, pp.33-37.
[63] Walsh, S., J. Linton, R. Grace, S. Marshall and J. Knutt, “MEMS, Microsystems,
Micro machines: Commercializing An Emergent Disruptive Technology”, in MEMS and MOEMS Technology and Applications”, The International Society for Optical
Engineering Development, 2000, pp. 479 –514 [64] Walsh, S., R. Boylan, W. Carr, R.Warrington, and J. Elders, "The Strategic
Development of HARM Manufacturing Technologies”, Microsystems Technologies, vol. 43, 1996, pp. 11-26.
[65] Walsh, S., B. A. Kirchhoff, S. Newbert, “ Differentiating market Strategies for
Disruptive Technologies.” Transactions on Engineering Management, vol. 49-4 November 2002, pp. 341-351.
[66] Walsh, S., et al (2003), “Ch. 2 Commercialization of Microsystems” International
Roadmap on MEMS, Microsystems, Micromachining and Top Down Nanotechnology MANCEF, 2003, pp. 33-68.
[67] Werner, B.M. and W.E. Souder, “Measuring R&D Performance-State of the Art.”
Research Technology Management, May-June 1994, pp 44-56. [68] Wu, B. P. F. “Innovations for Economical 300/450 IC Fabricators.” Advanced
Manufacturing Conference. IEEE/SEMI, 2002, pp. 150-154.

49
[69] Yin, Robert K. “Case Study Research: Design and Methods.” 3rd Ed. Sage Publishers, 2003.