ecomod.net foss conference... · web viewtrade liberalisation, corporate tax and poverty in ghana...
TRANSCRIPT
Trade Liberalisation, Corporate Tax and Poverty in Ghana
BY
Camara K. Obeng* Department of Economics
University of Cape Coast, GhanaEmail: [email protected]
Alternative email: [email protected]\ Mobile: +233244841712
&
Vijay K. Bhasin Department of Economics University of Cape Coast
Email: [email protected] Mobile: + 233244364881
.
………………………………………………………………………………………………
Abstract: This study examined the impact of using corporate tax to compensate for lost tariff revenue from trade liberalization on poverty in Ghana. Trade has been considerably liberalized in Ghana, which necessitated fiscal reforms to make up for the shortfall in government revenue. As part of the fiscal reforms, the corporate tax rate was reduced for all sectors and the basis for assessment changed from profits to income. What are the implications of trade liberalization and corporate tax reforms for the incidence, depth and severity of poverty at the national and household levels? This study investigated this question using a recursive dynamic computable general equilibrium model and a microsimulation model calibrated to the 2005 Social Accounting Matrix (SAM) of Ghana for the period 2005 to 2015. The results showed that the reduction in the incidence, depth and severity of poverty at the national and household levels is greater when corporate tax rate was increased than when it was reduced. The paper recommends a reversal of the policy on corporate tax.
Keywords: Trade Liberalisation, Tariff Revenue, Poverty, Corporate Tax, SAM, CGE, Microsimulation.
Acknowledgements: This paper is based on a chapter of the Ph.D Thesis of the lead author. The authors would like to thank all the participants and the discussant at the International Conference on Poverty, Social Exclusion and Development organised by the Faculty of Social Sciences at the University of Cape Coast from October 10 -12, 2012.
*Corresponding Author.
1
1.0 Introduction
One of the contentious issues in the trade literature is the effect of trade
liberalisation on poverty. On strand of the debate is that trade liberalisation affects
distribution of income in a country. Thus, as a country engages in international trade by
exporting goods that use intensively the factor of production it has in abundance, to
import goods that use intensively a factor that it lacks, the export sector will expand,
employment of the factor in high demand (abundant factor) will increase and incomes
will rise for such a factor. In contrast, the import-competing sector that uses its scare
factor will contract, and incomes will fall for the scare factor (Stolper-Samuelson, 1941).
In contrast, the critics of trade liberalisation, argue that, in developing countries,
integration into the world economy makes the poor poorer and the rich richer. The most
frequent criticism of trade liberalisation is that it augments poverty and inequality
(Rodrik, 2000; Rodriguez & Rodrik, 2001; Ravallion, 2001; Lubker, Smith &Weeks,
2002; Wei, 2002; Chen & Ravallion, 2004).
The foregoing clearly point to the fact that there are gainers and losers associated
with free trade (McCulloch, 2005; Feraboli, 2007; Bibi & Chatti, 2006 & Bchir et al,
2005; Cororaton et al 2005) and that government has to combine trade liberalisation with
complimentary policies such as tax reforms to mitigate the harsh impact of free trade on
the losers (Wong, Arguello, & Rivera, 2008; Siddiqui et al, 2008 & 2009; Khondker,
Mujeri & Raihan, 2008; Cattaneo, Hinojosa-Ojeda & Robinson, 1999; Wang & Zhai,
1998; Emini et al, 2005, Aka, 2003; Chan & Dung, 2008; Pradhan & Sahoo, 2008; Konan
& Maskus, 2000).
2
Ghana’s external trade has been extensively liberalised, making the Economic
Commission for Africa (2004) describe Ghana, in 2004, as one of the fastest liberalisers
in Africa. The liberalisation of external trade comprised import and export liberalisation.
Trade liberation involved gradual removal of most quantitative restrictions, including
import licensing, and the reduction in the level and range of tariffs. For instance, the
simple average tariff rate fell from 32.6 percent for the period 1972-1982 to 11.3 percent
for the period 1990 -2003. The decline in the average tariff rate caused the contribution of
trade taxes to government revenue to fall from 85 percent in 1979 to about 18 percent in
the 1990s (Oduro, 2000).
Government responded to the decline in its revenue by embarking upon a
comprehensive fiscal reform with the view to broadening the tax base and lowering the
tax rate to serve as incentive for domestic production, encourage compliance, and
enhance revenue growth and stability. The reforms encompassed both direct and indirect
taxes. A major component of the fiscal reform was reducing corporate tax rate for all
sectors. The rate fell from 55% in 1986 to 35% by 1993(Osei & Quartey, 2005; Addison
& Osei, 2001; Kusi, 1998). The general corporate tax rate is currently 25%. The figure,
however, varies depending on the sector and location of the companies (Internal Revenue
Service, 2010).
The lowering of the corporate tax rate was in line with the view that the surest
way to reduce poverty is through stronger economic growth, i. e. the trickle-down effect.
The idea is that lower corporate tax will grow the economy through higher investments
and expanding businesses for SMEs to the benefit of workers and the impoverished. That
is, growth is believed to bring jobs, which are the surest way to alleviate poverty. Thus,
3
building a strong economy means keeping corporate tax and government spending low to
empower the private sector. Quite a number of studies have found reduction in corporate
tax to lead to increase in aggregate investment and a fall in the size of the informal sector
(Djankov, Ganser, McLiesh, Ramalho & Shleifer, 2010), expansion in firms investment
(Fazzari, 1987; Diamond, 2005), increase foreign direct investment (De Mooij &
Ederveen, 2005), enhance the performance of SMEs ( Zariyawati, Saira, & Animar
(2010) , increases investment, creates jobs, boost economic growth, reduces consumer
price index, raise wages and reduces headcount poverty (Dartanto, 2012).
However, recent events have shown that growth is not an automatic channel for
poverty reduction. In fact, the effect of growth on poverty reduction depends on which
sector the growth takes place, the absorptive capacity of growth (Fields, 1972, 1980
1992) and the complementary policies implemented by government. There is therefore a
strong case for government to spend on social services to be able to cater for the
disadvantaged section of the population in a period when trade taxes have gone down. A
strong case is made that government can reduce poverty by redistributing wealth through
progressive taxation, i. e. imposing higher taxes on higher income brackets and through
more government spending. Investors are also comfortable working in economies with
healthy business environments where, for instance, electricity is available and its supply
is reliable and affordable, water supply is regular and also affordable, roads are in decent
shape, skilled labour is available, contracts are enforced, etc. Government needs to be
well resourced to be able to carry through all these. Some empirical evidence shows that
cuts in corporate tax negatively affect the stock of public capital. Thus lower corporate
4
tax rates raises budget deficits making it impossible for governments to provide public
services (Sinn, 1994; Gomes & Pouget, 2008).
In the past three decades, the economy of Ghana has undergone massive trade
liberalisation and a comprehensive fiscal reform. It is, however, not clear what the
poverty implications have been for the population even though headcount poverty has
fallen from almost 52% in 1991/92 to 28.5% in 2005/06. With the impending Economic
Partnership Agreement between Ghana and the EU, with its concomitant implication for
government revenues, looming, it is not certain government can generate enough
revenue, domestically, to support its poverty reduction programmes, in spite of her new
status as an oil exporter.
Ghana’s tax reforms constitute one of the major policy instruments needed to
accelerate growth and poverty reduction. Over the past two decades, the government has
consistently spent more revenue than it is able to generate and the gap is often financed
with foreign aid, which has perpetuated the country’s aid dependency. Two options can
be explored to reduce the gap between government revenue and expenditure; generate
more revenue or reduce government expenditure. Although the latter sounds reasonable,
the government needs to spend more on key sectors like education, health and
infrastructure if the country is to significantly reduce poverty. The critical issue has been
how to generate the needed resources domestically, using tax instruments that are least
harmful to the poor (Osei & Quartey, 2005). This study examines how one such tax
instrument, corporate tax, can be used to compensate for lost government revenue
resulting from liberalisation and what the implications will be for household poverty
using a computable general equilibrium (CGE) model.
5

Specifically, the study investigated the implications of trade liberalization and
corporate tax reforms on the incidence, depth and severity of poverty at the national and
household levels. This was achieved by considering two alternative policy simulations. In
the first simulation, trade taxes on all imported goods were eliminated and the reduction
in the tax revenue was compensated with a 50 percent increase in corporate tax rate. The
50 percent increase in the corporate tax rate was enough to make-up for the fall in
government revenue as a result of complete removal of import tariff. In the second policy
experiment, taxes on all imported goods were removed combined with a 50 percent
reduction in the corporate tax rate. The corporate tax rate was changed by the same
percentage to provide a basis for comparison of the results. The analysis was carried out
for the period 2005 to 2015. The choice of the study period was informed by the
availability of a comprehensive household dataset from the Ghana Living Standards
Survey (GLSS 5) and the fact that 2015 is the target date for halving 1990 poverty.
Previous Computable General Equilibrium (CGE) analysis for Ghana have used
static framework (Bhasin & Annim, 2005; Bhasin & Obeng, 2005a; 2005b; 2006). But
the present study analyzes the impact of trade liberalisation on poverty in a dynamic
framework. Bhasin (2012) has analyzed the financing of trade liberalisation through
capital flows, and value added tax in a static framework. The present study analyzes the
financing of trade liberalisation through corporate tax in a dynamic framework.
The results show a greater reduction in poverty at both the national and
household levels when trade liberalisation is accompanied by an increase in corporate tax
than when trade liberalisation is combined with a reduction in corporate tax. The results
of the study have to be interpreted with caution because of the following limitations:
6
First, trade liberalisation was narrowly defined as the complete removal of import
tariffs in this study. Since cocoa is a major export crop, future studies should consider the
poverty implications of the elimination of export tariffs on cocoa in the long run.
Second, the simulation exercises implemented for this study considered trade
liberalisation combined with income tax and VAT, separately. Future work could
consider implementing trade liberalisation and the tax instruments simultaneously so as
to capture the interaction effect of trade reforms and fiscal reforms on poverty in the long
run.
Third, the dataset used for the study, 2005-2006, is quite old. The data could have
been updated to reflect changes in the economy. However, no current household survey
existed to enable us carry out such an exercise. Future studies could update the data when
the current round of the Ghana Living Standards survey is completed.
Fourth, the categorization of households for this study was done using the
ecological zones of the country. Other categorization criteria such as economic activity,
as used in the static studies mentioned earlier and used by the Ghana statistical service
(GSS), could be used in future studies.
This study used a recursive dynamic CGE model to arrive at the results. We
appreciate the fact the use of other dynamic CGE modelling could have given us different
results. Finally, no sensitivity analysis was done so we are not in a position to tell the
sensitive of the results to changes in the parameters. This can be taken up in a future
study.
The rest of the paper is structured as follows. Section 2 describes the research
methodology, which covers the way the study was carried and the model used. Section 3
7

presents and discusses the results. Here, the presentation includes the macroeconomic
effects of the policy simulations, national and household poverty. Finally, section 4
concludes and presents the policy recommendation of the study.
2.0 Methodology
A study of the link among trade liberalisation, corporate tax reform and poverty is
a complex one. Therefore, the Dynamic Computable General Equilibrium-
Microsimulation (DCGE-MS) technique that has the capacity to capture these
complexities was employed in this study. The steps involved in the estimation are as
follows: the DCGE model was run from 2005 to 2015, feeds the market and factor price
changes for an aggregated household into a microsimulated household model for the
corresponding disaggregated households in the survey. As the data used to calibrate the
model (that is, social accounting matrix) is constructed using the survey data, there is a
direct mapping between commodities and households in the model and survey.
Household expenditures were accordingly updated and Standard poverty measures were
then recalculated using the updated expenditure estimates and the new poverty line.
Model
The model adopted for this study is a recursive dynamic CGE linked to a micro-
simulation model, developed by Breisinger, Diao and Thurlow (2009). It has as its origins
the static CGE model developed at the International Food Policy Research Institute
(IFPRI) and documented in Lofgren, Harris and Robinson (2002). It is solved one period
at a time through updating such variables as investment spending and population growth
8
rate to reflect changes that have taken place in the current period. The model represents a
small open economy that has no influence on international markets and it is calibrated to
the Social Accounting Matrix (SAM) of Ghana for the year 2005. There are three
production sectors, three factors of production and nine categories of households. The
model is presented in four blocks, including production and prices; institutional incomes
and domestic demand equations, equilibrium conditions and macroeconomic closure and
factor accumulation and allocation equations.
The poverty effects of the policy simulations were carried out in the micro-
simulation model. The micro-simulation model is constructed using the expenditures of
all the households in the 2005/2006 living standard survey for Ghana. In the CGE model,
however, households are aggregated and do represent larger household categories
identified in the survey based on expenditure and location. As the relevant data for the
CGE is the 2005 SAM for Ghana, which is constructed with data from the survey, there is
a direct mapping between commodities and households in the model and survey. The
endogenous changes in prices, incomes and commodity consumption from each
aggregate household coming from the policy simulation to the CGE is used to adjust the
level of expenditure for the corresponding disaggregated households in the survey. The
incidence, depth and severity of poverty at the national level and for each household
category are recalculated using the updated expenditure estimates and the changed
poverty line.
3. 0 Results
9

The macroeconomic effects of the simulations are shown in Table 1. Sim 1 refers
to the results of simulation one (complete removal of import tariff combined with 50%
reduction in corporate tax rate) and Sim 2 refers to the results of simulation two
(elimination of import tariff accompanied with 50% increase in corporate tax rate). As
shown in Table 1, absorption increases by about 2.7 percent over the base scenario for
simulation one. There is also an increase of about 5.3 percent in private consumption.
Increase in private consumption is sustained by rise in imports. Other components of
absorption have equally been affected positively by the policy experiments. For instance,
government consumption increases by about 3.6 percent, and investment rises by about
5.7 percent. The rise in absorption is an indication that import tariff elimination (trade
liberalisation) enhances overall welfare in Ghana for the study period of 2005 - 2015.
Other components of aggregate demand that have seen improvements as a result of the
policy change are exports and imports. Exports increase by about 13.8 percent while
imports rise by about 9.6 percent. The increase in absorption, exports and imports has
reflected in the positive change in GDP at market prices. There is an increase of about 2.3
percent rise in GDP at market prices. The finding supports the results of Diallo et al
(2010), Wong et al (2008), Feraboli (2007), Bchir et al (2005) and Cattaneo et al (1999).
Table 1: Macroeconomic Effects
Base Sim 1 Sim 2
Absorption 24659.64 2.69 3.63
Private cons 134436.88 5.29 7.94
Government cons 25644.83 3.59 5.85
Fixed Investment 444529.55 5.66 10.58
Stock change 48.13 1.29 2.20
10

Exports 51425.96 5.66 21.87
Imports 91159.57 9.58 15.04
GDP (Value Added) 164925.76 2.34 3.01
Source: simulation Results
For sim 2, GDP increases by about 3.01 percent. There is also improvement in the
components of GDP as exemplified by increases in absorption of about 3.63 percent and
private consumption of about 7.94. Government consumption increases by 5.85 percent,
investment rises by 10.58 percent, exports increase by 21.87 percent and imports improve
by 15.04 percent. The rise in GDP means that complete removal of import tariff (trade
liberalisation) combined with 50 percent increase in corporate tax improves economic
welfare (Wang & Zhai, 1998; Chan & Dung (2008).
For purposes of comparison, the macroeconomic effects are positive for all
simulations, but greater for sim 2. This is because government is not able to recover the
revenue lost as a result of trade liberalisation in sim 1 and, so she is denied the resources
to provide the infrastructural facilities and the enabling environment to promote
economic growth.
The improvement in the macroeconomic variables is justified in the sense that
tariff removal improves the competiveness of the economy of Ghana. Tariff reduction
results in a decrease in import prices, which makes imports cheaper than domestic
import-competing substitutes. Consumers therefore, shift from the domestic import-
competing substitutes to demand more of imported goods and services. The import-
competing sectors, which were initially heavily protected, will see a decline in output and
11
employment. The increase in imports causes depreciation of the local currency because
the current account is assumed fixed. Again, the fall in the prices of imported inputs
reduces domestic costs of production. These two effects will lead to a reduction in the
domestic costs of production for the expanding sectors of the economy. Output in these
expanding sectors will rise, employment will grow, and the productive factors from the
declining sectors will relocate to these growing sectors.
The reduction in costs of production and the depreciation of the local currency
leads to increase in competiveness of the export sector. As a result of the increase in the
domestic price of exports, the export industry expands, investment increases, production
of exportable increase, export of goods and services rise, employment in the export sector
rises, incomes increase; this creates a multiplier effect of incomes and expenditures
leading to further increase in GDP.
These are the sectors in which Ghana has comparative advantage and, more
importantly, are also labour intensive activities. Consequently, employment of unskilled
and semi-skilled labour will be substantial. Since labour income is the main source of
income for majority of households in the country, household incomes will rise and
poverty rate may decrease.
Household income
Income change for all categories of household has been positive for the two
simulations. However, household incomes increase more for Sim 2 than for Sim 1 as
depicted in Table 2. Household incomes increase in response to the rise in the returns to
labour, a primary source of income to households. Generally, rural households benefit
more from the increase in incomes than urban households because rural households rely
12

more on labour income, which increases as a result of the policy shock than their urban
counterparts. The result supports Chitiga and Mabugu (2005) for Zimbabwe but
contradicts the results of Siddiqui et al (2008) for Pakistan, Cororaton (2008) for the
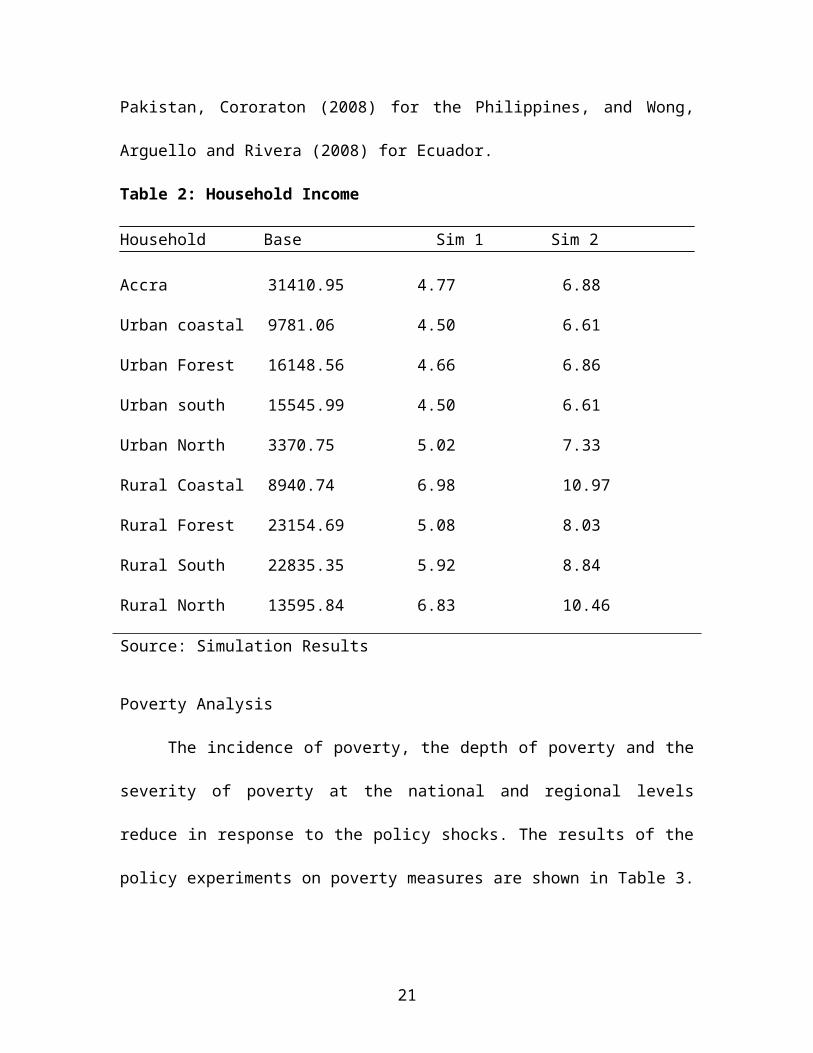
Philippines, and Wong, Arguello and Rivera (2008) for Ecuador.
Table 2: Household Income
Household Base Sim 1 Sim 2
Accra 31410.95 4.77 6.88
Urban coastal 9781.06 4.50 6.61
Urban Forest 16148.56 4.66 6.86
Urban south 15545.99 4.50 6.61
Urban North 3370.75 5.02 7.33
Rural Coastal 8940.74 6.98 10.97
Rural Forest 23154.69 5.08 8.03
Rural South 22835.35 5.92 8.84
Rural North 13595.84 6.83 10.46
Source: Simulation Results
Poverty Analysis
The incidence of poverty, the depth of poverty and the severity of poverty at the
national and regional levels reduce in response to the policy shocks. The results of the
policy experiments on poverty measures are shown in Table 3.
13
Table 3: National Poverty
Base Sim 1 Sim 2
P0 P1 P2 P0 P1 P2 P0 P1 P2
National 27.0 9.0 4.3 26.5 8.9 4.0 25.1 8.3 3.9
Urban 10.4 2.9 1.2 9.5 2.3 0.9 8.2 2.0 0.8
Rural 37.1 12.7 6.2 37.0 12.3 5.9 34.5 11.7 5.6
Source: Simulation Results
As shown in Table 3, for Sim 1, the incidence of poverty falls from the base value
of 27.0 percent to 26.5 percent in 2015. The depth of poverty decreases from 9.0 percent
in the base scenario to 8.9 percent in 2015. Furthermore, the severity of poverty declines
from 4.3 percent in the base scenario to 4.0 percent in 2015. In the case of Sim 2, the
incidence of poverty falls from 27.0 percent to 25.1 percent, the depth of poverty reduces
from 9.0 percent to 8.3 percent and the severity of poverty falls from 4.3 percent to 3.9
percent. Clearly, the national poverty measures are lower in Sim 2 than Sim 1.
In terms of location, poverty measures follow the national trend for all the
simulations. For Sim 1, the incidence of poverty for urban areas decreases from 10.4
percent in the base scenario to 9.5 percent while the poverty gap falls from 2.9 percent in
14

the base scenario to 2.3 percent in 2015. Finally, the severity of poverty falls from 1.2
percent in the base scenario to 0.9 percent in 2015. The results for Sim 2 show that
poverty headcount reduces from 10.4 percent to 8.2 percent, the depth of poverty falls
from 2.9 percent to 2.0 percent and the severity of poverty reduces from 1.2 percent to
0.8 percent. With regards to rural areas, poverty measures decline for all simulations, but
the extent of decline is higher for Sim 2.
Even though poverty levels fall for both urban and rural areas, urban areas record
lower levels of poverty than rural areas for all policy simulations. In particular, the rate of
decrease in the incidence of poverty, the depth of poverty and severity of poverty is lower
in the urban area than in the rural area after the policy shocks.
At the household level, all indications of poverty reduce following all the policy
experiments. However, the degree of decline is higher for Sim 2 than Sim 1. The detailed
results are captured in Table 4.
Table 4:Household Poverty
Household Base Sim 1 Sim 2
Po P1 P2 Po P1 P2 P0 P1 P2
Accra 10.2 2.7 1.0 9.7 2.3 0.9 8.2 1.9 0.7
Urban Coastal 5.5 0.8 0.2 4.2 0.6 0.1 3.6 0.5 0.1
Urban Forest 6.7 1.7 0.7 5.9 1.4 0.6 4.8 1.3 0.5
Urban South 20.9 7.4 3.9 20.0 6.8 3.6 15.8 6.3 3.3
Urban North 30.1 10.5 4.7 28.1 9.7 4.2 27.2 8.8 3.7
Rural Coastal 20.9 4.7 1.5 17.6 3.9 1.2 16.9 3.8 1.2
Rural Forest 25.4 6.1 2.1 31.5 8.0 2.9 22.7 5.3 2.1
15
Rural South 34.6 7.6 2.5 33.7 7.3 2.4 31.4 6.4 2.1
Rural North 67.2 30.4 17.0 67.0 30.0 15.7 66.0 28.9 16.0
Source: Simulation Results
In Table 4, compared with the benchmark values, poverty levels decrease for all
households for both simulations. Removing imports taxes makes the economy of Ghana
more efficient, the production structure changes from the production of import-competing
goods to the production of agricultural-based exports, which use labour more intensively.
Factors of production relocate to the expanding sectors and factor earnings increase,
which translates into increase in household incomes. The reduction in the domestic price
of imports and import-competing substitutes increases household consumption and
poverty decreases for all households. It is for these reasons that all household poverty
indicators decrease under the scenario of complete removal of import taxes.
Generally, poverty is prevalent in rural households than in urban households.
Again, poverty is higher in the northern households than any other households. Northern
households have the highest incidence of poverty in both urban and rural areas. For
northern rural households, poverty levels have been very high so that even though
poverty generally reduces with trade liberalisation, the level of poverty in the northern
rural households still remains high. For example, the poverty headcount decreases from
67.2 percent in the benchmark to 67 percent in 2015 for Sim 1, but falls to 66 percent in
Sim 2. The depth of poverty falls from 30.4 percent in the benchmark to 30.0 percent in
Sim 1, but declines to 29.9 percent for Sim 2 for all northern households. Finally, the
severity of poverty declines from 17.0 percent in the benchmark to 16.6 percent in 2015.
It is also worthy of note that the highest reduction in the incidence of poverty occurs in
16

the rural coast household. Here, the poverty headcount decreases from 20.9 percent in
the benchmark to 19.3 percent in 2015 for the policy experiments.
As shown in Table 4, all households experience reduction in poverty levels
relative to the base scenario, but urban households benefit more than rural households.
This finding is in line with the national analysis made earlier. Equally worth noting is the
fact that poverty is higher in the northern households than rural households. Northern
households have the highest incidence of poverty in both urban and rural areas. For
northern rural households, poverty levels have been very high so that even though
poverty generally reduces for policy simulations, the level of poverty in the northern rural
households still remains high.
4.0 Conclusion and Policy Recommendation
The study examined the impact of trade liberalisation combined with corporate
tax reform on poverty using a CGE model calibrated to the 2005 SAM of Ghana. Two
policy simulations were carried out: complete elimination of import tariffs combined with
50 percent decrease in corporate tax ( Sim 1) and total removal of import tariff
accompanied by a 50 percent rise in the corporate tax rate ( Sim 2 ). The results show that
all poverty measures fall following the policy shocks, but they fall more under Sim 2 than
Sim 1. This might be due to the fact that the increase in corporate tax following import
liberalisation generates enough resources to enable government provide the infrastructure
such as roads, electricity, water, et cetera for businesses to grow and also provide the
needed support to households for poverty reduction purposes. Clearly, financing trade
liberalisation with increase in the corporate tax will lead to a fall in the incidence, depth
17
and severity of poverty more than reducing it. The study recommends a reversal of the
policy of reducing corporate tax in Ghana.
ReferencesAddison, T., & Osei, R. (2001). Taxation and fiscal reform in Ghana (Discussion paper
No. 2001/97). Helsinki: UNU-WIDER.Aka, B. F. (2006). Poverty, inequality and welfare effects of trade
liberalisation in Cote d’lvoire: A computable general equilibrium model Analysis (AERC Research Paper 160). Nairobi: African Economic Research Consortium.
Bannister, G. J., & Thugge, K. (2001). International trade and poverty Alleviation (IMF working paper 01/54). Retrieved October 23, 2010, from http://papers.ssrn.com/sol3/papers.cfm?abstract_id=270440
Bchir, H., Bibi, S., Boughzala, M., Chatti, R., & Rajhi, T. (2005). Trade, employment and wages in Tunisia: An integrated and dynamic CGE model (Research No. FEM 21-29). Retrieved November 11, 2010, from http://www.femise.org/PDF/a021/fem2129-utuniselmanar.pdf
Bibi, S. & Chatti, R. (2006). Trade Liberalisation and the dynamics of Poverty in Tunisia: A layered CGE microsimulation analysis (MPIA Working Paper 2006-07). Retrieved November 3, 2010, from http://132.203.59.36/__NEW-PEP/Group/papers/papers/MPIA-2006-07.pdf
Bhasin, V.,K. ( 2012). The impact of the elimination of trade taxes on poverty and income distribution in Ghana. In Ackah, C. and Aryeetey, E. (eds). Globalization, trade and poverty in Ghana. Ottawa: IDRC.
Bhasin, V. K., & Annim, S. K. (2005). Impact of elimination of trade taxes on poverty and income distribution in Ghana. Washington DC: IMF
Bhasin, V. K., & Obeng, C. K. (2005a). Trade liberalisation, remittances,poverty and income distributions of households in Ghana. In J., Shaw (Ed.), Remittances, microfinance and development: Building the links. Volume 1: A global view (pp 33-45). Brisbane: The Foundation for Development Co-operation.
Bhasin, V. K, & Obeng, C. K. (2006). Trade liberalisation, foreign borrowing, poverty and income distributions of households in Ghana. ICFAI Journal of Applied Economics, 5( 4), 38-53.
Breisinger, C., Diao, X., & Thurlow, J. (2009). Modelling growth options and structural change to reach middle income country status: The case of Ghana. Economic Modelling, 26, 514-525.
Cattaneo, A., Hinojosa-Ojeda, R. A., & Robinson, S. (1999). Costa Rica trade liberalisation, fiscal imbalances, and macroeconomic policy: A computable general equilibrium model. The North American Journal of Economics and Finance, 10, 39 – 67.
18
Chan, N. V., & Dung, T. K. (2008). The impact of trade liberalisation on household welfare in Vietnam. In Cockburn, J., Decaluwe, B., and Robichaud, V. (Eds.), Trade liberalisation and poverty: A CGE analysis of the 1990s experience in Africa and Asia (pp 407 – 435) Quebec: Poverty and Economic Policy Research Network. Retrieved November 4, 2010, from http://www.pep-net.org/fileadmin/medias/pdf/promotionnal_material/TradeLiberalisation_Poverty-final.pdf
Chen, S., & Ravallion, M. (2004). Welfare impacts of China’s accession to the World Trade Organisation, The World Bank Economic Review, 18(1), 29 – 57.
Chitiga, M., & Mabugu, R. (2005). The impact of tariff reduction on poverty in Zimbabwe: A CGE top-down approach, Journal of Economic and Management Sciences, 8(1), 102-116. Retrieved October 28, 2010, from http://www.journals.co.za/ej/ejour_ecoman.html
Cororaton, C. B. (2008). The impact of trade reforms in the 1990s on welfare and poverty in the Philippines. In J. Cockburn, B. Decaluwe, & V. Robichaud (Eds.), Trade liberalisation and poverty: A CGE analysis of the 1990s experience in Africa and Asia (pp 345 – 376). Quebec: Poverty and Economic Policy Research Network.
Dartanto, T. ( 2012). The 2008 Corporate income tax reform and its contribution to poverty reduction in Indonesia, Working Paper in Economics and Business, Vol. II, No. 3/2012. Retrieved January 18, 2013 from http://econ.fe.ui.ac.id/workingpage
De Mooij, R. A. and Ederveen, S. (2005), Ex- plaining the Variation in Empirical Estimates of Tax Elasticities of Foreign Direct Investment, Tinbergen Institute Discussion Paper No. 2005108/3. Retrieved January 18, 2013 from http://ssrn.com/ abstract=869753
Diallo,S. S., Kone, S., & Kamagate, M. (2010). Trade liberalisation and income distribution in Cote d’lvoire: A simulation with a dynamic general equilibrium model (PMMA working paper 2010-05 ). Quebec: Poverty and Economic Policy Research Network.
Diamond, J. W. (2005), Dynamic effects of ex- tending the 2001 and 2003 income tax cuts, Inter- national Tax and Public Finance, Vol.12: pp.165- 192.
Economic Commission for Africa. (2004). Unlocking Africa’s trade potential. Addis Ababa: Economic Commission for Africa.
Emini, A., Cockburn, J., & Decaluwe, B. (2005). The poverty impacts of the Doha round in Cameroon: The role of tax policy (PEP Working Paper, No.4). Quebec: Poverty and Economic Policy Research Network.
Fazzari, S. M. (1987), Tax reform and investment: how big an impact? Fed- eral ReserveBank of St. Louis, pp. 15- 27. Retrieved January 178, 2013 from http://research.stlouisfed.org/ publications/review/87/01/Tax_Jan1987.pdf
Feraboli, O. (2007). Preferential trade liberalisation, fiscal policy responses
19

an welfare: A dynamic CGE model for Jordan. Retrieved May 6, 2008, from http://rief.univ-paris1.fr/Rennes2007/16-Feraboli.PDF.
Fields, G. S. (1979). A welfare approach to growth and distribution in the dual economy. The Quarterly Journal of Economics, 93(3), 325 -353.
Fields, G. S. (1980). Poverty, inequality, and development. Cambridge: Cambridge University Press.
Fields, G. S. (1992). Modern sector enlargement or traditional sector enrichment? GNP effects with induced migration. Journal of Population Economics, 5(2), 101 -112.
Gomes, P. and Pouget, F. (2008), Corporate tax competition and the decline of public investment, Working Paper Series No. 928/August 2008, European Central Bank. Retrieved January 18, 2013 from http://www.ecb. int/pub/pdf/scpwps/ecbwp928.pdf.
Internal Revenue Service (IRS). (2010). New tax rates, 2010. Accra: IRS. Khondker, B., Mujeri, M., & Raihan, S. (2008). Welfare and poverty impacts
of tariff reforms in Bangladesh: A general equilibrium approach. In J. Cockburn, B. Decaluwe, & V. Robichaud (Eds.), Trade liberalisation and poverty: A CGE analysis of the 1990s experience in Africa and Asia (pp 159-195). Quebec: Poverty and Economic Policy Research Network.
Konan, D. E., & Maskus, K. E. (2000). Joint trade liberalisation and tax reform in a small open economy: the case of Egypt. Journal of Development Economics, 61, 365 -392.
Kusi, N. K. (1998). Tax reform and revenue productivity in Ghana (AERC Research Paper No. 74). Nairobi: African Economic Research Consortium.
Lubker, M., Smith, G., & Weeks, J. (2002). Growth and the poor: A comment on Dollar and Kraay, Journal of International Development, 14: 555-571.
McCulloch, R. (2005). Protection and real wages: The Stolper-Samuelson theorem. In M. Szenberg, L. Ramrattan, & A. A. Gottesman (Eds), Samuelsonian economics and the 21st century (pp 1-14). New York: Oxford University Press.
Oduro, A. D. (2000). Performance of the external sector since 1970. In E. Aryeetey, J. Harrigan, & M. Nissanke (Eds.), Economic reforms in Ghana: The miracle and the mirage (pp 267 – 283). London: James Currey ltd.
Osei, R. D., & Quartey, P. (2005). Tax reforms in Ghana (UNU-WIDER Research Paper No. 2005/66). Helsinki: UNU-WIDER.
Pradhan, B. K., & Sahoo, A. (2008). The impact of trade liberalisation on household welfare and poverty in India. In J. Cockburn, B. Decaluwe, and V. Robichaud (Eds). Trade liberalisation and poverty; A CGE analysis of the 1990s experience in Africa and Asia (pp 217-262). Quebec: Poverty and Economic Policy Research Network.
Ravallion, M. (2001). Growth, inequality and poverty: looking beyond Averages. World Development, 29(11), 1803 -15.
20
Rimmer, M. T., & Powell, A. A. (1996). An implicit additive demand system. Applied Economics, 28(12), 1613 – 22.
Rodriguez, F. & Rodrik, D. (2001). Trade policy and economic growth: A sceptic’s guide to the cross-national evidence. NBER Macroeconomics annual 2000. Cambridge: MIT Press.
Rodrik, D. (2000). Comments on trade, growth, and poverty by David Dollar and Aart Kraay, Retrieved November 4, 2010, from http://ksghome.harvard.edu/~drodrik.academic.ksg/papers.html
Sinn, H.W. (1994), How much Europe? Sub- sidiarity, Centralization and Fiscal Competition, Scottish Journal of Political Economy, Vol. 41 No.1: pp. 85-107.
Siddiqui, R. (2009). Modeling gender effects of Pakistan’s trade liberalisation, Feminist Economics, 15(3), 287 -321.
Siddiqui, R., Kemal, A. R., Siddiqui, R., & Kemal, A. (2008). Tariff reduction, fiscal adjustment and poverty in Pakistan: A CGE-based analysis ( MPIA working paper 2008-17). Quebec: Poverty and Economic Policy Research Network.
Stolper, W, & Samuelson, P. A. ( 1941). Protection and real wages. Review of Economic Studies, 9(1), 58-73
Wang, Z., & Zhai, F. (1998). Tariff reduction, tax replacement and implications for income distribution in China. Journal of Comparative Economics, 26, 358-387.
Wei, S. J. (2002). Is globalisation good for the poor in China? Finance and Development, 39(3), 26 – 29.
Wong, S., Arguello, R., & Rivera, K. (2008). Fiscal policies and increased Trade Openness: Poverty Impacts in Ecuador (MPIA Working paper 2008-19). Quebec: Poverty and Economic Policy Research Network.
Zariyawati, M.A., Saira, K. and Animar, M.N. (2010), Corporate Tax Changes and Performance of SMEs in Malaysia. Retrieved January 18, 2013 from http://www.allbusiness.com/legal/ tax-law-corporate-tax/16387951-1.html
21