forty years and still - dorel sales distribution corporate dorel industries inc. is a rapidly...
TRANSCRIPT

A N N U A L R E P O R T 2 0 0 1
forty years and still growing

Manufacturing
Sales
Distribution
Corporate
DOREL industries inc. is a rapidly growing global consumer products manufacturer
specializing in three product areas: juvenile products, ready-to-assemble (RTA) furniture, and home furni-
shings. Dorel’s product offerings include a wide variety of RTA furniture for home and office use; juvenile
products such as infant car seats, strollers, high chairs, toddler beds, cribs, infant health and safety aids,
play-yards and juvenile accessories; and home furnishings such as metal folding furniture, chairs, tables, futons
and step stools.
Dorel employs approximately 3,600 people in nine countries. Major North American facilities are located in
Montreal, Quebec; Cornwall, Ontario; Columbus, Indiana; Cartersville, Georgia; Wright City, Missouri; Tiffin,
Ohio; Dowagiac, Michigan; and Canton, Massachusetts. The Company’s major divisions in the United States
include Ameriwood Industries and the Dorel Juvenile Group (DJG USA), which incorporates the Cosco and
Safety 1st brand names. In Canada, Dorel operates Ridgewood Industries and Dorel Home Products. European
operations are carried out through the Dorel Juvenile Group (DJG Europe) which includes the Maxi-Cosi,
Quinny and Safety 1st brand names. Dorel’s international sourcing operations are carried out through Dorel
Asia based in Hong Kong.

[ DOREL Annua l Repor t 2001 p.1 ]
financialANNUAL RESULTS 1997-2001
highlights
Operating Results (In thousands of US dollars, except per share amounts)
2001 2000 1999 1998 1997
Sales 916,769 757,540 596,702 492,554 351,989
Cost of sales 718,123 582,741 452,974 381,826 264,789
Gross profit 198,647 174,799 143,728 110,729 87,200 as percent of sales 21.7 % 23.1 % 24.1 % 22.5 % 24.8 %
General and administrative expenses 147,354 127,356 85,996 74,635 61,024
Restructuring costs and other one-time charges 20,000 12,037 – 10,067 –
Pretax earnings 31,293 35,406 57,732 26,027 26,176 as percent of sales 3.4 % 4.7 % 9.7 % 5.3 % 7.4 %
Income taxes 4,731 5,432 17,756 8,330 8,862
Net earnings from continuing operations 26,562 29,974 39,976 17,697 17,314 as percent of sales 2.9 % 4.0 % 6.7 % 3.6 % 4.9 %
Income (loss) from discontinued operations ( 1,058 ) ( 12,668 ) ( 1,401 ) 1,000 225
Net earnings 25,504 17,306 38,575 18,697 17,539 as percent of sales 2.8 % 2.3 % 6.5 % 3.8 % 5.0 %
Earnings per share from continuing operationsBasic * 0.94 1.07 1.43 0.65 0.69 Fully diluted * 0.93 1.05 1.41 0.65 0.69
Earnings per share Basic * 0.91 0.62 1.38 0.69 0.71 Fully diluted * 0.89 0.61 1.36 0.69 0.70
Book value per share at end of year ** 7.52 6.75 6.55 5.63 4.26
* Adjusted to account for the weighted daily average number of shares outstanding.
** Based on the number of shares outstanding at year-end.
All per share amounts have been adjusted to give retroactive recognition to the two-for-one stock split that took place in 1998.

We believe that we have a compelling story. What makes us even more excited is that thereremain significant opportunities for growth.
message to shareholders
Martin Schwartz and granddaughter Avery

[ DOREL Annua l Repor t 2001 p.3 ]
No one could have predicted the tragic
events of 2001 and the hardship it would bring
to so many. We can only be relieved that we are
now well into a new year. While the effects of
September 11 were widespread and directly impacted
consumer confidence, Dorel was able to outperform
the competition. Both our top and bottom lines
were enhanced despite the challenges. Shareholders
were rewarded with a considerable appreciation in
the value of the Company’s stock. We are confident
that as we celebrate our 40th anniversary we can do
even better and look forward to continued growth.
THE YEAR IN REVIEW
Income from continuing operations, before one-
time charges, was up 4% on a year-over-year basis.
We also succeeded in building market share in
each of our three segments. I find this performance
most acceptable in an environment where retailers
were taking a cautious approach and consumers
were being extremely prudent. The reverberations
through the economy sparked by the tragic events
of September 11, along with the run-up to Kmart’s
Chapter 11 filing, were significant and Dorel felt the
impact of these factors.
We were disappointed with the overall
performance of the Juvenile Group in 2001. While
the segment was able to maintain sales at last year’s
levels, fourth quarter sales in North America were
flat with the growth coming from increases
in Europe, principally as a result of the Quint
acquisition made during the second quarter.
We have reacted decisively to ensure that the
Juvenile Group returns to its traditional levels of
profitability. And we feel can do even better.
There is still considerable additional potential. While
Dorel’s Juvenile segment has seen rapid top line
growth, we are not yet satisfied with earnings.
We will welcome a new President to Dorel
Juvenile Group USA during the first half of this
year. He has been mandated to maximize the many
strengths of the Group. Strong brands and licensing
programs coupled with intensive new product
development will continue to solidify the Dorel
Juvenile Group as a world leader in the industry.
We expect to see the benefits of this intensified
focus as early as this year.
The positive results of our ready-to-assemble
furniture segment were in contrast to others in the
industry that experienced a particularly difficult
2001. We believe we are the only RTA producer
that was able to post such strong earnings increases
on a year-over-year basis. Dorel’s RTA segment has
traditionally done well in a weaker economy as our
products are popular and affordable. Clearly, we have
made gains during this difficult economic period at
the expense of our competitors.
In Home Furnishings, Dorel achieved the planned
turnaround and this segment is now definitely on
track for continued improvement. Strong demand
for the futon line and an aggressive program that
significantly lowered the cost structure of the
Montreal operations point to continued improve-
ment and profitability through 2002.
I refer you to our Management Discussion
& Analysis section beginning on page 18 for details
of the $12.4 million one-time, after-tax charge
related to the decision to increase the self-insured
component of the Company’s product liability insur-
ance program as well the $0.05 per share charge
for the write-off of Kmart accounts receivable.
[ DOREL Annua l Repor t 2001 p.4 ]
DOREL’S STRENGTHS
A question often asked by investors, particularly
when the economy shows weakness, is what is
Dorel doing that makes it stand out amongst the
crowd? As a global consumer products company,
we are committed to ensuring that people buy our
products, even if they are spending less. That is
why as one of the world’s largest juvenile products
and RTA manufacturers, we have concentrated on
items used daily, in homes and offices. Dorel makes
products that generally are in the opening to mid-
price point ranges, which can withstand economic
fluctuations and inflationary pressures.
INNOVATION IN PRODUCT DEVELOPMENT
Dorel is committed to continuous new product
development and innovation, across a vertically
integrated, low-cost manufacturing base. This is a
key to our success and has been a major factor in
placing us ahead of the competition. On average,
Dorel introduces 100 new quality products each
year. We have been extremely aggressive in out-
sourcing versus manufacturing in-house. Over the
years we have built an exceptionally strong
capability to source a wide variety of products,
designed by Dorel, but manufactured in Asia,
allowing us to maintain a highly competitive
position. We are, and will continue to be, relentless
in our pursuit to be the lowest cost producer in all
areas of our operations.
Despite its size, Dorel can act quickly. We have
brought new products to market in record time,
such as a line of tricycles and ladders. We have
designed and are continuing to develop a new
line of popular-priced car seats and strollers for
Europe’s mass retailers, hypermarches, as well as for
newer entry big box operations such as Wal*Mart.
This will widen the Company’s growing customer
base and will complement its existing strong
product lines in Europe. Rollouts will continue
through 2002.
QUALITY PRODUCTS
Dorel offers a growing variety of strong brand
name products on a reliable basis, providing retailers
with a highly dependable source of exciting
merchandise. Well aware of the importance of
branding, we have worked diligently to create
names that consumers relate to and continue to
seek out, such as Cosco, Maxi Cosi, Safety 1st and
Quinny in Juvenile and Ridgewood, Charleswood,
and Ameriwood in RTA.
We have also developed an assertive approach
to licensing and have secured programs with well
known names such as Disney, Eddie Bauer and
Playskool.
STRATEGIC MOVES
We have grown internally as well as by success-
fully integrating companies purchased through
a disciplined acquisition strategy–from our first
acquisition of Cosco in 1988 to last year’s acqui-
sition of Quint B.V. in Europe. Dorel has always
maintained a strong focus on the maintenance of a
very solid financial base. Our healthy balance sheet
has given us the ability to take advantage of
opportunities on an ongoing basis.

[ DOREL Annua l Repor t 2001 p.5 ]
CULTIVATION OF A SOLID CUSTOMER BASE
Another strength has been the ability to build
and maintain extremely solid relationships with
customers. The national mass merchants we serve
oblige us to deliver the best product for the best
price, accompanied by the best service. Our success
in dealing with these important merchandisers has
translated into Dorel being what we believe to be
the sharpest in the game. We continue to gain all
important market share as we further our strong
relationships and build on our customer base. The
popularity of our products with consumers ensures
that retailers increasingly turn to Dorel. Consumers
are able to access a wide choice of Dorel products
at any mass merchants.
OUTLOOK
We earnestly believe that we have a compelling
story. What makes us even more excited is that
there remain significant opportunities for growth.
We are set to reap the benefits of our continued
integration of recent acquisitions. Bottom line
improvement will be maintained through aggressive
purchasing and cost cutting initiatives. Our
European presence will continue to be bolstered by
the initiatives recently put in place. In addition,
there is considerable potential with additional
retailers that we haven’t yet penetrated.
We are convinced that with our record of
growth, our entrepreneurial spirit, dedication to
customer service, strong client relationships and
known brands, we can confidently predict continued
expansion and additional gains. Dorel will grow
profitably, but we must do it intelligently so that we
can continue to reward shareholders.
I can assure you that everyone at Dorel is
focused on improving the way we conduct business.
The on-going challenge is to take nothing for
granted, despite our successes. Although we have
increased profitability, we recognize there remains
room for additional improvement. This means being
more efficient, raising margins, cutting operating
expenses, lowering purchasing costs and becoming
better than we are today. Our employees and
suppliers have proven they are up to the challenge.
I sincerely thank all for their professionalism.
As we enter our 40th year, together we will continue to grow.
MARTIN SCHWARTZ
President and Chief Executive Officer
(signed)
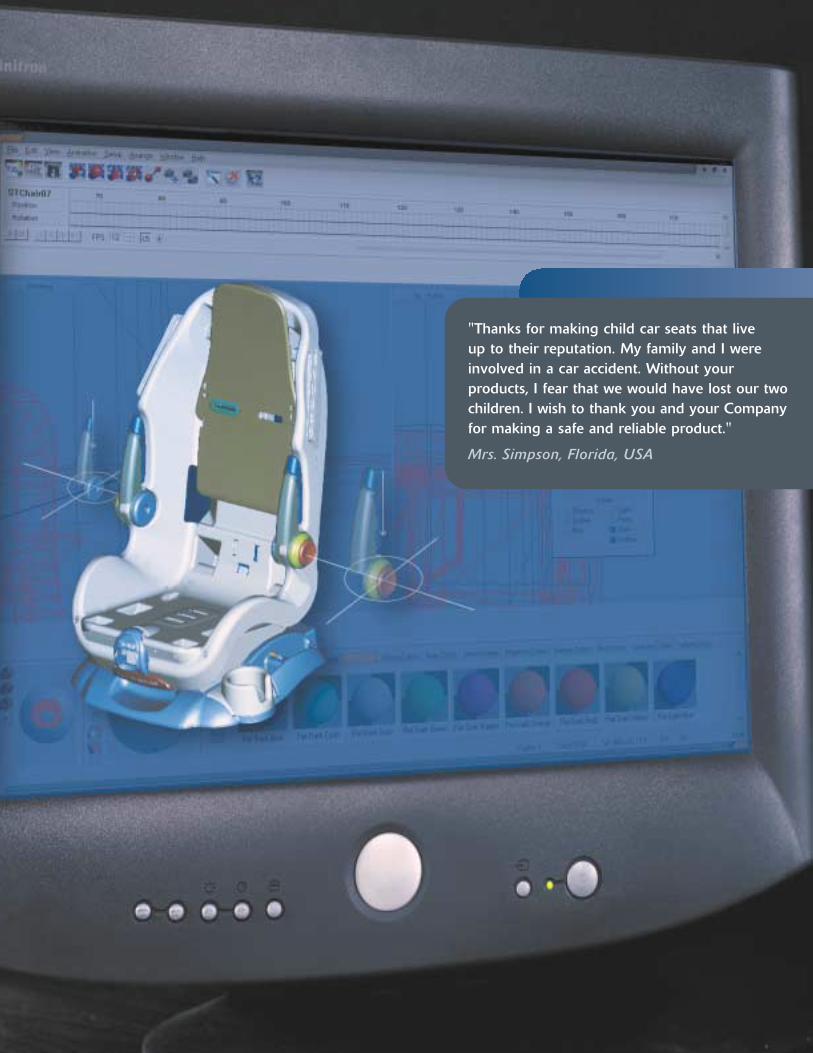
"Thanks for making child car seats that live up to their reputation. My family and I wereinvolved in a car accident. Without yourproducts, I fear that we would have lost our twochildren. I wish to thank you and your Companyfor making a safe and reliable product."
Mrs. Simpson, Florida, USA
[ DOREL Annua l Repor t 2001 p.7 ]
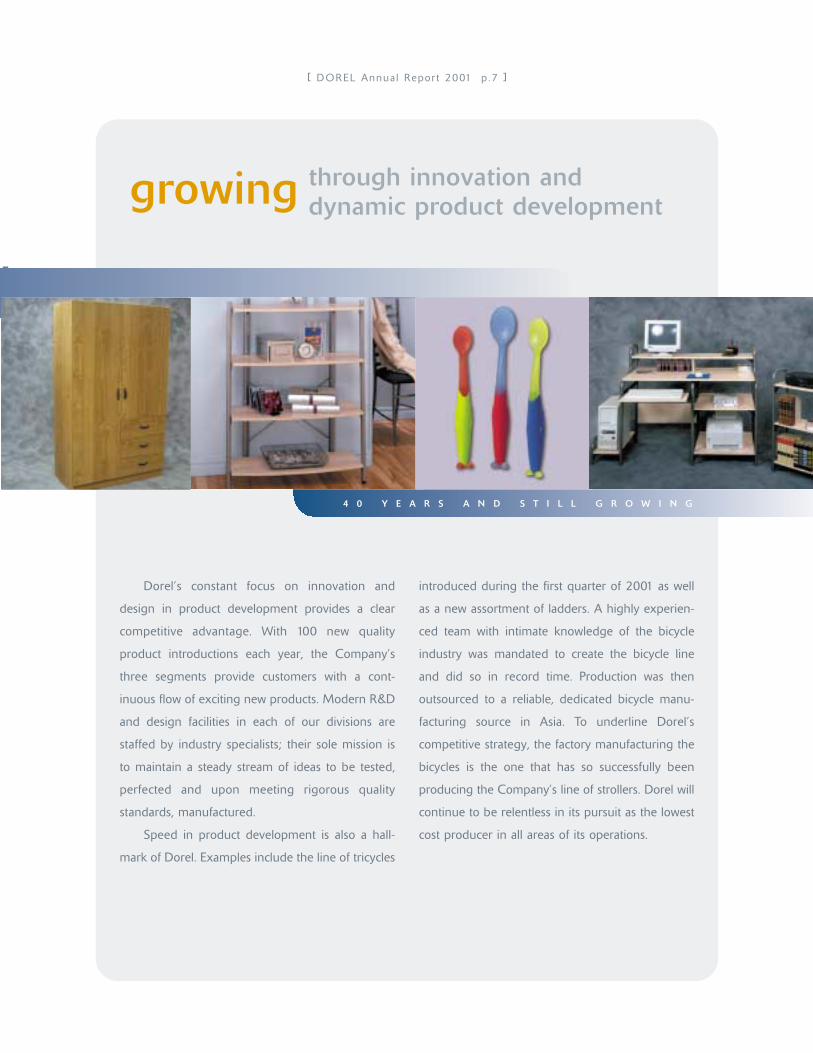
Dorel’s constant focus on innovation and
design in product development provides a clear
competitive advantage. With 100 new quality
product introductions each year, the Company’s
three segments provide customers with a cont-
inuous flow of exciting new products. Modern R&D
and design facilities in each of our divisions are
staffed by industry specialists; their sole mission is
to maintain a steady stream of ideas to be tested,
perfected and upon meeting rigorous quality
standards, manufactured.
Speed in product development is also a hall-
mark of Dorel. Examples include the line of tricycles
introduced during the first quarter of 2001 as well
as a new assortment of ladders. A highly experien-
ced team with intimate knowledge of the bicycle
industry was mandated to create the bicycle line
and did so in record time. Production was then
outsourced to a reliable, dedicated bicycle manu-
facturing source in Asia. To underline Dorel’s
competitive strategy, the factory manufacturing the
bicycles is the one that has so successfully been
producing the Company’s line of strollers. Dorel will
continue to be relentless in its pursuit as the lowest
cost producer in all areas of its operations.
growing through innovation and dynamic product development
4 0 Y E A R S A N D S T I L L G R O W I N G

[ DOREL Annua l Repor t 2001 p.8 ]
There can be no compromising when it comes
to quality and customer service. Dorel dedicates tens
of millions of dollars annually to these important
areas, subjecting products to rigorous testing
procedures. Our in-house sled testing facility is the
only one operated by a North American car seat
manufacturer. And Dorel dedicates important
human resources as well. The Dorel Juvenile
Group’s Vice-President of Quality and Safety
oversees the constant drive to continuously
upgrade the quality of all juvenile products. He also
works closely with regulatory agencies to ensure
harmonious and productive relationships.
This past year, the Company’s Juvenile products
system logistics was totally revamped, in part to
integrate the Cosco and Safety 1st shipping
systems. Ten locations were consolidated into five,
including two new 600,000 plus square foot,
state-of-the-art distribution centers in Greenwood,
Indiana and Ontario, California. Three other strate-
gically located centres were upgraded. The result
is faster, world-class service. With our capability to
load 200 trailers each day, Dorel’s customers are
assured the availability of more product and faster
order fulfillment. Dorel is now truly at the forefront
of just-in-time delivery.
growing through high-quality products and excellence in customer service
4 0 Y E A R S A N D S T I L L G R O W I N G

"I was so excited over your new step-ladder. I am 84. The wide steps, the lock on the side,
the handle, the wide tray, the rubber on all four legs make it so much safer for
a person my age."
Mrs. Virginia Montana, USA

"We travelled so many miles together. Nothing is too much with the Quinny 2000 buggy. Easy, fast and comfortable for my child."
Irene Oostdam, Eindhoven, Netherlands
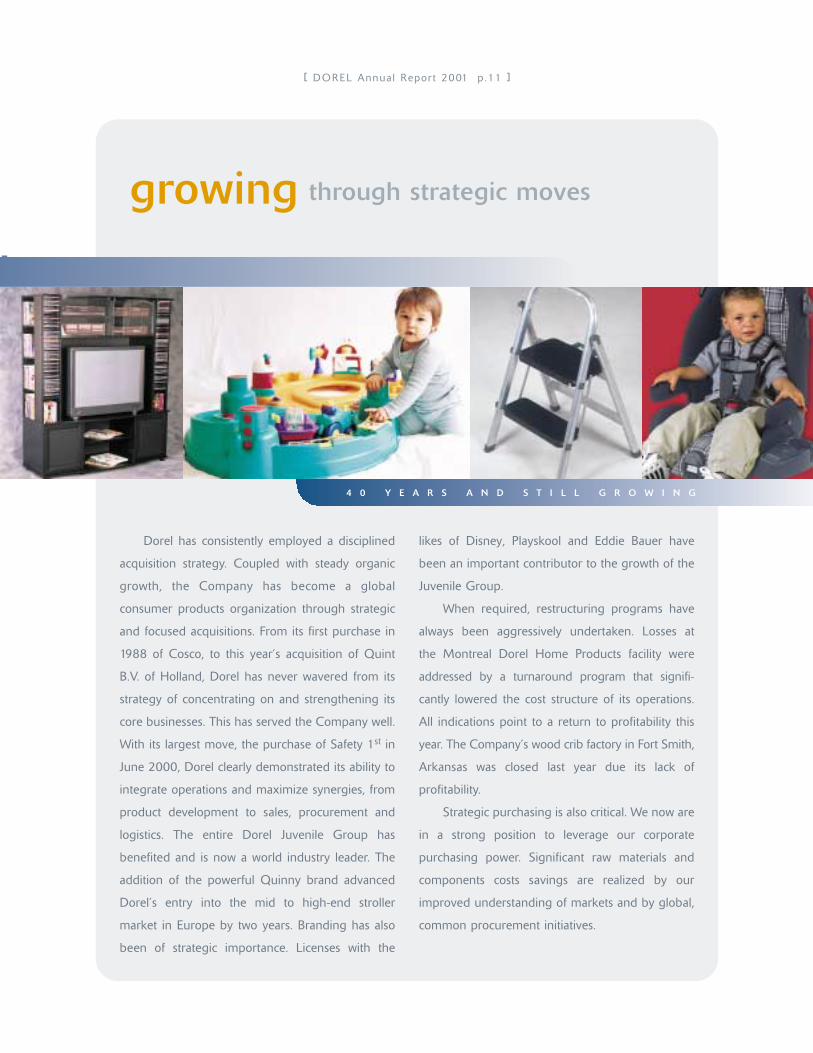
growing through strategic moves
[ DOREL Annua l Repor t 2001 p.11 ]
4 0 Y E A R S A N D S T I L L G R O W I N G
Dorel has consistently employed a disciplined
acquisition strategy. Coupled with steady organic
growth, the Company has become a global
consumer products organization through strategic
and focused acquisitions. From its first purchase in
1988 of Cosco, to this year’s acquisition of Quint
B.V. of Holland, Dorel has never wavered from its
strategy of concentrating on and strengthening its
core businesses. This has served the Company well.
With its largest move, the purchase of Safety 1st in
June 2000, Dorel clearly demonstrated its ability to
integrate operations and maximize synergies, from
product development to sales, procurement and
logistics. The entire Dorel Juvenile Group has
benefited and is now a world industry leader. The
addition of the powerful Quinny brand advanced
Dorel’s entry into the mid to high-end stroller
market in Europe by two years. Branding has also
been of strategic importance. Licenses with the
likes of Disney, Playskool and Eddie Bauer have
been an important contributor to the growth of the
Juvenile Group.
When required, restructuring programs have
always been aggressively undertaken. Losses at
the Montreal Dorel Home Products facility were
addressed by a turnaround program that signifi-
cantly lowered the cost structure of its operations.
All indications point to a return to profitability this
year. The Company’s wood crib factory in Fort Smith,
Arkansas was closed last year due its lack of
profitability.
Strategic purchasing is also critical. We now are
in a strong position to leverage our corporate
purchasing power. Significant raw materials and
components costs savings are realized by our
improved understanding of markets and by global,
common procurement initiatives.

[ DOREL Annua l Repor t 2001 p.12 ]
Dorel’s steady growth is due in large part to
the win-win relationships it has fostered with its
customers. Retailers continuously count on Dorel
for a reliable source of high quality, competitively
priced products that keep consumers returning to
their stores. With most items in the promotional to
mid-price ranges, sell-through is strong even in
difficult economic times. The Company’s attention
to customer service has resulted not only in increased
sales but in a record number of Vendor Awards
from major North American mass merchants.
Dorel’s strategy is to remain close to its
customers, both in terms of relationships and
physical location. The Company has established
offices to deal specifically with key accounts. Each is
dedicated exclusively to those specific customers
and is located in close proximity to them. Personnel
have also been mandated to oversee the needs of
key customers at Dorel’s various facilities.
This has created important and lasting relation-
ships that also result in an on-going dialogue with
buyers and provides vital feedback for use in product
design and procurement preferences.
growing through solid relationships
4 0 Y E A R S A N D S T I L L G R O W I N G
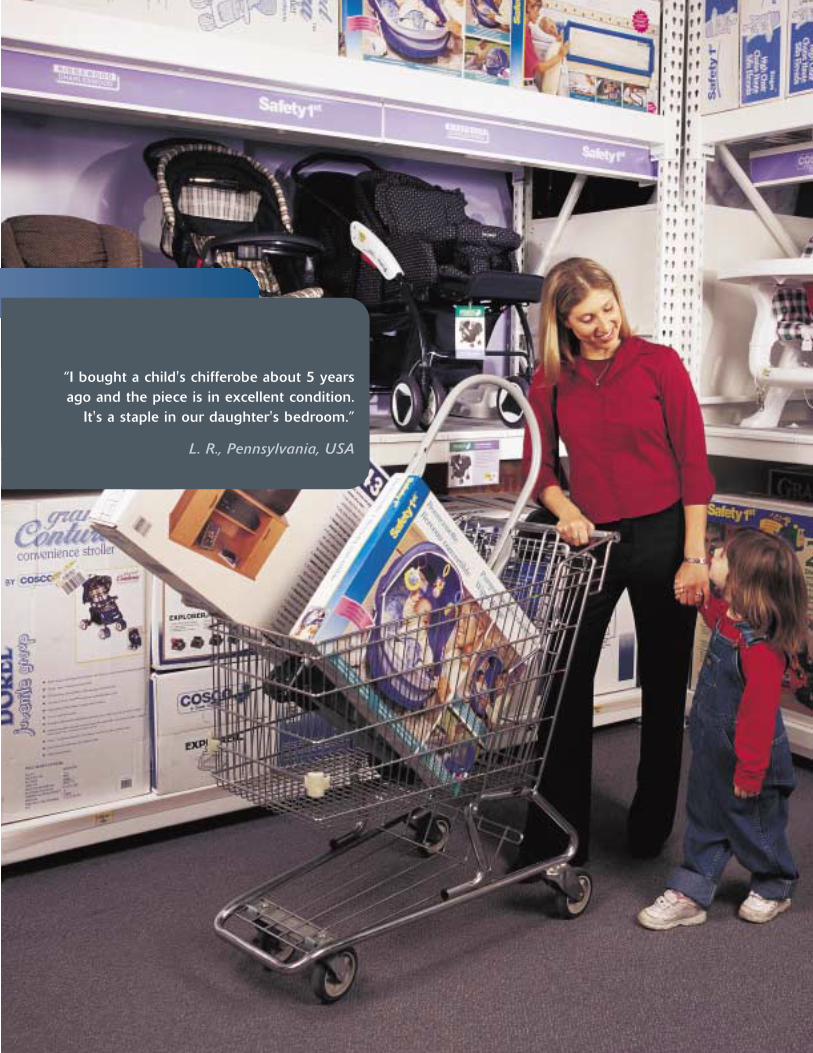
“I bought a child's chifferobe about 5 years ago and the piece is in excellent condition.
It's a staple in our daughter's bedroom.”
L. R., Pennsylvania, USA

With the initiatives that we haveundertaken over the past twelvemonths, we remain extremely well positioned to continue ourgrowth as we move forward.
messagefrom our chief operating officer
Pierre Dupuis and granddaughter Ines

Despite a difficult external environment in 2001,
Dorel made solid progress and continued to
position itself for long-term sustained growth. While
extremely challenging, the year was, in fact, one of
significant accomplishments. The Dorel team has
shown an incredible ability to achieve growth in even
the most demanding of times. With the initiatives
that we have undertaken over the past twelve
months, we remain extremely well positioned to
continue this growth as we move forward.
The year was one of serious re-evaluation and
continuous improvement of what we do and how
we do it. Simply put, we have been focusing on
growing our capabilities to best compete on a global
scale. We have been concentrating our efforts on
manufacturing in the most cost-effective way and
delivering to our customers the highest quality
products in the most timely and efficient manner.
What underlies our success is teamwork. Everyone
from senior management through to factory
personnel has accepted the challenges and
co-operates fully in realizing them.
Wide-ranging changes were identified and
addressed in the areas of organization, customer
service, efficiency, and marketing. We have also
continued to focus on the one area that has set this
Company apart from its competitors–an area that
has been our stalwart of growth–product develop-
ment and innovation at the right cost. Dorel was
built on a commitment of continuous new product
development and innovation across a vertically
integrated, low-cost manufacturing base. As a global
consumer products company product development
is the key to success. On average, Dorel is intro-
ducing 100 new products per year. This alone has
been the single largest factor in placing us ahead
of our competitors. Our recently implemented
restructuring programs are already paying off. Head
count and overhead costs have been reduced,
particularly in our Juvenile operations. Other savings
in information systems, logistics and purchasing
have also been realized. We have also been
extremely aggressive in our outsourcing effort; a
wide variety of products are now designed by Dorel
but manufactured in Asia. This has allowed us to
maintain a very competitive cost position.
We have taken major initiatives that will further
reduce our cost base, capitalizing on a weak econ-
omy and lower commodity prices. Procurement has
become a strategic opportunity. At the same time
that we are actively working to make all of our
plants more efficient, we have also taken a close
look at operating working capital. Strict targets were
set for inventories, receivables and payables and we
are already seeing the benefits of this discipline.
We are, and will continue to be, relentless in our
pursuit to be the low-cost producer in all of our
areas of operation.
I look forward with great satisfaction to another
period of building and growing–growing our market
share, growing our reputation, growing on our
solid global base and growing our bottom line.
The seeds have been planted and have taken firm
root over the past 40 years. As a result, Dorel,
its customers and shareholders are benefiting from
40 years of passion for service and building customer
relationships. Our Company is strong and can count
on over 3,600 individuals who are dedicated to the
success of our enterprise.
I am very proud to be a part ofthe future of this Company as webuild on its 40 years of history.
PIERRE DUPUIS
Chief Operating Officer
[ DOREL Annua l Repor t 2001 p.15 ]
(signed)
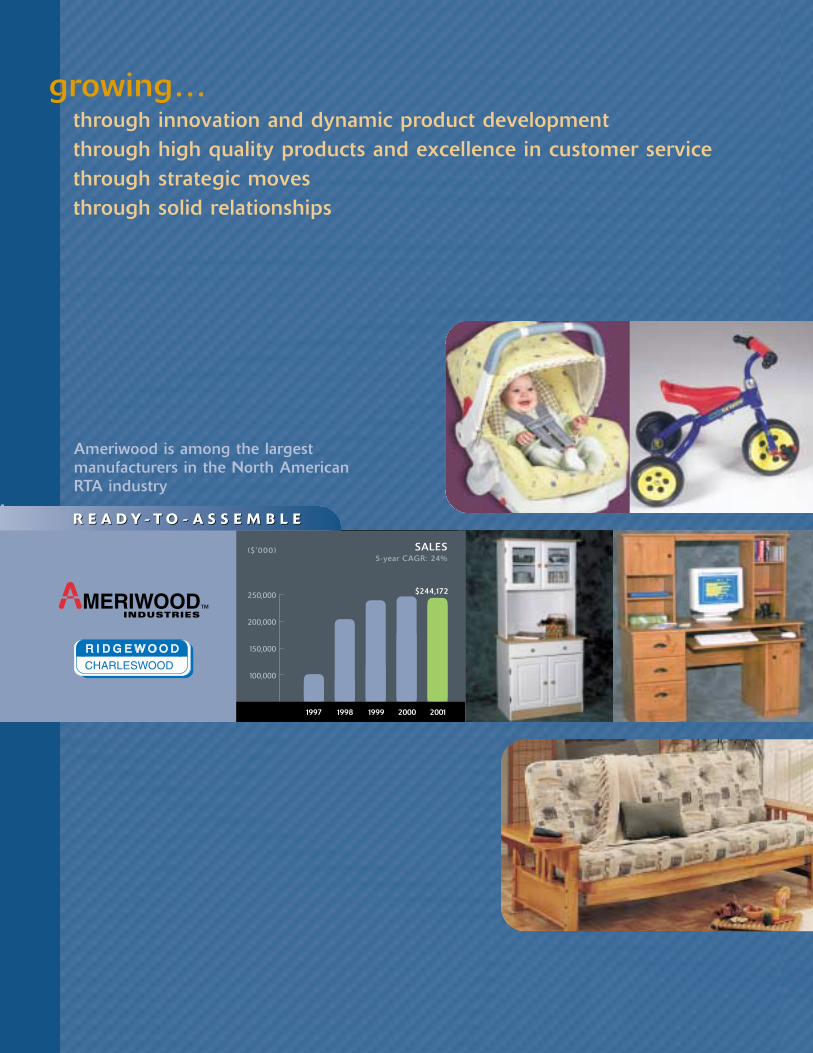
Ameriwood is among the largest manufacturers in the North American RTA industry
100,000
150,000
200,000
250,000 $244,172
($ '000) SALES5-year CAGR: 24%
1997 1998 1999 2000 2001
R E A D Y - T O - A S S E M B L ER E A D Y - T O - A S S E M B L E
growing… through innovation and dynamic product developmentthrough high quality products and excellence in customer servicethrough strategic movesthrough solid relationships

100,000
200,000
300,000
400,000
500,000
600,000
1997 1998 1999 2000 2001
$503,892
($ '000) SALES5-year CAGR: 35%
H O M E F U R N I S H I N G SH O M E F U R N I S H I N G S
50,000
100,000
150,000
200,000
$168,705
($ '000) SALES5-year CAGR: 15%
1997 1998 1999 2000 2001
J U V E N I L EJ U V E N I L E
The Cosco/Safety 1st/Maxi combinationhas created one of the world’s largestjuvenile products companies
Cosco is the leading brand name in the growing folding furniture and step stool market
DOREL (UK) LTD.
[ DOREL Annua l Repor t 2001 p.18 ]
management’s discussion and analysisCORPORATE OBJECTIVES, CORE BUSINESSES AND STRATEGIESOverview
Dorel Industries’ goal is to be one of the premier consumer products companies in North America and Europe. The Company
carries out its business in three distinct product areas: Juvenile Products, Ready-to-Assemble (RTA) Furniture and Home
Furnishings. These segments consist of several operating divisions or subsidiaries. Each operating division or subsidiary is
managed independently by a separate group of managers. Management of the Company coordinates the businesses of each
segment and maximizes cross-selling, cross-marketing, procurement and other complementary business opportunities.
The Juvenile Segment operates as the Dorel Juvenile Group (DJG) and comprises DJG USA, DJG Canada and DJG Europe.
The principal brand names of DJG are Cosco and Safety 1st in North America and Maxi-Cosi, Quinny and Safety 1st in Europe.
In addition, the Company has licensing agreements with well-recognized brand names such as Eddie Bauer, Disney, Looney
Tunes, Playskool and NASCAR. The RTA Segment consists of Ameriwood Industries and Ridgewood Industries, both based in
North America and sells under the Ameriwood, Ridgewood and Charleswood brand names. The Home Furnishings Segment
includes Cosco Home & Office Products, Dorel Home Products and Dorel Asia and has a licensing agreement with the Sealy
Mattress Company.
The Company’s head office is located in Montreal, Quebec and has major North American facilities located in Montreal,
Quebec; Cornwall, Ontario; Columbus, Indiana; Cartersville, Georgia; Wright City, Missouri; Tiffin, Ohio; Dowagiac, Michigan;
and Canton, Massachusetts. European operations are headquartered in Helmond, Holland with major sales offices in the United
Kingdom, Germany and France. The Company’s international sourcing operations are carried out through Dorel Asia based in
Hong Kong. Dorel currently employs approximately 3,600 people in nine countries.
Dorel’s ultimate goal is to satisfy consumer needs while achieving maximum financial results for its stakeholders. This is
accomplished by emphasizing high-quality products that are accessible to all consumers and by continually investing in new
product development. Dorel’s growth has come from both increasing sales of existing businesses and by acquiring companies
that Management believes add value to the Company. Recent key and strategic acquisitions include Quint B.V. (based in Europe)
in 2001, Safety 1st in 2000 and Ameriwood Industries in 1998.
Sales Philosophy and Channels of Distribution
Dorel conducts its business through a variety of sales and distribution arrangements. These consist of salaried employees;
individual agents who carry the Company's products on either an exclusive or non-exclusive basis; individual specialized agents
who sell products, including Dorel's, exclusively to one customer such as a major discount chain; and sales agencies which
themselves employ their own sales force. While retailers carry out the bulk of the advertising of Dorel’s products, the Juvenile
Products Segment does advertise and promote its products through the use of advertisements in specific magazines and multi-
product brochures.
Dorel believes that its commitment to providing a high-quality, industry-leading level of service has allowed it to develop
particularly successful and mutually beneficial relationships with major retailers. As an example of this commitment to service,
the Company has received more than 40 Awards of Excellence from its major customers since 1992. This level of customer
satisfaction has been achieved by fostering particularly close contacts between Dorel’s sales representatives and the customers.
To this end, permanent, full-service agency account teams dedicated exclusively to certain major accounts have been established.
These dedicated account teams provide their customers with the assurance that inventory and supply requirements will be met
and that any problems will be immediately addressed.
Dorel believes that the trend among its mass merchant customer base to buy from fewer but larger suppliers who are capable
of delivering a wide range of products, provide greater security of supply and render increased levels of service, will continue.
The ability to deliver a wide range of products on a reliable basis, combined with a demonstrated commitment to service, results
in an important competitive advantage in this environment. These relationships with major accounts have the additional benefit
of providing important feedback that is used to improve product offerings and to respond rapidly to changing market trends.
[ DOREL Annua l Repor t 2001 p.19 ]
Segments
Juvenile Products Segment
The Juvenile Products Segment manufactures and imports products such as infant car seats, strollers, high chairs, toddler beds,
playpens, swings and infant health and safety aids. Dorel is among the three largest juvenile products companies in North
America along with Graco (a part of the Newell Group of companies) and Evenflo Company Inc.
Although Dorel manufactures and sells juvenile products at all price levels–entry level to high-end price points–Dorel's
products are designed for consumers whose priorities are safety and quality at reasonable prices. Its products are sold principally
through mass merchants, department stores and hardware/home centres. In recent years, licensing agreements with well-
recognized brand names have accelerated the entry into the higher priced juvenile products market. In Europe, Dorel also sells
higher-end juvenile products to boutiques and smaller stores along with major domestic chains.
RTA Furniture Segment
RTA furniture is manufactured and packaged as component parts and is assembled by the consumer. Dorel's RTA Furniture
Segment produces office furniture, home office furniture, computer tables, microwave stands as well as entertainment and home
theater units. Dorel is one of the four largest producers of RTA furniture in North America, along with Bush Industries, O’Sullivan
Industries and Sauder.
RTA furniture, by nature, is a reasonably priced alternative to traditional wooden furniture and as such is sold mainly to mass
merchants, office superstores and hardware/home centers.
Home Furnishings Segment
The Home Furnishings Segment consists of metal folding furniture, futons, step stools, ladders, metal and wood home office
furniture and other imported furniture items. This segment capitalizes on the chains of distribution established by the other
segments of Dorel’s businesses and sells to the same types of customers.
The Home Furnishings industry that Dorel competes in is characterized by a large number of smaller competitors. As such, there
is little market share information available that would determine the Company’s size or performance in relation to its competitors.
Other
Dorel is the sole owner of all patents and manufacturing licenses for its products. The loss of any one of these patents would
not adversely impact Dorel's operations. In 2001, 91% of Dorel's sales were in North America and 9% were in Europe and
elsewhere. Generally, retail sales of Dorel products are not subject to major seasonal variations; however, sales in the RTA
Furniture Segment tend to be stronger in the second half of the year. Quality control is an essential part of Dorel's competitive
position. Dorel’s products are developed to exclusive specifications and rigid safety standards, particularly as regards to the
Juvenile Products Segment.
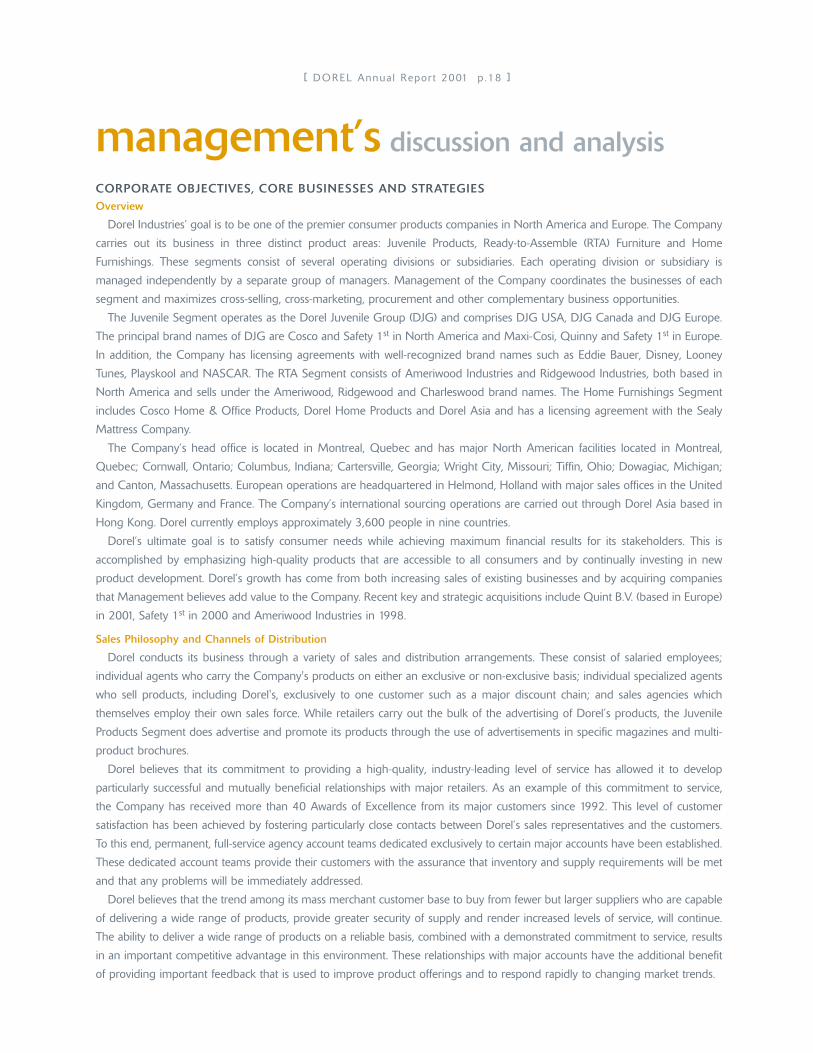
400,000
600,000
800,000
1,000,000
351,989
492,554
596,702
757,540
916,769
TOTAL SALES5-year CAGR: 26%
1997 1998 1999 2000 2001
($'000)
[ DOREL Annua l Repor t 2001 p.20 ]
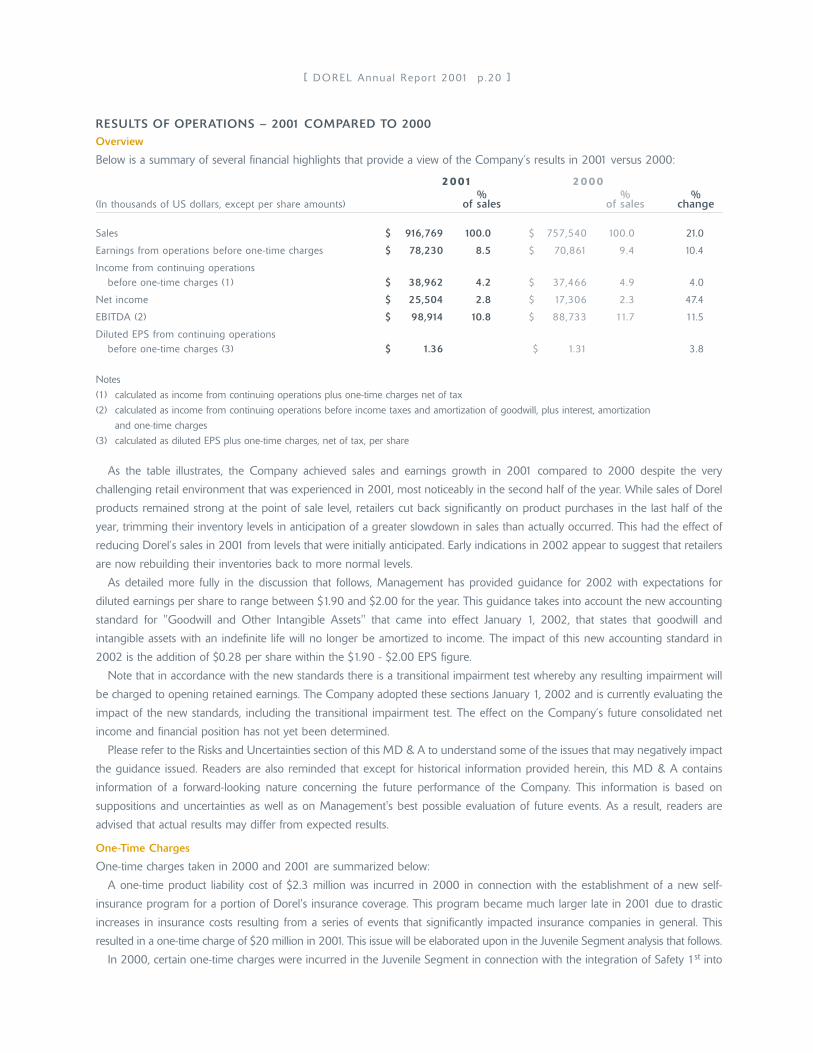
RESULTS OF OPERATIONS – 2001 COMPARED TO 2000Overview
Below is a summary of several financial highlights that provide a view of the Company’s results in 2001 versus 2000:
2001 2000% % %
(In thousands of US dollars, except per share amounts) of sales of sales change
Sales $ 916,769 100.0 $ 757,540 100.0 21.0
Earnings from operations before one-time charges $ 78,230 8.5 $ 70,861 9.4 10.4
Income from continuing operations before one-time charges (1) $ 38,962 4.2 $ 37,466 4.9 4.0
Net income $ 25,504 2.8 $ 17,306 2.3 47.4
EBITDA (2) $ 98,914 10.8 $ 88,733 11.7 11.5
Diluted EPS from continuing operations before one-time charges (3) $ 1.36 $ 1.31 3.8
Notes
(1) calculated as income from continuing operations plus one-time charges net of tax
(2) calculated as income from continuing operations before income taxes and amortization of goodwill, plus interest, amortization
and one-time charges
(3) calculated as diluted EPS plus one-time charges, net of tax, per share
As the table illustrates, the Company achieved sales and earnings growth in 2001 compared to 2000 despite the very
challenging retail environment that was experienced in 2001, most noticeably in the second half of the year. While sales of Dorel
products remained strong at the point of sale level, retailers cut back significantly on product purchases in the last half of the
year, trimming their inventory levels in anticipation of a greater slowdown in sales than actually occurred. This had the effect of
reducing Dorel’s sales in 2001 from levels that were initially anticipated. Early indications in 2002 appear to suggest that retailers
are now rebuilding their inventories back to more normal levels.
As detailed more fully in the discussion that follows, Management has provided guidance for 2002 with expectations for
diluted earnings per share to range between $1.90 and $2.00 for the year. This guidance takes into account the new accounting
standard for "Goodwill and Other Intangible Assets" that came into effect January 1, 2002, that states that goodwill and
intangible assets with an indefinite life will no longer be amortized to income. The impact of this new accounting standard in
2002 is the addition of $0.28 per share within the $1.90 - $2.00 EPS figure.
Note that in accordance with the new standards there is a transitional impairment test whereby any resulting impairment will
be charged to opening retained earnings. The Company adopted these sections January 1, 2002 and is currently evaluating the
impact of the new standards, including the transitional impairment test. The effect on the Company’s future consolidated net
income and financial position has not yet been determined.
Please refer to the Risks and Uncertainties section of this MD & A to understand some of the issues that may negatively impact
the guidance issued. Readers are also reminded that except for historical information provided herein, this MD & A contains
information of a forward-looking nature concerning the future performance of the Company. This information is based on
suppositions and uncertainties as well as on Management's best possible evaluation of future events. As a result, readers are
advised that actual results may differ from expected results.
One-Time Charges
One-time charges taken in 2000 and 2001 are summarized below:
A one-time product liability cost of $2.3 million was incurred in 2000 in connection with the establishment of a new self-
insurance program for a portion of Dorel's insurance coverage. This program became much larger late in 2001 due to drastic
increases in insurance costs resulting from a series of events that significantly impacted insurance companies in general. This
resulted in a one-time charge of $20 million in 2001. This issue will be elaborated upon in the Juvenile Segment analysis that follows.
In 2000, certain one-time charges were incurred in the Juvenile Segment in connection with the integration of Safety 1st into
[ DOREL Annua l Repor t 2001 p.21 ]
Dorel Industries. These restructuring costs totalled $9.7 million and consisted of asset impairments of $4.4 million, severance and
other employment related costs of $2.1 million, distribution consolidation costs of $2.8 million and other costs of $0.4 million.
Also in 2000, the Juvenile Segment as a whole was re-examined to identify core product lines and as a result, three of the
Company’s operating units within the segment were discontinued. The wood crib manufacturing operation in Fort Smith,
Arkansas was closed, the assets of Infantino, a soft goods importer based in California, were sold to Infantino management and
the stroller importing program carried out through Dorel U.K. in Europe was shut down. The losses from these three
discontinued operations totalled $12.7 million in 2000 and appear as a line item on the income statement. Of the $12.7 million
loss in 2000, $8.0 million came from operations and $4.7 million was earmarked for the anticipated loss on disposal. The losses
that were estimated at $4.7 million were actually $5.8 million and the difference of $1.1 million appears as loss from discontinued
operations in 2001. The Fort Smith shutdown was responsible for the more than initially anticipated losses on disposal.
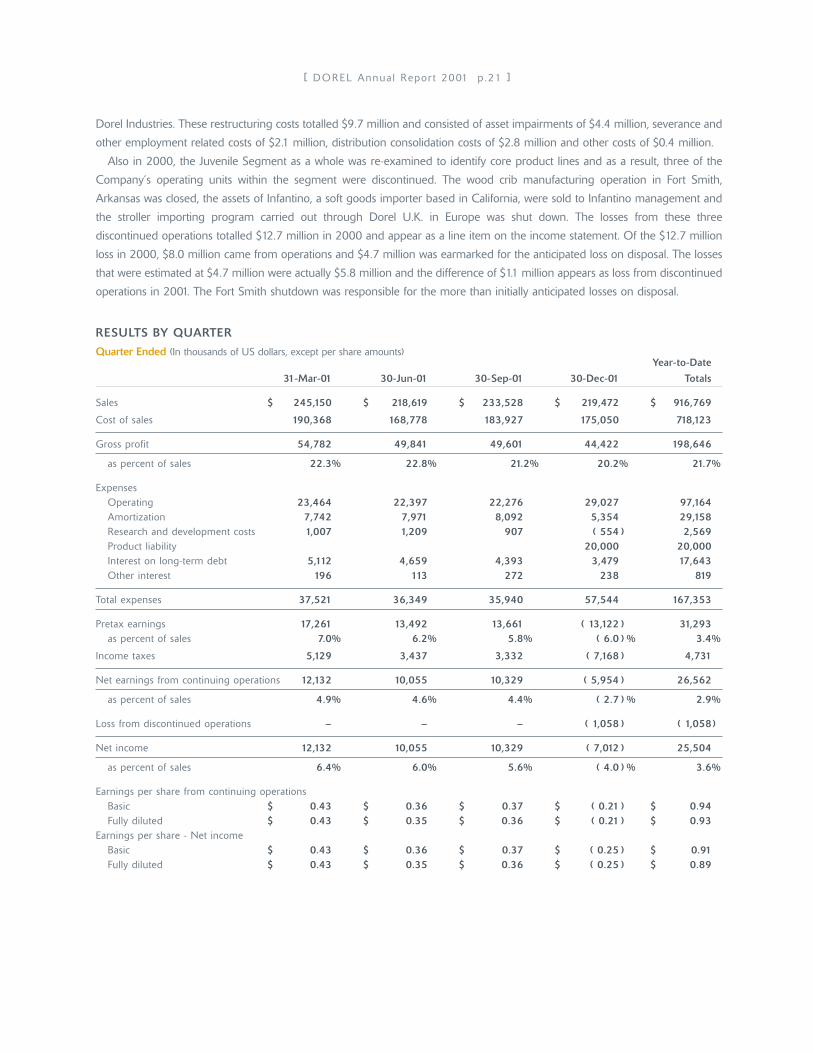
RESULTS BY QUARTER
Quarter Ended (In thousands of US dollars, except per share amounts)Year-to-Date
31-Mar-01 30-Jun-01 30-Sep-01 30-Dec-01 Totals
Sales $ 245,150 $ 218,619 $ 233,528 $ 219,472 $ 916,769
Cost of sales 190,368 168,778 183,927 175,050 718,123
Gross profit 54,782 49,841 49,601 44,422 198,646
as percent of sales 22.3% 22.8% 21.2% 20.2% 21.7%
ExpensesOperating 23,464 22,397 22,276 29,027 97,164 Amortization 7,742 7,971 8,092 5,354 29,158 Research and development costs 1,007 1,209 907 ( 554 ) 2,569 Product liability 20,000 20,000 Interest on long-term debt 5,112 4,659 4,393 3,479 17,643 Other interest 196 113 272 238 819
Total expenses 37,521 36,349 35,940 57,544 167,353
Pretax earnings 17,261 13,492 13,661 ( 13,122 ) 31,293 as percent of sales 7.0% 6.2% 5.8% ( 6.0 ) % 3.4%
Income taxes 5,129 3,437 3,332 ( 7,168 ) 4,731
Net earnings from continuing operations 12,132 10,055 10,329 ( 5,954 ) 26,562
as percent of sales 4.9% 4.6% 4.4% ( 2.7 ) % 2.9%
Loss from discontinued operations – – – ( 1,058 ) ( 1,058 )
Net income 12,132 10,055 10,329 ( 7,012 ) 25,504
as percent of sales 6.4% 6.0% 5.6% ( 4.0 ) % 3.6%
Earnings per share from continuing operationsBasic $ 0.43 $ 0.36 $ 0.37 $ ( 0.21 ) $ 0.94 Fully diluted $ 0.43 $ 0.35 $ 0.36 $ ( 0.21 ) $ 0.93
Earnings per share - Net incomeBasic $ 0.43 $ 0.36 $ 0.37 $ ( 0.25 ) $ 0.91 Fully diluted $ 0.43 $ 0.35 $ 0.36 $ ( 0.25 ) $ 0.89
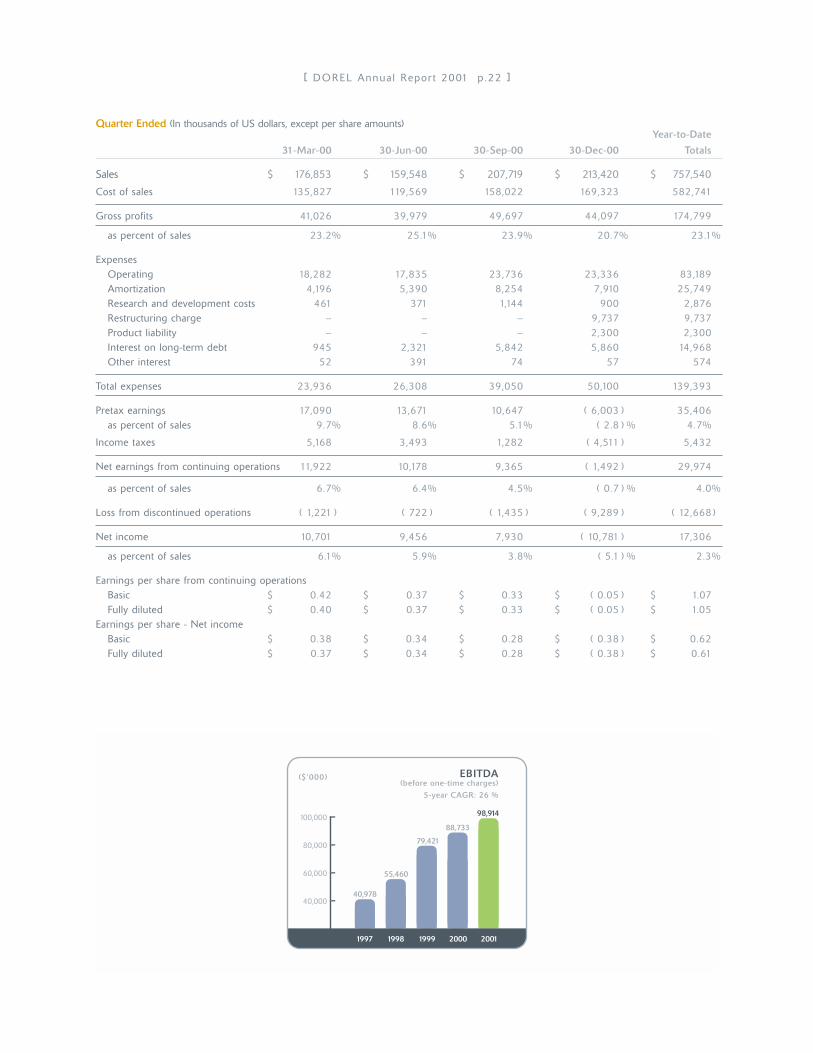
[ DOREL Annua l Repor t 2001 p.22 ]
Quarter Ended (In thousands of US dollars, except per share amounts)Year-to-Date
31-Mar-00 30-Jun-00 30-Sep-00 30-Dec-00 Totals
Sales $ 176,853 $ 159,548 $ 207,719 $ 213,420 $ 757,540
Cost of sales 135,827 119,569 158,022 169,323 582,741
Gross profits 41,026 39,979 49,697 44,097 174,799
as percent of sales 23.2% 25.1% 23.9% 20.7% 23.1%
ExpensesOperating 18,282 17,835 23,736 23,336 83,189 Amortization 4,196 5,390 8,254 7,910 25,749 Research and development costs 461 371 1,144 900 2,876 Restructuring charge – – – 9,737 9,737 Product liability – – – 2,300 2,300 Interest on long-term debt 945 2,321 5,842 5,860 14,968 Other interest 52 391 74 57 574
Total expenses 23,936 26,308 39,050 50,100 139,393
Pretax earnings 17,090 13,671 10,647 ( 6,003 ) 35,406 as percent of sales 9.7% 8.6% 5.1% ( 2.8 ) % 4.7%
Income taxes 5,168 3,493 1,282 ( 4,511 ) 5,432
Net earnings from continuing operations 11,922 10,178 9,365 ( 1,492 ) 29,974
as percent of sales 6.7% 6.4% 4.5% ( 0.7 ) % 4.0%
Loss from discontinued operations ( 1,221 ) ( 722 ) ( 1,435 ) ( 9,289 ) ( 12,668 )
Net income 10,701 9,456 7,930 ( 10,781 ) 17,306
as percent of sales 6.1% 5.9% 3.8% ( 5.1 ) % 2.3%
Earnings per share from continuing operationsBasic $ 0.42 $ 0.37 $ 0.33 $ ( 0.05 ) $ 1.07 Fully diluted $ 0.40 $ 0.37 $ 0.33 $ ( 0.05 ) $ 1.05
Earnings per share - Net incomeBasic $ 0.38 $ 0.34 $ 0.28 $ ( 0.38 ) $ 0.62 Fully diluted $ 0.37 $ 0.34 $ 0.28 $ ( 0.38 ) $ 0.61
40,000
60,000
80,000
100,000
40,978
55,460
79,421
88,733
98,914
EBITDA(before one-time charges)
5-year CAGR: 26 %
1997 1998 1999 2000 2001
($'000)

[ DOREL Annua l Repor t 2001 p.23 ]
Segments
Dorel’s segmented results are summarized below:2001 2000 Change
(In thousands of US dollars) $ % of sales $ % of sales $ %
Juvenile
Sales 503,892 100.0 369,582 100.0 134,309 36.3
Gross profit 115,881 23.0 95,159 25.7 20,722 21.8
Operating expenses 62,945 12.5 49,715 13.5 13,230 26.6
Amortization 21,042 4.2 15,058 4.1 5,984 39.7
Research and development 1,270 0.3 1,670 0.5 ( 400 ) ( 24.0 )
Earnings from operations* 30,624 6.1 28,715 7.8 1,908 6.6
* before one-time charges
Ready-to-Assemble
Sales 244,172 100.0 245,745 100.0 ( 1,572 ) ( 0.6 )
Gross profit 63,951 26.2 62,581 25.5 1,370 2.2
Operating expenses 14,163 5.8 14,567 5.9 ( 404 ) ( 2.8 )
Amortization 4,728 1.9 6,849 2.8 ( 2,121 ) ( 31.0 )
Research and development 864 0.4 728 0.3 136 18.7
Earnings from operations 44,196 18.1 40,438 16.5 3,759 9.3
Home furnishings
Sales 168,705 100.0 142,213 100.0 26,492 18.6
Gross profit 18,855 11.2 17,059 12.0 1,796 10.5
Operating expenses 12,757 7.6 11,999 8.4 758 6.3
Amortization 2,253 1.3 2,874 2.0 ( 620 ) ( 21.6 )
Research and development 435 0.3 479 0.3 ( 44 ) ( 9.2 )
Earnings from operations 3,410 2.0 1,708 1.2 1,702 99.6
$0.60
$0.90
$1.20
$1.50
$0.68
$0.92
$1.41$1.31 $1.36
E.P.S.(from continuing operations,
before one-time charges)
1997 1998 1999 2000 2001

[ DOREL Annua l Repor t 2001 p.24 ]
Juvenile
There were several significant events in the Juvenile Segment in 2001. Early in the year, it was announced that Dorel would
enter the $3 billion US bicycle market. Initial product consists of a line of US designed tricycles/small bicycles, manufactured in
China, to be marketed under the Safety 1st banner. This is the first phase in a program that will eventually see Dorel penetrate
the entire bicycle industry based on a plan to target the sector over the next 2 to 3 years with product offerings including adult
bikes. Innovative designs, strong brands and the solid relationships that have been built with mass merchants combine to place
Dorel in a most favourable position to offer consumers a line of exciting, safe, quality products. In addition, there are several
parallels between the production of bicycles and strollers, a product line in which Dorel has a great deal of experience. Dorel is
working with the same factory that manufactures its strollers. It is a highly reliable, dedicated bicycle-manufacturing source in
Asia and the Company has a small yet experienced design team with an intimate knowledge of the industry.
In April, Dorel agreed to a $US1.75 million settlement with the US Consumer Product Safety Commission (CPSC) to resolve
issues relating to delayed reporting of consumers' complaints involving some of the products manufactured by the Juvenile
Group. Dorel entered into this agreement for settlement purposes only, to avoid incurring additional legal costs and to bring
closure to this matter. Any allegation of wrongdoing of any kind was strongly rejected. As part of Dorel’s commitment to safety,
a new position of Vice-President of Quality Assurance and Product Safety was created and a product safety expert with more
than 20 years of experience was hired. Additional staff has been engaged to provide increased communications with the public
and government on product performance and safety issues.
Also in April, Dorel purchased Quint B.V. of Holland. Founded 50 years ago, Quint B.V. is an established designer and
marketer of high-end baby strollers sold in European specialty shops under the "Quinny" brand. This will allow for a major push
in Europe to significantly grow the Company's juvenile business. Quint was profitable at the time of purchase and was accretive
to earnings in 2001, although the impact was not material.
Quint’s products include three-wheel strollers popular with joggers, four-wheel strollers and buggies. The Company’s
marketing strategy has been to concentrate on upscale quality and design, leaving the low price segment, where there
is considerable competition, to others. Sales in the most recent fiscal year totalled $US20 million. The purchase of Quint
advanced Dorel’s entry into the mid to high-end stroller business by two years. It is a perfect fit with existing Maxi-Cosi lines that
have proven so popular in Europe. New travel systems combining Quint strollers with Maxi-Cosi car seats were introduced.
The Quint operations were relocated to a new expanded Maxi-Miliaan facility in Helmond, Holland, resulting in important
synergies in administration, sales, information technology and purchasing.
Late in the year, Dorel made a strategic decision to become less reliant on traditional insurance by increasing its self-insurance
product liability program and lessening its dependence on third-party insurers. This change in policy was due to the
unprecedented tightening of insurance markets that resulted in exorbitant increases in premiums and required retention levels.
As discussed earlier, the related one-time charge of $20 million, was based on the Company’s latest actuarial reports and was
not related to specific cases. Rather it was a general provision required as part of increased self-insurance to address the potential
liability risks and associated costs of the Company’s products currently in the market place. Dorel’s success in becoming the
market share leader of children’s car seats has resulted in a significant increase in the amount of its car seats that are in use. In
fact, over the past six years there has been an almost fivefold increase in the Company’s car seat sales. Also, the Company
believes that there will be a decrease in liability related to car seats once the new government-enforced Latch Locking System
for car seats comes into effect in late 2002. Dorel is at the forefront of this new technology that will allow for easier and safer
mounting of child restraints and will greatly reduce the potential misuse of these products.
Dorel continues to maintain traditional insurance for catastrophic losses.
Sales in the Juvenile Segment grew by 36% in 2001. Excluding the impact of acquisitions, internal sales growth was almost
11%, coming from Europe and North America and principally in car seats and strollers with smaller contributions from infant
health care categories and toddler beds. Juvenile margins were down versus last year with both Europe and North America
contributing to the decrease. European margins were hurt by the weak Euro, higher expenses as a result of the Quint integration
and product mix. In particular, Maxi-Cosi strollers were sold at lower margins in 2001 versus 2000. The European operations
were centralized in 2001 into a new large office and warehouse complex. This resulted in higher overheads due to some
duplication of expenses.
[ DOREL Annua l Repor t 2001 p.25 ]
In North America, product mix as well as higher than expected distribution costs resulted in reduced margins. In addition,
during the fourth quarter, retailers drastically reduced their purchases resulting in higher overheads as a percentage of sales. As
an illustration of this, US sales fell 22% in the fourth quarter versus the third quarter, yet fixed overheads remained the same.
Dorel also experienced additional warehousing costs for a portion of 2001 due to the overlap associated with the closure of
multiple warehouses acquired with Safety 1st in 2000 and the start-up of two new main distribution centers in California and
Indiana. Comparing the seven-month period in 2000 since the acquisition of Safety 1st in June of that year to the seven-month
period ending December 2001, distribution costs as a whole were higher by over 50%. The new warehouses are fully operational
and any residual costs related to the closed warehouses should not materially impact margins in the current year.
Operating costs in 2001 increased over 2000 due to the acquisition of Quint and the inclusion of Safety 1st for 12 months in
2001 versus seven months in 2000. More significantly, as a percentage of sales, costs dropped by a full percentage point to
12.5%. A further drop in operating expenses would have been possible had the Company not experienced higher expenses
related to product liability costs ($2.8 million higher) as well as increased bad debts ($1.5 million higher) related primarily to the
bankruptcy protection filing by KMart in January 2002. Without these higher costs, operating expenses as a percentage of sales
would have dropped an additional point to 11.6% of sales.
Amortization increased over 2000 but the majority of the increase was due to goodwill related to the Safety 1st and Quint
acquisitions. The balance of the increase was again due to Safety 1st being included in the 2001 figures for the entire year versus
seven months in 2000. Research and development expense dropped in 2001; however, spending actually increased
from $4 million in 2000 to $6.9 million in 2001. Dorel’s success in 2001 in bringing new products to market meant that more
costs were deferred and will be amortized over the next two years. This extra spending is indicative of the emphasis on new
product development in both Europe and North America.
All of the above factors translated into an increase of almost 7% in earnings from operations in the Juvenile Segment in 2001.
In 2002, the Juvenile Segment is expected to show marked improvement on a year-over-year basis. The Company’s guidance
calls for sales to reach between $525 and $575 million and earnings from operations to range between 7.5% and 8.5% of sales.
This improvement is expected to come from continued sales growth, higher margins and lower operating costs as the integration
of Safety 1st and Quint continues.
Ready-to-Assemble
The RTA Segment posted increased profitability in 2001 compared to 2000 despite flat sales. Margins were up and costs were
down, resulting in a 9% increase in earnings from operations. This performance was achieved even as Kmart, a large RTA
customer, drastically reduced purchases in the last quarter of the year. Subsequent to year-end, Kmart filed for Chapter 11
protection but in February 2002, began purchasing again at close to prior years levels.
This impressive performance came from several key areas. Firstly, margins increased by 7/10ths of a percentage point. Raw
material costs continued to hover at all-time low levels. Particle board costs, which make up substantially all of the raw material
of RTA products, began to drop in 2000 and stayed low throughout 2001. Efficiencies were also up over 2000 due to a
philosophy of continual improvement at the RTA plants. The integration of the Ridgewood factory in Cornwall, Ontario into the
Ameriwood division in the United States allowed for improved production scheduling, lower distribution costs and better
purchasing practices.
Operating costs also benefited from the Ridgewood integration. Practically all of the duplicate sales and administration tasks
were eliminated in 2000 and the bulk of these benefits were seen in 2001. Amortization dropped in 2001 due to very low capital
spending in 2001 and 2000. In fact, over this two-year period, capital spending was only $4.5 million, less than 1% of sales.
In 2002, the RTA Segment is expected to achieve sales of between $270 and $285 million and earnings from operations of
between 16.5% and 17.5% of sales. These expectations take into account a lower contribution from Kmart, anticipated increases
from other customers and additional sales from new product lines such as bookcases. Margins should remain flat as selling prices
to customers and board prices are expected to remain in the same range as 2001.
Home Furnishings
The Home Furnishings Segment showed improvement over 2000 in both sales and operating profit. Dorel Home Products,
the Company’s Montreal-based manufacturer of futons, went through a complete restructuring under the guidance of the RTA
group based in the United States. The manufacturing of certain futon components was transferred from Montreal to Asia, staffing
[ DOREL Annua l Repor t 2001 p.26 ]
levels were reduced, administrative functions in Montreal were integrated into the Ameriwood operations in the US, smaller
unprofitable accounts were dropped, and sales efforts were concentrated on large retail customers with existing channels
of supply from Dorel. As a result of these efforts, Dorel Home Products is now well positioned for profitability as margins have
improved, sales demand remains strong and new large accounts are being added.
Sales at Cosco Home and Office, Dorel’s Home Furnishings operations in the US, increased in 2001; however, profitability was
lower than expected. Ladders were introduced during the year, but there was a shift in the product mix between step stools and
folding furniture that had the effect of lowering margins. The position of President of Cosco Home and Office was created during
the year to further maximize the potential of this business segment.
Dorel Asia continued to grow as an important part of the business. The ability of Dorel to source product from Asia for several
large customers has proven to be very successful. As retailers look more and more to Asia for furniture and related products,
this part of Dorel’s business will continue to grow.
As a result of the above, Home Furnishings Segment sales were up almost 19% in 2001 and earnings doubled. There is still
room for improvement and Dorel has issued guidance for sales of between $165 and $175 million and earnings from operations
of 4% to 5% of sales. Sales growth and improved profitability is expected in all three divisions of this segment with larger
contributions expected from Dorel Home Products and Dorel Asia.
Other Expenses
Interest in the year was up over 2000 due mainly to the debt associated with the Safety 1st acquisition in June of 2000 being
carried for the whole year as opposed to only seven months in the prior year. However, interest expense in the second half of
the year actually decreased from $11.8 million in 2000 to $8.4 million in 2001, a decrease of almost 30%. This decrease was a
function of lower loan balances and lower interest rates as a large portion of Dorel’s debt is at variable rates.
Corporate expenses and income taxes remained relatively flat versus the prior year. The income tax rate dropped slightly in
2001 versus 2000 from 13.5% to 12.0%. This decrease in the effective tax rate is attributable to the proportionate change in
pre-tax profits in the different tax jurisdictions in which Dorel operates.
LIQUIDITY AND CAPITAL RESOURCES
Cash Flow
During 2001, cash flow from operations plus the net change in cash was $59.1 million as compared to $49.9 million in 2000.
This represented an increase of $9.2 million or 18%. Traditionally, cash flow is strongest in the second half of the year and this
was the case again in 2001. In the fourth quarter of 2001 alone, free cash flow was over $64 million. In addition, the number of
days in receivables dropped from 56 in 2000 to 44 in 2001, though that figure is expected to rise in 2002 to around 50 days.
Inventory turns improved from 4.4 to 4.9 and it is the Company’s goal to increase that figure to 6 by the end of 2002.
On June 22, 2001, Dorel entered into an agreement with a third party to sell $30 million of eligible accounts receivable at a
discount. Under this agreement, the Company acts as the servicer of the receivable and is permitted to sell, on a revolving basis,
additional eligible accounts receivable to the extent amounts are collected on previously sold receivables. As of December 30,
2001, $29.2 million of accounts receivable were sold under this agreement and this amount is excluded from the balance at
December 30, 2001. The Company also recorded a retained interest in the sold receivables representing the estimated fair value
retained at the date of sale. At December 30, 2001, the retained interest totalled $2.25 million.
The Company reinvested $23.7 million in various capital projects, principally capital assets and deferred research and
development costs. This compares to $22.6 million in 2000. As disclosed in Note 3, on April 27, 2001 the Company acquired
Quint B.V. and Interservice Alpha, located in the Netherlands. The total cost was $9.2 million. Net of cash acquired, the cost was
$8.6 million, financed entirely by long-term debt. Finally, discontinued operations consumed $3.7 million in 2001 versus
$10.6 million in 2000. Excess cash in the amount of $37 million was used to reduce outstanding bank borrowings. This compares
with $15.2 million in 2000.
Balance Sheet
The Company’s balance sheet strengthened in 2001 as evidenced by a drop in borrowings of $26 million and the increase
in cash of $12 million. The debt to assets ratio dropped from 0.44 in 2000 to 0.38 at the end of 2001. The bulk of the Company’s
[ DOREL Annua l Repor t 2001 p.27 ]
debt stems from the Safety 1st acquisition in 2000. Total debt as at June 30, 2000, soon after the acquisition, stood at
$285 million. At December 2000, this figure was reduced to $262 million and by the end of 2001, this figure had dropped
further to $236 million. Note that the figure at the end of 2001 also included the funding of the $9.2 million Quint acquisition
in April of that year.
Working capital at the end of 2001 was $183.1 million compared to $189.7 million in 2000. Equity increased to $212 million
from $190 million. As detailed in the notes to the financial statements, Dorel has the availability on its various borrowing facilities
to provide for continued operational growth. The Company is compliant with all covenants connected with these borrowings.
Exchange rates had a negative impact on the balance sheet as the Cumulative Translation Adjustment (CTA) account, which
is used to reflect the change in the net book value of Dorel’s foreign currency subsidiaries, worsened from $0.4 million to
$4.3 million. This originates from both the Canadian operations and the Dutch company, but the majority of the change is due
to the weakening of the Canadian dollar against the US dollar, which is the Company’s reporting currency. It should be noted
that the Company’s subsidiaries are considered as self-sustaining, as such any fluctuations in their value due to foreign exchange
are reflected in the CTA account as opposed the income statement.
RISKS
Product Liability
As with all manufacturers of products designed for use by consumers, Dorel is subject to numerous product liability claims,
particularly in the United States. At Dorel, there is an ongoing effort to improve quality control and to ensure the safety of its
products. In this regard, Cosco is the only North American manufacturer of juvenile products with its own in-house sled test for
children’s car restraints.
As detailed in the Juvenile results section, Dorel has made a strategic decision to become less reliant on traditional insurance
by increasing its self-insurance product liability program and lessening its dependence on third-party insurers. The Company
continues to maintain traditional insurance for catastrophic losses. Although Dorel believes its product liability insurance structure
is sufficient, no assurance can be given that a judgment will not be rendered against it in an amount exceeding the amount of
insurance coverage or in respect of a claim for which Dorel is not insured.
Credit Risk
Most of Dorel’s sales are to major retail chains. In recent years, the retail environment has been highly competitive. If major
retailers cease operations, there could be a material adverse effect on the Company’s consolidated results of operations. Kmart
in the United States has filed for protection from creditors and is reorganizing its affairs under relevant bankruptcy and insolvency
legislation. The long-term outcome of this situation cannot reasonably be determined. Dorel has resumed shipping Kmart and
this could increase Dorel’s bad debt expense if Kmart were to suddenly cease operations. It should be noted that the Company
conducts ongoing credit reviews and maintains credit insurance on selected accounts to minimize these types of risks.
Concentration of Sales
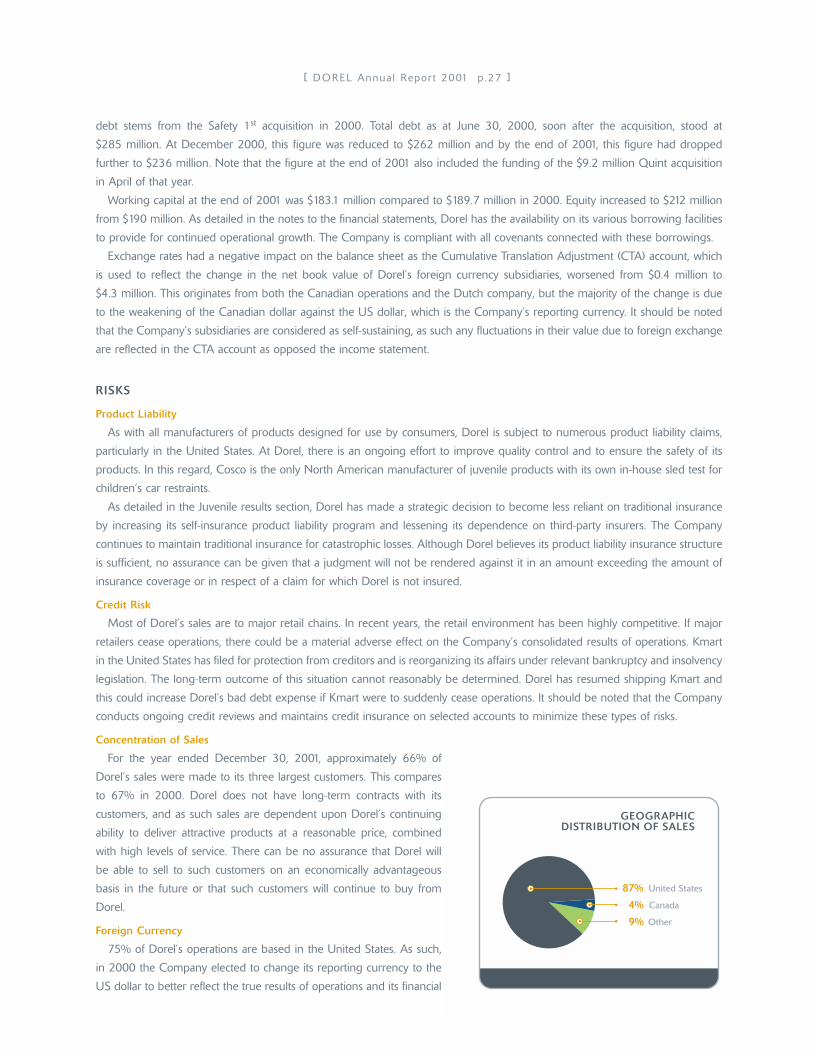
For the year ended December 30, 2001, approximately 66% of
Dorel’s sales were made to its three largest customers. This compares
to 67% in 2000. Dorel does not have long-term contracts with its
customers, and as such sales are dependent upon Dorel’s continuing
ability to deliver attractive products at a reasonable price, combined
with high levels of service. There can be no assurance that Dorel will
be able to sell to such customers on an economically advantageous
basis in the future or that such customers will continue to buy from
Dorel.
Foreign Currency
75% of Dorel’s operations are based in the United States. As such,
in 2000 the Company elected to change its reporting currency to the
US dollar to better reflect the true results of operations and its financial
87% United States
4% Canada
9% Other
GEOGRAPHICDISTRIBUTION OF SALES

[ DOREL Annua l Repor t 2001 p.28 ]
position as well as to minimize fluctuations in reported results. Dorel’s operating units outside of the United States assume the
majority of the Company’s foreign exchange risk with respect to both its purchases and sales. Dorel’s Canadian operations
benefit from a stronger US dollar as large portions of its sales are to the United States and the majority of its costs are in Canadian
dollars. Dorel’s European operations suffer from a stronger US dollar as large portions of its purchases are in US dollars while
its sales are not. Where advantageous, the Company uses futures and forward contracts to hedge against these adverse
fluctuations in currency.
Again, it should be noted that the Company’s subsidiaries are considered as self-sustaining. As such, any foreign exchange
fluctuations that occur upon the translation of their local currency financial statements are reflected in the CTA account on the
balance sheet as opposed to the consolidated income statement.
Environmental
All Dorel segments currently operate within existing environmental regulations. Dorel made nominal capital expenditures with
respect to environmental protection matters in 2001. As detailed in Note 18 to the December 30, 2001 financial statements,
Dorel assumed certain environmental liabilities and contingencies associated with the Michigan plant acquired with the purchase
of Ameriwood in 1998. A provision at December 30, 2001 of $537 thousand has been set up in connection with this liability.
Any amounts incurred in excess of the provision are not expected to have a material adverse affect on the Company.
Raw Material Costs
Dorel’s main commodities are steel, plastic resin, particleboard and paperboard. 2001 saw generally lower costs in these
commodities versus 2000. In fact 2001 levels in many cases were at very low levels. A dramatic increase in these costs could
have an adverse effect on the results going forward.
CRITICAL ACCOUNTING POLICIES AND ESTIMATES
These statements have been prepared in accordance with Canadian Generally Accepted Accounting Principles. The
preparation of these financial statements requires estimates and judgments that affect the reported amounts of assets, liabilities,
revenues and expenses, and related disclosure of contingent assets and liabilities. A complete list of all relevant account policies
is listed in Note 1 to the financial statements.
We believe the following are the most critical accounting policies that affect Dorel’s results as presented herein and that would
have the most material effect on the financial statements should these policies change or be applied in a different manner:
• The Canadian Institute of Chartered Accountants recently issued Section 1581, "Business Combinations", and Section 3062,"Goodwill and Other Intangible Assets". Effective July 1, 2001, the standards required that all business combinations beaccounted for using the purchase method. Additionally, effective January 1, 2002, goodwill and intangible assets with anindefinite life are no longer amortized to income and are assessed for impairment on an annual basis in accordance with thenew standards, including a transitional impairment test whereby any resulting impairment is charged to opening retainedearnings. The Company adopted these sections effective January 1, 2002 and is currently evaluating the impact of the newstandards, including the transitional impairment test. The effect on the Company’s future consolidated net income and financialposition has not yet been determined.
• The financial statements of the Company’s self-sustaining operations whose functional currency is other than the US dollar are translated from such functional currency to the US dollar using the current rate method. Assets and liabilities are translatedat the rates in effect at the balance sheet date. Income and expenses are translated at average rates of exchange for the year.Resulting unrealized gains or losses are accumulated as a separate component of shareholders’ equity.
• On June 22, 2001, the Company entered into an agreement with a third party to sell $30 million of eligible accounts receivableat a discount. Under this agreement, the Company acts as the servicer of the receivable and is permitted to sell, on a revolvingbasis, additional eligible accounts receivable to the extent amounts are collected on previously sold receivables. As ofDecember 30, 2001, the Company sold $29.2 million of accounts receivable under this agreement and excluded this amountfrom the balance at December 30, 2001. The Company also recorded a retained interest in the sold receivables representingthe estimated fair value retained at the date of sale. At December 30, 2001, the retained interest totalled $2.25 million. The retained interest recorded upon the sale of accounts receivable is calculated based on the estimated fair value at the dateof sale. To obtain fair values, Management uses its best estimate of the future expected cash flows based on historicaldeductions for returns and allowances. Gains or losses on the sale of accounts receivable are recorded to the extent actualcollections differ from the estimated fair value at the date of sale.
[ DOREL I N DUSTR I ES I NC. Annua l Repor t 2001 p.29 ]
management’s reportDorel Industries Inc.’s Annual Report for the year ended December 30, 2001, and the financial statements included
herein, were prepared by the Corporation’s Management and approved by the Board of Directors. The Audit
Committee of the Board is responsible for reviewing the financial statements in detail and for ensuring that the
Corporation’s internal control systems, management policies and accounting practices are adhered to.
The financial statements contained in this Annual Report have been prepared in accordance with the accounting
policies which are enunciated in said report and which Management believes to be appropriate for the activities of the
Corporation. The external auditors appointed by the Corporation’s shareholders, Goldsmith Miller Hersh, have audited
these financial statements and their report appears below. All information given in this Annual Report is consistent with
the financial statements included herein.
MARTIN SCHWARTZ JEFFREY SCHWARTZ
President and Chief Executive Officer Vice-President, Finance
auditors’ reportTO THE SHAREHOLDERS OF DOREL INDUSTRIES INC.
We have audited the consolidated balance sheets of DOREL INDUSTRIES INC. as at December 30, 2001 and
2000 and the consolidated statements of income, retained earnings and cash flows for each of the years in the three-
year period ended December 30, 2001. These financial statements are the responsibility of the Company's
management. Our responsibility is to express an opinion on these financial statements based on our audit.
We conducted our audit in accordance with Canadian generally accepted auditing standards. Those standards
require that we plan and perform an audit to obtain reasonable assurance whether the financial statements are free
of material misstatement. An audit includes examining, on a test basis, evidence supporting the amounts and
disclosures in the financial statements. An audit also includes assessing the accounting principles used and significant
estimates made by management, as well as evaluating the overall financial statement presentation.
In our opinion, these consolidated financial statements present fairly, in all material respects, the financial position
of the Company as at December 30, 2001 and 2000 and the results of its operations and its cash flows for each of
the years in the three-year period ended December 30, 2001, in accordance with Canadian generally accepted
accounting principles.
CHARTERED ACCOUNTANTS
Montreal, Quebec
February 14, 2002
(signed) (signed)
(signed)
[ DOREL I N DUSTR I ES I NC. Annua l Repor t 2001 p.30 ]
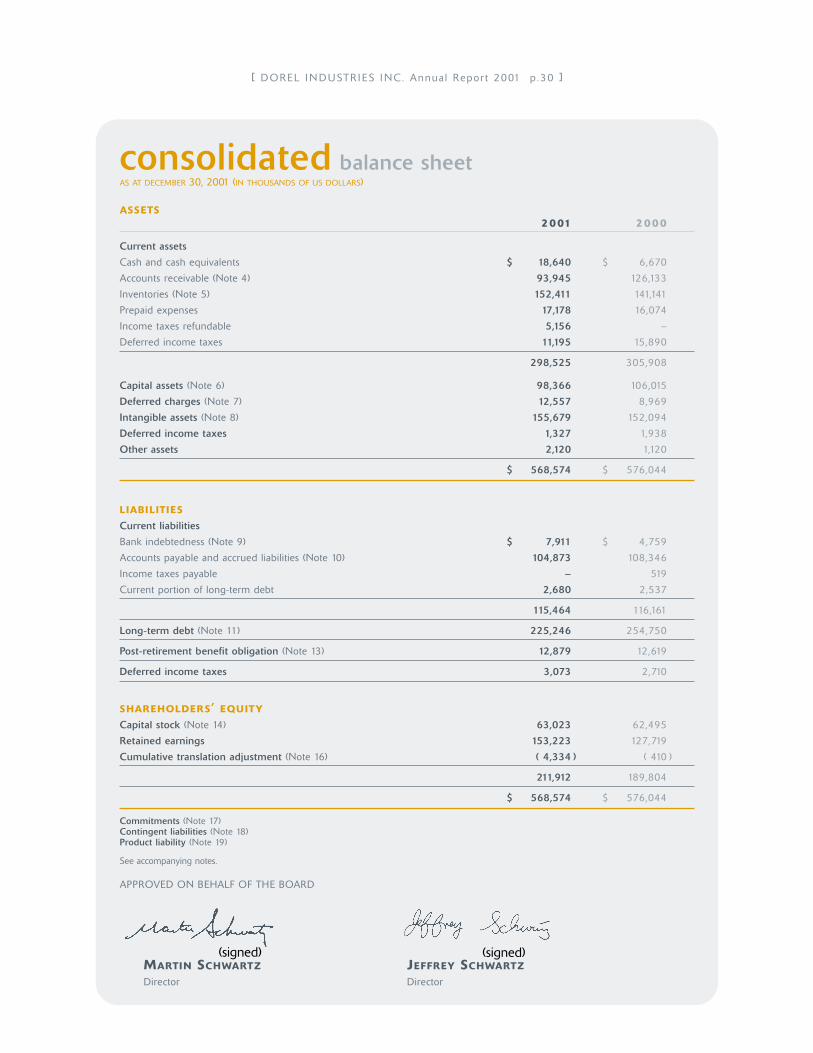
consolidated balance sheetAS AT DECEMBER 30, 2001 (IN THOUSANDS OF US DOLLARS)
ASSETS2001 2000
Current assets
Cash and cash equivalents $ 18,640 $ 6,670
Accounts receivable (Note 4) 93,945 126,133
Inventories (Note 5) 152,411 141,141
Prepaid expenses 17,178 16,074
Income taxes refundable 5,156 –
Deferred income taxes 11,195 15,890
298,525 305,908
Capital assets (Note 6) 98,366 106,015
Deferred charges (Note 7) 12,557 8,969
Intangible assets (Note 8) 155,679 152,094
Deferred income taxes 1,327 1,938
Other assets 2,120 1,120
$ 568,574 $ 576,044
LIABILITIES
Current liabilities
Bank indebtedness (Note 9) $ 7,911 $ 4,759
Accounts payable and accrued liabilities (Note 10) 104,873 108,346
Income taxes payable – 519
Current portion of long-term debt 2,680 2,537
115,464 116,161
Long-term debt (Note 11) 225,246 254,750
Post-retirement benefit obligation (Note 13) 12,879 12,619
Deferred income taxes 3,073 2,710
SHAREHOLDERS’ EQUITY
Capital stock (Note 14) 63,023 62,495
Retained earnings 153,223 127,719
Cumulative translation adjustment (Note 16) ( 4,334 ) ( 410 )
211,912 189,804
$ 568,574 $ 576,044
Commitments (Note 17)Contingent liabilities (Note 18)Product liability (Note 19)
See accompanying notes.
APPROVED ON BEHALF OF THE BOARD
MARTIN SCHWARTZ JEFFREY SCHWARTZ
Director Director
(signed) (signed)
[ DOREL I N DUSTR I ES I NC. Annua l Repor t 2001 p.31 ]
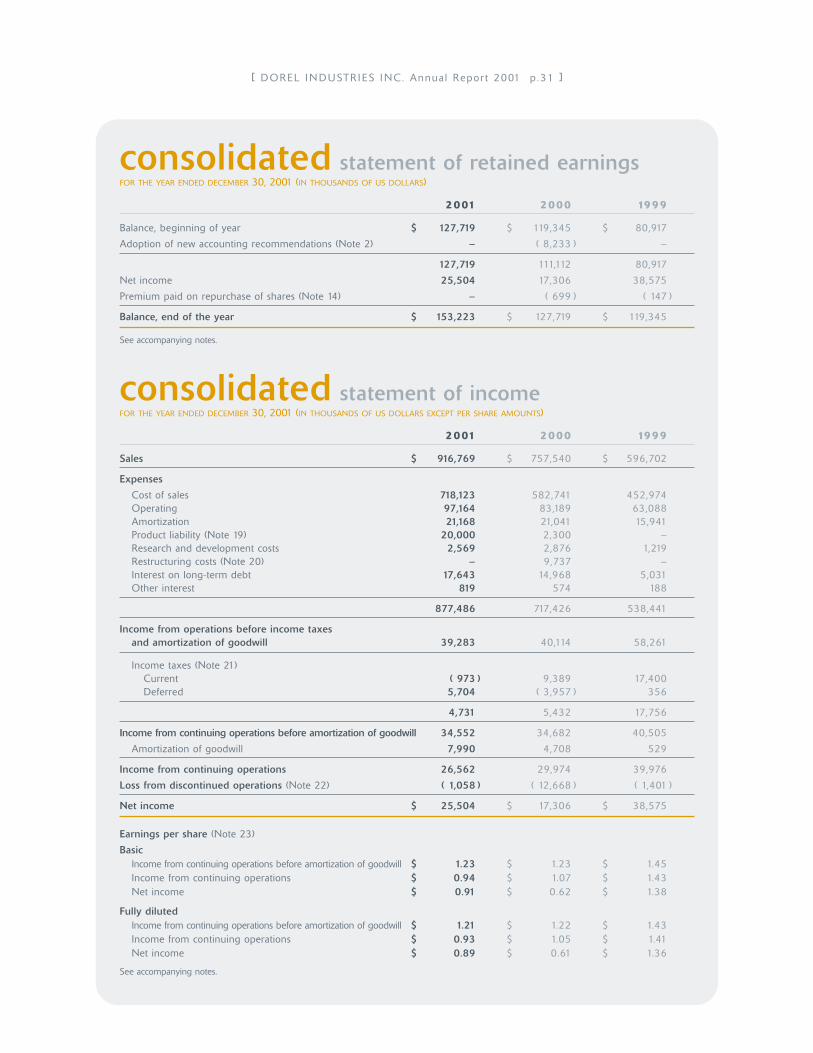
consolidated statement of retained earningsFOR THE YEAR ENDED DECEMBER 30, 2001 (IN THOUSANDS OF US DOLLARS)
2001 2000 1999
Balance, beginning of year $ 127,719 $ 119,345 $ 80,917
Adoption of new accounting recommendations (Note 2) – ( 8,233 ) –
127,719 111,112 80,917
Net income 25,504 17,306 38,575
Premium paid on repurchase of shares (Note 14) – ( 699 ) ( 147 )
Balance, end of the year $ 153,223 $ 127,719 $ 119,345
See accompanying notes.
consolidated statement of incomeFOR THE YEAR ENDED DECEMBER 30, 2001 (IN THOUSANDS OF US DOLLARS EXCEPT PER SHARE AMOUNTS)
2001 2000 1999
Sales $ 916,769 $ 757,540 $ 596,702
Expenses
Cost of sales 718,123 582,741 452,974Operating 97,164 83,189 63,088Amortization 21,168 21,041 15,941Product liability (Note 19) 20,000 2,300 –Research and development costs 2,569 2,876 1,219Restructuring costs (Note 20) – 9,737 –Interest on long-term debt 17,643 14,968 5,031Other interest 819 574 188
877,486 717,426 538,441
Income from operations before income taxes and amortization of goodwill 39,283 40,114 58,261
Income taxes (Note 21)Current ( 973 ) 9,389 17,400Deferred 5,704 ( 3,957 ) 356
4,731 5,432 17,756
Income from continuing operations before amortization of goodwill 34,552 34,682 40,505
Amortization of goodwill 7,990 4,708 529
Income from continuing operations 26,562 29,974 39,976
Loss from discontinued operations (Note 22) ( 1,058 ) ( 12,668 ) ( 1,401 )
Net income $ 25,504 $ 17,306 $ 38,575
Earnings per share (Note 23)
BasicIncome from continuing operations before amortization of goodwill $ 1.23 $ 1.23 $ 1.45Income from continuing operations $ 0.94 $ 1.07 $ 1.43Net income $ 0.91 $ 0.62 $ 1.38
Fully dilutedIncome from continuing operations before amortization of goodwill $ 1.21 $ 1.22 $ 1.43Income from continuing operations $ 0.93 $ 1.05 $ 1.41Net income $ 0.89 $ 0.61 $ 1.36
See accompanying notes.
[ DOREL I N DUSTR I ES I NC. Annua l Repor t 2001 p.32 ]
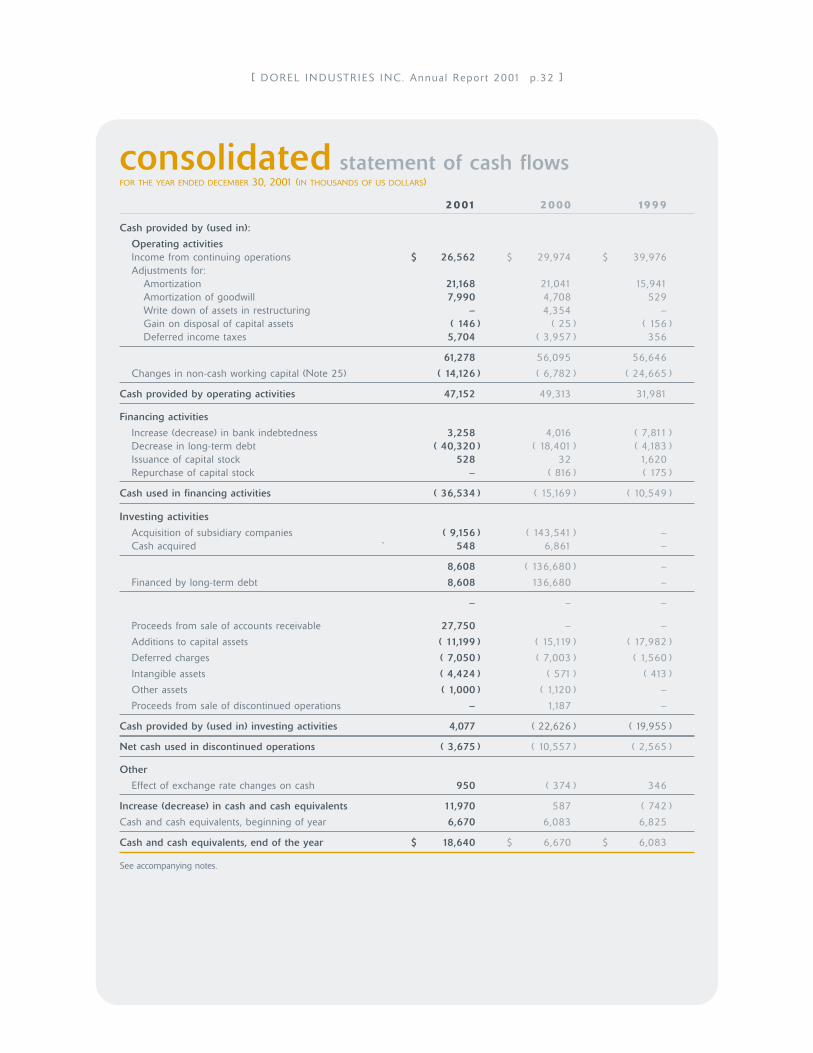
consolidated statement of cash flowsFOR THE YEAR ENDED DECEMBER 30, 2001 (IN THOUSANDS OF US DOLLARS)
2001 2000 1999
Cash provided by (used in):
Operating activitiesIncome from continuing operations $ 26,562 $ 29,974 $ 39,976Adjustments for:
Amortization 21,168 21,041 15,941Amortization of goodwill 7,990 4,708 529Write down of assets in restructuring – 4,354 – Gain on disposal of capital assets ( 146 ) ( 25 ) ( 156 )Deferred income taxes 5,704 ( 3,957 ) 356
61,278 56,095 56,646
Changes in non-cash working capital (Note 25) ( 14,126 ) ( 6,782 ) ( 24,665 )
Cash provided by operating activities 47,152 49,313 31,981
Financing activities
Increase (decrease) in bank indebtedness 3,258 4,016 ( 7,811 )Decrease in long-term debt ( 40,320 ) ( 18,401 ) ( 4,183 )Issuance of capital stock 528 32 1,620Repurchase of capital stock – ( 816 ) ( 175 )
Cash used in financing activities ( 36,534 ) ( 15,169 ) ( 10,549 )
Investing activities
Acquisition of subsidiary companies ( 9,156 ) ( 143,541 ) –Cash acquired ` 548 6,861 –
8,608 ( 136,680 ) –
Financed by long-term debt 8,608 136,680 –
– – –
Proceeds from sale of accounts receivable 27,750 – –
Additions to capital assets ( 11,199 ) ( 15,119 ) ( 17,982 )
Deferred charges ( 7,050 ) ( 7,003 ) ( 1,560 )
Intangible assets ( 4,424 ) ( 571 ) ( 413 )
Other assets ( 1,000 ) ( 1,120 ) –
Proceeds from sale of discontinued operations – 1,187 –
Cash provided by (used in) investing activities 4,077 ( 22,626 ) ( 19,955 )
Net cash used in discontinued operations ( 3,675 ) ( 10,557 ) ( 2,565 )
Other
Effect of exchange rate changes on cash 950 ( 374 ) 346
Increase (decrease) in cash and cash equivalents 11,970 587 ( 742 )
Cash and cash equivalents, beginning of year 6,670 6,083 6,825
Cash and cash equivalents, end of the year $ 18,640 $ 6,670 $ 6,083
See accompanying notes.
[ DOREL I N DUSTR I ES I NC. Annua l Repor t 2001 p.33 ]
notes to consolidated financial statementsAS AT DECEMBER 30, 2001 (IN THOUSANDS OF US DOLLARS, EXCEPT PER SHARE AMOUNTS)
NOTE 1 Nature of Operations
Dorel Industries Inc. is a consumer products manufacturer and importer of juvenile products and home furnishings. The Company’sprincipal business segments consist of ready-to-assemble (RTA) furniture, juvenile furniture and accessories, and home furnishings. Theprincipal markets for the Company’s products are Canada, United States and Europe.
NOTE 2 Accounting Policies
Basis of Presentation
The financial statements have been prepared in accordance with Canadian Generally Accepted Accounting Principles (GAAP) using theUS dollar as the reporting currency.
The Company has historically presented its financial statements in Canadian dollars. Effective January 1, 2000, the US dollar has beenadopted as the Company’s reporting currency. The comparative financial information presented here has been restated using thetranslation of convenience method. For periods up to and including December 30, 1999, the Canadian dollar financial statements of theCompany have been restated in US dollars using the December 30, 1999 closing exchange rate.
With respect to the financial statements of the Company and its subsidiaries, the material differences between Canadian and United StatesGAAP are described and reconciled in Note 27.
Basis of Consolidation
The consolidated financial statements include the accounts of the Company and its wholly-owned subsidiaries from the date of theiracquisition. All significant intercompany accounts and transactions have been eliminated.
Use of Estimates
The preparation of financial statements in conformity with generally accepted accounting principles requires Management to makeestimates and assumptions that affect the reported amounts of assets and liabilities and disclosure of contingent assets and liabilities atthe date of the financial statements and revenue and expenses during the period reported. Actual results could differ from thoseestimates.
Cash and Cash Equivalents
All highly liquid investments with original maturities of three months or less are considered to be cash equivalents.
Accounts Receivable
The retained interest recorded upon the sale of accounts receivable is calculated based on the estimated fair value at the date of sale. Toobtain fair values, management uses its best estimate of the future expected cash flows based on historical deductions for returns andallowances. Gains or losses on the sale of accounts receivable are recorded to the extent actual collections differ from the estimated fairvalue at the date of sale.
Inventories
Raw material inventories are valued at the lower of cost and replacement cost. Finished goods inventories are valued at the lower of costand net realizable value. Cost is determined on a first-in; first-out basis, and on a last-in; first-out basis for one of the Company’ssubsidiaries.
Amortization
Capital assets are amortized as follows:
Method Rate
Buildings and improvements Straight-line 40 years
Machinery and equipment Declining balance 15 %
Moulds Straight-line 5 years
Furniture and fixtures Declining balance 20 %
Vehicles Declining balance 30 %
Computer equipment Declining balance 30 %
Leasehold improvements Straight-line 5 years
[ DOREL I N DUSTR I ES I NC. Annua l Repor t 2001 p.34 ]
NOTE 2 Accounting Policies (cont’d)
Deferred Charges
Deferred charges are carried at cost less accumulated amortization.
Research and Development Costs:
The Company incurred costs on activities which relate to research and development of new products. Research costs are expensed asthey are incurred. Development costs are also expensed unless they meet specific criteria related to technical, market and financialfeasibility. Certain of the Company's juvenile and houseware product development costs in the amount of $6,921 (2000 - $4,027,1999 - $1,501) were deferred and are being amortized to operations on a straight-line basis over a period of two years.
Financing Costs:The Company incurred certain costs related to the issue of long-term debt. These amounts are amortized to operations on a straight-line basis over the terms of the related long-term debt.
Intangible Assets
Goodwill:
Goodwill represents the excess of the purchase price over the fair values assigned to identifiable net assets acquired of subsidiarycompanies. The amortization expense is computed by the straight-line method over periods not to exceed 40 years.
Patents:
Patents are amortized by the straight-line method over their expected useful lives.
Impairment of Long-Lived Assets
The Company evaluates the carrying value of its long-lived assets including goodwill, for potential impairment on an ongoing basis. The Company considers projected future operating results, trends and other circumstances in making such evaluations. Impaired assetsare written down to estimated fair value, being determined based on discounted expected future cash flows. No impairment chargeshave been recorded based on Management’s review.
Foreign Currency Translation
The financial statements of the Company’s self-sustaining operations whose functional currency is other than the US dollar are translatedfrom such functional currency to the US dollar using the current rate method. Assets and liabilities are translated at the rates in effect at the balance sheet date. Income and expenses are translated at average rates of exchange for the year. Resulting unrealized gains or losses are accumulated as a separate component of shareholders’ equity.
Monetary assets and liabilities of the Company’s operations, which are denominated in currencies other than the functional currency, are translated into the functional currency at the exchange rates prevailing at the balance sheet date. Non-monetary assets and liabilitiesare translated at historical exchange rates. Income and expenses are translated at the average exchange rates for the year, except for amortization which is translated on the same basis as the related assets. Translation gains and losses are reflected in net income.
Derivative Financial Instruments
The Company uses a number of derivative financial instruments, mainly foreign exchange contracts and interest-rate swap agreementsto reduce its exposure to fluctuation in interest rates and foreign exchange rates. Derivatives are used as part of the Company’s riskmanagement strategy and are measured for effectiveness on an ongoing basis. The Company does not use derivative financialinstruments for trading purposes.
The foreign currency gains and losses on these contracts are not recognized in the consolidated financial statements until the underlyingtransaction is recorded in net income. Payments and receipts under interest-rate swap agreements are recognized as adjustments tointerest expense.
Pension Plans
The Company's subsidiaries maintain defined benefit plans and defined contribution plans for their employees. Pension benefitobligations under the defined benefit plans are determined annually by independent actuaries using Management's assumptions andthe accrued benefit method. The plans provide benefits based on a defined benefit amount and length of service.
Pension expense consists of the following:
• the cost of pension benefits provided in exchange for employees' services rendered in the period;
• interest on the actuarial present value of accrued pension benefits less earnings on pension fund assets;
• amounts which represent the amortization of the unrecognized net pension assets that arose when accounting policies were firstapplied and subsequent gains or losses arising from changes in actuarial assumptions, and experience gains or losses related to returnon assets on the straight-line basis, over the expected average remaining service life of the employee group.
Post-Retirement Benefits Other Than Pensions
Post-retirement benefits other than pensions, include health care and life insurance benefits for retired employees. The costs of providingthese benefits are accrued over the working lives of employees in a manner similar to pension costs.
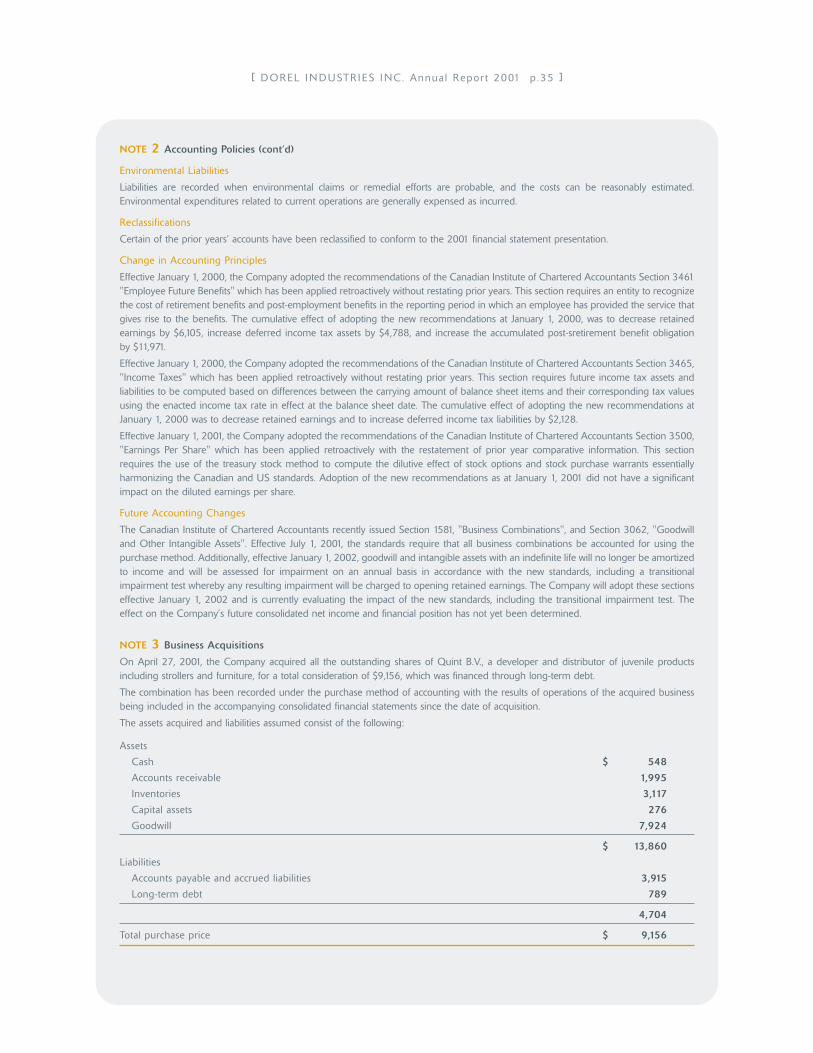
[ DOREL I N DUSTR I ES I NC. Annua l Repor t 2001 p.35 ]
NOTE 2 Accounting Policies (cont’d)
Environmental Liabilities
Liabilities are recorded when environmental claims or remedial efforts are probable, and the costs can be reasonably estimated.Environmental expenditures related to current operations are generally expensed as incurred.
Reclassifications
Certain of the prior years’ accounts have been reclassified to conform to the 2001 financial statement presentation.
Change in Accounting Principles
Effective January 1, 2000, the Company adopted the recommendations of the Canadian Institute of Chartered Accountants Section 3461"Employee Future Benefits" which has been applied retroactively without restating prior years. This section requires an entity to recognizethe cost of retirement benefits and post-employment benefits in the reporting period in which an employee has provided the service thatgives rise to the benefits. The cumulative effect of adopting the new recommendations at January 1, 2000, was to decrease retainedearnings by $6,105, increase deferred income tax assets by $4,788, and increase the accumulated post-sretirement benefit obligation by $11,971.
Effective January 1, 2000, the Company adopted the recommendations of the Canadian Institute of Chartered Accountants Section 3465,"Income Taxes" which has been applied retroactively without restating prior years. This section requires future income tax assets andliabilities to be computed based on differences between the carrying amount of balance sheet items and their corresponding tax valuesusing the enacted income tax rate in effect at the balance sheet date. The cumulative effect of adopting the new recommendations atJanuary 1, 2000 was to decrease retained earnings and to increase deferred income tax liabilities by $2,128.
Effective January 1, 2001, the Company adopted the recommendations of the Canadian Institute of Chartered Accountants Section 3500,"Earnings Per Share" which has been applied retroactively with the restatement of prior year comparative information. This sectionrequires the use of the treasury stock method to compute the dilutive effect of stock options and stock purchase warrants essentiallyharmonizing the Canadian and US standards. Adoption of the new recommendations as at January 1, 2001 did not have a significantimpact on the diluted earnings per share.
Future Accounting Changes
The Canadian Institute of Chartered Accountants recently issued Section 1581, "Business Combinations", and Section 3062, "Goodwilland Other Intangible Assets". Effective July 1, 2001, the standards require that all business combinations be accounted for using thepurchase method. Additionally, effective January 1, 2002, goodwill and intangible assets with an indefinite life will no longer be amortizedto income and will be assessed for impairment on an annual basis in accordance with the new standards, including a transitionalimpairment test whereby any resulting impairment will be charged to opening retained earnings. The Company will adopt these sectionseffective January 1, 2002 and is currently evaluating the impact of the new standards, including the transitional impairment test. Theeffect on the Company’s future consolidated net income and financial position has not yet been determined.
NOTE 3 Business Acquisitions
On April 27, 2001, the Company acquired all the outstanding shares of Quint B.V., a developer and distributor of juvenile productsincluding strollers and furniture, for a total consideration of $9,156, which was financed through long-term debt.
The combination has been recorded under the purchase method of accounting with the results of operations of the acquired businessbeing included in the accompanying consolidated financial statements since the date of acquisition.
The assets acquired and liabilities assumed consist of the following:
Assets
Cash $ 548
Accounts receivable 1,995
Inventories 3,117
Capital assets 276
Goodwill 7,924
$ 13,860
Liabilities
Accounts payable and accrued liabilities 3,915
Long-term debt 789
4,704
Total purchase price $ 9,156
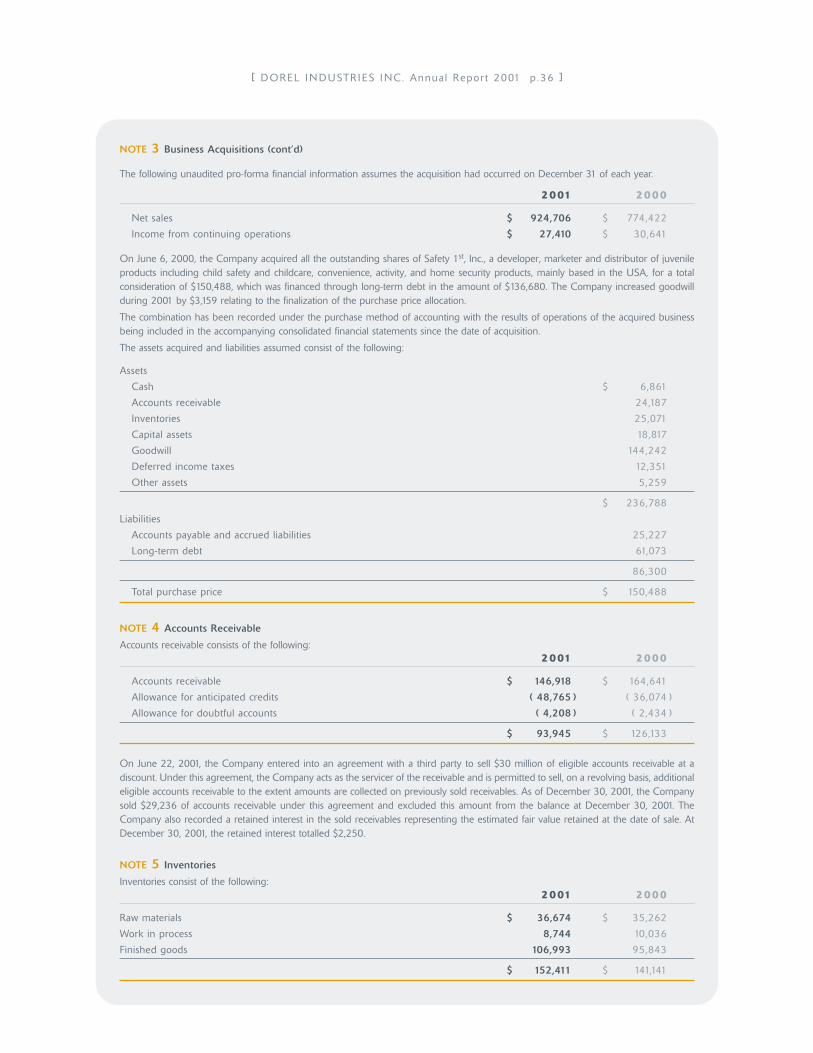
[ DOREL I N DUSTR I ES I NC. Annua l Repor t 2001 p.36 ]
NOTE 3 Business Acquisitions (cont’d)
The following unaudited pro-forma financial information assumes the acquisition had occurred on December 31 of each year.
2001 2000
Net sales $ 924,706 $ 774,422
Income from continuing operations $ 27,410 $ 30,641
On June 6, 2000, the Company acquired all the outstanding shares of Safety 1st, Inc., a developer, marketer and distributor of juvenileproducts including child safety and childcare, convenience, activity, and home security products, mainly based in the USA, for a totalconsideration of $150,488, which was financed through long-term debt in the amount of $136,680. The Company increased goodwillduring 2001 by $3,159 relating to the finalization of the purchase price allocation.
The combination has been recorded under the purchase method of accounting with the results of operations of the acquired businessbeing included in the accompanying consolidated financial statements since the date of acquisition.
The assets acquired and liabilities assumed consist of the following:
Assets
Cash $ 6,861
Accounts receivable 24,187
Inventories 25,071
Capital assets 18,817
Goodwill 144,242
Deferred income taxes 12,351
Other assets 5,259
$ 236,788
Liabilities
Accounts payable and accrued liabilities 25,227
Long-term debt 61,073
86,300
Total purchase price $ 150,488
NOTE 4 Accounts Receivable
Accounts receivable consists of the following:2001 2000
Accounts receivable $ 146,918 $ 164,641
Allowance for anticipated credits ( 48,765 ) ( 36,074 )
Allowance for doubtful accounts ( 4,208 ) ( 2,434 )
$ 93,945 $ 126,133
On June 22, 2001, the Company entered into an agreement with a third party to sell $30 million of eligible accounts receivable at adiscount. Under this agreement, the Company acts as the servicer of the receivable and is permitted to sell, on a revolving basis, additionaleligible accounts receivable to the extent amounts are collected on previously sold receivables. As of December 30, 2001, the Companysold $29,236 of accounts receivable under this agreement and excluded this amount from the balance at December 30, 2001. TheCompany also recorded a retained interest in the sold receivables representing the estimated fair value retained at the date of sale. AtDecember 30, 2001, the retained interest totalled $2,250.
NOTE 5 Inventories
Inventories consist of the following:2001 2000
Raw materials $ 36,674 $ 35,262
Work in process 8,744 10,036
Finished goods 106,993 95,843
$ 152,411 $ 141,141
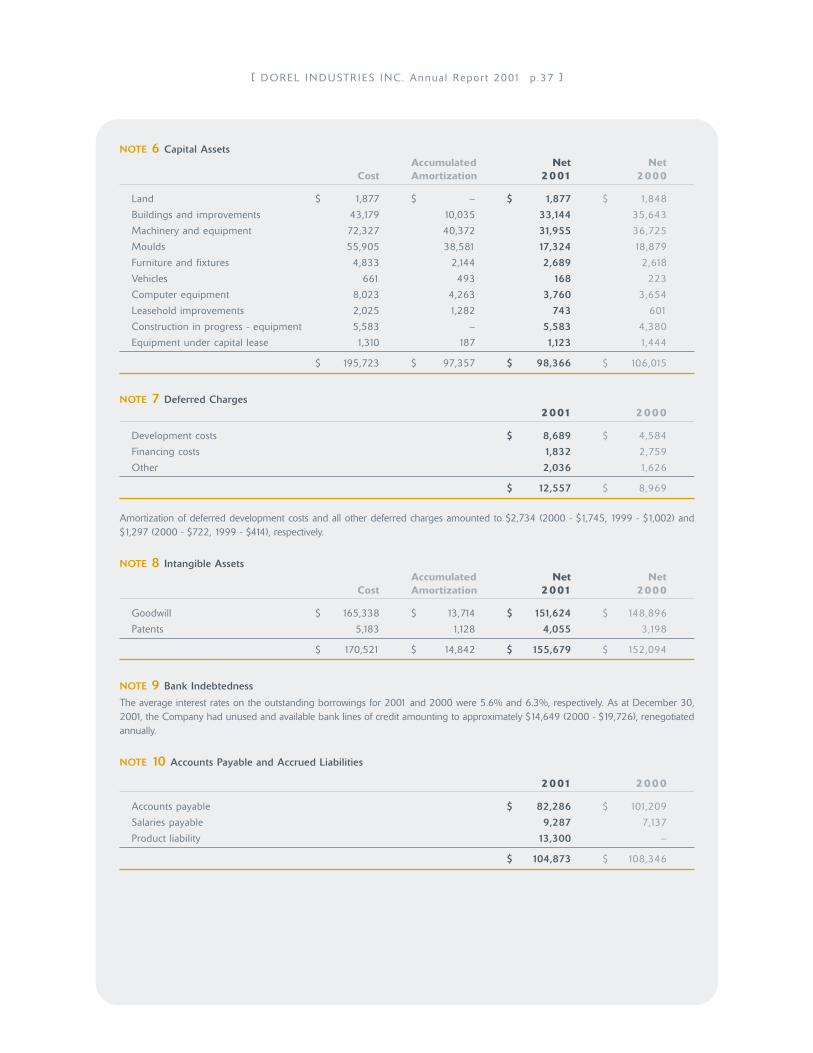
[ DOREL I N DUSTR I ES I NC. Annua l Repor t 2001 p.37 ]
NOTE 6 Capital AssetsAccumulated Net Net
Cost Amortization 2001 2000
Land $ 1,877 $ – $ 1,877 $ 1,848
Buildings and improvements 43,179 10,035 33,144 35,643
Machinery and equipment 72,327 40,372 31,955 36,725
Moulds 55,905 38,581 17,324 18,879
Furniture and fixtures 4,833 2,144 2,689 2,618
Vehicles 661 493 168 223
Computer equipment 8,023 4,263 3,760 3,654
Leasehold improvements 2,025 1,282 743 601
Construction in progress - equipment 5,583 – 5,583 4,380
Equipment under capital lease 1,310 187 1,123 1,444
$ 195,723 $ 97,357 $ 98,366 $ 106,015
NOTE 7 Deferred Charges2001 2000
Development costs $ 8,689 $ 4,584
Financing costs 1,832 2,759
Other 2,036 1,626
$ 12,557 $ 8,969
Amortization of deferred development costs and all other deferred charges amounted to $2,734 (2000 - $1,745, 1999 - $1,002) and$1,297 (2000 - $722, 1999 - $414), respectively.
NOTE 8 Intangible AssetsAccumulated Net Net
Cost Amortization 2001 2000
Goodwill $ 165,338 $ 13,714 $ 151,624 $ 148,896
Patents 5,183 1,128 4,055 3,198
$ 170,521 $ 14,842 $ 155,679 $ 152,094
NOTE 9 Bank Indebtedness
The average interest rates on the outstanding borrowings for 2001 and 2000 were 5.6% and 6.3%, respectively. As at December 30,2001, the Company had unused and available bank lines of credit amounting to approximately $14,649 (2000 - $19,726), renegotiatedannually.
NOTE 10 Accounts Payable and Accrued Liabilities
2001 2000
Accounts payable $ 82,286 $ 101,209
Salaries payable 9,287 7,137
Product liability 13,300 –
$ 104,873 $ 108,346

[ DOREL I N DUSTR I ES I NC. Annua l Repor t 2001 p.38 ]
NOTE 11 Long-Term Debt2001 2000
Revolving Bank Loans
Bearing interest at various rates ranging between 3.85% to 8.23% (2000 - 7.81% to 10.0%) per annum, averaging 6.05% (2000 - 7.8%) based on LIBOR or US bank rates, total availability of $275,000, with principal repayments due in May 2003: $ 190,000 $ 217,500
Term Notes
Bearing interest at 7.50% per annum with principal repayments as follows:2 annual installments of $1,500 ending in April 20035 annual installments of $4,800 ending in April 2008 27,000 28,500
Bearing interest at 7.63% per annum with principal repayments as follows:2 annual installments of $500 ending in June 20035 annual installments of $1,600 ending in June 2008 9,000 9,500
Obligations under capital lease 625 817
Other 1,301 970
227,926 257,287
Current portion 2,680 2,537
$ 225,246 $ 254,750
The aggregate repayments in subsequent years of existing long-term debt will be:
Fiscal Year Ending Amount
2002 $ 2,6802003 192,0502004 6,4502005 6,4502006 6,450
$ 214,080
NOTE 12 Financial Instruments
In the normal course of business, the Company uses various financial instruments, including derivative financial instruments, for purposesother than trading. The Company uses derivative financial instruments as outlined in Note 2, to reduce exposure to fluctuations in interestrates and foreign exchange rates. The derivative financial instruments include foreign exchange contracts and interest rate swaps. Thenon-derivative financial instruments include those as outlined below. By their nature, all such instruments involve risk, including marketrisk and the credit risk of non-performance by counterparties. These financial instruments are subject to normal credit standards, financialcontrols, risk management as well as monitoring procedures.
Fair Value of Recognized Financial Instruments
Following is a table which sets out the fair values of recognized financial instruments using the valuation methods and assumptionsdescribed below:
December 30, 2001 December 30, 2000
Carrying Fair Carrying FairValue Value Value Value
Financial Assets
Cash and cash equivalents $ 18,640 $ 18,640 $ 6,670 $ 6,670
Accounts receivable 93,945 93,945 126,133 126,133
Interest rate swap 935 ( 2,969 ) 1,072 ( 666 )
Financial Liabilities
Bank indebtedness 7,911 7,911 4,759 4,759
Accounts payable and accrued liabilities 104,873 104,873 108,346 108,346
Long-term debt 227,926 223,651 257,287 255,047
The carrying amounts shown in the table above are those which are included in the balance sheet and/or notes to the financial statements.
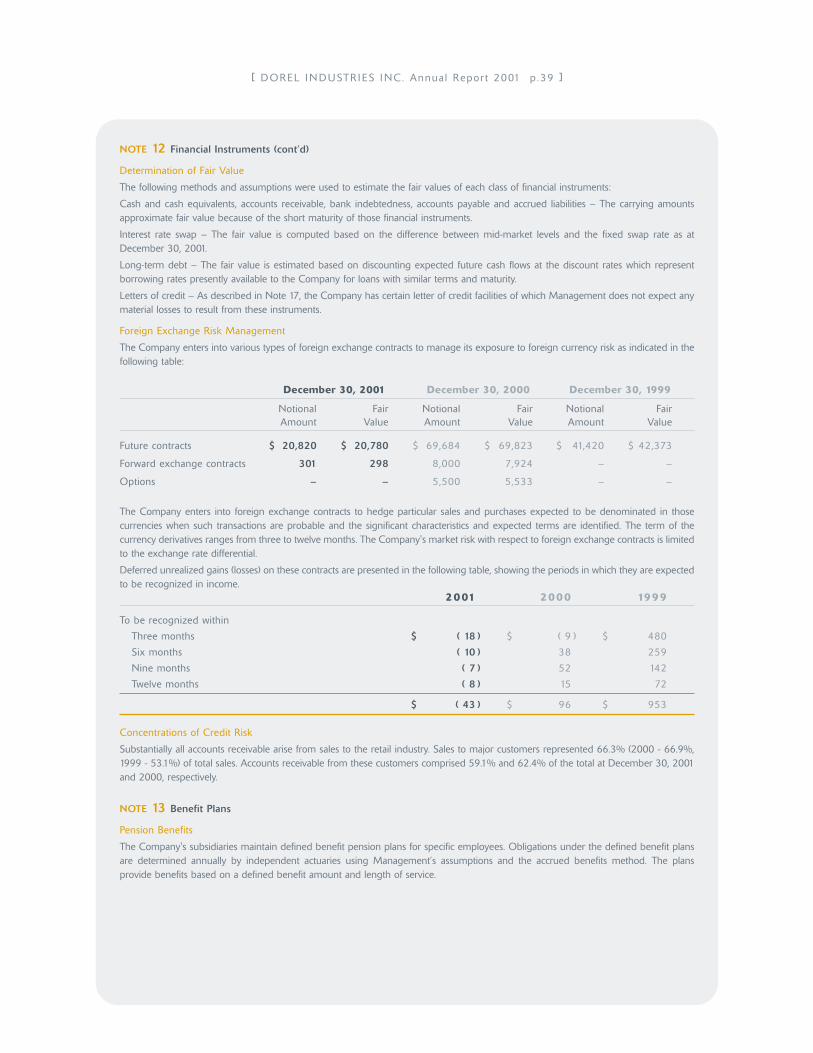
[ DOREL I N DUSTR I ES I NC. Annua l Repor t 2001 p.39 ]
NOTE 12 Financial Instruments (cont’d)
Determination of Fair Value
The following methods and assumptions were used to estimate the fair values of each class of financial instruments:
Cash and cash equivalents, accounts receivable, bank indebtedness, accounts payable and accrued liabilities – The carrying amountsapproximate fair value because of the short maturity of those financial instruments.
Interest rate swap – The fair value is computed based on the difference between mid-market levels and the fixed swap rate as atDecember 30, 2001.
Long-term debt – The fair value is estimated based on discounting expected future cash flows at the discount rates which representborrowing rates presently available to the Company for loans with similar terms and maturity.
Letters of credit – As described in Note 17, the Company has certain letter of credit facilities of which Management does not expect anymaterial losses to result from these instruments.
Foreign Exchange Risk Management
The Company enters into various types of foreign exchange contracts to manage its exposure to foreign currency risk as indicated in thefollowing table:
December 30, 2001 December 30, 2000 December 30, 1999
Notional Fair Notional Fair Notional FairAmount Value Amount Value Amount Value
Future contracts $ 20,820 $ 20,780 $ 69,684 $ 69,823 $ 41,420 $ 42,373
Forward exchange contracts 301 298 8,000 7,924 – –
Options – – 5,500 5,533 – –
The Company enters into foreign exchange contracts to hedge particular sales and purchases expected to be denominated in thosecurrencies when such transactions are probable and the significant characteristics and expected terms are identified. The term of thecurrency derivatives ranges from three to twelve months. The Company's market risk with respect to foreign exchange contracts is limitedto the exchange rate differential.
Deferred unrealized gains (losses) on these contracts are presented in the following table, showing the periods in which they are expectedto be recognized in income.
2001 2000 1999
To be recognized within
Three months $ ( 18 ) $ ( 9 ) $ 480
Six months ( 10 ) 38 259
Nine months ( 7 ) 52 142
Twelve months ( 8 ) 15 72
$ ( 43 ) $ 96 $ 953
Concentrations of Credit Risk
Substantially all accounts receivable arise from sales to the retail industry. Sales to major customers represented 66.3% (2000 - 66.9%,1999 - 53.1%) of total sales. Accounts receivable from these customers comprised 59.1% and 62.4% of the total at December 30, 2001and 2000, respectively.
NOTE 13 Benefit Plans
Pension Benefits
The Company's subsidiaries maintain defined benefit pension plans for specific employees. Obligations under the defined benefit plansare determined annually by independent actuaries using Management’s assumptions and the accrued benefits method. The plansprovide benefits based on a defined benefit amount and length of service.

[ DOREL I N DUSTR I ES I NC. Annua l Repor t 2001 p.40 ]
NOTE 13 Benefit Plans (cont’d)
Pension Benefits (cont’d)
Information regarding the Company’s defined benefit plans is as follows:2001 2000
Accrued benefit obligation:
Balance, beginning of year $ 14,881 $ 13,299Current service cost 327 317Interest cost 1,176 1,151Plan amendments 720 –Benefits paid ( 1,023 ) ( 792 )Actuarial (gains)/losses 754 906
Balance, end of year 16,835 14,881
Plan assets:
Fair value, beginning of year 17,579 17,342Actual return on plan assets ( 2,265 ) ( 109 )Employer contributions 2,750 1,138Benefits paid ( 1,023 ) ( 792 )
Fair value, end of year 17,041 17,579
Funded status-plan surplus 206 2,698
Unamortized actuarial (gain)/loss 4,931 277
Unamortized prior service cost 1,822 1,212
Unamortized transition obligation ( 24 ) ( 87 )
Accrued benefit asset $ 6,935 $ 4,100
Net pension costs for the defined benefit plan comprise the following:
2001 2000 1999
Current service cost, net of employee contributions $ 327 $ 317 $ 386
Interest cost 1,176 1,151 1,166
Expected return on assets ( 1,635 ) ( 1,662 ) ( 1,408 )
Amortization of prior service costs 110 110 113
Amortization of net actuarial (gain)/loss – – 69
Amortization of transition obligation ( 63 ) ( 63 ) ( 65 )
Pension expense (benefit): $ ( 85 ) $ ( 147 ) $ 261
Total expense under the defined contribution plans was $1,162 (2000 - $1,491, 1999 - $2,066).
Post-Retirement Benefits
The Company’s subsidiary maintains a defined benefit post-retirement benefit plan for substantially all its employees.
Information regarding the Company’s post-retirement benefit plan is as follows:2001 2000
Accrued benefit obligation:Balance, beginning of year $ 11,569 $ 10,151Current service cost 306 296Interest cost 807 792Plan amendments ( 1,481 ) –Benefits paid ( 751 ) ( 508 )Actuarial (gains)/losses ( 1,374 ) 838
Balance, end of year 9,076 11,569
Plan assets:Employer contributions 751 508Benefits paid ( 751 ) ( 508 )
Fair value, end of year – –
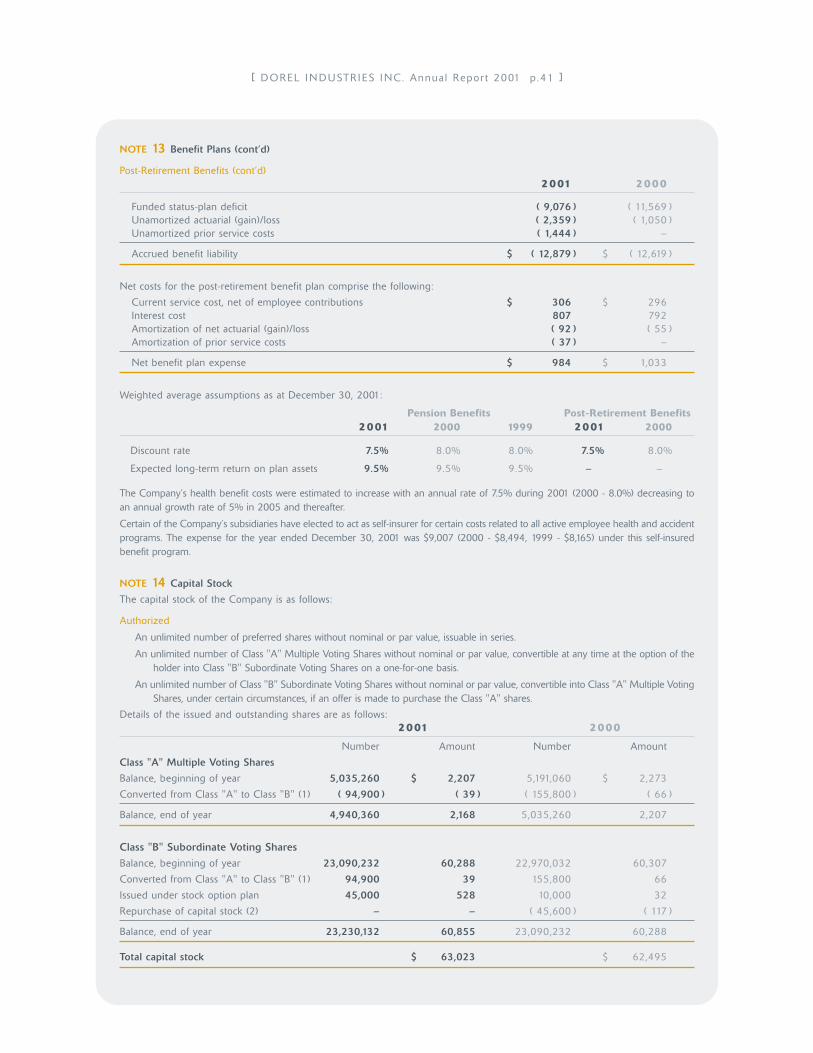
[ DOREL I N DUSTR I ES I NC. Annua l Repor t 2001 p.41 ]
NOTE 13 Benefit Plans (cont’d)
Post-Retirement Benefits (cont’d)2001 2000
Funded status-plan deficit ( 9,076 ) ( 11,569 )Unamortized actuarial (gain)/loss ( 2,359 ) ( 1,050 )Unamortized prior service costs ( 1,444 ) –
Accrued benefit liability $ ( 12,879 ) $ ( 12,619 )
Net costs for the post-retirement benefit plan comprise the following:
Current service cost, net of employee contributions $ 306 $ 296Interest cost 807 792Amortization of net actuarial (gain)/loss ( 92 ) ( 55 )Amortization of prior service costs ( 37 ) –
Net benefit plan expense $ 984 $ 1,033
Weighted average assumptions as at December 30, 2001:
Pension Benefits Post-Retirement Benefits2001 2000 1999 2001 2000
Discount rate 7.5% 8.0% 8.0% 7.5% 8.0%
Expected long-term return on plan assets 9.5% 9.5% 9.5% – –
The Company’s health benefit costs were estimated to increase with an annual rate of 7.5% during 2001 (2000 - 8.0%) decreasing toan annual growth rate of 5% in 2005 and thereafter.
Certain of the Company’s subsidiaries have elected to act as self-insurer for certain costs related to all active employee health and accidentprograms. The expense for the year ended December 30, 2001 was $9,007 (2000 - $8,494, 1999 - $8,165) under this self-insuredbenefit program.
NOTE 14 Capital Stock
The capital stock of the Company is as follows:
Authorized
An unlimited number of preferred shares without nominal or par value, issuable in series.
An unlimited number of Class "A" Multiple Voting Shares without nominal or par value, convertible at any time at the option of theholder into Class "B" Subordinate Voting Shares on a one-for-one basis.
An unlimited number of Class "B" Subordinate Voting Shares without nominal or par value, convertible into Class "A" Multiple VotingShares, under certain circumstances, if an offer is made to purchase the Class "A" shares.
Details of the issued and outstanding shares are as follows:2001 2000
Number Amount Number Amount
Class "A" Multiple Voting Shares
Balance, beginning of year 5,035,260 $ 2,207 5,191,060 $ 2,273
Converted from Class "A" to Class "B" (1) ( 94,900 ) ( 39 ) ( 155,800 ) ( 66 )
Balance, end of year 4,940,360 2,168 5,035,260 2,207
Class "B" Subordinate Voting Shares
Balance, beginning of year 23,090,232 60,288 22,970,032 60,307
Converted from Class "A" to Class "B" (1) 94,900 39 155,800 66
Issued under stock option plan 45,000 528 10,000 32
Repurchase of capital stock (2) – – ( 45,600 ) ( 117 )
Balance, end of year 23,230,132 60,855 23,090,232 60,288
Total capital stock $ 63,023 $ 62,495

[ DOREL I N DUSTR I ES I NC. Annua l Repor t 2001 p.42 ]
NOTE 14 Capital Stock (cont’d)
1 During the year, the Company converted 94,900 (2000 - 155,800) Class "A" Multiple Voting Shares into Class "B" Subordinate VotingShares at an average rate of $0.41 per share (2000 - $0.43 per share).
2. Under a Normal Course Issuer Bid effective December 9, 2000, the Company indicated its intention to purchase up to 260,143 Class "A" Multiple Voting Shares and 2,013,729 Class "B" Subordinate Voting Shares at the prevailing market price. The programexpired December 8, 2000. The Company purchased for cancellation by way of a Normal Course Issuer Bid on the Toronto StockExchange 45,600 Class "B" Subordinate Voting Shares in 2000 for $816.
3. On September 21, 2000, the Company granted to Hasbro, Inc. as partial consideration for the license agreement entered into, as outlined in Note 17, 200,000 share purchase warrants to purchase 200,000 Class "B" Subordinate Voting Shares at an exerciseprice of $20.20 expiring no later than September 21, 2005.
NOTE 15 Stock Options
Under various plans, the Company may grant stock options on the Class "B" Subordinate Voting Shares at the discretion of the boardof directors, to senior executives and certain key employees. The exercise price is the market price of the securities at the date the optionsmay be granted, less any discounts permitted by law and by regulations of the securities authorities to which the Company is then subject.No option may be exercised during the first year following its granting and is exercisable, on a cumulative basis, at the rate of 25% in each of the following four years, and will expire no later than the year 2006.
The Company's stock option plan is as follows:2001 2000
Weighted Average Weighted AverageOptions Exercise Price Options Exercise Price
Options outstanding, beginning of year 1,503,000 $ 13.72 1,498,000 $ 13.55
Granted 15,000 16.47 55,000 18.00
Exercised ( 45,000 ) 11.73 ( 10,000 ) 3.25
Cancelled ( 71,000 ) 16.62 ( 40,000 ) 16.11
Options outstanding, end of year 1,402,000 $ 13.65 1,503,000 $ 13.72
A summary of options outstanding at December 30, 2001 is as follows:
Total Outstanding Total Exercisable
Weighted Weighted WeightedAverage Average Average
Options Exercise Price Exercise Price Remaining Life Options Exercise Price
1,402,000 $ 12.47-18.53 $ 13.65 2.03 963,250 $ 13.25
NOTE 16 Cumulative Translation Adjustment
An analysis of the cumulative translation adjustment included in shareholders' equity is as follows:
2001 2000 1999
Balance, beginning of year $ ( 410 ) $ 2,422 $ 13,006Translation of self-sustaining foreign operations ( 3,924 ) ( 3,668 ) ( 10,098 )
Translation of foreign loans hedging net investment in foreign operations – 836 ( 486 )
Balance, end of year $ ( 4,334 ) $ ( 410 ) $ 2,422
NOTE 17 Commitments
a) The Company has entered into long-term lease agreements bearing various expiry dates to the year 2011. The minimum annual rentals exclusive of additional charges will be as follows:
Fiscal Year Ending Amount
2002 $ 6,9632003 6,0612004 5,4912005 4,2042006 1,520
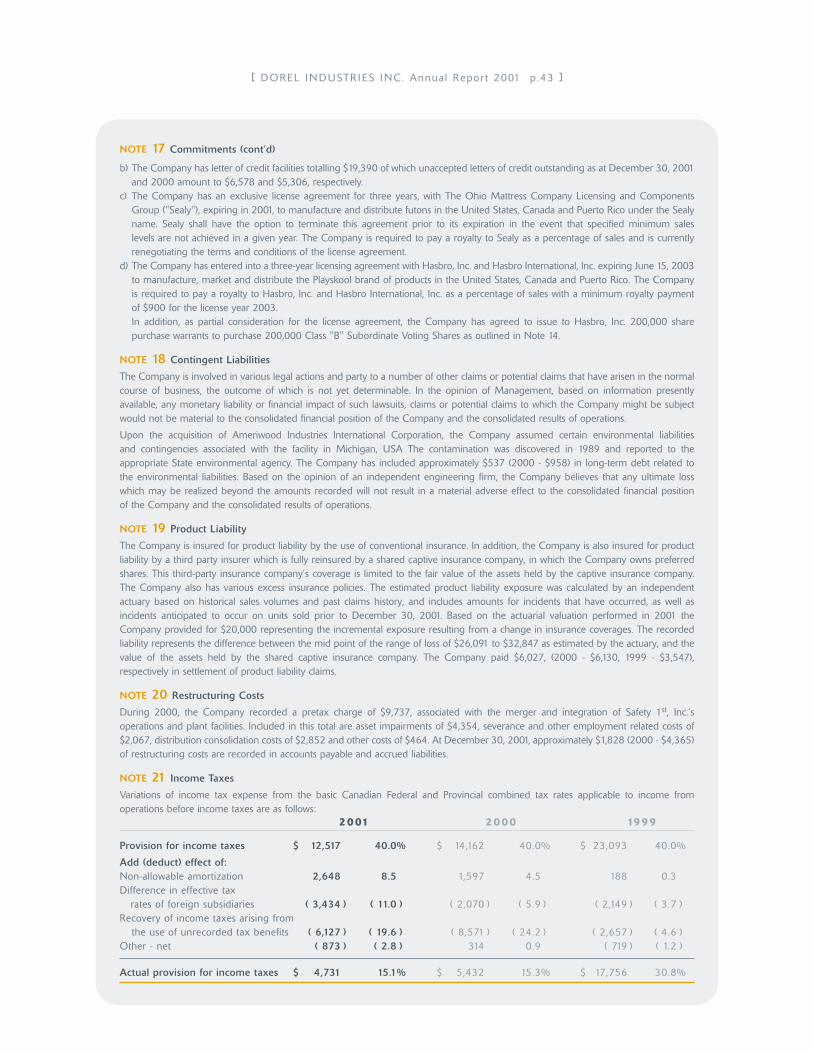
[ DOREL I N DUSTR I ES I NC. Annua l Repor t 2001 p.43 ]
NOTE 17 Commitments (cont’d)
b) The Company has letter of credit facilities totalling $19,390 of which unaccepted letters of credit outstanding as at December 30, 2001and 2000 amount to $6,578 and $5,306, respectively.
c) The Company has an exclusive license agreement for three years, with The Ohio Mattress Company Licensing and ComponentsGroup ("Sealy"), expiring in 2001, to manufacture and distribute futons in the United States, Canada and Puerto Rico under the Sealyname. Sealy shall have the option to terminate this agreement prior to its expiration in the event that specified minimum sales levels are not achieved in a given year. The Company is required to pay a royalty to Sealy as a percentage of sales and is currentlyrenegotiating the terms and conditions of the license agreement.
d) The Company has entered into a three-year licensing agreement with Hasbro, Inc. and Hasbro International, Inc. expiring June 15, 2003to manufacture, market and distribute the Playskool brand of products in the United States, Canada and Puerto Rico. The Companyis required to pay a royalty to Hasbro, Inc. and Hasbro International, Inc. as a percentage of sales with a minimum royalty paymentof $900 for the license year 2003.In addition, as partial consideration for the license agreement, the Company has agreed to issue to Hasbro, Inc. 200,000 sharepurchase warrants to purchase 200,000 Class "B" Subordinate Voting Shares as outlined in Note 14.
NOTE 18 Contingent Liabilities
The Company is involved in various legal actions and party to a number of other claims or potential claims that have arisen in the normalcourse of business, the outcome of which is not yet determinable. In the opinion of Management, based on information presentlyavailable, any monetary liability or financial impact of such lawsuits, claims or potential claims to which the Company might be subjectwould not be material to the consolidated financial position of the Company and the consolidated results of operations.
Upon the acquisition of Ameriwood Industries International Corporation, the Company assumed certain environmental liabilities and contingencies associated with the facility in Michigan, USA The contamination was discovered in 1989 and reported to theappropriate State environmental agency. The Company has included approximately $537 (2000 - $958) in long-term debt related to the environmental liabilities. Based on the opinion of an independent engineering firm, the Company believes that any ultimate losswhich may be realized beyond the amounts recorded will not result in a material adverse effect to the consolidated financial position of the Company and the consolidated results of operations.
NOTE 19 Product Liability
The Company is insured for product liability by the use of conventional insurance. In addition, the Company is also insured for productliability by a third party insurer which is fully reinsured by a shared captive insurance company, in which the Company owns preferredshares. This third-party insurance company’s coverage is limited to the fair value of the assets held by the captive insurance company.The Company also has various excess insurance policies. The estimated product liability exposure was calculated by an independentactuary based on historical sales volumes and past claims history, and includes amounts for incidents that have occurred, as well asincidents anticipated to occur on units sold prior to December 30, 2001. Based on the actuarial valuation performed in 2001 theCompany provided for $20,000 representing the incremental exposure resulting from a change in insurance coverages. The recordedliability represents the difference between the mid point of the range of loss of $26,091 to $32,847 as estimated by the actuary, and thevalue of the assets held by the shared captive insurance company. The Company paid $6,027, (2000 - $6,130, 1999 - $3,547),respectively in settlement of product liability claims.
NOTE 20 Restructuring Costs
During 2000, the Company recorded a pretax charge of $9,737, associated with the merger and integration of Safety 1st, Inc.’soperations and plant facilities. Included in this total are asset impairments of $4,354, severance and other employment related costs of$2,067, distribution consolidation costs of $2,852 and other costs of $464. At December 30, 2001, approximately $1,828 (2000 - $4,365)of restructuring costs are recorded in accounts payable and accrued liabilities.
NOTE 21 Income Taxes
Variations of income tax expense from the basic Canadian Federal and Provincial combined tax rates applicable to income fromoperations before income taxes are as follows:
2001 2000 1999
Provision for income taxes $ 12,517 40.0% $ 14,162 40.0% $ 23,093 40.0%
Add (deduct) effect of: Non-allowable amortization 2,648 8.5 1,597 4.5 188 0.3Difference in effective tax
rates of foreign subsidiaries ( 3,434 ) ( 11.0 ) ( 2,070 ) ( 5.9 ) ( 2,149 ) ( 3.7 )Recovery of income taxes arising from
the use of unrecorded tax benefits ( 6,127 ) ( 19.6 ) ( 8,571 ) ( 24.2 ) ( 2,657 ) ( 4.6 )Other - net ( 873 ) ( 2.8 ) 314 0.9 ( 719 ) ( 1.2 )
Actual provision for income taxes $ 4,731 15.1% $ 5,432 15.3% $ 17,756 30.8%

[ DOREL I N DUSTR I ES I NC. Annua l Repor t 2001 p.44 ]
NOTE 21 Income Taxes (cont’d)
The following presents the Canadian and foreign components of income from operations before income taxes and income taxexpense for the years ended December 30:
2001 2000 1999
Details of income from operations:
Domestic $ ( 59 ) $ ( 8,653 ) $ 8,161Foreign 31,352 44,059 49,571
Income from operations before income taxes $ 31,293 $ 35,406 $ 57,732
Details of income tax expense:
Current
Domestic $ ( 1,208 ) $ ( 314 ) $ 2,661Foreign 235 9,703 14,739
( 973 ) 9,389 17,400
Deferred
Domestic 319 58 370Foreign 5,385 ( 4,015 ) ( 14 )
5,704 ( 3,957 ) 356
Total income taxes $ 4,731 $ 5,432 $ 17,756
NOTE 22 Discontinued Operations
In December 2000, the Company adopted a plan to discontinue the operations of the Fort Smith, Arkansas wooden crib manufacturingfacility and sell the existing assets. Accordingly, the operating results of the Fort Smith, Arkansas facility have been classified asdiscontinued operations in the accompanying consolidated statement of income. All manufacturing operations in Fort Smith ceasedduring June 2001. The Company recorded a loss on disposal from discontinued operations of $1,058 in 2001 resulting from higher-than-anticipated operating losses. At December 30, 2001, the consolidated balance sheet includes $5,379 of inventory and $1,222 of capitalassets relating to Fort Smith.
In December 2000, the Company adopted a plan to discontinue the import and sale of strollers through its subsidiary company Dorel(U.K.) Limited. Accordingly, the operating results have been classified as discontinued operations in the accompanying consolidatedstatement of income.
On September 30, 2000, the Company sold capital assets and certain prepaid expenses of Infantino, Inc. in the amount of $1,187. Inaddition, the purchaser is obliged to acquire the inventory at book value with all amounts due and payable by May 1, 2002. Inventoryconsigned to the purchaser totalled $1,221 and $3,724 in 2001 and 2000, respectively. Accordingly, the results of Infantino, Inc. havebeen classified as discontinued operations in the accompanying consolidated statement of income.
Operating results from discontinued operations are as follows:
2001 2000 1999
Sales $ – $ 36,311 $ 40,985
Operating loss – ( 10,489 ) ( 2,331 )
Income tax benefit – 2,534 930
Loss from discontinued operations – ( 7,955 ) ( 1,401 )
Pre-tax loss on disposal of discontinued operations ( 2,101 ) ( 7,650 ) –
Income tax benefit 1,043 2,937 –
Loss on disposal of discontinued operations ( 1,058 ) ( 4,713 ) –
Discontinued operations - net of tax $ ( 1,058 ) $ ( 12,668 ) $ ( 1,401 )
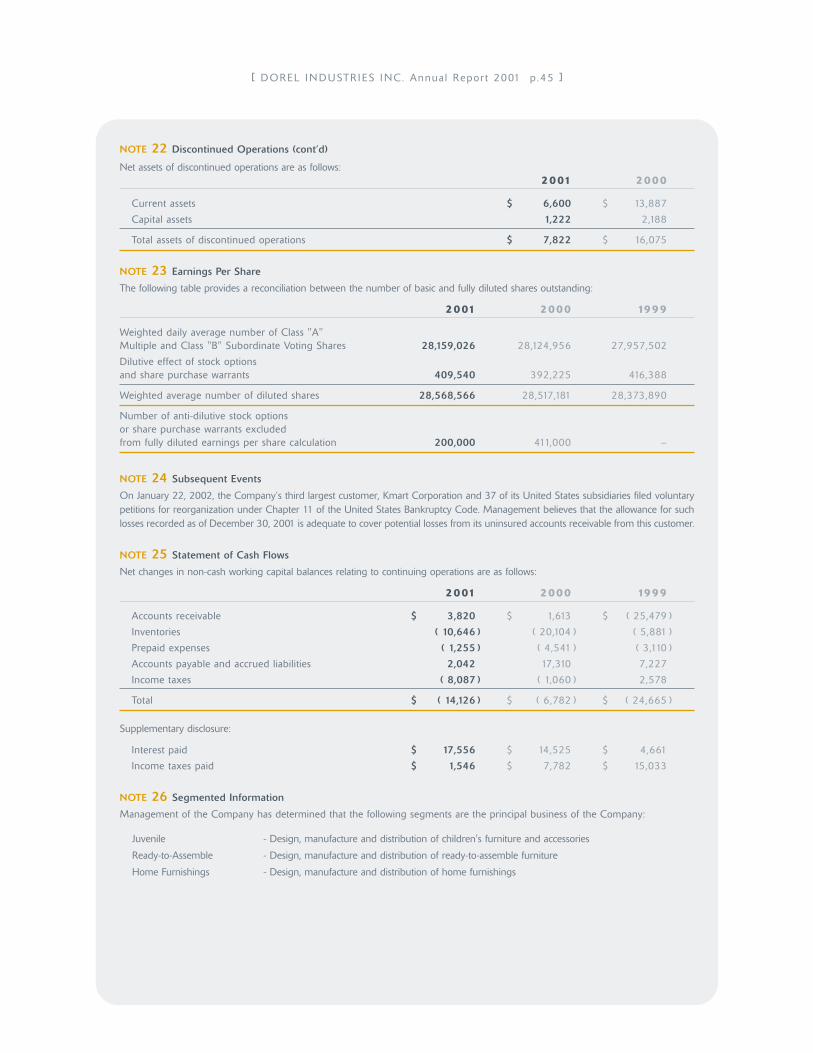
[ DOREL I N DUSTR I ES I NC. Annua l Repor t 2001 p.45 ]
NOTE 22 Discontinued Operations (cont’d)
Net assets of discontinued operations are as follows:2001 2000
Current assets $ 6,600 $ 13,887
Capital assets 1,222 2,188
Total assets of discontinued operations $ 7,822 $ 16,075
NOTE 23 Earnings Per Share
The following table provides a reconciliation between the number of basic and fully diluted shares outstanding:
2001 2000 1999
Weighted daily average number of Class "A" Multiple and Class "B" Subordinate Voting Shares 28,159,026 28,124,956 27,957,502
Dilutive effect of stock options and share purchase warrants 409,540 392,225 416,388
Weighted average number of diluted shares 28,568,566 28,517,181 28,373,890
Number of anti-dilutive stock options or share purchase warrants excluded from fully diluted earnings per share calculation 200,000 411,000 –
NOTE 24 Subsequent Events
On January 22, 2002, the Company’s third largest customer, Kmart Corporation and 37 of its United States subsidiaries filed voluntarypetitions for reorganization under Chapter 11 of the United States Bankruptcy Code. Management believes that the allowance for suchlosses recorded as of December 30, 2001 is adequate to cover potential losses from its uninsured accounts receivable from this customer.
NOTE 25 Statement of Cash Flows
Net changes in non-cash working capital balances relating to continuing operations are as follows:
2001 2000 1999
Accounts receivable $ 3,820 $ 1,613 $ ( 25,479 )
Inventories ( 10,646 ) ( 20,104 ) ( 5,881 )
Prepaid expenses ( 1,255 ) ( 4,541 ) ( 3,110 )
Accounts payable and accrued liabilities 2,042 17,310 7,227
Income taxes ( 8,087 ) ( 1,060 ) 2,578
Total $ ( 14,126 ) $ ( 6,782 ) $ ( 24,665 )
Supplementary disclosure:
Interest paid $ 17,556 $ 14,525 $ 4,661
Income taxes paid $ 1,546 $ 7,782 $ 15,033
NOTE 26 Segmented Information
Management of the Company has determined that the following segments are the principal business of the Company:
Juvenile - Design, manufacture and distribution of children's furniture and accessories
Ready-to-Assemble - Design, manufacture and distribution of ready-to-assemble furniture
Home Furnishings - Design, manufacture and distribution of home furnishings
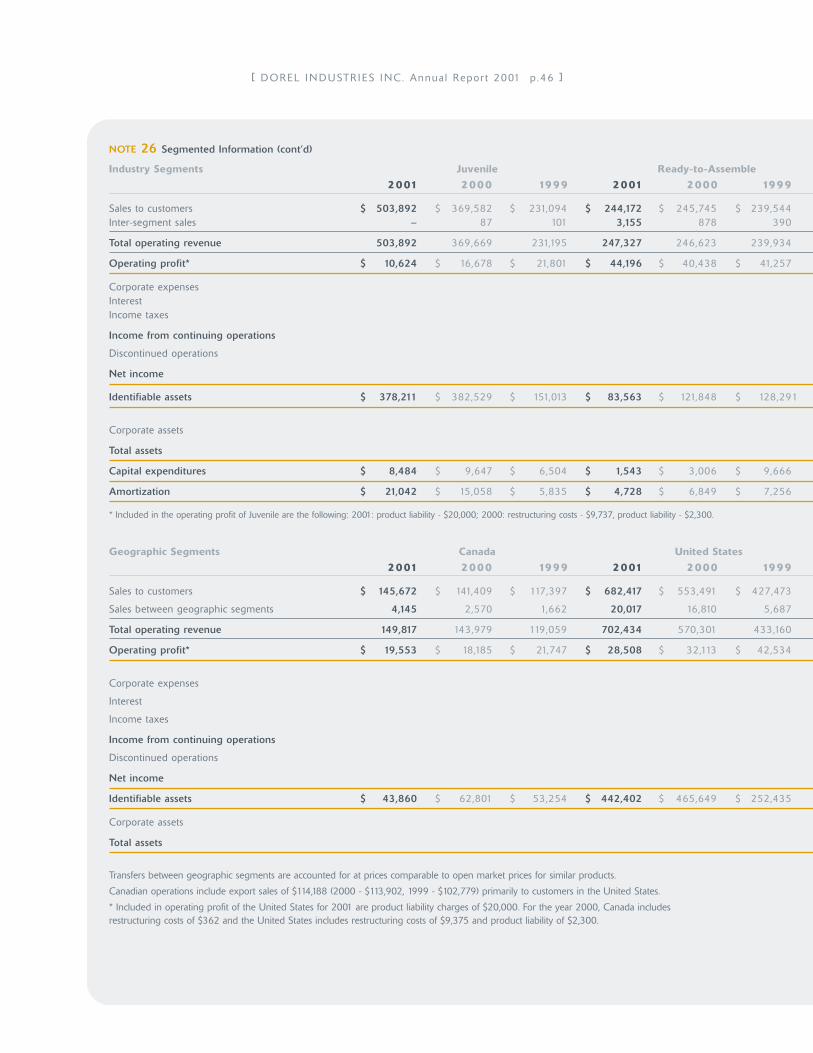
[ DOREL I N DUSTR I ES I NC. Annua l Repor t 2001 p.46 ]
NOTE 26 Segmented Information (cont’d)
Industry Segments Juvenile Ready-to-Assemble
2001 2000 1999 2001 2000 1999
Sales to customers $ 503,892 $ 369,582 $ 231,094 $ 244,172 $ 245,745 $ 239,544Inter-segment sales – 87 101 3,155 878 390
Total operating revenue 503,892 369,669 231,195 247,327 246,623 239,934
Operating profit* $ 10,624 $ 16,678 $ 21,801 $ 44,196 $ 40,438 $ 41,257
Corporate expensesInterestIncome taxes
Income from continuing operations
Discontinued operations
Net income
Identifiable assets $ 378,211 $ 382,529 $ 151,013 $ 83,563 $ 121,848 $ 128,291
Corporate assets
Total assets
Capital expenditures $ 8,484 $ 9,647 $ 6,504 $ 1,543 $ 3,006 $ 9,666
Amortization $ 21,042 $ 15,058 $ 5,835 $ 4,728 $ 6,849 $ 7,256
* Included in the operating profit of Juvenile are the following: 2001: product liability - $20,000; 2000: restructuring costs - $9,737, product liability - $2,300.
Geographic Segments Canada United States
2001 2000 1999 2001 2000 1999
Sales to customers $ 145,672 $ 141,409 $ 117,397 $ 682,417 $ 553,491 $ 427,473
Sales between geographic segments 4,145 2,570 1,662 20,017 16,810 5,687
Total operating revenue 149,817 143,979 119,059 702,434 570,301 433,160
Operating profit* $ 19,553 $ 18,185 $ 21,747 $ 28,508 $ 32,113 $ 42,534
Corporate expenses
Interest
Income taxes
Income from continuing operations
Discontinued operations
Net income
Identifiable assets $ 43,860 $ 62,801 $ 53,254 $ 442,402 $ 465,649 $ 252,435
Corporate assets
Total assets
Transfers between geographic segments are accounted for at prices comparable to open market prices for similar products.
Canadian operations include export sales of $114,188 (2000 - $113,902, 1999 - $102,779) primarily to customers in the United States.
* Included in operating profit of the United States for 2001 are product liability charges of $20,000. For the year 2000, Canada includes restructuring costs of $362 and the United States includes restructuring costs of $9,375 and product liability of $2,300.

[ DOREL I N DUSTR I ES I NC. Annua l Repor t 2001 p.47 ]
Home Furnishings Eliminations Consolidated
2001 2000 1999 2001 2000 1999 2001 2000 1999
$ 168,705 $ 142,213 $ 126,064 $ – $ – $ – $ 916,769 $ 757,540 $ 596,7022,663 – – ( 5,818 ) ( 965 ) ( 491 ) – – –
171,368 142,213 126,064 ( 5,818 ) ( 965 ) ( 491 ) 916,769 757,540 596,702
$ 3,410 $ 1,708 $ 7,603 58,230 58,824 70,661
8,475 7,876 7,71018,462 15,542 5,219
4,731 5,432 17,756
26,562 29,974 39,976
( 1,058 ) ( 12,668 ) ( 1,401 )
$ 25,504 $ 17,306 $ 38,575
$ 80,835 $ 60,265 $ 55,976 $ 542,609 $ 564,642 $ 335,280
25,965 11,402 8,257
$ 568,574 $ 576,044 $ 343,537
$ 1,427 $ 2,411 $ 2,104
$ 2,253 $ 2,874 $ 2,981
Foreign Eliminations Consolidated
2001 2000 1999 2001 2000 1999 2001 2000 1999
$ 88,680 $ 62,640 $ 51,832 $ – $ – $ – $ 916,769 $ 757,540 $ 596,702
5,430 3,541 185 ( 29,592 ) ( 22,921 ) ( 7,534 ) – – –
94,110 66,181 52,017 ( 29,592 ) ( 22,921 ) ( 7,534 ) 916,769 757,540 596,702
$ 10,169 $ 8,526 $ 6,380 58,230 58,824 70,661
8,475 7,876 7,710
18,462 15,542 5,219
4,731 5,432 17,756
26,562 29,974 39,976
( 1,058 ) ( 12,668 ) ( 1,401 )
$ 25,504 $ 17,306 $ 38,575
$ 56,347 $ 36,192 $ 29,591 $ 542,609 $ 564,642 $ 335,280
25,965 11,402 8,257
$ 568,574 $ 576,044 $ 343,537

[ DOREL I N DUSTR I ES I NC. Annua l Repor t 2001 p.48 ]
NOTE 27 United States Accounting Principles
The Company’s consolidated financial statements have been prepared in accordance with accounting principles generally accepted inCanada (Canadian GAAP) which, in the case of the Company, conform in all material respects with those in the United States (US GAAP)and with the requirements of the Securities and Exchange Commission (SEC), except as follows:
Deferred Charges
Canadian GAAP allows for the deferral and amortization of development costs if specific criteria are met. Under US GAAP all costsclassified as development costs are expensed as incurred.
Deferred Income Taxes
In 2000, the Company adopted the recommendations of the Canadian Institute of Chartered Accountants Section 3465, "Income Taxes"which were applied retroactively without restating prior years. These new standards substantially conform to those in the United Statesas contained in SFAS No. 109, "Accounting for Income Taxes". Prior to 2000, under Canadian GAAP, income taxes were recorded underthe deferred method which provided for tax allocation on differences between accounting income and taxable income for the periodusing the tax rates and regulations existing for that year.
Pension Plans and Post-Retirement Benefits Other than Pensions
In 2000, the Company adopted the recommendations of the Canadian Institute of Chartered Accountants Section 3461, "EmployeeFuture Benefits" which were applied retroactively without restating prior years. These standards substantially conform to those in theUnited States. Prior to 2000, Canadian GAAP did not require the recognition of an additional minimum pension liability for pensionplans which were underfunded. In addition, post-retirement benefits other than pensions were generally charged to operations asincurred.
Foreign Currency Translation
Under Canadian GAAP, unrealized and realized gains and losses on foreign currency transactions identified as hedges may be deferredas long as there is reasonable assurance that the hedge will be effective. Under US GAAP, deferral is allowed only on foreign currencytransactions intended to hedge firm foreign currency commitments.
Income Before Amortization of Goodwill
Under Canadian GAAP, recently issued Section 1581 "Business Combinations" permits amortization of goodwill to be presented net-of-taxon a separate line in the Consolidated Statement of Income. This presentation is not currently permitted under US GAAP.
Stock Options
The United States Financial Accounting Standards Board has issued standard SFAS No. 123 for accounting for stock-based compensation.The Company has elected to continue to account for its stock-based compensation plan under the guidelines of Accounting PrinciplesBoard Opinion No. 25 for purposes of reconciliation to US GAAP; however, additional disclosure as required by the guidelines of SFASNo. 123 is included below.
In accordance with Company policy, the exercise price of the Company’s employee stock option equals the market price of theunderlying stock on the date of grant. Accordingly, under the rules of APB 25, no related compensation expense was recorded in theCompany’s results of operations for US GAAP purposes.
If the Company had elected to recognize compensation costs based on the fair value at the date of grant, consistent with the provisionsof SFAS No. 123, the Company’s net income and earnings per share would have been reduced to the following pro-forma amounts:
2001 2000 1999
Pro-forma income from continuing operations for US GAAP $ 20,165 $ 25,696 $ 38,705
Loss from discontinued operations ( 1,058 ) ( 12,668 ) ( 1,401 )
Pro-forma net income for US GAAP $ 19,107 $ 13,028 $ 37,304
Pro-forma earnings per share:
Basic
Pro-forma income from continuing operations $ 0.72 $ 0.91 $ 1.38
Pro-forma net income $ 0.68 $ 0.46 $ 1.33
Fully Diluted
Pro-forma income from continuing operations $ 0.71 $ 0.90 $ 1.36
Pro-forma net income $ 0.67 $ 0.46 $ 1.31
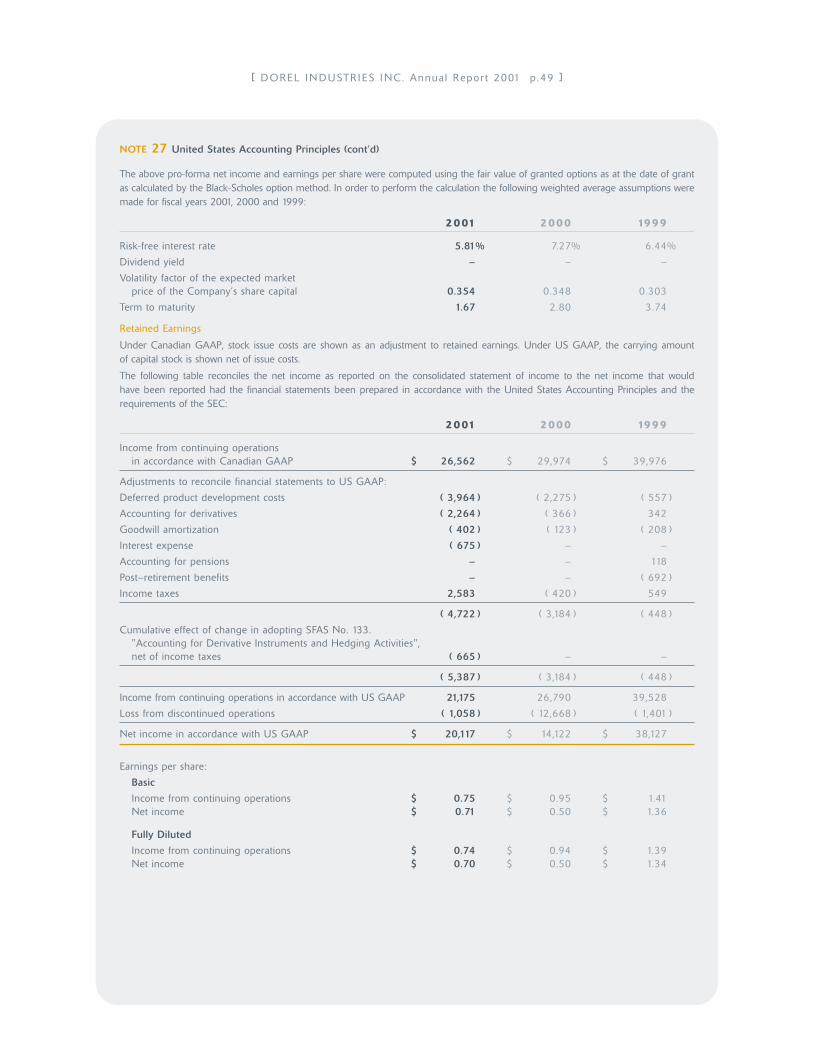
[ DOREL I N DUSTR I ES I NC. Annua l Repor t 2001 p.49 ]
NOTE 27 United States Accounting Principles (cont’d)
The above pro-forma net income and earnings per share were computed using the fair value of granted options as at the date of grantas calculated by the Black-Scholes option method. In order to perform the calculation the following weighted average assumptions weremade for fiscal years 2001, 2000 and 1999:
2001 2000 1999
Risk-free interest rate 5.81% 7.27% 6.44%
Dividend yield – – –
Volatility factor of the expected marketprice of the Company’s share capital 0.354 0.348 0.303
Term to maturity 1.67 2.80 3.74
Retained Earnings
Under Canadian GAAP, stock issue costs are shown as an adjustment to retained earnings. Under US GAAP, the carrying amount of capital stock is shown net of issue costs.
The following table reconciles the net income as reported on the consolidated statement of income to the net income that would have been reported had the financial statements been prepared in accordance with the United States Accounting Principles and therequirements of the SEC:
2001 2000 1999
Income from continuing operationsin accordance with Canadian GAAP $ 26,562 $ 29,974 $ 39,976
Adjustments to reconcile financial statements to US GAAP:
Deferred product development costs ( 3,964 ) ( 2,275 ) ( 557 )
Accounting for derivatives ( 2,264 ) ( 366 ) 342
Goodwill amortization ( 402 ) ( 123 ) ( 208 )
Interest expense ( 675 ) – –
Accounting for pensions – – 118
Post–retirement benefits – – ( 692 )
Income taxes 2,583 ( 420 ) 549
( 4,722 ) ( 3,184 ) ( 448 )
Cumulative effect of change in adopting SFAS No. 133. "Accounting for Derivative Instruments and Hedging Activities", net of income taxes ( 665 ) – –
( 5,387 ) ( 3,184 ) ( 448 )
Income from continuing operations in accordance with US GAAP 21,175 26,790 39,528
Loss from discontinued operations ( 1,058 ) ( 12,668 ) ( 1,401 )
Net income in accordance with US GAAP $ 20,117 $ 14,122 $ 38,127
Earnings per share:
Basic
Income from continuing operations $ 0.75 $ 0.95 $ 1.41Net income $ 0.71 $ 0.50 $ 1.36
Fully Diluted
Income from continuing operations $ 0.74 $ 0.94 $ 1.39Net income $ 0.70 $ 0.50 $ 1.34
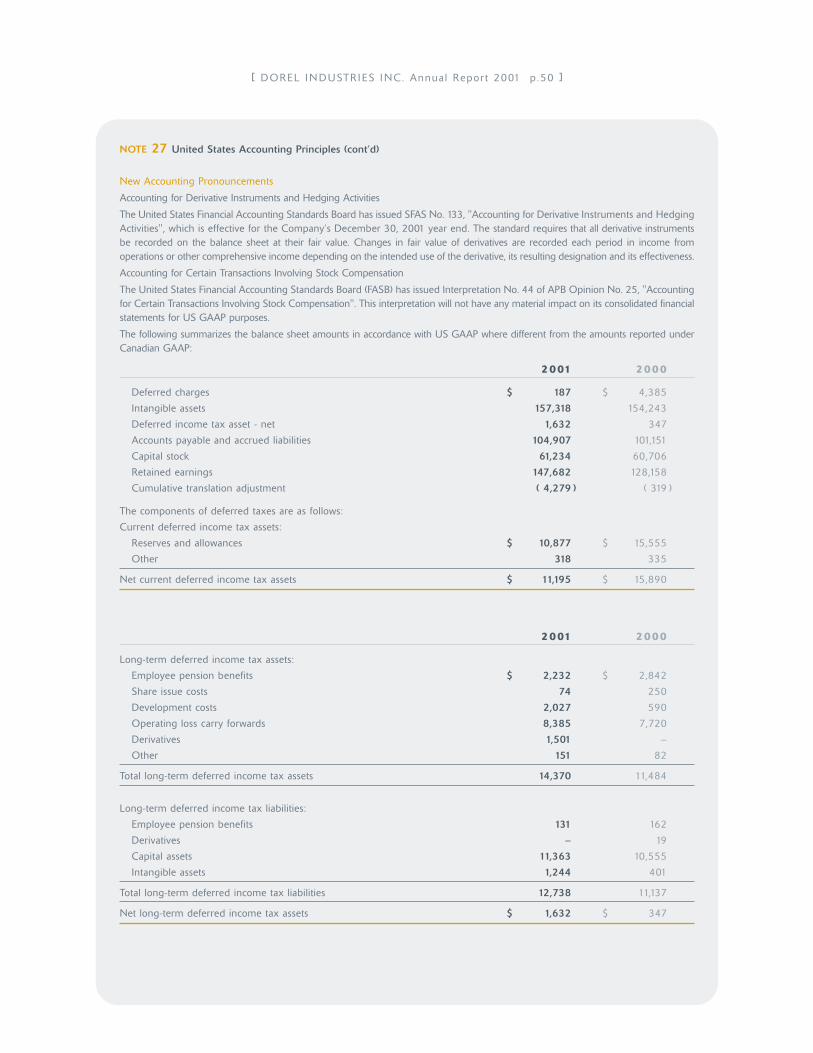
[ DOREL I N DUSTR I ES I NC. Annua l Repor t 2001 p.50 ]
NOTE 27 United States Accounting Principles (cont’d)
New Accounting Pronouncements
Accounting for Derivative Instruments and Hedging Activities
The United States Financial Accounting Standards Board has issued SFAS No. 133, "Accounting for Derivative Instruments and HedgingActivities", which is effective for the Company’s December 30, 2001 year end. The standard requires that all derivative instrumentsbe recorded on the balance sheet at their fair value. Changes in fair value of derivatives are recorded each period in income fromoperations or other comprehensive income depending on the intended use of the derivative, its resulting designation and its effectiveness.
Accounting for Certain Transactions Involving Stock Compensation
The United States Financial Accounting Standards Board (FASB) has issued Interpretation No. 44 of APB Opinion No. 25, "Accountingfor Certain Transactions Involving Stock Compensation". This interpretation will not have any material impact on its consolidated financialstatements for US GAAP purposes.
The following summarizes the balance sheet amounts in accordance with US GAAP where different from the amounts reported underCanadian GAAP:
2001 2000
Deferred charges $ 187 $ 4,385
Intangible assets 157,318 154,243
Deferred income tax asset - net 1,632 347
Accounts payable and accrued liabilities 104,907 101,151
Capital stock 61,234 60,706
Retained earnings 147,682 128,158
Cumulative translation adjustment ( 4,279 ) ( 319 )
The components of deferred taxes are as follows:
Current deferred income tax assets:
Reserves and allowances $ 10,877 $ 15,555
Other 318 335
Net current deferred income tax assets $ 11,195 $ 15,890
2001 2000
Long-term deferred income tax assets:
Employee pension benefits $ 2,232 $ 2,842
Share issue costs 74 250
Development costs 2,027 590
Operating loss carry forwards 8,385 7,720
Derivatives 1,501 –
Other 151 82
Total long-term deferred income tax assets 14,370 11,484
Long-term deferred income tax liabilities:
Employee pension benefits 131 162
Derivatives – 19
Capital assets 11,363 10,555
Intangible assets 1,244 401
Total long-term deferred income tax liabilities 12,738 11,137
Net long-term deferred income tax assets $ 1,632 $ 347
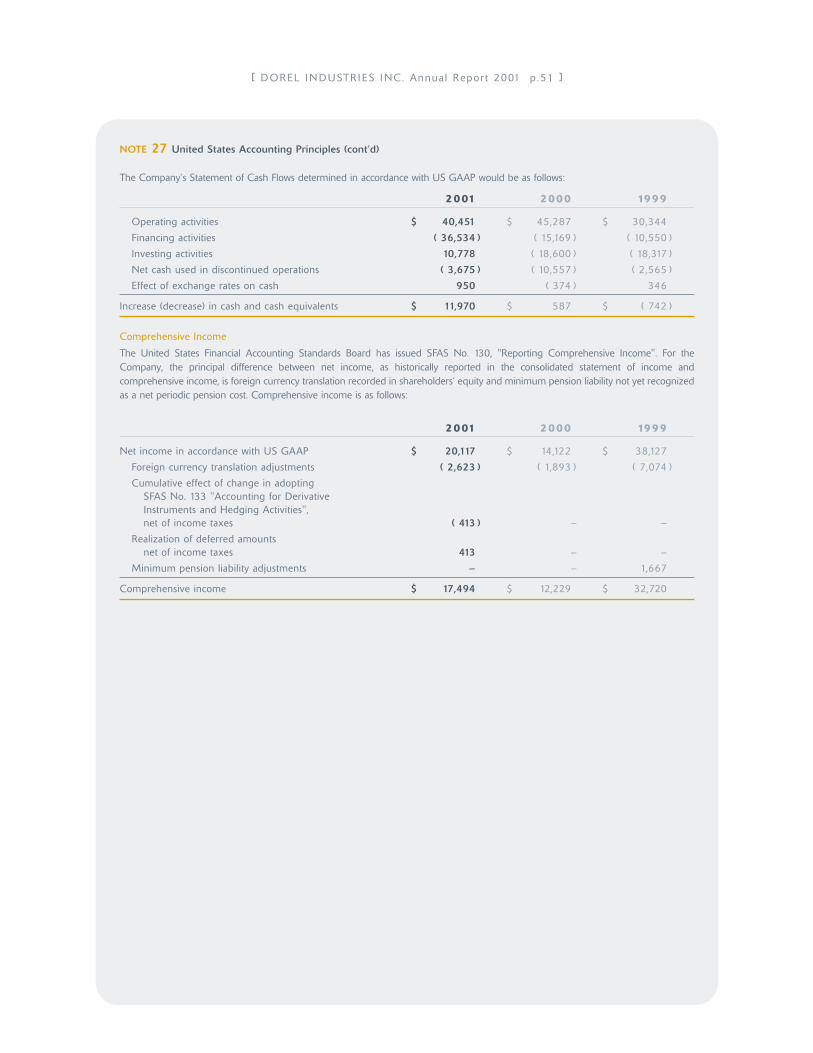
[ DOREL I N DUSTR I ES I NC. Annua l Repor t 2001 p.51 ]
NOTE 27 United States Accounting Principles (cont’d)
The Company’s Statement of Cash Flows determined in accordance with US GAAP would be as follows:
2001 2000 1999
Operating activities $ 40,451 $ 45,287 $ 30,344
Financing activities ( 36,534 ) ( 15,169 ) ( 10,550 )
Investing activities 10,778 ( 18,600 ) ( 18,317 )
Net cash used in discontinued operations ( 3,675 ) ( 10,557 ) ( 2,565 )
Effect of exchange rates on cash 950 ( 374 ) 346
Increase (decrease) in cash and cash equivalents $ 11,970 $ 587 $ ( 742 )
Comprehensive Income
The United States Financial Accounting Standards Board has issued SFAS No. 130, "Reporting Comprehensive Income". For theCompany, the principal difference between net income, as historically reported in the consolidated statement of income andcomprehensive income, is foreign currency translation recorded in shareholders’ equity and minimum pension liability not yet recognizedas a net periodic pension cost. Comprehensive income is as follows:
2001 2000 1999
Net income in accordance with US GAAP $ 20,117 $ 14,122 $ 38,127
Foreign currency translation adjustments ( 2,623 ) ( 1,893 ) ( 7,074 )
Cumulative effect of change in adopting SFAS No. 133 "Accounting for Derivative Instruments and Hedging Activities", net of income taxes ( 413 ) – –
Realization of deferred amounts net of income taxes 413 – –
Minimum pension liability adjustments – – 1,667
Comprehensive income $ 17,494 $ 12,229 $ 32,720

DIRECTORS
Martin SchwartzPresident and Chief Executive Officer, Dorel Industries Inc.
Jeff SegelVice-President, Sales and Marketing, Dorel Industries Inc.
Alan SchwartzVice-President, Operations, Dorel Industries Inc.
Jeffrey SchwartzVice-President, Finance and Secretary, Dorel Industries Inc.
Dr. Laurent Picard, D.B.A. Harvard, & C.C. *Past Dean of Faculty of Management of McGill University
Bruce Kaufman *Chairman, Trans Island Airways Limited
Maurice Tousson *President and CEO of Groupe CDREM Inc.
* Members of the Audit Committee
OFFICERS
Martin SchwartzPresident and Chief Executive Officer
Pierre DupuisChief Operating Officer
Jeffrey SchwartzVice-President, Finance and Secretary
Jeff SegelVice-President, Sales and Marketing
Alan SchwartzVice-President, Operations
Frank RanaTreasurer
corporate information
Leo Schwartz(Founder)
Cosco Acquisition
Charleswood Acquisition
MaxiAcquisition
1962
1987
IPOMontreal Exchange
Listing
1988 1990 1994
Forty years…
1990
Toronto StockExchange Listing
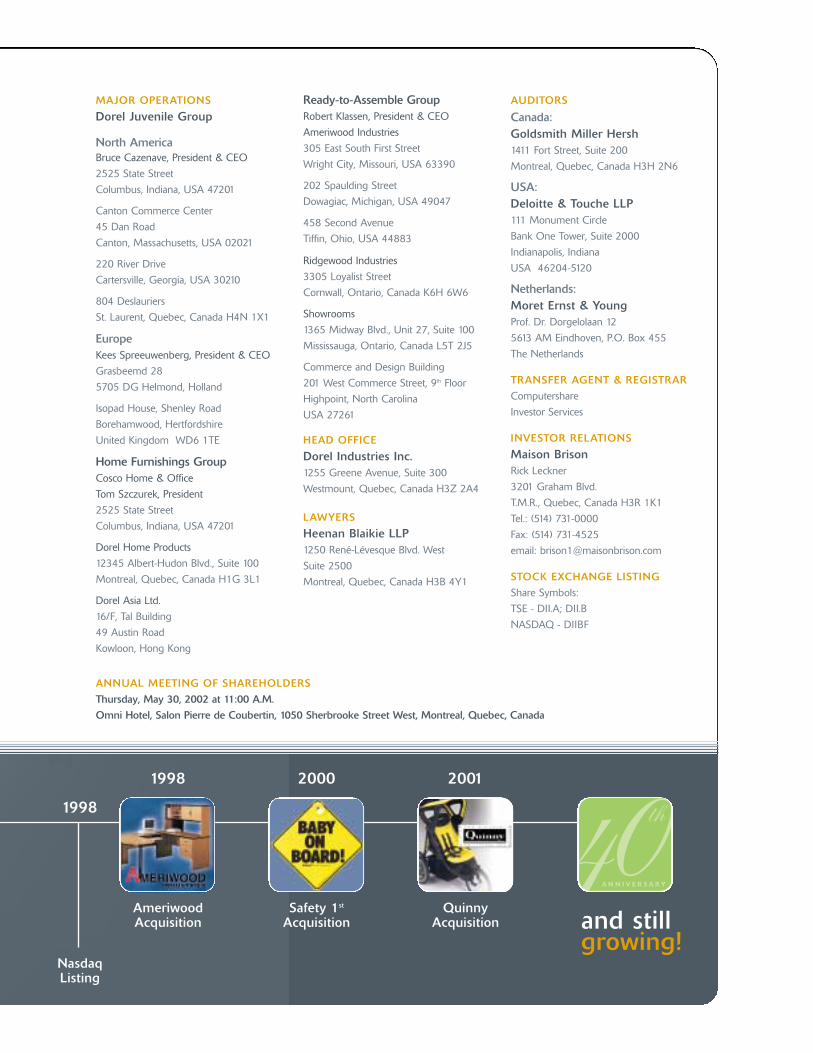
MAJOR OPERATIONS
Dorel Juvenile Group
North AmericaBruce Cazenave, President & CEO
2525 State Street
Columbus, Indiana, USA 47201
Canton Commerce Center
45 Dan Road
Canton, Massachusetts, USA 02021
220 River Drive
Cartersville, Georgia, USA 30210
804 Deslauriers
St. Laurent, Quebec, Canada H4N 1X1
EuropeKees Spreeuwenberg, President & CEO
Grasbeemd 28
5705 DG Helmond, Holland
Isopad House, Shenley Road
Borehamwood, Hertfordshire
United Kingdom WD6 1TE
Home Furnishings GroupCosco Home & Office
Tom Szczurek, President
2525 State Street
Columbus, Indiana, USA 47201
Dorel Home Products
12345 Albert-Hudon Blvd., Suite 100
Montreal, Quebec, Canada H1G 3L1
Dorel Asia Ltd.
16/F, Tal Building
49 Austin Road
Kowloon, Hong Kong
Ready-to-Assemble GroupRobert Klassen, President & CEO
Ameriwood Industries
305 East South First Street
Wright City, Missouri, USA 63390
202 Spaulding Street
Dowagiac, Michigan, USA 49047
458 Second Avenue
Tiffin, Ohio, USA 44883
Ridgewood Industries
3305 Loyalist Street
Cornwall, Ontario, Canada K6H 6W6
Showrooms
1365 Midway Blvd., Unit 27, Suite 100
Mississauga, Ontario, Canada L5T 2J5
Commerce and Design Building
201 West Commerce Street, 9th Floor
Highpoint, North Carolina
USA 27261
HEAD OFFICE
Dorel Industries Inc.1255 Greene Avenue, Suite 300
Westmount, Quebec, Canada H3Z 2A4
LAWYERS
Heenan Blaikie LLP1250 René-Lévesque Blvd. West
Suite 2500
Montreal, Quebec, Canada H3B 4Y1
AUDITORS
Canada:Goldsmith Miller Hersh1411 Fort Street, Suite 200
Montreal, Quebec, Canada H3H 2N6
USA:Deloitte & Touche LLP111 Monument Circle
Bank One Tower, Suite 2000
Indianapolis, Indiana
USA 46204-5120
Netherlands:Moret Ernst & YoungProf. Dr. Dorgelolaan 12
5613 AM Eindhoven, P.O. Box 455
The Netherlands
TRANSFER AGENT & REGISTRAR
Computershare
Investor Services
INVESTOR RELATIONS
Maison BrisonRick Leckner
3201 Graham Blvd.
T.M.R., Quebec, Canada H3R 1K1
Tel.: (514) 731-0000
Fax: (514) 731-4525
email: [email protected]
STOCK EXCHANGE LISTING
Share Symbols:
TSE - DII.A; DII.B
NASDAQ - DIIBF
ANNUAL MEETING OF SHAREHOLDERS
Thursday, May 30, 2002 at 11:00 A.M.
Omni Hotel, Salon Pierre de Coubertin, 1050 Sherbrooke Street West, Montreal, Quebec, Canada
Ameriwood Acquisition
Safety 1st
AcquisitionQuinny
Acquisition and still growing!
1998 2000 2001
1998
NasdaqListing
A N N I V E R S A R Y
1255 GREENE AVENUE, SUITE 300, WESTMOUNT, QUEBEC, CANADA H3Z 2A4WWW.DOREL.COM