forthcoming in the american political science revie hutchison...how do persistent terrorist attacks...
TRANSCRIPT
The Impact of Persistent Terrorism on Political Tolerance: Israel, 1980 to 2011
Forthcoming in the American Political Science Review
Mark Peffley Professor of Political Science
University of Kentucky 1653 Patterson Office Tower
Lexington, KY 40506 859-257-7033
Marc L. Hutchison Associate Professor of Political Science
University of Rhode Island Washburn Hall, 80 Upper College Rd
Kingston, RI 02881 401-874-4054
Michal Shamir Alvin Z. Rubinstein Chair of Political Science
Tel Aviv University P.O. Box 39040
Tel Aviz, Israel 6997801 972-3-6407406

2
Abstract How do persistent terrorist attacks influence political tolerance, a willingness to extend basic liberties
to one’s enemies? Studies in the U.S. and elsewhere have produced a number of valuable insights
into how citizens respond to singular, massive attacks like 9/11. But they are less useful for
evaluating how chronic and persistent terrorist attacks erode support for democratic values over the
long haul. Our study focuses on political tolerance levels in Israel across a turbulent thirty-year
period, from 1980 to 2011, which allows us to distinguish the short-term impact of hundreds of
terrorist attacks from the long-term influence of democratic longevity on political tolerance. We find
that the corrosive influence of terrorism on political tolerance is much more powerful among Israelis
who identify with the Right, who have also become much more sensitive to terrorism over time. We
discuss the implications of our findings for other democracies under threat from terrorism.
3
How do persistent terrorist attacks influence political tolerance, a willingness to extend basic
liberties to one’s domestic enemies? After 9/11, several studies in the U.S. and elsewhere
documented a sharp increase in public support for policies restricting a range of civil liberties, such
as warrantless government searches and surveillance and indefinite detention of terrorism suspects
without charge or trial. As Merolla and Zechmeister (2009) argue, these and other public responses
to terrorism pose a real threat to the health of democracy because not only are laws passed that
compromise democratic values and practices for years to come, but the “war on terrorism” is unlike
traditional wars in that there is no clear end date and the threat of terrorism is unlikely to recede in
the near future. And in more extreme cases, such as Sri Lanka in the early 1980's and Peru in 1992,
terrorist threat can quickly destabilize democracies and interrupt democratic sustainability.
While studies in the U.S. and elsewhere have yielded valuable insights, they are limited in two
important respects. First and foremost, the attacks from international terrorists in the U.S. in 2001,
like those in Spain in 2004 and the U.K. in 2005, were singular and massive attacks, whose
magnitude was without precedence or recurrence. It is therefore difficult to determine whether
Americans’ response to the 9/11 attacks can be generalized to countries where terrorism is a more
frequent occurrence. Indeed, scholars have been left to speculate about whether additional attacks
would seriously erode political tolerance and support for democratic values among U.S. citizens
(Hetherington and Suhay 2011, 558; Davis 2007; Gibson 2008, 97). Thus, the question of the impact
of persistent terrorist attacks on political tolerance remains unsettled.
Another limitation of U.S. studies is that most surveys that followed on the heels of the 9/11
attacks focused on the public’s support for civil liberties policies, such as approval of increased
surveillance (see Davis 2007; Berinsky 2009; Brooks and Manza 2013; Hetherington and Suhay
2011) instead of what is commonly considered to be the essence of toleration –i.e., “putting up”

4
with groups and ideas one opposes, as assessed by the least-liked political tolerance measure1
(Sullivan et al. 1982). The distinction is an important one because as Gibson (2013) makes plain, the
two measures -- support for restrictive policies and least-liked tolerance -- are only weakly related,
and their association with various covariates suggests they are tapping substantially different
constructs. Although both measures have their use, in addition to providing a proper test of political
tolerance, the least-liked method has been used extensively in the U.S. (e.g., Gibson 2008) and in
cross-national research (e.g., Gibson 1998; Gibson and Gouws 2003; Sullivan et al. 1993).
To gain more insight into the potential for persistent terrorist attacks to threaten support for
political tolerance over time, we turn to Israel. Along with several other democracies (e.g., India,
Northern Ireland), Israel has experienced chronic and persistent terrorism, characterized by a large
number of attacks over several years. During the years of our study, from 1980 to 2011, Israel
endured over 1,500 attacks, averaging almost 50 terrorist attacks per year, according to the Global
Terrorism Database (GTD) (2014). Furthermore, terrorism has a salient and daily presence in the
lives of Israelis. A survey of Israeli citizens in 2000-2001, for example, reported that 12% of
respondents had personally been present at an attack; a further 60% were acquainted with a victim
of terrorist violence (Kirschenbaum 2005). Given such high levels of exposure to chronic terrorism,
Israel provides an invaluable case study for investigating how persistent terrorist attacks over time
influence Israeli citizens’ support for political tolerance. Does chronic terrorist threat present a
virtual death sentence for citizens’ support for the political freedoms of unpopular minorities, the
provision of which is a core requirement of a liberal democracy? How resilient are democratic
publics in the face of chronic security threats?
1 As described more fully below, the least-liked approach allows respondents to pick the domestic political group they like the least from a list so that political tolerance questions are tailored to that group.
5
In this study, we take advantage of a unique collection of 18 Israeli public opinion surveys
tracking political tolerance among Israeli Jews2 from 1980 to 2011, where tolerance is measured
using the least liked method. In fact, we know of no other country in the world, outside of the U.S.,
where political tolerance, classically defined, has been assessed more often over such a long sweep of
time. As we argue below, the Israeli case allows us to distinguish the short-term influences of
terrorist attacks from the long-term impact of democratic longevity on political tolerance. In
addition, we can assess how the impact of terrorism changes over time and how it is moderated by
individual characteristics like left-right identification in Israel. Although any single country has its
share of unique characteristics, there is no denying that the large number of terrorist attacks poses a
potentially serious threat to democratic support in Israel, making it a valuable case for studying
democracies under chronic threat from terrorism and a necessary complement to studies in
countries like the U.S., with few but massive terrorist attacks.
The ‘Push’ and ‘Pull’ of Macro-Level Conditions on Political Tolerance
Political tolerance has been called “an essential endorphin of a democratic body politic”
(Gibson 2006, 21). Defined as the willingness to put up with groups or ideas that one finds objectionable
(Sullivan et al. 1982), political tolerance is crucial to democratic politics because without tolerance,
open competition for power—the hallmark of a liberal democracy—cannot take place (Dahl 1971).
As Gibson (2006, 22) points out, central to this definition is the idea that “one cannot tolerate (i.e.,
the word does not apply) ideas of which one approves. Political tolerance is forbearance; it is the
restraint of the urge to support the repression one’s political enemies.”
2 Jews constitute today about 75%, and Arab or Palestinian citizens, about 20% of Israel's population. Our analysis relies on Jewish respondents because several surveys in our data set included only Jews and because when studying terrorism in Israel and the threat it entails, it is appropriate to study separately Jewish and Arab citizens, as is commonly done.

6
Because the degree to which publics are willing to tolerate their domestic enemies is an
important predictor of political repression and the health of democracies, it is not surprising that
scores of tolerance studies have been undertaken around the globe.3 Although tolerance levels are
low, on average, cross-national studies reveal large differences across countries due to various state-
level factors that either facilitate or suppress tolerance, including democratic longevity and state-level
threat environments as well as other factors4 (Duch and Gibson 1992; Peffley and Rohrschneider
2003; Hutchison and Gibler 2007). Considered together, these factors represent the proverbial
“push-pull” of contextual forces on individual tolerance levels: democratic longevity pushes citizens
toward greater tolerance over time, with various state-level threats pulling citizens away from
tolerance.
Democratic longevity is important because democratic institutions establish the rules of the
system and, more importantly, promote and deepen democratic norms and political culture over
time. The democratic learning thesis asserts that political tolerance should be higher in more stable
democratic nations that have successfully persisted over time (see Rohrschneider 1996, 1999).
Tolerating one’s enemies is a difficult lesson to learn (Stouffer 1955; Sniderman 1975); and in stable
democracies where civil liberties have been in place for longer periods, citizens have more
opportunities to apply abstract democratic norms to disliked opponents. Empirically, several studies
have uncovered strong evidence for the impact of democratic learning on individual-level tolerance
(e.g., Rohrschneider 1996; Marquart-Pyatt and Paxton 2007).
To the extent that democratic longevity is associated with political tolerance in Israel, the
Supreme Court is undeniably an important institution in the democratic learning process in its
3 See Gibson (2007) for a brief review of this extensive literature. 4 Other macro characteristics (e.g., economic conditions) are discussed below. See also Section 6 of the Appendix, where we provide a brief overview of alternative macro-level predictors (e.g. militarized disputes with international rivals, unemployment, per capita income), none of which have significant effects or alter any of our substantive findings.

7
rulings over the years, protecting freedom of speech and minority rights, and in the "Constitutional
Revolution" led by Justice Aharon Barak in the 1990s. Shamir and Weinshall-Margel (2015), for
example, show that since the mid-1980s the Israeli Supreme Court has played an increasingly
important role in protecting the right of Arab minority representatives to be elected to the Knesset,
providing some of the most prominent examples of political tolerance. More generally, the
development of an independent judiciary has been found to play a critical role in preventing
antidemocratic reversals among democracies facing military threats from neighboring states (Gibler
and Randazzo 2011).
In contrast to the push of democratic longevity and democratic learning, the pull of elevated
levels of objective threat to the state appear to seriously dampen political tolerance among the
citizenry. In their study of 33 countries using the 1995-1997 World Values surveys, Hutchison and
Gibler (2007) found that external militarized threats involving territorial disputes drastically lower
individual tolerance. Internal threats to the state are consequential as well. In another cross-national
study using the World Values surveys, Hutchison (2014) found that violent conflict, including
terrorist attacks, civil wars and insurgency-based armed conflict, reduces individual tolerance. By
contrast, the decline in threat in Israel in the Oslo period5 was accompanied by growing support for
democracy and higher levels of political tolerance (Arian et al 2005, 91-111; also see Figure 1 below).
Terrorist attacks constitute the kind of salient state-level threat that has been shown to pull
citizens away from political tolerance. As is well understood, the goal of terrorists is to strike fear
into the hearts of citizens by attacking civilians, and indeed, the impact of terrorism extends well
beyond its immediate victims and destruction to include a much broader target population of the
entire nation (Huddy et al. 2005). Thus, the forbearance required for tolerating one’s domestic
5 The Oslo peace process began on September 13, 1993, when Israel and the PLO signed the Declaration of Principles. It should be noted that this period corresponds in time to the Constitutional Revolution discussed above.
8
enemies may be extremely difficult to sustain in the face of heightened national threat from terrorist
attacks. Almost everything we know about political tolerance – that it is difficult to learn, that it is
more pliable than intolerance, that it is heavily influenced by perceived threat – strongly suggests
that it is likely to be compromised by salient state-level threats from terrorist groups.
The Importance of the Israeli Case
Although prior studies make a strong circumstantial case for tying persistent terrorist attacks
to the erosion of political tolerance, they are limited in several important respects. To be sure, survey
studies in the U.S. provide a wealth of evidence showing that the threat of terrorist attacks ratchets
up support for counterterrorism policies (e.g., Huddy and Feldman 2011). And innovative
experimental studies show that several years after 9/11, manipulating terrorist threat through
information, reminders about past attacks, or threatening images invariably raises support for
counterterrorism policies restricting individual freedoms (Brooks and Manza 2013; Merolla and
Zechmeister 2009; Malhotra and Popp 2012). But very few studies have examined how terrorism
affects political tolerance in its essential meaning of “putting up” with groups and ideas one opposes
(c.f., Merolla and Zechmeister 2009, 94-96). And even the most realistic and evocative experimental
manipulations are unlikely to capture the effects of chronic terrorism encountered in the real world.
Cross-national studies of political tolerance suffer from a tendency to rely on a single cross-
section of surveys. Theoretically, both political tolerance and its antecedents—e.g., democratic
longevity and terrorist attacks--should be assessed over time. Cross-sectional studies thus make it
difficult to unravel various causal influences from the existing evidence. By contrast, our design,
which combines repeated cross-sections of Israeli survey data with terrorism data over a 30 year

9
period, 6 permits a more dynamic analysis of how variation in the level of terrorist attacks over time
helps to explain fluctuations in political tolerance. In this way, our study complements available
studies and allows us to overcome their major limitations.
Israel represents an invaluable case because in almost every sense of the term, Israel is a
democracy truly under threat from terrorism. Since its founding in 1948, Israel has experienced serial
external and internal threats, including chronic terrorist attacks involving two highly organized
campaigns in the last 30 years. But while Israel is often described as unique, its global ranking in
terms of both terrorist threat and democratic longevity is distinctive but not unique. Among the top
25 countries targeted by terrorist attacks between 1979 and 2010, 10 were democracies, at least half
of which experienced more attacks and fatalities from foreign actors than Israel.7 And with 62 years
of uninterrupted democratic government from the time of its creation in 1948 to 2011, the last year
of our study, Israel’s status as a “middle-aged” democracy is far closer to the average age of the top
10 democracies targeted by terrorists from 1979 to 2010, also 62 years, than “mature” democracies
like the U.K. (130 years) and U.S. (201 years).
Even more important is the fact that Israel along with other countries still qualifies as a
democracy after years of terrorist threat, while some democracies failed or experienced serious
backsliding in the face of similar threats. And like other democracies under threat, Israel’s
commitment to minority rights lags behind its commitment to political rights and electoral
democracy. Thus for a number of reasons, our study, which captures 30 of Israel’s 62 years of 6 Other researchers have studied the political consequences of terrorism in Israel for voting behavior, support for right-wing parties and willingness to grant territorial concessions, all assessed over shorter periods of time (Berrebi and Klor 2006, 2008; Getmansky and Zeitzoff 2014; Gould and Klor 2010). 7 Using the GTD (2014) to measure terror attacks and an average score of 6 on Polity IV’s democracy/autocracy scale to define democracies (Marshall and Jaggers 2012), between 1979 and 2010 -- the start and end points of our surveys with a one-year lag, several democracies experienced more terrorist attacks than Israel: Colombia, India, Northern Ireland, Spain, Turkey, and South Africa. If we expand the list to countries experiencing high levels of terrorism that were democracies for at least 15 years during this period, 4 more states qualify: Chile, Guatemala, Peru, and Philippines. Thus, Israel’s experience is comparable in many ways to at least 10 other countries.
10
existence, provides an unparalleled opportunity to evaluate the influence of state-level factors
pushing and pulling individual tolerance over time in a democracy.
Does the Impact of Terrorism on Tolerance Vary across Individuals?
The impact of terrorism on political tolerance is expected to vary across different types of
individuals. Previous work on tolerance emphasizes the key role played by dispositional tendencies
in moderating the influence of situational triggers on political tolerance judgments (Marcus et al.
1995; Sniderman et al. 2004; Feldman and Stenner 1997; Huddy et al. 2005). This general finding
applies to a variety of dispositions (e.g., ideology, authoritarianism) and situational triggers, and is
consistent with several established theoretical perspectives (e.g., social identity, group conflict and
prejudice).
In Israel, we expect left-right identification to play a pivotal role in moderating the impact of
terrorism on political forbearance. Left-right identification in Israel is a potent political construct,
and has repeatedly been found to be a major predictor of tolerance assessed with the least-liked
approach (Shamir and Sullivan 1983). This contrasts to U.S. findings where least-liked measures of
tolerance are uniquely independent of partisan and ideological self-identifications (Gibson 2013).
Indeed, the hallmark of the least-liked approach is its ideological neutrality. Nevertheless, cross-
sectional studies in Israel have often found that those on the right are less willing to extend civil
liberties to their least-liked group than those on the left.
But how is left-right identification likely to influence reactions to terrorist attacks over time
in Israel? Prior research and theory suggest two alternative hypotheses, described here as the Right-
wing intolerance and Rightward shift hypotheses. The Right-wing intolerance hypothesis asserts that
individuals on the right will react more strongly to security threats from terrorist attacks by opposing
freedoms for groups they oppose. Numerous studies find that individuals on the right tend to be
more sensitive to social and political threats from a range of outgroups, a tendency that is
11
attributable to political, personality and value orientations (e.g., Jost et al 2003; Stenner 2005; Kam
and Kinder 2007; Feldman 2003). In the Israeli context, the association between left-right
identification and political tolerance should be enhanced by the fact that terrorism is perpetrated
primarily by Palestinians from the occupied territories, who are associated with Israeli Arabs
(Palestinians) among Israeli Jews, particularly among right wingers.
Research in opinion leadership and issue ownership provides additional support for the
hypothesis. Parties on the right tend to “own” national security issues in Israel as in the U.S. and are
viewed as more likely to respond forcefully to terrorist attacks by using military force to strike back
at terrorist groups (e.g., Merolla and Zechmeister 2009; Berrebi and Klor 2006). And domestically in
Israel, right-bloc parties have vilified Israeli Arabs as posing a security threat to the state, despite a
general lack of evidence for such claims, and have promoted policies designed to curtail civil liberties
(e.g. Peleg and Waxman 2011; Shamir and Weinshall-Margel 2015).
By contrast, the Rightward shift hypothesis asserts that after terrorist attacks much of the
increase in public support for restricting freedoms of unpopular groups is likely to come from
moderates and liberals because those on the right already support such restrictive policies. The
rightward shift hypothesis is best exemplified by Hetherington and associates’ (Hetherington and
Weiler 2009; Hetherington and Suhay 2011) research on authoritarianism and public support for
anti-terrorism policies in the U.S. The authors found in a 2006 survey that non-authoritarians were
more likely to increase their support for more restrictive counterterrorism policies when they
perceived threat from terrorism, in part because authoritarians already supported such policies.8
On the other hand, a series of experiments by Merolla and Zechmeister (2009, 89-95) raise
questions about the rightward shift hypothesis as it applies to political tolerance. Contrary to
8See also Malhotra and Popp (2012), who found experimental evidence for a rightward shift in support for counterterrorism measures among a small group of “threatened” Democrats.”
12
Hetherington and associates, they found that when the salience of terrorist threat increases, the
difference in support for moral and political tolerance attitudes across authoritarians and non-
authoritarians grows instead of shrinking in the treatment condition, primarily because authoritarians
became much more intolerant after being exposed to terrorist threat. The mixed results of U.S.
studies make our investigation of the two hypotheses in the Israeli context of persistent terrorism all
the more important.
Does the Impact of Terrorism on Tolerance Change over Time?
One advantage of our study is that we can gauge how tolerance levels are affected by actual
terrorist attacks. Another advantage is that it is possible to move beyond a simple assessment of the
average impact of terrorist attacks on political tolerance to also consider whether the impact of
attacks on political tolerance changes over time. One possibility is that the public may become less
sensitive to persistent terrorist attacks over time (e.g., Stecklov and Goldstein 2010; Waxman 2011).
Thus, the connection between tolerance and terrorist attacks may weaken over time as individuals
become habituated and desensitized to chronic terrorist threat.
But while it makes perfect sense to expect individuals to habituate themselves to chronic
terrorism in their personal lives and daily routines, their political reactions to terrorism can be
expected to strengthen, not weaken, over time as individuals become more sensitive to repeated
attacks. In a prolonged terrorism campaign, terrorist groups have an incentive to introduce new
tactics to maintain media coverage and levels of fear among the civilian population, a strategy
intended to discourage habituation (Crenshaw 2010). Indeed, increased exposure to attacks and
distress have been found to raise intolerance toward political minorities (e.g., Canetti-Nisim et al
2008, 2009). An intolerant response is also likely when politicians have an incentive to link domestic
foes to threat from international terrorism. Thus, while desensitization and habituation to repeated

13
terror attacks undoubtedly occur, the more likely scenario in terms of political intolerance is one of
increased sensitivity over time.
There is also every reason to expect ideological groups to vary in their sensitivity to
persistent terrorist attacks over time. But whether it is more reasonable to expect the Right or the
Left to become more sensitive will depend, at least in part, on whether the Right-wing intolerance or
the Rightward shift hypothesis is supported. If those on the right are found to be more intolerant
after an upsurge in terrorist attacks, consistent with the Right-wing intolerance hypothesis, they
should also become increasingly intolerant in the face of persistent terrorist attacks. If the Rightward
shift hypothesis is confirmed, however, those who identify as leftists and centrists may be the ones
who become more sensitive to repeated attacks over time.
Hypotheses
Based on the foregoing discussion, the push and pull of macro-level forces in Israel from
1980 to 2011, as filtered through individual-level characteristics of Israeli Jewish citizens, leads to
our main hypotheses. In the first place, we predict that terrorist attacks should significantly reduce
individual forbearance, an expectation that aligns with an abundance of theory and research linking
terrorist threats to individual tolerance:
H1: An increase in terrorist attacks will lower political tolerance among Israeli Jews, independently of other macro-level factors and individual-level predictors of political tolerance.
An accurate assessment of terrorism’s influence on Israeli tolerance must also take into account the
influence of long-term forces-- in particular, democratic longevity, which is expected to increase
political tolerance over time. Further, we expect the relationship to be nonmonotonic, since there is
no reason to expect political tolerance to increase with continuous democracy in a strictly linear
fashion.
14
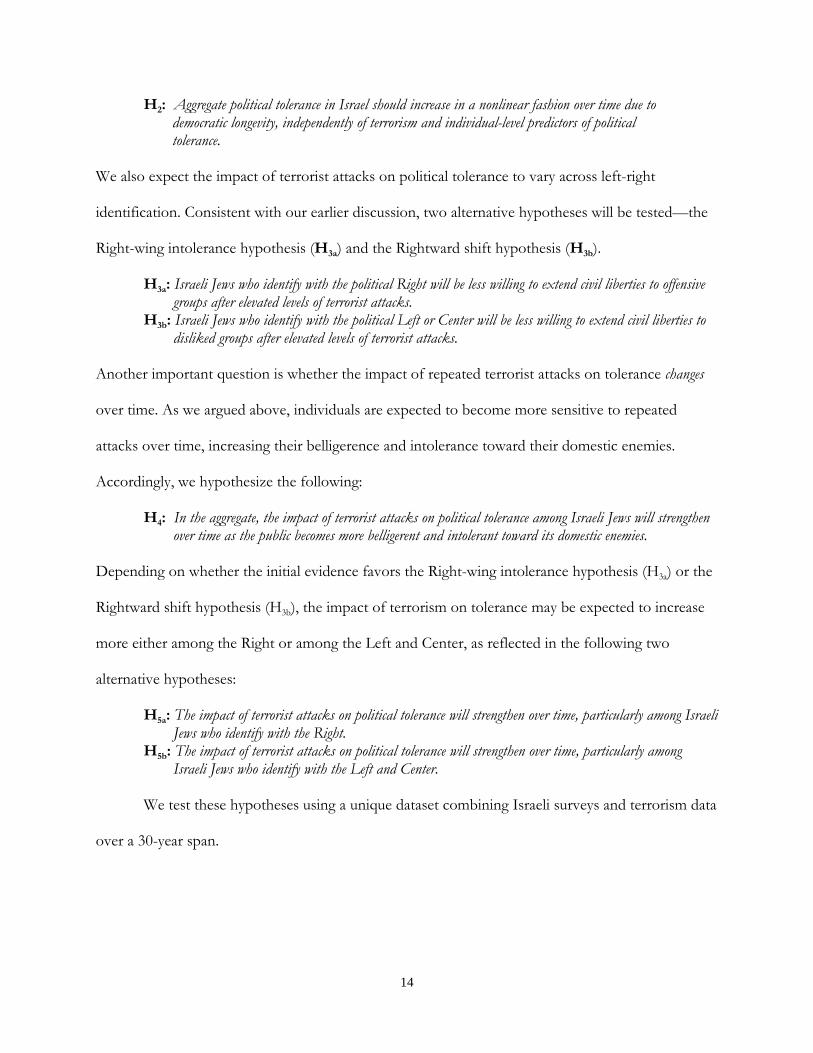
H2: Aggregate political tolerance in Israel should increase in a nonlinear fashion over time due to democratic longevity, independently of terrorism and individual-level predictors of political tolerance.
We also expect the impact of terrorist attacks on political tolerance to vary across left-right
identification. Consistent with our earlier discussion, two alternative hypotheses will be tested—the
Right-wing intolerance hypothesis (H3a) and the Rightward shift hypothesis (H3b).
H3a: Israeli Jews who identify with the political Right will be less willing to extend civil liberties to offensive groups after elevated levels of terrorist attacks.
H3b: Israeli Jews who identify with the political Left or Center will be less willing to extend civil liberties to disliked groups after elevated levels of terrorist attacks.
Another important question is whether the impact of repeated terrorist attacks on tolerance changes
over time. As we argued above, individuals are expected to become more sensitive to repeated
attacks over time, increasing their belligerence and intolerance toward their domestic enemies.
Accordingly, we hypothesize the following:
H4: In the aggregate, the impact of terrorist attacks on political tolerance among Israeli Jews will strengthen over time as the public becomes more belligerent and intolerant toward its domestic enemies.
Depending on whether the initial evidence favors the Right-wing intolerance hypothesis (H3a) or the
Rightward shift hypothesis (H3b), the impact of terrorism on tolerance may be expected to increase
more either among the Right or among the Left and Center, as reflected in the following two
alternative hypotheses:
H5a: The impact of terrorist attacks on political tolerance will strengthen over time, particularly among Israeli Jews who identify with the Right.
H5b: The impact of terrorist attacks on political tolerance will strengthen over time, particularly among Israeli Jews who identify with the Left and Center.
We test these hypotheses using a unique dataset combining Israeli surveys and terrorism data
over a 30-year span.

15
Data, Measures, and Method
Survey Measures
Our survey data consist of 18 surveys administered from 1980 to 2011. Interviews were
conducted either by phone or face-to-face in the respondent’s home with representative samples of
the adult Jewish population. The dates, sample sizes and polling firms of the surveys are reported in
Table A1 of the Appendix.
Political Tolerance. The dependent variable in the analyses below is Political tolerance, classically
defined and measured using the least-liked group approach. Respondents were first asked to select
the group they like the least from a list of political groups (or to suggest a group not on the list).
Respondents were then asked a series of questions regarding their willingness to extend civil liberties
to the selected group. Political tolerance is an additive index formed by summing respondents’ level
of agreement with two 5-point Likert statements on whether their least-liked group should “be
allowed to make a speech on T.V.” and “be allowed to demonstrate,” both of which are
fundamental civil liberties and were repeated in all of the surveys. After recoding, the Political
Tolerance index ranges from low tolerance (0) to high tolerance (8), with 0 indicating strong
disagreement with both statements and 8 representing strong agreement with both.
It is worth noting that in addition to being the only country outside the U.S. where least-
liked measures of political tolerance have been assessed over a long sweep of time, the target groups
typically selected in Israel have a political presence in the country, in parliament and in salient extra-
parliamentary activity.9 Arguably, political forbearance is less hypothetical in Israel than in the U.S.,
9 See Table A4 in the Appendix for a list of least-liked political groups across the surveys. In the most recent 2011 survey, the more "popular" least-liked groups were political parties in the Knesset, including some in the coalition government, such as Shas, Israel Beytenu, Meretz and Arab parties, as well as other salient political (extra-parliamentary) actors such as the Judea Samaria and Gaza Council, the Islamic movement and Peace Now. Consistent with earlier studies (Shamir and Sullivan 1983), the selection of least-liked groups tends to reflect the polarization of Israelis along ideological lines. Across our surveys individuals on the right are more
16
where people typically select groups like the KKK and communists, about which ordinary citizens
have little knowledge or experience (e.g., Sniderman et al. 1989).
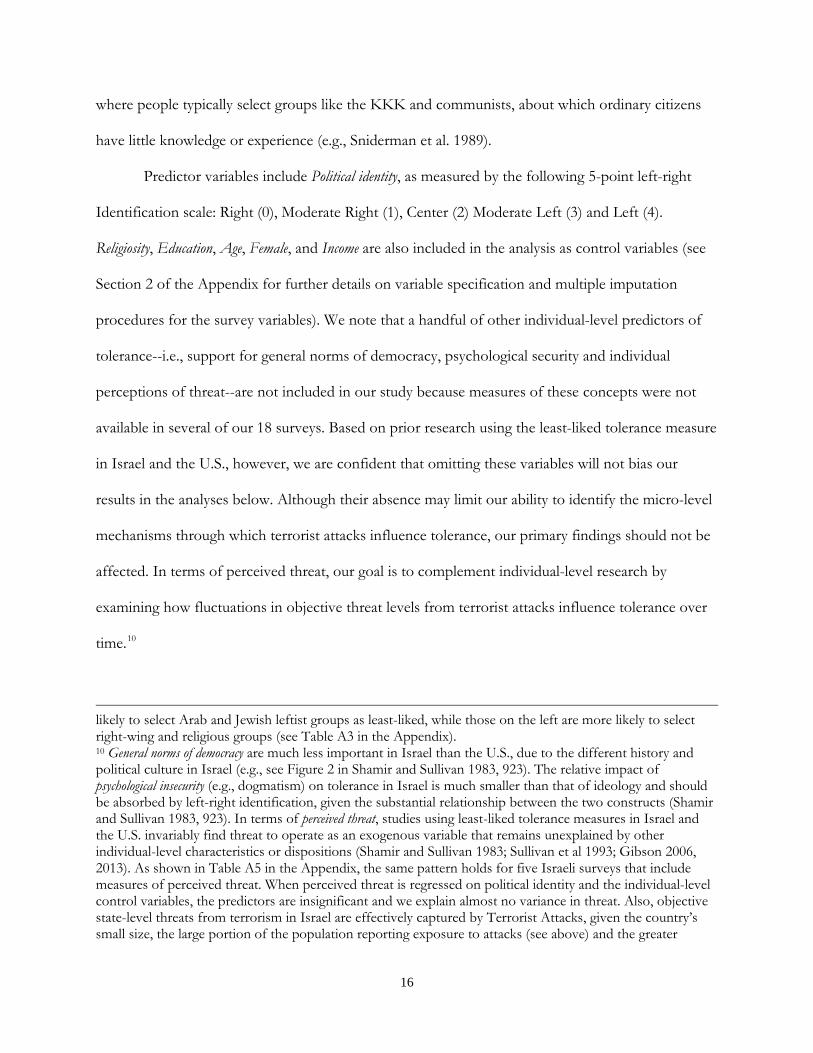
Predictor variables include Political identity, as measured by the following 5-point left-right
Identification scale: Right (0), Moderate Right (1), Center (2) Moderate Left (3) and Left (4).
Religiosity, Education, Age, Female, and Income are also included in the analysis as control variables (see
Section 2 of the Appendix for further details on variable specification and multiple imputation
procedures for the survey variables). We note that a handful of other individual-level predictors of
tolerance--i.e., support for general norms of democracy, psychological security and individual
perceptions of threat--are not included in our study because measures of these concepts were not
available in several of our 18 surveys. Based on prior research using the least-liked tolerance measure
in Israel and the U.S., however, we are confident that omitting these variables will not bias our
results in the analyses below. Although their absence may limit our ability to identify the micro-level
mechanisms through which terrorist attacks influence tolerance, our primary findings should not be
affected. In terms of perceived threat, our goal is to complement individual-level research by
examining how fluctuations in objective threat levels from terrorist attacks influence tolerance over
time.10
likely to select Arab and Jewish leftist groups as least-liked, while those on the left are more likely to select right-wing and religious groups (see Table A3 in the Appendix). 10 General norms of democracy are much less important in Israel than the U.S., due to the different history and political culture in Israel (e.g., see Figure 2 in Shamir and Sullivan 1983, 923). The relative impact of psychological insecurity (e.g., dogmatism) on tolerance in Israel is much smaller than that of ideology and should be absorbed by left-right identification, given the substantial relationship between the two constructs (Shamir and Sullivan 1983, 923). In terms of perceived threat, studies using least-liked tolerance measures in Israel and the U.S. invariably find threat to operate as an exogenous variable that remains unexplained by other individual-level characteristics or dispositions (Shamir and Sullivan 1983; Sullivan et al 1993; Gibson 2006, 2013). As shown in Table A5 in the Appendix, the same pattern holds for five Israeli surveys that include measures of perceived threat. When perceived threat is regressed on political identity and the individual-level control variables, the predictors are insignificant and we explain almost no variance in threat. Also, objective state-level threats from terrorism in Israel are effectively captured by Terrorist Attacks, given the country’s small size, the large portion of the population reporting exposure to attacks (see above) and the greater

17
Macro-Level Measures
Terrorism. Using the GTD data, we constructed a measure of terrorism consisting of the
occurrences of terrorist attacks perpetrated within the internationally-recognized borders of Israel
prior to the surveys, which holds a number of advantages for this study. A particular advantage is
that the data include event counts of several different types of terrorism, including the number of
terrorist attacks, suicide terrorist attacks, civilian deaths from terrorist attacks, and the number of
terrorist attacks that resulted in at least one (non-terrorist) fatality. Because the form of terrorism--
e.g., skyjackings, hostage taking, bombings, assassinations, suicide terrorism, rocket attacks--changed
dramatically over time in Israel, and because some measures, such as fatalities and suicide terrorism
are heavily concentrated in the Second Intifada, the most generic GTD measure, the total number of
attacks prior to the survey, was expected to be the most consistent predictor of political tolerance
over the entire time series. Empirically, this is exactly what we found. As shown in Table A7 of the
Appendix, across different lags, different model specifications and other robustness checks, such as
dropping particular surveys with exceptionally large spikes in attacks or fatalities from the analysis,
the count of the number of terrorist attacks before the survey was consistently the most reliable
predictor of political tolerance over the time series.
We also investigated how long the direct impact of terrorist attacks persisted before the
effects decay. For each type of terrorism described above, we computed three different lags prior to
the start month of the survey: three, six and twelve months. Consistently, across the different types
of attacks, the three month lag had the most powerful impact on Israelis’ political tolerance, which is
in keeping with other studies of terrorism in Israel (e.g., Berrebi and Klor 2008). Therefore, in all the
analyses reported below, we use the number of Terrorist Attacks three months prior to the survey as
importance of perceptions of national versus personal threat for shaping reactions to terrorism (e.g., Huddy and Feldman 2011).

18
our measure of terrorism. It should be noted, however, that while the predominant effect of terrorist
attacks was found to be relatively short-lived, attacks continued to have a significant, albeit greatly
diminished impact on political tolerance for up to a year after their occurrence (the effects of
terrorism decline by about 60% from three months to one year; see Table A7 of the Appendix).
Other Macro Measures. We measure Continuous democracy in months to ensure greater precision and
then convert it to years by dividing by 12 to make the coefficients easier to interpret. Because Israel
has been considered a democracy since its establishment in May 1948, according to Marshall and
Jaggers’ (2012) Polity IV index, our measure is simply the number of years, or fractions thereof,
leading up to the month of the survey, with the date of the first survey serving as the initial point on
the continuous democracy scale that ranges from 0 (December, 1980, the date of our first survey) to
31.4 years (February, 2011, our last survey).11 We also include a quadratic term consisting of the
years of continuous democracy squared to capture what is expected to be a nonmonotonic
relationship. Finally, we include two macro-economic indicators of the performance of Israel’s
economy as control variables, since economic growth could elevate political tolerance while the inflation
rate could depress support for democracy and political tolerance in Israel.12
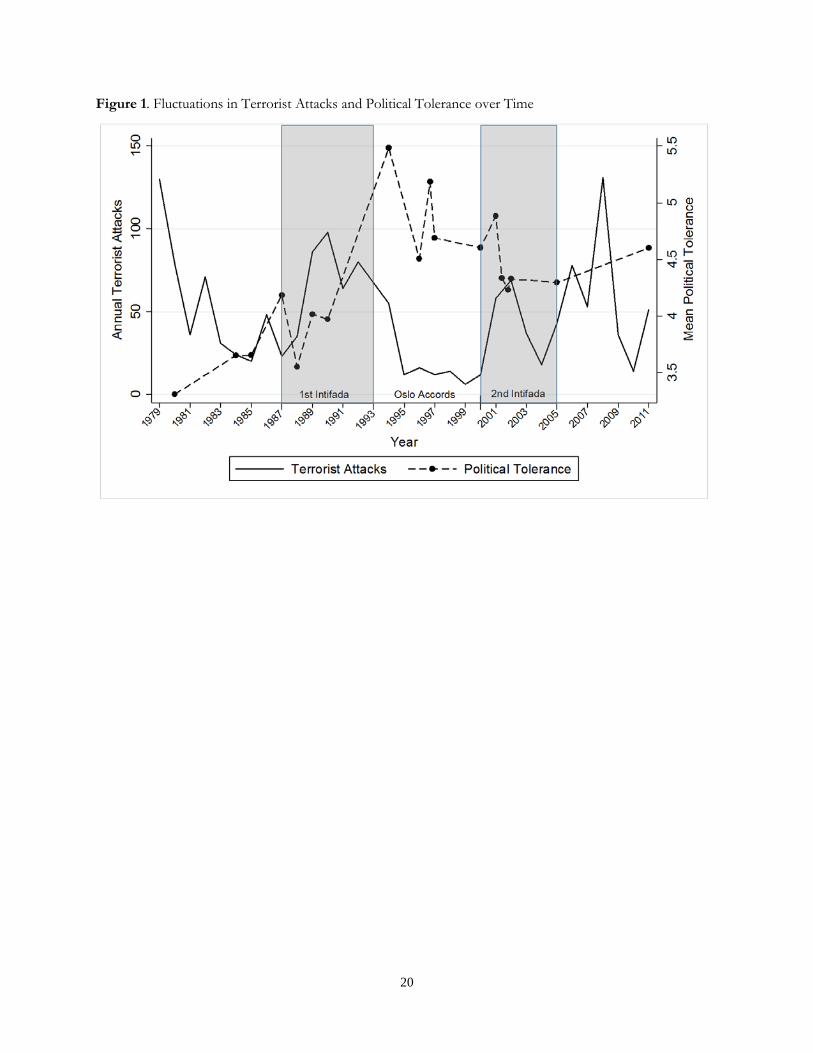
To get a preliminary sense of the sheer magnitude and fluctuation in terrorist attacks over
time in Israel, and how they track with aggregate trends in political tolerance, Figure 1 charts the
total number of terrorist attacks per year in Israel from 1979 to 2010 (the years prior to the first and
last surveys) and the average level of political tolerance across our surveys (1980 to 2011). There is
no question that terrorist attacks in Israel have been chronic and persistent during the three decades
11 Although 1980 is not the start of democracy in Israel, which began 32 years prior in 1948, we use this as the 0 point so the estimates of the intercept in the multilevel models have a meaningful value. Otherwise, the start point of our measure is fairly arbitrary. 12 Both measures are based on annual World Development Indicators for Israel one year prior to the survey (World Bank 2014). Economic Growth is GDP per capita, ranging from 0 to 9.2% in our sample, and Inflation is inflation in consumer prices, ranging from -.4% to 373.8%.
19
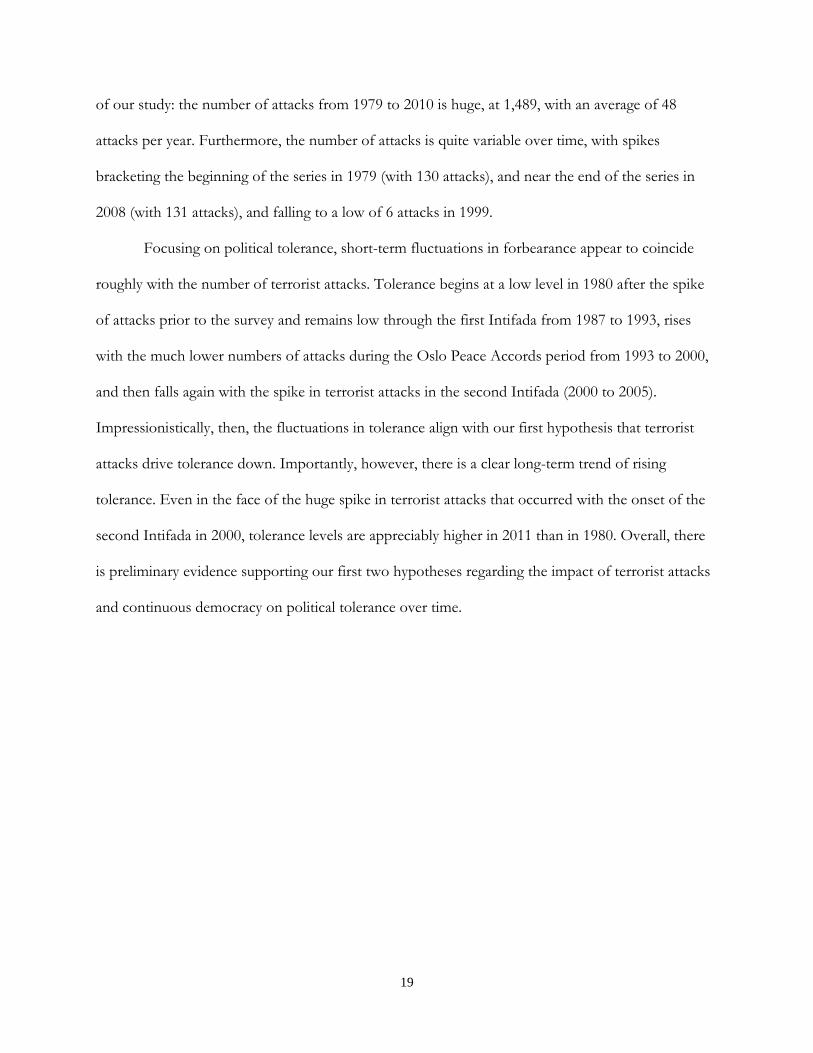
of our study: the number of attacks from 1979 to 2010 is huge, at 1,489, with an average of 48
attacks per year. Furthermore, the number of attacks is quite variable over time, with spikes
bracketing the beginning of the series in 1979 (with 130 attacks), and near the end of the series in
2008 (with 131 attacks), and falling to a low of 6 attacks in 1999.
Focusing on political tolerance, short-term fluctuations in forbearance appear to coincide
roughly with the number of terrorist attacks. Tolerance begins at a low level in 1980 after the spike
of attacks prior to the survey and remains low through the first Intifada from 1987 to 1993, rises
with the much lower numbers of attacks during the Oslo Peace Accords period from 1993 to 2000,
and then falls again with the spike in terrorist attacks in the second Intifada (2000 to 2005).
Impressionistically, then, the fluctuations in tolerance align with our first hypothesis that terrorist
attacks drive tolerance down. Importantly, however, there is a clear long-term trend of rising
tolerance. Even in the face of the huge spike in terrorist attacks that occurred with the onset of the
second Intifada in 2000, tolerance levels are appreciably higher in 2011 than in 1980. Overall, there
is preliminary evidence supporting our first two hypotheses regarding the impact of terrorist attacks
and continuous democracy on political tolerance over time.
20
Figure 1. Fluctuations in Terrorist Attacks and Political Tolerance over Time

21
Method
A true test of our hypotheses, of course, requires estimation of a series of multilevel models,
an appropriate method given the multilevel structure of our data and the goals of our analysis
(Steenbergen and Jones 2002). Typically, multilevel models evaluate the effect of contextual
conditions on individual-level behavior using spatial differentiation (i.e., countries, regions and
states). In this case, however, individuals are nested within surveys conducted at different points in
time. Since our aim is to assess the impact of macro-level variables (e.g., terrorist attacks) and
individual-level attributes (e.g., left-right identification) and their interaction on political tolerance
that varies both within and across surveys, ignoring the multilevel nature of our data would lead to
statistical and inferential errors. We therefore rely on multilevel statistical techniques that model the
macro-level and individual-level jointly and estimate separate variance structures to produce
unbiased standard errors (Raudenbush and Bryk 2002).13
Multilevel models also “provide a more theoretically satisfying way of dealing with temporal
heterogeneity in pooled public opinion data” (Kertzer 2013, 231). Political scientists most commonly
account for time by using year fixed-effects for each survey (Beck et al.1998), but that approach is
inappropriate in this case because it treats time as problematic whereas we want to model time
explicitly by including macro-level characteristics (e.g., terrorist attacks) that change over time. Thus,
multilevel models are an especially appropriate and flexible method for our purposes because not
only do they avoid bias, but they allow both intercepts and slopes (of individual attributes) to vary
13 See Section 4 of the Appendix for an extended discussion of the appropriateness of multilevel modeling techniques, an assessment of the relative goodness of fit for alternative estimated models as well as the equations of the models estimated.
22
over time, and allow macro-level variables to explain why the effects of micro-level variables vary
across time (Luke 2004).14
Results
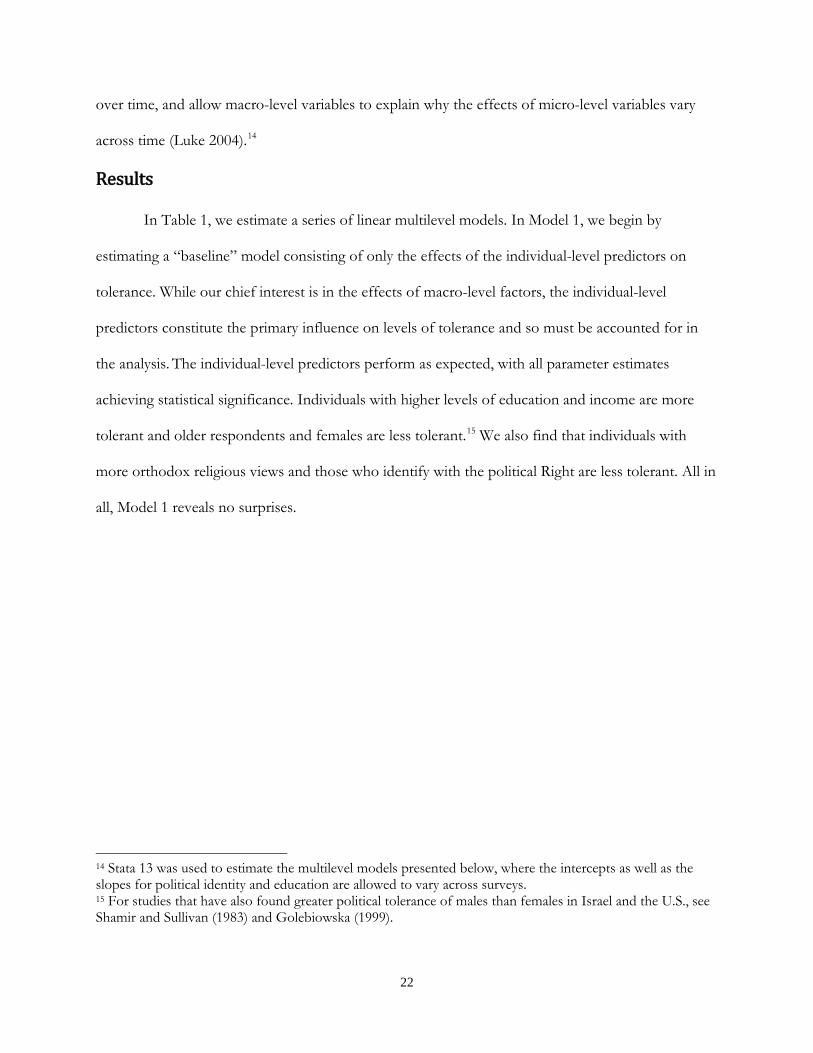
In Table 1, we estimate a series of linear multilevel models. In Model 1, we begin by
estimating a “baseline” model consisting of only the effects of the individual-level predictors on
tolerance. While our chief interest is in the effects of macro-level factors, the individual-level
predictors constitute the primary influence on levels of tolerance and so must be accounted for in
the analysis. The individual-level predictors perform as expected, with all parameter estimates
achieving statistical significance. Individuals with higher levels of education and income are more
tolerant and older respondents and females are less tolerant.15 We also find that individuals with
more orthodox religious views and those who identify with the political Right are less tolerant. All in
all, Model 1 reveals no surprises.
14 Stata 13 was used to estimate the multilevel models presented below, where the intercepts as well as the slopes for political identity and education are allowed to vary across surveys. 15 For studies that have also found greater political tolerance of males than females in Israel and the U.S., see Shamir and Sullivan (1983) and Golebiowska (1999).
23
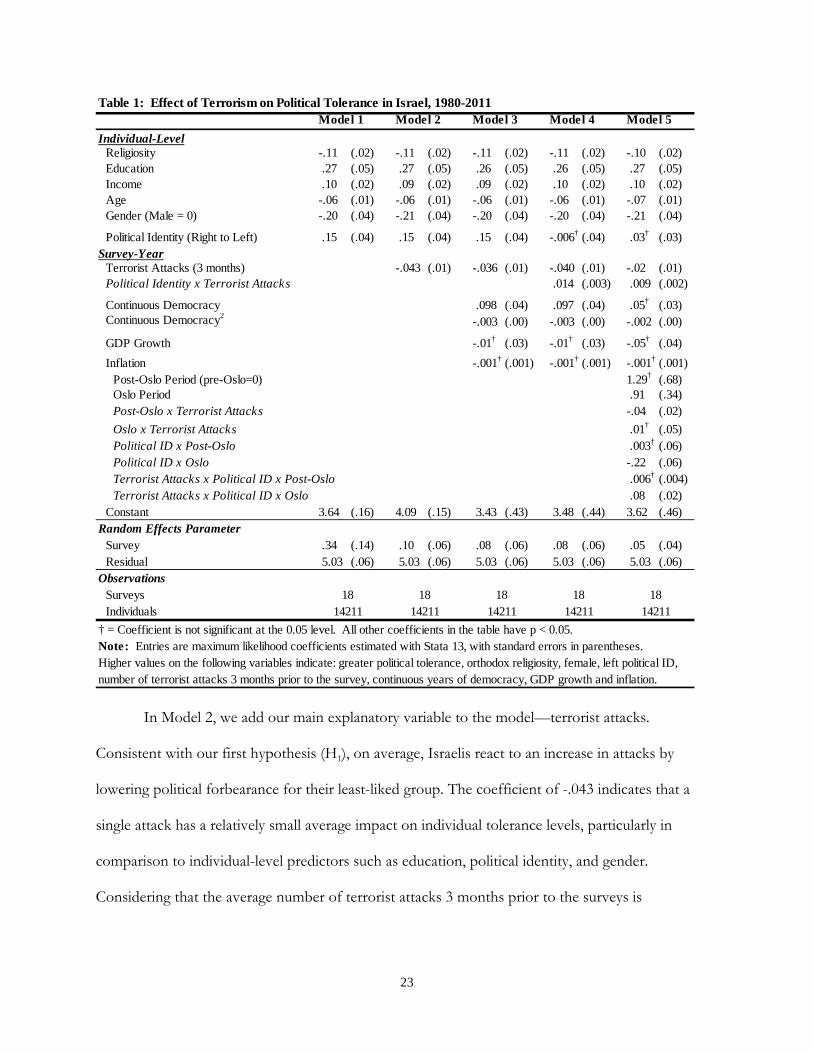
In Model 2, we add our main explanatory variable to the model—terrorist attacks.
Consistent with our first hypothesis (H1), on average, Israelis react to an increase in attacks by
lowering political forbearance for their least-liked group. The coefficient of -.043 indicates that a
single attack has a relatively small average impact on individual tolerance levels, particularly in
comparison to individual-level predictors such as education, political identity, and gender.
Considering that the average number of terrorist attacks 3 months prior to the surveys is
Table 1: Effect of Terrorism on Political Tolerance in Israel, 1980-2011Model 1 Model 2 Model 3 Model 4 Model 5
Individual-LevelReligiosity -.11 (.02) -.11 (.02) -.11 (.02) -.11 (.02) -.10 (.02)Education .27 (.05) .27 (.05) .26 (.05) .26 (.05) .27 (.05)Income .10 (.02) .09 (.02) .09 (.02) .10 (.02) .10 (.02)Age -.06 (.01) -.06 (.01) -.06 (.01) -.06 (.01) -.07 (.01)Gender (Male = 0) -.20 (.04) -.21 (.04) -.20 (.04) -.20 (.04) -.21 (.04)
Political Identity (Right to Left) .15 (.04) .15 (.04) .15 (.04) -.006† (.04) .03† (.03)Survey-Year
Terrorist Attacks (3 months) -.043 (.01) -.036 (.01) -.040 (.01) -.02 (.01)Political Identity x Terrorist Attacks .014 (.003) .009 (.002)
Continuous Democracy .098 (.04) .097 (.04) .05† (.03)Continuous Democracy2 -.003 (.00) -.003 (.00) -.002 (.00)
GDP Growth -.01† (.03) -.01† (.03) -.05† (.04)Inflation -.001† (.001) -.001† (.001) -.001† (.001)
Post-Oslo Period (pre-Oslo=0) 1.29† (.68)Oslo Period .91 (.34)Post-Oslo x Terrorist Attacks -.04 (.02)Oslo x Terrorist Attacks .01† (.05)Political ID x Post-Oslo .003† (.06)Political ID x Oslo -.22 (.06)Terrorist Attacks x Political ID x Post-Oslo .006† (.004)Terrorist Attacks x Political ID x Oslo .08 (.02)
Constant 3.64 (.16) 4.09 (.15) 3.43 (.43) 3.48 (.44) 3.62 (.46)Random Effects Parameter
Survey .34 (.14) .10 (.06) .08 (.06) .08 (.06) .05 (.04)Residual 5.03 (.06) 5.03 (.06) 5.03 (.06) 5.03 (.06) 5.03 (.06)
ObservationsSurveysIndividuals
† = Coefficient is not significant at the 0.05 level. All other coefficients in the table have p < 0.05.Note: Entries are maximum likelihood coefficients estimated with Stata 13, with standard errors in parentheses. Higher values on the following variables indicate: greater political tolerance, orthodox religiosity, female, left political ID, number of terrorist attacks 3 months prior to the survey, continuous years of democracy, GDP growth and inflation.
14211 14211 14211 14211 1421118 18 18 18 18

24
approximately 10 and for a third of our surveys the number is close to 20, however, the overall
impact of terrorist attacks is substantial.
Continuous Democracy. In Model 3, we add our nonlinear measure of continuous democracy,
where we find the first-order and quadratic term coefficients to be statistically significant. In this
model and those that follow, continuous democracy has a strong positive effect on tolerance over
time, and does not seriously undercut the impact of terrorist attacks on political tolerance.16
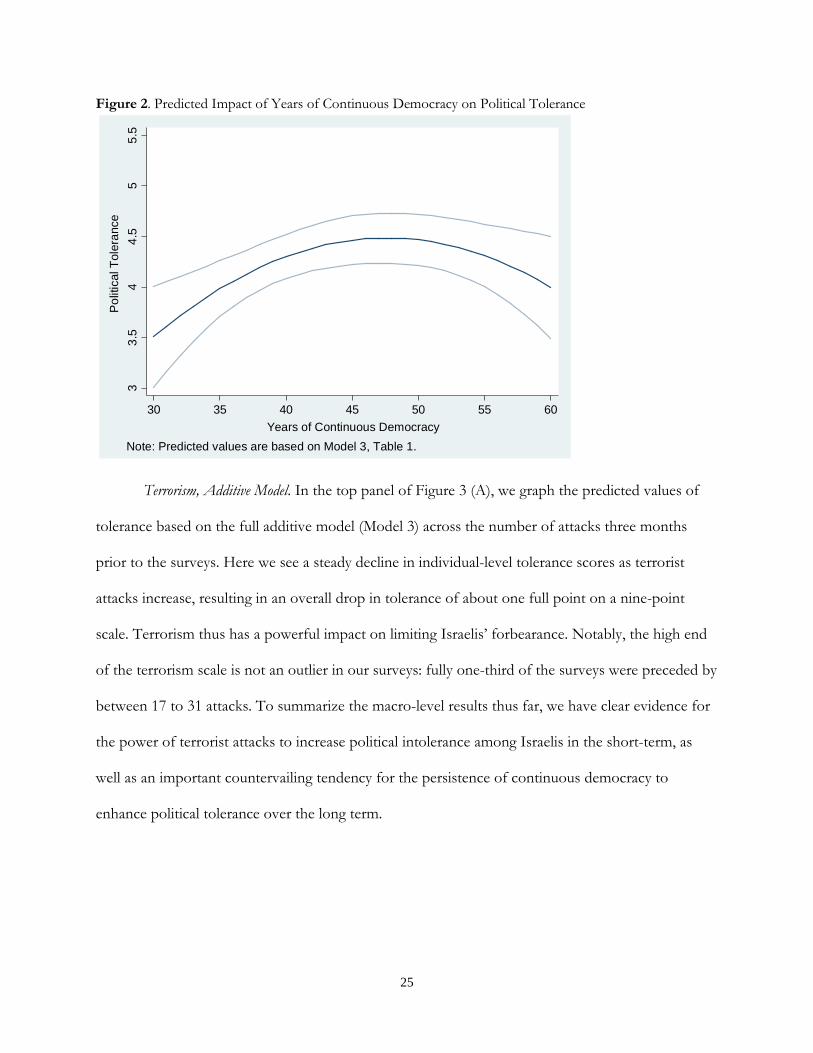
In Figure 2, we display the predicted impact of continuous democracy on individual political
tolerance levels, based on the Model 3 estimates in Table 1.17 Consistent with the quadratic
specification, political tolerance increases more rapidly earlier in the time series with smaller
incremental growth in tolerance later in the series, before leveling off and making a slight downward
turn. The fact that overall tolerance did not return to the lower level of the early 1980s following the
2nd Intifada is supportive of the democratic learning hypothesis (H2). At a minimum, it strongly
suggests that individual tolerance is affected by more than just terrorism and is subject to
countervailing macro-level factors.
16 Model 3 also adds the two state-level economic variables, GDP growth and Inflation, the coefficients of which are small and insignificant, even after experimentation with logged and quadratic measures, probably because the effects of economic performance on tolerance are filtered through continuous democracy. In addition, as described in Table A8, Section 6 of the Appendix, the results in Models 3 and 4 are unaffected by the addition of various measures of international militarized threats to Israel, and none of the measures of militarized interstate disputes (MIDs) are statistically significant. 17 We recoded the continuous democracy scale in the figure to accurately reflect the number of years that Israel has been a democracy by adding 32 years to our measure.
25
Figure 2. Predicted Impact of Years of Continuous Democracy on Political Tolerance
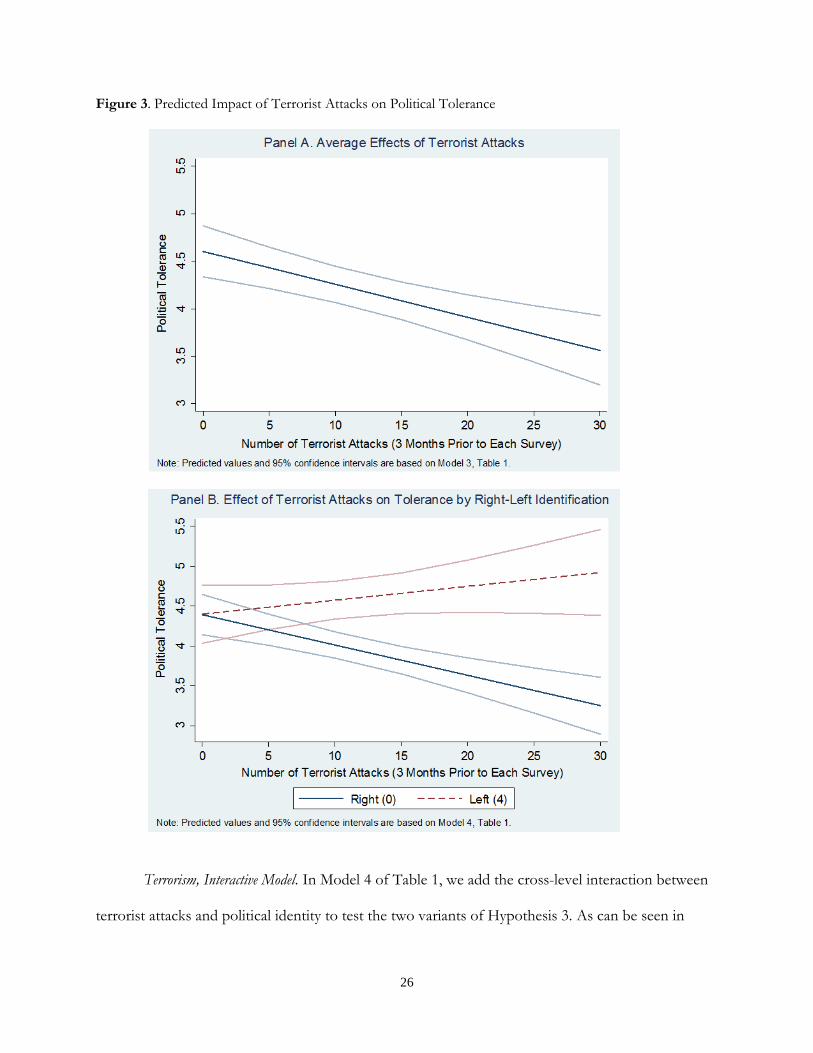
Terrorism, Additive Model. In the top panel of Figure 3 (A), we graph the predicted values of
tolerance based on the full additive model (Model 3) across the number of attacks three months
prior to the surveys. Here we see a steady decline in individual-level tolerance scores as terrorist
attacks increase, resulting in an overall drop in tolerance of about one full point on a nine-point
scale. Terrorism thus has a powerful impact on limiting Israelis’ forbearance. Notably, the high end
of the terrorism scale is not an outlier in our surveys: fully one-third of the surveys were preceded by
between 17 to 31 attacks. To summarize the macro-level results thus far, we have clear evidence for
the power of terrorist attacks to increase political intolerance among Israelis in the short-term, as
well as an important countervailing tendency for the persistence of continuous democracy to
enhance political tolerance over the long term.
33.
54
4.5
55.
5P
oliti
cal T
oler
ance
30 35 40 45 50 55 60Years of Continuous Democracy
Note: Predicted values are based on Model 3, Table 1.
26
Figure 3. Predicted Impact of Terrorist Attacks on Political Tolerance
Terrorism, Interactive Model. In Model 4 of Table 1, we add the cross-level interaction between
terrorist attacks and political identity to test the two variants of Hypothesis 3. As can be seen in

27
Table 1, the coefficient for the multiplicative term is highly significant. The bottom panel of Figure 3
(B) presents the predicted values for the effect of terrorist attacks on political tolerance among
Israelis on the right (at point 0 on the political identity scale) and the left (at point 4), based on the
results in Model 4. Their differential reactions to terrorist attacks are striking. For those on the right,
terrorist attacks drive political tolerance sharply downward. But for the most leftist citizens, there is
an opposite tendency to respond to terrorist attacks with greater political tolerance, although the
effect is not statistically significant at conventional levels (p = .10, two-tailed). Berrebi and Klor
(2008) found a similar tendency for terrorism to polarize the voting preferences of Israelis along
ideological lines.
Our findings clearly fit the Right-wing intolerance version of Hypothesis 3 (H3a). On
average, when terrorist attacks increase in Israel, the political Right has consistently taken a more
hardline position against its domestic enemies by opposing their right to basic political freedoms,
such as the freedom to demonstrate or express their views in the public sphere. In fact, our analysis
shows that the increased intolerance following terrorist attacks in Israel is due primarily to the
reactions of those on the right. Terrorism significantly precipitates intolerance only among Israelis
who identify themselves as “Right” (p < .001, 2-tailed) and “Moderate Right” (p < .001), but not the
“Center” (p = .29), the “Moderate Left” (p = .57) or “Left” (p = .10). In other words, across a
broad sweep of time in Israel, we find no evidence for the “Rightward shift” hypothesis (H3b); those
on the left do not appear to become less tolerant.
Another Test of the Rightward Shift Hypothesis. It could be argued that a better test of the
rightward shift hypothesis comes after major increases in terrorist attacks, like the upsurge in attacks
during the first or second Intifadas. Hetherington and Weiler (2009, 192), for example, refer to a
“high profile terrorist attack” as the kind of circumstances more likely to result in a rightward shift
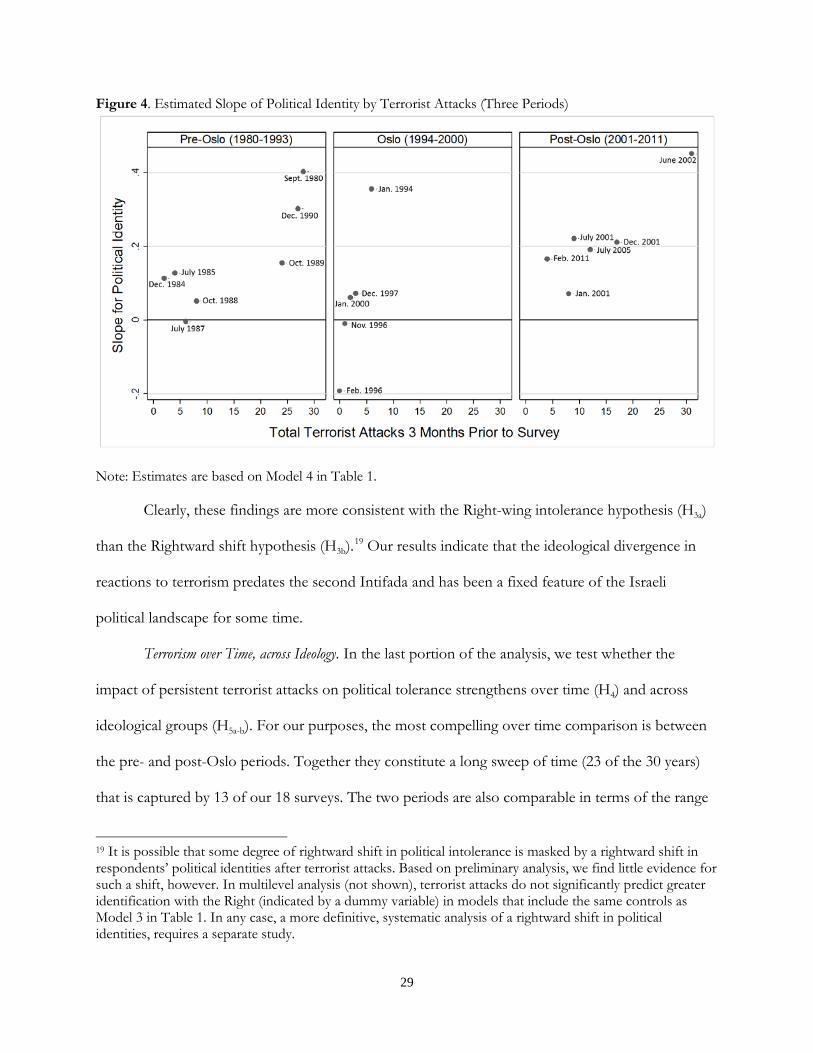
from individuals not on the right. To examine this possibility, Figure 4 plots terrorist attacks versus

28
the estimated slopes for political identity in the individual surveys (based on Model 4) across three
distinct periods in Israel’s history when the number of attacks varied substantially: the pre-Oslo
period (1980 to 1993), when terrorist attacks ranged from 4 to 28, the Oslo period (1994 to 2000),
when attacks were uniformly infrequent (from 0 to 6), and the post-Oslo period (2001 to 2011),
which resembles the pre-Oslo period in the frequency of terrorist attacks, ranging from 4 to 31.
Given the coding of political identity from Right to Left, support for the right-wing
intolerance hypothesis would be indicated by positive slopes of political identity becoming stronger
after an increase in terrorist attacks. By contrast, support for the rightward shift hypothesis--where
the left becomes more intolerant after a series of attacks, would be indicated by negative (or
substantially less positive) slopes in surveys preceded by a larger number of attacks. As can be seen
in the figure, however, in almost all the surveys, those on the right express less tolerance than those
on the left—i.e., the slope for political identity is positive. And while the relationship is not perfect,
there is a clear tendency for the positive slope of political identity to strengthen, not weaken, in
surveys preceded by an upsurge of terrorist attacks in the pre-Olso period (e.g., 1980, 1989, and
1990) and the post-Oslo period (e.g., Dec. 2001 and June 2002). By contrast, in the Oslo period,
with much lower variability and frequency of terrorist attacks, there is very little relationship between
the number of attacks and the slope of political identity.18
18 In the Oslo period, the slopes for two surveys require some context. The January 1994 survey was the first survey after the signing of the Oslo Declaration of Principles by Israel and the PLO on September 13, 1993--a highly threatening event for the Israeli Right. The February 1996 survey went into the field three months after Prime Minister Yitzhak Rabin was assassinated on November 4, 1995 by a right-wing extremist after considerable right-wing dissent over the Oslo peace process. The negative coefficient for political identity indicates that individuals on the left were more intolerant toward their least-liked group, a large percentage of which were on the right after the Rabin assassination.
29
Figure 4. Estimated Slope of Political Identity by Terrorist Attacks (Three Periods)
Note: Estimates are based on Model 4 in Table 1. Clearly, these findings are more consistent with the Right-wing intolerance hypothesis (H3a)
than the Rightward shift hypothesis (H3b).19 Our results indicate that the ideological divergence in
reactions to terrorism predates the second Intifada and has been a fixed feature of the Israeli
political landscape for some time.
Terrorism over Time, across Ideology. In the last portion of the analysis, we test whether the
impact of persistent terrorist attacks on political tolerance strengthens over time (H4) and across
ideological groups (H5a-b). For our purposes, the most compelling over time comparison is between
the pre- and post-Oslo periods. Together they constitute a long sweep of time (23 of the 30 years)
that is captured by 13 of our 18 surveys. The two periods are also comparable in terms of the range
19 It is possible that some degree of rightward shift in political intolerance is masked by a rightward shift in respondents’ political identities after terrorist attacks. Based on preliminary analysis, we find little evidence for such a shift, however. In multilevel analysis (not shown), terrorist attacks do not significantly predict greater identification with the Right (indicated by a dummy variable) in models that include the same controls as Model 3 in Table 1. In any case, a more definitive, systematic analysis of a rightward shift in political identities, requires a separate study.

30
and the average number of terrorist attacks occurring three months prior to the surveys (at 13.9 and
12.9 attacks, respectively), and the fact that both periods include an organized terrorist campaign,
namely the first and second Intifadas.
Given the strong support for the Right-wing intolerance hypothesis in prior analyses, it
makes sense to focus our attention on Hypothesis 5a, which predicts a greater over-time increase in
sensitivity to terrorism among the right wing. Accordingly, Model 5 includes three-way interactions
between terrorism, political identity and two period dummies, Oslo and post-Oslo, with pre-Oslo as
the excluded category, in addition to lower-order terms. 20 Although the three-way interaction, Post-
Oslo x Terrorist Attacks x Political Identity, is not significant (p = .19), a more precise test of H5a finds
support in the significant coefficient for Post-Oslo x Terrorist Attacks (-.04), which gives the difference
in the effect of terrorist attacks across the pre-and post-Oslo periods only for those on the Right
(where Political Identity = 0).
20 The random coefficient allowing the effects of political identity to vary over time was dropped, since it was no longer significant once the period effects were included in the model.
31
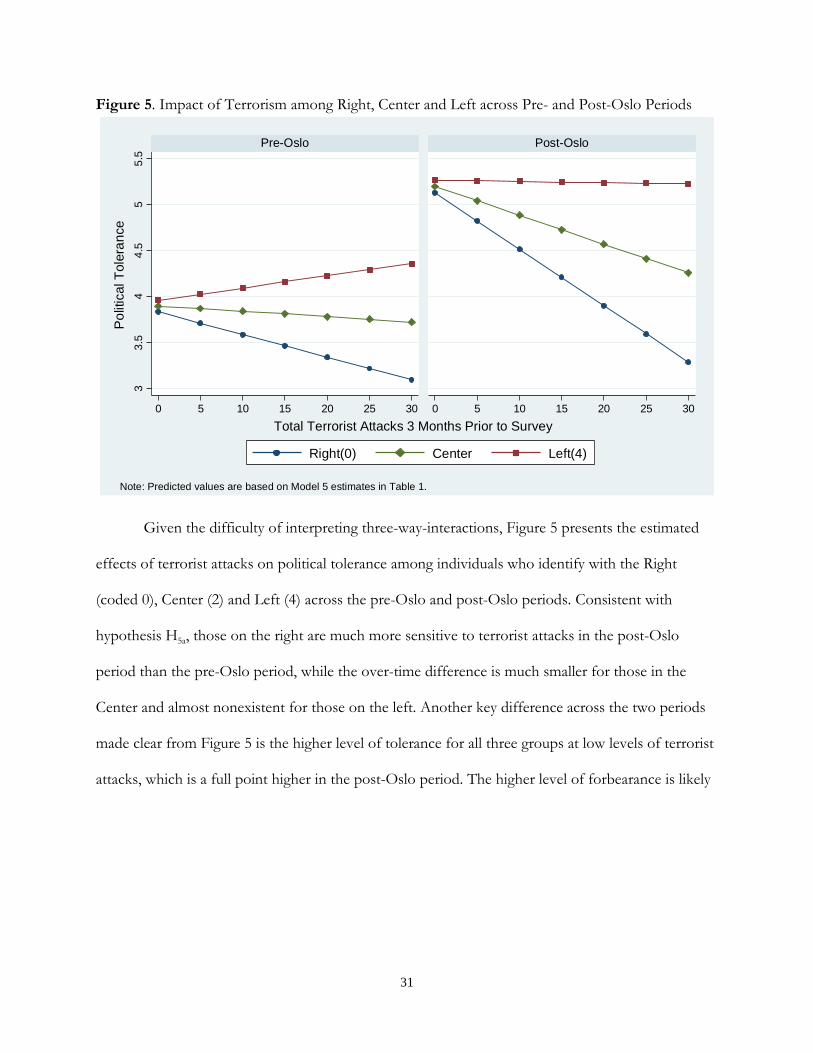
Figure 5. Impact of Terrorism among Right, Center and Left across Pre- and Post-Oslo Periods
Given the difficulty of interpreting three-way-interactions, Figure 5 presents the estimated
effects of terrorist attacks on political tolerance among individuals who identify with the Right
(coded 0), Center (2) and Left (4) across the pre-Oslo and post-Oslo periods. Consistent with
hypothesis H5a, those on the right are much more sensitive to terrorist attacks in the post-Oslo
period than the pre-Oslo period, while the over-time difference is much smaller for those in the
Center and almost nonexistent for those on the left. Another key difference across the two periods
made clear from Figure 5 is the higher level of tolerance for all three groups at low levels of terrorist
attacks, which is a full point higher in the post-Oslo period. The higher level of forbearance is likely
33.
54
4.5
55.
5
0 5 10 15 20 25 30 0 5 10 15 20 25 30
Pre-Oslo Post-Oslo
Right(0) Center Left(4)
Pol
itica
l Tol
eran
ce
Total Terrorist Attacks 3 Months Prior to Survey
Note: Predicted values are based on Model 5 estimates in Table 1.
32
attributable to two factors— democratic longevity and the relative absence of terrorist attacks during
the Oslo period.21
The slopes for terrorist attacks for each of the three groups in the figure provide a sense of
the magnitude of change, or lack thereof, across the two periods. Those on the right in the post-
Oslo period show the strongest reaction at higher levels of terrorist attacks and therefore the
steepest descent in forbearance. The post-Oslo slope for right wingers is more than twice as large as
the pre-Oslo slope (b = -.057 [se = .19] versus b = -.02 [se = .01], respectively). By contrast, those
on the left do not respond strongly to high levels of terrorism in either period (neither effect is
significant), while the impact of terrorist attacks among centrists is only significant in the post-Oslo
period (b = -.03) at the .10 level.
To summarize, those on the right (and to a much lesser extent centrists) are clearly more
sensitive to persistent terrorist attacks in the post-Oslo period. In contrast to those on the left, who
appear to maintain the higher levels of political forbearance gained over time between the pre- and
post-Oslo periods, right wingers exposed to high levels of attacks in the latter period appear to
abandon any good will they may have acquired toward their least-liked group. Thus, as is true for the
entire time-series (Figure 3.B), the greater impact of terrorism in the post-Oslo period is primarily
due to reactions of individuals on the right. On the other hand, the maintenance of higher levels of
tolerance in the face of persistent terrorism in the post-Oslo period is due mostly to leftists and, to a
lesser extent, centrists.
Perhaps the greater sensitivity of right wingers is due to their greater tendency to select least-
liked groups they (mistakenly) associate with terrorism, i.e., Arab groups (see Note 9 and Table A3
of the Appendix). Further analysis (not shown) casts doubt on this explanation, however. In fact, the
21 In addition, as suggested by an anonymous reviewer, high tolerance in the Oslo period may be due, in part, to the hopeful climate of opinion after the Oslo Accord was signed in 1993, while some of the decline in tolerance after the signing may be due to decreased faith in the peace process as it progressed.
33
impact of terrorism on tolerance among the Right does not differ significantly when right wingers
select Arab versus non-Arab (mostly Jewish left-wing) groups in either the pre-Oslo or post-Oslo
period.22 Interestingly, for leftists and centrists, it is only in the pre-Oslo period that the impact of
terrorism on tolerance is greater when Arab versus non-Arab groups are selected as least-liked.
These differences vanish in the post-Oslo period.23
The broader implications of these results are discussed in the conclusions. For now, we
underline the important finding that the impact of terrorism on tolerance in Israel is driven primarily
by its Jewish citizens on the right. Whether we focus on the average impact of terrorism across the
30 years of our study or the stronger influence of persistent terrorism in the post-Oslo period,
terrorism drives down forbearance primarily among individuals who identify with the Right. Thus,
the evidence tilts decidedly toward the Rightwing intolerance hypothesis.
Conclusions
Research over the past decade has made remarkable progress in elevating our understanding
of how terrorism moves mass behavior in democracies. Ours is the first study to take on an
important but neglected question: To what degree do persistent terrorist attacks erode public support
for political tolerance—i.e., granting basic civil liberties and political freedoms to one’s domestic
enemies? This is a critical question for the health and the very survival of democracies because 22 The multilevel model includes 4-way interactions between terrorist attacks, political identity, the two period dummies (post-Oslo and Oslo), and a dummy variable indicating whether the selected least-liked group is Arab or not, as well as associated lower-order terms. Among those on the right, the estimated slopes for terrorism in the pre-Oslo period are -.017 (se = .007) for those selecting non-Arab groups and -.025 (se = .006) if an Arab group was selected. In the post-Oslo period, analogous estimates are -.038 (se = .017) for non-Arab and -.046 (se = .016) for Arab groups. Neither difference across the type of target group is close to being significant. 23 Another possible explanation why those on the right are more sensitive to terrorism in the post-Oslo period is that fatalities from suicide terrorist attacks rose dramatically during the second Intifada. However, as demonstrated in Section 5 of the Appendix, the impact of fatalities on political tolerance is entirely dependent on a single survey in the post-Oslo period when the number of fatalities before the June, 2002 survey rose dramatically. When this survey is dropped from the analysis, the impact of fatalities for the entire time-series and the post-Oslo period becomes insignificant, which suggests the impact of fatalities on tolerance was especially short-lived.

34
persistent attacks over time challenge the public’s commitment to democratic values and institutions.
Israel has proved to be an excellent case for examining this question longitudinally, with sharp ups
and downs in both terrorism and forbearance for least-liked groups that have a real political
presence in the country. Not only is Israel’s experience relevant to the dozen or so other
democracies under threat from severe terrorism around the world, it also provides one of the few
cases where it is possible to evaluate the generalizability of hypotheses from tolerance studies in the
U.S. in a setting of persistent terrorism.
Prior research in the U.S. clearly shows that threat from terrorism increases public support
for restrictive counterterrorism policies. Our study moves beyond this research by demonstrating
that fluctuations in actual terrorist attacks over a 30 year period in Israel are strongly associated with the rise and fall
of political tolerance measured by the least liked method. Persistent and chronic terrorism has a powerfully
corrosive effect in undermining public support for the application of democratic norms and
minority rights. This is an important result because political intolerance has profound political
consequences for democracies, contributing to a culture of political conformity and the enactment
of politically repressive policies toward unpopular groups (Gibson 2006, 2008). Tragically, the
domestic groups that experience the greatest political discrimination and restrictions on their
political freedoms tend to be “fellow travelers” who pose no real security threat to the state: Muslim
Americans after 9/11 in the U.S. and Arab citizens of Israel throughout its history.
While we found the primary force of terrorism on tolerance to be relatively short-lived--
captured best by a three month lag prior to the surveys, we also found that despite decaying after
three months, attacks continued to have a significant, albeit diminished, impact on tolerance for up
to a year after their occurrence. In addition to these direct effects of terrorism on forbearance, more
indirect and long-lasting influences are also possible, even likely. We know, for example, that
terrorism encourages a rightward shift in Israeli voting behavior (Berrebi and Klor 2008; Getmansky
35
and Zeitzoff 2014), often bringing to power a right-wing government committed to curtailing the
civil liberties of its domestic enemies. Moreover, if terrorism also produces a rightward shift in
political identification, its effects could produce a more enduring shift in the balance of power in
Israel. Our preliminary analysis found little evidence for such a shift (see Note 19), but a more
definitive assessment requires a separate investigation. Regardless, we know from studies in the U.S.
that public concern about terrorism remained high years after 9/11, and merely raising the salience
of terrorism can increase support for counterterrorism policies and intolerant attitudes (e.g., Brooks
and Manza 2013; Malhotra and Popp 2012; Merolla and Zechmeister 2009). It stands to reason that
chronic terrorism likely creates a context that allows elites to stoke public fears even longer.
Beyond revealing the impact of terrorism on forbearance in the near-term, our study also
uncovered important evidence for the long-term resilience of democratic commitments in the face
of chronic terrorism. Consistent with the democratic learning hypothesis, we found that years of
continuous democracy in Israel increased the level of political tolerance over time, and even in the
aftermath of the second Intifada overall tolerance did not return to the low levels of the early 1980s.
Our results thus speak volumes about the ability of democracies to sustain themselves, even though
chronic terrorism constitutes a real, ongoing danger to democratic quality and even survival.
To be sure, the outcome of the push of democratic forces in Israel against the strong pull of
intractable conflict and threat is in no way inevitable. Although Israel as well as several other
democracies beset with chronic terrorism (e.g., India, Spain and Northern Ireland) sustained a
commitment to democracy, not every democracy survives the strain of chronic threat. Among the
top 25 targeted countries, a slew of emerging democracies --Peru, Pakistan, Russia, Sri Lanka,
Turkey, and Thailand--suffered a democratic reversal (i.e., became non-democratic) during the time
period of our study. Of those reversals, only Peru and Turkey returned to and remained a
democracy.
36
The democratic reversal in Peru in 1992 after only a decade of democratic government
provides a useful contrast. Like Israelis, Peruvians faced pervasive terrorist threat since the start of
their democracy in 1980, with violence escalating for the next twelve years when, in 1992, Peru’s
President Fujimori announced his autogolpe (self-coup) that suspended democratic governance and
instituted authoritarian rule that lasted until 2000, a move he claimed was necessary to restore
security (see Arce 2003). By contrast, in the early nineties, Israel had been a democracy for over 40
years and the "Constitutional Revolution" had further established the independence of its judiciary, a
critical institution for democratic learning.
Additional research is necessary to identify the mechanisms that underlie democratic
longevity -- be they democratic socialization practices, institutions such as an independent judiciary,
or historical cultural factors such as a liberal legacy. A much needed complementary strategy to our
multi-level analysis of survey data would undertake comparative studies of the dynamics of the push
and pull of democratic longevity and terrorism, as well as other factors that elevate or depress
political tolerance over time in resilient versus deteriorating or defunct democracies.
Another key finding of our study is that the impact of terrorism on political tolerance works
primarily through the responses of those on the right, whose forbearance in Israel was far more
likely to be stymied by terrorist attacks than those on the left. In fact, much of the downturn in
tolerance occurring after an upsurge in terrorist attacks in Israel was due to the reactions of
individuals on the right moving toward intolerance. Our investigation of change in the impact of
terrorism on tolerance across the pre- and post-Oslo periods turned up similar results. Even if
individuals habituate themselves to chronic terrorism in their daily lives, we found that many Israelis,
particularly those on the right, became more, not less sensitive to terrorist attacks in the post-Oslo
period, compared with the pre-Oslo period. Thus, the downturn in tolerance that occurred with the
onset of the second Intifada (Figure 1) occurred primarily because right wingers became more
37
intolerant toward their domestic enemies—mostly Arab and Jewish leftist groups. Forbearance
among left wingers, on the other hand, appeared more resilient to the attacks of the post-Oslo
period.
Thus, our findings consistently line up in support of the Right-wing intolerance hypothesis
(H3a, H5a) but not the Rightward shift hypothesis (H3b, H5b). The convergence between our results and
those from experimental studies in the U.S. (e.g., Merolla and Zechmeister 2009) is revealing, but
further research should examine more closely the limiting conditions of the Rightward shift
hypothesis in the U.S. and other countries (e.g., Malhotra and Popp 2012).24
Although the Right-wing intolerance hypothesis is based on a bedrock of cross-national
research, it is also worth noting how Israeli politics influences the responses of those on the right.
As noted, terrorism in Israel is anchored in the Palestinian-Israeli conflict, as it is perpetrated mostly
by Palestinians from the occupied territories. Consequently, beyond its immediate physical danger,
terrorism also triggers a threat to Jewish national identity, which is valued more by the Right than
the Left (Shamir and Arian 1994), increasing the association between terrorism and Israeli Arabs
(and, thus, Arab groups as well as Jewish left-wing groups) among individuals on the right. As noted
earlier, there is every incentive for Israeli politicians, particularly those on the right who clearly
“own” the issues of national security and terrorism, to use fear to manipulate the public for political
gains and for justifying the repression of the Arab/Palestinian minority. The role of elite political
rhetoric in stoking fears of terrorism and political intolerance in Israel and elsewhere clearly requires
further study (see Lupia and Menning 2009).
While the reactions of those on the right are consistent with the Right-wing Intolerance
Hypothesis, the tendency for Israeli left wingers to become slightly more tolerant (though not
24 One possibility is that a rightward shift is more likely for counterterrorism policies when a ceiling effect prevents authoritarians or conservatives from moving farther to the right.

38
significantly so) in response to terrorism (Figure 3.B) and to maintain their higher tolerance in the
post-Oslo period (Figure 5) requires further explanation. One likely reason is that leftists in Israel
have traditionally been more supportive of minority rights, particularly for Israeli Arabs, than right
wingers (e.g., Shamir and Sullivan 1983). Another explanation focuses on the psychological
orientations, such as authoritarianism and dogmatism, long found to be associated with Right-Left
identification in Israel (e.g., Shamir and Sullivan 1983, Halperin and Bar-Tal 2011).25 In her wide-
ranging study of the “authoritarian dynamic” that includes both experimental and cross-national
survey evidence, Stenner (2005) repeatedly found that threat activates polarized responses, with
authoritarians becoming less tolerant and non-authoritarians (which she terms libertarians)
becoming more tolerant.26 Thus, while data limitations prevent us from pinpointing the precise
micro-level mechanisms that give rise to diverging Right-Left responses to terrorism in Israel, such
polarized responses are quite consistent with theory and prior research.
Our study also has important implications for the way political tolerance and other attitudes
can and should be studied in the future. One limitation of an observational study like ours is that it
cannot provide the kind of strong evidence of causation that experimental or true panel studies can.
Yet, in order to examine the dynamics of persistent terrorism on political tolerance over a 30 year
period, our use of a repeated cross-sectional design in a multilevel framework was essential for
complementing and extending studies using other methods. Certainly a key advantage of our 30-year
study of the effects of terrorism and democratic longevity on tolerance in Israel is that it constitutes
over half of Israel’s existence as a nation state.
25 See Note 10 for Shamir and Sullivan’s (1983) findings and see Halperin and Bar-Tal (2011, 643). 26 According to Stenner (2005, 269-270), conditions of normative threat “activate authoritarian predispositions and increase the manifestation of their characteristic defensive stances, while provoking countervailing reactions from [non-authoritarians] most intent on protecting freedom and difference precisely when they might seem too risky for the collective.”
39
On balance, our longitudinal case study in Israel has provided unprecedented insight into the
resilience and the pliability of ordinary citizens’ application of democratic values under conditions of
chronic terrorism. The most general lesson from our study is that the political tolerance of
democracies under threat is the product of an ongoing struggle that takes place not only within
individual citizens, but also between political groups and political institutions, where a commitment
to minority rights and political freedoms for all adult citizens labors against existential fears of
terrorism and security.
40
References
Arce, Moises. 2003. “Political Violence and Presidential Approval in Peru.” Journal of Politics 65(2):572-583.
Arian, Asher, Shlomit Barnea, Pazit Ben-Nun, Rapheal Ventura, and Michal Shamir. 2005. Auditing Israeli Democracy—2005: A Decade after the Assassination of Prime Minister Yitzhak Rabin. Jerusalem: The Guttman Center at the Israel Democracy Institute.
Beck, Nathaniel, Jonathan N. Katz, and Richard Tucker. 1998. “Taking Time Seriously: Time-Series-Cross-Section Analysis with a Binary Dependent Variable.” American Journal of Political Science 42(4):1260-1288.
Berinsky, Adam J. 2009. In Time of War: Understanding Public Opinion, From World War II to Iraq. Chicago: University of Chicago Press.
Berrebi, Claude, and Esteban F. Klor. 2006. “On Terrorism and Electoral Outcomes: Theory and Evidence from the Israeli-Palestinian Conflict.” Journal of Conflict Resolution 50(6):899-925.
Berrebi, Claude, and Esteban F. Klor. 2008. “Are Voters Sensitive to Terrorism? Direct Evidence from the Israeli Electorate.” American Political Science Review 102(3):279-300.
Brooks, Clem, and Jeff Manza. 2013. Whose Rights? Counterterrorism and the Dark Side of American Public Opinion. New York: Russell Sage Foundation.
Canetti-Nisim, Daphna, Gal Ariely, and Eran Halperin. 2008. “Life, Pocketbook, or Culture: The Role of Perceived Security Threats in Promoting Exclusionist Political Attitudes toward Minorities in Israel.” Political Research Quarterly 61(1):90-103.
Canetti-Nisim, Daphna, Eran Halperin, Keren Sharvit and Stevan E. Hobfoll. 2009. “A New Stress-Based Model of Political Extremism: Personal Exposure to Terrorism, Psychological Distress, and Exclusionist Political Attitudes.” Journal of Conflict Resolution 53(3):363-389.
Crenshaw, Martha. 2010. Explaining Terrorism: Causes, Processes and Consequences. New York: Routledge. Dahl, Robert. 1971. Polyarchy. New Haven, CT: Yale University Press. Davis, Darren W. 2007. Negative Liberty: Public Opinion and the Terrorist Attacks on America. New York:
Russell Sage Foundation. Duch, Raymond M., and James L. Gibson. 1992. “Putting Up With Fascists in Western Europe: A
Comparative, Cross-level Analysis of Political Tolerance.” Western Political Quarterly 45(1):237-74.
Feldman, Stanley. 2003. “Enforcing Social Conformity: A Theory of Authoritarianism.” Political Psychology 24(1):41-74.
Feldman, Stanley, and Karen Stenner. 1997. “Perceived Threat and Authoritarianism.” Political Psychology 18(4):741-770.
Getmansky, Anna, and Thomas Zeitzoff. 2014. “Terrorism and Voting: The Effect of Rocket Threat on Voting in Israeli Elections.” American Political Science Review 108(3):588-604.
Gibler, Douglas M., and Kirk A. Randazzo. 2011. “Testing the Effects of Independent Judiciaries on the Likelihood of Democratic Backsliding.” American Journal of Political Science 55(3):696-709.
Gibson, James L. 1998. “Putting Up With Fellow Russians: An Analysis of Political Tolerance in the Fledgling Russian Democracy.” Political Research Quarterly 51(1):37-68.
Gibson, James L. 2006. “Enigmas of Intolerance: Fifty Years after Stouffer’s Communism, Conformity, and Civil Liberties.” Perspectives on Politics 4(1):21-34.
Gibson, James L. 2007. “Political Intolerance.” In Oxford Handbook of Political Behavior, eds. Russell J. Dalton and Hans-Dieter Klingemann. Oxford: Oxford University Press, pp. 323–341.
Gibson, James L. 2008. “Intolerance and Political Repression in the United States: A Half Century after McCarthyism.” American Journal of Political Science 52(1):96-108.
41
Gibson, James L. 2013. “Measuring Political Tolerance and General Support for Pro-Civil Liberties Policies: Notes, Evidence, and Cautions.” Public Opinion Quarterly 77(1):45-68.
Gibson, James L., and Amanda Gouws. 2003. Overcoming Intolerance in South Africa: Experiments in Democratic Persuasion. Cambridge: Cambridge University Press.
Golebiowska, Ewa A. 1999. “Gender Gap in Political Tolerance.” Political Behavior 21(1):43-66. Gould, Eric D., and Esteban F. Klor. 2010. “Does Terrorism Work?” The Quarterly Journal of
Economics 125(4):1459-1510. Halperin, Eran, and Daniel Bar-Tal. 2011. “Socio-Psychological Barriers to Peace Making: An
Empirical Examination within the Israeli Jewish Society.” Journal of Peace Research 48(5):637-651.
Hetherington, Marc J., and Elizabeth Suhay. 2011. “Authoritarianism, Threat, and Americans’ Support for the War on Terror.” American Journal of Political Science 55(3):546-560.
Hetherington, Marc J., and Jonathan D. Weiler. 2009. Authoritarianism and Polarization in American Politics. Cambridge: Cambridge University Press.
Huddy, Leonie, Stanley Feldman, Charles Taber, and Gallya Lahav. 2005. “Threat, Anxiety, and Support for Antiterrorism Policies.” American Journal of Political Science 49(3):593-608.
Huddy, Leonie, and Stanley Feldman. 2011. “Americans Respond Politically to 9/11: Understanding the Impact of the Terrorist Attacks and Their Aftermath.” American Psychologist 66(6):455-467.
Hutchison, Marc L. 2014. “Tolerating Threat? The Independent Effects of Civil Conflict on Domestic Political Tolerance.” Journal of Conflict Resolution 58(5):796-824.
Hutchison, Marc L., and Douglas M. Gibler. 2007. “Political Tolerance and Territorial Threat: A Cross-National Study.” Journal of Politics 69(1):128-142.
Jost, John T., Jack Glaser, Arie W. Kruglanski, and Frank J. Sulloway. 2003. “Political Conservatism as Motivated Social Cognition.” Psychological Bulletin 129(3):339-375.
Kam, Cindy D, and Donald R. Kinder. 2007. “Terror and Ethnocentrism: Foundations of American Support for the War on Terrorism.” Journal of Politics 69(2):318-336.
Kertzer, Joshua D. 2013. “Making Sense of Isolationism: Foreign Policy Mood as a Multilevel Phenomenon.” Journal of Politics 75(1):225-240.
Kirschenbaum, Alan. 2005. “Adapting Behaviors of Israeli Civilians to Palestinian Terror.” In The Concept of Social Resilience, ed. N. Friedland, A. Arian, A. Kirschenbaum, N. Fleisher, pp.36–81. Haifa, Israel: Samuel Neaman Institute.
Luke, Douglas A. 2004. Multilevel Modeling, Quantitative Applications in the Social Sciences. Thousand Oaks, CA: Sage Publications.
Lupia, Arthur, and Jesse O. Menning. 2009. "When Can Politicians Scare Citizens into Supporting Bad Policies?" American Journal of Political Science, 53: 90-106.
Malhotra, Neil, and Popp, Elizabeth. 2012. “Bridging Partisan Divisions over Antiterrorism Policies: The Role of Threat Perceptions.” Political Research Quarterly 65(1):34-47.
Marcus, George E., John L. Sullivan, Elizabeth Theiss-Morse, and Sandra L. Wood. 1995. With Malice Toward Some: How People Make Civil Liberties Judgments. Cambridge: Cambridge University Press.
Marshall, Monty G., and Keith Jaggers. 2012. Polity IV Project: Political Regime Characteristics and Transitions, 1800–2012. Integrated Network for Societal Conflict Research (INSCR) Program (http://www.systemicpeace.org/polity/polity4.htm).
Marquart-Pyatt, Sandra, and Pamela Paxton. 2007. “In Principle and In Practice: Learning Political Tolerance in Eastern and Western Europe.” Political Behavior 29(1):89-113.
42
Merolla, Jennifer L., and Elizabeth J. Zechmeister. 2009. Democracy at Risk: How Terrorist Threats Affect the Public. Chicago: University of Chicago Press.
National Consortium for the Study of Terrorism and Responses to Terrorism (START). 2014. Global Terrorism Database. |Data file| Available at:<http://www.start.umd.edu/gtd> [Accessed May 1, 2014].
Peffley, Mark, and Robert Rohrschneider. 2003. “Democratization and Political Tolerance in Seventeen Countries: A Multi-level Model of Democratic Learning.” Political Research Quarterly 56(3):243-57.
Peleg, Ilan, and Dov Waxman. 2011. Israel’s Palestinians: The Conflict Within. Cambridge: Cambridge University Press.
Raudenbush, Stephen W., and Anthony S. Bryk. 2002. Hierarchical Linear Models: Applications and Data Analysis Methods. 2nd ed. Newbury Park, CA: Sage.
Rohrschneider, Robert. 1996. “Institutional Learning versus Value Diffusion: The Evolution of Democratic Values Among Parliamentarians in Eastern and Western Germany.” Journal of Politics 58(2):442-466.
Rohrschneider, Robert. 1999. Learning Democracy: Democracy and Economic Values in Unified Germany. Oxford: Oxford University Press.
Shamir, Michal, and Asher Arian. 1994. “Competing Values and Policy Choices: Israeli Public Opinion on Foreign and Security Affairs.” British Journal of Political Science 24(2):249-271.
Shamir, Michal, and John Sullivan. 1983. “The Political Context of Tolerance: The United States and Israel.” American Political Science Review 77(4):911-928.
Shamir Michal, and Keren Weinshall-Margel 2015 (in press). “‘Your Honor, Restrain Us’ – The Political Dynamics of the Right to be Elected in the Israeli Democracy.” In The Elections in Israel – 2013, ed., Michal Shamir. New Brunswick, NJ: Transaction Publ.
Sniderman, Paul M. 1975. Personality and Democratic Politics. Berkeley, CA: University of California Press.
Sniderman, Paul M., Louk Hagendoorn, and Markus Prior. 2004. “Predisposing Factors and Situational Triggers: Exclusionary Reactions to Immigrant Minorities.” American Political Science Review 98(1):35-49.
Sniderman, Paul M., Philip E. Tetlock, James M. Glaser, Donald P. Green, and Michael Hout. 1989. “Principled Tolerance and the American Mass Public.” British Journal of Political Science 19(1):25-45.
Stecklov, Guy, and Joshua R. Goldstein. 2010. “Societal Responses to Endemic Terror: Evidence from Driving Behavior in Israel.” Social Forces 88(4):1859-1884.
Steenbergen, Marco R., and Bradford S. Jones. 2002. “Modeling Multilevel Data Structures.” American Journal of Political Science 46(1):218–237.
Stenner, Karen. 2005. The Authoritarian Dynamic. Cambridge: Cambridge University Press. Stouffer, Samuel. 1955. Communism, Conformity, and Civil Liberties. New York: Doubleday. Sullivan, John, James Piereson, and George E. Marcus. 1982. Political Tolerance and American Democracy.
Chicago: University of Chicago Press. Sullivan, John, Patrick Walsh, Michal Shamir, David Barnum, and James L. Gibson. 1993. “Why Are
Politicians More Tolerant? Selective Recruitment and Socialization among Elites in New Zealand, Israel, Britain and the United States.” British Journal of Political Science 23(1):51-76.
Waxman, Dov. 2011. “Living with Terror, Not Living in Terror: The Impact of Chronic Terrorism on Israeli Society.” Perspectives on Terrorism 5(5-6):4-26.
World Bank. 2014. World Development Indicators. |Data file| Available at: <http://data.worldbank.org/data-catalog/world-development-indicators> [Accessed May 1, 2014].

1
The Impact of Persistent Terrorism on Political Tolerance: Israel, 1980 to 2011 Supplementary Online Appendix
INTRODUCTION This online appendix presents more detailed information about the surveys, survey items, expanded discussion of methodological and multilevel estimation issues, and robustness checks which include discussions of terrorism and other macro-level variables. The appendix is divided into several sections that are cross-referenced in the manuscript. • SECTION 1: Survey Information, Survey Items & Missing Data Imputation (Tables A1 & A2) • SECTION 2: Least-Liked Group Selection (Tables A3 & A4) • SECTION 3: Threat Perception (Table A5) • SECTION 4: Multilevel Estimation: Discussion, Diagnostics and Equations (Table A6) • SECTION 5: Assessing Different Measures of Terrorism (Table A7) • SECTION 6: Macro-level Variable Specification and Other Robustness Checks
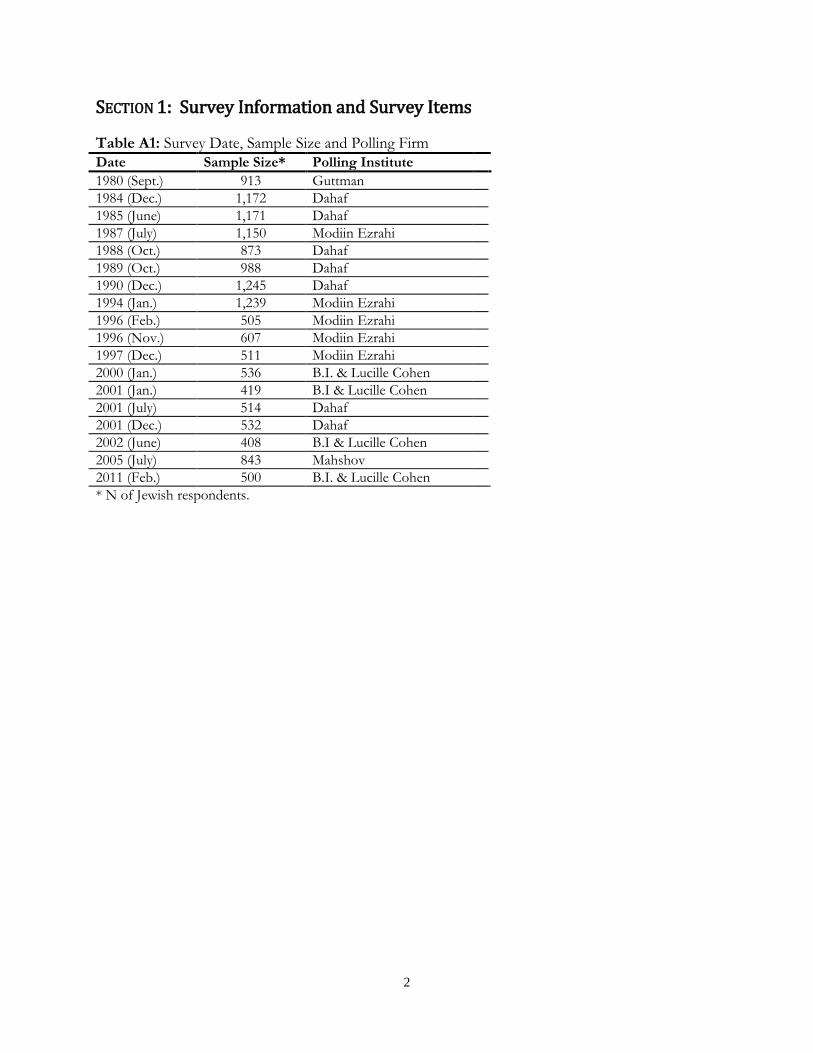
2
SECTION 1: Survey Information and Survey Items Table A1: Survey Date, Sample Size and Polling Firm Date Sample Size* Polling Institute 1980 (Sept.) 913 Guttman 1984 (Dec.) 1,172 Dahaf 1985 (June) 1,171 Dahaf 1987 (July) 1,150 Modiin Ezrahi 1988 (Oct.) 873 Dahaf 1989 (Oct.) 988 Dahaf 1990 (Dec.) 1,245 Dahaf 1994 (Jan.) 1,239 Modiin Ezrahi 1996 (Feb.) 505 Modiin Ezrahi 1996 (Nov.) 607 Modiin Ezrahi 1997 (Dec.) 511 Modiin Ezrahi 2000 (Jan.) 536 B.I. & Lucille Cohen 2001 (Jan.) 419 B.I & Lucille Cohen 2001 (July) 514 Dahaf 2001 (Dec.) 532 Dahaf 2002 (June) 408 B.I & Lucille Cohen 2005 (July) 843 Mahshov 2011 (Feb.) 500 B.I. & Lucille Cohen * N of Jewish respondents.

3
Table A2. Measurement Appendix for Individual-level Variables 1. Political Tolerance (Pearson’s correlation = .75 across the surveys)
a. Members of the (Least-liked Group) should be allowed to make a speech on T.V.27 b. Members of the (Least-liked Group) should be allowed to demonstrate.
2. Least-Liked Group Selection: Here is a list of groups in politics. As I read the list, please tell me which of these groups do you like the least or if there is some group that you like even less than the groups listed here, please tell me the name of that group.
3. Political Identification
a. With which political tendency do you identify—left (4), moderate left (3), center (2), moderate right (1) or right (0)? Surveys: 1988, 1990, 1994, 2/1996, 11/1996, 1997, 2000, 1/2001, 2002.
b. People talk much about right wing and left wing in politics. Where would you place yourself on this 7-point scale that goes from extreme right (1) to extreme left (7), or haven't you thought much about this? (The scale was recoded so that 1 & 2=0, 3=1, 4=2, 5=3, 6 & 7=4.) Surveys: 1980, 1984, 1989, 7/2001, 11/2001, 2005
c. Responses to the two items (a and b) are correlated at .79 in the 1988 survey. d. For the three surveys where left-right identification was not assessed, we followed Shamir and
Sullivan (1983, 922), who used the ideology of the respondent’s least-liked group as an indicator of left-right identification. In 12/1984, and 6/1985, selecting a left-wing or Arab group is coded as Right (0), selecting a right-wing group is coded as Left (4), and selecting a religious or center group is coded as Center (2). In 7/1987, where respondents were asked to select a least-liked and a second least-liked group, Right-wing identification (0) was indicated by selecting two left-wing groups, Moderate Right (1) by selecting one right-wing group and a group neutral on the left-right dimension (religious), Center (2) by selecting one left- and one right-wing group or two neutral groups, Moderate Left (3) by selecting one right-wing group, and Left (4) by selecting two right-wing groups.
4. Religious Identification
a. Are you: ultra-orthodox (0), religious (1), traditional (2) or secular (3)? Surveys: 1984, 1985, 1987, 1988, 1989, 1990, 1994, 2/1996, 11/1996,1997, 2000.
b. To what extent do you keep religious tradition [i.e., observe the strictures of orthodox Jewish law (Halacha )]? I observe it all (0), a lot (1), a little bit (3), or not at all (4)? Surveys: 1980, 1/2001, 7/2001, 12/2001, 2002.
c. Responses to the two questions are correlated at .81 (2005 survey).
5. Demographic Characteristics. a. Education is assessed on a 4-point scale: What is your education? elementary school (0), some high
school (1), completed high school (2), some college (3). b. Age is measured with a 6-point scale using the following categories: What is your age? 18-22 (0), 23-
30 (1), 31-40 (2), 41-50 (3), 51-60 (4), and 61and older (5). c. Female is a dummy variable with male equal to 0.
27 Because the speech item was not asked in the 1/1994 survey, we created a proxy measure based on agreement with another statement indicating political tolerance: “Members of the (GROUP) should be allowed to vote for the Knesset.” In addition, in some years, the wording of the speech statement varied slightly from the above: 2/1996, 11/1996: “Members of the (GROUP) should be allowed to be interviewed in the media;” 7/2001, 6/2002: “Members of the (GROUP) should be allowed to make a speech in public rallies and on T.V.”
4
d. Income is based on five categories using the following question: “The average expenditure of a family of four in April was [x] Shekels. Considering your expenses and the size of your family, do you spend: much below average (0), below average (1), average (2), above average (3), or much above average (4)?”
Imputation of Missing Data To avoid the bias inherent in listwise deletion of missing data in our surveys, we used the Amelia II software package to impute missing data for our individual-level predictor variables (Honaker, King and Blackwell 2011). Amelia II uses a method of multiple imputations to compute values for each missing cell in the individual-level data matrix. While the observed values remain unchanged, Amelia generates several data sets in which the missing data take on different values mirroring the uncertainty associated with the missing values. To impute missing individual-level data, we generated ten imputations for each survey and evaluated them using the battery of diagnostics suggested by Eddings and Marchenko (2012).28 These diagnostics include comparisons of the summary statistics as well as the distributions and densities of the original data vs. the imputed data and the Kolmogorov-Smirnov test. The diagnostics revealed no problems with the imputations and are available upon request. All ten imputed datasets were used with the “mi estimate: mixed” command in Stata 13, which adjusts coefficients and standard errors for the variability between imputations according to the combination rules by Rubin (1987).
28 There were two instances of missing data for individual-level demographic control variables in two surveys (12/1984 and 10/1988). In the interest of using these surveys in our study, we addressed this issue by conducting an initial procedure of generating five imputations for those two surveys only. We then evaluated these imputations using the same battery of diagnostics described above and found no problems with the imputations. Using these diagnostics, we selected the best imputation for those two surveys to include in the initial dataset from which we used Amelia II to generate the 10 final imputations for all of the surveys.
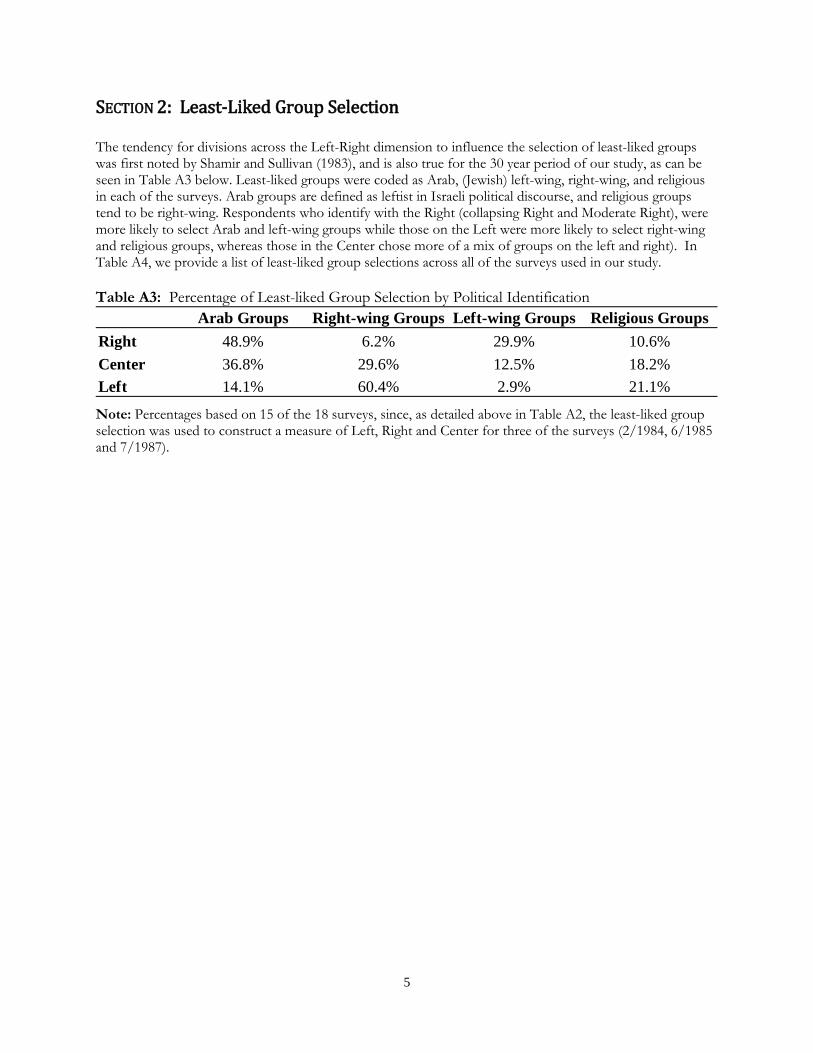
5
SECTION 2: Least-Liked Group Selection The tendency for divisions across the Left-Right dimension to influence the selection of least-liked groups was first noted by Shamir and Sullivan (1983), and is also true for the 30 year period of our study, as can be seen in Table A3 below. Least-liked groups were coded as Arab, (Jewish) left-wing, right-wing, and religious in each of the surveys. Arab groups are defined as leftist in Israeli political discourse, and religious groups tend to be right-wing. Respondents who identify with the Right (collapsing Right and Moderate Right), were more likely to select Arab and left-wing groups while those on the Left were more likely to select right-wing and religious groups, whereas those in the Center chose more of a mix of groups on the left and right). In Table A4, we provide a list of least-liked group selections across all of the surveys used in our study. Table A3: Percentage of Least-liked Group Selection by Political Identification
Note: Percentages based on 15 of the 18 surveys, since, as detailed above in Table A2, the least-liked group selection was used to construct a measure of Left, Right and Center for three of the surveys (2/1984, 6/1985 and 7/1987).
Arab Groups Right-wing Groups Left-wing Groups Religious GroupsRight 48.9% 6.2% 29.9% 10.6%Center 36.8% 29.6% 12.5% 18.2%Left 14.1% 60.4% 2.9% 21.1%
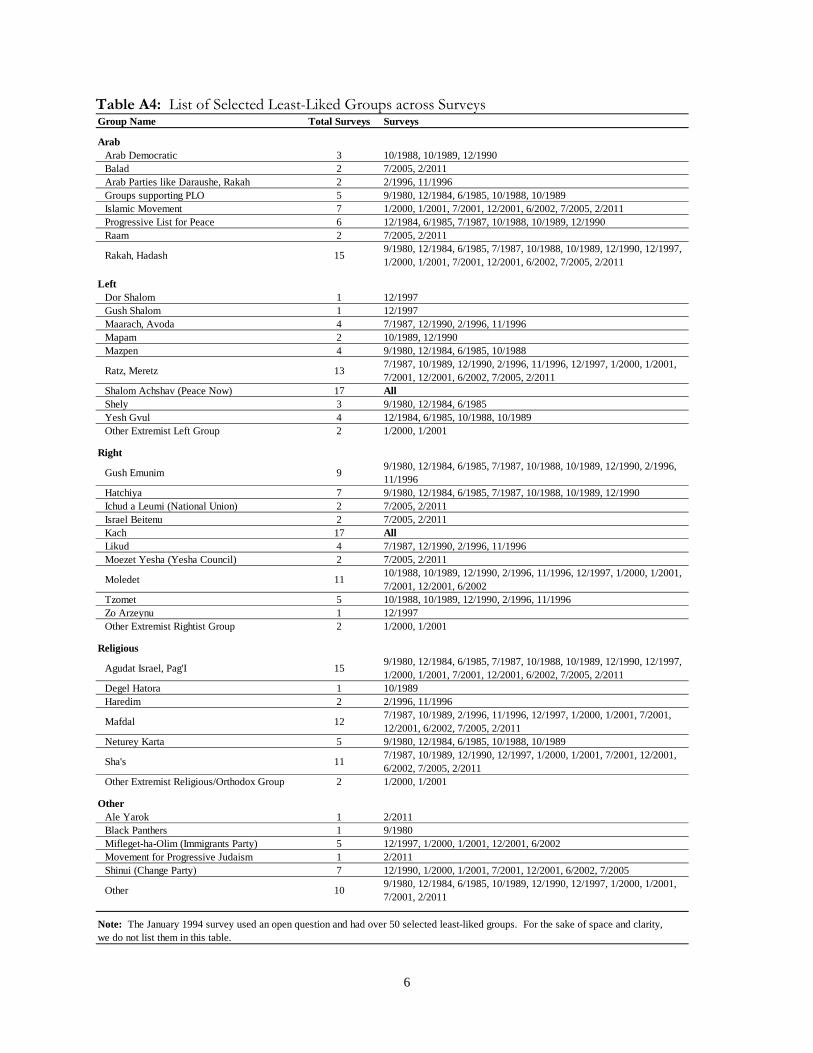
6
Table A4: List of Selected Least-Liked Groups across Surveys Group Name Total Surveys Surveys
ArabArab Democratic 3 10/1988, 10/1989, 12/1990Balad 2 7/2005, 2/2011Arab Parties like Daraushe, Rakah 2 2/1996, 11/1996Groups supporting PLO 5 9/1980, 12/1984, 6/1985, 10/1988, 10/1989Islamic Movement 7 1/2000, 1/2001, 7/2001, 12/2001, 6/2002, 7/2005, 2/2011Progressive List for Peace 6 12/1984, 6/1985, 7/1987, 10/1988, 10/1989, 12/1990Raam 2 7/2005, 2/2011
Rakah, Hadash 15 9/1980, 12/1984, 6/1985, 7/1987, 10/1988, 10/1989, 12/1990, 12/1997, 1/2000, 1/2001, 7/2001, 12/2001, 6/2002, 7/2005, 2/2011
LeftDor Shalom 1 12/1997Gush Shalom 1 12/1997Maarach, Avoda 4 7/1987, 12/1990, 2/1996, 11/1996Mapam 2 10/1989, 12/1990Mazpen 4 9/1980, 12/1984, 6/1985, 10/1988
Ratz, Meretz 13 7/1987, 10/1989, 12/1990, 2/1996, 11/1996, 12/1997, 1/2000, 1/2001, 7/2001, 12/2001, 6/2002, 7/2005, 2/2011
Shalom Achshav (Peace Now) 17 AllShely 3 9/1980, 12/1984, 6/1985Yesh Gvul 4 12/1984, 6/1985, 10/1988, 10/1989Other Extremist Left Group 2 1/2000, 1/2001
Right
Gush Emunim 9 9/1980, 12/1984, 6/1985, 7/1987, 10/1988, 10/1989, 12/1990, 2/1996, 11/1996
Hatchiya 7 9/1980, 12/1984, 6/1985, 7/1987, 10/1988, 10/1989, 12/1990Ichud a Leumi (National Union) 2 7/2005, 2/2011Israel Beitenu 2 7/2005, 2/2011Kach 17 AllLikud 4 7/1987, 12/1990, 2/1996, 11/1996Moezet Yesha (Yesha Council) 2 7/2005, 2/2011
Moledet 11 10/1988, 10/1989, 12/1990, 2/1996, 11/1996, 12/1997, 1/2000, 1/2001, 7/2001, 12/2001, 6/2002
Tzomet 5 10/1988, 10/1989, 12/1990, 2/1996, 11/1996Zo Arzeynu 1 12/1997Other Extremist Rightist Group 2 1/2000, 1/2001
Religious
Agudat Israel, Pag'I 15 9/1980, 12/1984, 6/1985, 7/1987, 10/1988, 10/1989, 12/1990, 12/1997, 1/2000, 1/2001, 7/2001, 12/2001, 6/2002, 7/2005, 2/2011
Degel Hatora 1 10/1989Haredim 2 2/1996, 11/1996
Mafdal 12 7/1987, 10/1989, 2/1996, 11/1996, 12/1997, 1/2000, 1/2001, 7/2001, 12/2001, 6/2002, 7/2005, 2/2011
Neturey Karta 5 9/1980, 12/1984, 6/1985, 10/1988, 10/1989
Sha's 11 7/1987, 10/1989, 12/1990, 12/1997, 1/2000, 1/2001, 7/2001, 12/2001, 6/2002, 7/2005, 2/2011
Other Extremist Religious/Orthodox Group 2 1/2000, 1/2001
OtherAle Yarok 1 2/2011Black Panthers 1 9/1980Mifleget-ha-Olim (Immigrants Party) 5 12/1997, 1/2000, 1/2001, 12/2001, 6/2002Movement for Progressive Judaism 1 2/2011Shinui (Change Party) 7 12/1990, 1/2000, 1/2001, 7/2001, 12/2001, 6/2002, 7/2005
Other 10 9/1980, 12/1984, 6/1985, 10/1989, 12/1990, 12/1997, 1/2000, 1/2001, 7/2001, 2/2011
Note: The January 1994 survey used an open question and had over 50 selected least-liked groups. For the sake of space and clarity, we do not list them in this table.
7
SECTION 3: Threat Perception As we report in the article, our analysis does not include an individual-level measure of perceived threat because such measures are not available for several of our 18 surveys. Although perceived threat is an important predictor of tolerance in individual-level studies of the U.S. and Israel, its influence in studies of least-liked tolerance is invariably found to be exogenous in that it is uncorrelated with other individual-level predictors. Below, we show the same is true for the five Israeli surveys administered at different points in time throughout the time series using two different measures of perceived threat toward one’s least-liked group. In two of the surveys, 9/1980 (not reported in Table A5) and 7/2001 (Model A1 in Table A5), a summary index of 5 semantic differentials (Honest/dishonest, Trustworthy/untrustworthy, Safe/dangerous, Non-violent/violent, Good/bad), each rated on a scale ranging from 1 to 7, is used to measure perceived threat. The results of the 1980 survey are given in Shamir and Sullivan (1983, 925) who conclude, “Perceived threat is basically exogenous in both [Israel and the U.S.].” Using the same measure of perceived threat in the July, 2001 survey leads to the same conclusion (Table A5, Model A1). In three additional surveys--(7/1987, 12/2001 and 2/2011), perceived threat is measured by asking respondents the extent to which “their least-liked group is a threat to the regime” on a 5-point scale ranging from “extremely likely” (5) to “not at all” (1). The results in Table A5, Models 2A-4A show the same pattern as before. Only the coefficient for education in the 1987 survey is significant at the .05 level. Consequently, the adjusted R2 for all four equations in Table A5 ranges from .00 to .03. Thus, the results clearly show that perceptions of threat, assessed with two different measures, are basically exogenous with respect to the other individual-level predictors across the five surveys administered at different points in time. We therefore conclude that omitting perceived threat should not bias our estimates of the impact of individual-level characteristics like political identity on political tolerance.
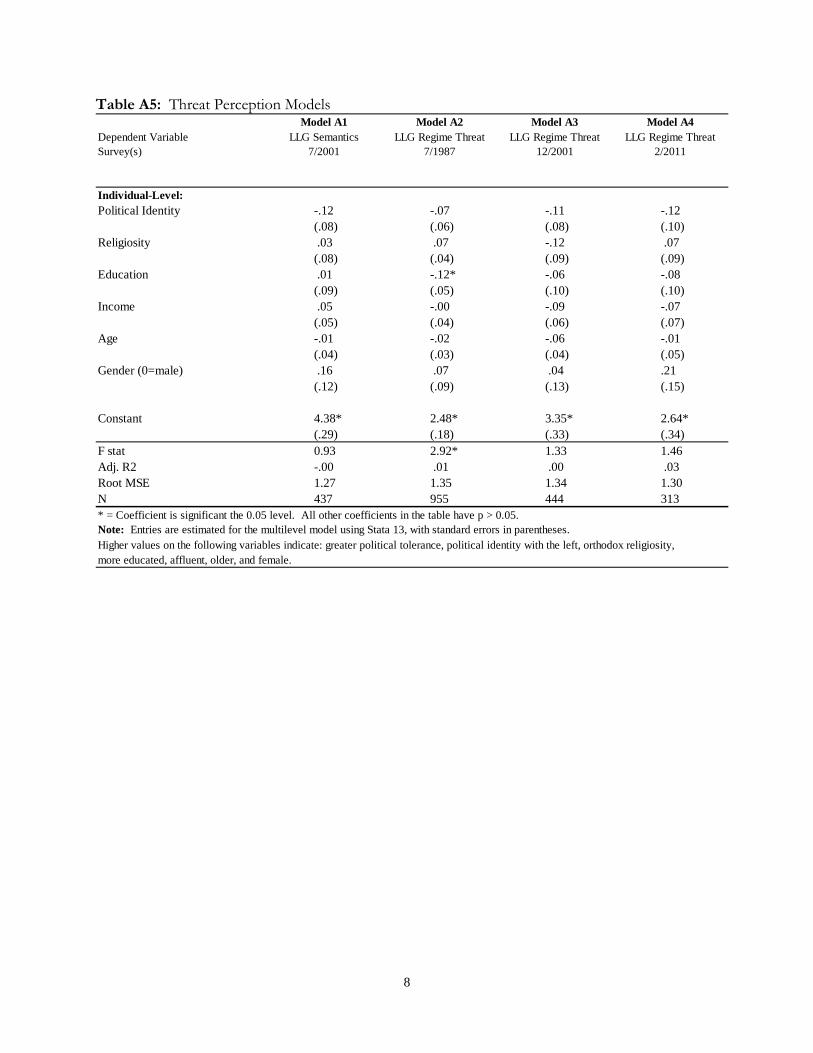
8
Table A5: Threat Perception Models
Model A1 Model A2 Model A3 Model A4Dependent Variable LLG Semantics LLG Regime Threat LLG Regime Threat LLG Regime ThreatSurvey(s) 7/2001 7/1987 12/2001 2/2011
Individual-Level:Political Identity -.12 -.07 -.11 -.12
(.08) (.06) (.08) (.10)Religiosity .03 .07 -.12 .07
(.08) (.04) (.09) (.09)Education .01 -.12* -.06 -.08
(.09) (.05) (.10) (.10)Income .05 -.00 -.09 -.07
(.05) (.04) (.06) (.07)Age -.01 -.02 -.06 -.01
(.04) (.03) (.04) (.05)Gender (0=male) .16 .07 .04 .21
(.12) (.09) (.13) (.15)
Constant 4.38* 2.48* 3.35* 2.64*(.29) (.18) (.33) (.34)
F stat 0.93 2.92* 1.33 1.46Adj. R2 -.00 .01 .00 .03Root MSE 1.27 1.35 1.34 1.30N 437 955 444 313* = Coefficient is significant the 0.05 level. All other coefficients in the table have p > 0.05.Note: Entries are estimated for the multilevel model using Stata 13, with standard errors in parentheses.Higher values on the following variables indicate: greater political tolerance, political identity with the left, orthodox religiosity, more educated, affluent, older, and female.

9
SECTION 4: Multilevel Estimation: Discussion, Diagnostics and Equations Discussion Our data are clearly multilevel: individuals are nested within surveys conducted at different points in time. More traditional statistical techniques that cannot account for the multilevel nature of the data introduce different types of bias to the parameter estimates (Steenbergen and Jones 2002). For example, simply disaggregating macro-level data into a pooled individual-level model would likely result in a significant underestimation of the standard errors for the macro-level variables and increase the likelihood of Type II errors. Conversely, if we aggregated the individual-level data into a macro-level model, we risk rather severe ecological inference problems (Luke 2004). Furthermore, as Arceneaux and Nickerson (2009) show, when the number of clusters in multilevel data is less than 20, or when one is interested in estimating cross-level interactions, multilevel modeling is often preferred to clustered standard error approaches. Finally, having only 18 macro-level units is not a cause for concern in light of Stegmueller’s (2013) demonstration through Monte Carlo simulations that the standard errors generated in multilevel analyses with over 15 macro-level units do not suffer from a significant amount of bias. Nevertheless, we are mindful of limited degrees of freedom at the macro-level and include only the most important contextual conditions commonly hypothesized to influence individual tolerance over time.
Diagnostics To determine if multilevel modeling techniques are required to estimate our models, we first estimate a one-way Analysis of Variance (ANOVA) with survey year random effects to assess the degree to which variation in political tolerance is due to variation across individuals within surveys versus variation between surveys. Table A7 shows that the intraclass correlation (p) indicates that 5.4% of the variation in political tolerance is due to variation across surveys, which is to be expected, since we have hundreds of individuals within just 18 surveys. Since our intraclass correlation is not 0, the use of multilevel modeling is appropriate for this study. We also calculate two additional intraclass correlations to show how much variability between surveys is accounted for with the introduction of our individual-level predictors and a full macro-micro-level model. Although we see a noticeable improvement in our goodness of fit with introduction of the individual-level predictors, our largest improvement comes in full macro-micro-level model after we fully account for our contextual predictors. Next we determine which type of model specification is appropriate for this type of data. In general, researchers can choose whether to specify a random intercept model, which allows the intercept between groups (in this case, surveys) to vary, or a random coefficient model, which allows the intercept and certain slopes to vary between groups (see Raudenbush and Byrk 2002). Here we compare the relative goodness of fit between the best random intercept model (Full) and a random coefficient model that allows the slopes of political identity, which we argue is most likely to shift over time, and education to vary. Comparing the two intraclass correlations reveals that using a random coefficient model has a better goodness of fit for our data than a random intercept model. Thus, in the models reported in our study, we use a random coefficient specification that allows the slopes of both political identity and education to vary across the surveys. Table A6: Measuring Fit across Different Multilevel Model Specifications Model p Oneway ANOVA 0.054 Random intercept model - Individual 0.046 Random intercept model - Full 0.020 Random coefficient model - Political Identity & Education 0.017

10
Multilevel Model Equations To offer more insight into our multilevel model specification, we present our mixed form equation for Model 3 which is our full additive random coefficient model in this study. Toleranceij= γ00 + γ01*Continuous Democracy2
j + γ02*GDP Growth j + γ03*Inflation j + γ04*Terrorism j +
γ10*Political Identityij + γ20*Educationij + γ30*Religiosityij + γ40*Incomeij + γ50*Ageij + γ60*Genderij + (u0j + u1j*Political Identity + u2j*Education + ∊ij)
Toleranceij is our level-1 dependent variable for an individual i (=1, . . ., Nj) nested in our level-2 unit, time j(=1, . . ., J). Our individual-level predictors are denoted as Xij indicating that it varies across both individuals and time while ∊ij is the level-1 error term. Our macro-level predictors are denoted as Zj indicating that it varies across time. u0j is the residual level-2 variation in the individual-level intercept after accounting for our macro-level predictors. In the mixed-form equation above, γ00 is the intercept while the notation γX0 is used to represent the effects of our individual-level predictors and γ0X is used for the effects of our macro-level predictors. Since this is a random coefficient model, we also include u1j and u2j, which represent the residual level-2 variation in slopes for political identity and education, respectively, after accounting for our macro-level predictors, in addition to the random parameters u0j and ∊ij. Listed below are the equations for each of the models estimated in Table 1 of the article. Model 1 Toleranceij= γ00 + γ10*Political Identityij + γ20*Educationij + γ30*Religiosityij + γ40*Incomeij + γ50*Ageij + γ60*Genderij + (u0j +
u1j*Political Identity + u2j*Education + ∊ij) Model 2 Toleranceij= γ00 + γ01*Terrorism j + γ10*Political Identityij + γ20*Educationij + γ30*Religiosityij + γ40*Incomeij + γ50*Ageij +
γ60*Genderij + (u0j + u1j*Political Identity + u2j*Education + ∊ij) Model 3 Toleranceij= γ00 + γ01*Continuous Democracy2
j + γ02*GDP Growth j + γ03*Inflation j + γ04*Terrorism j +
γ10*Political Identityij + γ20*Educationij + γ30*Religiosityij + γ40*Incomeij + γ50*Ageij + γ60*Genderij + (u0j + u1j*Political Identity + u2j*Education + ∊ij)
Model 4 Toleranceij= γ00 + γ01*Continuous Democracy2
j + γ02*GDP Growth j + γ03*Inflation j + γ04*Terrorism j +
γ10*Political Identityij + γ20*Educationij + γ30*Religiosityij + γ40*Incomeij + γ50*Ageij + γ60*Genderij + γ14*Terrorism j *Political Identityij (u0j + u1j*Political Identity + u2j*Education + ∊ij)
Model 5 Toleranceij= γ00 + γ01*Continuous Democracy2
j + γ02*GDP Growth j + γ03*Inflation j + γ04*Terrorism j +
γ05*Osloj + γ06*Post-Osloj + γ07*Terrorism j *Osloj + γ08*Terrorism j *post-Osloj + γ10*Political
Identityij + γ20*Educationij + γ30*Religiosityij + γ40*Incomeij + γ50*Ageij + γ60*Genderij + γ11*Terrorism j *Political Identityij + γ12*Osloj *Political Identityij + γ13*post-Osloj *Political Identityij + γ14*Terrorism j*Osloj *Political Identityij + γ15*Terrorism j*post-Osloj *Political Identityij (u0j + u1j*Political Identity + u2j*Education + ∊ij)

11
SECTION 5: Assessing Different Measures of Terrorism Prior studies of the impact of terrorism on political attitudes and behavior use a range of different measures of terrorism (e.g., terrorist attacks, suicide terrorism, and fatalities), lags (e.g., from one month to one year) and model specifications (e.g., additive, interactive). In Table A7, we compare the effects of terrorism across indicators, lags and models to provide evidence for our claim that Terrorist Attacks assessed with a 3 month lag is the most appropriate measure for this study. The pattern of findings in Table A7 can be summarized as follows. First, across all three measures of terrorism, on average, the impact of terrorism is greatest for the three month lag and least (but still statistically significant) for the one year lag. This result is consistent with other studies of the political effects of terrorism in Israel (e.g., Berrebi and Klor 2008) that also find attacks within three months have the greatest impact and decay over time. Using our preferred measure of Terrorist Attacks, for example, the impact of a single attack declines by about 60% from three months (b = -.036) to one year (b = -.016). Second, with just one exception (Fatalities with a one year lag), for models based on all 18 surveys, the coefficients for all three types of terrorism are statistically significant, regardless of the lag. Third, in almost every case, the coefficient for Fatalities is smaller than the effects of Terrorist Attacks and Fatal Attacks. Fourth, only the effects of Terrorist Attacks—the measure employed in our analysis—are robust in the face of dropping surveys with exceptionally large spikes in fatalities—12/2001 and 6/2002. Those two surveys account for over 50% of the terrorist occurrences in Fatal Attacks and Fatalities for measures with either a 3 month or a 6 month lag. When dropping these two surveys, the coefficients for Fatal Attacks and Fatalities are much less likely to achieve statistical significance, whereas the effects of Terrorist Attacks are largely unaffected.29 In conclusion, these results support the theoretical argument in favor of using a measure of Terrorist Attacks. Over the sweep of 30 years in Israel, when the form of terrorism changes dramatically, when fatalities and suicide bombings become the preferred terrorist strategy in later periods, mirroring a global trend (e.g., Sandler 2014), the use of Terrorist Attacks with a 3 month lag in our study makes both theoretical and empirical sense. We do not claim that our measure is “best” for all conditions; other measures may be more appropriate, depending on the purpose and the time period of the study.
29 We also examined the functional form of the impact of Fatal Attacks and Fatalities by adding a quadratic term or taking the natural log, but neither terms were statistically significant for any of the models reported here.

12
Table A7: Results across Different Specifications for Terrorism Indicators, Lags, and Samples
Note: This table provides a series of robustness checks for the model estimated in Table 1 by substituting different indicators of terrorism, lags, additive and interactive specifications, and sensitivity to dropping surveys with large spikes of civilian fatalities from terrorist attacks in the second Intifada. Coefficients are maximum likelihood estimates from a multilevel model, with p values in parentheses. The additive model corresponds to Model 3 in Table 1 and the interactive model corresponds to Model 4. Recall that Terrorist Attacks are the total number of terrorist attacks occurring in the period before the survey and Fatal Attacks are coded in the same manner except only attacks that resulted in a least one fatality are recorded. Fatalities are the number of civilian fatalities. All terrorism data taken from the GTD database (National Consortium for the Study of Terrorism and Responses to Terrorism 2014).
Additive Models Interactive Models
All SurveysWithout Surveys
12/2001 & 6/2002 All SurveysWithout Surveys
12/2001 & 6/2002A. Terrorist Attacks3 month lag -.036 -.030 -.040 -.035
(.001) (.013) (.001) (.004) 6 month lag -.020 -.020 -.022 -.021
(.001) (.001) (.001) (.001) 1 year lag -.016 -.014 -.016 -.015
(.001) (.001) (.001) (.001)
Political Identity -.006 -.007 -.021 .012 .010 .000(.884) (.867) (.648) (.766) (.808) (.993)
Political ID x Terrorism .014 .007 .005 .012 .006 .004(.001) (.001) (.001) (.001) (.001) (.001)
B. Fatal Attacks3 month lag -.042 -.040 -.056 -.068
(.003) (.291) (.001) (.082)6 month lag -.043 -.055 -.046 -.056
(.001) (.007) (.001) (.006)1 year lag -.022 -.021 -.029 -.031
(.002) (.244) (.001) (.096)
Political Identity .066 .044 .029 .055 .046 .029(.084) (.266) (.508) (.181) (.283) (.601)
Political ID x Terrorism .020 .015 .010 .031 .017 .011(.001) (.001) (.001) (.001) (.001) (.001)
C. Fatalities3 month lag -.007 -.024 -.011 -.030
(.018) (.021) (.001) (.006)6 month lag -.007 -.021 -.010 -.024
(.002) (.002) (.001) (.001)1 year lag -.002 .002 -.005 .002
(.194) (.749) (.018) (.817)
Political Identity .101 .083 .078 .081 .063 .118(.006) (.030) (.089) (.049) (.162) (.061)
Political ID x Terrorism .004 .003 .002 .009 .006 .000(.001) (.001) (.001) (.034) (.027) (.923)
N 14257 14257 14257 13318 13318 13318 14257 14257 14257 13318 13318 13318
13
SECTION 6: Alternative Macro-level Variables and Other Robustness Checks To further evaluate whether our reported results are robust to changes in variable specification or suffer from potential omitted variable bias, we explore alternative country-level predictors in different specifications of our macro-level model. While our examination of different country-level predictors is by no means exhaustive, it is intended to assess major types of contextual factors that could influence individual political tolerance. It should be noted that many of the standard controls used in cross-national studies on political tolerance (e.g., ethnic and religious fractionalization, geographic characteristics, and political institutional configurations) are largely unnecessary in a longitudinal study of a single country because they tend to be relatively static over a 30 year period. Our study focuses on important dynamic macro-level variables—economic performance, terrorism and continuous democracy--that can be expected to vary over time. We did use different indicators of economic performance, such as unemployment and per capita income (each lagged to the year of the survey and taken from the World Development Indicators database (World Bank 2014) but find no trace of a statistically significant relationship with political tolerance, and the estimates of our key independent variables remain substantively unaffected. To account for any effect of international militarized threats on individual tolerance (see Hutchison and Gibler 2007), we also included event counts of militarized interstate disputes (MIDs) in our main models as an additional control. This measure is derived from the Correlates of War militarized interstate dispute (MID) dataset (Palmer et al. 2015), which identifies events involving the threat, show, or use of force between two or more states from 1816 to 2010. Our general MID indicator is the total militarized interstate disputes that occurred within a year prior to the survey on individual political tolerance. We also examine the effect of different types of international militarized threats on tolerance. Unlike Hutchison and Gibler (2007), our specifications do not include territorial disputes because Israel did not experience any during the examined time period. Instead we use different specifications intended to capture salient external threats to Israel during this time, such as targeted disputes and disputes with international strategic rivals (see Thompson 2001).30 As Table A8 reveals, we find virtually no effect from these external threat variables on political tolerance in Israel over this time period as none of the variables have a significant impact on tolerance nor substantially affect the influence of terrorist attacks. Although militarized interstate disputes play an important role in contributing to a country’s overall threat environment, in this case they simply do not influence tolerance the way terrorism does, and this result does not change with different specifications of our MID variable. It is likely that the salience of these non-territorial external threats (see Hutchison and Gibler 2007) pales in comparison to the very present everyday threat of terrorism affecting Israeli citizens over this same period of time.31 Overall, these findings, in conjunction with the different terrorism variable specifications reported in Table A6, leave us confident that our findings are robust to different model and variable specifications. In most instances, we find that alternative macro-level variables have little to no impact on political tolerance while our key independent variables remain substantively unaffected.
30 We also use longer event counts for the general, targeted, and rivalry MIDs and look at the total number of disputes in the two year period prior to the survey. As Hutchison and Gibler (2007: 135) note, using a longer event count for MIDs can better account for disputes that slowly escalate, thereby, increasing the amount of time “between the manifestation of threat and its diffusion to the domestic level.” As in the case of the shorter one year event counts, we observe that none of these variables have a significant effect on individual political tolerance nor substantially affect the influence of terrorist attacks. 31 Hutchison (2014) notes in a footnote that a robustness check reveals that, cross-nationally, both territorial MIDs and terrorist attacks significantly lower individual tolerance.

14
Table A8: Additional International Threat Models
Model A5 Model A6 Model A7 Model A8 Model A9 Model A10Individual-Level
Religiosity -.11 -.11 -.11 -.11 -.11 -.11(.02) (.02) (.02) (.02) (.02) (.02)
Education .27 .27 .26 .26 .27 .27(.05) (.05) (.05) (.05) (.05) (.05)
Income .10 .10 .10 .10 .10 .10(.02) (.02) (.02) (.02) (.02) (.02)
Age -.06 -.06 -.06 -.06 -.06 -.06(.01) (.01) (.01) (.01) (.01) (.01)
Gender (Male = 0) -.21 -.20 -.20 -.20 -.21 -.21(.04) (.04) (.04) (.04) (.04) (.04)
Political Identity (Right to Left) .15 -.001† .15 .001† .15 -.001†
(.04) (.04) (.04) (.04) (.04) (.04)Country-Level
Terrorist Attacks (3 months) -.034 -.039 -.037 -.041 -.034 -.041(.01) (.01) (.01) (.01) (.01) (.01)
Political Identity x Terrorist Attacks .014 .014 .014(.003) (.003) (.003)
Continuous Democracy .121 .121 .110 .107 .114 .112(.03) (.03) (.04) (.04) (.03) (.04)
Continuous Democracy2 -.003 -.003 -.003 -.003 -.003 -.003(.00) (.00) (.00) (.00) (.00) (.00)
GDP Growth -.02† -.02† -.002† -.004† -.01† -.01†
(.03) (.03) (.03) (.03) (.04) (.03)Inflation -.001† -.001† -.001† -.001† -.001† -.001†
(.001) (.001) (.001) (.001) (.001) (.001)Militarized Interstate Disputes .23† .24†
(.13) (.13)Targeted Militarized Interstate Disputes .07† .09†
(.18) (.19)Rivalry Militarized Interstate Disputes .17† .19†
(.13) (.13)
Constant 2.97 3.04 3.32 3.39 3.13 3.21(.46) (.46) (.43) (.44) (.44) (.44)
Random Effects ParameterSurvey .09 .11 .09 .09 .10 .10
(.07) (.07) (.07) (.07) (.07) (.06)Residual 5.03 5.03 5.03 5.03 5.03 5.03
(.06) (.06) (.06) (.06) (.06) (.06)Observations
Surveys 18 18 18 18 18 18Individuals 14211 14211 14211 14211 14211 14211
† = Coefficient is not significant at the 0.05 level. All other coefficients in the table have p < 0.05.Note: Entries are maximum likelihood coefficients estimated using Stata 13, with standard errors in parentheses. Higher values on the followingvariables indicate: greater political tolerance, orthodox religiosity, education and income levels, age, female, left political ID, number of terroristattacks in 3 months prior to the survey, continuous years of democracy, higher GDP growth and inflation, and number of militarized interstatedisputes in the year prior to the survey.
15
REFERENCES Arceneaux, Kevin, and David W. Nickerson. 2009. “Modeling Certainty with Clustered Data: A Comparison
of Methods.” Political Analysis 17(2):177-190. Berrebi, Claude, and Esteban F. Klor. 2008. “Are Voters Sensitive to Terrorism? Direct Evidence from the
Israeli Electorate.” American Political Science Review 102(3):279-300. Eddings, Wesley, and Yulia Marchenko. 2012. “Diagnostics for Multiple Imputation in Stata.” The Stata
Journal 12(3):353-367. Honaker, James, Gary King, and Matthew Blackwell. 2011. “Amelia II: A Program for Missing Data.” Journal
of Statistical Software 45(7):1–47. Hutchison, Marc L. 2014. “Tolerating Threat? The Independent Effects of Civil Conflict on Domestic
Political Tolerance.” Journal of Conflict Resolution 58(5):796-824. Hutchison, Marc L., and Douglas M. Gibler. 2007. “Political Tolerance and Territorial Threat: A Cross-
National Study.” Journal of Politics 69(1):128-142. Luke, Douglas A. 2004. Multilevel Modeling, Quantitative Applications in the Social Sciences. Thousand Oaks, CA:
Sage Publications. National Consortium for the Study of Terrorism and Responses to Terrorism (START). 2014. Global Terrorism
Database. |Data file| Available at:<http://www.start.umd.edu/gtd> [Accessed May 1, 2014]. Palmer, Glenn, Vito D'Orazio, Michael Kenwick, and Matthew Lane. 2015. “The MID4 Data Set, 2002-2010:
Procedures, Coding Rules and Description.” Conflict Management and Peace Science. Forthcoming. Raudenbush, Stephen W., and Anthony S. Bryk. 2002. Hierarchical Linear Models: Applications and Data Analysis
Methods. 2nd ed. Newbury Park, CA: Sage. Rubin, Donald. B. 1987. “Comment.” Journal of the American Statistical Association 82(398):543-546. Sandler, Todd. 2014. “The Analytical Study of Terrorism: Taking Stock.” Journal of Peace Research 51(2):257-
271. Shamir, Michal, and John Sullivan. 1983. “The Political Context of Tolerance: The United States and Israel.”
American Political Science Review 77(4):911-928. Steenbergen, Marco R., and Bradford S. Jones. 2002. “Modeling Multilevel Data Structures.” American Journal
of Political Science 46(1):218–237. Stegmueller, Daniel. 2013. “How Many Countries for Multilevel Modeling? A Comparison of Frequentist and
Bayesian Approaches.” American Journal of Political Science 57(3):748-761. Thompson, William R. 2001. “Identifying Rivals and Rivalries in World Politics.” International Studies Quarterly
45(4):557-586. World Bank. 2014. World Development Indicators. |Data file| Available at: <http://data.worldbank.org/data-
catalog/world-development-indicators> [Accessed May 1, 2014].