formulation and development of diltiazem hcl …...formulation and development of diltiazem hcl...
TRANSCRIPT
American Journal of Advanced Drug Delivery
www.ajadd.co.uk
American Journal of Advanced Drug Delivery www.ajadd.co.uk
Original Article
Formulation and Development of Diltiazem HCL Controlled Released Microcapsules by Ionotropic Gelation Technique Praveen Kumar Uppala*1, Madhusha Reddy.Y2, Murali Krishna.B3, Chakravarthi.G4, Ashok Reddy.P5
1,2 K.V.K. College of Pharmacy, Surmaiguda, Hayathnagar, R.R.District, A.P. India 3Sri Venkateswara College of Pharmacy, Etcherla, Srikakulam,Andhra Pradesh, India 4College of Pharmaceutical Sciences,Mohuda,Berhampur,Odisha, India 5T.R.R College of Pharmacy, Inole,Patancheru, Medak District, A.P. India
ABSTRACT
The aim of the present study was to prepare and evaluate microcapsules of Diltiazem Hydrochloride using blend of Sodium CMC and Xanthan Gum by Ionotropic Gelation technique for controlled release. Microscopic analysis data indicated that the prepared microcapsules were in the ranges of 1009 to 1311µm. SEM photographs confirm the prepared formulations are spherical in nature. DSC studies and FT IR spectra showed that the encapsulated drug was stable in the prepared formulations. The prepared formulations were analyzed quantitatively for the amount of encapsulated drug. From the drug loading, encapsulation efficiency and in vitro drug release data, optimum formulation F7 was selected. The optimum formulation shows the drug release of 84.04% up to 12 h having drug loading and encapsulation efficiency of 18.24 mg and 91.20% respectively. It was also observed that, there was no significant release of drug at gastric pH. The release kinetics for all the formulations indicated that drug release followed non -Fickian diffusion. The optimized formulation was selected for stability studies. The release performance was greatly affected by the ratio of materials used in preparation of microparticles. Diltiazem Hydrochloride loaded microcapsules have desirable release profiles and worthy of further investigation as an oral controlled release dosage form.
Keywords: Diltiazem Hydrochloride; Microparticles; controlled release; Ionotropic.
Date of Receipt- 28/07/2013 Date of Revision- 30/07/2013 Date of Acceptance- 02/09/2013
Address for Correspondence K.V.K. College of Pharmacy, Surmaiguda, Hayathnagar, R.R.District, A.P. India Tel. +91‐9441479276. E-mail: praveen.chintu32 @gmail.com

Uppala et al____________________________________________________ISSN-2321-547X
AJADD[1][4][2013]394‐412
INTRODUCTION
Oral drug delivery is the most desirable and preferred method of administering therapeutic agents for their systemic effects. In addition, the oral medication is generally considered as the first avenue investigated in the discovery and development of new drug entities and pharmaceutical formulations, mainly because of patient acceptance, convenience, and cost effective manufacturing process1.
It is an established fact that the conventional immediate release drug delivery systems when taken frequently in a day can maintain drug concentration levels in therapeutically effective range. The new way of patenting the drug is to use “Novel Drug Delivery Systems” i.e. NDDS with improved bioavailability (BA). To formulate a drug or to re-formulate it in a form of NDDS is not a Herculean task if one goes methodically and skillfully. This is where the formulation development studies play an important role2.
Drug absorption at the desired rate means, first to reach the effective plasma level within an acceptable short time period; second, to avoid an overshoot in the case of rapidly absorbed drugs and third to maintain effective plasma levels over the desired time period. Although the intensity of pharmacological effect is related to the drug concentration at the site of action, which is in turn, related to the plasma drug concentration, an ideal situation is obtained when the concentration is continuously maintained between minimum effective and maximum safe levels (Therapeutic Index). Invariably, conventional drug dosage forms do not maintain the drug3.
Modified release DDS, in general, can broadly divided into four categories:
Delayed release Site specific release Receptor release
Sustained release
Hypertensive is defined as an abnormal elevation in diastolic pressureand/or systolic pressure; mean arterial pressure is also elevated in hypertension, but it is not usually measured in people.
Controlled drug delivery containing polymeric carriers has gained increased interest in last two decades, because they can be fabricated into films, rods .and microparticles16.
A microparticle‟ may be defined as a spherical particle with size varying from 1 to 1000µm containing a core substance4.
Microencapsulation is a process of applying relatively thin coatings to small particles of solids or droplets of liquid containing one or more drugs and dispersions.
Reasons for Microencapsulation: • Sustained and prolonged release of
drugs. • Masking of unacceptable taste or odour
of drugs. • Preparation of free flowing powders
from drugs in liquid form. • Stabilization of drugs sensitive to
oxygen, moisture or light. • Elimination of incompatibilities among
drugs. • Prevention of vaporization of volatile
drugs. • Reduction of toxicity and to reduce
gastro-intestinal irritation. • Alteration in site of absorption.
Microparticles are encapsulated
particles between 1 and 1000 µm in size. The uniqueness of microencapsulation is the smallness of coated particles and their subsequent use and adaptation to a wide

Uppala et al____________________________________________________ISSN-2321-547X
AJADD[1][4][2013]394‐412
variety of dosage forms and product applications.
Controlled drug release from microparticles occurs by
1. Diffusion of drug through polymeric excipients,
2. Diffusion of entrapped drug as the polymer erodes, and
3. Release of drug through pores in the polymeric membrane.
If the drug is released by diffusion through the polymer without erosion, the release depends on the surface area of the microparticles and the path length followed by the drug in transit to the surrounding environment5.
Ionotropic gelation is based on the ability of polyelectrolytes to cross link in the presence of counter ions to form hydrogels. Since, the use of alginates, gellan gum, chitosan, and carboxymethyl cellulose for the encapsulation of drug and even cells, ionotropic gelation technique has been widely used for this purpose. It is generally understood that the release of drug from microcapsules/beads can be considered as mass transport phenomenon involving the diffusion of drug molecules from higher concentration in the dosage form to a region of lower concentration in the surrounding environment6. MATERIALS AND METHODS
Preparation of Diltiazem Hydrochloride microcapsules
An accurately weighed quantity of Diltiazem Hydrochloride was dispersed in an aqueous solution of carboxymethyl cellulose sodium (NaCMC) and Xanthan gum and mixed homogeneously using magnetic stirrer. Twenty milliliters of dispersion was extruded in the form of droplets into 100 ml aqueous solution of AlCl3 solution using 25 ml hypodermic syringe through a needle (number 23). The beads were removed after the defined gelation period and washed with
distilled water repeatedly to make free from un-reacted ions and dried at room temperature for 24 h and then at 40◦C for 10 h7.
Characterization of Microparticles: Particle size analysis8
The particle size of the prepared microbeads was measured by using a digimatic micrometer (MDC-255 Mitutoyo, Tokyo, Japan) having an accuracy of 0.001 mm. the average diameter of the 100 particles per batch was calculated. Scanning Electron Microscopic (SEM) studies9
SEM photographs were taken with a scanning electron microscope Model Joel- LV-5600, USA, at the required magnification at room temperature. The photographs were observed for morphological characteristics and to confirm spherical nature of the microparticles. Fourier Transform Infrared Spectroscopic (FT IR) studies10
FTIR analysis was carried out for pure drug and for microparticles with and without drug using KBr pellet method on FTIR spectrophotometer .Drug was mixed with KBr and spectra was taken. FT-IR spectrum of pure drug Diltiazem HCl was compared with FT-IR spectra of Diltiazem HCl formulations. Disappearance of peaks or shifting of peaks in any of the spectra was studied using the apparatus FTIR- 8400-S, Shimadzu, Japan. Differential Scanning Calorimetry (DSC)11
DSC is a technique in which the difference in heat flow between the sample and a reference is recorded versus temperature All dynamic DSC studies were carried out on Mettler Toledo thermal analyzer with 2010 DSC module. Calorimetric measurements were made with empty cell as the reference. The instrument
Uppala et al____________________________________________________ISSN-2321-547X
AJADD[1][4][2013]394‐412
was calibrated using high purity indium metal as standard. The dynamic scans were taken in nitrogen atmosphere at the heating rate of 10º c/min. The runs were made in triplicate. The scanning temperature for reference pure drug and formulation are the same when dynamic measurements are performed, and hence the required heat energy for chemical transformation is directly recorded on a heat flow versus temperature graph. The energy is measured as Joules per kilocalorie. X- Ray Diffraction Studies (XRD)12
The spectra were recorded using a P Analytical X’ Pert pro, x-ray diffractometer with Cu-Nf filtered CuKα radiation. Quartz was used an internal standard for calibration. The powder x-ray diffractometer was attached to a digital graphical assembly and computer with Cu-Nf 40 KV/30 mA tube as a CuKα radiation source in the 2θ range 0-50ºC.
Drug loading and encapsulation efficiency13
Drug loading is important with regard to release characteristics. Generally, increased drug loading leads to an acceleration of the drug release. Drug entrapment efficiency represents the proportion of the initial amount of drug, which has been incorporated into the microparticles. 100 mg of Diltiazem HCl microparticles were weighed and transferred to 100 ml volumetric flask containing pH 7.4 phosphate buffer. From this, 1 ml of solution was transferred to 10 ml volumetric flask and diluted up to the mark. Further 1 ml of this solution is diluted to 10 ml and absorbance was measured at 236 nm. The drug content was calculated by using the formula. Amount of drug = Conc. from standard graph X dilution factor
1000 Percentage encapsulation efficiency is
found out by calculating the amount of drug present in 100 mg of microparticles.
In vitro drug release studies14 The in vitro release of drug from the
microparticles was carried out in basket type dissolution tester USP XXIII, TDT-08L, with auto sampler containing 900 ml of pH 1.2 buffer for the first 2 hrs and in 7.4 pH phosphate buffer for the next 22 hrs. The volume of the dissolution media was maintained at 900 ml with constant stirring (100rpm) and temperature of bath was maintained at 37 ± 0.5°C. Aliquots (10 ml) of dissolution media were sampled at specified time points and replaced with fresh media immediately after sampling. Samples were analyzed for drug content by UV Visible spectroscopy .The release data obtained were fitted into various mathematical models to know which mathematical model is best fitting for the obtained release profile. Dissolution studies were carried out for all the batches of the prepared formulations (09 batches). DISCUSSION
The microcapsules of Xanthan gum and Sodium CMC containing diltiazem HCl were prepared by ionotropic gelation method using Aluminium chloride. The obtained microcapsules were spherical in shape and freely flowing. The surface morphology was examined by scanning electron microscopy studies (SEM). The SEM microphotographs of microcapsules showed that the prepared microcapsules are spherical, having rough surface without surface foldings.
FT IR spectra were obtained for Diltiazem HCl pure drug and Diltiazem HCl loaded microcapsules from the data it is observed that a similar characteristic peak of Diltiazem Hydrochloride and Formulation F7 were appeared with minor differences. The characteristics peaks found both in pure drug of Diltiazem and formulation F7, hence it appears there is chemical interaction between drug and polymer and it can be concluded that
Uppala et al____________________________________________________ISSN-2321-547X
AJADD[1][4][2013]394‐412
the characteristics bands of pure drugs were not affected after successful loading.
The DSC analysis of plain diltiazem, drug-free beads and drug-loaded beads was carried out. The drug-free beads have shown an endothermic peak at 117oC and 180 ◦C indicating melting temperature of the polymer, whereas drug-loaded beads showed an endothermic peak at 121oC. The plain diltiazem has shown a sharp endothermic peak at 215oC due to melting of the drug, but this peak is not seen in the drug-loaded beads. This indicates that the drug was molecularly dispersed in an amorphous state in the polymer matrix.
The X-ray diffractograms of diltiazem, drug free beads and drug-loaded beads are carried out. Diltiazem has shown characteristic intense peaks between the 2 of 8o and 16o due to its crystalline nature. Whereas, in case of drug loaded beads, no intense peaks related to drug were noticed between the 2 of 8o and 16o. This indicates the amorphous dispersion of the drug after entrapment into beads.
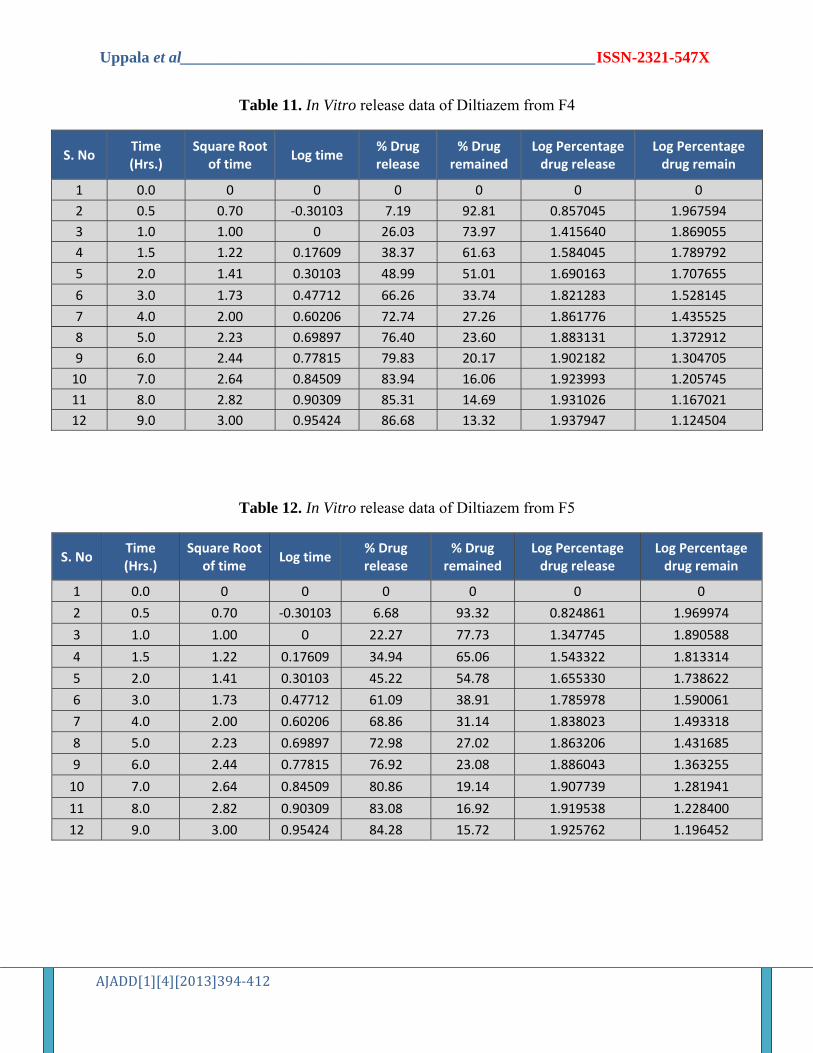
The in-vitro drug release study was performed using dissolution rate test apparatus in 0.1 N HCl (pH 1.2) and phosphate buffer (pH 7.4). The results indicate that the beads were capable of releasing drug up to 9 hours. The 96.96, 93.53, 90.18, 86.68, 84.28, 88.57 and 85.75 drug was released from F1, F2, F3, F4, F5, F8 and F9 beads at the end of 9th hour, while 89.52 and 84.04% drug was released from the crosslinked F6 and F7 beads respectively at the end of 12th hour. The beads which were prepared with higher concentration of AlCl3 released the drug more slowly. Also increase in concentration of the polymer resulted in decreased drug release. The increase in initial drug loading increased the drug release.
The stability study was performed for the prepared formulation as per the ICH guidelines and it showed that the formulation F7 was stable, with no physical change and
also there was no significant reduction in drug content.
CONCLUSION
From the FT-IR spectra, it was observed that similar characteristic peaks appear with minor differences for the drug and their formulations. Hence, it appears that there was no chemical interaction between the drug and the polymer used.
The DSC thermogram obtained for the pure drug, drug free beads and for the formulation shows that the drug was uniformly dispersed in an amorphous state in the polymer matrix.
The SEM studies clearly showed that the obtained microcapsules exhibited good spherical nature.
The XRD studies are useful to investigate the crystallinity of the drugs after entrapment into the dosage forms; the x-ray diffraction studies indicated the amorphous dispersion of the drug after entrapment into beads.
From the results of drug content determination, it can be inferred that there was a proper and uniform distribution of drug in the microcapsules prepared by Ionic Gelation method. The percentage encapsulation efficiency also showed that the drug loading is optimum.
The in vitro drug release indicated that the beads which were prepared with higher concentration of Aluminium chloride released the drug more slowly. Also increase in concentration of the polymer resulted in decreased drug release. The increase in initial drug loading increased the drug release. Drug release mechanism followed non-Fickian transport.
From the results of the present experimental work, it can be concluded that the microcapsules formulation is easy to administer, simple, comfortable, with increased patient compliance. Hence it is

Uppala et al____________________________________________________ISSN-2321-547X
AJADD[1][4][2013]394‐412
stated that Diltiazem Hydrochloride could be formulated into microcapsules as controlled drug release dosage form. REFERENCES 1. Manjanna K.M., Shivakumar.B.,
Pramodkumar T.M., “Formulation of oral sustained release aceclofenac microbeads”. International Journal of Pharm Tech Research. 2009; 1. (3): 940-952.
2. Banker GS, Anderson NR. Tablets: The theory and practice of industrial pharmacy. 3rd. Bombay: Varghese Pub. House; 2003.
3. Chein YW. Novel Drug Delivery Systems. 2nd Ed. New York: Marcel Dekker. Inc.1992.
4. Lee TW, Robinson JR. Remington: The Science and Practice of Pharmacy. 20th ed. Pennsylvania: Mack Publishing Company; 2001.
5. Aulton ME. Pharmaceutics: The Science of Dosage Form Design. 2nd ed. Livingstone C. Elsevier science Ltd; 2002.
6. Welling PG, Dobrinska M.Controlled drug delivery: Fundamentals and applications. 2nd ed. New York: Marcell Dekker Inc; 1987.
7. Brahmankar DM, Jaiswal SB. Biopharmaceutics and Pharmacokinetics a treatise. Reprint of 1st Edn. Delhi: Vallabh Prakashan; 2003.
8. BipulNath., L. K. Nath., B. Mazumdar., N. K. Sharma., M. K. Sarkar. “Preparation and in vitro evaluation of
gastric floating microcapsules of metformin HCL”. IJPER. 2008; 43. (2): 177-186.
9. D. M. Morkhad and S. B. Joshi. “Evaluation of Gum damar as a novel microencapsulating material for ibuprofen and diltiazem hydrochloride”. Indian Journal of Pharmaceutical Sciences. 2007; 69. (2): 263-268.
10. Sonali R. Naikwade and Amrita N. Bajaj. “Preparation and in vitro evaluation of fluticasone spray dried microspheres for pulmonary delivery”. IJPER. 2009; 43. (1): 16-27.
11. Rajat Ray., Siddhartha Maity., SanchitaMandal., Tapan K.,Chatterjee., Biswanath Sa., ‘‘Development and evaluation of a new Interpenetrating network bead of sodium carboxymethyl xanthan and sodium alginate for Ibuprofen release’’. Pharmacology & Pharmacy, 2010, 1: 9-17.
12. B. AppaRao., M.R. Shivalingam., Y.V. Kishore Reddy., N. Sunitha., T. Jyothibasu., T. Shyam. „„Design and evaluation of sustained release microcapsules containing Diclofenac sodium”. Int J Pharm Biomed Res, 2010; 1(3): 90-93.
13. Manjanna K.M., Shivakumar.B., Pramodkumar T.M. “Formulation of oral sustained release aceclofenac microbeads”. International Journal of PharmTech Research. 2009; 1. (3): 940-952.
14. ICH Harmonized Tripartite Guidelines, 2003. Stability testing of New Drug Substances and Products. Q1A (R2).

Uppala et al____________________________________________________ISSN-2321-547X
AJADD[1][4][2013]394‐412
Table 1. Microencapsulation processes & their applicabilities
Microencapsulation Processes & their Applicabilities Microencapsulation
process
Applicable core material
Approximate particle size (μm)
Air suspension Solids 35‐5000 Coacervation‐phase separation Solids & liquids 2‐5000
Multiorifice centrifugal Solids & liquids 1‐5000 Pan coating Solids 600‐5000
Solvent evaporation Solids & liquids 5‐5000 Spray drying and congealing Solids & liquids 600
Table 2. List of materials
MATERIALS SOURCE
Diltiazem Hydrochloride Shrushti Pharmaceuticals, Bangalore
Sodium CMC SD Fine chemicals Ltd., Mumbai
Xanthan Gum Kachabo Gums., Mumbai
Aluminium Chloride Hexahydrate Thomas Baker Chemicals Ltd, New Delhi
Potassium chloride Loba Chemie Pvt Ltd, Mumbai
Hydrochloric acid SD Fine chemicals, Mumbai
Sodium hydroxide pellets SD Fine chemicals, Mumbai Potassium dihydrogen orthophosphate SD Fine chemicals, Mumbai
Table 3. List of equipments and instruments
EQUIPMENT MODEL/ MANUFACTURER
Magnetic stirrer Remi motors, Mumbai
Digital balance Adair dutt instrument pvt. Ltd.
Hot air oven Tempo, Mumbai
Dissolution apparatus (6 basket) Lab India, LTD Mumbai, India.
UV – Visible spectrophotometer Shimadzu‐1700, Japan
FT‐IR spectrophotometer 8400S, Shimadzu, Japan
Scanning electron microscope JEOL, JSM‐6360, Kyoto, Japan

Uppala et al____________________________________________________ISSN-2321-547X
AJADD[1][4][2013]394‐412
Table 4. Formulation code of Diltiazem hydrochloride loaded microcapsules
Formulation codes
Xanthan gum (% w/v)
Sodium CMC (% w/v)
Aluminium chloride Hexahydrate (%w/v)
Curing Time
F 1 2.0 1.0 5 10 F 2 1.5 1.5 5 10 F 3 1.0 2.0 5 10 F 4 1.5 1.5 10 10 F 5 1.5 1.5 15 10 F 6 1.5 1.5 20 10 F 7 1.5 1.5 20 10 F 8 1.5 1.5 10 15 F 9 1.5 1.5 10 20
Table 5. Dissolution media used for prepared formulation
S. No Formulations Quantity used Dissolution media
For first 2 hrs For next 10 hrs
1 F1‐F9 Equivalent to 30 mg of Diltiazem Hydrochloride
pH 1.2 buffer
pH 7.4 phosphate buffer
Table 6. % Yield of Diltiazem Hydrochloride loaded microparticles
Formulation % Yield ± SD*
F1 85.76 ± 1.24 F2 81.58 ± 1.84 F3 83.80 ± 1.43
F4 87.29 ± 1.63
F5 89.59± 1.33
F6 91.05 ± 1.21
F7 95.50± 1.63
F8 88.75± 1.82
F9 88.95 ± 1.38 *Standard deviation, n = 3

Uppala et al____________________________________________________ISSN-2321-547X
AJADD[1][4][2013]394‐412
Table 7. Average bead size and drug entrapment efficiency (dee) of xanthan gum and
Sodium CMC beads
Microbeads Average size (�m) DEE (%)
F1 1204� 1.89 70.33� 0.052
F2 1120 ± 1.45 74.26� 0.085
F3 1064 ± 1.36 67.86� 0.15
F4 1009 ± 2.36 77.13� 0.45
F5 1311 ± 4.56 82.93� 0.75
F6 1277 ± 1.87 86.67� 0.45
F7 1259 ± 3.44 91.20� 0.08
F8 1250 ± 1.75 85.80� 0.42
F9 1246 ± 1.89 83.33� 0.75
The values are average of three determinations. ± indicates SD values
Table 8. In Vitro release data of Diltiazem from F1
S. No Time (Hrs.) Square Root
of time Log time
% Drug release
% Drug remained
Log Percentage drug release
Log Percentage drug remain
1 0.0 0 0 0 0 0 0 2 0.5 0.70 ‐0.30103 15.76 84.28 1.197584 1.928498 3 1.0 1.00 0 34.26 65.74 1.534826 1.817829 4 1.5 1.22 0.17609 50.02 49.98 1.699179 1.698796 5 2.0 1.41 0.30103 64.41 35.59 1.808984 1.551327 6 3.0 1.73 0.47712 78.80 21.20 1.896554 1.326335 7 4.0 2.00 0.60206 86.68 13.32 1.937947 1.124504 8 5.0 2.23 0.69897 90.45 9.55 1.956430 0.980003 9 6.0 2.44 0.77815 92.85 7.51 1.967796 0.875639 10 7.0 2.64 0.84509 93.88 6.12 1.972577 0.786751 11 8.0 2.82 0.90309 95.59 4.41 1.980431 0.644438 12 9.0 3.00 0.95424 96.96 3.04 1.986613 0.482873

Uppala et al____________________________________________________ISSN-2321-547X
AJADD[1][4][2013]394‐412
Table 9. In Vitro release data of Diltiazem from F2
S. No Time (Hrs.)
Square Root of time
Log time % Drug release
% Drug remained
Log Percentage drug release
Log Percentage drug remain
1 0.0 0 0 0 0 0 0 2 0.5 0.70 ‐0.30103 10.96 89.09 1.039976 1.949828 3 1.0 1.00 0 29.46 70.54 1.469325 1.848435 4 1.5 1.22 0.17609 45.22 54.78 1.655400 1.738622 5 2.0 1.41 0.30103 57.21 42.79 1.757543 1.631342 6 3.0 1.73 0.47712 74.00 26.00 1.869280 1.414973 7 4.0 2.00 0.60206 81.13 18.87 1.909208 1.275771 8 5.0 2.23 0.69897 85.34 14.66 1.931200 1.166133 9 6.0 2.44 0.77815 87.91 12.09 1.944083 1.082426 10 7.0 2.64 0.84509 90.18 9.82 1.955112 0.992111 11 8.0 2.82 0.90309 92.13 7.87 1.964417 0.895974 12 9.0 3.00 0.95424 93.53 4.47 1.970989 0.650307
Table 10. In Vitro release data of Diltiazem from F3
S. No Time (Hrs.)
Square Root of time
Log time % Drug release
% Drug remained
Log Percentage drug release
Log Percentage drug remain
1 0.0 0 0 0 0 0 0 2 0.5 0.70 ‐0.30103 9.59 90.41 0.981984 1.956216
3 1.0 1.00 0 27.41 72.59 1.437916 1.860876
4 1.5 1.22 0.17609 41.45 58.55 1.617611 1.767526 5 2.0 1.41 0.30103 52.42 47.58 1.719517 1.677424 6 3.0 1.73 0.47712 69.55 30.45 1.842322 1.483587
7 4.0 2.00 0.60206 75.72 24.28 1.879218 1.385248
8 5.0 2.23 0.69897 79.83 20.17 1.902182 1.304705 9 6.0 2.44 0.77815 82.91 17.09 1.918641 1.232742
10 7.0 2.64 0.84509 86.68 13.32 1.937947 1.124504
11 8.0 2.82 0.90309 88.39 11.61 1.946446 1.064832 12 9.0 3.00 0.95424 90.18 9.82 1.955112 0.992111
Uppala et al____________________________________________________ISSN-2321-547X
AJADD[1][4][2013]394‐412
Table 11. In Vitro release data of Diltiazem from F4
S. No Time (Hrs.)
Square Root of time
Log time % Drug release
% Drug remained
Log Percentage drug release
Log Percentage drug remain
1 0.0 0 0 0 0 0 0 2 0.5 0.70 ‐0.30103 7.19 92.81 0.857045 1.967594 3 1.0 1.00 0 26.03 73.97 1.415640 1.869055 4 1.5 1.22 0.17609 38.37 61.63 1.584045 1.789792
5 2.0 1.41 0.30103 48.99 51.01 1.690163 1.707655
6 3.0 1.73 0.47712 66.26 33.74 1.821283 1.528145
7 4.0 2.00 0.60206 72.74 27.26 1.861776 1.435525 8 5.0 2.23 0.69897 76.40 23.60 1.883131 1.372912 9 6.0 2.44 0.77815 79.83 20.17 1.902182 1.304705 10 7.0 2.64 0.84509 83.94 16.06 1.923993 1.205745 11 8.0 2.82 0.90309 85.31 14.69 1.931026 1.167021 12 9.0 3.00 0.95424 86.68 13.32 1.937947 1.124504
Table 12. In Vitro release data of Diltiazem from F5
S. No Time (Hrs.)
Square Root of time
Log time % Drug release
% Drug remained
Log Percentage drug release
Log Percentage drug remain
1 0.0 0 0 0 0 0 0
2 0.5 0.70 ‐0.30103 6.68 93.32 0.824861 1.969974
3 1.0 1.00 0 22.27 77.73 1.347745 1.890588
4 1.5 1.22 0.17609 34.94 65.06 1.543322 1.813314
5 2.0 1.41 0.30103 45.22 54.78 1.655330 1.738622
6 3.0 1.73 0.47712 61.09 38.91 1.785978 1.590061
7 4.0 2.00 0.60206 68.86 31.14 1.838023 1.493318
8 5.0 2.23 0.69897 72.98 27.02 1.863206 1.431685
9 6.0 2.44 0.77815 76.92 23.08 1.886043 1.363255
10 7.0 2.64 0.84509 80.86 19.14 1.907739 1.281941
11 8.0 2.82 0.90309 83.08 16.92 1.919538 1.228400
12 9.0 3.00 0.95424 84.28 15.72 1.925762 1.196452

Uppala et al____________________________________________________ISSN-2321-547X
AJADD[1][4][2013]394‐412
Table 13. In Vitro release data of Diltiazem from F6
S. No Time (Hrs.)
Square Root of time
Log time % Drug release
% Drug remained
Log Percentage drug release
Log Percentage drug remain
1 0.0 0 0 0 0 0 0 2 0.5 0.70 ‐0.30103 3.76 96.30 0.576219 1.984887 3 1.0 1.00 0 14.39 85.61 1.158076 1.943197 4 1.5 1.22 0.17609 28.78 71.22 1.459106 1.886772 5 2.0 1.41 0.30103 38.13 61.87 1.581322 1.822102 6 3.0 1.73 0.47712 51.7 48.30 1.713516 1.722798 7 4.0 2.00 0.60206 62.05 37.95 1.792745 1.631342 8 5.0 2.23 0.69897 68.83 31.17 1.837806 1.560384 9 6.0 2.44 0.77815 73.04 26.96 1.863614 1.493318 10 7.0 2.64 0.84509 76.61 23.39 1.884298 1.447932 11 8.0 2.82 0.90309 78.8 21.20 1.896554 1.397940 12 9.0 3.00 0.95424 81.44 18.56 1.910856 1.350829 13 10.0 3.16 1 84.35 15.56 1.926115 1.304705 14 11.0 3.31 1.041393 86.95 13.05 1.939318 1.249687 15 12.0 3.46 1.079181 89.52 10.48 1.951966 1.203032
Table 14. In Vitro release data of Diltiazem from F7
S. No Time (Hrs.)
Square Root of time
Log time % Drug release
% Drug remained
Log Percentage drug release
Log Percentage drug remain
1 0.0 0 0 0 0 0 0 2 0.5 0.70 ‐0.30103 3.42 96.58 0.534826 1.984887 3 1.0 1.00 0 12.26 87.74 1.088709 1.943197 4 1.5 1.22 0.17609 22.95 77.05 1.360901 1.886772 5 2.0 1.41 0.30103 33.61 66.39 1.526496 1.822102 6 3.0 1.73 0.47712 47.18 52.82 1.673760 1.722798 7 4.0 2.00 0.60206 57.21 42.79 1.757543 1.631342 8 5.0 2.23 0.69897 63.66 36.34 1.803872 1.560384 9 6.0 2.44 0.77815 68.86 31.14 1.838023 1.493318 10 7.0 2.64 0.84509 71.95 28.05 1.857046 1.447932 11 8.0 2.82 0.90309 75.00 25.00 1.875072 1.397940 12 9.0 3.00 0.95424 77.57 22.43 1.889703 1.350829 13 10.0 3.16 1 79.83 20.17 1.902182 1.304705 14 11.0 3.31 1.041393 82.23 17.77 1.915038 1.249687 15 12.0 3.46 1.079181 84.04 15.96 1.924524 1.203032

Uppala et al____________________________________________________ISSN-2321-547X
AJADD[1][4][2013]394‐412
Table 15. In Vitro release data of Diltiazem from F8
S. No Time (Hrs.)
Square Root of time
Log time % Drug release
% Drug remained
Log Percentage drug release
Log Percentage drug remain
1 0.0 0 0 0 0 0 0
2 0.5 0.70 ‐0.30103 9.59 90.41 0.981985 1.956216 3 1.0 1.00 0 27.06 72.94 1.432454 1.862965 4 1.5 1.22 0.17609 39.74 60.26 1.599285 1.780029 5 2.0 1.41 0.30103 52.07 47.93 1.716670 1.680607 6 3.0 1.73 0.47712 68.86 31.14 1.838023 1.493318 7 4.0 2.00 0.60206 75.37 24.63 1.877249 1.391464 8 5.0 2.23 0.69897 78.53 21.47 1.895041 1.331832 9 6.0 2.44 0.77815 82.57 17.43 1.916844 1.241297 10 7.0 2.64 0.84509 85.96 14.04 1.934327 1.147367
11 8.0 2.82 0.90309 87.61 12.39 1.942557 1.093071
12 9.0 3.00 0.95424 88.57 11.43 1.947287 1.058046 13 10.0 3.16 1 14 11.0 3.31 1.041393 15 12.0 3.46 1.079181
Table 16. In Vitro release data of Diltiazem from F9
S. No Time (Hrs.)
Square Root of time
Log time % Drug release
% Drug remained
Log Percentage drug release
Log Percentage drug remain
1 0.0 0 0 0 0 0 0 2 0.5 0.70 ‐0.30103 7.75 92.25 0.8893 1.964966 3 1.0 1.00 0 14.20 85.80 1.15228 1.933487 4 1.5 1.22 0.17609 24.86 75.14 1.3955 1.875871 5 2.0 1.41 0.30103 33.53 66.47 1.525453 1.822625 6 3.0 1.73 0.47712 43.62 56.38 1.63968 1.751125 7 4.0 2.00 0.60206 52.85 47.15 1.72044 1.673481 8 5.0 2.23 0.69897 68.64 31.36 1.83657 1.496376 9 6.0 2.44 0.77815 77.63 22.37 1.890029 1.349665 10 7.0 2.64 0.84509 81.50 18.50 1.911157 1.267171 11 8.0 2.82 0.90309 84.38 15.62 1.92623 1.193681 12 9.0 3.00 0.95424 85.75 14.25 1.93323 1.153814 13 10.0 3.16 1 14 11.0 3.31 1.041393 15 12.0 3.46 1.079181

Uppala et al____________________________________________________ISSN-2321-547X
AJADD[1][4][2013]394‐412
Table 17. FT-IR Spectral data of pure Diltiazem hydrochloride and formulation Containing Diltiazem hydrochloride
Group Frequency of Pure drug(in cm‐1)
Frequency of pure drug(in cm‐1) Frequency of F7 (in cm‐1)
Aliphatic N‐H stretch 3446.91 3421.83 O‐CH3,C‐H stretch 2966.62 2935.76 Two C=O groups 1743.71, 1681.96 1743.71, 1678.13
N‐H df 1255.70 1253.77 Aliphatic C‐N stretch 1219.05 1219.05
O‐substituted aromatic C‐H out of plane deformation
839.06 837.13
p‐substituted aromatic C‐H out of plane deformation
781.57 782.2
Figure.1. Plasma level profiles following conventional and controlled release dosing

Uppala et al____________________________________________________ISSN-2321-547X
AJADD[1][4][2013]394‐412
Figure.2. FT‐IR spectra of Diltiazem Hydrochloride pure drug, formulation F7

Uppala et al____________________________________________________ISSN-2321-547X
AJADD[1][4][2013]394‐412
Figure.3. DSC of Diltiazem Hydrochloride pure drug, Drug free beads, formulation F7

Uppala et al____________________________________________________ISSN-2321-547X
AJADD[1][4][2013]394‐412
Figure.4. XRD of Diltiazem Hydrochloride pure drug, formulation F7 and Drug free beads

Uppala et al____________________________________________________ISSN-2321-547X
AJADD[1][4][2013]394‐412
Figure.5. In vitro release profile of diltiazem from xanthan gum and CMC beads F1, F2, F3
Figure.6. In vitro release profile of diltiazem from xanthan gum and CMC beads F4, F5, F6

Uppala et al____________________________________________________ISSN-2321-547X
AJADD[1][4][2013]394‐412
Figure.7. In vitro release profile of diltiazem from xanthan gum and CMC beads F7, F8, F9