formatting solutions version 2 -...
TRANSCRIPT

Introduction 1

2 IGSS32 Getting Started with ERW
Table of Contents
Introduction.................................................................................................................................. 3 What is ERW? ..................................................................................................................................... 3
Report tool........................................................................................................................................ 3 System Requirements .......................................................................................................................... 3 Installation ........................................................................................................................................... 3 Purpose of This Document .................................................................................................................. 3 Before We Begin ................................................................................................................................. 3
Example 1: A Simple Report on Flow Measurement ............................................................... 4 Purpose of the report ........................................................................................................................ 4 Task 1: Create a report folder and set up an Excel spreadsheet........................................................ 4 Task 2: Open ERW and load the Excel spreadsheet......................................................................... 4 Task 3: Setting up ERW with the objects desired for a report.......................................................... 5 Task 4: Binding configured ERW objects to the Excel cells in the spreadsheet report.................... 9 Task 5: Preparing to view or print the report.................................................................................. 11
Example 2: A 24 Hour Report on Flow Measurement............................................................ 14 Purpose of the report ...................................................................................................................... 14 Task 1: Create a report folder and create an Excel file................................................................... 14 Task 2: Format the DataPre sheet in Excel: create “target” area for data from ERW .................... 14 Task 3: Format the DataPre sheet in Excel: create “peel away” area ............................................. 15 Task 4: Format the DataPre sheet: create “validation” area and insert formula ............................. 17 Task 5: Format the Data sheet: consolidated data presentation...................................................... 17 Task 6: Lay out the Correction sheet.............................................................................................. 18 Task 7: Lay out and format the FinalReport sheet.......................................................................... 19 Task 8: Select the objects and their reduction methods in ERW.................................................... 20 Task 9: Binding the objects selected in ERW with Excel .............................................................. 22 Task 10: Choosing sheets to output, time intervals and previewing the report .............................. 24 Concluding Remarks ...................................................................................................................... 26
Version Information .......................................................................................................................... 27

Introduction 3
Introduction
What is ERW? ERW is an acronym for EEEvvveeennnttt RRReeepppooorrrttt WWWrrriiittteeerrr, which is an optional reporting module for the IGSS software package. ERW represents a new concept for IGSS because it now becomes possible to handle and present process data in a myriad of different ways. Users are thus provided with an even greater degree of flexibility in organising their data and displaying these in a meaningful framework.
ERW is programmed in MS Access 2000 and consists of two separate pieces of software: ERW Tools and ERW. The Tools software is used for viewing various types of logged data from IGSS, for managing report configuration directly by manipulating databases (Note: This should only be done by an experienced user), setting default working directories, etc. ERW itself is used for the basic construction of reports such as object selection from the IGSS configuration and generation of reports based on the configuration.
System Requirements The following software must be present on the PC where ERW is to be run:
•= MS Access 2000 (or Run Time Access 2000)
•= MS Excel 2000 ERW uses these two applications for the configuration of reports, to perform, if desired, calculations on the report data and to determine report layout. The ERW module cannot be used with HMI/Light versions of IGSS and is only compatible with IGSS version 3 or higher.
Installation The only installation procedure necessary is to copy a new license file (options.txt) into the GSS subfolder on the hard disk where IGSS has been installed. This new license file is received upon purchase of the ERW module.
Purpose of This Document Because the ERW module is not yet widely known and used, 7-Technologies has produced this short introduction to its practical use. The examples, which follow, are intended to give the user a better insight into how to set up reports using the ERW software. After a closer look at the examples the user should then have a better grasp of ERW functionality and thus be able to experiment further on his own.
Before We Begin To generate ERW reports, the configuration upon which the report is based must be running. In the example that follows, we’ve based our ERW report on the IGSS32 version 3 demo configuration. IMPORTANT: Before using the ERW program, you must make sure that the decimal character is set to a “.” (period) and that the thousands separator is set to a “,” (comma) in Regional Settings→Number in the Windows NT Control Panel or in Regional Options→Number in the Windows 2000 Control Panel.
Report tool
4 IGSS32 Getting Started with ERW
Example 1: A Simple Report on Flow Measurement
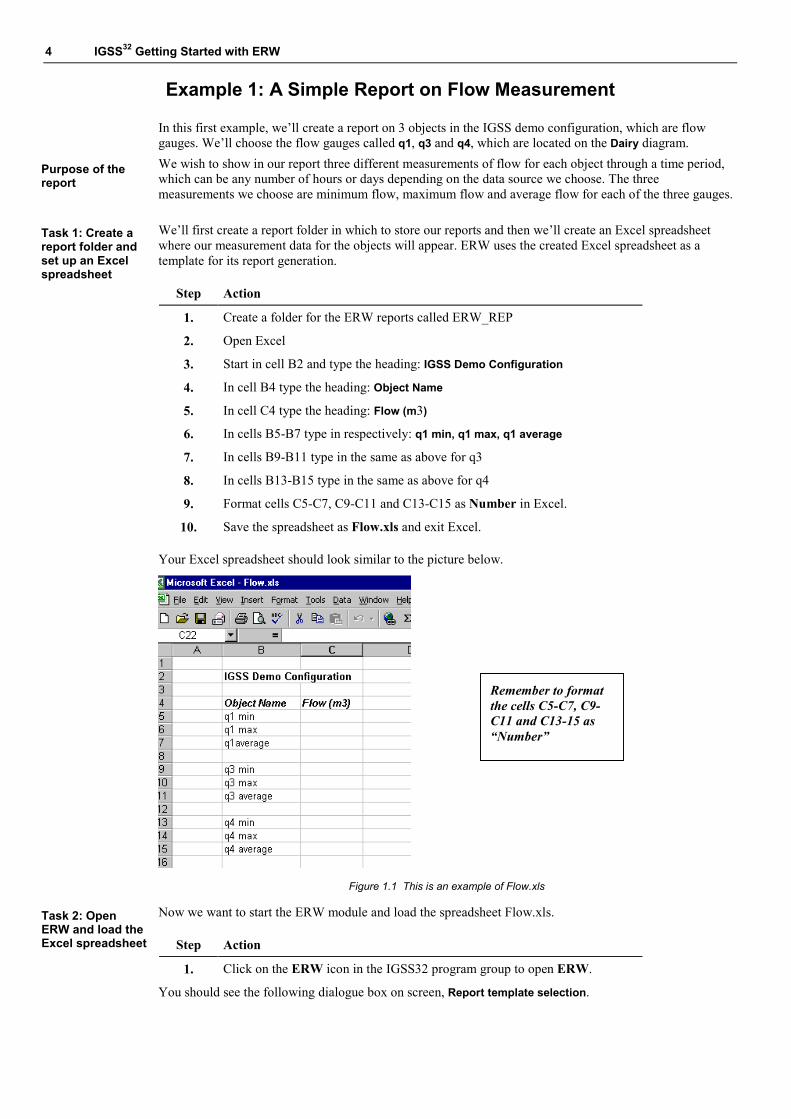
In this first example, we’ll create a report on 3 objects in the IGSS demo configuration, which are flow gauges. We’ll choose the flow gauges called q1, q3 and q4, which are located on the Dairy diagram. We wish to show in our report three different measurements of flow for each object through a time period, which can be any number of hours or days depending on the data source we choose. The three measurements we choose are minimum flow, maximum flow and average flow for each of the three gauges. We’ll first create a report folder in which to store our reports and then we’ll create an Excel spreadsheet where our measurement data for the objects will appear. ERW uses the created Excel spreadsheet as a template for its report generation.
Step Action
1. Create a folder for the ERW reports called ERW_REP
2. Open Excel
3. Start in cell B2 and type the heading: IGSS Demo Configuration
4. In cell B4 type the heading: Object Name
5. In cell C4 type the heading: Flow (m3)
6. In cells B5-B7 type in respectively: q1 min, q1 max, q1 average
7. In cells B9-B11 type in the same as above for q3
8. In cells B13-B15 type in the same as above for q4
9. Format cells C5-C7, C9-C11 and C13-C15 as Number in Excel.
10. Save the spreadsheet as Flow.xls and exit Excel.
Your Excel spreadsheet should look similar to the picture below.
Figure 1.1 This is an example of Flow.xls
Now we want to start the ERW module and load the spreadsheet Flow.xls.
Step Action
1. Click on the ERW icon in the IGSS32 program group to open ERW.
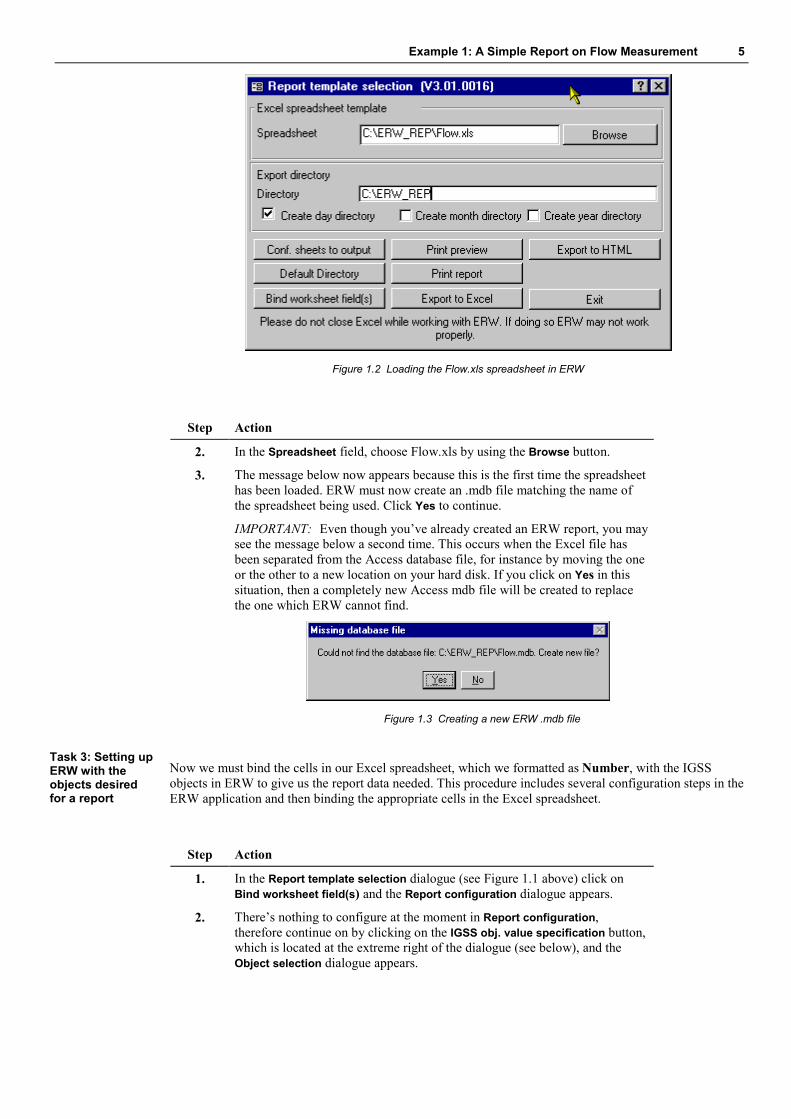
You should see the following dialogue box on screen, Report template selection.
Purpose of the report
Task 1: Create a report folder and set up an Excel spreadsheet
Task 2: Open ERW and load the Excel spreadsheet
Remember to format the cells C5-C7, C9-C11 and C13-15 as “Number”
Example 1: A Simple Report on Flow Measurement 5
Figure 1.2 Loading the Flow.xls spreadsheet in ERW
Step Action
2. In the Spreadsheet field, choose Flow.xls by using the Browse button.
3. The message below now appears because this is the first time the spreadsheet has been loaded. ERW must now create an .mdb file matching the name of the spreadsheet being used. Click Yes to continue.
IMPORTANT: Even though you’ve already created an ERW report, you may see the message below a second time. This occurs when the Excel file has been separated from the Access database file, for instance by moving the one or the other to a new location on your hard disk. If you click on Yes in this situation, then a completely new Access mdb file will be created to replace the one which ERW cannot find.
Figure 1.3 Creating a new ERW .mdb file
Now we must bind the cells in our Excel spreadsheet, which we formatted as Number, with the IGSS objects in ERW to give us the report data needed. This procedure includes several configuration steps in the ERW application and then binding the appropriate cells in the Excel spreadsheet.
Step Action
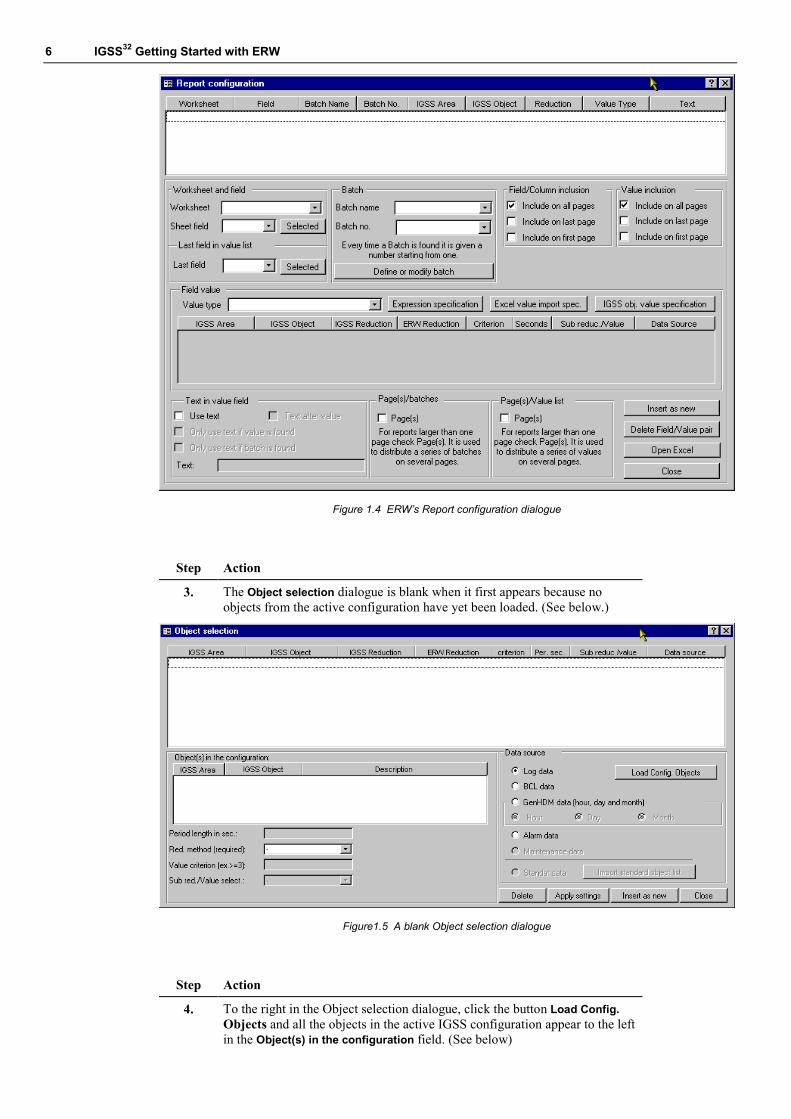
1. In the Report template selection dialogue (see Figure 1.1 above) click on Bind worksheet field(s) and the Report configuration dialogue appears.
2. There’s nothing to configure at the moment in Report configuration, therefore continue on by clicking on the IGSS obj. value specification button, which is located at the extreme right of the dialogue (see below), and the Object selection dialogue appears.
Task 3: Setting up ERW with the objects desired for a report
6 IGSS32 Getting Started with ERW
Figure 1.4 ERW’s Report configuration dialogue
Step Action
3. The Object selection dialogue is blank when it first appears because no objects from the active configuration have yet been loaded. (See below.)
Figure1.5 A blank Object selection dialogue
Step Action
4. To the right in the Object selection dialogue, click the button Load Config. Objects and all the objects in the active IGSS configuration appear to the left in the Object(s) in the configuration field. (See below)

Example 1: A Simple Report on Flow Measurement 7
Figure 1.6 Objects visible from the active configuration
Step Action
5. Use the scroll bar in Object(s) in the configuration to locate the first object to include in the report, q1, and choose it with the mouse cursor.
6 Now go to the drop down box directly underneath called Red. method (required) and choose Average.
7. To the right under Data source, make sure that Log data is chosen.
8. At the bottom right of the dialogue, click the button Insert as new and the object and its reduction method are placed in the topmost field of the Object selection dialogue. (See below.)
Figure 1.7 Selecting objects and their reduction method from the active configuration
Step Action
9. Keep q1 selected in Object(s) in the configuration and now select Minimum in the Red. method (required) drop down box.

8 IGSS32 Getting Started with ERW
10. Move to the right and again click the button Insert as new, and the q1object and Minimum reduction method appear in the topmost list in the dialogue together with the first choice (q1 and Average).
11. Keep q1 selected in Object(s) in the configuration and select the last reduction method we’ll use in Red. method (required) called Maximum.
12. Move to the right and again click the button Insert as new, and the q1object and Maximum reduction method appear in the topmost list in the dialogue together with the first and second choices (q1 and Average and q1 and Minimum).(See below.)
Figure 1.8 All the reduction methods for q1 have been inserted in the list for reporting
Step Action
13. Repeat steps 5. to 12. for the object q3.
14. Repeat steps 5. to 12. for the object q4.
15. Click on Close when finished and the Report configuration dialogue appears.
Example 1: A Simple Report on Flow Measurement 9
Figure 1.9 Objects ready to be made selectable
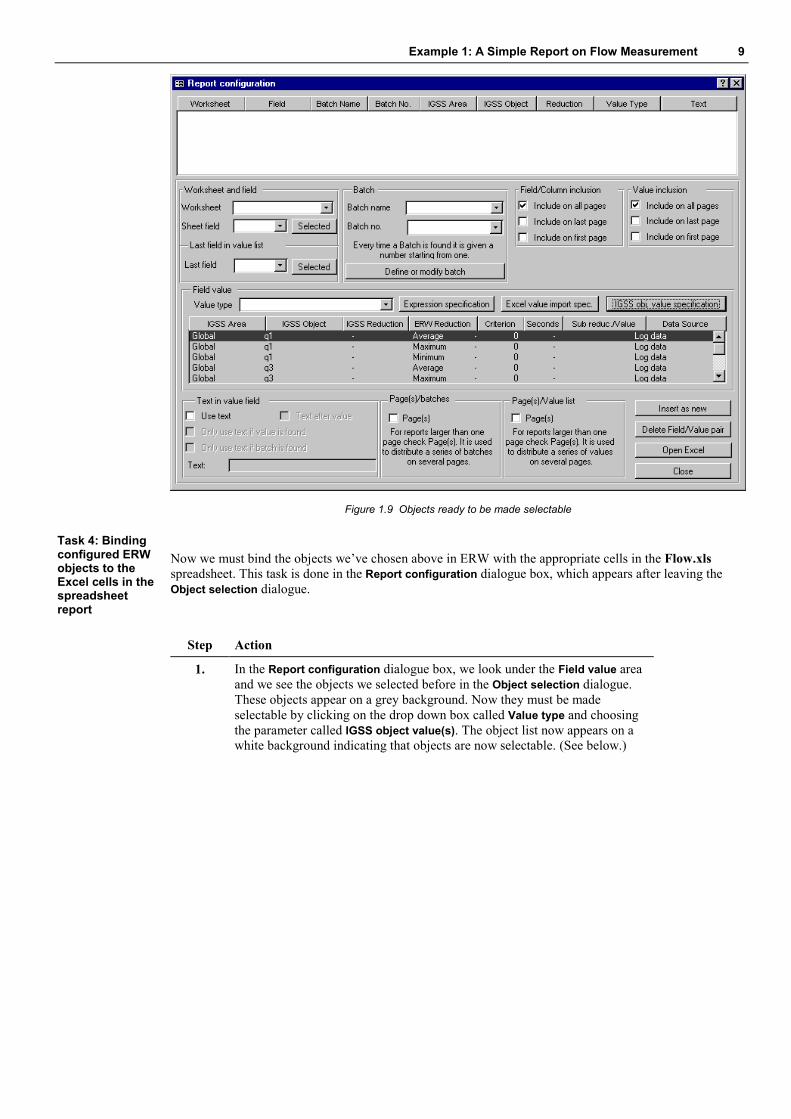
Now we must bind the objects we’ve chosen above in ERW with the appropriate cells in the Flow.xls spreadsheet. This task is done in the Report configuration dialogue box, which appears after leaving the Object selection dialogue.
Step Action
1. In the Report configuration dialogue box, we look under the Field value area and we see the objects we selected before in the Object selection dialogue. These objects appear on a grey background. Now they must be made selectable by clicking on the drop down box called Value type and choosing the parameter called IGSS object value(s). The object list now appears on a white background indicating that objects are now selectable. (See below.)
Task 4: Binding configured ERW objects to the Excel cells in the spreadsheet report

10 IGSS32 Getting Started with ERW
Figure 1.10 Making objects selectable in the Report configuration dialogue
2 Select the from the list q1 Average. (See below.)
3. In the Windows Task Bar (at the bottom of your screen), click on the Excel icon and the Flow.xls spreadsheet appears in Excel.
4. Select the cell where the q1 Average value is to appear, in our example C7.
5. In the Task Bar click on the ERW IGSS32 icon to come back to the Report configuration dialogue.
6. Under the Worksheet and field area in the upper left of the dialogue, click to the right of the Sheet field drop down box on the button Selected and the correct sheet name and correct cell number location appear for q1 average.
7. At the bottom right of the Report configuration dialogue, click the button Insert as new and the chosen object with correct spreadsheet binding appears in the uppermost list of the dialogue box. (See below.)

Example 1: A Simple Report on Flow Measurement 11
Figure 1.11 Binding Excel cells to objects in ERW
Step Action
8. Repeat steps 2. to 7. for all the other objects in the list under the Field value area and being careful to select the correct Excel cell to be bound to each different object reduction method.
9. When finished click the Close button on the right side of the dialogue box and the Report template selection dialogue appears again.
Our next task is to prepare the report for either viewing or printing. This is done in the dialogue box we started in when we first chose our Excel file, the Report template selection. (See below)
Figure 1.12 Settings for viewing and printing reports are accessed through Print preview
Task 5: Preparing to view or print the report

12 IGSS32 Getting Started with ERW
Step Action
1. In the Export directory area, put a check mark in Create day directory to have ERW create a directory with the number of the day and place the generated report in this directory. The date used for the directory generation is the report start time.
2. Now click on the Print preview button and the Report period selection dialogue appears. (See below)
Figure 1.13 Choosing the time span of a report
Step Action
3. At the top of the dialogue, choose the month and year for the report in the drop down boxes.
4. On the resulting calendar displayed just below, click a date to use as the start date for the report.
5. Now click the button underneath the calendar called Use as start date/time, and the date and default time of 00:00:00 appear in the field Report start time. Logged object values time stamped with the same time as the report start time are included in the data set of the report.
6. Go back to the calendar and click on a later date as the end date for the report.
7 Now click the button underneath the calendar called Use as stop date/time, and the date and default time of 00:00:00 appear in the field Report stop time. Logged object values time stamped with the same time as the report stop time are not included in the data set of the report.
Example 1: A Simple Report on Flow Measurement 13
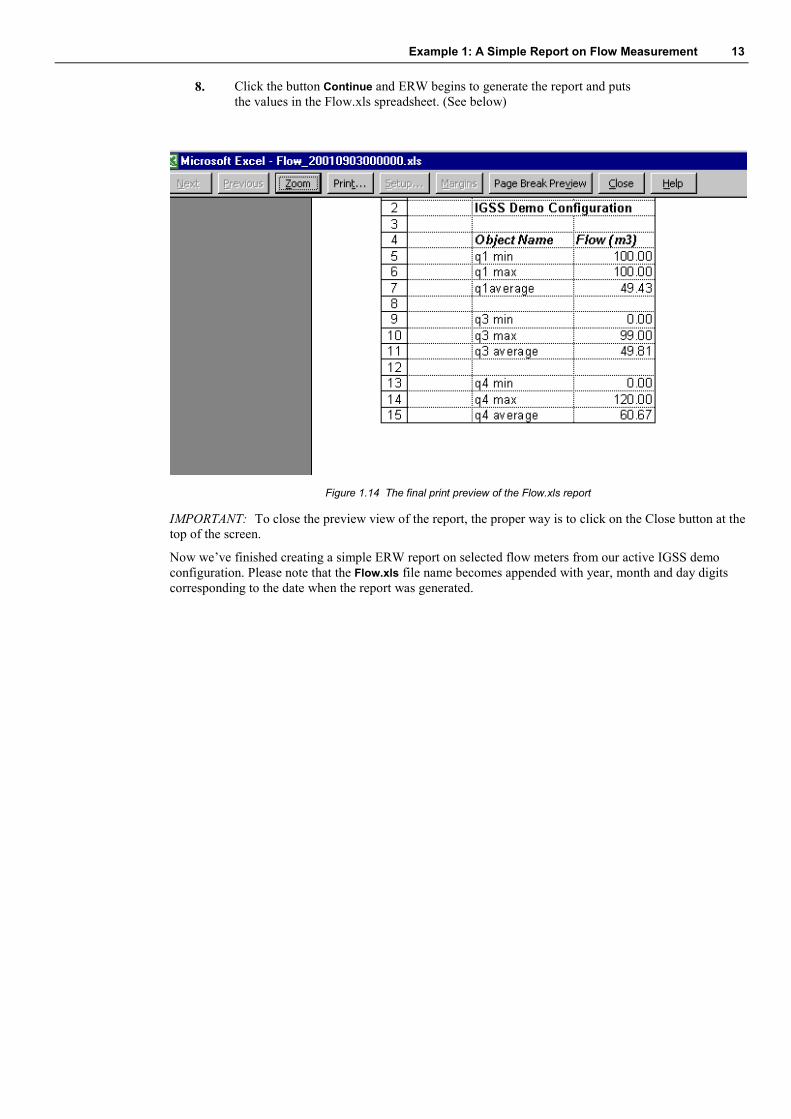
8. Click the button Continue and ERW begins to generate the report and puts the values in the Flow.xls spreadsheet. (See below)
Figure 1.14 The final print preview of the Flow.xls report
IMPORTANT: To close the preview view of the report, the proper way is to click on the Close button at the top of the screen.
Now we’ve finished creating a simple ERW report on selected flow meters from our active IGSS demo configuration. Please note that the Flow.xls file name becomes appended with year, month and day digits corresponding to the date when the report was generated.

14 IGSS32 Getting Started with ERW
Example 2: A 24 Hour Report on Flow Measurement
In this example, we’ll create a 24 hour report on the two flow gauges in the IGSS version 3 demo configuration called q1 and q2, which are located on the Dairy diagram. We choose to show the minimum, maximum and average flow in the course of a 24 hour period for each gauge. We can then use this report to generate a standard daily report for our gauges. As data source for the report we’ll be using the so-called GenHDM hourly data generated by the IGSS system itself.
In contrast to the first example in this manual, we’ll create several Excel sheets in a single workbook, which along with some specific Excel functionality, we’ll use to validate and ensure correct placement of hourly values in our report.
After we’ve created this Excel template, then we’ll go on to the task of binding cells from one of the Excel sheets we’ve created to the objects in ERW for which we require report data.
If you haven’t yet created a report folder as described in Example 1, Task 1 on page 4, then follow the instructions there. Come back to this section afterwards to continue with Example 2.
For setting up an Excel spreadsheet for our 24 hour report we’ll configure four sheets called FinalReport, Correction, Data and DataPre. The last three sheets are used to pre-process the data exported by ERW before being passed on to the FinalReport sheet.
The purpose of the DataPre sheet is twofold. Firstly, it’s used to fetch the data we’ll use for our report, i.e. it’s here we bind the cells of the Excel spreadsheet to our data input from ERW. Secondly, it’s used to ensure the correct placement of data coming into the sheet in relation to the time stamp of the data, i.e. it’s here we validate our data. In case of missing data for a given hour, we want to make sure that a value of zero is inserted for the hour in question. This prevents data from being shifted to an incorrect hour, which would then give us an erroneous report.
The Data sheet is used to fetch the validated data from the DataPre sheet. The Correction sheet is for the user to be able to manually key in missing (or incorrect) hourly values. The FinalReport sheet is used as the final layout and data record for the report. This sheet fetches its data from the Correction sheet and the Data sheet by adding the values together found on each sheet for each of the 24 hours and for each object and its respective reduction method.
Step Action
1. Open Excel.
2. Create 4 sheets and name them FinalReport, Correction, Data and DataPre.
3 Save the Excel file in the ERW_REP folder as 24hrflow.xls
The uppermost part of the DataPre sheet we’ll use for binding to the IGSS objects in ERW, from which we want data to appear in our report. This will be our “target area” for the data we want to work with in creating our report. We should add titles and headings, which clearly show the object names and hourly intervals through a 24-hour time span. We set aside 24 cells vertically. Note that we must repeat these columns of 24 cells for each type of measurement we want data for, i.e. Minimum, Maximum and Average, as well as for each object.
Step Action
1. Go to the DataPre sheet in the 24hrflow.xls workbook.
2. In cell B2 write q1 values from IGSS32 DenHDM hour data as title.
3. In cells B3 and C3 write in Hour and Min[m3/h] respectively as column headers.
4. In cells D3 and E3 write in Hour and Max[m3/h] respectively as column headers.
5. In cells F3 and G3 write in Hour and Avg[m3/h] respectively as column headers.
6. In cell H2 write in q2 values from IGSS32 GenHDM hour values as title.
7. Repeat steps 3. to 5. and substitute column letter pairs H/I, J/K and L/M.
Purpose of the report
Task 1: Create a report folder and create an Excel file.
Task 2: Format the DataPre sheet in Excel: create “target” area for data from ERW

Example 2: A 24 Hour Report on Flow Measurement 15
8. Format cells B4-B27, D4-D27, F4-F27, H4-H27, J4-J27 and L4-L27 as Date
9. Format cells C4-C27, E4-E27, G4-G27, I4-I27, K4-K27 and M4-M27 as Number. (See below for layout.)
Figure 2.1 Lay outing the DataPre sheet: cells to bind in ERW
The above area or table contains the cells we later in this exercise will bind to our objects and reduction methods in ERW.
Now we need Excel to “peel away” some of the layers from the data we fetch from ERW. To our “target area” shown above, the time stamp includes day, month, year, hour, minute and second. We are only interested in that part of the time stamp indicating “hour”. Therefore we need to make a table, for example right underneath our “target area”, which will give us only hour and value.
Step Action
1. In B29 type Hour and in C29 type Min[m3/h].
2. In D29 type Hour and in E29 type Max[m3/h] .
3. In F29 type Hour and in G29 type Avg[m3/h].
4. Repeat steps 1. to 3. for each of the pairs H29/I29, J29/K29 and L29/M29. (See below.)
5. Format all cells to contain values as Number.
Now we want to create a relationship between the cells under these headings and the appropriate cells in our “target area” to carry out the “peeling away” of everything but “hour”. The pairs B/C, D/E and F/G must be related to the target area’s q1 object and the pairs H/I, J/K and L/M must be related to the target area’s q2 object.
Step Action
1. Make B30 fetch only the hour part of the time stamp from B4 (syntax is =Hour(B4) ).
Task 3: Format the DataPre sheet in Excel: create “peel away” area

16 IGSS32 Getting Started with ERW
2. Make C30 fetch the value from C4 (syntax is =C4).
3. Repeat steps 1. and 2. vertically downwards for the remaining 23 hours. The easy way to do this is to select the two cells B4 and C4 and then drag the small square in the lower left corner of the selected area downwards so all 24 pairs of cells for one object/reduction method are surrounded by a dimmed square.
4. Repeat steps 1. to 3. for each of the pairs D30/E30, F30/G30, H30/I30, J30/K30 and L30/M30 always making sure the cells from the “target area” immediately above are referenced. (See below).
Figure 2.2 The “peel away” area.
The last portion of formatting we must do in this area is to create a series of Excel data tables, which we’ll later use in matching time stamp and corresponding values.
Step Action
1. Create each of the data tables Hourq1_Max, Hourq1_Min and Hourq1_Avg for a 24 hour period for the q1 object. Go to the Excel menu Insert->Name->Define for defining tables/name areas. (Refer to Help in Excel)
2. Create each of the data tables Hourq2_Max, Hourq2_Min and Hourq2_Avg for a 24 hour period for the q2 object. Go to the Excel menu Insert->Name->Define for defining tables/name areas. (Refer to Help in Excel).

Example 2: A 24 Hour Report on Flow Measurement 17
The last table or area we want to create on the sheet is used to validate our object value data in relation to placement next to the correct hour. We start by creating an area exactly like the one for the “peeling away” task above, which we place directly underneath. For this area we use the Excel functions ISNA,VLOOKUP and the data tables we created above. We tell Excel to look at the hour in the left hand column of the new table we create in the “validation” area and find this time stamp from the Excel data tables created in the “peel away” area. If no corresponding time stamp is found, then a zero is inserted as the value. If a time stamp is found, then the data for that hour is placed in the cell. For instance the expression for the cell C70 shown below looks like this: =IF(ISNA(VLOOKUP(B70,Hourq1_MAX,2,FALSE));0; VLOOKUP(B70,Hourq1_MAX,2,FALSE)). Using this method ensures that no incorrect placement of values occur in relation to missing timestamps.
Step Action
1. Create the “validation” area immediately beneath the “peel away” area with the same layout as the latter.
2. Under the heading Hour in column B56-B79, D56-D79, F56-F79, H56-H79, J56-J79 and L56-L79 type in the successive hours starting with zero and ending with 23.
3. Under the heading Max [m3/h] in cell C56 type in the formula using the IF statement syntax with VLOOKUP to look in the Hourq1_Max table to find the correct time stamp. (Refer to Help in Excel).
4. Repeat step 3. for Min [m3/h] and Avg [m3/h] for q1.
5. Repeat step 3. and 4. for q2. (See below) to complete this task.
6. Format the cells created in steps 1. to 6. as Number.
Figure2.3 Expression to use in the “validation” area cells
Now we’ll create the Data sheet where the results from the “validation” area of the DataPre sheet are placed.
Task 4: Format the DataPre sheet: create “validation” area and insert expression
Task 5: Format the Data sheet: consolidated data presentation

18 IGSS32 Getting Started with ERW
Step Action
1. Create a heading called [hour] in cell A6, for instance.
2. Create underneath in cells A7-A30 hour divisions like 0-1, 1-2, etc.
3. Create horizontally starting with B5 column headings with q1 max., q1 min. and q1 avg.
4. Repeat steps 1. to 3. for q2 (See below)
5. Format the cells under each column created in step 1. to 4. as Number.
6. Make each of these cells fetch their respective data from the “validation” area on the DataPre sheet. (See below) to complete this task.
Figure 2.4 Formatting the Data sheet.
The purpose of the Correction sheet is to give personnel responsible for generating reports the opportunity to key in missing data or overwrite data known to be erroneous.
Step Action
1. Create the same layout as for the Data sheet.
2. Format the cells where data can be keyed in as Number to complete the task. (See below)
Task 6: Lay out the Correction sheet.

Example 2: A 24 Hour Report on Flow Measurement 19
Figure2.5 Lay outing the Correction sheet.
Now we’ll complete the last sheet in our Excel workbook. It’s this sheet that we want to preview and print as our final report.
Step Action
1. Create the same layout as for the Correction sheet.
2. Format the cells for data as Number.
3. Make each data cell fetch its data by adding the values from the appropriate cells in the Correction and the Data sheets. (See below)
4. Save the Excel workbook as 24hrflow.xls and exit Excel.
Task 7: Lay out and format the FinalReport sheet
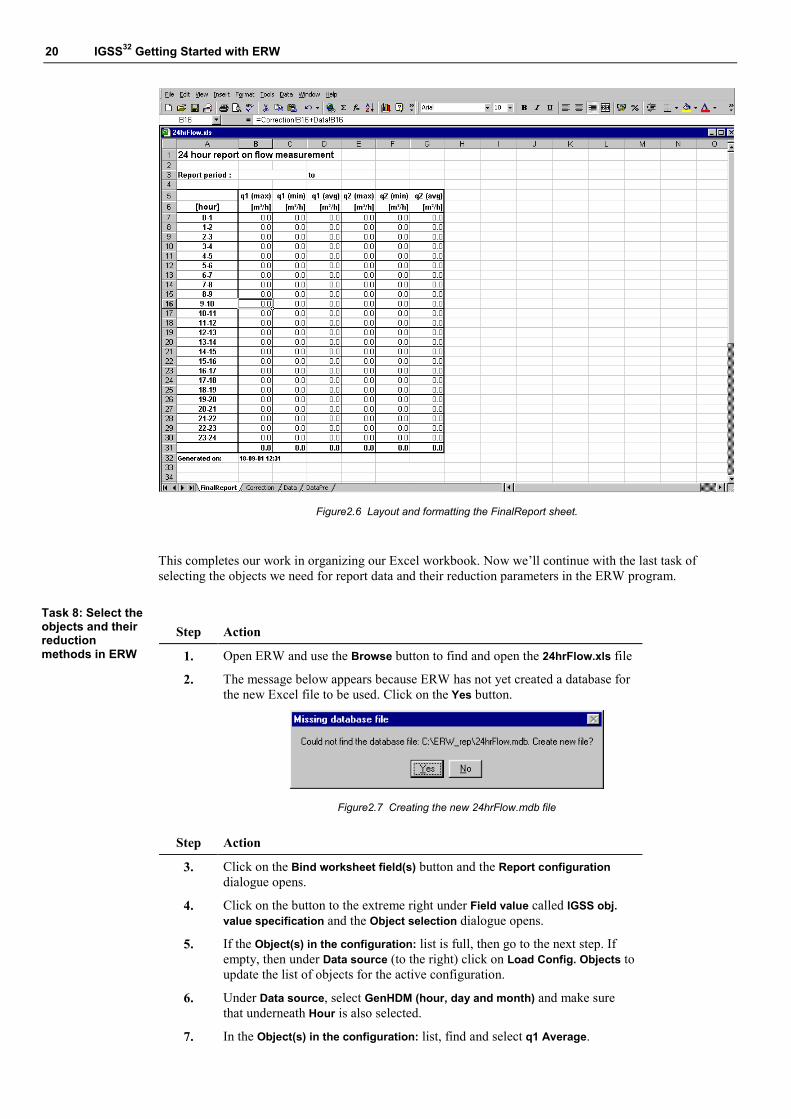
20 IGSS32 Getting Started with ERW
Figure2.6 Layout and formatting the FinalReport sheet.
This completes our work in organizing our Excel workbook. Now we’ll continue with the last task of selecting the objects we need for report data and their reduction parameters in the ERW program.
Step Action
1. Open ERW and use the Browse button to find and open the 24hrFlow.xls file
2. The message below appears because ERW has not yet created a database for the new Excel file to be used. Click on the Yes button.
Figure2.7 Creating the new 24hrFlow.mdb file
Step Action
3. Click on the Bind worksheet field(s) button and the Report configuration dialogue opens.
4. Click on the button to the extreme right under Field value called IGSS obj. value specification and the Object selection dialogue opens.
5. If the Object(s) in the configuration: list is full, then go to the next step. If empty, then under Data source (to the right) click on Load Config. Objects to update the list of objects for the active configuration.
6. Under Data source, select GenHDM (hour, day and month) and make sure that underneath Hour is also selected.
7. In the Object(s) in the configuration: list, find and select q1 Average.
Task 8: Select the objects and their reduction methods in ERW

Example 2: A 24 Hour Report on Flow Measurement 21
8. Immediately underneath, select in the drop down box Red. Method (required): the parameter Value(s). (See below)
Figure 2.8 Selecting the first reduction method parameter for q1average.
Step Action
9. Click the button Insert as new (to the right) and q1 Average Value(s) appear in the list at the top of the dialogue.
10. Without changing any parameters, go to the drop down box under Red. method (required): called Sub.red./Value select: and select the parameter Value time.
11. Click the button Insert as new (to the right) and q1 Average Value(s) Value time appear in the list at the top of the dialogue as a new entry. (See below)

22 IGSS32 Getting Started with ERW
Figure 2.9 Two reduction methods selected for q1 Average
Step Action
12. Repeat steps 7. to 11. for each of the following: q1 Minimum, q1 Maximum, q2 Average, q2 Minimum and q2 Maximum.
NOTE: To de-select Value time when you start to work on a new object where only Value(s) is to be selected, you must highlight Value time and then press the Delete key on your PC.
13 When finished click the Close button and the Report configuration dialogue reappears.
IMPORTANT: If the reduction methods are not chosen correctly as described above, then report data will either be missing or error messages will occur.
Now we’ll bind the objects to cells on the DataPre sheet in our 24hrFlow.xls Excel workbook.
Step Action
1. On the Windows task bar, click on the Excel icon to go into 24hrFlow.xls and make the DataPre sheet the active sheet.
2. Select the cell B4, and then return to ERW by clicking on it on the Windows task bar.
3. At the top left of the dialogue under Worksheet and field, click on the Selected button and worksheet name and cell appears you selected in the previous step, B4.
4. Go back to Excel again and this time make the last cell in the column active, B27 and then return to ERW.
5. Under Last field in value list click the Selected button and the cell B27 appears.
Task 9: Binding the objects selected in ERW with Excel

Example 2: A 24 Hour Report on Flow Measurement 23
6. This column, B4-B27, is where we place the time stamp for q1 Maximum, and therefore we must select the q1 Value(s) Value time parameter from the list under Field value. With this highlighted, we click on the button to the right called Insert as new and it appears in the topmost list. (See below.)
Figure2.10 q1 Value(s) Value time binding to DataPre worksheet
Step Action
7. Return to the DataPre sheet and make cell C4 active and then come back to ERW.
8. At the top left of the dialogue under Worksheet and field, click on the Selected button and worksheet name and cell appears you selected in the previous step, C4.
9. Go back to Excel again and this time make the last cell in the column active, C27 and then return to ERW.
10. Under Last field in value list click the Selected button and the cell C27 appears.
11. This column, C4-C27, is where we place the value for q1 Maximum, and therefore we must select the q1 Value(s) parameter from the list under Field value. With this highlighted, we click on the button to the right called Insert as new and it appears in the topmost list.
IMPORTANT: Be meticulous with the binding process of the various q1 and q2 parameters, always making sure that the parameters selected are attached to the appropriate cells on the sheet.
12. Repeat steps 2. to 11. for the remainder of the objects in the list under the Field value area.
13. When finished, click on the Close button and the Report template selection dialogue appears..

24 IGSS32 Getting Started with ERW
Our last few tasks consist of selecting which sheet or sheets we wish to output, the time interval for the report and the way to view the report, either preview or print.
Step Action
1. In the Report template selection dialogue, click on the button Conf. sheets to output and the Sheet output configuration dialogue appears.
2. In the Sheets to output field, select the sheets Correction, Data and DataPre and move them to the Sheets field on the right because we don’t wish to output these. The only sheet left in the Sheets to output field is FinalReport. (See below).
Figure 2.11Selecting the correct sheet to output.
3. Click the button Apply and then Close and the Report template selection dialogue reappears.
4. Click the button Print preview and the Report period selection dialogue appears.
5. Click on the button Print preview and the Report period selection dialogue appears.
6. At the top of the dialogue, choose the month and year from the drop down boxes.
7. On the resulting calendar, click on the date for which you want the generation of the report to begin, then click on the button Use as start date/time and this choice then appears in the field Report start time. Logged object values time stamped with the same time as the report start time are included in the data set of the report.
8. Click on the date for which you want the generation of the report to terminate, then click on the button Use as stop date/time and this choice then appears in the field Report stop time(See below). Logged object values time stamped with the same time as the report stop time are not included in the data set of the report.
Task 10: Choosing sheets to output, time intervals and previewing the report

Example 2: A 24 Hour Report on Flow Measurement 25
Step Action
9. Click the button Continue to generate the report on screen. (See below)

26 IGSS32 Getting Started with ERW
Figure 2.12 The final report generated as print preview
The procedure described above for generating the hourly values on q1 and q2 can in fact be expanded to include generating daily or monthly reports using other of GenHDM data sources. And of course, ERW report generation is not limited to the objects used as examples in this manual – its use extends to all objects in the active configuration.
A few of the possibilities of combining ERW report data with Excel functionality has been demonstrated on the pages of this manual. We hope that this will serve as inspiration for the user to experiment further in creating reports, which fulfil the needs specific to the process in question.
Concluding Remarks

Example 2: A 24 Hour Report on Flow Measurement 27
Version Information Getting Started with ERW for IGSS32 version 3.0 Published: September 21, 2001
Version no.: 0109B This manual describes IGSS32, version 3.0, build no. 1205 or higher
Publication
Version
Software version