formation mechanisms marker compounds and …
TRANSCRIPT

FORMATION MECHANISMS, MARKER COMPOUNDS AND SOURCE
APPORTIONMENT FOR BIOGENIC ATMOSPHERIC AEROSOLS
« BIOSOL »
W. MAENHAUT, M. CLAEYS, I. JANSSENS, M. KULMALA
ATMOSPHERE &
Atmosphere
Promotors
Willy MAENHAUT
Ghent University (UGent), Department of Analytical Chemistry
Institute for Nuclear Sciences, Research group
“Tropospheric Aerosol Research and Nuclear Microanalysis”
Proeftuinstraat 86, B-9000 Gent
Tel: +32-9-264.65.96 - Fax: +32-9-264.49.60
Magda CLAEYS
University of Antwerp (UA), Department of Pharmaceutical Sciences
Research group “Bio-organic Mass Spectrometry”
Universiteitsplein 1, B-2610 Antwerpen
Tel: +32-3-265.27.07 - Fax: +32-3-265.27.40
Ivan JANSSENS
University of Antwerp (UA), Department of Biology
Research group “Plant and Vegetation Ecology”
Universiteitsplein 1, B-2610 Antwerpen
Tel: +32-3-265.22.55 - Fax: +32-3-265.22.71
Markku KULMALA
University of Helsinki (UHEL)
Department of Physical Sciences, Division of Atmospheric Sciences
Gustaf Hällströmin katu 2, FIN-00014 Helsinki, Finland
Tel: +358-9-191.50.756 - Fax: +358-9-191.50.717
Authors
Willy Maenhaut, Magda Claeys, Ivan Janssens, Markku Kulmala
SCIENCE FOR A SUSTAINABLE DEVELOPMENT
(SSD)
FINAL REPORT
FORMATION MECHANISMS, MARKER COMPOUNDS AND SOURCE
APPORTIONMENT FOR BIOGENIC ATMOSPHERIC AEROSOLS
« BIOSOL »
SD/AT/02
D2011/1191/15 Published in 2011 by the Belgian Science Policy Rue de la Science 8
Wetenschapsstraat 8
B-1000 Brussels
Belgium
Tel: +32 (0)2 238 34 11 – Fax: +32 (0)2 230 59 12
http://www.belspo.be
Contact person: Martine Vanderstraeten
+32 (0)2 238 36 10
Neither the Belgian Science Policy nor any person acting on behalf of the Belgian Science Policy
is responsible for the use which might be made of the following information. The authors are
responsible for the content.
No part of this publication may be reproduced, stored in a retrieval system, or transmitted in any
form or by any means, electronic, mechanical, photocopying, recording, or otherwise, without
indicating the reference :
Willy Maenhaut, Magda Claeys, Ivan Janssens, Markku Kulmala. Formation mechanisms,
marker compounds and source apportionment for biogenic atmospheric aerosols « BIOSOL »
Final Report. Brussels : Belgian Science Policy 2011 – 121 p. (Research Programme Science for
a Sustainable Development)

Project SD/AT/02 - Formation mechanisms, marker compounds and source apportionment for biogenic atmospheric
aerosols “BIOSOL”
SSD - Science for a Sustainable Development - Atmosphere 3
TABLE OF CONTENTS
SUMMARY ...................................................................................................................... 5
1. INTRODUCTION ................................................................................................ 11
2. METHODOLOGY ............................................................................................... 15
2.1. Study of the formation mechanisms of SOA from isoprene (and other BVOCs) by laboratory experiments ......................................................................................15 2.2. Field experiment at the forested site of K-puszta, Hungary.....................................16 2.3. Field experiment at the state forest “De Inslag”, Brasschaat, Belgium ....................18 2.4. Field experiment at the forested site of SMEAR II, Hyytiälä, Finland ......................19 2.5. Field work during an oceanic cruise and at a remote island in the southern Indian Ocean ..........................................................................................................21 2.6. Data analyses and interpretation for the laboratory and field experiments ..............22 2.7. Modelling of the formation and growth of the fine particles and of the fine biogenic atmospheric aerosol .................................................................................22 2.8. Identification of particulate-phase oxidation products of isoprene (and other BVOCs), which can be used as indicator compounds for source apportionment ....23 2.9. Determination of the contribution from the BVOCs to the organic aerosol for various sites in Europe ...........................................................................................23
3. RESULTS ........................................................................................................... 25
3.1. Study of the formation of biogenic SOA through smog chamber experiments ........25
3.1.1. Formation mechanisms of SOA from isoprene .................................................... 25 3.1.2. Formation mechanism of 2-methyltetrols from gaseous precursors .................... 28 3.1.3. Structure of marker compounds for the photo-oxidation of α-pinene .................. 29 3.1.4. Studies on organosulphates ................................................................................ 29
3.2. Study of the formation of biogenic SOA through plant growth chamber experiments ...........................................................................................................32 3.3. Comprehensive studies during the 2006 summer campaign at the forested site of K-puszta, Hungary .................................................................................................33
3.3.1. Meteorology and air mass origin .......................................................................... 33 3.3.2. VOC data and relation to temperature ................................................................. 34 3.3.3. Relation of the data for the PM and various aerosol components to temperature .......................................................................................................... 36 3.3.4. Examination of the VOC data set by Principal Component Analysis ................... 38 3.3.5. Physical aerosol data ........................................................................................... 39 3.3.6. Assessment of artifacts in the collection of particulate OC .................................. 41 3.3.7. Chemical aerosol data from the HVDS samples.................................................. 42 3.3.8. Aerosol chemical mass closure ........................................................................... 45
3.4. Studies during 2007 at the state forest “De Inslag”, Brasschaat, Belgium ...............47 3.4.1. In-situ data for particulate OC and EC ................................................................. 47 3.4.2. Data from the HVDS aerosol samples ................................................................. 49 3.4.3. VOC data.............................................................................................................. 54
3.5. Studies at the SMEAR II forest station in Hyytiälä, Finland .....................................57 3.5.1. Summer campaign in 2005 .................................................................................. 57 3.5.2. Meteorology, air mass origin, and inorganic trace gases for the 2007 summer campaign ................................................................................................ 57 3.5.3. BVOC data and relation to temperature for the 2007 summer campaign ........... 59
Project SD/AT/02 - Formation mechanisms, marker compounds and source apportionment for biogenic atmospheric
aerosols “BIOSOL”
SSD - Science for a Sustainable Development - Atmosphere 4
3.5.4. In-situ data for the PM, BC, and particulate OC and EC during the 2007 summer campaign and their relation to temperature ......................................................... 60 3.5.5. Mass size distributions for the PM and OC during the 2007 summer campaign and comparison with physical aerosol data ......................................................... 62 3.5.6. Filter data for the PM, OC, EC, and WSOC during the 2007 summer campaign and assessment of artifacts in the collection of particulate OC ........................... 63 3.5.7. Results from the IC and elemental analyses, impact from biomass burning,
correlations with meteorological and trace gas data, and aerosol chemical mass closure for the 2007 summer campaign ..................................................... 64
3.6. Studies during an oceanic cruise and at a remote island in the southern Indian Ocean ....................................................................................................................70
3.6.1 Aerosol study during an oceanic cruise in the Northern Hemisphere .................. 70 3.6.2. Aerosol study at Amsterdam Island ..................................................................... 74
3.7. Modelling of the formation and growth of the fine particles and of the fine biogenic atmospheric aerosol ...................................................................................84
3.8. Particulate-phase oxidation products of isoprene (and other BVOCs), which can be used as indicator compounds for source apportionment ................................86
3.9. Determination of the contribution from the BVOCs to the organic aerosol for various sites in Europe ......................................................................................89
4. POLICY SUPPORT ............................................................................................ 93
5. DISSIMINATION AND VALORISATION ............................................................ 99
6. PUBLICATIONS ............................................................................................... 101
6.1. Publications of the teams ..................................................................................... 101 6.2. Co-publications .................................................................................................... 105
7. ACKNOWLEDGEMENTS ................................................................................ 109
8. REFERENCES ................................................................................................. 111
Project SD/AT/02 - Formation mechanisms, marker compounds and source apportionment for biogenic atmospheric
aerosols “BIOSOL”
SSD - Science for a Sustainable Development - Atmosphere 5
SUMMARY
Biogenic volatile organic compounds (BVOCs) play an important role in atmospheric
chemistry and give rise to secondary aerosols, which have effects on climate and
human health. Increased temperature and CO2 concentrations will lead to increased
plant photosynthesis and growth rates and higher emissions of BVOCs, which in turn
result in a higher aerosol load from natural sources and partly offset the decreased
cooling from anthropogenic aerosols. However, a considerable lack of knowledge
exists concerning the formation of new particles from BVOCs and the organic
chemical composition of natural aerosols.
The objectives of the BIOSOL project included (1) study of the formation
mechanisms of secondary organic aerosol (SOA) from isoprene and other BVOCs,
assessing their role in particle formation and growth, examining the relative
importance of homogeneous photo-oxidation and multi-phase processes, and
modelling of the processes involved; (2) identification of particulate-phase oxidation
products of isoprene and other BVOCs, which can be used as indicator compounds
for source apportionment, and development/deployment of novel analytical
techniques thereby; and (3) determination of the contribution from the BVOCs to the
organic aerosol for various sites in Europe.
For reaching objective (1), experiments and measurements were performed in the
laboratory, at three forested European sites, and during an oceanic cruise in the Atlantic
and at a remote island in the southern Indian Ocean. The BVOCs, their volatile organic
oxidation products, and critical inorganic trace gases were determined, and aerosol
samples were collected and subjected to comprehensive analyses; in addition, in-situ
measurements of particle number concentrations and size distributions, of ion
spectra, and of the particulate mass (PM) and particulate organic carbon (OC) were
made, and radiation and standard meteorological measurements were performed.
In co-operation with Caltech, a study was performed to obtain insights into the
formation mechanisms of SOA from isoprene, in particular the mechanisms that
result in the formation of 2-methyltetrols, 2-methylglyceric acid (2-MG), and humic-
like substances (HULIS). An extensive series of smog chamber experiments was
performed under various conditions, in particular at low- and high-NOx levels, and
with and without seed aerosol. It was found that the chemical nature of the SOA was
significantly different between the two NOx regimes. At high-NOx, the SOA
components were acidic and formed upon the further oxidation of methacrolein; no
other first-generation gas-phase products contributed to the high-NOx SOA. In
contrast, the low-NOx SOA was neutral owing to the formation of polyols and organic

Project SD/AT/02 - Formation mechanisms, marker compounds and source apportionment for biogenic atmospheric
aerosols “BIOSOL”
SSD - Science for a Sustainable Development - Atmosphere 6
peroxides. Oligomerisation was an important isoprene SOA formation pathway at
both low- and high-NOx. The nature of the oligomers was, however, distinctly
different in each NOx regime. The high-NOx oligomers were characterised as oligo-
esters involving 2-MG as the key monomeric unit, while the low-NOx oligomers were
hemiacetal derivatives of the 2-methyltetrols. Based on the results of this study
mechanisms could be proposed for the formation of isoprene SOA under both high- and
low-NOx conditions.
In co-operation with Caltech and US EPA smog chamber experiments were
performed in order to study the mechanism and ubiquity of organosulphate formation
in biogenic SOA. In addition, archived laboratory-generated isoprene SOA and
ambient filter samples from the southeastern US were re-examined for
organosulphates and nitrooxy organosulphates. Only SOA compounds that were also
detected in ambient PM2.5 aerosol were selected for structural characterisation. By
comparing the mass spectral data collected for both the laboratory-generated and
ambient aerosol, previously uncharacterised ambient organic aerosol components
were found to be organosulphates of isoprene, α-pinene, β-pinene, and limonene, thus
demonstrating the ubiquity of organosulphate formation in ambient SOA. Several of the
organosulphates characterised in this study provide ambient tracer compounds for the
occurrence of biogenic SOA formation under acidic conditions. As to the contribution
from organosulphates to the total organic mass fraction in ambient aerosols, the
calculations for the PM10 samples from the 2003 K-puszta summer campaign
indicated that this contribution can be as high as 30%.
A comprehensive field campaign was held at the forested site of K-puszta, Hungary,
from 24 May to 29 June 2006. From the start of the campaign until 11 June, it was
unusually cold with daily maximum temperatures between 12 and 23 °C, but from 12
June onward higher temperatures were noted with daily maxima from 24 to 36 °C.
From the data for the volatile organic compounds (VOCs) and their oxidation
products it was quite clear that much higher levels were observed during the warm
period than during the cold one. This difference is to be expected, given that both
formation and emission of the VOCs by plants increase with light and temperature.
An increase with temperature was also observed for the 24-hr (or day-time or night-
time) averaged concentrations of fine PM and fine OC (whereby fine = PM2.5) from the
in-situ instruments and for the data of a number of components in the filter samples,
such as the dicarboxylic acids (DCAs) and the mineral dust elements. The in-situ
measurements of particle number concentrations and size distributions and of ion
spectra indicated that there were particle production episodes around every second
day, which is quite frequent. There seemed to be no relation between the particle
production events and the in-situ VOC, fine PM or fine OC levels. Organic matter,

Project SD/AT/02 - Formation mechanisms, marker compounds and source apportionment for biogenic atmospheric
aerosols “BIOSOL”
SSD - Science for a Sustainable Development - Atmosphere 7
estimated as 1.8 OC, was the major aerosol component in both PM2.5 and PM10 and
in both the cold and warm periods and accounted for between 40 and 50% of the
gravimetric PM. Sulphate was the second component in PM2.5, with percentage
contributions of 22-24%.
From the results for OC, elemental carbon (EC), and the VOCs that were obtained in
the course of 2007 at the forested site “De Inslag”, Brasschaat, it appeared that the
site is substantially impacted by anthropogenic activities. This is in contrast to the two
other forested sites studied in this project. The fine size fraction samples of the Hi-Vol
dichotomous sampler (HVDS) were analyzed for inorganic and organic ions by ion
chromatography (IC) and for a variety of organic compounds by liquid
chromatography/mass spectrometry (LC/MS). Known and new tracers for α-pinene
SOA and a number of organosulphates, including nitrooxy organosulphates with a
molecular weight (MW) of 295, were detected and quantified, in addition to the DCAs.
Interestingly, rather low concentrations of the MW 295 SOA tracers were found
during the first nights of the campaign (with maximum day-time temperatures > 22
°C). These results hint that the latter α-pinene SOA tracers are formed during nights
following days where α-pinene was not fully consumed by photo-oxidation, leaving a
portion of the emitted α-pinene available for processing by night-time NO3 chemistry.
The combined contribution of the measured organic compounds to the OC was, on
average, 5.3% (with 4.1% from the IC compounds and 1.2% from the LC/MS
compounds).
From 1 to 31 August 2007, a comprehensive field campaign was held at the SMEAR
II forested site in Hyytiälä, Finland. Overall, the weather was nice during the
campaign with little rain. The mean daily temperature rose from 13.4 °C on 1 August to
around 20 °C in the period of 6-13 August and decreased to 6.1 °C on 31 August, with
a secondary maximum of 17 °C on 22-24 August. From the time series of the in-situ
data for the BVOCs, it appeared that the highest levels of the monoterpenes were noted
in the nights of 7, 8, and 9 August, thus right after the start of the warm period. When
looking at daily averages, there was clearly some relation between the concentrations
of the BVOCs and temperature, with higher levels at higher temperatures. The time
series for in-situ fine PM and fine OC was different from that for the BVOCs. The OC
levels (and to a lesser extent also the PM levels) kept increasing from the beginning of
the campaign until 13 August and decreased afterwards, with a second maximum on 22
to 24 August. It seemed thus that there was little relation between the local
concentrations of the BVOCs and fine OC at the SMEAR II site. It is thought that the
levels of fine OC are more related to the total BVOC emissions upwind of the site during
the last 5 days or so of air mass transport than to the local BVOC concentrations at
SMEAR II itself. The mass size distributions for OC, as measured in cascade
Project SD/AT/02 - Formation mechanisms, marker compounds and source apportionment for biogenic atmospheric
aerosols “BIOSOL”
SSD - Science for a Sustainable Development - Atmosphere 8
impactor samples collected at ambient relative humidity (RH), peaked in the
accumulation size range, but there was also a clear coarse mode with peak at
around 3-4 µm aerodynamic diameter. Like during the 2006 summer campaign at
K-puszta, there was little EC in the aerosol at SMEAR II and most of the fine OC was
water-soluble (i.e., 63%). The PM2.5 samples of the HVDS were analyzed for
inorganic and organic ions by IC. The organic compounds measured accounted, on
average, for 2.0% of the OC and 3.1% of the water-soluble OC (WSOC). These
percentages are about one third lower than those found at K-puszta. The results from
the low-volume filter samples were used to examine to which extent aerosol chemical
mass closure could be obtained. Eight aerosol types (components) were considered
in the mass closure calculation. Organic matter was clearly the dominant component
in both PM2.5 and PM10. It accounted for 73% and 64% of the average gravimetric
PM in PM2.5 and PM10, respectively, and was in both cases followed by non-sea-
salt sulphate, which represented 25% and 17% of the average gravimetric PM in
PM2.5 and PM10, respectively.
The OC and EC data from the oceanic cruise in 2006 in the Northern Hemisphere
(NH) indicated that there was a large impact from continental aerosol and from fossil-
fuel combustion aerosol. This was in contrast with the OC and EC data from
Amsterdam Island in the southern Indian Ocean. At the latter site, EC was below the
detection limit and OC was substantially lower than during the NH cruise. A common
feature of both marine study areas was that only around 30% of the fine OC was
water-soluble. This percentage is similar to that found at urban sites, where most of
the OC consists of primary organic aerosol from fossil fuel combustion. It seems that
the fine OC for our two oceanic study areas was also mostly primary. It has been
suggested that SOA from isoprene may be a large source of cloud condensation
nuclei in some oceanic regions. There was clearly no evidence for SOA from
isoprene in the samples from the NH cruise nor in these from Amsterdam Island. In
both the coarse and fine size fractions of the HVDS samples from Amsterdam Island,
sea salt was by far the major aerosol type; organic aerosol made up for less than
10% of the dry aerosol mass. Of the organic species measured, methanesulphonate,
a gas-to-particle conversion product from dimethylsulphide, which is emitted by
marine phytoplankton, was by far the major contributor to the fine WSOC, with an
average contribution of about 17%. Various organosulphates were also present in the
fine WSOC (with an average combined contribution of 0.8%); they were attributed to
oxidation of primary algal biomass.
With regard to objective (2) of BIOSOL, studies were conducted to structurally
characterise major particulate-phase oxidation products of α-pinene that occur at
significant concentrations in ambient fine aerosol. Using mass spectrometric

Project SD/AT/02 - Formation mechanisms, marker compounds and source apportionment for biogenic atmospheric
aerosols “BIOSOL”
SSD - Science for a Sustainable Development - Atmosphere 9
techniques and synthesis of reference compounds, the structures of two major
α-pinene SOA marker compounds with MWs of 148 and 204 were established as
3-hydroxyglutaric acid and 3-methyl-1,2,3-butanetricarboxylic acid (MBTCA),
respectively. A formation mechanism for MBTCA was proposed, which involves OH-
initiated oxidation in the presence of NOx. Furthermore, major efforts were
undertaken to elucidate the structure of a MW 172 compound and related
compounds, which are formed upon photo-oxidation and ozonolysis of α-pinene (and
other BVOCs) and are also present in ambient fine aerosol from sites with coniferous
vegetation. The MW 172 compound was identified as the lactone-containing
terpenylic acid. Terpenylic acid shows unique non-covalent dimer-forming properties
upon electrospray ionisation in the negative ion mode [(–)ESI] and is thought to play
a role in initial particle formation.
As to objective (3), we determined the contribution from the BVOCs to the organic
aerosol for PM2.5 samples, which had been collected in summer 2003 in a mixed
deciduous forest in Jülich, and for the PM2.5 size fraction of the HVDS samples from
the 2003 summer campaign at K-puszta. We made thereby use of the laboratory-
derived tracer mass fractions (fSOC), which were obtained by Kleindienst et al. [2007]
with gas chromatography/mass spectrometry (GC/MS). For the K-puszta samples,
isoprene secondary organic carbon (SOC) and α-pinene SOC accounted, on
average, for respectively 6.9% and at least 4.8% of the PM2.5 OC; for the Jülich
samples, the average contributions from isoprene SOC and α-pinene were 2.5% and
at least 2.4%, respectively. Although the data for α-pinene SOC should be regarded
as minimum values because not all molecular tracers necessary to estimate α-pinene
SOC were measured, these percentages are clearly much lower than expected.
Although the uncertainty that is associated with our estimates is at least a factor of 2,
one may wonder to what extent the values of Kleindienst et al. [2007] are applicable
to ambient organic aerosol in various types of environments and different levels of
NOx, oxidants, RH, and other ambient parameters. More laboratory studies of the
fSOC values under various conditions (and also for additional BVOCs) are therefore
recommended. It is also suggested that additional techniques, such as LC/MS, are
used besides GC/MS in future studies on fSOC.
Project valorisation was done through interaction with members of the Follow-up
Committee and joint meetings with the SSD project IBOOT, writing of progress
reports and scientific publications, conference presentations, and contributions to
activities organised within national and international programmes.
Keywords: atmosphere, biogenic volatile organic compounds, secondary organic
aerosols, indicator compounds, smog chambers, forested sites.


Project SD/AT/02 - Formation mechanisms, marker compounds and source apportionment for biogenic atmospheric
aerosols “BIOSOL”
SSD - Science for a Sustainable Development - Atmosphere 11
1. INTRODUCTION
It is well established that trace gases and atmospheric aerosols are important to the
global radiation, cloud formation, and human and animal health and welfare. Trace
gases and atmospheric aerosols are tightly connected with each other via physical,
chemical, meteorological, and biological processes occurring in the atmosphere and at
the atmosphere-biosphere interface. Atmospheric aerosol particles influence the Earth's
radiation balance directly by scattering and absorbing solar radiation, and indirectly by
acting as cloud condensation nuclei (CCN) [e.g., Charlson et al., 1992; Novakov and
Penner, 1993; Andreae et al., 2005; IPCC, 2007]. Progress has been made in
evaluating the radiative effects of various aerosol components such as sulphate,
organics, black carbon, sea-salt, and crustal species [Penner et al., 2001]. Despite
these efforts, substantial uncertainties still remain in quantifying the contribution from
each source, particularly to assess the relative contributions of biogenic and natural
emissions.
Knowledge of the effects of natural emissions of aerosols on the Earth's radiation
balance is necessary in order to accurately predict and understand the true effect of
anthropogenic emissions and land-use changes. In its Third Assessment Report (TAR),
the Intergovernmental Panel on Climate Change revised its older prediction of the
globally averaged surface temperature increase over the period 1990 to 2100 from 1.0-
3.5 to 1.4-5.8 K [IPCC, 2001] and the results from the new Fourth Assessment Report
[IPCC, 2007] essentially corroborate those given in the TAR. The increase in the upper
limit of the prediction is largely due to the role of aerosols in the climate of the Earth: it is
believed that reduction of pollution will result in reduced direct and indirect (via clouds)
scattering of sunlight back to the space. However, as can be seen from the large
uncertainty of the estimated temperature increase, there is insufficient knowledge about
the role of natural and anthropogenic aerosols in climate processes. As stated by
Andreae et al. [2005], the strong present-day aerosol cooling may imply a hot future.
The terrestrial vegetation is a key player in future climate change processes; increased
temperature and CO2 concentrations will lead to increased plant photosynthesis and
growth rates and higher emissions of volatile organic compounds (VOCs), which in turn
will result in a higher aerosol load from natural sources and partly offset the decreased
cooling from anthropogenic aerosols.
Organic material significantly contributes to the total fine aerosol mass, i.e., 20-50% at
continental mid-latitudes [Saxena and Hildemann, 1996; Putaud et al., 2004], and a
substantial fraction of the organic material results from the oxidation of VOCs and is
thus secondary organic aerosol (SOA). However, our knowledge about the organic
aerosol and SOA is still rather poor. A large fraction remains uncharacterised [e.g.,

Project SD/AT/02 - Formation mechanisms, marker compounds and source apportionment for biogenic atmospheric
aerosols “BIOSOL”
SSD - Science for a Sustainable Development - Atmosphere 12
Turpin et al., 2000; Kubátová et al., 2002; Iinuma et al., 2004]. It is recognised that
especially the characterisation of multifunctional organic molecules is a major analytical
challenge [Brasseur et al., 2003]. Furthermore, organic aerosol has so far been poorly
represented in current aerosol global climate models [for a review, see Kanakidou et al.,
2005]. The latter models focus mainly on sulphur chemistry, especially when
considering the formation of new particles in the troposphere. Nucleation events, that is
the formation of “nucleation mode” (3-20 nm diameter) particles, are usually discussed
in terms of sulphuric acid nucleation, either as binary (H2SO4/H2O) or ternary
(H2SO4/NH3/H2O) system. However, aerosol formation studies at rural sites indicate a
link between new particle formation and oxidation of VOCs. Measurements of
nanometer size particles at the SMEAR II station in southern Finland provide an
example of particle formation events over a boreal pine forest [Mäkelä et al., 1997; Boy
et al., 2004]. Similar observations have been made in other forested regions [Kulmala et
al., 2004a]. The observation of nucleation events took place in remote forested areas,
where the release of highly reactive VOCs from trees followed by a rapid oxidation to
less volatile products has to be considered a potential source of nucleating vapours.
Unfortunately, the amount of condensable material needed to form nanometer particles
is extremely small and the chemical identification of the nucleating species is therefore
rather difficult. According to Kulmala et al. [2004a], organic vapours could, in principle,
participate in nucleation, but nucleation mechanisms that involve organics have not yet
been identified. It is very likely, however, that organics contribute to growth of nucleated
particles into the size range that they efficiently scatter solar radiation and can act as
CCN [O’Dowd et al., 2002].
The effort to understand particle formation and growth from biogenic VOC oxidation is
driven not only by the field observations mentioned above, but also by certain
characteristics of this group of hydrocarbons. First, it is well established that terrestrial
vegetation releases into the atmosphere a tremendous amount of organic compounds
(e.g., isoprene, monoterpenes, sesquiterpenes, oxygen-containing compounds)
[Guenther et al., 1995]. The large quantities of biogenic VOCs (BVOCs) emitted globally
exceed the release of anthropogenic VOCs and have stimulated research into the
atmospheric chemistry of these compounds. Secondly, the aerosol formation potential
of BVOCs with more than six carbon atoms, as measured in smog chamber
experiments, is generally high and, for specific biogenics, the major fraction of products
can convert to the particle phase [Hoffmann et al., 1997; Griffin et al., 1999]. Based on
information regarding fractional aerosol yields and on available emission inventories,
the global production of SOA from oxidation of BVOCs is estimated at between 8 and
40 Tg per year [IPCC, 2001]. Since aerosol formation from BVOC oxidation represents
a natural source contributing to the continental background aerosol, knowledge of its
contribution to the particle burden of the troposphere is crucial in order to determine the
Project SD/AT/02 - Formation mechanisms, marker compounds and source apportionment for biogenic atmospheric
aerosols “BIOSOL”
SSD - Science for a Sustainable Development - Atmosphere 13
relative importance of anthropogenic versus natural particle production. The gas-phase
chemistry in a forest ecosystem, which is driven by high concentrations of reactive
precursor compounds and high UV radiation and leads to aerosol formation, is still
poorly understood although some recent progress has been made [Holzinger et al.,
2005]. Natural VOCs are also tightly linked with the oxidative capacity of the
atmosphere, which involves mainly hydroxyl radicals and ozone. Ozone and particulate
concentrations are affected by NOx and both biogenic and anthropogenic VOC
emissions. With the levels of NOx and anthropogenic VOCs decreasing, it may be
expected in the future that the contribution of biogenic VOCs to ozone and the particle
burden in the troposphere will become relatively more important. It should be pointed
out, however, that quite a number of non-volatile oxidation products considered as key
molecules in aerosol formation processes are of minor relevance for the tropospheric
ozone production.
There is a general consensus in the atmospheric chemistry community that
monoterpenes, aromatic hydrocarbons, and possibly sesquiterpenes are significant
contributors to SOA, while the contribution from isoprene, which is emitted in larger
amounts than monoterpenes (estimated at 500 Tg vs 125 Tg [Guenther et al., 1995]),
has generally been thought to be negligible based on the smog chamber experiments
by Pandis et al. [1991]. However, during the past five years, evidence from both field
and laboratory experiments has been obtained for isoprene contributing to SOA
formation. Polyols (2-methyltetrols), a hydroxycarboxylic acid (2-methylglyceric acid),
and C5-alkene triols, which have retained the C5-isoprene skeleton or a part of it, were
characterised and detected in significant amounts in natural background PM2.5
(particulate matter with diameter smaller than 2.5 µm) aerosol from the Amazon basin,
Brazil, from K-puszta, Hungary, and from Hyytiälä, Finland [Claeys et al., 2004a,b;
Wang et al., 2005; Kourtchev et al., 2005]. In addition, a 2003 summer field campaign
at K-puszta revealed that the 2-methyltetrols and 2-methylglyceric acid exhibit a diel
pattern with the highest concentrations during day-time, consistent with their formation
through fast photo-oxidation of locally emitted isoprene [Ion et al., 2005]. Furthermore, a
field experiment carried out at a Japanese boreal forest site showed significant
concentrations of carbonyl-containing oxidation products of isoprene in the PM2.5
aerosol with maxima in the evening [Matsunaga et al., 2003]. Laboratory studies
supporting the contribution of isoprene oxidation to the organic fraction of ambient
PM2.5 are the investigations showing that acidic seed aerosol catalysed the SOA-
forming ozonolysis reaction of isoprene [Jang et al., 2002], that exposure to isoprene of
quartz fibre filters impregnated with sulphuric acid leads to the formation of oligomeric
humic-like substances (HULIS) [Limbeck et al., 2003], and that irradiation of
isoprene/NOx/air mixtures in the presence of SO2 results in the formation of

Project SD/AT/02 - Formation mechanisms, marker compounds and source apportionment for biogenic atmospheric
aerosols “BIOSOL”
SSD - Science for a Sustainable Development - Atmosphere 14
2-methyltetrols, 2-methylglyceric acid, as well as other unidentified organic compounds,
possibly oligomeric HULIS [Edney et al., 2005].
All together, the impact of BVOCs on air quality and the formation of secondary
products affecting our climate on a regional and global scale are far from being
understood. A considerable lack of knowledge exists concerning the formation of new
particles from BVOCs and the organic chemical composition of natural aerosols. As
stated in the review by Kanakidou et al. [2005] on organic aerosol and global climate
modelling, SOA formation is a complex and not yet sufficiently understood process.
The objectives of the current project include (1) study of the formation mechanisms of
SOA from isoprene (and other BVOCs), assessing their role in particle formation and
growth, examining the relative importance of homogeneous photo-oxidation and multi-
phase processes, evaluating the importance of HULIS formation, and modelling of the
processes involved; (2) identification of particulate-phase oxidation products of isoprene
(and other BVOCs), which can be used as indicator compounds for source
apportionment, and development and deployment of novel analytical techniques and
procedures thereby; and (3) determination of the contribution from the BVOCs to the
organic aerosol for various sites in Europe.
Project SD/AT/02 - Formation mechanisms, marker compounds and source apportionment for biogenic atmospheric
aerosols “BIOSOL”
SSD - Science for a Sustainable Development - Atmosphere 15
2. METHODOLOGY
2.1. Study of the formation mechanisms of SOA from isoprene (and other BVOCs) by laboratory experiments
The methodology and approaches for reaching objective (1) of this project were quite
varied. Experiments and measurements were performed in the laboratory (i.e., in smog
chambers and plant growth chambers), at three forested European sites (K-puszta,
Hungary; Brasschaat, Belgium; and Hyytiälä, Finland), and during an oceanic cruise
and at a remote island in the southern Indian Ocean. The BVOCs, their volatile organic
oxidation products, and critical inorganic trace gases are determined and aerosol
samples are collected and subjected to comprehensive analyses; in addition, in-situ
measurements of particle number concentrations and size distributions, of ion
spectra, and of the particulate mass (PM) and particulate organic carbon (OC) are
made, and radiation and standard meteorological measurements are performed. The
data sets are used for modelling the formation and growth of the fine biogenic
atmospheric aerosol. In this section 2.1, we present the methods and approaches for
the laboratory experiments; the methods and approaches for other activities are
presented in the subsequent sections.
The smog chamber experiments were performed in co-operation with the groups of
Prof. J.H. Seinfeld (California Institute of Technology (Caltech), U.S.A.), of Dr. T.E.
Kleindienst (National Exposure Research Laboratory of the US Environmental
Protection Agency (US EPA), U.S.A), of Prof. U. Baltensperger (Paul Scherrer Institute
(PSI), Villigen, Switzerland), and of Prof. H. Herrmann (Leibniz Institute for
Tropospheric Research (IfT), Leipzig, Germany). The actual smog chamber
experiments and all in-situ (on-line) measurements were made by these teams, but
samples were collected for chemical analysis by BIOSOL partner 2 (P2). For details on
the chambers and the in-situ (on-line) measurements, reference is made to Surratt et al.
[2006], Edney et al. [2005], Paulsen et al. [2005], Iinuma et al. [2007], and to references
cited in these papers. P2 performed analyses on aerosol (and other) samples collected
from these chambers by gas chromatography-flame ionisation detection (GC-FID),
gas chromatograhy/mass spectrometry (GC/MS) and liquid chromatography/mass
spectrometry (LC/MS) techniques. For GC-FID a 800 Top gas chromatograph (Carlo
Erba, Milan, Italy) was used, while for GC/MS a TRACE GC2000 gas chromatograph
connected with a Polaris Q ion trap mass spectrometer (Thermo Scientific, San Jose,
CA, USA) was employed. GC/MS analysis was performed in the electron ionisation
(EI) or chemical ionisation (CI) modes. For LC/MS analysis, a Surveyor Plus system
(Thermo Scientific) was coupled to an LXQ linear ion trap mass spectrometer

Project SD/AT/02 - Formation mechanisms, marker compounds and source apportionment for biogenic atmospheric
aerosols “BIOSOL”
SSD - Science for a Sustainable Development - Atmosphere 16
(Thermo Scientific), and electrospray ionisation in the negative ion mode was used
[(–)ESI]. Prior to analysis, the samples were extracted with a mixture of methanol and
dichloromethane (1:1, v/v) or with methanol. In addition, prior to GC-FID or GC/MS,
the sample extracts were derivatised (e.g., trimethylsilylated) to convert the polar
compounds into volatile derivatives. The capillary columns used for GC-FID and
GC/MS contained a 95% dimethyl, 5% phenyl polysiloxane stationary phase. The
reversed phase C18-column employed for LC/MS was a dC18 Atlantis column
(Waters); this column contains difunctionally bonded C18 alkyl residues in order to allow
the analysis of very polar analytes. Additional details on the GC-FID, GC/MS, and
LC/MS methods used by P2 can be found in Surratt et al. [2006, 2007], Szmigielski et
al. [2007a], Maenhaut and Claeys [2007], and Gómez-González et al. [2008].
For the plant growth chamber experiments, it was planned to make use of the growth
chambers of BIOSOL partner 3 (P3). Unfortunately, these chambers were badly
damaged by a storm in January 2007. Therefore, P2 started a co-operation with the
group of Dr. J. Joutsensaari (University of Kuopio, Finland), whereby use is made of the
Kuopio growth chambers. The actual experiments were made by this team, but
samples were collected for LC/MS analysis by P2. Young Scots pine and Norway
spruce plants (2-year old) were housed in a plant chamber and BVOC emissions
were triggered by methyl jasmonate. Subsequently, the emitted BVOCs were
transferred to a 2 m3 Teflon reaction chamber with a pressurised air stream and
oxidised with ozone (200 ppb). Simultaneously, particle formation and growth was
monitored by measuring aerosol particle number size distributions using a differential
mobility particle sizer (DMPS). After a reaction time of ca. 60 min the SOA formed
was collected on a Teflon or quartz fibre filter. The filters were extracted with
methanol:dichloromethane (1:1, v/v) under ultrasonic agitation, and the extract was
analysed with the LC/(–)ESI-MS technique. Chromatographic separation of the SOA
components was achieved with a dC18 Atlantis column (Waters).
2.2. Field experiment at the forested site of K-puszta, Hungary
From 20 May to 1 July 2006, a field campaign was conducted at the K-puszta
background station in Hungary. This station is a mixed deciduous/coniferous forest site
[Ion et al., 2005] and is located at 46º58'N, 19º35'E, 136 m above sea level. It is about
15 km to the NW of the town of Kecskemèt and about 80 km SE of Budapest. The
station is one of the 20 high-quality ground-based stations within the European Union
(EU) funded project “European Supersites for Atmospheric Aerosol Research”
(EUSAAR) and is also involved in the Global Atmospheric Watch (GAW) network and in
the European Monitoring and Evaluation Programme (EMEP). The actual field work at
the site took place from 24 May to 29 June 2006. Besides the 4 BIOSOL partners also

Project SD/AT/02 - Formation mechanisms, marker compounds and source apportionment for biogenic atmospheric
aerosols “BIOSOL”
SSD - Science for a Sustainable Development - Atmosphere 17
two Hungarian teams participated in the field work, i.e., the team of Prof. A. Gelencsér
from the University of Pannonia (Veszprém) and that of Prof. I. Salma from Eötvös
University (Budapest).
Isoprene (C5H8), other BVOCs including monoterpenes (C10H16) and the hemi-
terpene 2-methyl-3-buten-2-ol (MBO), and their volatile organic oxidation products
were determined by proton-transfer reaction - mass spectrometry (PTR-MS)
[Lindinger et al., 1998]. Critical inorganic trace gases (i.e., O3 and NOx) were
determined by instrumentation, which was available at the site. Particle number
concentrations and size distributions (in the size range from 10 nm to 1 µm) were
measured with a DMPS and ion spectra (for diameter from 0.5 to 40 nm) were
determined with an Air Ion Spectrometer (AIS); both the DMPS and AIS were home-
built instruments of BIOSOL partner 4 (P4). The PM, aerosol black carbon (BC), and
particulate-phase OC and elemental carbon (EC) were determined in situ and in real
time with a Rupprecht and Patashnick tapered element oscillating microbalance
(TEOM, model 1400A), a Magee Scientific aethalometer (tape-feeder model AE
14U), and an OCEC Field instrument from Sunset Laboratory, respectively. All three
instruments were equipped with a PM2.5 inlet. The TEOM was a standard TEOM,
with the filter heated at 50 °C. The OCEC Field instrument was equipped with a
parallel plate denuder to remove VOCs from the incoming air stream. The OCEC
Field instrument of Sunset Laboratory is based on the same principles as the lab
instrument from the same company and makes use of a thermal-optical transmission
(TOT) technique to measure total carbon (TC) and to discriminate between thermal
EC and thermal OC [Birch and Cary, 1996]. In addition, the Field instrument provides
data for optical EC (OptEC), which are obtained from the transmitted laser light (660
nm) intensity through the sampling filter. From the difference between TC and
OptEC, optical OC (OptOC) is then deduced. The in-situ measurements with the
TEOM and aethalometer were done with a time resolution of 5 min and those with
the OCEC Field instrument with a time resolution of one hour.
Aerosol samples (normally separate day and night samples, with start at 7:00 and
19:00, respectively) for comprehensive organic and inorganic analyses were
collected with a variety of filter samplers, including low-volume PM2.5 and PM10
collectors [Maenhaut and Claeys, 2007] and a Hi-Vol dichotomous sampler (HVDS)
[Solomon et al., 1983], which provides two size fractions (fine: <2.5 µm aerodynamic
diameter (AD) and coarse (>2.5 µm AD)), and with a 10-stage microorifice uniform
deposit impactor (MOUDI) [Marple et al., 1991] with 3-stage nano-MOUDI extension.
In order to restrict and/or to assess the artifacts in the filter sampling for particulate
OC, a cylindrical diffusion denuder for VOCs was deployed in front of the filter
[Mikuška et al., 2003; Maenhaut et al., 2004] and/or a tandem (double) filter system

Project SD/AT/02 - Formation mechanisms, marker compounds and source apportionment for biogenic atmospheric
aerosols “BIOSOL”
SSD - Science for a Sustainable Development - Atmosphere 18
with front and back quartz fibre filters [Maenhaut and Claeys, 2007] was used. All
together, 3 low-volume PM2.5 samplers with quartz fibre filters were deployed, all of
them with tandem filters, one with normally day/night time resolution, the other two
with normally 24-hour time resolution, with one of these (P25DWW) operated with a
diffusion denuder for VOCs upstream of the front filter and the other (P25UWW)
without such denuder.
Standard meteorological measurements (of, e.g., temperature, relative humidity, and
wind speed and direction) were also performed.
Depending upon the sampler type and/or collection surface, the aerosol samples
were analysed for the PM, OC and EC, water-soluble OC (WSOC), various individual
water-soluble and organic-solvent extractable species, and a suite of elements. The
analytical methods include gravimetry (for the PM), a TOT technique (for OC and
EC), ion chromatography (IC) for the inorganic components, and GC/MS, LC/MS,
and IC for the organic species [Maenhaut and Claeys, 2007, and references therein].
For measuring WSOC, use was made of a Shimadzu TOC-V CPH analyser and the
elements were determined by particle-induced X-ray emission spectrometry (PIXE)
[Maenhaut and Claeys, 2007]. The analyses for the PM, OC, EC, WSOC, inorganic
and organic ionic components, and elements have all been completed, but the
detailed analyses for the organic species are still going on.
Prior to the 2006 campaign, a 2003 campaign was conducted at the K-puszta site by
the BIOSOL partners C and P2 [Maenhaut and Claeys, 2007]. This earlier campaign
was an aerosol measurement and collection campaign only. A HVDS was deployed in
the 2003 campaign too and these samples were subjected to additional analyses for
detailed organic compounds as part of the current project.
2.3. Field experiment at the state forest “De Inslag”, Brasschaat, Belgium
The state forest “De inslag” is located at 51º18'33”N, 4º35'14”E, 15 m above sea level,
in Brasschaat, Belgium. It is a 79-year old mixed pine-oak forest and is situated at about
12 km NE of the center of the city of Antwerp and at about 9 km to the east of the
Antwerp harbour area. The field work at this site was done in co-operation with the
Flemish Research Institute for Nature and Forest (Ir. J. Neirynck); it started on 25 April
2007 and ended on 12 November 2007. Three of the 4 BIOSOL partners (C, P2, and
P3) participated in the field work. In-situ measurements for OC, EC, and TC (all in
PM2.5) were done with a Sunset Laboratory OCEC Field instrument from 25 April to 13
July 2007 (1st period) and from 19 September to 12 November 2007 (2nd period); in
between 13 July and 19 September 2007, the instrument was shipped off to Finland
Project SD/AT/02 - Formation mechanisms, marker compounds and source apportionment for biogenic atmospheric
aerosols “BIOSOL”
SSD - Science for a Sustainable Development - Atmosphere 19
and back for use in the field campaign at the SMEAR II site (see section 2.4). The time
resolution of the operation with the OCEC Field instrument was 1 hour during the 1st
period of the measurements and 2 hours during the 2nd period. From 5 June until 13
July 2007, a HVDS was deployed for separate day and night aerosol collections in two
size fractions (fine: <2.5 µm AD; coarse: >2.5 µm AD). The inlet for the OCEC Field
instrument and the HVDS were located on a tower at about 9 m above ground level.
For measuring biogenic and other VOCs, a PTR-MS instrument was deployed at the
site from 25 April until the end of October 2007. However, because of instrument
problems, good accurate data are only available for the period from the end of July until
mid-September 2007. Two intakes were installed on the tower for the PTR-MS
measurements, one at 24 m above ground level, the other at 40 m above ground.
Because of the problems with the PTR-MS instrument, there are unfortunately no
overlapping aerosol and PTR-MS measurements for the site. The samples of the HVDS
were analysed by C for OC and EC by TOT and also for WSOC. C analysed both the
fine front and back filters by IC for cationic and anionic species, including dicarboxylic
acids. P2 performed analyses for detailed organic compounds by LC/(-)ESI-MS of the
fine front filters.
P3 was not really satisfied with the results from its VOC measurements by PTR-MS in
2007 and decided therefore to make new measurements in the course of 2008.
Unfortunately, there were serious problems with the PTR-MS instrument and good
data were not acquired. In order to have the 2008 PTR-MS measurements
complemented by measurements for organic aerosols, C decided to perform in-situ
measurements for OC with its OCEC Field instrument in parallel. The latter
instrument was installed at the site on 9 June 2008, but there were during one month
serious problems with it. Good data were obtained from 15 July on until 6 November
2008, when the instrument was removed from the site. The time resolution used for
the measurements was 2 h.
2.4. Field experiment at the forested site of SMEAR II, Hyytiälä, Finland
From 29 July to 2 September 2007, a field campaign was conducted at the Station for
Measuring Forest Ecosystem-Atmosphere Relations (SMEAR II) in Hyytiälä, Finland.
This station is a boreal coniferous forest station [Boy et al., 2004] and is located at
61°51'N, 24°17'E, 181 m above sea level. The largest city near the station is Tampere,
ca. 60 km S-SW of the measurement site. Similarly as K-puszta, SMEAR II is a
EUSAAR station. The actual field work at the site took place from 1 to 31 August 2007.
Three of the 4 BIOSOL partners (C, P2, and P4) participated in the field work.

Project SD/AT/02 - Formation mechanisms, marker compounds and source apportionment for biogenic atmospheric
aerosols “BIOSOL”
SSD - Science for a Sustainable Development - Atmosphere 20
The field work for the campaign consisted of in-situ measurements on gases and
aerosols and of collection of various types of aerosol samples. Isoprene, other BVOCs,
and their volatile organic oxidation products were determined by PTR-MS; critical
inorganic trace gases (e.g., O3, NOx, SO2) were determined by instrumentation
available at the site; particle number concentrations and size distributions were
measured with DMPS systems; ion spectra were determined with an AIS; the PM, BC,
and particulate-phase OC (and EC) were determined in situ and in real time with a
TEOM, an aethalometer, and an OCEC Field instrument, respectively. The real-time
measurements were thus similar as for the 2006 campaign at K-puszta; however, the
ones for trace gases and various auxiliary parameters were much more extensive than
at K-puszta. The time resolution for the OCEC Field instrument was 1, 2, or 4 hours,
depending upon the OC levels, whereas the time resolution of the other in-situ
measurements was 10 min or better.
As far as the aerosol collections were concerned, the same samplers were deployed as
for the 2006 campaign at K-puszta (see section 2.2) and in addition also a small deposit
area low pressure cascade impactor (SDI) [Maenhaut et al., 1996a]. The latter device
was used with quartz fibre filter impaction substrates for OC and EC analyses by TOT
and thus for obtaining the detailed mass size distrution of OC and EC. The collections
with the various samplers were mostly done with day/night time resolution, with the day-
time samplings from 7:30 to 19:40 local time (UTC+3) and the night-time samplings
from 20:20 to 6:40 local time.
Depending upon the sampler type and/or collection surface, the aerosol samples
were (or will be) analysed for the PM, OC and EC, WSOC, various individual water-
soluble and organic-solvent extractable species, and a suite of elements, using the
same analytical techniques as for the samples from the 2006 K-pustza campaign
(see section 2.2). The analyses for the PM, OC, EC, WSOC, inorganic and organic
ionic components, and elements have all been completed, but the detailed analyses
for the organic species by MS still have to be started.
Prior to the 2007 campaign, a less comprehensive campaign was conducted in summer
2005 (i.e., from 28 July to 11 August) at SMEAR II by the BIOSOL partners P2, P4, and
C. The work of that campaign also forms part of the current project. Details on the
measurements, aerosol collections, and chemical analyses of that 2005 campaign are
given in Kourtchev et al. [2008a,b].

Project SD/AT/02 - Formation mechanisms, marker compounds and source apportionment for biogenic atmospheric
aerosols “BIOSOL”
SSD - Science for a Sustainable Development - Atmosphere 21
2.5. Field work during an oceanic cruise and at a remote island in the southern Indian Ocean
These experiments were at the same time conducted within the framework of the EU-
funded project “Organics over the Ocean Modifying Particles in both Hemispheres”
(OOMPH) and were carried out in co-operation with research teams of France (Dr. J.
Sciare, Laboratoire des Sciences du Climat et de l’Environnement (LSCE), Gif-sur-
Yvette) and of Greece (Prof. N. Mihalopoulos, University of Crete (UoC), Heraklion). At
the outset, it was planned to have aerosol samples collected during two oceanic
cruises, one in the Northern and one in the Southern Hemisphere. The cruise in the
Northern Hemisphere took place with the F.S. Meteor in the Mauritanian upwelling
region of the tropical North Atlantic from 12 July to 6 August 2006. At the request of
Prof. Mihalopoulos, Hi-Vol samples on quartz fibre filter substrates were collected
during this cruise by the team of Dr. A. Baker (University of East Anglia, U.K.). The
sampler was a 3-stage Hi-Vol cascade impactor [Baker, 2004], providing three size
fractions (>2 µm, 1.3-2 µm, and <1.3 µm), and a total of 21 daily samples were
collected. The coarse (>2 µm) and medium (1.3-2 µm) size fractions were collected
on impaction substrates, and the fine (<1.3 µm) fraction on a back-up filter. The three
size fractions of all samples from this cruise were analysed for OC and EC, the fine
and coarse size fractions also for WSOC, and the fine fractions also by GC/MS and
LC/MS.
As far as the cruise in the Southern Hemisphere is concerned: It was decided not to
collect Hi-Vol samples on this cruise, but instead at Amsterdam Island (37.52ºS,
77.32ºE), which is located in the southern Indian Ocean about half-way between the
southern edge of Africa and the southern edge of Australia. UGent provided a HVDS to
LSCE for deployment by LSCE personnel at the site. The sampler was located on the
north side of the island at about 30 m above sea level and the horizontal distance of
the HVDS from the sea was around 45 m. A total of 18 HVDS collections (of 5 days)
were done in two size fractions (fine: <2.5 µm, and coarse: >2.5 µm) on double
Gelman Pall quartz fibre filters, i.e., from 3 December 2006 until 4 March 2007. The
front and back filters of both size fractions were subjected by C to analyses for OC,
EC, TC, WSOC, and water-soluble inorganic and organic species. Besides, the
samples were subjected to LC/(–)ESI-MS by P2; with this technique, the front and
back filters of the fine size fraction were analysed for methanesulphonate (MSA),
sulphate, and organosulphates, whereas the front and back filters of the coarse size
fraction were analysed for MSA. As part of the analyses for organosulphates, it was
also examined whether isoprene-related organosulphates were present. SOA from the
photo-oxidation of isoprene produced by phytoplankton blooms has been proposed as

Project SD/AT/02 - Formation mechanisms, marker compounds and source apportionment for biogenic atmospheric
aerosols “BIOSOL”
SSD - Science for a Sustainable Development - Atmosphere 22
a marine SOA source, which could be responsible for the increased cloud droplet
concentrations over such blooms [Meskhidze and Nenes, 2006]. The isoprene SOA
markers targeted were sulphate esters of the 2-methyltetrols (2-methylthreitol and
2-methylerythritol), which have been reported first by Surratt et al. [2007] and can
serve as markers for SOA from the photo-oxidation of isoprene in acidic conditions.
Our rationale for considering the 2-methyltetrol sulphates was that the 2-methyltetrols
are markers for the photo-oxidation of isoprene under low-NOx conditions [Surratt et
al., 2006] such as found in a pristine marine environment, and that, if formed, they
would be converted to sulphates given that fine marine aerosols contain a substantial
amount of sulphate.
2.6. Data analyses and interpretation for the laboratory and field experiments
For both the laboratory and field measurements, the relationships between the
concentrations of the BVOCs, their volatile oxidation products, critical inorganic trace
gases, other atmospheric and radiative parameters, particle (and ion) numbers and
sizes, and the aerosol composition as a function of size (in particular the concentration
of particulate-phase BVOC oxidation products) are thoroughly examined. This involves
approaches as used by Boy et al. [2004] and Edney et al. [2005]. A major aim of this
work is to gain improved insights into the relative importance of homogeneous photo-
oxidation and multi-phase processes and in the importance of HULIS formation.
2.7. Modelling of the formation and growth of the fine particles and of the fine biogenic atmospheric aerosol
The data sets obtained are used for modelling the formation and growth of the fine
particles and of the fine biogenic atmospheric aerosol. For this purpose, extensive use
is made of the modelling capabilities of the Finnish partner (i.e., partner 4), and
especially of aerosol dynamics and atmospheric chemistry models, such as the
University of Helsinki Multicomponent Aerosol (UHMA) model [Pirjola 1999; Lehtinen
and Kulmala, 2003; Laakso et al., 2004; Korhonen et al., 2004]. In these models,
aerosol formation and growth, including aerosol dynamics to evaluate sink terms for
condensable molecules and gas-phase chemistry to include source terms for these
molecules, will be used. Furthermore, process models are coupled with dispersion
models. In the chemistry part of the models, the chemistry of O3, NOx, VOC, and other
relevant species are related to aerosol formation. The effects of meteorological
dynamics on aerosol processes are studied by applying the aerosol dynamic models in
a Lagrangian approach including wave motions and atmospheric mixing. The

Project SD/AT/02 - Formation mechanisms, marker compounds and source apportionment for biogenic atmospheric
aerosols “BIOSOL”
SSD - Science for a Sustainable Development - Atmosphere 23
concentrations of non-measured critical species, such as the OH and HO2 radicals, are
hereby estimated, as done by Boy et al. [2005].
The characteristics of new particle formation events and cluster ions were examined for
the 2006 summer campaign at K-puszta.
2.8. Identification of particulate-phase oxidation products of isoprene (and other BVOCs), which can be used as indicator compounds for source apportionment
For the identification of particulate-phase oxidation products of isoprene (and other
BVOCs) useful for source apportionment, archived and newly collected aerosol
samples from both laboratory experiments and field campaigns were examined.
Unknown compounds, which occur at important levels in gas or liquid chromatograms
of the sample extracts, were structurally characterised. For the structural elucidation of
unknown compounds, use was made of GC/MS in combination with derivatisation and
ion trap MSn techniques as well as of LC/MS employing electrospray ionisation and the
ion trap MSn capability. The latter technique is also used to elucidate the complex
chemical structures of the HULIS, which represent an important fraction of natural
biogenic aerosol [Zappoli et al., 1999]. On the basis of the results, it is deduced which
oxidation products (besides the 2-methyltetrols) are sufficiently stable to serve as
marker compounds for the determination of the SOA contribution, which is derived from
isoprene. Although the emphasis in this work was placed on oxidation products of
isoprene, other unknown compounds, which occur at important levels and which, for
example, might be formed by photo-oxidation of other BVOCs, such as the mono- and
sesquiterpenes, were characterised as well. Besides advanced multidimensional MS
approaches, also nuclear magnetic resonance (NMR) is used for the structural
elucidation [Claeys et al., 2007; Szmigielski et al., 2007a].
On the basis of the results obtained from the field campaign samples and those from
the various laboratory measurements, it is attempted to construct appropriate source
profiles (that is with percentages of the appropriate indicator compounds in the OC
generated from the BVOCs), which can be useful for source apportionment, including
Chemical Mass Balance receptor modelling.
2.9. Determination of the contribution from the BVOCs to the organic aerosol for various sites in Europe
So far, this work was performed for the PM2.5 size fraction of the HVDS samples from
the 2003 summer campaign at K-puszta [Kourtchev et al., 2009] and for PM2.5
Project SD/AT/02 - Formation mechanisms, marker compounds and source apportionment for biogenic atmospheric
aerosols “BIOSOL”
SSD - Science for a Sustainable Development - Atmosphere 24
samples, which had been collected in summer 2003 in a mixed deciduous forest in
Jülich [Kourtchev et al., 2008c]. The secondary organic carbon (SOC) contributions of
isoprene and α-pinene and the OC contributions from wood smoke and fungal spores
(and for K-puszta also from the dicarboxylic acids (DCAs)), were calculated. The SOC
contributions from isoprene and α-pinene were estimated using our measured tracer
concentrations and the laboratory-derived tracer mass fractions (fSOC) reported by
Kleindienst et al. [2007]. Three isoprene SOA tracers (i.e., the two 2-methyltetrols
and 2-methylglyceric acid) and 9 α-pinene SOA tracers were included by these
authors in the determination of the fSOC data and the fSOC data and associated
uncertainties reported were 0.155±0.039 for isoprene and 0.231±0.111 for α-pinene.
We used the same set of 3 tracers for isoprene SOA, but our set of tracers for
α-pinene SOA was limited to 3 of the 9 tracers of Kleindienst et al. [2007], i.e., to 3 of
the 4 following compounds: cis-pinonic acid, cis-pinic acid, 3-hydroxyglutaric acid
(3-HGA), and 3-methyl-1,2,3-butanetricarboxylic acid (MBTCA); as a consequence,
our estimate of SOC from α-pinene has to be considered as a lower limit of the true
contribution from α-pinene. The DCAs, which were measured by us and included in the
contribution calculations (for K-puszta) were oxalic acid, malic acid, succinic acid,
glutaric acid, and 2-hydroxyglutaric acid. It was hereby assumed that the short-chain
diacids do not form part of the isoprene and α-pinene SOA in the laboratory
experiments of Kleindienst et al. [2007]. Levoglucosan was used as indicator for wood
burning and arabitol for fungal spores. For estimating the wood burning OC, use was
made of the levoglucosan/OC ratio of 0.179 for Austrian wood smoke, as deduced
from Schmidl et al. [2008]. Fungal spores OC was estimated using the arabitol/OC
ratio for fungal spores of 0.092, as derived from the data given by Bauer et al. [2008].

Project SD/AT/02 - Formation mechanisms, marker compounds and source apportionment for biogenic atmospheric
aerosols “BIOSOL”
SSD - Science for a Sustainable Development - Atmosphere 25
3. RESULTS
3.1. Study of the formation of biogenic SOA through smog chamber experiments
3.1.1. Formation mechanisms of SOA from isoprene
In co-operation with Caltech, a study was performed to obtain insights into the
formation mechanisms of SOA from isoprene, in particular the mechanisms that result
in the formation of 2-methyltetrols, 2-methylglyceric acid (2-MG), and HULIS. An
extensive series of smog chamber experiments was performed under various
conditions, in particular at low- and high-NOx levels, and with and without seed aerosol.
The results from the chamber experiments were compared with results for fine aerosol
that had been collected in the Amazon forest.
It was found that the chemical nature of the smog-chamber SOA was significantly
different between the two NOx regimes. For the high-NOx conditions, the SOA
components were acidic and formed upon the further oxidation of methacrolein
(MACR), where currently no other first-generation gas-phase products appear to
contribute to SOA formation. The low-NOx SOA was found to be neutral in nature
owing to the formation of polyols and organic peroxides. MACR was found not to
contribute to SOA formation under low-NOx conditions, which is likely due to
hydroperoxide formation. Based on SOA growths, acid-catalysis seemed to play a
larger role under low-NOx conditions. By using a conventional iodometric-
spectroscopic method, it was found that organic peroxides (likely dominated by
hydroperoxides) contributed significantly to the low-NOx SOA mass [~61% for
nucleation experiments (these are experiments without seed aerosol) and ~25% and
30% for dry seeded and acid seeded experiments, respectively].
Oligomerisation was observed to be an important isoprene SOA formation pathway
for both low- and high-NOx conditions. The nature of the oligomers, however, was
distinctly different in each NOx regime. The high-NOx oligomers have an obvious
monomeric unit, where observable 102 Da differences were detected with the on-line
and off-line mass spectrometry techniques. These high-NOx oligomers were
characterised as oligo-esters, where their formation could be explained by particle-
phase esterification reactions involving 2-methylglyceric acid as the key monomeric
unit. These oligo-esters accounted for a substantial fraction (~22-34%) of the SOA
mass formed from isoprene oxidation under high-NOx conditions.

Project SD/AT/02 - Formation mechanisms, marker compounds and source apportionment for biogenic atmospheric
aerosols “BIOSOL”
SSD - Science for a Sustainable Development - Atmosphere 26
Tracer compounds for isoprene oxidation in the ambient atmosphere, which had
been detected for samples from the Amazon Basin, were detected in the low-NOx
chamber experiments with isoprene. They included C5-alkene triols and hemiacetal
dimers, which were detected for the first time in a controlled laboratory experiment,
suggesting that the oxidative conditions used in these experiments are relevant to
remote regions of the world. It was elucidated that the hemiacetal dimers formed in
these low-NOx chamber experiments result from the reaction of 2-methyltetrols and
C5-alkene triols (a pathway that is likely relevant to the real atmosphere). Higher
mass hemiacetals (and acetals) evaded detection using the GC/MS derivatisation
technique, owing to the possible thermal decomposition of these higher mass
oligomers and/or being permanently retained on the GC/MS column. The detection of
C5-alkene triols and the unstable products, tentatively characterised as 2-methyltetrol
performate derivatives, provides evidence for the rearrangement of hydroxyperoxy
radicals or the decomposition/rearrangement of hydroperoxides, formed from the
initial oxidation (OH/O2) of isoprene, into C5-alkene triols and epoxydiols. Besides the
formation of hemiacetal (acetal) oligomers in low-NOx SOA, it is speculated (despite
lack of spectroscopic evidence) that peroxyhemiacetal oligomers could also form,
owing to the large amounts of peroxides measured in the particle phase.
Based on the results of this study mechanisms could be proposed for the formation of
isoprene SOA under both high- and low-NOx conditions (Schemes 1 and 2).
More details on this isoprene smog chamber study and the structural characterisation
of isoprene SOA compounds can be found in two comprehensive published articles
[Surratt et al., 2006; Szmigielski et al., 2007a].

Project SD/AT/02 - Formation mechanisms, marker compounds and source apportionment for biogenic atmospheric
aerosols “BIOSOL”
SSD - Science for a Sustainable Development - Atmosphere 27
Scheme 1. Proposed mechanism for SOA formation from isoprene photo-oxidation under
high-NOx conditions. Symbol used: &, further study needed in order to understand the formation (in gas/particle phase) of 2-MG.
a, b and cElemental compositions confirmed by accurate mass ESI-MS.
Project SD/AT/02 - Formation mechanisms, marker compounds and source apportionment for biogenic atmospheric
aerosols “BIOSOL”
SSD - Science for a Sustainable Development - Atmosphere 28
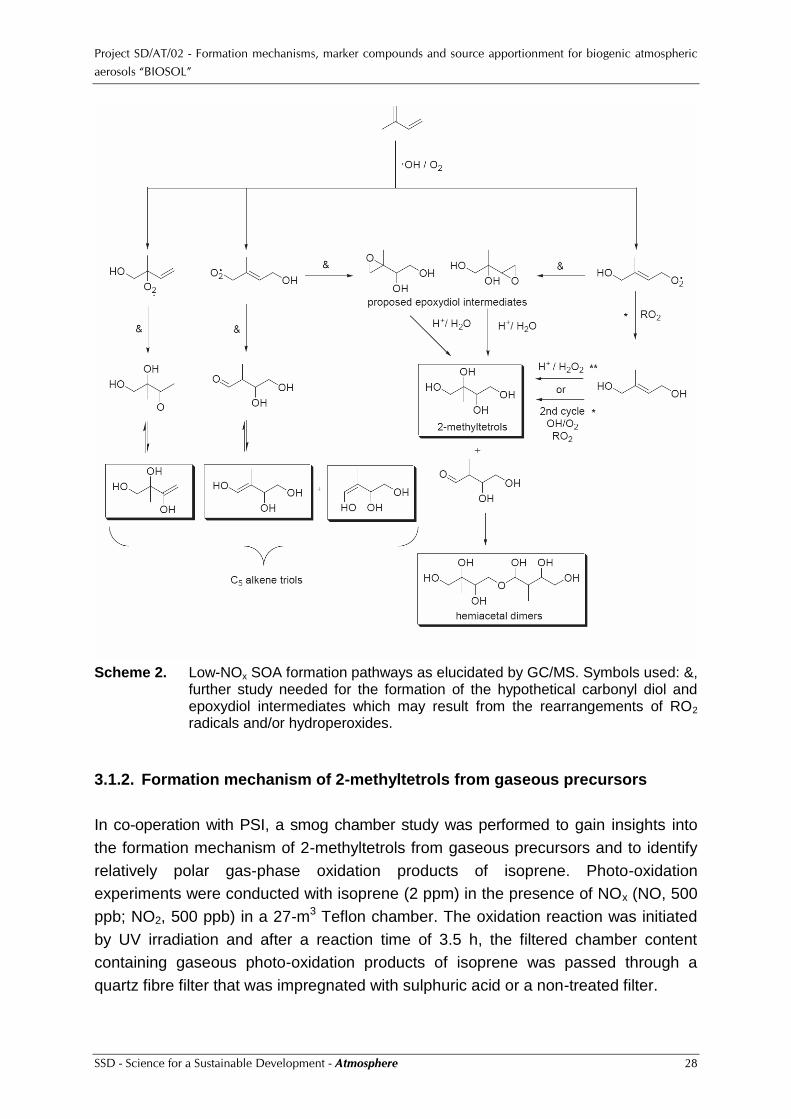
Scheme 2. Low-NOx SOA formation pathways as elucidated by GC/MS. Symbols used: &,
further study needed for the formation of the hypothetical carbonyl diol and epoxydiol intermediates which may result from the rearrangements of RO2 radicals and/or hydroperoxides.
3.1.2. Formation mechanism of 2-methyltetrols from gaseous precursors
In co-operation with PSI, a smog chamber study was performed to gain insights into
the formation mechanism of 2-methyltetrols from gaseous precursors and to identify
relatively polar gas-phase oxidation products of isoprene. Photo-oxidation
experiments were conducted with isoprene (2 ppm) in the presence of NOx (NO, 500
ppb; NO2, 500 ppb) in a 27-m3 Teflon chamber. The oxidation reaction was initiated
by UV irradiation and after a reaction time of 3.5 h, the filtered chamber content
containing gaseous photo-oxidation products of isoprene was passed through a
quartz fibre filter that was impregnated with sulphuric acid or a non-treated filter.

Project SD/AT/02 - Formation mechanisms, marker compounds and source apportionment for biogenic atmospheric
aerosols “BIOSOL”
SSD - Science for a Sustainable Development - Atmosphere 29
It was found that the 2-methyltetrol concentration is significantly increased in the
sulphuric acid-treated filter compared to the non-treated filter. These results support
that formation of 2-methyltetrols in SOA from the photo-oxidation of isoprene involves
acid-catalysed hydrolysis of gaseous precursors, as proposed in previous work. More
specifically, the formation of 2-methyltetrols can be readily explained by acid-
catalysed degradation of methylnitrooxybutanetriols and methyldinitroxybutanediols,
which are known to form in the presence of NOx. In addition, a relatively polar photo-
oxidation product of isoprene was collected on the sulphuric acid-treated filter. This
compound was tentatively identified as a novel C5-hydroxydicarbonyl compound
(molecular weight (MW): 116; 4-hydroxy-1,3-diketo-2-methylbutane) based on its
chromatographic behaviour and detailed interpretation of electron and chemical
ionisation mass spectral data. The formation of 4-hydroxy-1,3-diketo-2-methylbutane
can be explained through acid-catalysed degradation of methylnitrooxybutanetriols
and methyldinitroxybutanediols but also involves acid-catalyzed loss of the tertiary
hydroxyl group and formal loss of nitrous acid (HONO).
3.1.3. Structure of marker compounds for the photo-oxidation of α-pinene
In co-operation with US EPA, a smog chamber study was carried out to elucidate the
structures of marker compounds for the photo-oxidation of α-pinene, which were also
detected in fine aerosol that had been collected during the 2003 summer campaign in
K-puszta, Hungary. The results of this study are presented in section 3.8.
3.1.4. Studies on organosulphates
P2 collaborated in the interpretation of results on organosulphates which were
obtained by Caltech and US EPA in smog chamber experiments with isoprene and
α-pinene. In this study, experiments were done under different NOx conditions in the
absence and presence of sulphuric acid seed aerosol. Over the full range of NOx
conditions, resultant sulphate esters in isoprene and α-pinene SOA were identified
and structurally elucidated. Sulphate esters were found to account for a larger
fraction of the SOA mass with increased acidity of seed aerosol, providing an
explanation for the “acid-effect” in SOA formation. Many of the isoprene and α-pinene
sulphate esters identified in the chamber experiments were also found in aerosol
collected from the southeastern US and K-puszta, Hungary, demonstrating the
atmospheric relevance of these particle-phase reaction products. The isoprene and
α-pinene photo-oxidation products of which organosulphate derivatives were
identified include (Scheme 3): 2-methyltetrols (1), 2-methyltetrol mono-nitrate
derivatives (2), 2-methylglyceric acid (3), and α-pinanediol hydroxynitrate (4).

Project SD/AT/02 - Formation mechanisms, marker compounds and source apportionment for biogenic atmospheric
aerosols “BIOSOL”
SSD - Science for a Sustainable Development - Atmosphere 30
OH OH
OH
O
OHOH
OH
ONO2
OHOH
OH
OH
ONO2
OH
(1)
(3)
(2)
(4)
Scheme 3. Photo-oxidation products of isoprene and α-pinene for which sulphate derivatives were identified.
Further details on this study can be found in a published article [Surratt et al., 2007].
P2 also contributed to a smog chamber study performed by the IfT with interpretation of
results and interpretation of mass spectral data. This study dealt with the
characterisation of an organosulphate from the ozonolysis of β-pinene and of other
organosulphates from the photo-oxidation of monoterpenes. Organosulphates were
only found in SOA from β-pinene ozonolysis in the presence of acidic sulphate seed
particles. One of the detected organosulphates also occurred in ambient aerosol
samples that were collected at a forest site in northeastern Bavaria, Germany.
β-Pinene oxide, an oxidation product in β-pinene/O3 and β-pinene/NO3 reactions, is
identified as a possible precursor for the β-pinene-derived organosulphate.
Furthermore, several nitrooxy-organosulphates originating from monoterpenes were
found in the ambient samples. These nitrooxy-organosulphates were only detected in
the night-time samples suggesting a role for night-time chemistry in their formation.
Their LC/MS chromatographic peak intensities suggest that they represent an
important fraction of the organic mass in ambient aerosols, especially at night. More
details on this study are given in Iinuma et al. [2007].
In cooperation with Caltech and EPA, the mechanism and ubiquity of organosulphate
formation in biogenic SOA was comprehensively investigated by a series of laboratory
photo-oxidation and night-time oxidation experiments using isoprene and
monoterpenes (α- and β-pinene, d- and l-limonene, α-terpinene, γ-terpinene, and
terpinolene). In addition, archived laboratory-generated isoprene SOA and ambient
filter samples from the southeastern US were re-examined for organosulphates and
nitrooxy organosulphates. Only SOA compounds that were also detected in ambient
PM2.5 aerosol from the southeastern USA were selected for structural
characterisation. In addition, C estimated for PM10 samples of K-puszta, Hungary,
which contain the same organosulphates as the samples from the southeastern USA,

Project SD/AT/02 - Formation mechanisms, marker compounds and source apportionment for biogenic atmospheric
aerosols “BIOSOL”
SSD - Science for a Sustainable Development - Atmosphere 31
for which a fraction of the OM may be due to organosulphates. In these calculations, C
made use of its sulphur data obtained by particle-induced PIXE and of its sulphate
data obtained by IC for the samples from the 2003 summer campaign at K-puszta. It
was found that the organosulphates were formed only when monoterpenes were
oxidised in the presence of acidified sulphate seed aerosol, a result consistent with
prior work. By comparing the tandem MS and accurate mass data collected for both
the laboratory-generated and ambient aerosol, previously uncharacterised ambient
organic aerosol components were found to be organosulphates of isoprene, α-pinene,
β-pinene, and limonene, thus demonstrating the ubiquity of organosulphate formation
in ambient SOA. Several of the organosulphates of isoprene and of the monoterpenes
characterised in this study provide ambient tracer compounds for the occurrence of
biogenic SOA formation under acidic conditions. Furthermore, the night-time-oxidation
experiments conducted under highly acidic conditions revealed one viable mechanism
for the formation of previously identified nitrooxy organosulphates found in ambient
night-time aerosol samples. It was estimated that the contribution from
organosulphates to the total organic mass fraction for the PM10 samples from the
2003 K-puszta summer campaign can be as high as 30%. Based on this study,
reaction mechanisms for the formation of the MW 295 nitrooxy organosulphates
related to α-pinene were proposed (Scheme 4). For isomers 1 and 2(295), it remains
unclear how the NO3-initiated oxidation produces these products in the presence of
highly acidified sulphate seed aerosol. Further work is recommended to address this
issue. A comprehensive article on this study was published [Surratt et al., 2008].
OH OH
O2
OH
ONO2
OSO3H
ONO2
OH OH
O2
OH
O2NO
OSO3H
O2NO
O2
ONO2
OH
O2
OH
ONO2
OSO3H
ONO2
OH isomerisation
O2
. . NO H2SO4
- H2O
MW 215 1(295)
OH isomerisation
O2
..
NO H2SO4
- H2O
MW 215 2(295)
OH
.
.
NO3
O2
O2
RO2
NO
H2SO4
- H2O
3(295)
Scheme 4. Proposed mechanisms for formation of the isomeric MW 295 nitrooxy
organosulphates related to α-pinene.
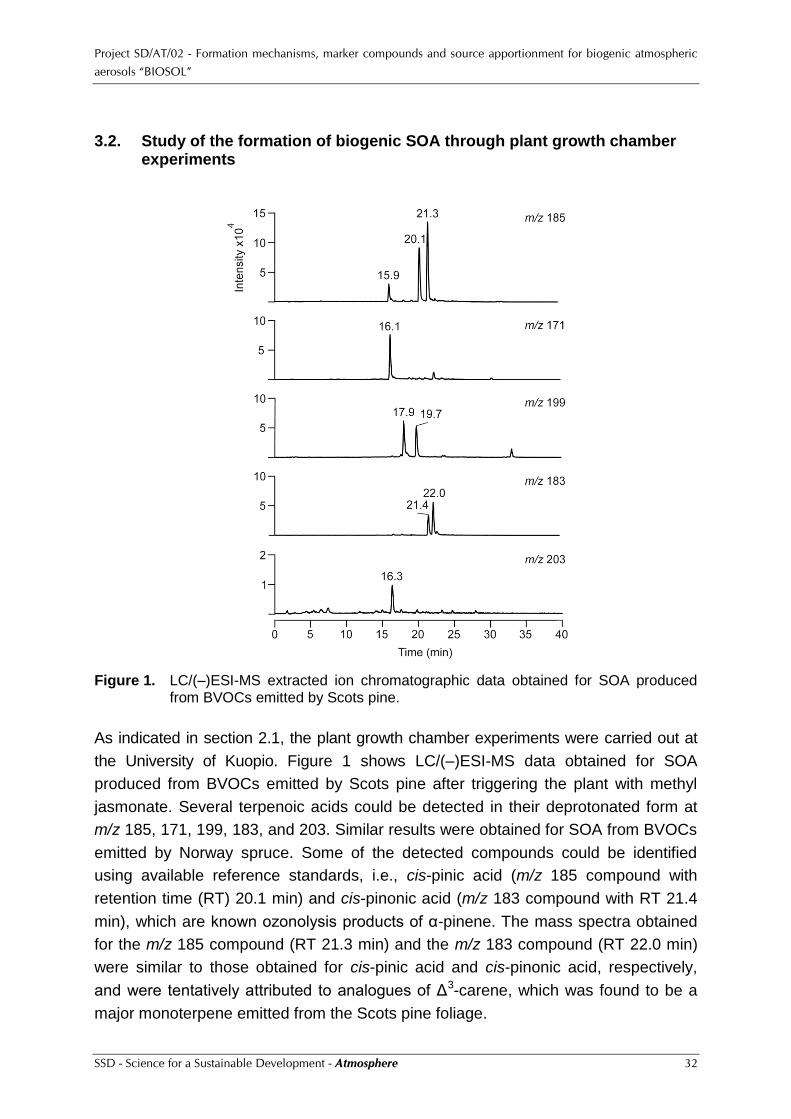
Project SD/AT/02 - Formation mechanisms, marker compounds and source apportionment for biogenic atmospheric
aerosols “BIOSOL”
SSD - Science for a Sustainable Development - Atmosphere 32
3.2. Study of the formation of biogenic SOA through plant growth chamber experiments
Figure 1. LC/(–)ESI-MS extracted ion chromatographic data obtained for SOA produced
from BVOCs emitted by Scots pine.
As indicated in section 2.1, the plant growth chamber experiments were carried out at
the University of Kuopio. Figure 1 shows LC/(–)ESI-MS data obtained for SOA
produced from BVOCs emitted by Scots pine after triggering the plant with methyl
jasmonate. Several terpenoic acids could be detected in their deprotonated form at
m/z 185, 171, 199, 183, and 203. Similar results were obtained for SOA from BVOCs
emitted by Norway spruce. Some of the detected compounds could be identified
using available reference standards, i.e., cis-pinic acid (m/z 185 compound with
retention time (RT) 20.1 min) and cis-pinonic acid (m/z 183 compound with RT 21.4
min), which are known ozonolysis products of α-pinene. The mass spectra obtained
for the m/z 185 compound (RT 21.3 min) and the m/z 183 compound (RT 22.0 min)
were similar to those obtained for cis-pinic acid and cis-pinonic acid, respectively,
and were tentatively attributed to analogues of Δ3-carene, which was found to be a
major monoterpene emitted from the Scots pine foliage.
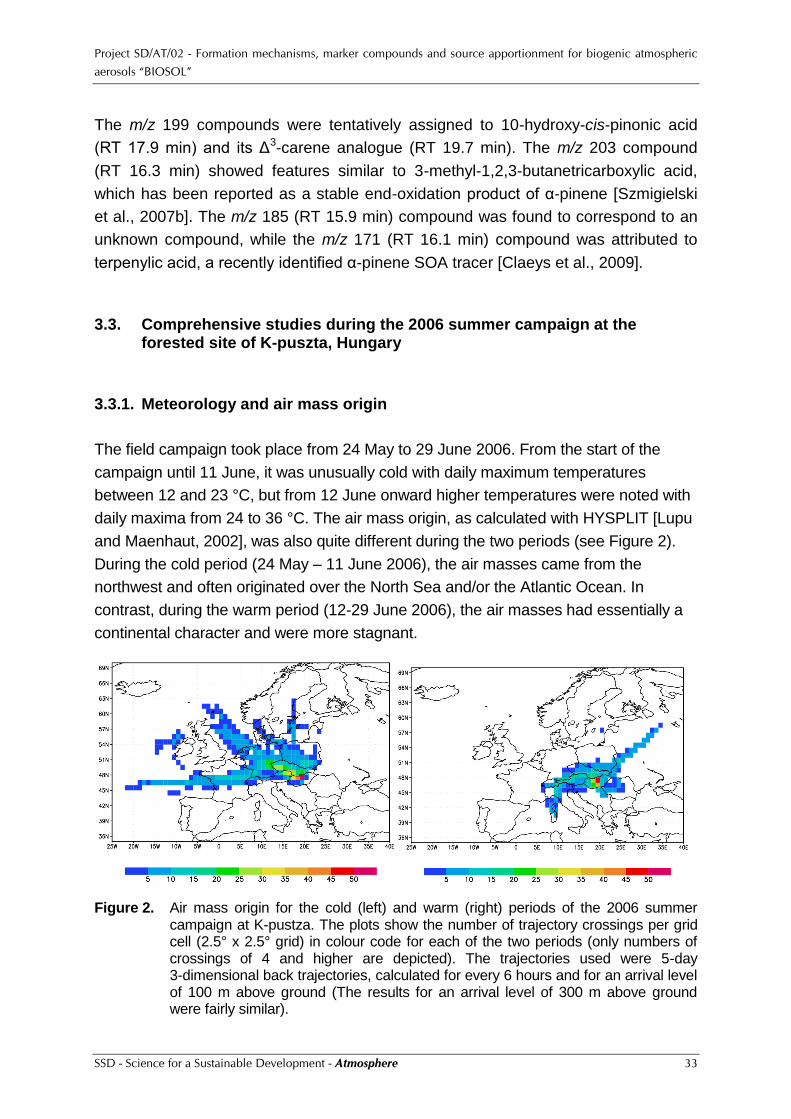
Project SD/AT/02 - Formation mechanisms, marker compounds and source apportionment for biogenic atmospheric
aerosols “BIOSOL”
SSD - Science for a Sustainable Development - Atmosphere 33
The m/z 199 compounds were tentatively assigned to 10-hydroxy-cis-pinonic acid
(RT 17.9 min) and its Δ3-carene analogue (RT 19.7 min). The m/z 203 compound
(RT 16.3 min) showed features similar to 3-methyl-1,2,3-butanetricarboxylic acid,
which has been reported as a stable end-oxidation product of α-pinene [Szmigielski
et al., 2007b]. The m/z 185 (RT 15.9 min) compound was found to correspond to an
unknown compound, while the m/z 171 (RT 16.1 min) compound was attributed to
terpenylic acid, a recently identified α-pinene SOA tracer [Claeys et al., 2009].
3.3. Comprehensive studies during the 2006 summer campaign at the forested site of K-puszta, Hungary
3.3.1. Meteorology and air mass origin
The field campaign took place from 24 May to 29 June 2006. From the start of the
campaign until 11 June, it was unusually cold with daily maximum temperatures
between 12 and 23 °C, but from 12 June onward higher temperatures were noted with
daily maxima from 24 to 36 °C. The air mass origin, as calculated with HYSPLIT [Lupu
and Maenhaut, 2002], was also quite different during the two periods (see Figure 2).
During the cold period (24 May – 11 June 2006), the air masses came from the
northwest and often originated over the North Sea and/or the Atlantic Ocean. In
contrast, during the warm period (12-29 June 2006), the air masses had essentially a
continental character and were more stagnant.
Figure 2. Air mass origin for the cold (left) and warm (right) periods of the 2006 summer
campaign at K-pustza. The plots show the number of trajectory crossings per grid cell (2.5° x 2.5° grid) in colour code for each of the two periods (only numbers of crossings of 4 and higher are depicted). The trajectories used were 5-day 3-dimensional back trajectories, calculated for every 6 hours and for an arrival level of 100 m above ground (The results for an arrival level of 300 m above ground were fairly similar).

Project SD/AT/02 - Formation mechanisms, marker compounds and source apportionment for biogenic atmospheric
aerosols “BIOSOL”
SSD - Science for a Sustainable Development - Atmosphere 34
3.3.2. VOC data and relation to temperature
From the data for the VOCs and their oxidation products, as obtained by PTR-MS, it
was quite clear that much higher levels were observed during the warm period than
during the cold one (Table I). This difference is to be expected, given that both
formation and emission of the VOCs by plants increase with light and temperature.
Table I. Interquartile atmospheric concentration ranges for selected VOCs under different weather conditions. MACR = methacrolein, MVK = methyl vinyl ketone, and MBO = 2-methyl-3-buten-2-ol. The data for the cold period pertain to the period 29 May - 11 June 2006 (there are no data for the earlier days), those for the warm period to the period 12- 25 June 2006.
Interquartile concentration ranges for selected compounds (ppbv)
Weather period
Isoprene (m/z 69)
MACR and MVK (m/z 71)
Mono-terpenes (m/z 137)
Nopinone (m/z 139)
Pinonal-dehyde
(m/z 151)
MBO (m/z 87)
Benzene (m/z 79)
Cold (cloudy)
0.028 - 0.090
0.026 - 0.093
0.019 - 0.044
0.0039 - 0.0079
0.0029 - 0.0063
0.046 -0.074
0.038 - 0.066
Warm (sunny, clear sky)
0.24 - 0.82
0.24 - 0.71
0.089 - 0.63
0.028 - 0.062
0.011 - 0.036
0.12 -0.21
0.049 - 0.086
0.01
0.1
1
10
29-M
ay-0
6
30-M
ay-0
6
31-M
ay-0
6
01-J
un-0
6
02-J
un-0
6
03-J
un-0
6
04-J
un-0
6
05-J
un-0
6
06-J
un-0
6
07-J
un-0
6
08-J
un-0
6
09-J
un-0
6
10-J
un-0
6
11-J
un-0
6
12-J
un-0
6
13-J
un-0
6
14-J
un-0
6
15-J
un-0
6
16-J
un-0
6
17-J
un-0
6
18-J
un-0
6
19-J
un-0
6
20-J
un-0
6
21-J
un-0
6
22-J
un-0
6
23-J
un-0
6
24-J
un-0
6
25-J
un-0
6
Local time
Co
nce
ntr
atio
n [
pp
bv]
-10
0
10
20
30
40
50
Te
mp
. (°
C)
isoprene
MACR + MVK
Temp. (°C)
Figure 3. Time series of the atmospheric concentrations of isoprene (m/z 69), its oxidation
products (m/z 71) [i.e., methacrolein (MACR) and methyl vinyl ketone (MVK)], and of the air temperature at K-puszta for the period from 29 May to 25 June 2006. Note that a log scale is used for the VOCs and a linear scale for the temperature. The vertical dashed lines are at 00:00 h.
When looking at the data with high-time resolution (10-15 min) (see Figure 3), it
appears that the individual concentrations of isoprene and its first-order gas-phase
oxidation products (MACR + MVK) followed the temperature quite closely and the

Project SD/AT/02 - Formation mechanisms, marker compounds and source apportionment for biogenic atmospheric
aerosols “BIOSOL”
SSD - Science for a Sustainable Development - Atmosphere 35
concentrations of the three compounds are highly correlated with each other.
Considering that the emission of isoprene increases exponentially with temperature
and that this compound has an atmospheric lifetime of the order of 1 hr, this behaviour
is not surprising.
The regression equation of the high-time resolution data for isoprene (in ppbv) as a
function of air temperature (in °C) for the period from 29 May to 25 June 2006 was y =
0.014 * e0.140x [R2 = 0.63]. This equation can also be written as y = 0.014 * 4.06x/10; this
indicates that there is a factor of 4 increase in isoprene concentration per 10 °C
increase in temperature. This is much higher than the value typically observed for
biological reactions (which is about 2). For comparison, Lappalainen et al. [2009] found
a lower dependence on air temperature for the day-time isoprene concentration at the
SMEAR II station in Hyytiälä, Finland, during the period 6 June, 2006 - 31 August,
2007. Their equation was y = 0.033 * e0.085x [R2 = 0.65], which corresponds to y =
0.033 * 2.34x/10.
0.01
0.1
1
10
29-M
ay-0
6
30-M
ay-0
6
31-M
ay-0
6
01-J
un-0
6
02-J
un-0
6
03-J
un-0
6
04-J
un-0
6
05-J
un-0
6
06-J
un-0
6
07-J
un-0
6
08-J
un-0
6
09-J
un-0
6
10-J
un-0
6
11-J
un-0
6
12-J
un-0
6
13-J
un-0
6
14-J
un-0
6
15-J
un-0
6
16-J
un-0
6
17-J
un-0
6
18-J
un-0
6
19-J
un-0
6
20-J
un-0
6
21-J
un-0
6
22-J
un-0
6
23-J
un-0
6
24-J
un-0
6
25-J
un-0
6
Local time
Co
nc.
of
mo
no
terp
en
es [
pp
bv]
Figure 4. Time series of the atmospheric concentration of monoterpenes (m/z 137) at
K-puszta for the period from 29 May to 25 June 2006. The vertical dashed lines are at 00:00 h.
The concentrations of the monoterpenes (m/z 137) also followed the temperature
when examining these data with low time resolution (such as daily averages) or the
separate high-resolution day-time and night-time data. For example, a similar
regression on temperature as for isoprene for the day-time monoterpene data
indicated that y = 0.008 * 2.46x/10 [R2 = 0.56]. However, when looking at the combined
day-time and night-time data (Figure 4), it appears that the concentration of the
monoterpenes is about an order of magnitude higher during the night than during the
day. The difference in behaviour between the monoterpenes and isoprene is in part
explained by the longer atmospheric lifetime of the monoterpenes.

Project SD/AT/02 - Formation mechanisms, marker compounds and source apportionment for biogenic atmospheric
aerosols “BIOSOL”
SSD - Science for a Sustainable Development - Atmosphere 36
3.3.3. Relation of the data for the PM and various aerosol components to temperature
An increase with temperature was also observed for the 24-hr (or day-time or night-
time) averaged concentrations of fine PM and fine OC (whereby fine = PM2.5) from the
in-situ instruments (TEOM and OCEC Field instrument) and for the data of a number
of components in the filter samples. The relationship between air temperature and the
hourly fine PM (TEOM) and fine OC (OCEC Field instrument) data is shown in Figure
5. Although there is clearly an increase in fine PM and fine OC when going from the
cold to the warm period, the high-time resolution dependence of the two components
on temperature seems to be quite complicated. For example, during the warm period
(from 12 June on) there is clearly a tendency for opposite diurnal variation of OC and
temperature. This behaviour is similar to that for the monoterpenes, be it that it is
much less pronounced. The higher OC levels during night than during the day may be
due to a combination of several reasons, including the build-up of a shallow
atmospheric boundary layer during the night, the larger partitioning of semi-volatile
organic compounds towards the vapour phase during the warm day, increased
formation of SOA from condensable compounds during the cool night, and/or specific
night-time chemistry resulting in SOA formation.
0.1
1
10
100
24
-Ma
y-0
6
25
-Ma
y-0
6
26
-Ma
y-0
6
27
-Ma
y-0
6
28
-Ma
y-0
6
29
-Ma
y-0
6
30
-Ma
y-0
6
31
-Ma
y-0
6
01
-Ju
n-0
6
02
-Ju
n-0
6
03
-Ju
n-0
6
04
-Ju
n-0
6
05
-Ju
n-0
6
06
-Ju
n-0
6
07
-Ju
n-0
6
08
-Ju
n-0
6
09
-Ju
n-0
6
10
-Ju
n-0
6
11
-Ju
n-0
6
12
-Ju
n-0
6
13
-Ju
n-0
6
14
-Ju
n-0
6
15
-Ju
n-0
6
16
-Ju
n-0
6
17
-Ju
n-0
6
18
-Ju
n-0
6
19
-Ju
n-0
6
20
-Ju
n-0
6
21
-Ju
n-0
6
22
-Ju
n-0
6
23
-Ju
n-0
6
24
-Ju
n-0
6
25
-Ju
n-0
6
26
-Ju
n-0
6
27
-Ju
n-0
6
28
-Ju
n-0
6
29
-Ju
n-0
6
30
-Ju
n-0
6
Date (hourly data, local time)
PM
and O
C (
µg/m
3)
for
PM
2.5
-20
-10
0
10
20
30
40
50
60
70
80
Tem
p. (°
C)
PM
OC
Temp (°C)
Mov. Avg. (PM)
Mov. Avg. (OC)
Figure 5. Time series (hourly data) of PM2.5 PM and OC and of the air temperature during
the 2006 summer K-puszta campaign (the vertical dashed lines are at 00:00 h). Full lines for the PM and OC are 4-point moving averages.

Project SD/AT/02 - Formation mechanisms, marker compounds and source apportionment for biogenic atmospheric
aerosols “BIOSOL”
SSD - Science for a Sustainable Development - Atmosphere 37
K-Puszta: Medians (and interquartile ranges) in PM10 size fraction
100 1000 10000 100000
NO3
Si
OC
PM
Concentration (ng/m3)
2006 Cold
2006 Warm
2003
Figure 6. Median concentrations (and interquartile ranges) for the PM, OC, Si, and nitrate in
PM10 aerosol in the separate cold and warm periods of the 2006 summer campaign at K-puszta and for the entire 2003 summer campaign at the same site. All data were obtained from filter samplers, which were operated with mostly 12-h time resolution.
The median concentrations (and interquartile ranges) for the PM, OC, Si (an indicator
for the mineral dust or crustal component), and nitrate in PM10 during the separate
cold and warm periods of the 2006 summer campaign are shown in Figure 6, together
with the overall medians (and interquartile ranges) for the same aerosol components in
the 2003 summer campaign at the same site. It was very hot and dry during the entire
2003 campaign, similar as during the warm period of the 2006 campaign. Clearly,
higher levels are noted for PM, OC, and especially Si during the warm period than
during the cold one of the 2006 campaign. In contrast, for nitrate, the levels are highest
during the cold period. Overall, the data from the 2003 campaign are quite similar to
those from the 2006 warm period.
The relationships between the PM10 data of the crustal component (obtained as
explained below) and OC (each in µg/m3) and the air temperature (in °C) for the 2006
summer day-time samples were y = 0.097 * e0.150x [R2 = 0.84] and y = 1.094 * e0.059x
[R2 = 0.87], respectively. The higher concentrations of OC at elevated temperature are
attributed to higher emissions of primary organic matter by the vegetation and of
biogenic SOA precursors, such as isoprene and monoterpenes, followed by fast SOA
formation. As to the steep increase of crustal matter with temperature, this is likely due
to much more intense soil dust mobilisation on the local and regional scale, probably
because of the combination of a drier soil and increased agricultural activities in warm
weather.
As indicated above in relation to Figure 6, aerosol nitrate levels (expressed per m3 of
air) were higher during the cold period than during the warm one. When expressing

Project SD/AT/02 - Formation mechanisms, marker compounds and source apportionment for biogenic atmospheric
aerosols “BIOSOL”
SSD - Science for a Sustainable Development - Atmosphere 38
nitrate as concentration in the aerosol (instead of in the ambient air), the dependence
on temperature was even more pronounced. The relationship between the NO3/PM
ratio in PM2.5 and the air temperature over all filter samples (thus day-time + night-
time) was y = 0.305 * e-0.117x [R2 = 0.66]. It should be indicated that there was sufficient
ammonium in the fine aerosol to fully neutralise the fine sulphate and nitrate to
(NH4)2SO4 and NH4NO3. The NO3/PM ratio in PM2.5 increased with increasing air
relative humidity (RH), which is not surprising considering that RH was inversely
related to temperature. It is well known that the equilibrium between NH4NO3 and the
gas-phase species NH3 and HNO3 depends on temperature and RH [e.g., Stelson and
Seinfeld, 1982]. At higher temperature particulate NH4NO3 dissociates into the gas-
phase species. On the other hand, artifacts during the aerosol collection may also
have played a role.
3.3.4. Examination of the VOC data set by Principal Component Analysis
To better understand the relationships between the compounds measured by PTR-
MS, Principal Component Analysis (PCA) was applied to the full data set from 29
May to 25 June. This full data set contained 2901 observations for 59 variables
(atmospheric concentrations of 59 m/z values). Seven components were found to
explain more than 1 unit of variance. These 7 components explained 84% of the total
variance in the data set. Each component represents an independent group of
strongly correlated m/z values, as is indicated by the loadings of the m/z values on
the components. When certain m/z values exhibit a high loading on a component,
this suggests that their release from the vegetation (or from anthropogenic activity in
the case of non-biogenic VOCs) and/or their formation/destruction in the atmosphere
is correlated in time. It does not necessarily mean that these m/z values reflect
fragments or compounds that are truly interdependent (such as isoprene and its
oxidation products), although this could be the case. Correlation between
independent compounds in time could, for example, occur if the release or production
of these compounds is controlled by the same driver, such as stomatal conductance
or irradiance. The results presented here only show the observed correlations, not
the potential drivers.
The variables (m/z values) that were highly loaded (> 0.7) on the first 4 principal
components were:
Component 1: 43, 61, 69, 70, 71, 85, 87, 99, 101, 111, 113, 115, 117, 123, 125, 127,
141, 143, 145, 155, 157, 159, 163, 167, 169, 171, 173. The species associated with
this component include acetic acid (m/z 43 and 61), isoprene (m/z 69 and 70),
methacrolein (m/z 71) and methyl vinyl ketone (m/z 71), and a wide range of other
compounds.

Project SD/AT/02 - Formation mechanisms, marker compounds and source apportionment for biogenic atmospheric
aerosols “BIOSOL”
SSD - Science for a Sustainable Development - Atmosphere 39
Component 2: 81, 93, 95, 135, 137, 139, 151. The species associated with this
component include α-pinene (m/z 81 and 137), β-pinene, Δ3-carene, myrcene (m/z
81, 93, 137, 139), α-humulene (m/z 81 and 95), β-caryophyllene, nopinone (m/z 139),
and pinonaldehyde (m/z 151).
Component 3: 30, 31, 32, 33, 34. Component 3 includes signals that are related to
NO+ (m/z 30, 31), and O2+ (m/z 32).
Component 4: 29 (negative loading), 37, 38, 39, 55. The species associated with this
component include a cluster of protonated water (H3O·H2O)+ (m/z 37).
3.3.5. Physical aerosol data
The physical aerosol measurements (DMPS and AIS) for the 2006 summer K-puszta
campaign were worked up by P4. During the measurement period particle production
episodes were detected around every second day, which is quite frequent. During
these episodes the total particle concentration in the 10 nm – 1 µm size range, as
measured with the DMPS, rose from the background concentration of some
thousand particles to tens of thousands particles per cm3. The lowest concentration
detected was around 800 cm-3 and the highest concentration was noted during the
production event of 13 June, with over 40,000 cm-3. The AIS detected the same
episodes as the DMPS. Episodes initiated typically some time during the morning.
Figure 7 shows the DMPS size distributions for the week from 12 to 19 June. During
each day of this week some particle production was detected and during five days
the particle concentration reached 10,000 cm-3 over the measurement range. In
Figure 8, the negative air ion size distribution is presented over the strongest
production day 13 June. The air ion concentration increased suddenly around 10:00
in the morning. The ion peak below 1 nm is a so called cluster ion peak, it consists of
charged molecules or molecular clusters. It is worth noting that the strong particle
production event was not associated with high VOC levels, as measured by PTR-MS
(Figures 3, 4) or with high PM or OC levels (Figure 5).

Project SD/AT/02 - Formation mechanisms, marker compounds and source apportionment for biogenic atmospheric
aerosols “BIOSOL”
SSD - Science for a Sustainable Development - Atmosphere 40
Figure 7. Particle size distribution and total concentration measured at the K-puszta site
with the DMPS during the week from 12 to 19 June 2006. The vertical dashed lines are at 00:00 h.

Project SD/AT/02 - Formation mechanisms, marker compounds and source apportionment for biogenic atmospheric
aerosols “BIOSOL”
SSD - Science for a Sustainable Development - Atmosphere 41
Figure 8. AIS air negative ion size distribution at the K-puszta site during the day of 13
June 2006.
3.3.6. Assessment of artifacts in the collection of particulate OC
All aerosol filter samplers for subsequent analyses for OC and EC (and also for
organic compounds) had tandem quartz fibre filters in an attempt to assess the
artifacts in the collection of particulate OC (and particulate organic compounds). The
average ratio (OC on the back filter)/(OC on the front filter) and associated standard
deviation for the undenuded 12-hour samples (N=68 for each sampler type) were
0.15±0.04 for the PM2.5 size fraction of the HVDS, and 0.15±0.06 and 0.09±0.05 for
the low-volume PM2.5 and PM10 samplers. For the undenuded and denuded 24-hour
low-volume PM2.5 filter samplers (P25UWW and P25DWW) the average ratio (OC on
the back filter)/(OC on the front filter) and associated standard deviation were
0.18±0.05 for P25UWW and 0.02±0.03 for P25DWW. In the 2003 summer campaign
the corresponding ratios were very similar, i.e., 0.16±0.05 for P25UWW and 0.02±0.04
for P25DWW. These results clearly show that the diffusion denuder for VOCs has an
effect on the back to front filter ratio for OC. If we assume that the OC on the back filter
is essentially due to the collection of VOCs (positive artifacts) in an undenuded set-up
and to the loss of semi-volatile VOCs from the front filter (negative artifacts) in a
denuded set-up, “artifact-free” particulate OC data can be obtained as OC(front filter) –
OC(back filter) for the undenuded set-up and as OC(front filter) + OC(back filter) for the

Project SD/AT/02 - Formation mechanisms, marker compounds and source apportionment for biogenic atmospheric
aerosols “BIOSOL”
SSD - Science for a Sustainable Development - Atmosphere 42
denuded set-up [Mader et al., 2003]. Moreover, when a denuded and undenuded set-
up are operated in parallel, the corrected OC data from the two set-ups should be the
same. Applying the correction to the OC data from the parallel undenuded and
denuded 24-hour low-volume PM2.5 filter samplers resulted in an average ratio
(corrected OC from P25UWW)/(corrected OC from P25DWW) of 0.97±0.28, which
indicates that the above assumptions were valid for these samples [In the 2003
campaign a poorer ratio of 1.16±0.11 was obtained]. We assumed that the above
assumptions were also valid for the undenuded 12-hour samplers, and corrected OC
were calculated for these samples as OC(front filter) – OC(back filter). The OC data
listed and used for the K-puszta site in this report are such corrected data, except
when indicated otherwise.
EC represented only a minor fraction of the TC (with TC = OC + EC), indicating that
the K-puszta site was not influenced much by automotive emissions or other fossil fuel
combustion. For the hourly PM2.5 OCEC data presented in Figure 5, the average ratio
and associated standard deviation for OptEC/TC were 0.15±0.05. For the filter
samples even lower EC/TC ratios were obtained. For example, based on the 68 HVDS
samples for the 2006 campaign, the average ratios and associated standard deviations
for EC/TC (using uncorrected OC data) were 0.063±0.030 for the fine front filters and
0.026±0.038 for the coarse front filters. The corresponding data for the 2003 campaign
were similar, i.e., 0.049±0.014 for fine and 0.036±0.013 for coarse. Most of the PM10
OC was in the fine (PM2.5) size fraction during the 2006 campaign, on average
72±10% [N=68]. For comparison, of the PM10 PM, on average, 67±8% [N=68] was in
the PM2.5 size fraction (based on the PM data from the samplers with Nuclepore
polycarbonate filters). The data from the MOUDI/nano-MOUDI combination indicated
that there was very little mass in the ultrafine (<0.1 µm) size fraction, i.e., on average,
only 3% of the PM10 PM. It also appeared from the detailed mass size distributions for
the PM that no real separate Aitken or nucleation mode could be discerned; rather the
mass size distribution in the ultrafine size range appeared to be a tail of the
accumulation mode. The WSOC analyses of the HVDS samples indicated that most of
the fine OC was water-soluble. Using uncorrected OC data, 57±9% [N=68] of the OC
was WSOC for the fine front filters and 73±12% [N=68] for the fine back filters during
the 2006 campaign. The corresponding percentages for the 2003 campaign were
61±9% for the fine front filters and 87±15% for the fine back filters.
3.3.7. Chemical aerosol data from the HVDS samples
The median concentrations and interquartile ranges for TC, OC, EC, WSOC, MSA,
DCAs, and water-soluble inorganic species, as derived from the PM2.5 size fraction
front filters of the HVDS samples from the 2006 summer campaign, are given in

Project SD/AT/02 - Formation mechanisms, marker compounds and source apportionment for biogenic atmospheric
aerosols “BIOSOL”
SSD - Science for a Sustainable Development - Atmosphere 43
Table II. Median concentrations and interquartile ranges for TC, OC, EC, WSOC, MSA, DCAs, and water-soluble inorganic species, as derived from the PM2.5 size fraction front filters of the HVDS samples from the 2006 summer campaign at K-puszta. The medians obtained for the PM2.5 size fraction front filters of the HVDS samples from the 2003 summer campaign at K-puszta are also included.
2006 Cold period
(N = 33)
2006 Warm period
(N = 34)
2003
(N = 63)
Species Front filter conc. (ng/m3) Front filter conc. (ng/m3)
Front filter
(ng/m3)
median interq. range median interq. range median
TC 2100 1730 – 2500 4600 3700 – 5300 4400
OC 1960 1540 – 2300 4500 3400 – 4900 4200
EC 143 124 – 192 176 130 – 250 195
WSOC 970 770 – 1130 2900 2200 – 3200 2600
NH4+ 840 580 – 1040 1530 1130 – 2000 1520
SO42– 1790 1170 – 2400 3600 2600 – 4400 3500
NO3– 410 300 – 750 360 197 – 500 310
Na+ 30 13.8 – 47 35 22 – 51 48
Mg2+ 2.3 1.14 – 3.9 6.8 4.6 – 13.8 14.7
K+ 48 39 – 81 81 64 – 127 67
Ca2+ 22 14.5 – 32 88 57 – 210 198
MSA– 29 12.2 – 44 29 22 – 36
Oxalate 73 56 – 85 210 154 – 250 196
Malonate 33 24 – 37 65 50 – 76
Succinate 32 26 – 38 142 100 – 166 41
Glutarate 7.1 4.9 – 9.0 7.8
Table II. Separate medians and ranges for the cold and warm periods are given in
the Table. A comparison is also made with the medians obtained for the PM2.5 size
fraction front filters of the HVDS samples from the 2003 summer campaign. For most
species, the median concentrations are substantially larger during the warm period
than during the cold one of the 2006 campaign and the warm period medians are
similar to the overall medians of the 2003 campaign. This feature was already
observed for other samples and other species and/or elements. The organic species
listed in Table II follow the overall trend of higher concentrations in the warm period,
with the exception of MSA. The higher levels for OC in the warm period were
attributed to higher emissions of primary organic matter by the vegetation and of
biogenic SOA precursors, such as isoprene and monoterpenes, followed by fast SOA
formation. The DCAs are both of primary and secondary origin and are attributed to a
multitude of sources. It seems that the primary emissions for these species, the
emissions of their gaseous precursors, and/or their secondary formation processes
were more pronounced in the warm period than in the cold one. The difference in air

Project SD/AT/02 - Formation mechanisms, marker compounds and source apportionment for biogenic atmospheric
aerosols “BIOSOL”
SSD - Science for a Sustainable Development - Atmosphere 44
mass origin between the two periods (with more maritime air in the cold period and
continental air in the warm period) may also have played a role. As to MSA, this is a
particulate phase oxidation product of dimethylsulphide (DMS), which is mainly
emitted by marine phytoplankton. It is thus not surprising that the MSA levels of the
cold period (with maritime air) were equally high as those observed in the warm
period. The organic compounds measured by IC accounted, when averaging over all
samples, for 2.9% of the OC and 5.2% of the WSOC and there was little difference
between the means of the cold and the warm periods.
It is well known that the collection of carbonaceous aerosols on quartz fibre filters is
prone to both positive and negative artifacts [e.g., Turpin et al., 2000]. A simple way
to assess the importance of the artifacts is to make use of a tandem filter set-up with
front and back quartz fibre filters in series. In studies on artifacts, one normally
concentrates on OC as a whole or occasionally on WSOC. It is rare that studies are
carried out on individual organic species. One example of the latter type of study is
that by Limbeck et al. [2001], who used a tandem filter set-up at a rural background
site in South Africa and measured DCAs and other polar organic species on the front
and back filters. Substantial amounts were found on the back filter; the mean
back/front filter ratios for oxalate, malonate, succinate, and glutarate were 0.14, 0.01,
0.26, and 0.38, respectively. The authors’ interpretation was that the DCA
concentrations on the back filters were caused by the adsorption of gaseous organic
species and that DCAs have a semivolatile behaviour. Low-volume TSP samplers
were used in that study, the face velocity across the filter was about 22 cm/s, and the
collection time per sample was around one week. From the results of the fine size
fraction of our HVDS samples we first calculated the back/front filter ratio for each
species in each individual sample and from these data the interquartile ranges in the
back/front ratios were then obtained for each species (for the 2006 campaign, the
data from the cold and warm periods were kept separate). The resulting data for the
carbonaceous species, organic compounds, and selected inorganic species are
given in Table III. Our back/front ratios for oxalate and succinate are low and clearly
lower than those obtained by Limbeck et al. [2001]; malonate was nearly absent on
the back filter in the earlier study, whereas we found larger back/front ratios than for
oxalate and succinate; of the four DCAs studied by us, glutarate has the largest
back/front ratio, but Limbeck et al. [2001] found an even greater back/front ratio for
this species. It should be noted that there were substantial differences in sampling
between our HVDS samplings at K-puszta and the samplings in the study of Limbeck
et al. [2001]. In our HVDS samplings the collection time per sample was generally
only 12 h (occasionally 24 h) versus one week in the earlier study; besides, the face
velocity through the PM2.5 filters of the HVDS was 80 cm/s, which is almost a factor
of 4 larger than that in the TSP samplings of Limbeck et al. [2001]. It is clear that
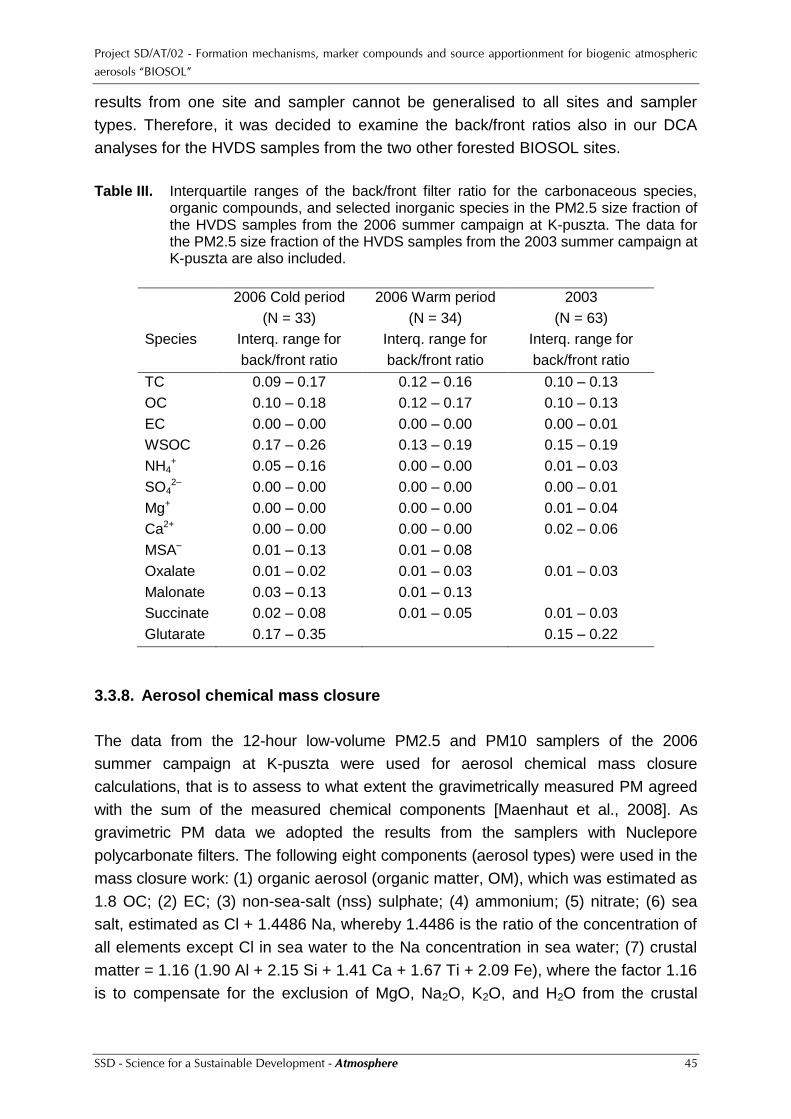
Project SD/AT/02 - Formation mechanisms, marker compounds and source apportionment for biogenic atmospheric
aerosols “BIOSOL”
SSD - Science for a Sustainable Development - Atmosphere 45
results from one site and sampler cannot be generalised to all sites and sampler
types. Therefore, it was decided to examine the back/front ratios also in our DCA
analyses for the HVDS samples from the two other forested BIOSOL sites.
Table III. Interquartile ranges of the back/front filter ratio for the carbonaceous species, organic compounds, and selected inorganic species in the PM2.5 size fraction of the HVDS samples from the 2006 summer campaign at K-puszta. The data for the PM2.5 size fraction of the HVDS samples from the 2003 summer campaign at K-puszta are also included.
2006 Cold period
(N = 33)
2006 Warm period
(N = 34)
2003
(N = 63)
Species
Interq. range for
back/front ratio
Interq. range for
back/front ratio
Interq. range for
back/front ratio
TC 0.09 – 0.17 0.12 – 0.16 0.10 – 0.13
OC 0.10 – 0.18 0.12 – 0.17 0.10 – 0.13
EC 0.00 – 0.00 0.00 – 0.00 0.00 – 0.01
WSOC 0.17 – 0.26 0.13 – 0.19 0.15 – 0.19
NH4+ 0.05 – 0.16 0.00 – 0.00 0.01 – 0.03
SO42– 0.00 – 0.00 0.00 – 0.00 0.00 – 0.01
Mg+ 0.00 – 0.00 0.00 – 0.00 0.01 – 0.04
Ca2+ 0.00 – 0.00 0.00 – 0.00 0.02 – 0.06
MSA– 0.01 – 0.13 0.01 – 0.08
Oxalate 0.01 – 0.02 0.01 – 0.03 0.01 – 0.03
Malonate 0.03 – 0.13 0.01 – 0.13
Succinate 0.02 – 0.08 0.01 – 0.05 0.01 – 0.03
Glutarate 0.17 – 0.35 0.15 – 0.22
3.3.8. Aerosol chemical mass closure
The data from the 12-hour low-volume PM2.5 and PM10 samplers of the 2006
summer campaign at K-puszta were used for aerosol chemical mass closure
calculations, that is to assess to what extent the gravimetrically measured PM agreed
with the sum of the measured chemical components [Maenhaut et al., 2008]. As
gravimetric PM data we adopted the results from the samplers with Nuclepore
polycarbonate filters. The following eight components (aerosol types) were used in the
mass closure work: (1) organic aerosol (organic matter, OM), which was estimated as
1.8 OC; (2) EC; (3) non-sea-salt (nss) sulphate; (4) ammonium; (5) nitrate; (6) sea
salt, estimated as Cl + 1.4486 Na, whereby 1.4486 is the ratio of the concentration of
all elements except Cl in sea water to the Na concentration in sea water; (7) crustal
matter = 1.16 (1.90 Al + 2.15 Si + 1.41 Ca + 1.67 Ti + 2.09 Fe), where the factor 1.16
is to compensate for the exclusion of MgO, Na2O, K2O, and H2O from the crustal

Project SD/AT/02 - Formation mechanisms, marker compounds and source apportionment for biogenic atmospheric
aerosols “BIOSOL”
SSD - Science for a Sustainable Development - Atmosphere 46
mass calculation; and (8) elements, which is the sum of the mass of all non-
crustal/non-sea-salt elements measured by PIXE (S and K were excluded from this
sum). The average concentrations of the various aerosol types (and of the
unexplained gravimetric PM) are shown in Figure 9, and this separately for the
PM2.5 and PM10 aerosol and for the cold and warm periods. For 6 of the 8
components, higher average levels are observed in the warm period than in the cold
one. The two exceptions are nitrate and sea salt. The lower levels of nitrate during
the warm period are attributed to transfer of nitrate from the particulate to the vapour
phase at elevated temperature, as indicated above in section 3.3.3. For sea salt, the
difference is due to difference in air mass origin (more maritime air during the cold
period versus continental air during the warm one, see Figure 2). It also appears from
Figure 9 that the data for most of the aerosol types in PM10 are quite similar for the
overall 2003 campaign and the warm period of the 2006 campaign.
K-Puszta 2006 (and 2003) : Aerosol types
0.2
3.11.1
7.45.7
1.9
3.9
2.0
4.0
3.9
1.0
1.7
0.9
1.5
1.8
3.7
8.0
5.4
10.6
10.4
0
5
10
15
20
25
30
PM2.5
Cold
PM2.5
Warm
PM10
Cold
PM10
Warm
PM10
2003
Ave
rag
e c
onc. (µ
g/m
3)
Unexplained
OC*1.8
EC
NH4
NO3
nss-Sulphate
Sea Salt
Crustal
Elements
Figure 9. Average concentrations of 8 aerosol types during the 2006 summer campaign at
K-puszta, and this separately for the PM2.5 and PM10 aerosol and for the cold and warm periods. The data for the PM10 aerosol during the 2003 summer campaign at the same site are also shown.
The percentage contributions of the various components to the average gravimetric
PM are given in Figure 10. Noteworthy here are the much larger percentages of
crustal matter during the warm period than during the cold one (both for the PM2.5
and PM10 aerosol). In the PM2.5 aerosol, crustal matter accounted for 17% of the
PM during the warm period, but only for 3.1% during the cold period. Of all
components, OM contributed by far the most to the PM2.5 PM, and its percentage
contributions were rather similar in both periods. For PM10, the data of the overall
2003 campaign are quite similar to those of the warm period of the 2006 campaign.

Project SD/AT/02 - Formation mechanisms, marker compounds and source apportionment for biogenic atmospheric
aerosols “BIOSOL”
SSD - Science for a Sustainable Development - Atmosphere 47
K-Puszta 2006 (and 2003) : Average % mass closure
3
1710
28 25
24
22
17
151710
2
10
3 413 108
6 8
4945 48 40
45
0
10
20
30
40
50
60
70
80
90
100
PM2.5
Cold
PM2.5
Warm
PM10
Cold
PM10
Warm
PM10
2003
% o
f experi
menta
l P
M
OC*1.8
EC
NH4
NO3
nss-Sulphate
Sea Salt
Crustal
Elements
Figure 10. Percentage contributions of the various components to the average gravimetric
PM for the 2006 summer campaign at K-puszta, and this separately for the PM2.5 and PM10 aerosol and for the cold and warm periods. The data for the PM10 aerosol during the 2003 summer campaign at the same site are also shown.
3.4. Studies during 2007 at the state forest “De Inslag”, Brasschaat, Belgium
3.4.1. In-situ data for particulate OC and EC
As already indicated in section 2.3, the OCEC Field instrument was deployed at the
site in 2007 from 25 April until 13 July (1st period) and from 19 September to 12
November (2nd period), and during the year 2008 good data were obtained from 15
July until 6 November (3rd period); the time resolution of the measurements was 1 h
during the first period and 2 h in the other two periods. For the first period, TC ranged
from 0.3 to 9.2 µg/m3 (median 2.5 µg/m3) and the OptEC/TC ratio was, on average,
0.26±0.11 [N = 1769]; for the second period, the range in TC was 0.4 – 15 µg/m3
(median 3.4 µg/m3) and the OptEC/TC ratio was, on average, 0.36±0.12 [N = 611]; for
the third period, TC ranged from 0.6 to 16 µg/m3 (median 2.8 µg/m3) and the OptEC/TC
ratio was, on average, 0.38±0.11 [N = 1303]. These OptEC/TC ratios are about a factor
of 2 larger than those, which were obtained with the same instrument during the 2006
campaign at K-puszta (see section 3.3.6), indicating that the Brasschaat site is much
more impacted by fossil fuel combustion (including traffic) aerosols than the K-puszta
site. The EC/TC ratio at Brasschaat is actually similar to that observed at Ghent and
other urban sites in Europe [e.g., Viana et al., 2007]. Note that EC should be absent in
both primary and secondary aerosols that are derived from the vegetation.
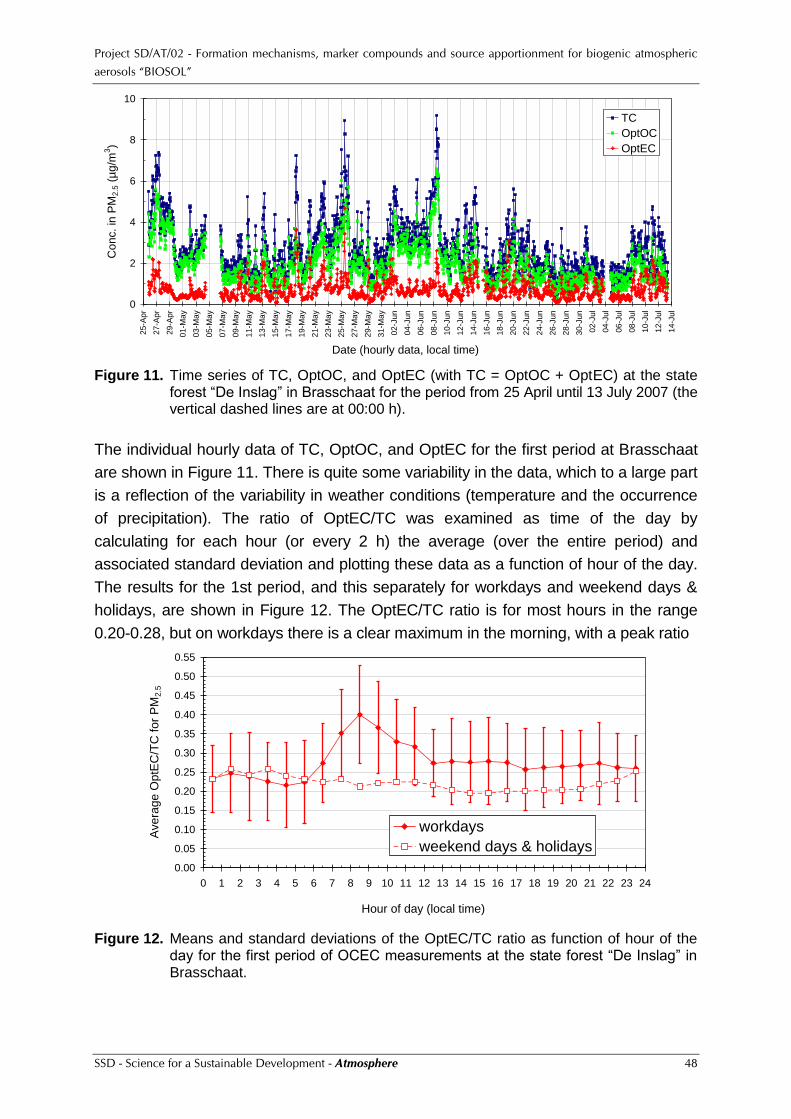
Project SD/AT/02 - Formation mechanisms, marker compounds and source apportionment for biogenic atmospheric
aerosols “BIOSOL”
SSD - Science for a Sustainable Development - Atmosphere 48
0
2
4
6
8
10
25
-Ap
r
27
-Ap
r
29
-Ap
r
01
-Ma
y
03
-Ma
y
05
-Ma
y
07
-Ma
y
09
-Ma
y
11
-Ma
y
13
-Ma
y
15
-Ma
y
17
-Ma
y
19
-Ma
y
21
-Ma
y
23
-Ma
y
25
-Ma
y
27
-Ma
y
29
-Ma
y
31
-Ma
y
02
-Ju
n
04
-Ju
n
06
-Ju
n
08
-Ju
n
10
-Ju
n
12
-Ju
n
14
-Ju
n
16
-Ju
n
18
-Ju
n
20
-Ju
n
22
-Ju
n
24
-Ju
n
26
-Ju
n
28
-Ju
n
30
-Ju
n
02
-Ju
l
04
-Ju
l
06
-Ju
l
08
-Ju
l
10
-Ju
l
12
-Ju
l
14
-Ju
l
Date (hourly data, local time)
Co
nc. in
PM
2.5
(µ
g/m
3)
TC
OptOC
OptEC
Figure 11. Time series of TC, OptOC, and OptEC (with TC = OptOC + OptEC) at the state
forest “De Inslag” in Brasschaat for the period from 25 April until 13 July 2007 (the vertical dashed lines are at 00:00 h).
The individual hourly data of TC, OptOC, and OptEC for the first period at Brasschaat
are shown in Figure 11. There is quite some variability in the data, which to a large part
is a reflection of the variability in weather conditions (temperature and the occurrence
of precipitation). The ratio of OptEC/TC was examined as time of the day by
calculating for each hour (or every 2 h) the average (over the entire period) and
associated standard deviation and plotting these data as a function of hour of the day.
The results for the 1st period, and this separately for workdays and weekend days &
holidays, are shown in Figure 12. The OptEC/TC ratio is for most hours in the range
0.20-0.28, but on workdays there is a clear maximum in the morning, with a peak ratio
0.00
0.05
0.10
0.15
0.20
0.25
0.30
0.35
0.40
0.45
0.50
0.55
0 1 2 3 4 5 6 7 8 9 10 11 12 13 14 15 16 17 18 19 20 21 22 23 24
Hour of day (local time)
Avera
ge O
ptE
C/T
C f
or
PM
2.5
workdays
weekend days & holidays
Figure 12. Means and standard deviations of the OptEC/TC ratio as function of hour of the
day for the first period of OCEC measurements at the state forest “De Inslag” in Brasschaat.

Project SD/AT/02 - Formation mechanisms, marker compounds and source apportionment for biogenic atmospheric
aerosols “BIOSOL”
SSD - Science for a Sustainable Development - Atmosphere 49
of 0.40 at around 8:30, which illustrates the effect of the morning rush hour traffic. A
similar maximum was also observed for the other two periods of the OCEC
measurements.
The relationships between the OptOC, OptEC, and TC data and the meteorological
and inorganic trace gas data were examined. This was done for the measurement
periods of 2007 and also that of 2008. The data for the several meteorological
parameters and inorganic trace gases were provided by the Flemish Research
Institute for Nature and Forest (INBO); they included pressure (P), temperature (T),
relative humidity (RH), wind speed (WS), wind direction (WD), sunshine,
precipitation, and concentrations of SO2, O3, NO, NO2, and CO2. For the 2007 data
(combination of periods 1 and 2), OptEC was highly correlated with NO (r = 0.75) and
NO2 (r = 0.66), but even better with NOx (r = 0.83). This is clearly a reflection of the
common origin of OptEC and these trace gases, which is the combustion of fossil
fuels and in particular automotive exhaust emissions. OptOC, OptEC, and TC were
also highly correlated with CO2 (all r around 0.7). Furthermore, there was a clear
tendency for the particulate carbonaceous species, NO, NO2, NOx, and CO2 to be
negatively correlated with wind speed. This is rather logical as low wind speeds are
common during periods of stagnation, when the levels of pollutants can build up. As
to the relationship between the particulate carbonaceous species and wind direction,
this was examined by making polar plots (wind roses) for OptOC and OptEC. OptOC
was highest for winds from the east; periods of easterly winds are frequently periods
of air mass stagnation and low wind speeds. OptEC, in contrast, showed highest
levels for the wind direction range from 112.5° to 270°, which corresponds roughly
with the sector where the center of Antwerp and the harbour are located. There was,
however, a clear peak in OptEC for winds from the SSE. Incidentally, in this direction,
a major highway (i.e., the E19/A1) passes within 1.5 km from our sampling site.
3.4.2. Data from the HVDS aerosol samples
The HVDS samplings for separate day-time and night-time collections in two size
fractions (fine: <2.5 µm, and coarse: >2.5 µm) took place from 5 June until 13 July and
overlapped thus with the last five weeks of OCEC Field instrument measurements of
the first period at the site. The fine fraction (PM2.5) front filter EC/TC ratio was, on
average, 0.21±0.09, whereas the OptEC/TC for the OCEC instrument data taken in
parallel was somewhat higher (i.e., 0.29±0.09). Of the fine front filter OC, 51±9% was,
on average, WSOC, which is intermediate between the percentages observed for
urban sites and pure forested sites [Chi and Maenhaut, 2008]. The mean back/front
filter percentage ratio for fine OC was 18±5%, which is on the high side, but not much
higher than summer values for other sites in Europe, and the mean back/front
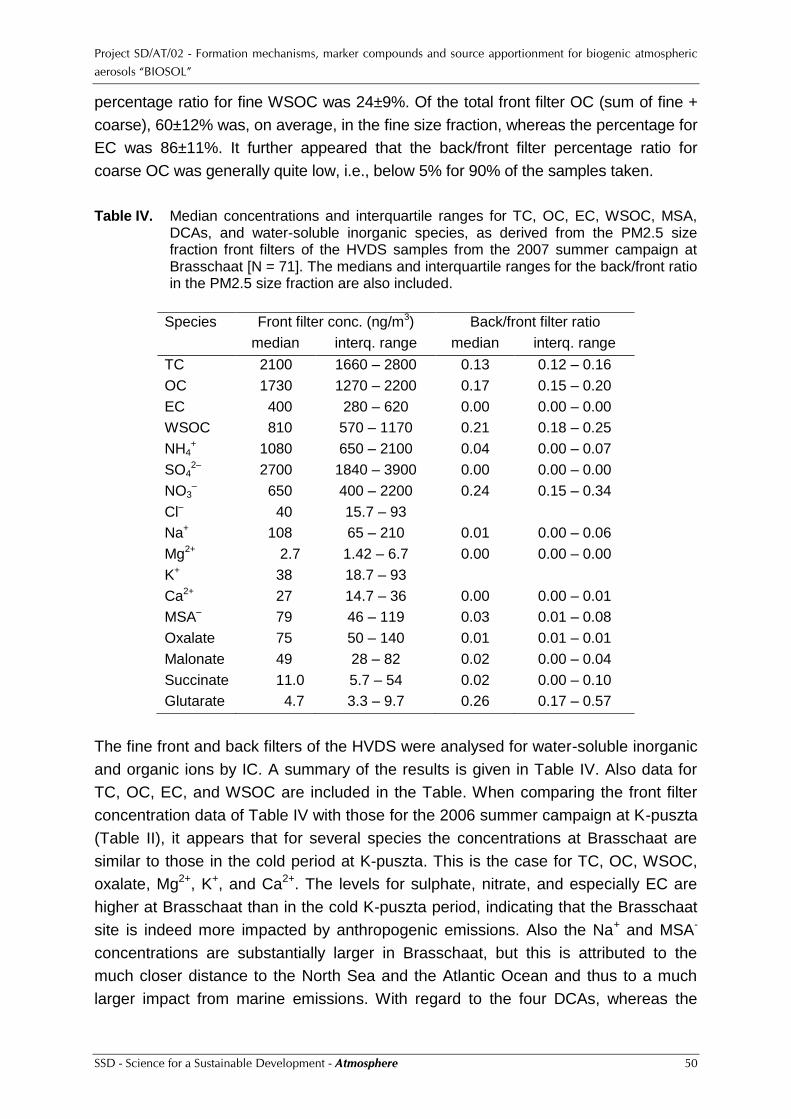
Project SD/AT/02 - Formation mechanisms, marker compounds and source apportionment for biogenic atmospheric
aerosols “BIOSOL”
SSD - Science for a Sustainable Development - Atmosphere 50
percentage ratio for fine WSOC was 24±9%. Of the total front filter OC (sum of fine +
coarse), 60±12% was, on average, in the fine size fraction, whereas the percentage for
EC was 86±11%. It further appeared that the back/front filter percentage ratio for
coarse OC was generally quite low, i.e., below 5% for 90% of the samples taken.
Table IV. Median concentrations and interquartile ranges for TC, OC, EC, WSOC, MSA, DCAs, and water-soluble inorganic species, as derived from the PM2.5 size fraction front filters of the HVDS samples from the 2007 summer campaign at Brasschaat [N = 71]. The medians and interquartile ranges for the back/front ratio in the PM2.5 size fraction are also included.
Species Front filter conc. (ng/m3) Back/front filter ratio
median interq. range median interq. range
TC 2100 1660 – 2800 0.13 0.12 – 0.16
OC 1730 1270 – 2200 0.17 0.15 – 0.20
EC 400 280 – 620 0.00 0.00 – 0.00
WSOC 810 570 – 1170 0.21 0.18 – 0.25
NH4+ 1080 650 – 2100 0.04 0.00 – 0.07
SO42– 2700 1840 – 3900 0.00 0.00 – 0.00
NO3– 650 400 – 2200 0.24 0.15 – 0.34
Cl– 40 15.7 – 93
Na+ 108 65 – 210 0.01 0.00 – 0.06
Mg2+ 2.7 1.42 – 6.7 0.00 0.00 – 0.00
K+ 38 18.7 – 93
Ca2+ 27 14.7 – 36 0.00 0.00 – 0.01
MSA– 79 46 – 119 0.03 0.01 – 0.08
Oxalate 75 50 – 140 0.01 0.01 – 0.01
Malonate 49 28 – 82 0.02 0.00 – 0.04
Succinate 11.0 5.7 – 54 0.02 0.00 – 0.10
Glutarate 4.7 3.3 – 9.7 0.26 0.17 – 0.57
The fine front and back filters of the HVDS were analysed for water-soluble inorganic
and organic ions by IC. A summary of the results is given in Table IV. Also data for
TC, OC, EC, and WSOC are included in the Table. When comparing the front filter
concentration data of Table IV with those for the 2006 summer campaign at K-puszta
(Table II), it appears that for several species the concentrations at Brasschaat are
similar to those in the cold period at K-puszta. This is the case for TC, OC, WSOC,
oxalate, Mg2+, K+, and Ca2+. The levels for sulphate, nitrate, and especially EC are
higher at Brasschaat than in the cold K-puszta period, indicating that the Brasschaat
site is indeed more impacted by anthropogenic emissions. Also the Na+ and MSA-
concentrations are substantially larger in Brasschaat, but this is attributed to the
much closer distance to the North Sea and the Atlantic Ocean and thus to a much
larger impact from marine emissions. With regard to the four DCAs, whereas the

Project SD/AT/02 - Formation mechanisms, marker compounds and source apportionment for biogenic atmospheric
aerosols “BIOSOL”
SSD - Science for a Sustainable Development - Atmosphere 51
Brasschaat site and the cold K-puszta period exhibited the same levels for oxalate,
malonate was substantially more elevated at Brasschaat and succinate and glutarate
were substantially less elevated at Brasschaat. The organic compounds measured
by IC accounted, on average, for 4.1% of the OC and 8% of the WSOC.
The back/front filter ratios of Table IV were calculated in the same way as for
K-puszta, thus on a sample by sample basis, and from these data medians and
interquartile ranges for the ratios were then derived. The ratios of Table IV are overall
quite similar to those observed at K-puszta (Table III), but there are, however, a few
noteworthy exceptions, i.e., for the DCAs. Whereas at K-puszta the ratios for
malonate were larger than those for oxalate and succinate, this is not the case at
Brasschaat. At both sites, glutarate has clearly the largest back/front filter ratios.
However, the concentration of glutarate was near the detection limit in several back
filters (particularly for Brasschaat) and had thus a large associated uncertainty.
Table V. Median concentrations and interquartile ranges for the species measured by
LC/(-)ESI-MS, as derived from the PM2.5 size fraction front filters of the HVDS
samples [N= 71] from the 2007 summer campaign at Brasschaat.
Species (MW) Formula Front filter conc. (ng/m3)
median interq. range
MBTCA (204) C8H11O6 2.7 1.33 – 5.0
cis-pinonic acid (184) C10H16O3 1.79 1.23 – 3.1
cis-pinic acid (186) C9H14O4 0.49 0.35 – 1.19
terebic acid (158) C7H10O4 1.87 1.31 – 3.5
terpenylic acid (172) C8H12O4 2.4 1.57 – 3.7
unknown compound (188) C8H12O5 2.1 0.90 – 3.8
diaterpenylic acid acetate (232) C8H16O6 0.27 0.13 – 0.64
caronic acid (184) C10H16O3 0.30 0.19 – 0.47
caric acid (186) C8H14O4 0.60 0.31 – 1.50
ketolimononic acid (186) C9H14O4 0.41 0.27 – 0.57
limonic acid (186) C9H14O4 0.85 0.45 – 1.69
homoterpenylic acid (186) C9H14O4 0.57 0.39 – 0.88
2,3-dihydroxypentane-1,5-dialdehyde OS
[∑2 isomers] (212)
C5H8O7S 6.5 0.64 – 81
2-methyltetrol OS [∑2 isomers] (216) C6H10O7S 6.4 0.47 – 64
2-hydroxy-6-ketohexanoic acid OS (226) C5H8O8S 4.6 0.48 – 66
2- & 3-hydroxyglutaric acid OS (228) C5H12O7S 3.4 0.12 – 51
2-methyltetrol mononitrate OS [∑2 isomers] (261) C5H11O9SN 0.76 DL – 27
pinanediol mononitrate OS [∑5 isomers] (295) C10H17O7SN 1.51 0.63 – 3.6
2-methyltetrol dinitrate OS [∑4 isomers] (306) C5H10O11SN2 6.6 DL – 40

Project SD/AT/02 - Formation mechanisms, marker compounds and source apportionment for biogenic atmospheric
aerosols “BIOSOL”
SSD - Science for a Sustainable Development - Atmosphere 52
Table V gives a summary of the results obtained by P2 [using LC/(–)ESI-MS] for the
fine front filters of the HVDS samples. All species listed in the Table, with the
exception of cis-pinonic acid and cis-pinic acid, were identified and structurally
characterised as part of the BIOSOL project; they include pure organic species (i.e.,
containing only C, H, and O) and organosulphates (OS), with among the latter also
nitrooxy organosulphates. The MWs and gross formulas of the various compounds
are also included in the Table. More information on the pure organic species, which
were structurally characterised as part of BIOSOL, and on some of the
organosulphates is given in section 3.8. The time series for selected LC/MS species
and OC throughout the 2007 campaign at Brasschaat is shown in Figure 13. Of the
LC/MS species shown, MBTCA, terebic acid, terpenylic acid, and an unknown
MW188 compound exhibited the highest concentrations during the first days of the
0.1
1
10
100
1000
05-J
un
06-J
un
07-J
un
08-J
un
09-J
un
10-J
un
11-J
un
12-J
un
13-J
un
14-J
un
15-J
un
16-J
un
17-J
un
18-J
un
19-J
un
20-J
un
21-J
un
22-J
un
23-J
un
24-J
un
25-J
un
26-J
un
27-J
un
28-J
un
29-J
un
30-J
un
01-J
ul
02-J
ul
03-J
ul
04-J
ul
05-J
ul
06-J
ul
07-J
ul
08-J
ul
09-J
ul
10-J
ul
11-J
ul
12-J
ul
13-J
ul
14-J
ul
Conc. (n
g/m
3)
OC/10
MBTCA
cis-pinonic
cis-pinic
MW295
0.1
1
10
100
1000
05
-Ju
n
06
-Ju
n
07
-Ju
n
08
-Ju
n
09
-Ju
n
10
-Ju
n
11
-Ju
n
12
-Ju
n
13
-Ju
n
14
-Ju
n
15
-Ju
n
16
-Ju
n
17
-Ju
n
18
-Ju
n
19
-Ju
n
20
-Ju
n
21
-Ju
n
22
-Ju
n
23
-Ju
n
24
-Ju
n
25
-Ju
n
26
-Ju
n
27
-Ju
n
28
-Ju
n
29
-Ju
n
30
-Ju
n
01
-Ju
l
02
-Ju
l
03
-Ju
l
04
-Ju
l
05
-Ju
l
06
-Ju
l
07
-Ju
l
08
-Ju
l
09
-Ju
l
10
-Ju
l
11
-Ju
l
12
-Ju
l
13
-Ju
l
14
-Ju
l
Conc.
(ng/m
3)
OC/10
terebic
terpenylic
188 unknown
Figure 13. Time series for selected LC/MS species and OC, as derived from the PM2.5 front filters of the HVDS samples, for the 2007 summer campaign in Brasschaat.
Project SD/AT/02 - Formation mechanisms, marker compounds and source apportionment for biogenic atmospheric
aerosols “BIOSOL”
SSD - Science for a Sustainable Development - Atmosphere 53
campaign that were characterised by high maximum temperatures (> 22 °C), while
cis-pinonic acid showed the lowest concentrations, a result consistent with the
formation of MBTCA through further oxidation of cis-pinonic acid [Szmigielski et al.,
2007b]. MBTCA and cis-pinonic acid (expressed as %C of OC) showed diel
variations with maxima mostly during day-time, while cis-pinic acid mainly peaked at
night. The MW 295 nitrooxy organosulphates exhibited clear diel variations with
maxima at night, consistent with observations first reported by Iinuma et al. [2007]
and night-time NO3 radical chemistry as supported by Surratt et al. [2008].
Interestingly, rather low concentrations of the MW 295 SOA tracers were found
during the first nights of the campaign (with maximum day-time temperatures > 22
°C). These results hint that the latter α-pinene SOA tracers are formed during nights
following days where α-pinene was not fully consumed by photo-oxidation, leaving a
portion of the emitted α-pinene available for processing by night-time NO3 chemistry.
The 19 LC/MS compounds listed in Table V accounted, on average, for 1.2% of the
OC and and 2.3% of the WSOC.
All concentration data available for the fine front filters of the Brasschaat HVDS
samples were combined and pairwise correlations between the various species and
also between the species and data for several meteorological parameters and
inorganic trace gases were calculated. The meteorological and trace gas data
included were the same as for the data sets from the OCEC Field instrument. In
addition, a day-night (D_N) parameter was included; this was set equal to 1 for the
day-time samples and equal to 0 for the night-time samples. Several correlations
were very high (r>0.85) or high (0.7<r<0.85) or substantial (0.5<r<0.7). For example,
oxalate exhibited very high or high correlations with TC, OC, WSOC, ammonium,
nitrate, sulphate, malonate, succinate, MBTCA, terebic, diaterpenylic acid acetate,
and the OS with MWs 212, 226, and 228. MBTCA was very highly correlated with
TC, OC, WSOC, oxalate, malonate, succinate, terebic, terpenylic, diaterpenylic acid
acetate, homoterpenylic acid, and the OS with MWs 212, 216, 226, 228, 261, and
306 (thus all OS with the exception of these with MW 295). As to the correlations for
cis-pinic, very high, high or substantial correlations were only noted with cis-pinonic (r
= 0.78), terebic (r = 0.60), terpenylic (r = 0.68), caronic (r = 0.73), ketolimononic (r =
0.61), limonic (r = 0.59), homoterpenylic (r = 0.77), and caric acid (r = 0.81). For the
MW 295 nitrooxy organosulphates correlations were only found between its 5
isomers and with limonic and caric acid. MSA had only high or substantial
correlations with Na+ (r = 0.70), Cl- (r = 0.63), and Mg2+ (r = 0.63); these correlations
might have been expected considering the importance of marine sources for these
species. The correlations between the various species and the meteorological
parameters and trace gases were at most substantial. For example, substantial
correlations with T were found for TC, OC, WSOC, succinate, MBTCA, and several

Project SD/AT/02 - Formation mechanisms, marker compounds and source apportionment for biogenic atmospheric
aerosols “BIOSOL”
SSD - Science for a Sustainable Development - Atmosphere 54
other organic LC/MS species (the exceptions were cis-pinonic, cis-pinic, caronic,
limonic, and caric acid, and the MW 295 OS).
3.4.3. VOC data
BVOC concentration measurements at two heights above the forest started on 25 April
2007 and were scheduled to continue until the end of October 2007. However, as
already indicated in section 2.3, due to instrument problems, good accurate data are
only available from the end of July until mid-September 2007.
The two-months useful data contains nice diel patterns of BVOC concentrations. An
average of the diel concentration fluctuations of total monoterpenes, acetone,
methanol, and isoprene for the month of August is presented in Figure 14.
Figure 14. Average diel profiles of the concentrations of total monoterpenes (upper left panel),
acetone (upper right panel), isoprene (lower left panel) and methanol (lower right panel). Mean and median concentrations are given for two measurement heights as determined from the data for August 2007.

Project SD/AT/02 - Formation mechanisms, marker compounds and source apportionment for biogenic atmospheric
aerosols “BIOSOL”
SSD - Science for a Sustainable Development - Atmosphere 55
Figure 15. Toluene concentrations relative to benzene concentrations. Data above the 1:1 line
indicate that fresh pollutants were added to the atmosphere.
The time series of the BVOC concentrations is currently being quality controlled with
the view of publishing the most important results. The higher concentrations observed
during night-time are related in part to the shallower boundary layer during night, and
partly to the reduced oxidation rates. The concentration patterns do, however, differ
substantially from those observed during the 2006 K-puszta campaign. One possible
reason could be that the Brasschaat site is located downwind of the harbour of
Antwerp with its associated anthropogenic emissions. The PTR-MS instrument does
not measure individual compounds but individual masses. Under natural conditions, for
example, isoprene dominates the signal at its corresponding mass and hence the
PTR-MS results can be interpreted as being representative for isoprene. Under
polluted conditions, however, a wide variety of VOCs having the same mass as
isoprene, can be present at relatively high concentrations. Hence, the diel
concentration patterns at the Brasschaat site may have been affected by the industrial
VOC emissions, whereas this was much less the case at the rural K-puszta site. An
indication that fresh pollution was present is given by the ratio of toluene/benzene
concentrations. Toluene oxidises much more rapidly than benzene. Hence, air masses
where toluene is dominant are indicative for fresh additions of organic pollutants. It is
clear that these emissions were important for the Brasschaat site (Figure 15), and
therefore that the natural VOCs may have been overshadowed by the anthropogenic
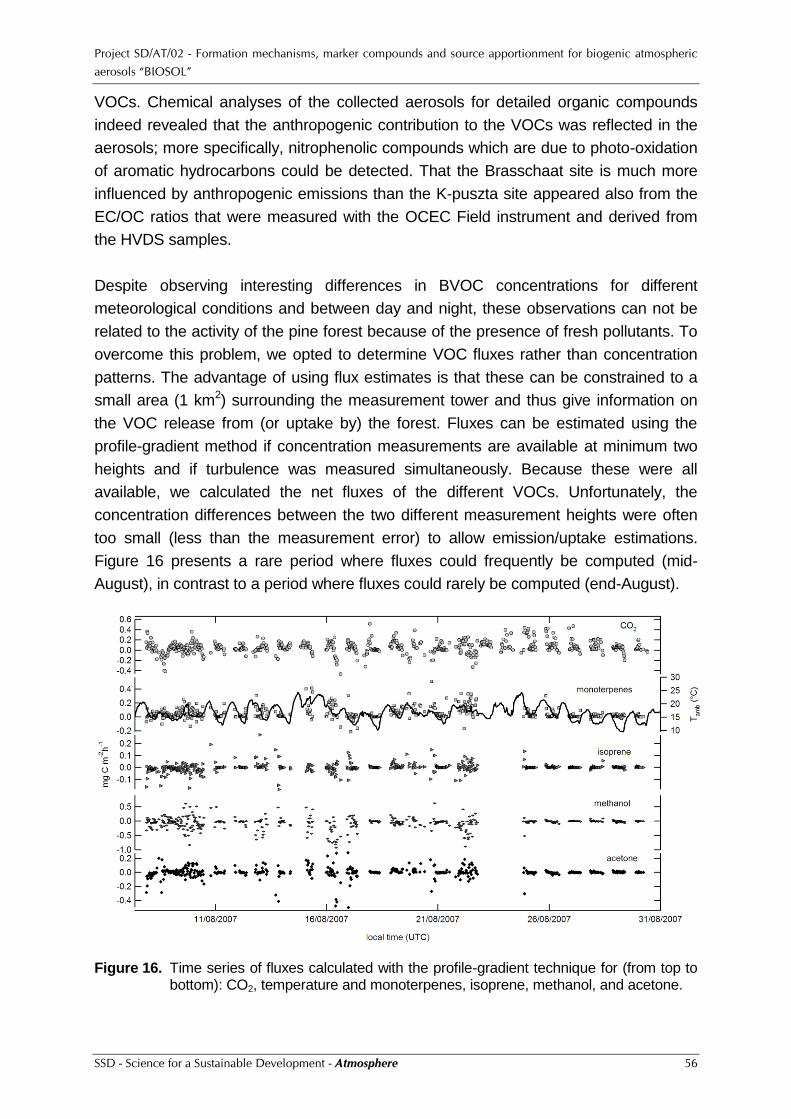
Project SD/AT/02 - Formation mechanisms, marker compounds and source apportionment for biogenic atmospheric
aerosols “BIOSOL”
SSD - Science for a Sustainable Development - Atmosphere 56
VOCs. Chemical analyses of the collected aerosols for detailed organic compounds
indeed revealed that the anthropogenic contribution to the VOCs was reflected in the
aerosols; more specifically, nitrophenolic compounds which are due to photo-oxidation
of aromatic hydrocarbons could be detected. That the Brasschaat site is much more
influenced by anthropogenic emissions than the K-puszta site appeared also from the
EC/OC ratios that were measured with the OCEC Field instrument and derived from
the HVDS samples.
Despite observing interesting differences in BVOC concentrations for different
meteorological conditions and between day and night, these observations can not be
related to the activity of the pine forest because of the presence of fresh pollutants. To
overcome this problem, we opted to determine VOC fluxes rather than concentration
patterns. The advantage of using flux estimates is that these can be constrained to a
small area (1 km2) surrounding the measurement tower and thus give information on
the VOC release from (or uptake by) the forest. Fluxes can be estimated using the
profile-gradient method if concentration measurements are available at minimum two
heights and if turbulence was measured simultaneously. Because these were all
available, we calculated the net fluxes of the different VOCs. Unfortunately, the
concentration differences between the two different measurement heights were often
too small (less than the measurement error) to allow emission/uptake estimations.
Figure 16 presents a rare period where fluxes could frequently be computed (mid-
August), in contrast to a period where fluxes could rarely be computed (end-August).
Figure 16. Time series of fluxes calculated with the profile-gradient technique for (from top to
bottom): CO2, temperature and monoterpenes, isoprene, methanol, and acetone.
Project SD/AT/02 - Formation mechanisms, marker compounds and source apportionment for biogenic atmospheric
aerosols “BIOSOL”
SSD - Science for a Sustainable Development - Atmosphere 57
3.5. Studies at the SMEAR II forest station in Hyytiälä, Finland
3.5.1. Summer campaign in 2005
The comprehensive experiments at the SMEAR II site in Hyytiälä took place in August
2007. However, as indicated in section 2.4, already in summer of 2005 a less
comprehensive campaign was conducted, for which the work also forms part of the
current project. The results are described in detail in Kourtchev et al. [2008a,b]. Here
only a brief summary is given. The median total concentration of terpenoic acids [i.e.,
cis-pinic acid, cis-norpinic acid, and two novel compounds, 3-hydroxyglutaric acid
and 3-methyl-1,2,3-butanetricarboxylic acid (this compound was previously and also
in Kourtchev et al. [2008a] incorrectly identified as 2-hydroxyl-4-isopropyladipic acid)
was 65 ng m-3, while that of the isoprene oxidation products (i.e., 2-methyltetrols and
C5-alkene triols) was 17.2 ng m–3. The 2-methyltetrols exhibited day/night variations
with maxima during day-time, while the α-/β-pinene oxidation products did not show
any diel variation. The sampling period was marked by a relatively high condensation
sink, caused by pre-existing aerosol particles, and no nucleation events. In general,
the concentration trends of the SOA compounds reflected those of the inorganic
trace gases, meteorological parameters, and condensation sink. Both the isoprene
and α-/β-pinene SOA products were strongly influenced by SO2, which is consistent
with earlier reports that acidity plays a role in SOA formation. The results support
previous proposals that oxygenated VOCs contribute to particle growth processes
above the boreal forest.
3.5.2. Meteorology, air mass origin, and inorganic trace gases for the 2007 summer campaign
The field work for the 2007 summer field campaign took place from 1 to 31 August
2007. A summary of selected meteorological and inorganic trace gas data for the
month of August is given in Table VI. The data in this Table are based on daily
averages (in case of precipitation, daily sums). The temperature and trace gas data in
the Table are for a height of 8.4 m above the base of the mast on which the sensors
were installed. There were sensors at 7 levels above mast base, ranging from 4.2 to
74 m. The highest sensor level within the forest canopy was at 8.4 m above mast base
(near the top of the canopy) and the lowest sensor level above the canopy was at 16.8
m above mast base. The aerosol instruments and collectors of BIOSOL partner C were
all installed at about 8 m above mast base on a separate tower. Figure 17 shows the
time series of the 15-min averaged temperature data at 6 levels above mast base.
There were 14 days with rain throughout the month (i.e., on 1, 3, 12, 15 through 19, and

Project SD/AT/02 - Formation mechanisms, marker compounds and source apportionment for biogenic atmospheric
aerosols “BIOSOL”
SSD - Science for a Sustainable Development - Atmosphere 58
26 through 31 August). However, on most of these days, the total amount of rain was
less than 4 mm; the only exceptions were 28 and 29 August with 8-9 mm. As to the
temperature, the mean daily temperature rose from 13.4 °C on 1 August to around 20
°C in the period of 6-13 August and decreased then down to 6.1 °C on 31 August, with
a secondary maximum of 17 °C on 22-24 August.
Table VI. Averages (and associated standard deviations), medians, and ranges of daily averaged data for temperature, wind speed, relative humidity, and selected inorganic trace gases (O3, NOx, and SO2) during August 2007 at SMEAR II. The data for precipitation are the average, median, and range of the daily summed rainfall.
Parameter mean ± std.dev. median range
Temp. (°C) 15.5 ± 4.4 17.0 6.1 – 21.3
Wind speed (m/s) at 8.4 m 0.67 ± 0.29 0.61 0.34 – 1.45
Wind speed (m/s) at 16.8 m 1.95 ± 0.69 1.71 1.05 – 3.71
Precipitation (mm) 1.2 ± 2.2 0 0 – 8.7
Relative humidity (%) 78 ± 9 79 59 – 98
O3 (ppbv) 29 ± 4 29 21 – 36
NOx (ppbv) 0.76 ± 0.27 0.69 0.30 – 1.56
SO2 (ppbv) 0.14 ± 0.13 0.10 0.01 – 0.51
0
5
10
15
20
25
30
01-A
ug-0
7
02-A
ug-0
7
03-A
ug-0
7
04-A
ug-0
7
05-A
ug-0
7
06-A
ug-0
7
07-A
ug-0
7
08-A
ug-0
7
09-A
ug-0
7
10-A
ug-0
7
11-A
ug-0
7
12-A
ug-0
7
13-A
ug-0
7
14-A
ug-0
7
15-A
ug-0
7
16-A
ug-0
7
17-A
ug-0
7
18-A
ug-0
7
19-A
ug-0
7
20-A
ug-0
7
21-A
ug-0
7
22-A
ug-0
7
23-A
ug-0
7
24-A
ug-0
7
25-A
ug-0
7
26-A
ug-0
7
27-A
ug-0
7
28-A
ug-0
7
29-A
ug-0
7
30-A
ug-0
7
31-A
ug-0
7
01-S
ep-0
7
T67.2 (°C)T50.4 (°C)T33.6 (°C)T16.8 (°C)T8.4 (°C)T4.2 (°C)
Figure 17. Time series of the 15-min averaged temperature as a function of local summer time
during August 2007 at SMEAR II.
The air masses came mostly from the West, except in the period from 9 to 14 August,
when they first showed a recirculation pattern and on 13 and 14 August came from the
South (Figure 18). In the period of 10-13 August there was extensive biomass burning
in the southern part of European Russia (Figure 19), which considering the air mass
transport could have affected our measurements at SMEAR II.

Project SD/AT/02 - Formation mechanisms, marker compounds and source apportionment for biogenic atmospheric
aerosols “BIOSOL”
SSD - Science for a Sustainable Development - Atmosphere 59
Figure 18. Five-day, 3-dimensional air mass back trajectories, calculated with HYSPLIT [Lupu
and Maenhaut, 2002] for every 6 hours and for an arrival level of 100 m above ground at SMEAR II on 13 and 14 August 2007. The trajectories are colour-coded from dark blue to dark red, with the dark blue one for 13 August 0:00 UTC and the dark red one for 14 August 18:00 UTC.
Figure 19. Left: MODIS fire map for 11 August 2007 (source: University of Maryland). Right: Navy Aerosol Analysis and Prediction System (NAAPS) surface smoke
concentration (in µg/m3) for 11 August 2007: 18:00 UTC.
3.5.3. BVOC data and relation to temperature for the 2007 summer campaign
The time series of the in-situ data for isoprene and the monoterpenes and of the
ambient temperature is shown in Figure 20. The highest levels of the monoterpenes are
noted in the nights of 7, 8, and 9 August, thus right after the start of the warm period
(from 6 to 13 August) when daily averaged temperatures were around 20 °C. Overall,
when looking at daily averages, there was some relation between the concentrations of

Project SD/AT/02 - Formation mechanisms, marker compounds and source apportionment for biogenic atmospheric
aerosols “BIOSOL”
SSD - Science for a Sustainable Development - Atmosphere 60
the two BVOCs and temperature, with higher levels at higher temperatures. However,
similarly as during the 2006 K-puszta campaign (see section 3.3.2), in the high time
resolution data, the night-time levels for the monoterpenes are about an order of
magnitude level higher than the day-time levels, so that there is an anticorrelation with
temperature for these BVOCs.
0.01
0.1
1
10
01-A
ug-0
7
02-A
ug-0
7
03-A
ug-0
7
04-A
ug-0
7
05-A
ug-0
7
06-A
ug-0
7
07-A
ug-0
7
08-A
ug-0
7
09-A
ug-0
7
10-A
ug-0
7
11-A
ug-0
7
12-A
ug-0
7
13-A
ug-0
7
14-A
ug-0
7
15-A
ug-0
7
16-A
ug-0
7
17-A
ug-0
7
18-A
ug-0
7
19-A
ug-0
7
20-A
ug-0
7
21-A
ug-0
7
22-A
ug-0
7
23-A
ug-0
7
24-A
ug-0
7
25-A
ug-0
7
26-A
ug-0
7
27-A
ug-0
7
28-A
ug-0
7
29-A
ug-0
7
30-A
ug-0
7
31-A
ug-0
7
01-S
ep-0
7
Local summer time
Co
nc. (p
pbv)
0
10
20
30
40
50
60
Tem
p.
(°C
)
Monoterpenes
Isoprene
Temp (°C)
Mov. Avg. (Monoterpenes)
Mov. Avg. (Isoprene)
Figure 20. Time series of the atmospheric concentrations of monoterpenes (m/z 137) and
isoprene (m/z 69), and of the air temperature at SMEAR II for the period from 1 to 31 August 2007. Note that a log scale is used for the BVOCs and a linear scale for the temperature. The vertical dashed lines are at 00:00 h.
3.5.4. In-situ data for the PM, BC, and particulate OC and EC during the 2007 summer campaign and their relation to temperature
The PM2.5 in-situ data for optical OC (OptOC) and optical EC (OptEC), as obtained
with the OCEC Field instrument (using 1-hour, 2-hour or 4-hour time resolution,
depending on the OC level), varied from 0.1 to 7.9 µg/m3 (OptOC) and from 0 to 0.82
µg/m3 (OptEC). The ratio of OptEC to TC (with TC = OptOC + OptEC) was, on average,
0.083±0.039 [N = 425]. Such ratio is fairly logical for a forested site. It is substantially
lower than the mean OptEC/TC ratio of 0.15±0.05 that was obtained with the OCEC
Field instrument during the 2006 K-puszta campaign (it should be noted, though, that
the EC/TC ratio, as derived from the PM2.5 front filters of the HVDS during that
campaign was, on average, only 0.063±0.030, see section 3.3.6) and much lower than
the OptEC/TC ratios from the OCEC Field instrument and EC/TC ratio from the HVDS
obtained for Brasschaat (sections 3.4.1 and 3.4.2). In any case, the low OptEC/TC ratio
at SMEAR II indicates that the site was little affected by carbonaceous matter from
fossil fuel combustion. PM and BC in PM2.5 were measured with 10 min time resolution
by a TEOM and aethalometer, respectively, but the data were averaged over the time

Project SD/AT/02 - Formation mechanisms, marker compounds and source apportionment for biogenic atmospheric
aerosols “BIOSOL”
SSD - Science for a Sustainable Development - Atmosphere 61
periods of the OCEC instrument. The averaged data ranged from 0 to 22 µg/m3 for the
PM and from 0 to 0.79 µg/m3 for BC.
0.1
1
10
100
01-A
ug-0
7
02-A
ug-0
7
03-A
ug-0
7
04-A
ug-0
7
05-A
ug-0
7
06-A
ug-0
7
07-A
ug-0
7
08-A
ug-0
7
09-A
ug-0
7
10-A
ug-0
7
11-A
ug-0
7
12-A
ug-0
7
13-A
ug-0
7
14-A
ug-0
7
15-A
ug-0
7
16-A
ug-0
7
17-A
ug-0
7
18-A
ug-0
7
19-A
ug-0
7
20-A
ug-0
7
21-A
ug-0
7
22-A
ug-0
7
23-A
ug-0
7
24-A
ug-0
7
25-A
ug-0
7
26-A
ug-0
7
27-A
ug-0
7
28-A
ug-0
7
29-A
ug-0
7
30-A
ug-0
7
31-A
ug-0
7
01-S
ep-0
7
Mid-time of sample collection (local summer time)
Con
c.
in P
M2
.5 (
µg/m
3)
0
10
20
30
40
50
60
Te
mp
. (°
C)
PM
Opt. OC
Temp (°C)
Mov. Avg. (PM)
Mov. Avg. (Opt. OC)
Figure 21. Time series of PM2.5 PM and OC and of the air temperature during the 2007
summer campaign at SMEAR II (the vertical dashed lines are at 00:00 h). Full lines for the PM and OC are 4-point moving averages.
The time series of the PM and OptOC (both in PM2.5) and of the ambient temperature
is shown in Figure 21. Optical OC and the PM were fairly well correlated with each
other, with OptOC = 0.28 * PM + 0.36 (R2 = 0.55). The time series for the PM and OC
is different from that for the BVOCs. Whereas the highest levels of the monoterpenes
were noted in the nights of 7, 8, and 9 August, and high levels were also observed in
the nights of 13, 16, and 19 August, the OC levels (and to a lesser extent also the PM
levels) kept increasing from the beginning of the measurements until 13 August and
decreased afterwards, with a second maximum on 22 to 24 August. It seems thus that
there is little relation between the local concentrations of the BVOCs and fine OC at the
SMEAR II site. Tunved et al. [2006] found that both particle number concentrations and
aerosol mass at three boreal forest sites in Finland (including SMEAR II) in the period
from late spring to early fall were related to the integrated passage time of the air
masses over the forested areas, where the BVOCs were emitted, and to the total
amount of terpenes emission that had occurred during the air mass transport. It is likely
that this also holds for our fine OC data and that they are thus related to the total BVOC
emissions upwind of the site during the last 5 days or so of air mass transport rather
than to the local BVOC concentrations at SMEAR II itself.
Project SD/AT/02 - Formation mechanisms, marker compounds and source apportionment for biogenic atmospheric
aerosols “BIOSOL”
SSD - Science for a Sustainable Development - Atmosphere 62
3.5.5. Mass size distributions for the PM and OC during the 2007 summer campaign and comparison with physical aerosol data
As part of the activities during the 2007 summer campaign at SMEAR II, size-
fractionated aerosol samples were collected with two cascade impactors, i.e., a 12-
stage SDI and a 10-stage MOUDI, which was extended with 3 nanoMOUDI stages.
Separate collections were made during day-time (from 7:30 to 19:40 local time) and
night-time (from 20:20 to 6:40 local time). The two impactors were operated at
ambient temperature and RH. The collection surfaces in the SDI consisted of pre-
fired Pall quartz fibre filters and the impaction surfaces in the MOUDI of pre-fired
aluminium foils. The SDI samples were analysed for OC and EC by TOT, whereas
the MOUDI aluminium foils were weighed at 20 °C and 50% RH to obtain the PM.
Besides the two cascade impactors, a DMPS was operated with 10-min time
resolution to derive the number size distribution from 3 nm to 1 µm mobility diameter.
The DMPS was deployed under dry conditions (RH <30%).
The mass of EC on the SDI stages was close to the detection limit of the TOT
method and will therefore not be discussed. The mass size distributions for OC and
PM peaked in the accumulation size range, but there was also a clear coarse mode
for both with peak at around 3-4 µm AD. Two distinct submicrometer modes, with
peaks at about 0.3 and 0.7 µm AD, were clearly present for OC in the accumulation
size range for the individual day-time SDI samples, whereas in the night-time SDI
samples the two modes seemed to have consistently merged into one broad
accumulation mode.
Two submicrometer submodes have been observed earlier for particulate sulphate,
ammonium, and nitrate [Hering and Friedlander, 1982; John et al., 1990; Hering et
al., 1997; Ricard et al., 2002]; the one with lower diameter was termed
“condensation” mode and the other one “droplet” mode. The formation of the
“droplet” mode is explained by activation of condensation mode particles to form fog
or cloud drops followed by aqueous-phase chemistry in fogs or clouds and
subsequent fog or cloud evaporation [Meng and Seinfeld, 1994; Kerminen and
Wexler, 1995]. This formation process of the “droplet” mode can only be invoked for
water-soluble (or at least hydrophilic) species. As indicated below in section 3.5.6, it
appeared from the analysis of the PM2.5 HVDS filter samples that a very large
fraction of the PM2.5 OC was water-soluble, on average, 63±7%. As to the broad
accumulation mode during the night, this is likely due to hygroscopic growth of the
OC. The RH increased to 80-100% during the night, whereas it generally decreased
to well below 60% during day-time. In the MOUDI size distributions for the PM, no

Project SD/AT/02 - Formation mechanisms, marker compounds and source apportionment for biogenic atmospheric
aerosols “BIOSOL”
SSD - Science for a Sustainable Development - Atmosphere 63
distinct submicrometer modes could be discerned, but this is attributed to the fewer
number of submicrometer stages than in the SDI [Salma et al., 2005]. Both during
day and night, the PM exhibited a broad submicrometer size distribution, but with
peak at slightly larger diameter during night than during the day (i.e., at 0.45 µm AD
versus 0.40 µm AD). For the dry volume size distributions derived from the DMPS
there was no difference between the average day-time and night-time distributions;
both peaked at 0.25 µm mobility diameter. This is fully consistent with the difference
between day and night mass size distributions for OC and the PM being caused by
hygroscopic growth during the night.
3.5.6. Filter data for the PM, OC, EC, and WSOC during the 2007 summer campaign and assessment of artifacts in the collection of particulate OC
The medians (and ranges) for the PM, as derived from 12-hour low-volume PM2.5 and
PM10 samplers with Nuclepore filters, were 7.2 (0.7 – 15) µg/m3 for PM2.5 and 10.2
(1.5 – 29) µg/m3 for PM10. The PM2.5 to PM10 mass ratio for the PM, was, on
average, 0.64±0.11 [N=51]. The medians (and ranges) for “artifact-free” (i.e., back-filter
corrected) OC, as derived from undenuded 12-hour low-volume PM2.5 and PM10
samplers with tandem quartz fibre filters, were 2.8 (0 – 6.0) µg/m3 for PM2.5 and 3.4 (0
– 8.6) µg/m3 for PM10. The PM2.5 to PM10 mass ratio for OC, was, on average,
0.72±0.23 [N=50]. On the basis of the individual OC and PM data from the samplers
just mentioned, average OC/PM ratios of 0.41±0.12 and of 0.37±0.10 were calculated
for PM2.5 and PM10, respectively, indicating that the PM was dominated by organic
aerosol. If we apply an OC-to-OM conversion factor of 1.8, as done for K-puszta
(section 3.3.8), this would lead to a concentration of OM in the PM of 74% for PM2.5
and 67% for PM10.
As far as artifacts for the particulate OC are concerned, the average ratios (OC on the
back filter)/(OC on the front filter) for the undenuded 12-hour samples were 0.17±0.04
for the PM2.5 size fraction of the HVDS, and 0.09±0.08 and 0.11±0.09 for the low-
volume PM2.5 and PM10 samplers. For the undenuded and denuded 24-hour low-
volume PM2.5 filter samplers (F25UWW and F25DWW) the average ratios and
associated standard deviations of (OC on the back filter)/(OC on the front filter) were
0.11±0.06 for F25UWW and 0.05±0.02 for F25DWW. All these ratios are fairly similar
to those obtained for the 2006 summer campaign at K-puszta (see section 3.3.6), be it
that there was a tendency for the undenuded samplers to exhibit slightly higher ratios
in that campaign. From the data for F25UWW and F25DWW an average ratio
(corrected OC from F25UWW)/(corrected OC from F25DWW) of 1.11±0.10 was
obtained, indicating that like for the 2006 K-puszta campaign, the assumptions of Mader

Project SD/AT/02 - Formation mechanisms, marker compounds and source apportionment for biogenic atmospheric
aerosols “BIOSOL”
SSD - Science for a Sustainable Development - Atmosphere 64
et al. [2003] were valid and that it was appropriate to calculate “artifact-free” particulate
OC for the undenuded samplers as the difference between front and back filter OC.
As indicated above in section 3.5.4, the average ratio of OptEC/TC in PM2.5, as
obtained from the OCEC Field instrument, was 0.083±0.039. Like at K-puszta, from the
filter samplers somewhat lower EC/TC ratios were obtained, be it that the difference
was smaller now. For example, in the HVDS samples from the 2007 campaign at
SMEAR II, the average ratios and associated standard deviations for EC/TC (using
uncorrected OC data) were 0.060±0.020 for the fine front filters and 0.027±0.015 for
the coarse front filters. The WSOC analyses of the HVDS samples indicated that most
of the fine OC was water-soluble. Using uncorrected OC data, 63±7% [N=51] of the
OC was WSOC for the fine front filters and 70±12% [N=51] for the fine back filters
during the 2007 campaign. The corresponding percentages for the HVDS samples of
the 2006 K-puszta campaign were 57±9% for the fine front filters and 73±12% for the
fine back filters.
3.5.7. Results from the IC and elemental analyses, impact from biomass burning, correlations with meteorological and trace gas data, and aerosol chemical mass closure for the 2007 summer campaign
Table VII. Median concentrations and interquartile ranges for TC, OC, EC, WSOC, MSA, DCAs, and water-soluble inorganic species, as derived from the PM2.5 size fraction front filters of the HVDS samples from the 2007 summer campaign at SMEAR II [N = 71]. The medians and interquartile ranges for the back/front ratio in the PM2.5 size fraction are also included.
Species Front filter conc. (ng/m3) Back/front filter ratio
median interq. range median interq. range
TC 2600 1650 – 3400 0.15 0.13 – 0.19
OC 2400 1540 – 3300 0.16 0.14 – 0.20
EC 164 101 – 191 0.00 0.00 – 0.00
WSOC 1570 870 – 2100 0.17 0.11 – 0.28
NH4+ 520 280 – 1880 0.00 0.00 – 0.01
SO42– 1640 930 – 2300 0.00 0.00 – 0.00
NO3– 71 45 – 106 0.25 0.13 – 0.36
Na+ 55 35 – 84 0.00 0.00 – 0.06
Mg2+ 3.5 1.91 – 5.0 0.00 0.00 – 0.00
K+ 47 14.2 – 77
Ca2+ 22 15.1 – 37 0.00 0.00 – 0.00
MSA– 45 31 – 58 0.06 0.02 – 0.10
Oxalate 104 67 – 132 0.01 0.01 – 0.02
Malonate 19.8 10.0 – 33 0.09 0.02 – 0.17
Succinate 12.6 4.4 – 23 0.02 0.01 – 0.06
Glutarate 7.0 5.0 – 8.8 0.07 0.00 – 0.15

Project SD/AT/02 - Formation mechanisms, marker compounds and source apportionment for biogenic atmospheric
aerosols “BIOSOL”
SSD - Science for a Sustainable Development - Atmosphere 65
The fine front and back filters of the HVDS were analysed for water-soluble inorganic
and organic ions by IC. The results are summarized in Table VII. Also data for TC,
OC, EC, and WSOC are included in the Table. When comparing the front filter
concentration with those for the 2006 summer campaign at K-puszta (Table II), it
appears that for most species the concentrations at SMEAR II are similar to those in
the cold period at K-puszta. Only for nitrate are the levels substantially lower at
SMEAR II than in the cold K-puszta period. With regard to the DCAs, whereas
oxalate has somewhat higher concentrations at SMEAR II than in the cold K-puszta
period, an opposite pattern is noted for malonate and succinate. The organic
compounds measured by IC accounted, on average, for 2.0% of the OC and 3.1% of
the WSOC. These percentages are about one third lower than those found at
K-puszta.
The back/front filter ratios of Table VII were calculated in the same way as for
K-puszta, thus on a sample by sample basis, and from these data medians and
interquartile ranges for the ratios were then derived. The ratios of Table VII are
overall quite similar to those observed at K-puszta (Table III).
Table VIII. Median concentrations and interquartile ranges for the PM, OC, EC, and water-soluble inorganic species, as derived from the PM2.5 and PM10 low-volume filter samples with Nuclepore polycarbonate or Whatman QM-A quartz fibre filters. DL indicates detection limit.
PM2.5 (ng/m3)
(N = 51)
PM10 (ng/m3)
(N = 51)
PM2.5/PM10
ratio
median interq. range median interq. range median
PM 7200 4300 – 9100 10200 7400 – 12400 0.67
OC 2800 1590 – 4000 3400 2100 – 4700 0.73
EC 72 34 – 107 49 12 – 104
NO3– 37 13.1 – 95 187 92 – 480 0.21
SO42– 1520 910 – 2300 1690 1070 – 2500 0.92
nss-SO42– 1500 890 – 2300 1620 1030 – 2400 0.94
Cl– 2.4 0.62 – 10.2 5.5 2.73 – 44 0.19
Br– 0.16 DL – 0.28 0.13 DL – 0.34
MSA– 135 66 – 171 145 98 – 181 0.90
NH4+ 580 360 – 920 570 350 – 790 1.10
Na+ 49 33 – 85 116 57 – 270 0.39
Mg2+ 1.87 0.02 – 5.0 25 12.5 – 39 0.08
K+ 24 11.4 – 45 52 33 – 80 0.48
Ca2+ 9.9 2.6 – 20 57 33 – 131 0.10

Project SD/AT/02 - Formation mechanisms, marker compounds and source apportionment for biogenic atmospheric
aerosols “BIOSOL”
SSD - Science for a Sustainable Development - Atmosphere 66
The filters from the 12-hour PM2.5 and PM10 Nuclepore filter samplers were analysed
for inorganic ions by IC and for elements by PIXE [Maenhaut et al., 2011]. The median
concentrations and interquartile ranges for the PM, OC, EC, and water-soluble
inorganic species, as derived from the PM2.5 and PM10 low-volume filter samples
with Nuclepore polycarbonate or Whatman QM-A quartz fibre filters, are presented in
Table VIII. For PM2.5, the data can be compared with those derived from the HVDS
(Table VII). The two sets of PM2.5 data are in reasonable agreement. For MSA–
there is a difference of a factor of 3 between the two medians; the MSA– data from
the HVDS are thought to be more reliable because of a much better peak separation
in the IC of the HVDS samples than in the IC of low-volume PM2.5 samples. As to
EC, NO3– and the cationic species Mg2+, K+, and Ca2+, there is clearly a tendency for
lower levels in the low-volume samples than in the HVDS. For NO3–, Mg2+, K+, and
Ca2+, the low-volume data (which were derived from Nuclepore polycarbonate filters)
are expected to be more reliable because of positive artifacts in the case of NO3– and
high blank levels for Mg2+, K+, and Ca2+ with the quartz fibre filters used in the HVDS.
As to EC, the data from the HVDS are expected to be more reliable than those from
the low-volume samples. Table VIII also gives the median PM2.5/PM10 ratios for
various species, as derived from the low-volume samples. When looking at Table
VIII, for both PM2.5 and PM10, OC is clearly the major component, followed by
sulphate and ammonium. These major species are mostly associated with the fine
size fraction, and as a result also the PM is mostly in this fraction. Also MSA, which is
a gas-to-particle conversion product of marine DMS is mostly fine. For K+, which had
important contributions from biomass burning in a number of samples (see below),
the median PM2.5/PM10 ratio is 0.48; for Na+, which is mostly attributable to sea salt,
it is 0.39, and NO3-, Mg2+, and Ca2+ are clearly predominantly associated with the
coarse particles. The Cl-/Na+ ratio in PM10 exhibited a median of 0.08 and an
interquartile range of 0.02-0.26. All these ratios are much lower than the Cl/Na ratio
in sea water, indicating that the sea salt was quite aged and had been subjected to
substantial Cl loss processes.
Figure 22 shows the time series for the PM, OC, oxalate, K+, and Zn (all in PM2.5)
during the 2007 summer campaign at SMEAR II (the data for OC in the Figure come
from an undenuded low-volume sampler with quartz fibre filters, those for the PM, K+,
and Zn from the PM2.5 sampler with Nuclepore polycarbonate filter, and those for
oxalate from the HVDS). It is clear that the time series for K+ substantially differs from
that for the PM and OC. The time series for Zn shows good resemblance to that of K+
and also oxalate has a tendency to be elevated in the samples where K+ is high. Fine
K+, Zn, and oxalate are all indicators for biomass burning [e.g., Andreae, 1983;
Maenhaut et al., 1996b; Kuokka et al., 2007]. Particularly striking is that there are 3
samples in a row (i.e., the day-time samples of 12 and 13 August and the night-time

Project SD/AT/02 - Formation mechanisms, marker compounds and source apportionment for biogenic atmospheric
aerosols “BIOSOL”
SSD - Science for a Sustainable Development - Atmosphere 67
sample of 12 August) that exhibit high K+, Zn, and oxalate levels. Considering the
intensive biomass burning in the southern part of European Russia (Figure 19), when
the air masses passed over there, it is quite likely that the high levels of fine K+ and Zn
in those 3 samples were to a large extent due to the biomass burning in that region.
Consistent with the attribution of fine K+ in the 3 samples in a row to biomass burning
was that K was fully water-soluble as could be concluded from the excellent agreement
between the PIXE K and IC K+ data in these samples; in the remaining samples
typically only about 50% of the PM2.5 K was water-soluble. Furthermore, the
PM2.5/PM10 ratio for PIXE K in the 3 samples was around 0.8, whereas in the other
samples the ratio was typically only around 0.5. This all emphasizes the large impact
from fine biomass burning K, which was presumably present as KCl in those 3 samples.
Although part of the oxalate was likely also derived from biomass burning for those 3
samples, it seems that most of the fine oxalate and also most of the fine OC are derived
from other sources.
0.0001
0.001
0.01
0.1
1
10
100
2N
3D
3N
4D
4N
5D
5N
6D
6N
7D
7N
8D
8N
9D
9N
10D
10N
11D
11N
12D
12N
13D
13N
14D
14N
15D
15N
16D
16N
17D
17N
18D
18N
19D
19N
20D
20N
21D
21N
22D
22N
23D
23N
24D
24N
25D
25N 26
27
28
29
Day of August 2007 (D = day, N = night)
Co
nc. (µ
g/m
3)
in P
M2
.5
PM
OC
Oxalate
K+
Zn
Figure 22. Time series of the PM, OC, oxalate, K+, and Zn (all in PM2.5), as derived from
filter samplers during the summer campaign at SMEAR II.
For both the low-volume PM2.5 and PM10 data, the correlations among the various
species and of the particulate species with a number of meteorological parameters
and trace gases were examined. The meteorological data included T, RH, and WS,
whereas the trace gases were H2O, CO2, CO, SO2, NO, NOx, O3, isoprene, and
monoterpenes. For PM2.5 also the data from the HVDS were included in the
correlation calculations. In both PM2.5 and PM10 OC was highly correlated (r>0.7)
with the PM, H2O, CO, and isoprene and substantially (0.5<r<0.7) with the
monoterpenes and K+. In PM2.5, OC was also highly correlated with WSOC and
oxalate, malonate, and succinate, as derived from the HVDS, and substantially with
glutarate (also derived from the HVDS). The correlations between the PM and OC in
PM2.5, as obtained from the in-situ instruments (and thus with much higher time
Project SD/AT/02 - Formation mechanisms, marker compounds and source apportionment for biogenic atmospheric
aerosols “BIOSOL”
SSD - Science for a Sustainable Development - Atmosphere 68
resolution than from the filter measurements), and the meteorological parameters
and trace gas data were also examined. OC was highly correlated with the PM, H2O,
and CO, substantially with T (r = 0.52) and isoprene (r = 0.53) and somewhat less
with the monoterpenes (r = 0.43). That there is no very strong correlation between
the in-situ data of OC and the BVOCs is attributed to the fact that the biogenic SOA
at the SMEAR II site is not so much related to the BVOC concentrations at the site
itself, but rather to the total BVOC emissions upwind of the site during the last 5 days
or so of air mass transport. The correlations of in-situ OC (in μg/m3) with H2O (in
ppthv) and CO (in ppbv) were y = 0.463 x – 3.7 [R2 = 0.63] and y = 0.072 x – 6.0 [R2
= 0.79], respectively. Although the correlations were strong, the regression lines did
not pass through the origin at all; instead there was clearly an offset (constant
background) of around 7 ppthv H2O and of about 90 ppbv CO for zero OC
concentration. The constant background for CO is likely due to CO formation
processes (such as fossil fuel combustion) which have virtually no impact on (and are
not related to) the OC levels at the SMEAR II site. Why the additional CO (thus that
in excess of that offset) is then so very highly correlated with the OC is not so clear.
First, the question arises whether the excess CO is due to oxidation of BVOCs or
whether there is a substantial contribution from the biomass burning in the southern
part of European Russia. Although there was a substantial correlation (r = 0.58)
between PM2.5 K+, which was shown to be a useful indicator for the biomass
burning, and CO, there was much less variability in the CO levels than in the levels of
PM2.5 K+, suggesting that the biomass burning CO was not very important. The
average of the CO data points was 119 ppbv; thus, after subtraction of the 90 ppbv
background, 29 ppbv of excess CO remains. According to modelling calculations by
Granier et al. [2000], the CO levels arising from the oxidation of isoprene and
monoterpenes are around 5 ppbv each for the month of July in Finland, thus about
10 ppbv combined (Incidentally, Granier et al. [2000] attributed about 20 ppbv to CH4
oxidation, but most of this may form part of our 90 ppbv background). Although the
concentration of 10 ppbv is about a factor of three lower than our excess CO, it may
well be that a substantial (if not major) fraction of our excess CO at SMEAR II is due
to oxidation of BVOCs, whereby the latter is expected to be the major source process
for the OC. The strong correlation between CO and OC may be coincidental and their
concurrent increase in concentration may just be a reflection of the more intense
(photo-)oxidation processes, which will give rise to both higher CO levels and higher
concentrations of biogenic SOA. As to the observed relationship between OC and
H2O, investigations on this type of relations are generally made in terms of OC
versus RH and in smog chamber experiments both positive and negative relations
have been found, depending on the VOC and reaction studied. Our in-situ OC data
were not related at all to RH (r = 0.12), but there was clearly a high positive
correlation between OC and the absolute concentration of H2O vapour in the air. It

Project SD/AT/02 - Formation mechanisms, marker compounds and source apportionment for biogenic atmospheric
aerosols “BIOSOL”
SSD - Science for a Sustainable Development - Atmosphere 69
seems thus that the higher the H2O vapour concentration the higher the levels of OC
and presumably of biogenic SOA. Further studies are suggested to examine whether
there is any causal relationship between H2O and biogenic SOA and if so, which
processes are behind it.
SMEAR II 2007 : Aerosol types
0.2
1.31.1
1.7
1.8
0.1
4.9
6.5
1.6
0
2
4
6
8
10
12
PM2.5 PM10 Coarse
Ave
rag
e c
onc. (µ
g/m
3)
Unexplained
OC*1.8
EC
NH4
NO3
nss-Sulphate
Crustal
Sea Salt
Elements
Figure 23. Average concentrations of 8 aerosol types during the 2007 summer campaign at
SMEAR II, and this separately for the PM2.5, PM10, and coarse (PM10-2.5) aerosol.
The data of the PM and of a number of particulate species and elements in the
PM2.5 and PM10 low-volume filter samples were used to examine to which extent
aerosol chemical mass closure could be obtained. This exercise was done for each
individual sample and for both PM2.5 and PM10 and also for the coarse (PM10-2.5)
aerosol, whereby the data for the latter were obtained by subtracting the PM2.5 data
from the PM10 data. The calculations were done in the same way as for the 2006
campaign at K-puszta (section 3.3.8) and the same eight aerosol types (components)
were considered. The average concentrations of the various aerosol types (and of
the unexplained gravimetric PM) are shown in Figure 23, and this separately for the
PM2.5, PM10, and coarse aerosol. The percentage contributions of the various
components to the average gravimetric PM are given in Figure 24. OM is clearly the
dominant component in both PM2.5 and PM10. It accounts for 73% and 64% of the
average gravimetric PM in PM2.5 and PM10, respectively, and is in both cases
followed by nss-sulphate, which represents 25% and 17% of the average gravimetric
PM in PM2.5 and PM10, respectively. In the coarse aerosol, OM is still the most
important component (with 48%), but now followed by crustal matter (with 32%).
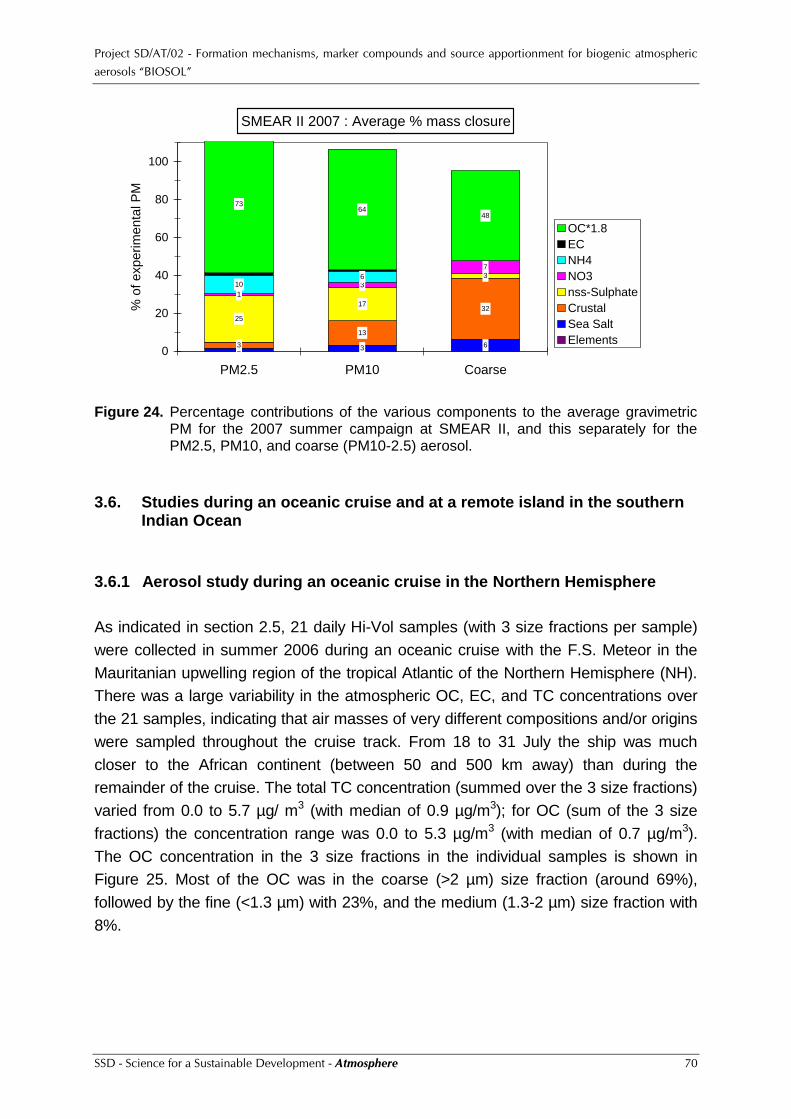
Project SD/AT/02 - Formation mechanisms, marker compounds and source apportionment for biogenic atmospheric
aerosols “BIOSOL”
SSD - Science for a Sustainable Development - Atmosphere 70
SMEAR II 2007 : Average % mass closure
2 3 63
13
32
25
17
3
1
3
7
106
7364
48
0
20
40
60
80
100
PM2.5 PM10 Coarse
% o
f experi
menta
l P
M
OC*1.8
EC
NH4
NO3
nss-Sulphate
Crustal
Sea Salt
Elements
Figure 24. Percentage contributions of the various components to the average gravimetric
PM for the 2007 summer campaign at SMEAR II, and this separately for the PM2.5, PM10, and coarse (PM10-2.5) aerosol.
3.6. Studies during an oceanic cruise and at a remote island in the southern Indian Ocean
3.6.1 Aerosol study during an oceanic cruise in the Northern Hemisphere
As indicated in section 2.5, 21 daily Hi-Vol samples (with 3 size fractions per sample)
were collected in summer 2006 during an oceanic cruise with the F.S. Meteor in the
Mauritanian upwelling region of the tropical Atlantic of the Northern Hemisphere (NH).
There was a large variability in the atmospheric OC, EC, and TC concentrations over
the 21 samples, indicating that air masses of very different compositions and/or origins
were sampled throughout the cruise track. From 18 to 31 July the ship was much
closer to the African continent (between 50 and 500 km away) than during the
remainder of the cruise. The total TC concentration (summed over the 3 size fractions)
varied from 0.0 to 5.7 µg/ m3 (with median of 0.9 µg/m3); for OC (sum of the 3 size
fractions) the concentration range was 0.0 to 5.3 µg/m3 (with median of 0.7 µg/m3).
The OC concentration in the 3 size fractions in the individual samples is shown in
Figure 25. Most of the OC was in the coarse (>2 µm) size fraction (around 69%),
followed by the fine (<1.3 µm) with 23%, and the medium (1.3-2 µm) size fraction with
8%.

Project SD/AT/02 - Formation mechanisms, marker compounds and source apportionment for biogenic atmospheric
aerosols “BIOSOL”
SSD - Science for a Sustainable Development - Atmosphere 71
-0.5
0.0
0.5
1.0
1.5
2.0
Jul15 Jul16 Jul17 Jul18 Jul19 Jul20 Jul21 Jul22 Jul23 Jul24 Jul25 Jul26 Jul27 Jul28 Jul29 Jul30 Jul31 Aug01 Aug02 Aug03 Aug04
OC
(µ
g/m
3)
Filter: <1.3 µm P4: 1.3-2 µm P3: >2 µm
Figure 25. OC concentrations in 3 size fractions during the NH cruise. The samples are
labeled according to the start date of the 24-h collection. P3 stands for the stage, which collected the coarse particles, and P4 for the stage, which collected the medium size fraction.
Large EC/TC ratios were generally observed for the fine and medium size fractions
(typically, around 0.4 and 0.3, respectively). In contrast, in the coarse fraction, there
was generally no EC detected. The high fine EC/TC ratios clearly indicate that the
samples were substantially impacted by emissions from fossil fuel combustion. The
EC/TC ratio in the total aerosol (sum of the 3 size fractions) of the individual samples
showed substantial variability, with low ratios being observed in the samples collected
from 31 July onward, when the ship was more than 500 km away from the African
continent; the median ratio (over all samples) was 0.19.
The percentage OC, which was water-soluble (thus WSOC), was rather variable over
the 21 samples; the median percentages were 27% for the fine size fraction and 14%
for the coarse fraction.
Sections of the back-up filters (size fraction <1.3 µm) of the Hi-Vol samples were
analysed in an effort to detect photo-oxidation products of BVOCs [Claeys et al.,
2004a,b; Ion et al., 2005], dicarboxylic acids [e.g., Kawamura and Sakaguchi, 1999],
and methanesulphonic acid (MSA) [e.g., Saltzman et al., 1986]. In total, back-up filters
from 21 samples and three blanks were analysed. An extraction method similar to that
used in previous studies [e.g., Kourtchev et al., 2005] was applied. Briefly, a part (10
cm2) of the quartz fibre filter was placed in a 25 mL Pyrex glass flask and spiked with
two internal recovery standards, i.e., 0.5 µg methyl-β-D-xylanopyranoside (m-XP) and
0.5 µg deuterated (D3)-malic acid. The samples were extracted (3 x 20 mL) with a
mixture of CH2Cl2:CH3OH (50:50, v/v) under ultrasonic agitation for 30 min. The
extracts were combined and reduced by volume with a rotary evaporator (213 hPA, 30

Project SD/AT/02 - Formation mechanisms, marker compounds and source apportionment for biogenic atmospheric
aerosols “BIOSOL”
SSD - Science for a Sustainable Development - Atmosphere 72
°C) to approximately 1 mL and filtered through a Teflon filter (0.45 µm). Subsequently,
the filtrate was dried under a gentle stream of nitrogen and dissolved in 200 µL of a
mixture of CH2Cl2:CH3OH (50:50, v/v). The final solution was divided into two parts.
One part was refrigerated at 4 °C for eventual further analysis. The other part was
transferred to a 2 mL silylation vial and evaporated under a gentle stream of pure
nitrogen. The dry residue was derivatised with 25 mL of N-methyl-
N-trimethylsilyltrifluoroacetamide (MSTFA + 1% trimethylchlorosilane (TMCS)) and 15
mL pyridine, and heated for 1 h at 70 °C. The derivatised sample was cooled down to
room temperature and immediately analysed by GC/MS. For qualitative analysis the full
scan (FS) mode was used in the mass range m/z 50-650, while for quantitative analysis
the instrument was operated in the selected ion monitoring (SIM) mode. Base ion
fragments occurring at m/z 204 and 217 were used for monitoring m-XP and
levoglucosan; m/z 219 and 277 for 2-methyltetrols; m/z 231 for C5-alkene triols; m/z
233 and 307 for malic acid; m/z 236 and 310 for (D3)-malic acid; m/z 171 and 315 for
cis-pinic acid; m/z 349 for 3-hydroxyglutaric acid; m/z 405 for 3-methyl-
1,2,3-butanetricarboxylic acid and m/z 217 and 319 for arabitol and mannitol. The
GC/MS analysis results in both the FS and SIM modes did not reveal the presence of
the targeted polar organic compounds in the analysed samples.
An attempt was made to detect water-soluble dicarboxylic acids using a procedure
described in previous studies [Kawamura, 1993; Kawamura and Ikushima, 1993].
Briefly, a part (10 cm2) of five selected back-up filters with the highest OC loadings
was cut in small pieces and spiked with an internal recovery standard, i.e., 0.5 µg
deuterated (D3)-malic acid. The filters were subsequently extracted with organic-free
water (3 x 10 mL), which was prepared by oxidising the organic impurities in Milli-Q
water with UV light. The extracts (water-soluble organics) were passed through a
Teflon filter (0.45 µm) to remove filter debris and then concentrated to 100 μL using a
rotary evaporator. The residue was further dried under a nitrogen stream and reacted
with 14% BF3/n-butanol at 100 °C in order to convert carboxyl groups to n-butyl
esters and aldehyde groups to di-n-butoxy acetals. The derivatives were extracted
with n-hexane after adding pure water and then analysed with GC/MS in the EI mode
and using the FS mode in the mass range m/z 50-650. As in the analyses described
above, no evidence could be obtained for the presence of dicarboxylic acids in the
filter samples. This is in contrast to previous studies conducted in marine
environments, e.g., over the Pacific Ocean [Kawamura and Sakaguchi, 1999], where
dicarboxylic acids were found at relatively large concentrations contributing up to
13% to the total aerosol carbon. The discrepancy with our study could be explained
by the rather low loading of the filters for the NH cruise. While in the Pacific Ocean
study [Kawamura and Sakaguchi, 1999] the air volume, aerosol deposit area, and
area used for an extraction were 4300 m3, 500 cm2, and 60 cm2, respectively, these
Project SD/AT/02 - Formation mechanisms, marker compounds and source apportionment for biogenic atmospheric
aerosols “BIOSOL”
SSD - Science for a Sustainable Development - Atmosphere 73
values were much lower in the present study, and were 1300 m3, 330 cm2, and 10
cm2, respectively.
Subsequently, the back-up filter samples were analysed by LC/(–)ESI-MS using a
C18 Hypersil™ column (Thermo Fisher) in an effort to determine other organic
species that could have escaped detection by GC/MS. By LC/(–)ESI-MS non-polar
and moderately polar analytes, including acids, neutrals, and lipophilic compounds,
were targeted. Prior to LC/MS analysis the filter samples were extracted (3 x 20 mL)
with a mixture of CH2Cl2:CH3OH (50:50, v/v) under ultrasonic agitation for 30 min.
The extracts were combined and reduced by volume with a rotary evaporator (213
hPA, 30 °C) to approximately 1 mL and filtered through a Teflon filter (0.45 µm). The
filtrate was dried under a gentle stream of nitrogen, redissolved in 100 µL of CH3OH
and analysed by LC/(–)ESI-MS in the FS mode. The mobile phases of the LC system
consisted of acetic acid 0.1% (v/v) (A) and methanol (B). The applied 45-min gradient
elution program was as follows: the concentration of eluent B was kept at 3% for 2
min, then increased to 90% in 18 min, kept at 90% for 10 min, then decreased to 3%
in 5 min, and kept at 3% for 10 min. The injection volume and flow rate were 5 μL
and 0.2 mL min–1, respectively. The detailed analysis of the extracts demonstrated
the presence of MSA which co-eluted with H2SO4. For the further quantification of
MSA an effort was made to optimise the method. In order to achieve an increased
retention of MSA on the C18 reversed-phase column and separation from H2SO4,
various gradient elution programs were used, but without success. Finally, an ion-
pairing agent (dibutylammonium acetate (0.5 mol/L)) was added to mobile phase A in
order to decrease the polarity of the ionic species.
Addition of dibutylammonium acetate to the mobile phase increased the retention
time and enabled separation between MSA and H2SO4. In a subsequent step, an
appropriate internal recovery standard was selected for the estimation of MSA.
n-Ethanesulphonic acid (ESA), n-propanesulphonic acid (PSA), and
n-butanesulphonic acid (BSA) were tested as possible internal recovery standards; of
these, ESA was selected, since both PSA and BSA were found to co-elute with
H2SO4.
Once the methodology for the MSA determination was developed, the concentration
of MSA and its contribution to the OC were determined. Figure 26 shows the MSA
and OC levels in the fine (<1.3 µm) size fraction for the NH cruise from 15 July to 4
August 2006. During two days (15 July and 4 August) the concentrations of MSA
were below detection limit. The average concentration of MSA in the fine (<1.3 µm)
size fraction over all aerosol samples was 33 ng/m3 and the concentration in the

Project SD/AT/02 - Formation mechanisms, marker compounds and source apportionment for biogenic atmospheric
aerosols “BIOSOL”
SSD - Science for a Sustainable Development - Atmosphere 74
individual samples reached up to 100 ng/m3. MSA contributed on average 2.6% to
the fine OC and was up to 6% in some samples.
1
10
100
1000
15-J
ul
16-J
ul
17-J
ul
18-J
ul
19-J
ul
20-J
ul
21-J
ul
22-J
ul
23-J
ul
24-J
ul
25-J
ul
26-J
ul
27-J
ul
28-J
ul
29-J
ul
30-J
ul
31-J
ul
1-A
ug
2-A
ug
3-A
ug
4-A
ug
Sampling date (2006)
Co
nc.,
ng
/m3
OC
MSA
Figure 26. Time series for the OC and MSA concentrations in the fine (<1.3 µm ) size
fraction of the aerosol samples collected during the NH cruise.
3.6.2. Aerosol study at Amsterdam Island
From 3 December 2006 until 4 March 2007, a total of 18 HVDS collections (of 5 days)
were made in two size fractions (fine: <2.5 µm, and coarse: >2.5 µm) on double quartz
fibre filters. As to the purpose of double filters for each of the two size fractions, this
was to assess artifacts in the collection of particulate OC. The EC levels were all very
low, actually below the detection limit (which was of the order of 10 ng/m3), indicating a
negligeable impact from fossil fuel combustion. The concentrations of the isoprene
SOA markers in the examined fine size fractions were also below detection limit (DL),
which was in the order of 1 ng/m3. It was found that the back/front filter ratios for fine
OC were puzzlingly high, on average 0.4 (even higher back/front ratios were found for
fine WSOC); also for the coarse size fraction, unexpectedly high back/front ratios were
observed. Fortunately, the IC data shed light on this issue. It was found that also
species, for which artifacts during sampling should be absent, such as the inorganic
cations Na+, Mg2+, and K+, exhibited high back/front filter ratios. It is evident that
positive artifacts, such as those typically observed for OC, cannot be invoked to
explain the high back/front filter ratios for the inorganic cations Na+, Mg2+, and K+, and
that artifact-free data for these species should not be calculated by subtracting the
back filter data from the front filter data. It should be indicated here that the HVDS was
deployed quite close to the sea (the horizontal distance was around 45 m); as a

Project SD/AT/02 - Formation mechanisms, marker compounds and source apportionment for biogenic atmospheric
aerosols “BIOSOL”
SSD - Science for a Sustainable Development - Atmosphere 75
consequence, the relative humidity of the air at the sampler was fairly high and the
collected aerosol was presumably rather wet. Besides, each individual HVDS sample
was collected over a 5-day period, whereas the collection time at continental sites is
usually restricted to 12 or 24 hours. Furthermore, the front and back filter touched each
other inside the HVDS. It is thought that the filters became fairly wet during the 5-day
collection period and that the continuous drawing of air through the filters had the effect
that water-soluble species (including Na+, Mg2+, and K+) could migrate from the front
filter to the back filter. Consequently, the double filters acted as one single thick filter
and the data of the back and front filters should be combined to obtain the actual
concentration data. This approach was adopted for all species measured and for both
the fine and coarse size fractions. All data reported from now on for the HVDS samples
from Amsterdam Island are thus always the sum of the data of the front+back filters.
0
100
200
300
400
500
600
700
Dec05 Dec11 Dec16 Dec21 Dec26 Dec31 Jan06 Jan11 Jan16 Jan21 Jan25 Jan30 Feb05 Feb10 Feb15 Feb20 Feb24 Mar01
OC
(n
g/m
3)
FINE OC
COARSE OC
Figure 27. Time series of fine and coarse OC for the HVDS samples from Amsterdam Island.
The samples are labeled according to the mid-point date of the 5-day collection.
The time series of fine and coarse OC is presented in Figure 27. OC peaks in the
period from 29 December 2006 to 18 January 2007, which presumably corresponds
with the maximum in biogenic activity. WSOC followed OC closely (the correlation
coefficient between both parameters was 0.88 for the fine size fraction and 0.97 for the
coarse one). The medians and ranges for OC and WSOC in the total aerosol (sum of
fine + coarse) were 240 (82 – 1040) ng/m3 and 60 (16 – 280) ng/m3, respectively. Of
the total OC, 47±6% was in the fine size fraction; of the total WSOC, 61±11% was fine.
The percentage of OC that was WSOC was, on average, 32±12% for the fine size
fraction, 18±6% for the coarse one, and 25±8% for the total aerosol. These
percentages are very similar to those observed for the NH cruise. As to the median for
total OC, this is about a factor of 3 lower for this campaign at Amsterdam Island than in
the NH cruise. Another substantial difference between the two studies was in the EC
levels and in the EC/TC ratios. For the NH cruise, the median EC/TC ratio for the
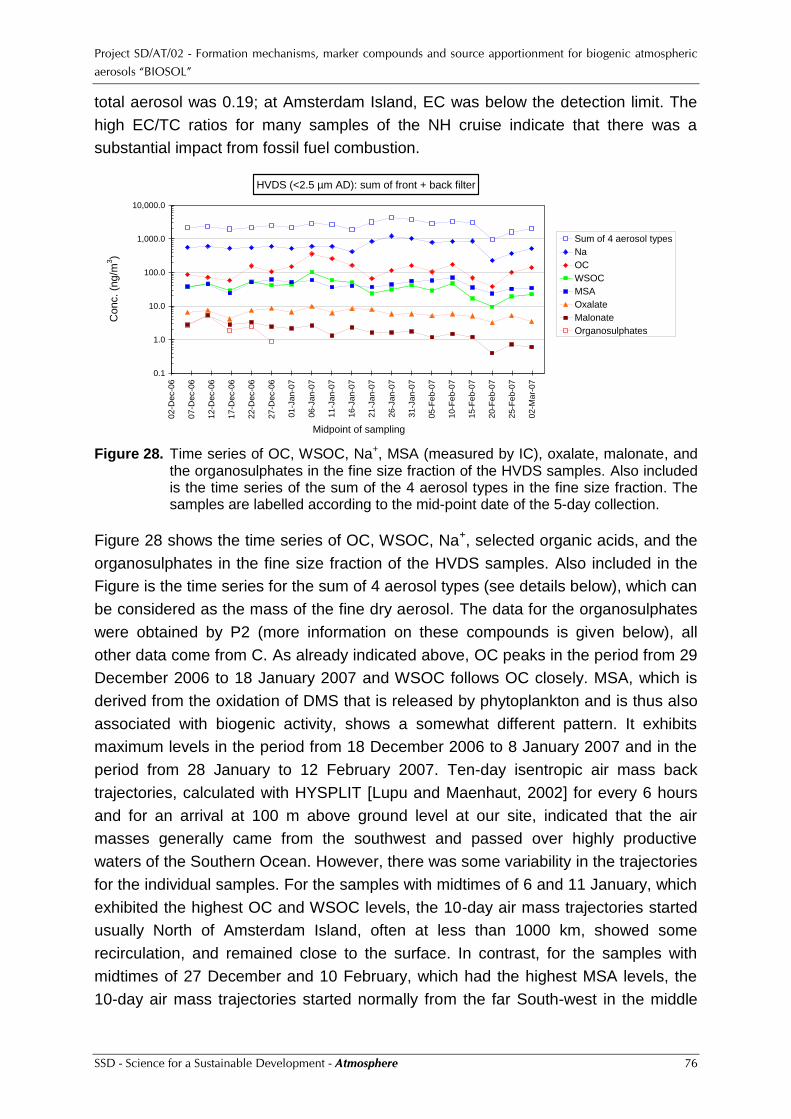
Project SD/AT/02 - Formation mechanisms, marker compounds and source apportionment for biogenic atmospheric
aerosols “BIOSOL”
SSD - Science for a Sustainable Development - Atmosphere 76
total aerosol was 0.19; at Amsterdam Island, EC was below the detection limit. The
high EC/TC ratios for many samples of the NH cruise indicate that there was a
substantial impact from fossil fuel combustion.
HVDS (<2.5 µm AD): sum of front + back filter
0.1
1.0
10.0
100.0
1,000.0
10,000.0
02-D
ec-0
6
07-D
ec-0
6
12-D
ec-0
6
17-D
ec-0
6
22-D
ec-0
6
27-D
ec-0
6
01-J
an-0
7
06-J
an-0
7
11-J
an-0
7
16-J
an-0
7
21-J
an-0
7
26-J
an-0
7
31-J
an-0
7
05-F
eb-0
7
10-F
eb-0
7
15-F
eb-0
7
20-F
eb-0
7
25-F
eb-0
7
02-M
ar-
07
Midpoint of sampling
Con
c.
(ng/m
3)
Sum of 4 aerosol types
Na
OC
WSOC
MSA
Oxalate
Malonate
Organosulphates
Figure 28. Time series of OC, WSOC, Na+, MSA (measured by IC), oxalate, malonate, and
the organosulphates in the fine size fraction of the HVDS samples. Also included is the time series of the sum of the 4 aerosol types in the fine size fraction. The samples are labelled according to the mid-point date of the 5-day collection.
Figure 28 shows the time series of OC, WSOC, Na+, selected organic acids, and the
organosulphates in the fine size fraction of the HVDS samples. Also included in the
Figure is the time series for the sum of 4 aerosol types (see details below), which can
be considered as the mass of the fine dry aerosol. The data for the organosulphates
were obtained by P2 (more information on these compounds is given below), all
other data come from C. As already indicated above, OC peaks in the period from 29
December 2006 to 18 January 2007 and WSOC follows OC closely. MSA, which is
derived from the oxidation of DMS that is released by phytoplankton and is thus also
associated with biogenic activity, shows a somewhat different pattern. It exhibits
maximum levels in the period from 18 December 2006 to 8 January 2007 and in the
period from 28 January to 12 February 2007. Ten-day isentropic air mass back
trajectories, calculated with HYSPLIT [Lupu and Maenhaut, 2002] for every 6 hours
and for an arrival at 100 m above ground level at our site, indicated that the air
masses generally came from the southwest and passed over highly productive
waters of the Southern Ocean. However, there was some variability in the trajectories
for the individual samples. For the samples with midtimes of 6 and 11 January, which
exhibited the highest OC and WSOC levels, the 10-day air mass trajectories started
usually North of Amsterdam Island, often at less than 1000 km, showed some
recirculation, and remained close to the surface. In contrast, for the samples with
midtimes of 27 December and 10 February, which had the highest MSA levels, the
10-day air mass trajectories started normally from the far South-west in the middle
Project SD/AT/02 - Formation mechanisms, marker compounds and source apportionment for biogenic atmospheric
aerosols “BIOSOL”
SSD - Science for a Sustainable Development - Atmosphere 77
troposphere, often at more than 1000 km from Amsterdam Island. The ratio
MSA/nss-sulphate in the fine size fraction (averaged over all 18 samples) was
0.18±0.05. This ratio is intermediate between the measured MSA/nss-sulphate ratios
of, on the one hand, the Indian Ocean and the South Pacific and, on the other hand,
austral summertime data for the Southern Ocean and Antarctic [Gondwe et al.,
2004]. Since non-DMS derived nss-sulphate should be negligible for most of these
earlier data (particularly for the austral summertime data for the Southern Ocean and
Antarctic), this suggests that the nss-sulphate during austral summer at Amsterdam
Island is like MSA indeed derived from DMS. Oxalate shows somewhat less
variability than MSA throughout the sampling period. The concentration of malonate
shows a decrease with time and the organosulphates were only above DL in the first
5 samples. According to Wang et al. [2006], the dicarboxylic acids (including oxalate
and malonate) and other water-soluble organics in marine aerosols over the
Southern Ocean may mainly be produced through in-situ photochemical reactions
and their precursors over the Southern Ocean may be predominately derived from
sea-to-air emissions of biogenic organic compounds including unsaturated fatty
acids, phenolic compounds, and olefins.
Table IX presents a summary of the total concentrations (sum of coarse+fine) for the
period of HVDS samplings and of the percentage that was in the fine size fraction.
Most data in the Table were obtained by C. For data obtained by P2, P2 is given in
brackets after the name of the species. Nss-sulphate was calculated for each
individual sample as [SO42-] – 0.252 [Na+], whereby 0.252 is the SO4
2-/Na+ ratio in
bulk sea water [Riley and Chester, 1971]. As expected, the total aerosol is dominated
by sea salt (Cl- and Na+). Slightly less than 50% of these sea-salt ions is in the fine
fraction; for nss-sulphate and the organic species (MSA–, oxalate, malonate) around
90% is in the fine fraction and for WSOC and nitrate, intermediate percentages
(means of 61 and 74%, respectively) are observed. The fairly high fine percentages
for the sea-salt ions are surprising. It is possible that the true cut-point between fine
and coarse for our HVDS operating conditions was somewhat larger than the
nominal 2.5 µm. According to Solomon [2008], it could be around 3 to 3.5 µm. On the
other hand, the fact that our HVDS was at some distance from and at some altitude
above the sea may have had the effect that many coarse particles were removed
from the sea-salt aerosol by particle settling (dry deposition) before they could reach
the HVDS.

Project SD/AT/02 - Formation mechanisms, marker compounds and source apportionment for biogenic atmospheric
aerosols “BIOSOL”
SSD - Science for a Sustainable Development - Atmosphere 78
Table IX. Medians and concentration ranges (ng m–3) in the total aerosol (sum of coarse+fine) and percentage that was in the fine size fraction. Note that organosulphates were not measured for the coarse size fraction, so that the organosulphate data refer to the fine size fraction. DL indicates detection limit. The data are based on the analyses of 18 HVDS samples.
Species
Median conc.
(ng m–3)
Concentration range
(ng m–3)
Mean ± std. dev. for
% Fine of Total
OC 240 82 – 1040 47 ± 6
WSOC 60 16 – 280 61 ± 11
MSA– 47 25 – 78 91 ± 4
MSA– [P2] 56 31 – 89 91 ± 5
Oxalate 7.0 3.6 – 12 86 ± 6
Malonate 2.0 0.5 – 5.4 85 ± 8
Organosulphates [P2] DL – 5.1
Cl– 2300 920 – 4600 40 ± 10
NO3– 17 3.9 – 30 74 ± 13
NO2– 4.5 0.6 – 7.9 32 ± 20
SO42– 650 300 – 880 66 ± 6
nss-SO42– 260 157 - 390 93 ± 6
Br– 2.7 0.8 – 6.0 35 ± 13
Na+ 1350 570 – 2700 46 ± 9
K+ 48 20 – 105 50 ± 14
Mg2+ 155 59 – 320 44 ± 8
Ca2+ 34 13 – 70 46 ± 8
Table X gives for the separate fine and coarse size fractions what fraction of the OC
was water-soluble (WSOC) and to what extent the WSOC is accounted for by the
carbon in the measured organic species. It is clear that the coarse OC is less water-
soluble than the fine one (on average 18% versus 32%). The percentage of fine OC
that is water-soluble resembles percentages obtained at urban locations in Europe,
where about 50% of the submicrometer OC is of primary origin according to Aerosol
Mass Spectrometer (AMS) measurements [Zhang et al., 2007]. It is substantially
lower than the percentages of around 60% obtained at forested sites, where a large
fraction of the OC is made up by SOA [Chi and Maenhaut, 2008]. This suggests that
most of the OC at Amsterdam Island is primary (even during the period of high
biogenic activity). For the fine size fraction, a substantial fraction of the WSOC is
accounted for by the carbon in the measured compounds (around 25% in total), but
for the coarse size fraction only around 5% of the WSOC is explained by these
compounds. The composition of the unaccounted WSOC is unclear. This fraction is
likely made up of higher molecular weight compounds (MW > 500), which escape
detection in the analyses performed by the teams of C and P2. Possibly, the fraction
consists of partially oxidised primary OC, which has become water-soluble and/or of

Project SD/AT/02 - Formation mechanisms, marker compounds and source apportionment for biogenic atmospheric
aerosols “BIOSOL”
SSD - Science for a Sustainable Development - Atmosphere 79
water-soluble primary OC. This is also consistent with another observation, i.e., that
SOA (i.e., organosulphates, see below) is found that can be explained through
oxidation of primary algal biomass. More specifically, oxidation of unsaturated fatty
acid residues in the latter biomass will afford polar and complex higher MW bio-
organic macromolecular compounds that are refractory and are not targeted in our
analyses.
Table X. Percentage of the OC that was water-soluble (WSOC) and percentages of the WSOC that are accounted for by the carbon in the measured organic compounds (based on 18 HVDS samples). Note that the organosulphates were not measured for the coarse size fraction.
Fine Coarse Total
Mean ± st.dev Mean ± st.dev Mean ± st.dev
WSOC % of OC 32 ± 12 18 ± 6 25 ± 8
MSA C [P2] % of WSOC 21 ± 8 3.6 ± 2.4 14 ± 6
MSA C % of WSOC 17 ± 6 2.8 ± 1.7 11 ± 5
Oxalate C % of WSOC 5.0 ± 2.0 1.2 ± 0.8 3.5 ± 1.5
Malonate C % of WSOC 1.8 ± 0.9 0.5 ± 0.4 1.4 ± 0.7
Organosulphate C [P2] % of WSOC 0.8 ± 1.5 0.5 ± 1.0
It was indicated above that the total aerosol is dominated by sea salt (Cl- and Na+). In
order to examine this more closely and also for the separate fine and coarse size
fractions, the concentrations of 4 aerosol types, i.e., sea salt, nss-sulphate, water-
soluble organic matter (WSOM), and water-insoluble organic matter (WIOM), were
calculated and it was assumed that the sum of these 4 aerosol types was a
reasonable proxy for the dry aerosol mass. A potentially major aerosol type missing
from this sum is crustal matter (mineral dust), but it is thought that its contribution is
not larger than 10% of the dry aerosol mass. Ezat and Dulac [1995] found an
atmospheric mineral dust concentration of 120 ng m–3 at Amsterdam Island; this is
actually less than 2% of the sum of our 4 aerosol types for the total aerosol. Sea salt
was calculated as 3.256 [Na+], whereby the factor is the mass ratio of sea salt to Na+
in sea salt, nss-sulphate was estimated as explained above, WSOM was obtained as
1.8 WSOC and WIOM as 1.4 (OC – WSOC). The factors 1.8 and 1.4 are identical to
those used by Facchini et al. [2008] in a similar recent exercise. Figure 29 (left part)
shows the average concentrations of the 4 aerosol types (averaged over the 18
HVDS samples) for the separate fine and coarse size fractions and for the total
aerosol (sum of fine+coarse); in Figure 29 (right part) the percentage contributions of
the 4 aerosol types, expressed as percent of the mean concentration of the sum of
the 4 types, is given. Organic aerosol (sum of WIOM + WSOM) makes up for less
than 10% of the sum of the 4 aerosol types. This is even the case for the fine size
fraction, which is clearly dominated by sea salt.

Project SD/AT/02 - Formation mechanisms, marker compounds and source apportionment for biogenic atmospheric
aerosols “BIOSOL”
SSD - Science for a Sustainable Development - Atmosphere 80
21232515
4638130
189
319
0
1000
2000
3000
4000
5000
6000
Fine Coarse Total
Mass c
onc.
(ng/m
3)
WIOM
WSOM
nss-Sulphate
Sea salt 83
9187
2.82.1 2.4
5.0 6.8 6.0
0
10
20
30
40
50
60
70
80
90
100
Fine Coarse TotalM
ass %
WIOM
WSOM
nss-Sulphate
Sea salt
Figure 29. Average concentrations of 4 aerosol types in the separate fine and coarse size fractions and in the sum of both (left part of Figure) and percentage contributions of the 4 aerosol types, expressed as percent of the mean concentration of the sum of the 4 types (right part of Figure). The numeric data for WIOM and sea salt are also given for both parts of the Figure, and the right part of the Figure also provides the numeric data for WSOM.
In addition to MSA and sulphate the LC/(–)ESI-MS method also revealed the
presence of organosulphates with MWs 212, 254, 268, 282, 296, and 310.
Organosulphates are SOA components that only have been recently discovered and
are formed by reaction of SOA constituents containing a hydroxyl or a keto/aldehyde
group with sulphuric acid [Surratt et al., 2007]. Figure 30 shows LC/(–)ESI-MS
chromatographic data obtained without ion-pairing for the fine front filter collected
from 8 to 13 December 2006. The most prominent signals were observed for m/z 253
and 281, corresponding to MW 254 and 282 compounds, respectively. In addition to
MW 254, 268, and 282 organosulphates, minor signals were also observed for
organosulphates with MWs 212, 296, and 310. Similar profiles were obtained for the
other fine samples (front and back) but since the signals were quite weak except in
the first five samples, quantitative calculations were only done for these five samples.
Figure 31 presents mass spectral data obtained for the two major isomers of the MW
254 compound. On the basis of these data, the compounds were identified as
organosulphates of C9 hydroxy fatty acids. Characteristic organosulphate ions in the
MS2 spectra include the loss of SO3 (80 u) and the bisulphate ion [HSO4]– (m/z 97).
In addition, accurate mass measurements performed on the m/z 253 ion allowed to
confirm the elemental compositions as C9H17O6S. Mass spectral data sets (not
shown) were also obtained for the other organosulphates with MWs 212, 268, 282,
296, and 310. The MW 268, 282, 296, and 310 compounds were characterised as
C10, C11, C12, and C13 homologues of the major C9 (MW 254) compounds. The MW
212 compound was characterised as an organosulphate of a neutral compound, i.e.,
a C6 dihydroxyaldehyde. The m/z 211 MS2 spectrum only revealed the bisulphate ion

Project SD/AT/02 - Formation mechanisms, marker compounds and source apportionment for biogenic atmospheric
aerosols “BIOSOL”
SSD - Science for a Sustainable Development - Atmosphere 81
[HSO4]– (m/z 97) and the accurate mass data indicated an elemental composition of
C6H11O6S for the m/z 211 ion.
Figure 30. LC/(–)ESI-MS chromatographic data obtained without ion-pairing for the fine front filter collected from 8 to 13 December 2006. The top chromatogram is a base peak chromatogram (BPC), while the other chromatograms are extracted ion chromatograms at the m/z value of [M – H]– ions of MSA (m/z 95) and selected organosulphates (m/z 253, 267, and 281) where the m/z 253 and 281 compounds are the most abundant ones.
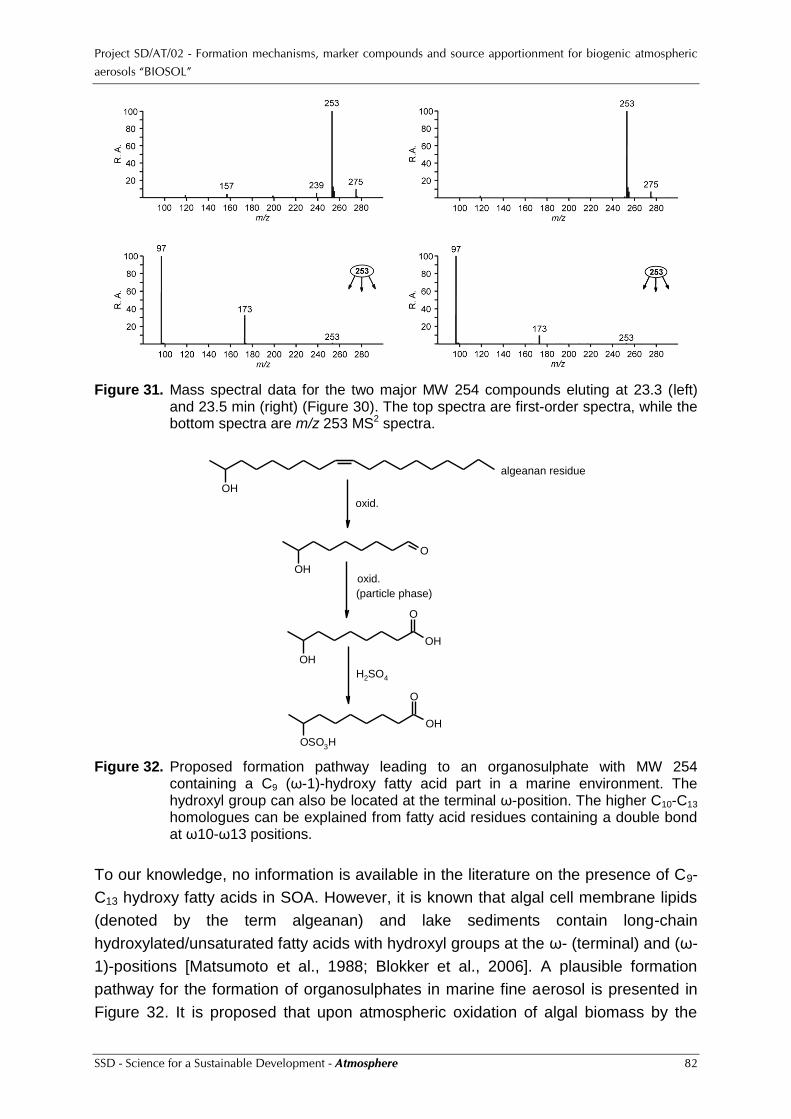
Project SD/AT/02 - Formation mechanisms, marker compounds and source apportionment for biogenic atmospheric
aerosols “BIOSOL”
SSD - Science for a Sustainable Development - Atmosphere 82
Figure 31. Mass spectral data for the two major MW 254 compounds eluting at 23.3 (left) and 23.5 min (right) (Figure 30). The top spectra are first-order spectra, while the bottom spectra are m/z 253 MS2 spectra.
OH
OH
O
OH
O
OH
OSO3H
O
OH
algeanan residue
oxid.
oxid.
(particle phase)
H2SO4
Figure 32. Proposed formation pathway leading to an organosulphate with MW 254 containing a C9 (ω-1)-hydroxy fatty acid part in a marine environment. The hydroxyl group can also be located at the terminal ω-position. The higher C10-C13 homologues can be explained from fatty acid residues containing a double bond at ω10-ω13 positions.
To our knowledge, no information is available in the literature on the presence of C9-
C13 hydroxy fatty acids in SOA. However, it is known that algal cell membrane lipids
(denoted by the term algeanan) and lake sediments contain long-chain
hydroxylated/unsaturated fatty acids with hydroxyl groups at the ω- (terminal) and (ω-
1)-positions [Matsumoto et al., 1988; Blokker et al., 2006]. A plausible formation
pathway for the formation of organosulphates in marine fine aerosol is presented in
Figure 32. It is proposed that upon atmospheric oxidation of algal biomass by the
Project SD/AT/02 - Formation mechanisms, marker compounds and source apportionment for biogenic atmospheric
aerosols “BIOSOL”
SSD - Science for a Sustainable Development - Atmosphere 83
action of ozone and/or enzymatic degradation, hydroxy alkanals are released, which
are trapped on acidic fine aerosol where they are further converted to hydroxy fatty
acids. Subsequently, these hydroxy fatty acids may react with sulphuric acid resulting
in organosulphates. The formation of the MW 212 compound can be explained via a
similar pathway where the C6 dihydroxyaldehyde is formed through oxidation of bis-
unsaturated fatty acid moieties of algal cell membrane lipids.
Unlike organosulphates found in continental fine aerosol, which have a mixed
biogenic/anthropogenic origin and where the sulphate part is mainly from
anthropogenic origin, the organosulphates in remote marine fine aerosol have a
sulphate part from biogenic origin and are thus mainly biogenic.
Our results indicate that organic aerosol for samples collected at Amsterdam Island
during the austral summer of 2006-2007, a period of high biological activity, makes up
less than 10% of the mass in both the fine and coarse size fractions. Our percentage in
the fine size fraction is much less than the 65% of OC (sum of WIOC + WSOC) found
for submicrometer-sized aerosol during a high biological activity period at the Atlantic
Ocean site of Mace Head [O’Dowd et al., 2004]. On a mass basis, sea salt followed by
nss-sulphate dominate and WIOC is relatively more important than WSOC at
Amsterdam Island, comparable with results obtained in a recent aerosol
characterisation study for size-segregated samples during a phytoplankton bloom in the
North Atlantic [Facchini et al., 2008]. The percentage of fine OC that is water-insoluble
resembles percentages obtained at urban locations in Europe, where much of the OC is
of primary origin. The WIOC is attributed to primary marine biomass produced during
phytoplankton blooms, considering that electron microscopic evidence from prior
studies is available that marine aerosol particles contain fragments and secretions of
algae and bacteria [Leck and Bigg, 2005a; 2005b; 2008].
About 23% of the fine WSOC could be attributed to methanesulphonate, dicarboxylic
acids, and organosulphates, with methanesulphonate providing the largest fraction
(17%). A large fraction of the fine WSOC escaped our analysis and likely corresponds
to oxidised marine biomass that became water-soluble. It was found that the temporal
variation of WSOC closely followed that of OC, while methanesulphonate, the
dicarboxylic acids, and the organosulphates showed a different time series, pointing to
different biogenic origins and/or source regions.
A novel group of SOA tracers, i.e., organosulphates, which occurred in low
concentrations and represented only 0.8% of the fine WSOC, were structurally
elucidated as sulphate esters of C9-C13 hydroxyl acids and a C6 dihydroxylaldehyde,
and explained by oxidation of hydroxylated/unsaturated fatty acid residues of
Project SD/AT/02 - Formation mechanisms, marker compounds and source apportionment for biogenic atmospheric
aerosols “BIOSOL”
SSD - Science for a Sustainable Development - Atmosphere 84
algal/bacterial cell membrane lipids and subsequent oxidation/sulphation on pre-
existing particles. The organosulphates characterised here can be considered as
tracers for a SOA formation process that is specific for the marine environment, i.e.,
oxidation of primary marine biomass. To our knowledge, this is a novel SOA source
process that has not been previously reported.
No evidence could be found for SOA from the photo-oxidation of isoprene, which is
consistent with recent model estimates indicating that isoprene has an insignificant role
in forming marine organic aerosol by secondary processes [Arnold et al., 2009], and
thus further supporting a primary source of OC in the remote marine atmosphere.
3.7. Modelling of the formation and growth of the fine particles and of the fine biogenic atmospheric aerosol
This work is carried out by BIOSOL partner P4, but experimental data input is provided
by all partners.
P4 performed preparatory work to apply the UHMA model to the data sets from
K-puszta (section 3.3) and Hyytiälä (section 3.5). The basic idea is to look at the
connection between different vapours and aerosol production and to see how
different hypotheses are able to explain particle formation and growth. This has been
explained, e.g., by Kulmala et al. [2006] and Sihto et al. [2006].
If we look at the formation rate of 1 nm particles, J1 is the particle formation rate at 1
nm, corresponding to the size region at which the atmospheric nucleation is generally
assumed to take place. In particular, the values nJ1 = 1 or nJ1 = 2 in the correlation
between J1 and 1
42SOH Jn would imply the activation of pre-existing clusters (nJ1 = 1)
or kinetic nucleation of sulphuric acid (nJ1 = 2) to be the dominating mechanisms for
atmospheric new particle formation, as proposed by Kulmala et al. [2006]. In these
cases the new particle formation rate (i.e., the atmospheric nucleation rate) can be
simply written as:
421 SOHAJ
or 2
421 SOHKJ
where A and K are now coefficients containing the details of the nucleation
processes. According to Sihto et al. [2006], these nucleation mechanisms seem to be
the best candidates for the atmospheric nucleation observed in Hyytiälä. Exponents
larger than 2, on the other hand, may indicate that the atmospheric nucleation is
thermodynamically limited.

Project SD/AT/02 - Formation mechanisms, marker compounds and source apportionment for biogenic atmospheric
aerosols “BIOSOL”
SSD - Science for a Sustainable Development - Atmosphere 85
Atmospheric particle and ion data measured during 39 days in the 2006 summer
campaign at K-puszta, Hungary, were analysed and related to meteorological and
trace gas data [Yli-Juuti et al., 2009]. It was found that there were many new particle
formation event days during that period; formation of new nucleation mode particles
and subsequent growth was observed on more than half the days and also during
most of the other days some kind of particle formation was observed. Based on the
results, it is reasonable to assume that the production rate of condensable vapours
able to form particles was high. The chemical production of these vapours is likely to
be intense, since K-puszta is characterised by intensive solar radiation in
summertime. The ambient SO2 concentration was not significantly higher than, e.g.,
in Hyytiälä [Lyubovtseva et al., 2005]. This suggests that the cause for the high event
frequency at K-puszta might not be a significantly high sulphuric acid concentration -
presumably the presence of condensable organic vapours, and their clear
contribution to new particle formation and growth [e.g., Kulmala et al., 2004b].
None of the measured trace gases or meteorological variables was solely able to
explain the new particle formation events since no clear differences in these data
were found between event and non-event days. However, the condensation sink
reached, as expected, higher values on non-event days than on average, which is in
line with other studies [Dal Maso et al., 2005].
The observed formation rates of 10 nm particles were higher than the formation rates
observed at Hyytiälä, Finland. As a summary, we can state that the formation rate is
at the upper end of formation rates observed in the continental boundary layer [see
Kulmala et al., 2004a]. The growth rates of atmospheric nucleation mode particles
during new particle formation events were strongly size-dependent and in the same
range as those obtained in other studies at other sites [Kulmala et al., 2004a]. The
size-dependency in growth rates is in line with findings in previous observational
[Hirsikko et al., 2005; Suni et al., 2008] and phenomenological studies [Kulmala et
al., 2004c] and suggests that different factors are affecting the growth of different
sized particles. Since the growth and formation rates of particles were not
exceptionally high at K-puszta the high new particle formation event frequency
probably cannot be explained by the high concentration of condensable vapours but
possibly by the high production rate of these vapours. The high event frequency
might also be connected to the intensive solar radiation at K-puszta.
0.5-1.8 nm ion cluster concentrations were found to correlate clearly with ambient
conditions: during the warm period with continental air masses the diurnal maximum
cluster concentrations were significantly higher than during the period with colder and
Project SD/AT/02 - Formation mechanisms, marker compounds and source apportionment for biogenic atmospheric
aerosols “BIOSOL”
SSD - Science for a Sustainable Development - Atmosphere 86
cleaner air masses from the North Sea or the Atlantic Ocean. This could be partly
explained by lower wind speed during the warmer period resulting in a weaker
boundary layer mixing. It might also point to the role of gaseous precursors in forming
atmospheric clusters, since the concentrations of both BVOCs and inorganic trace
gases were higher during the warm period. Interestingly, the diurnal variation of the
cluster ions was similar to that for the ambient monoterpene concentrations. This
could partly be explained by the effect of boundary layer dynamics, but could also
point to monoterpenes as a possible source of atmospheric clusters.
3.8. Particulate-phase oxidation products of isoprene (and other BVOCs), which can be used as indicator compounds for source apportionment
The studies mentioned in sections 3.1 and 3.2 also relate to this task. In addition,
studies were performed aimed at the characterisation of particulate-phase oxidation
products of isoprene, α-pinene, and unsaturated fatty acids that are present in
significant concentrations in ambient fine aerosol and can serve as SOA marker
compounds.
In close collaboration with US EPA, Caltech, and IfT, P2 conducted studies to
structurally characterise major particulate-phase oxidation products of α-pinene that
occur at significant concentrations in ambient fine aerosol. It has been firmly
established that cis-pinic, cis-norpinic, and cis-pinonic acid are major products
formed from α-pinene by reaction with O3. However, several ambient aerosol studies
have shown that the atmospheric concentrations of major α-pinene SOA products
(i.e., cis-pinic and cis-pinonic acid) are rather low during summer episodes, while
evidence was obtained that highly oxygenated products are formed that could also
be generated by irradiating α-pinene in the presence of NOx through reactions that
involve O3 and OH radicals. Using GC/MS with prior derivatisation to volatile
derivatives and LC/(–)ESI-MS, detailed interpretation of the MS data, and synthesis
of reference compounds, the structures of two major α-pinene SOA marker
compounds with MWs of 148 and 204 were firmly established as 3-hydroxyglutaric
acid and 3-methyl-1,2,3-butanetricarboxylic acid (MBTCA), respectively. The
proposed formation mechanism for MBTCA is given in Scheme 5. It involves
participation of the OH radical, but it cannot be ruled out that ozone is also involved.
With the pathway of Scheme 5 it is possible to explain the smog chamber
observations reported by Claeys et al. [2007], which suggested that the MW 204
compound was formed at the expense of cis-pinic acid. The observations can be
explained with cis-pinonic acid following two routes; namely, a short one leading to
cis-pinic acid, and a longer one, leading to MBTCA. The formation of MBTCA likely
takes place in the particle phase, but further work is required to confirm this

Project SD/AT/02 - Formation mechanisms, marker compounds and source apportionment for biogenic atmospheric
aerosols “BIOSOL”
SSD - Science for a Sustainable Development - Atmosphere 87
hypothesis and obtain insights into the reaction mechanism. More details on this
work are given in Claeys et al. [2007] and Szmigielski et al. [2007b].
Scheme 5. Mechanism proposed for the formation of 3-methyl-1,2,3-butanetricarboxylic
acid.
Major efforts were undertaken to elucidate the structure of a MW 172 compound and
related compounds, which are formed upon photo-oxidation and ozonolysis of
α-pinene (and other BVOCs) and are also present in ambient fine aerosol from
forested sites with coniferous vegetation. Using LC/(–)ESI-MS, detailed interpretation
of the MS data, and synthesis of reference compounds, the MW 172 compound was
firmly established as the lactone-containing terpenoic acid terpenylic acid. Terpenylic
acid shows unique non-covalent dimer-forming properties in (–)ESI-MS and is
thought to play a role in initial particle formation. More details about this work are
given in Claeys et al. [2009]. The structures and trivial names of recently
characterised terpenoic acids and their BVOC precursor(s) is presented in
Scheme 6.

Project SD/AT/02 - Formation mechanisms, marker compounds and source apportionment for biogenic atmospheric
aerosols “BIOSOL”
SSD - Science for a Sustainable Development - Atmosphere 88
O
O
OH
O
O
O
OH
O
OH
O OH
O
O
O
O
O
OH
O
OH
O
O
OH O
OH
O
OH
O
O
OHO
OH
O
OH
O
O
OH
O
O
OH
terpenylic acid 2-hydroxyterpenylic acidterebic acid
homoterpenylic acid
(alpha-pinene) (alpha-pinene)(alpha-pinene)
(beta-pinene)
(beta-pinene)
(delta-3-carene)
ketolimononic acid(limonene)
limonic acid(limonene)
caronic acid(delta-3-carene)
caric acid(delta-3-carene)
diaterpernylic acid acetate(alpha-pinene)(1,8-cineole)
Scheme 6. Structures and trivial names of terpenoic acids that are present in ambient fine
aerosol from forested sites. Their BVOC precursor(s) is (are) indicated between parentheses.
A detailed MS characterisation was carried out on organosulphates from isoprene
SOA (i.e., 2-methyltetrols, 2-methylglyceric acid, 2-methyltetrol mono-nitrate
derivatives, glyoxal, and methylglyoxal) and on unknown organosulphates that were
present in ambient PM2.5 aerosol collected at K-puszta and Brasschaat. LC in
combination with linear ion trap MS using (–)ESI was employed. A major
fragmentation pathway for the deprotonated molecules of the sulphate esters of
2-methyltetrols and 2-methylglyceric acid and of the sulphate derivatives of glyoxal
and methylglyoxal is the formation of the bisulphate [HSO4]– anion, while the
deprotonated sulphate esters of 2-methyltetrol mono-nitrate derivatives preferentially
fragment through loss of nitric acid. Rational interpretation of MS2, MS3, and accurate
mass data led to the structural characterisation of unknown polar compounds in
K-puszta and Brasschaat fine aerosol as organosulphate derivatives of photo-
oxidation products of unsaturated fatty acids (Scheme 7), i.e., 2-hydroxy-
1,4-butanedialdehyde (1), 4,5- and 2,3-dihydroxy-pentanoic acids (2 and 3),
2-hydroxyglutaric acid (4), 2,3-dihydroxypentane-1,5-dialdehyde (5),
2,3,4-trihydroxypentanoic acid (6), 2-hydroxy-6-ketohexanoic acid (7), and of
α-pinene, i.e., 3-hydroxyglutaric acid (8). The deprotonated molecules of the
sulphated hydroxyacids (e.g., 2-methylglyceric acid, 4,5- and 2,3-dihydroxypentanoic
acid, and 2- and 3-hydroxyglutaric acids) showed in addition to the [HSO4]– ion (m/z
97) neutral losses of water, CO2, and/or SO3, features that are characteristic of
humic-like substances.

Project SD/AT/02 - Formation mechanisms, marker compounds and source apportionment for biogenic atmospheric
aerosols “BIOSOL”
SSD - Science for a Sustainable Development - Atmosphere 89
OO
OH
O
OHOH
OH
O
OH
OH
OH
O
OH
OH
OH
O
O
OHOH
O OH
OH
OO
OH O
OH
OH
OHOH
O
OHO
OH
(1) (2) (3) (4)
(8)(5) (6) (7)
Scheme 7. Photo-oxidation products of unsaturated fatty acids and α-pinene for which
sulphate derivatives were structurally elucidated.
The polar organosulphates characterised are of climatic relevance because they may
contribute to the hydrophilic properties of fine ambient aerosol. In addition, these
compounds likely serve as ambient marker compounds for the occurrence of SOA
formation under acidic conditions. More details on the organosulphates from isoprene
are given in Surratt et al. [2007; 2008], while details on some of the other
organosulphates are given in Gómez-González et al. [2008].
3.9. Determination of the contribution from the BVOCs to the organic aerosol for various sites in Europe
As indicated in section 2.9, this work was done for the PM2.5 size fraction of the
HVDS samples from the 2003 summer campaign at K-puszta [Kourtchev et al., 2009]
and for PM2.5 samples, which had been collected in summer 2003 in a mixed
deciduous forest in Jülich [Kourtchev et al., 2008c]. For K-puszta, the SOC
contribution from isoprene was estimated at 0.28 μgC m–3. Expressed as percentage
contribution to the PM2.5 OC, isoprene SOC represented, on average, 6.9%; the
day-time mean was 9.6% and the night-time mean 5.2%. The SOC contribution from
α-pinene was, on average, 0.21 μgC m–3. This represented, on average, 4.8% of the
PM2.5 OC; the day-time mean was 3.8% and the night-time mean 6.0%. It is noted
that the data for α-pinene SOC should be regarded as minimum values because not
all molecular tracers necessary to estimate α-pinene SOC were measured. For the
Jülich samples, the contribution from isoprene was estimated at, on average, 2.5% of
the OC and that of α-pinene SOA at at least 2.4%. Our percentages for K-puszta and
Jülich can be compared to those obtained with the same approach for Research
Triangle Park, southeastern USA, during the months May-July of 2003 [Kleindienst et
al., 2007], for 5 midwestern US cities during the months June-August of 2004
[Lewandowski et al., 2008], and for Hong Kong during a 2006 summer period [Hu et
al., 2008]. The contributions from isoprene SOC to the PM2.5 OC in these 3 cases

Project SD/AT/02 - Formation mechanisms, marker compounds and source apportionment for biogenic atmospheric
aerosols “BIOSOL”
SSD - Science for a Sustainable Development - Atmosphere 90
were 23%, 29%, and 3.6%, respectively, while those from α-pinene SOC were 15%,
13%, and 10%, respectively. The US percentages for isoprene SOC are more than a
factor of 3 larger than our percentage for K-puszta. This may in part be due to the
larger isoprene emissions at the US sites. However, it should be noted that the
quantification of the isoprene and also the α-pinene SOA tracers in the US studies
was done in a different way than by us and in the Hong Kong study. Because of this,
Hu et al. [2008] estimated the quantification uncertainty in their Hong Kong study to
be within a factor of 3. Considering that also various other uncertainties are
associated with the approach, as indicated by Kleindienst et al. [2007], we estimate
that the uncertainty that is associated with our isoprene and α-pinene SOC
percentages is at least a factor of 2.
Combined together, isoprene and α-pinene SOC make thus up for at least 11.7% of
the PM2.5 OC for K-puszta. If we assume that the short-chain diacids do not form
part of the isoprene and α-pinene SOA in the laboratory experiments of Kleindienst et
al. [2007], we can add to our biogenic SOC percentage the OC accounted for by the
various diacids. Oxalate, malonate, succinate, glutarate, and 2-hydroxyglutaric acid,
contributed, on average, with 1.26, 0.36, 0.16, 0.11, and 0.06%, respectively, or in
total with 1.94%. By making use of the levoglucosan and arabitol data from our
previous analyses [Ion et al., 2005] and of the conversion factors of these
compounds to wood combustion OC and fungal spores OC of Schmidl et al. [2008]
and Bauer et al. [2008], we can attribute 2.4 and 1.7% of our PM2.5 OC to wood
burning and fungal spores, respectively. If we add these percentages to those from
the diacids and the biogenic SOC, we arrive at a total percentage of about 18% of
our PM2.5 OC attributed. Clearly, this is a rather low percentage and the question
remains which compounds and/or sources are responsible for the remaining OC
mass. According to Feczko et al. [2007], HULIS represent 24% of the OC at the
K-puszta site. It was also found that organosulphates and nitrooxy organosulphates
were important constituents of the OC at K-puszta during the 2003 campaign
[Gómez-González et al., 2008], but their concentrations could not be quantified. By
making use of data of total sulphur, measured by PIXE, and of inorganic sulphate, as
obtained by IC, it is estimated that up to 22% of the OC at K-puszta during the 2003
campaign may be attributable to organosulphates (Maenhaut, unpublished results).
Thus, the 18% of PM2.5 OC attributed by our tracers, the 24% of HULIS, and the up
to 22% of organosulphates, if taken as independent, which may not be justified,
would sum up to 64%, which would mean that 36% of the OC remains unaccounted.
Considering the substantial uncertainties that are associated with the various
attributions, it is hard to tell how significant this 36% of unaccounted OC is. It is clear
that further work on the sources and closure of the OC is needed. As to the samples
from Jülich, the average contribution from wood smoke to the OC was estimated at

Project SD/AT/02 - Formation mechanisms, marker compounds and source apportionment for biogenic atmospheric
aerosols “BIOSOL”
SSD - Science for a Sustainable Development - Atmosphere 91
3.3%, while the contribution from fungal spores to the OC was estimated at 3.6%.The
summed contribution of isoprene and α-pinene SOC, wood combustion, and fungal
spores to the PM2.5 OC of the Jülich samples was thus at least 12%. It is clear that
most of the OC remained unaccounted. Organosulphates, HULIS, and other primary
biogenic aerosol besides fungal spores probably made up for a substantial fraction of
the unexplained OC.
It was found for the 2003 summer campaign at K-puszta that isoprene SOC and
α-pinene SOC accounted, on average, for respectively 6.9% and at least 4.8% of the
PM2.5 OC; for the PM2.5 samples, which had been collected in summer 2003 in
Jülich, the average contributions from isoprene SOC and α-pinene were 2.5% and at
least 2.4%, respectively. Although the data for α-pinene SOC should be regarded as
minimum values because not all molecular tracers necessary to estimate α-pinene
SOC were measured, these percentages are clearly much lower than expected. It
was noted above that the uncertainty that is associated with our estimates is at least
a factor of 2. The laboratory-derived tracer mass fractions (fSOC) reported by
Kleindienst et al. [2007] have a large associated uncertainty and these authors did
their quantification of the tracers in a different manner than was done by us. It is
recommended that the effect of this different quantification is studied in detail. One
may also wonder to what extent the fSOC values of Kleindienst et al. [2007] are
applicable to ambient organic aerosol in various types of environments and different
levels of NOx, oxidants, RH, and other ambient parameters. More laboratory studies
of the fSOC values under various conditions (and also for additional BVOCs) are
therefore recommended. It should also be indicated that Kleindienst et al. [2007] only
performed GC/MS analyses for measuring the tracers. By performing analyses by
LC/MS of both laboratory-generated SOA and field samples various new tracers for
isoprene and terpene SOC were discovered by us in international cooperation with
the US EPA, Caltech, and IfT. It is therefore advisable that besides GC/MS, also
LC/MS and possibly other analyses are performed in future studies on fSOC.
Additional work on the contribution to the organic aerosol for various sites in Europe
was done by P2, who was invited by the Technical University of Vienna (Prof. H.
Puxbaum) to co-operate in a manuscript on research that was carried within the EU-
funded project CARBOSOL. The manuscript [Puxbaum et al., 2007] dealt with the
impact of biomass burning along a traject from West to East (from the Azores to
K-puszta) in Europe. As part of this work P2 also contributed to the development of a
new method for saccharides (including levoglucosan) in aerosol samples. A
manuscript on this work was published [Caseiro et al., 2007]. Furthermore, P2 co-
operated with the Vienna group in assessing the contribution from primary biogenic

Project SD/AT/02 - Formation mechanisms, marker compounds and source apportionment for biogenic atmospheric
aerosols “BIOSOL”
SSD - Science for a Sustainable Development - Atmosphere 92
(biological) particles (i.e., fungal spores) to the organic aerosol. A manuscript on this
work was also published [Bauer et al., 2008].

Project SD/AT/02 - Formation mechanisms, marker compounds and source apportionment for biogenic atmospheric
aerosols “BIOSOL”
SSD - Science for a Sustainable Development - Atmosphere 93
4. POLICY SUPPORT
The project deals with biogenic atmospheric aerosols, their formation mechanisms,
marker compounds for source apportionment, and assessment of the contribution from
the BVOCs to the organic aerosol. Aerosols have both direct and indirect effects on
climate through their scattering and absorption of solar and terrestrial radiation and
through their effects on the formation and lifetime of clouds. It is believed that the net
effect of aerosols (and definitely that of biogenic aerosols) is cooling so that aerosols
counteract to some extent the global warming which results from the greenhouse
gases. However, aerosols also affect human health and welfare and as a consequence
their concentrations should be reduced, at least on local and regional scales where the
population is exposed to the aerosols. The fact that aerosols have both beneficial and
harmful aspects gives rise to a dilemma. Some aerosol types, such as elemental
carbon (black carbon, soot), lead to warming and are also harmful to humans, so that
the concentrations of these aerosols should be reduced. On the other hand, most
biogenic aerosols give rise to cooling and are thought to be not so harmful, so that their
concentrations should not be reduced. In order to take appropriate measures and to
reduce the harmful biosol types, detailed aerosol characterisation (also as a function of
size) and assessment of the contribution of the various aerosol types are needed on
local, regional, and global scales. Consequently, the work performed within this project
contributes to the objectives of policy advisers and policy makers who deal with climate
and human health.
As indicated in a recent SOA status paper, to which C and P2 contributed [Hallquist et
al., 2009], the chemical and physical processes associated with SOA formation are
complex and varied, and, despite considerable progress in recent years, a quantitative
and predictive understanding of SOA formation does not exist and therefore represents
a major research challenge in atmospheric science. Several emerging issues pose
challenges which need to be addressed via a combination of laboratory, field, and
modelling studies. These key issues are briefly discussed below and in more detail in
Hallquist et al. [2009]. It is pointed out that many of the items on the list require faster
and more accurate analytical tools which may open avenues for exploring a wider
range of phenomena. Other major challenges include an improved understanding of the
fundamental processes responsible for SOA formation and how they affect composition
and the design of simulation experiments which more closely reflect the conditions and
complexity of the real atmosphere.
A first issue is that there is large uncertainty associated with the SOA budget. It is
plausible that large sources of organic compounds are yet to be identified. There is also
a need for improved quantification of biogenic SOA (BSOA) in the field. Future highly

Project SD/AT/02 - Formation mechanisms, marker compounds and source apportionment for biogenic atmospheric
aerosols “BIOSOL”
SSD - Science for a Sustainable Development - Atmosphere 94
time-resolved studies should be performed at locations that are expected to be
dominated by BSOA to evaluate the biogenic signal more clearly. Biomass burning is
an important contributor to the organic aerosol on a global scale and has generally
been thought to mainly give rise to primary aerosol. Very recent results indicate that
SOA formation from biomass burning emissions can be very important under some
circumstances and minor in others. Additional field studies are needed to characterise
this potentially important SOA source. With regard to the relative contributions of
modern and fossil fuel sources to the carbonaceous aerosol, there is a discrepancy
between the results from 14C and highly time-resolved studies, whereby the 14C studies
attribute most SOA to modern sources and the highly time-resolved studies point to
anthropogenic pollution as the dominant source. New field studies should strive to
include both types of measurements to allow a more direct comparison and to address
the possibility that the different findings are due to different geographical locations or
times. The potential enhancement of BSOA by anthropogenic pollution needs to be
evaluated in the field by analyzing BSOA formation during periods of high and low
pollution. Bottom-up estimates of SOA formation fluxes rely on data generated from
simulation chamber experiments. However, the yields of SOA from individual
precursors appear to be highly dependent on experimental conditions. Further work is
clearly required to establish the most appropriate parameters for inclusion in global
models. The potential importance of additional sources of SOA (newly discovered and
previously unconsidered precursors, such as acetylene and oxygenated BVOCs)
should be explored.
As a second issue, there is a need for improved understanding of VOC oxidation. The
atmospheric degradation mechanisms for many established SOA precursors (e.g.,
monoterpenes, aromatics) contain a high level of uncertainty, particularly in relation to
the reactivity of certain oxidation products. The role of NO3-initiated chemistry in SOA
formation has largely been neglected and the chemical mechanisms for the
atmospheric degradation of other potential SOA precursors, such as sesquiterpenes,
long-chain alkanes and oxygenated BVOCs, also require improvement. The link
between the fundamental understanding of gas-particle partitioning and its application
to atmospheric or laboratory-generated SOA is complex. Further improvements in the
use of gas-particle partitioning theory to interpret experimental data, obtained in both
laboratory and field studies, are required. The wide range of higher-MW products
detected in laboratory-generated SOA have resulted in many proposed reactions
occurring in the condensed phase. Further work is required to investigate the key
processes (e.g., oligomerization, organosulfate formation) under conditions relevant to
the atmosphere. Chemical and photochemical processes in the atmospheric aqueous
phase may lead to the formation of polyfunctional organic compounds in diluted
droplets, which play an important role in condensation reactions leading to oligomers

Project SD/AT/02 - Formation mechanisms, marker compounds and source apportionment for biogenic atmospheric
aerosols “BIOSOL”
SSD - Science for a Sustainable Development - Atmosphere 95
and SOA when the organic concentrations increase during cloud evaporation. However,
the scientific knowledge of photochemical processes of organics, especially
polyfunctional compounds, in the atmospheric aqueous phases is still quite limited and
needs further investigation. Nucleation of new particles is recognized as a widespread
phenomenon but the exact mechanisms of initiation and growth are not well known. A
major challenge is posed by the minute mass of the nucleation mode particles.
Standing issues include identification of the main nucleating agents, the possible role of
organics in nucleation, and the contribution of organics to the growth mechanism. New
instrumentation dedicated to these issues is urgently required. The missing parameters
need to be studied in different environments (urban, rural, remote locations) in order to
be able to include nucleation in a meaningful manner in models.
A third issue deals with measurements of aerosol composition. Organic aerosol
contains both WSOM and WIOM. WIOM is left mostly under-characterised. Tools for
isolation, characterisation and process studies of this important fraction are therefore
encouraged. Recent field and chamber studies suggest that complex organic matter
may consist of organosulfates, amines, organic nitrates, oligomers, and other higher-
MW compounds. Many of these species remain poorly characterised. Missing
information includes the identity, concentration, formation pathways, and possible roles
in affecting surface tension, optical properties, reactivity, and CCN activity of SOA. New
analytical methods should be developed to extract, identify and quantify these
compounds. While the formation of oligomers has been firmly established in laboratory
experiments, it is still uncertain whether they are formed under ambient conditions.
There are still abundant unknown SOA constituents, even first-generation products
detected in laboratory chamber studies, which are present in ambient and plant
chamber aerosol and need to be structurally elucidated. Given their chemical
complexity, efforts should be made to isolate and purify key species and to establish
their chemical structures, where use could be made of available advanced
multidimensional MS and NMR techniques. The development of measurement
techniques with high time-resolution would be very beneficial especially for mobile
platforms by providing fast measurements of more components, e.g., tracers or
functional groups.
The fourth issue deals with complexity. Many laboratory studies employ simplified
experimental conditions which neglect the environmental complexity. Important factors
often overlooked are presence of water, complex reactant mixture and composition,
and temperature dependence. This limits the ability to extrapolate laboratory-based
data to the atmosphere. With regards to simulation chambers, more complex VOC
mixtures could be employed. An important future development would be to describe the
effect on SOA formation when going from the oxidation of a single precursor to the

Project SD/AT/02 - Formation mechanisms, marker compounds and source apportionment for biogenic atmospheric
aerosols “BIOSOL”
SSD - Science for a Sustainable Development - Atmosphere 96
oxidation of complex mixtures. In the field, SOA from different precursors are mixed.
The laboratory allows for the analysis of specific precursors and thus SOA detection by
different methods can be tested. The laboratory studies should be better linked to the
ambient measurements in future.
A fifth and important issue is the modelling of SOA. It is obvious that modelling activities
must follow experimental and mechanistic understanding, and the most basic problem
regarding modelling of SOA is therefore the uncertainty surrounding the main formation
mechanisms. However, the mechanistic details obtained from experimental and
theoretical work need to be tested in models against ambient data in order to be
considered reliable. It is essential that models reflect the latest findings as well as
possible, and it can be noted that much of the understanding that has emerged over the
past several years concerning the formation of SOA still needs to be incorporated in the
SOA models embedded in atmospheric chemical transport models. The new
developments that need to be reflected in any class of models include sufficiently
detailed gas-phase chemistry, especially the role of NOx level, leading to formation of
semi-volatile products, particulate-phase chemistry, identification of the volatility range
of oxidation products, and the roles of organic aerosol level in determining aerosol
water content. It is evident that laboratory data should preferably reflect conditions
either as close to ambient as possible or which allow confident extrapolation to ambient
conditions. Ambient data must provide information which can be used for source-
apportionment, to evaluate the models emissions, and chemical processing, which will
require some combination of chemical speciation, radiocarbon data and/or functional
group analysis.
The sixth issue deals with the impacts of SOA on health and climate. A recent
epidemiological study reveals a stronger association between daily mortality and fine
particulate air pollution in summer than in winter [Nawrot et al., 2007]. As high PM levels
in summer are typically associated with the production of SOA, this finding suggests
that SOA may substantially contribute to the observed effect on mortality. However,
there are very few studies of the health effects of SOA. Several studies strongly
suggest that BVOCs may be involved in new particle formation in forested
environments. This phenomenon has important implications for climate-biosphere
interactions, and should be further investigated, including the application of recently
developed nanoparticle composition techniques in forested areas. The optical
properties (scattering and absorption) of fresh and aged SOA (pure or in combination
with other species) are not well constrained, hindering assessment of their possible
contribution to the aerosol direct effect. New sensitive techniques should be sought to
measure these missing properties. The complex interaction and influence of SOA in the
formation of clouds could be essential. One crucial point is to establish the influence of

Project SD/AT/02 - Formation mechanisms, marker compounds and source apportionment for biogenic atmospheric
aerosols “BIOSOL”
SSD - Science for a Sustainable Development - Atmosphere 97
SOA on the kinetics and thermodynamics of water uptake. In addition, ice nucleation
and evaporation of water are two processes where the complex mixtures of SOA are
expected to have an impact.
The six issues discussed can be seen as recommendations to policy advisers and
makers for future research on atmospheric aerosols and in particular SOA.
Furthermore, several of the activities mentioned in Chapter 5 below were (and are)
actually contributions to Policy Support.

Project SD/AT/02 - Formation mechanisms, marker compounds and source apportionment for biogenic atmospheric
aerosols “BIOSOL”
SSD - Science for a Sustainable Development - Atmosphere 99
5. DISSIMINATION AND VALORISATION
Dissimination and valorisation of the results of the BIOSOL project was (and is being
done) through various channels, including publications in peer-reviewed international
scientific journals, presentations at national and international workshops and
conferences, organisation of workshops, Follow-up Committee meetings, and joint
meetings with the SSD project IBOOT (Impact of Biogenic emissions on Organic
aerosols and Oxidants in the Troposphere), and other activities.
For the peer-reviewed publications we refer to Chapter 6 below. Here, we only like to
mention that C and P2 co-authored a major overview article entitled “The formation,
properties and impact of secondary organic aerosol: current and emerging issues”
[Hallquist et al., 2009]. With regard to presentations at international conferences and
workshops, many oral and poster presentations on the BIOSOL work were given,
including at the Joint IGAC/CACGP Symposia in 2006 and 2010, the Seventh and
Eighth International Aerosol Conferences (IAC 2006 and IAC 2010), the Aerosols -
Properties, Processes and Climate INTROP-ESF Conference in 2007, the European
Geosciences Union (EGU) General Assemblies of 2007 and 2008, the International
Conferences on Nucleation and Atmospheric aerosols (ICNAA) of 2007 and 2009,
the 4th Gordon Research Conference on Biogenic Hydrocarbons in 2007, the
European Aerosol Conferences (EACs) of 2007, 2008, and 2009, the VOCBAS-
INTROP meeting “Biogenic volatile organic compounds. Sources and fates in a
changing world” in 2007, the 9th International Conference on Carbonaceous Particles
in the Atmosphere (ICCPA) in 2008, and several workshops of the EU project
OOMPH. Some of the presentations were on invitation. As to national meetings, C
presented BIOSOL at the Kick-off meeting of the Belgian Federal Science Policy Office
Programme “Science for Sustainable Development (SSD) (2005-2009)” in March 2007
and at the SSD Encounter “Health and ambient air quality” – Balance of the actions -
dialogue between the parties in June 2009.
C and P2 organised an OOMPH workshop in Ghent in 2007 and P4 (co-)organised
several workshops on research that is related to BIOSOL. As to the BIOSOL Follow-up
Committee meetings, 4 such meetings took place (all at the University of Antwerp), i.e.,
on 20 March and 22 November 2007, on 26 November 2008, and 19 November 2009.
These meetings were only attended by the Belgian members of the Committee (LNE,
VMM, and BIRA-IASB), but with the 4 non-Belgian members (from Greece, Germany,
Finland, and Austria) there were interactions by E-mail, at international conferences or
on other occasions. In July 2007, C and P2 visited IfT (the home institution of the
German Committee member) and in August 2007 C and P2 visited the Finnish

Project SD/AT/02 - Formation mechanisms, marker compounds and source apportionment for biogenic atmospheric
aerosols “BIOSOL”
SSD - Science for a Sustainable Development - Atmosphere 100
Meteorological Institute (the home institution of the Finnish Committee member) and
they had discussions then with the German and Finnish Committee members.
In addition to the Follow-up Committee meetings, there were also formal and other
meetings (and interactions by E-mail) with the partners of the SSD project IBOOT. On
21 November 2006, a technical meeting of the SSD projects BIOSOL and IBOOT was
held at the University of Antwerp, a second BIOSOL-IBOOT meeting took place on 22
November 2007, a third on 26 November 2008, and a fourth on 19 November 2009.
C and P2 gave invited seminars on BIOSOL at the IfT (July 2007) and the University of
Florence (November 2009). In August 2007 and July 2008, C also gave invited
seminars at the University of Helsinki and Desert Research Institute in Reno, Nevada.
Furthermore, C provided input for the MIRA-T 2006 report and contributed to the
EMEP/TFMM PM Assessment report. C also wrote the national contribution from
Belgium for the EMEP/TFMM PM Assessment report [Maenhaut, 2007; see:
http://tarantula.nilu.no/projects/ccc/reports/cccr8-2007.pdf]. On the invitation of the
journal Atmospheric Environment C wrote a New Directions article for this journal
[Maenhaut, 2008]. C provides advice to the VMM with regard to its chemical aerosol
characterisation work and performs analyses for OC and EC on samples from these
activities. C also provides advice to the European Commission with regard to OC and
EC analyses of aerosol samples and he is an expert member of the Belgian Institute
for Normalisation (NBN) and the European Committee for Standardisation, Working
group CEN/TC 264/WG 35; the aim of the Working group is to arrive at a standard
method for measurement of EC and OC deposited on filters.
P2 contributed to (and appeared in) a scientific programme for the Czech TV on
applications of mass spectrometry in environmental and global change research (see:
http://www.ceskatelevize.cz/ivysilani/206411058200032-planeta-veda/). P2 also
provided input for the July 2009 issue of the Science, Technology and Innovation
Projects magazine of British Publishers (see: http://www.projects.eu.com/). On pages
24-25 there is an article on the EU project SOAMASS, which dealt with research that
formed part of BIOSOL.
P2 and P3 taught for doctoral students in an ISONET-VOCBAS Short Course, entitled
“Stable Isotopes, Plant VOCs and Secondary Organic Aerosols in Biosphere-
Atmosphere Carbon Exchange”, which was held in Kuopio, Finland, in November 2006.
In May 2007, a Website was activated for the BIOSOL project. The URL for it is:
http://www.analchem.ugent.be/BIOSOL/

Project SD/AT/02 - Formation mechanisms, marker compounds and source apportionment for biogenic atmospheric
aerosols “BIOSOL”
SSD - Science for a Sustainable Development - Atmosphere 101
6. PUBLICATIONS
Only the articles, which appeared in peer-reviewed international scientific journals
are listed here.
6.1. Publications of the teams
For the team of C
W. Maenhaut.
New Directions: Future needs for global monitoring and research of aerosol chemical
composition.
Atmospheric Environment, 42 (2008) 1070-1072, doi:10.1016/
j.atmosenv.2007.11.038.
PUBLI 1_maenhaut_AE2008.pdf]
W. Maenhaut, N. Raes, X. Chi, J. Cafmeyer and W. Wang.
Chemical composition and mass closure for PM2.5 and PM10 aerosols at K-puszta,
Hungary, in summer 2006.
X-Ray Spectrometry, 37 (2008) 193-197, doi:10.1002/xrs.1062.
PUBLI2_maenhaut_XRS2008.pdf]
I. Salma, T. Mészáros, W. Maenhaut, E. Vass and Zs. Majer.
Chirality and the origin of atmospheric humic-like substances.
Atmospheric Chemistry and Physics, 10 (2010) 1315-1327.
PUBLI 3_salma_acp-10-1315-2010.pdf]
W. Maenhaut, W. Wang and X. Chi.
Semivolatile behaviour and filter sampling artifacts for dicarboxylic acids during
summer campaigns at three forested sites in Europe.
Boreal Environment Research, (2011) in press.
PUBLI 4_maenhaut_BER2011_proof.pdf]
For the team of P2
R. Szmigielski, J.D. Surratt, R. Vermeylen, K. Szmigielska, J.H. Kroll, N.L. Ng, S.M.
Murphy, A. Sorooshian, J.H. Seinfeld and M. Claeys.

Project SD/AT/02 - Formation mechanisms, marker compounds and source apportionment for biogenic atmospheric
aerosols “BIOSOL”
SSD - Science for a Sustainable Development - Atmosphere 102
Characterization of 2-methylglyceric acid oligomers in secondary organic aerosol
formed from the photooxidation of isoprene using trimethylsilylation and gas
chromatography / ion trap mass spectrometry.
Journal of Mass Spectrometry, 42 (2007) 101-116, doi:10.1002/jms.1146.
PUBLI 5_szmigielski_JMS2007.pdf]
J.D. Surratt, J.H. Kroll, T.E. Kleindienst, E.O. Edney, M. Claeys, A. Sorooshian, N.L.
Ng, J.H. Offenberg, M. Lewandowski, M. Jaoui, R.C. Flagan and J.H. Seinfeld.
Evidence for organosulfates in secondary organic aerosol.
Environmental Science and Technology, 41 (2007) 517-527, doi:
10.1021/es062081q.
PUBLI 6_surratt_EST2007_es062081q.pdf]
Y. Iinuma, C. Müller, T. Berndt, O. Böge, M. Claeys and H. Herrmann.
Evidence for the existence of organosulfates from β-pinene ozonolysis in ambient
secondary organic aerosol.
Environmental Science and Technology, 41 (2007) 6678-6683, doi:
10.1021/es070938t.
PUBLI 7_iinuma_es070938t.pdf and
PUBLI 7B_iinuma_es070938tsi20070723_080104.pdf]
H. Puxbaum, A. Caseiro, A. Sánchez-Ochoa, A. Kasper-Giebl, M. Claeys, A.
Gelencsér, S. Preunkert, M. Legrand and C. Pio.
Levoglucosan levels at background sites in Europe for assessing the impact of
biomass combustion on the European aerosol background.
Journal of Geophysical Research, 112, D23S05, doi:10.1029/2006JD008114 (2007).
PUBLI 8_puxbaum_2006JD008114.pdf]
A. Caseiro, I.L. Marr, M. Claeys, A. Kasper-Giebl, H. Puxbaum and C.A. Pio.
Determination of saccharides in atmospheric aerosol using anion-exchange HPLC
and pulsed amperometric detection, Journal of Chromatography A, 1171 (2007) 37-
45.
PUBLI 9_caseiro_CHROMA348058.pdf]
H. Bauer, M. Claeys, R. Vermeylen, E. Schueller, G. Weinke, A. Berger and H.
Puxbaum.
Short communication: Arabitol and mannitol as tracers for the quantification of
airborne fungal spores.
Atmospheric Environment, 42 (2008) 588-593, doi:10.1016/j.atmosenv.2007.10.013.
PUBLI 10_bauer_AE2008.pdf]
Project SD/AT/02 - Formation mechanisms, marker compounds and source apportionment for biogenic atmospheric
aerosols “BIOSOL”
SSD - Science for a Sustainable Development - Atmosphere 103
M. Claeys.
Comment on “Unexpected epoxide formation in the gas-phase photooxidation of
isoprene”
Science 327 (2010) 644-b; doi:10.1126/science.1180942.
PUBLI 11_Claeys_Science2010.pdf]
For the team of P4
M. Dal Maso, L. Sogacheva, P.P. Aalto, I. Riipinen, M. Komppula, P. Tunved, L.
Korhonen, V. Suur-Uski, A. Hirsikko, T. Kurtén, V.-M. Kerminen, H. Lihavainen, Y.
Viisanen, H.-C. Hansson and M. Kulmala.
Aerosol size distribution measurements at four Nordic field stations: identification,
analysis and trajectory analysis of the new particle formation bursts.
Tellus B, 59 (2007) 350-361.
PUBLI 12_dal_maso_tellusB_2007.pdf]
J. Rinne, R. Taipale, T. Markkanen, T.M. Ruuskanen, H. Hellén, M.K. Kajos, T.
Vesala and M. Kulmala.
Hydrocarbon fluxes above a Scots pine forest canopy: measurements and modeling.
Atmospheric Chemistry and Physics 7 (2007) 3361-3372.
PUBLI 13_rinne_acp-7-3361-2007.pdf]
T.M. Ruuskanen, M.K. Kajos, H. Hellén, H. Hakola, V. Tarvainen and J. Rinne.
Volatile organic compound emissions from Siberian larch.
Atmospheric Environment, 41 (2007) 5807-5812.
PUBLI_14ruuskanen_AE2007.pdf]
A. Laaksonen, M. Kulmala, C.D. O'Dowd, J. Joutsensaari, P. Vaattovaara, S.
Mikkonen, K.E.J. Lehtinen, L. Sogacheva, M. Dal Maso, P. Aalto, T. Petäjä, A.
Sogachev, Y.J. Yoon, H. Lihavainen, D. Nilsson, M.C. Facchini, F. Cavalli, S. Fuzzi,
T. Hoffmann, F. Arnold, M. Hanke, K. Sellegri, B. Umann, W. Junkermann, H. Coe,
J.D. Allan, M.R. Alfarra, D.R. Worsnop, M.-L. Riekkola, T. Hyötyläinen and Y.
Viisanen.
The role of VOC oxidation products in continental new particle formation.
Atmospheric Chemistry and Physics, 8 (2008) 2657-2665.
PUBLI 15_laaksonen_acp-8-2657-2008.pdf]

Project SD/AT/02 - Formation mechanisms, marker compounds and source apportionment for biogenic atmospheric
aerosols “BIOSOL”
SSD - Science for a Sustainable Development - Atmosphere 104
R. Taipale, T.M. Ruuskanen, J. Rinne, M.K. Kajos, H. Hakola, T. Pohja and M.
Kulmala.
Technical Note: Quantitative long-term measurements of VOC concentrations by
PTR-MS – measurement, calibration, and volume mixing ratio calculation methods.
Atmospheric Chemistry and Physics, 8 (2008) 6681-6698.
PUBLI 16_taipale_acp-8-6681-2008.pdf]
B. Bonn, M. Kulmala, I. Riipinen, S.-L. Sihto and T.M. Ruuskanen.
How biogenic terpenes govern the correlation between sulfuric acid concentrations
and new particle formation.
Journal of Geophysical Research, 113 (2008) D12209, doi:10.1029/2007JD009327.
PUBLI 17_bonn_2007JD009327.pdf]
L. Sogacheva, L. Saukkonen, E.D. Nilsson, M. Dal Maso, D.M. Schultz, G. de Leeuw
and M. Kulmala.
New aerosol particle formation in different synoptic situations at Hyytiälä, Southern
Finland.
Tellus, 60B (2008) 485-494.
PUBLI 18_sogacheva_tellusB_2008.pdf]
S.-L. Sihto, H. Vuollekoski, J. Leppä, I. Riipinen, V.-M. Kerminen, H. Korhonen,
K.E.J. Lehtinen, M. Boy and M. Kulmala.
Aerosol dynamics simulations on the connection of sulphuric acid and new particle
formation.
Atmospheric Chemistry and Physics, 9 (2009) 2933-2947.
PUBLI 19_sihto_acp-9-2933-2009.pdf]
H.E. Manninen, T. Nieminen, I. Riipinen, T. Yli-Juuti, S. Gagne, E. Asmi, P.P. Aalto,
T. Petaja, V.-M. Kerminen and M. Kulmala.
Charged and total particle formation and growth rates during EUCAARI 2007
campaign in Hyytiälä.
Atmospheric Chemistry and Physics, 9 (2009) 4077-4089.
PUBLI 20_manninen_acp-9-4077-2009.pdf]
H.K. Lappalainen, S. Sevanto, J. Bäck, T.M. Ruuskanen, P. Kolari, R. Taipale, J.
Rinne, M. Kulmala and P. Hari.
Day-time concentrations of biogenic volatile organic compounds in a boreal forest
canopy and their relation to environmental and biological factors.
Atmospheric Chemistry and Physics, 9 (2009) 5447-5459.
PUBLI 21_lappalainen_acp-9-5447-2009.pdf]

Project SD/AT/02 - Formation mechanisms, marker compounds and source apportionment for biogenic atmospheric
aerosols “BIOSOL”
SSD - Science for a Sustainable Development - Atmosphere 105
6.2. Co-publications
For the teams of C and P2
J.D. Surratt, S.M. Murphy, J.H. Kroll, N.L. Ng, L. Hildebrant, A. Sorooshian, R.
Szmigielski, R. Vermeylen, W. Maenhaut, M. Claeys, R.C. Flagan and J.H. Seinfeld.
Chemical composition of secondary organic aerosol formed from the photooxidation
of isoprene.
Journal of Physical Chemistry A, 110 (2006) 9665-9690, doi: 10.1021/jp061734m.
PUBLI 22_surratt_JPhysChemA2006.pdf and
PUBLI 23_surratt_JPhysChemA2006_supp_jpjp061734msi20060320_041133.pdf]
M. Claeys, R. Szmigielski, I. Kourtchev, P. Van der Veken, R. Vermeylen, W.
Maenhaut, M. Jaoui, T. Kleindienst, M. Lewandowski, J.H. Offenberg and E.O.
Edney.
Hydroxydicarboxylic acids: markers for secondary organic aerosol from the
photooxidation of α-pinene.
Environmental Science and Technology, 41 (2007) 1628-1634,
doi:10.1021/es0620181.
PUBLI 24_claeys_EST2007_es0620181.pdf and
PUBLI 25_claeys_EST2007_es0620181si20061204_050930.pdf]
R. Szmigielski, J.D. Surratt, Y. Gómez-González, P. Van der Veken, I. Kourtchev, R.
Vermeylen, F. Blockhuys, M. Jaoui, T.E. Kleindienst, M. Lewandowski, J.H.
Offenberg, E.O. Edney, J.H. Seinfeld, W. Maenhaut and M. Claeys.
3-methyl-1,2,3-butanetricarboxylic acid: An atmospheric tracer for terpene secondary
organic aerosol.
Geophysical Research Letters, 34, L24811, doi:10.1029/2007GL031338 (2007).
PUBLI 26_szmigielski_2007GL031338.pdf]
Y. Gómez-González, J.D. Surratt, F. Cuyckens, R. Szmigielski, R. Vermeylen, M.
Jaoui, M. Lewandowski, J.H. Offenberg, T.E. Kleindienst, E.O. Edney, F. Blockhuys,
C. Van Alsenoy, W. Maenhaut and M. Claeys.
Characterization of organosulfates from the photooxidation of isoprene and
unsaturated fatty acids in ambient aerosol using liquid chromatography/(–
)electrospray ionization mass spectrometry.
Journal of Mass Spectrometry, 43 (2008) 371-382, doi:10.1002/jms.1329.
PUBLI 27_gomez_JMS2008.pdf]

Project SD/AT/02 - Formation mechanisms, marker compounds and source apportionment for biogenic atmospheric
aerosols “BIOSOL”
SSD - Science for a Sustainable Development - Atmosphere 106
J.D. Surratt, Y. Gómez-González, A.W.H. Chan, R. Vermeylen, M. Shahgholi, T.E.
Kleindienst, E.O. Edney, J.H. Offenberg, M. Lewandowski, M. Jaoui, W. Maenhaut,
M. Claeys, R.C. Flagan and J.H. Seinfeld.
Organosulfate formation in biogenic secondary organic aerosol.
Journal of Physical Chemistry A, 112 (2008) 8345-8378, doi:10.1021/jp802310p.
PUBLI 28_surratt_JPhysChem_A_2008.pdf and
PUBLI 29 _surratt_JPhysChem_A_2008_SupportingInformation.pdf]
I. Kourtchev, J. Warnke, W. Maenhaut, T. Hoffmann and M. Claeys.
Polar organic marker compounds in PM2.5 aerosol from a mixed forest site in
western Germany.
Chemosphere, 73 (2008) 1308-1314.
PUBLI 30_kourtchev_chemos2008.pdf]
I. Kourtchev, L. Copolovici, M. Claeys and W. Maenhaut.
Characterization of atmospheric aerosols at a forested site in Central Europe.
Environmental Science and Technology, 43 (2009) 4665-4671.
PUBLI 31_kourtchev_EST2009_es803055w.pdf and
PUBLI 32_kourtchev_EST2009_es803055w_si_001.pdf]
M. Hallquist, J. Wenger, U. Baltensperger, Y. Rudich, D. Simpson, M. Claeys, J.
Dommen, N.M. Donahue, C. George, A.H. Goldstein, J.F. Hamilton, H. Herrmann, T.
Hoffmann, Y. Iinuma, M. Jang, M. Jenkin, J.-L. Jimenez, A. Kiendler-Scharr, W.
Maenhaut, G. McFiggans, T. Mentel, A. Monod, A.S.H. Prévôt, J.H. Seinfeld, J.D.
Surratt, R. Szmigielski and J. Wildt.
The formation, properties and impact of secondary organic aerosol: current and
emerging issues.
Atmospheric Chemistry and Physics, 9 (2009) 5155-5236.
PUBLI 33_hallquist_acp-9-5155-2009.pdf]
M. Claeys, Y. Iinuma, R. Szmigielski, J.D. Surratt, F. Blockhuys, C. Van Alsenoy, O.
Böge, B. Sierau, Y. Gómez-González, R. Vermeylen, P. Van der Veken, M.
Shahgholi, A.W.H. Chan, H. Herrmann, J.H. Seinfeld and W. Maenhaut.
Terpenylic acid and related compounds from the oxidation of α-pinene: Implications
for new particle formation and growth above forests.
Environmental Science and Technology, 43 (2009) 6976-6982.
PUBLI 34_claeys_EST2009_es9007596.pdf and
PUBLI 35_claeys_EST2009_es9007596_si_001.pdf]
Project SD/AT/02 - Formation mechanisms, marker compounds and source apportionment for biogenic atmospheric
aerosols “BIOSOL”
SSD - Science for a Sustainable Development - Atmosphere 107
M. Claeys, W. Wang, R. Vermeylen, I. Kourtchev, X. Chi, Y. Farhat, J.D. Surratt, Y.
Gómez-González, J. Sciare and W. Maenhaut.
Chemical characterisation of marine aerosol at Amsterdam Island during the austral
summer of 2006-2007.
Journal of Aerosol Science, 41 (2010) 13-22.
PUBLI 36_claeys_JASCI2010.pdf]
F. Yasmeen, N. Sauret, J.F. Gal, P.-C. Maria, L. Massi, W. Maenhaut and M. Claeys.
Characterization of oligomers from methylglyoxal under dark conditions: a pathway to
produce secondary organic aerosol through cloud processing during nighttime.
Atmospheric Chemistry and Physics, 10 (2010) 3803-3812.
PUBLI 37_yasmeen_10-3803-2010.pdf and
PUBLI 38_yasmeen_10-3803-2010-supplement.pdf]
F. Yasmeen, R. Vermeylen, R. Szmigielski, Y. Iinuma, O. Böge, H. Herrmann, W.
Maenhaut and M. Claeys.
Terpenylic acid and related compounds: precursors for dimers in secondary organic
aerosol from the ozonolysis of α- and β-pinene.
Atmospheric Chemistry and Physics, 10 (2010) 9383-9392.
PUBLI 39_yasmeen_10-9383-2010.pdf and
PUBLI 40_yasmeen_10-9383-2010-supplement.pdf]
R. Szmigielski, R. Vermeylen, J. Dommen, A. Metzger, W. Maenhaut, U.
Baltensperger and M. Claeys.
The acid effect in the formation of 2-methyltetrols from the photooxidation of isoprene
in the presence of NOx.
Atmospheric Research, 98 (2010) 183-189.
PUBLI 41_szmigielski_AR2010.pdf]
F. Yasmeen, R. Szmigielski, R. Vermeylen, Y. Gómez-González, J.D. Surratt, A.W.H.
Chan, J.H. Seinfeld, W. Maenhaut and M. Claeys.
Mass spectrometric characterization of isomeric terpenoic acids from the oxidation of
α-pinene, β-pinene, d-limonene, and Δ3-carene in fine forest aerosol.
Journal of Mass Spectrometry, (2011) revised version submitted.
PUBLI 42_yasmeen_JMS2011_revised_submitted.pdf]
Project SD/AT/02 - Formation mechanisms, marker compounds and source apportionment for biogenic atmospheric
aerosols “BIOSOL”
SSD - Science for a Sustainable Development - Atmosphere 108
For the teams of C and P4
W. Maenhaut, S. Nava, F. Lucarelli, W. Wang, X. Chi and M. Kulmala.
Chemical composition, impact from biomass burning, and mass closure for PM2.5 and
PM10 aerosols at Hyytiälä, Finland, in summer 2007.
X-Ray Spectrometry, (2011) in press, doi:10.1002/xrs.1302.
PUBLI 43_maenhaut_XRS2011_proof.pdf]
For the teams of C, P2 and P4
I. Kourtchev, T.M. Ruuskanen, P. Keronen, L. Sogacheva, M. Dal Maso, A. Reissell,
X. Chi, R. Vermeylen, M. Kulmala, W. Maenhaut and M. Claeys.
Determination of isoprene and α-/β-pinene oxidation products in boreal forest
aerosols from Hyytiälä, Finland: Diel variations and possible link with particle
formation events.
Plant Biology, 10 (2008) 138-149, doi:10.1055/s-2007-964945.
PUBLI 44_kourtchev_PB2008.pdf]
I. Kourtchev, T.M. Ruuskanen, P. Keronen, L. Sogacheva, M. Dal Maso, A. Reissell,
X. Chi, R. Vermeylen, M. Kulmala, W. Maenhaut and M. Claeys.
Determination of isoprene and α-/β-pinene oxidation products in boreal forest
aerosols from Hyytiälä, Finland (vol 10, pg 138, 2008).
Plant Biology, 10 (2008) 280.
Note: This article is a Corrigendum for the previous article.
PUBLI 45_kourtchev_PB2008_correction.pdf]
For the teams of C, P2, P3 and P4
T. Yli-Juuti, I. Riipinen, P.P. Aalto, T. Nieminen, W. Maenhaut, I.A. Janssens, M.
Claeys, I. Salma, R. Ocskay, A. Hoffer, K. Imre and M. Kulmala.
Characteristics of aerosol particle formation events at K-Puszta, Hungary.
Boreal Environment Research, 14 (2009) 683-698.
PUBLI 47_yli-juuti_ber14-683.pdf]

Project SD/AT/02 - Formation mechanisms, marker compounds and source apportionment for biogenic atmospheric
aerosols “BIOSOL”
SSD - Science for a Sustainable Development - Atmosphere 109
7. ACKNOWLEDGEMENTS
This project was funded by the Belgian Federal Science Policy Office (Belspo).
Financial support was also received from other sources, i.e., the “Fonds voor
Wetenschappelijk Onderzoek - Vlaanderen”, the Special Research Funds of Ghent
University and the University of Antwerp, and the 6th Framework Programme of the
European Commission through the project “Organics over the Ocean Modifying
Particles in both Hemispheres (OOMPH)” (Contract: 018419) and through the Marie
Curie Action project “Characterization of secondary organic aerosol from
photooxidation of isoprene and alpha-pinene with mass spectrometric approaches
(SOAMASS)” (Project No.: 39787). Funds were also received from the European
Commission projects “European Network for Atmospheric Composition Change
(ACCENT)” and EUSAAR for access to the SMEAR II site in 2007 through the
ACCENT programme “Access to Infrastructures”.
For the research team of Willy Maenhaut (C), contributions were provided by Jan
Cafmeyer, Xuguang Chi, Lucian Copolovici, Sheila Dunphy, Mustafa Koçak, Nico
Raes, and Wan Wang. In the team of Magda Claeys (P2), contributions were
provided by Farhat Yasmeen, Yadian Gómez-González, Ivan Kourtchev, Rafal
Szmigielski, Katarzyna Szmigielska, and Reinhilde Vermeylen. Gunter Eerdekens,
Bert Gielen, Katarzyna Szmigielska, and Inge Van de Putte contributed in the team of
Ivan Janssens (P3). And in the team of Markku Kulmala (P4) there were
contributions from Pasi Aalto, Maija Kajos, Petri Keronen, Ella-Maria Kyrö, Heikki
Laakso, Tuomo Nieminen, Jevgeni Parshintsev, Toivo Pohja, Ilona Riipinen, Janne
Rinne, Martta Salonen, Sanna-Liisa Sihto, Henri Vuollekoski, and Taina Yli-Juuti.
We benefited from co-operation with the following universities and institutes:
- Departments of Chemical Engineering and Environmental Science and
Engineering, California Institute of Technology (Caltech), Pasadena, CA, U.S.A.:
J.H. Seinfeld, J.D. Surratt, and others;
- National Exposure Research Laboratory, US Environmental Protection Agency
(EPA), Research Triangle Park, NC, U.S.A.: T.E. Kleindienst, E.O. Edney, and
others;
- Leibniz Institute for Tropospheric Research (IfT), Leipzig, Germany: H. Herrmann, Y.
Iinuma, and others;
- Laboratory of Atmospheric Chemistry, Paul Scherrer Institute (PSI), Villigen,
Switzerland: U. Baltensperger, J. Dommen, and others;
- Department of Physics, University of Kuopio, Kuopio, Finland: J. Joutsensaari and
others;

Project SD/AT/02 - Formation mechanisms, marker compounds and source apportionment for biogenic atmospheric
aerosols “BIOSOL”
SSD - Science for a Sustainable Development - Atmosphere 110
- Department of Earth and Environmental Sciences, University of Pannonia,
Veszprém, Hungary: A. Gelencsér and others;
- Institute of Chemistry, Eötvös University, Budapest, Hungary: I. Salma and co-
workers;
- Institute of Analytical Chemistry, Academy of Sciences of the Czech Republic,
Brno, Czech Republic: Z. Večeřa and co-workers;
- Flemish Research Institute for Nature and Forest (INBO), Geraardsbergen, Belgium:
J. Neirynck and others;
- Atmospheric Chemistry Division, Max Planck Institute for Chemistry (MPIC), Mainz,
Germany: J. Williams and others (and also some other universities and institutions
within the framework of the EU OOMPH project);
- Laboratoire des Sciences du Climat et de l’Environnement (LSCE), Centre des
Faibles Radioactivités, CNRS-CEA, Gif-sur-Yvette, France: J. Sciare and others;
- Department of Chemistry, University of Crete (UoC), Heraklion, Greece: N.
Mihalopoulos and co-workers;
- Institute for Analytical Chemistry, Vienna University of Technology, Vienna, Austria:
H. Puxbaum, H. Bauer, and others;
- Institute for Experimental Physics, University of Vienna, Vienna, Austria: R.
Hitzenberger and co-workers;
- Department of Inorganic and Analytical Chemistry, University of Mainz, Mainz,
Germany: T. Hoffmann and co-workers;
- Department of Physics, University of Florence and INFN, Florence, Italy: F.
Lucarelli and S. Nava.
- Department of Chemistry, University of Antwerp, Antwerp, Belgium: F. Blockhuys
and K. Van Alsenoy;
- Research Team Medicinal Chemistry, Department of Pharmaceutical Sciences,
University of Antwerp, Antwerp, Belgium: P. Van der Veken.
The financial support by the funding agencies and the work and/or assistance of the
internal and external contributors is very much appreciated.
Project SD/AT/02 - Formation mechanisms, marker compounds and source apportionment for biogenic atmospheric
aerosols “BIOSOL”
SSD - Science for a Sustainable Development - Atmosphere 111
8. REFERENCES
Andreae, M.O. 1983. Soot carbon and excess fine potassium - long-range transport of
combustion-derived aerosols, Science, 220: 1148-1151.
Andreae, M.O., C.D. Jones and P.M. Cox. 2005. Strong present-day aerosol cooling
implies a hot future, Nature, 435: 1187-1190.
Arnold, S.R., D.V. Spracklen, J. Williams, N. Yassaa, J. Sciare, B. Bonsang, V. Gros,
I. Peeken, A.C. Lewis, S. Alvain and C. Moulin. 2009. Evaluation of the global
oceanic isoprene source and its impacts on marine organic carbon aerosol,
Atmos. Chem. Phys., 9: 1253-1262.
Baker, A.R. 2004. Inorganic iodine speciation in tropical Atlantic aerosol, Geophys. Res.
Lett., 31: L23S02, doi:10.1029/2004GL020144.
Bauer, H., M. Claeys, R. Vermeylen, E. Schueller, G. Weinke, A. Berger and H.
Puxbaum. 2008. Short communication: Arabitol and mannitol as tracers for the
quantification of airborne fungal spores, Atmos. Environ., 42: 588593.
Birch, M.E. and R.A. Cary. 1996. Elemental carbon-based method for monitoring
occupational exposures to particulate diesel exhaust, Aerosol Sci. Technol., 25:
221-241.
Blokker, P., H. van den Ende, J.W. de Leeuw, G.J.M. Versteegh and J.S. Sinninghe
Damsté. 2006. Chemical fingerprinting of algeanan using RuO4 oxidation, Org.
Geochem., 37: 871-881.
Boy, M., T. Petäjä, M. Dal Maso, Ü. Rannik, J. Rinne, P. Aalto, A. Laaksonen, P.
Vaattovaara, J. Joutsensaari, T. Hoffmann, J. Warnke, M. Apostolaki, E.G.
Stephanou, M. Tsapakis, A. Kouvarakis, C. Pio, A. Carvalho, A. Rompp, G.
Moortgat, C. Spirig, A. Guenther, J. Greenberg, P. Ciccioli and M. Kulmala. 2004.
Overview of the field measurement campaign in Hyytiälä, August 2001 in the
framework of the EU project OSOA, Atmos. Chem. Phys., 4: 657-678.
Boy, M., M. Kulmala, T.M. Ruuskanen, M. Pihlatie, A. Reissell, P.P. Aalto, P. Keronen,
M. Dal Maso, H. Hellen, H. Hakola, R. Jansson, M. Hanke and F. Arnold. 2005.
Sulphuric acid closure and contribution to nucleation mode particle growth, Atmos.
Chem. Phys., 5: 863-878.
Brasseur, G.P., R.G. Prinn and A.A.P. Pszenny (eds.). 2003. Atmospheric Chemistry in
a Changing World: An Integration and Synthesis of a Decade of Tropospheric
Chemistry Research, Springer Verlag, Heidelberg, Germany.
Caseiro, A., I.L. Marr, M. Claeys, A. Kasper-Giebl, H. Puxbaum and C.A. Pio. 2007.
Determination of saccharides in atmospheric aerosol using anion-exchange HPLC
and pulsed amperometric detection, J. Chromatogr. A, 1171: 37-45.
Charlson, R.J., S.E. Schwartz, J.M. Hales, R.D. Cess, J.A. Coakley, J.E. Hansen and
D.J. Hofmann. 1992. Climate forcing by anthropogenic aerosols, Science, 255: 423-
430.
Project SD/AT/02 - Formation mechanisms, marker compounds and source apportionment for biogenic atmospheric
aerosols “BIOSOL”
SSD - Science for a Sustainable Development - Atmosphere 112
Chi, X. and W. Maenhaut. 2008. Water-soluble organic carbon in PM2.5 at some
urban and forested sites in Europe, In: Abstract Book of the 9th International
Conference on Carbonaceous Particles in the Atmosphere (ICCPA), 12-14 August
2008, Lawrence Berkeley National Laboratory, Berkeley, CA, U.S.A., 1 page.
Claeys, M., B. Graham, G. Vas, W. Wang, R. Vermeylen, V. Pashynska, J.
Cafmeyer, P. Guyon, M.O. Andreae, P. Artaxo and W. Maenhaut. 2004a.
Formation of secondary organic aerosols through photooxidation of isoprene,
Science, 303: 1173-1176.
Claeys, M., W. Wang, A.C. Ion, I. Kourtchev, A. Gelencsér and W. Maenhaut. 2004b.
Formation of secondary organic aerosols from isoprene and its gas-phase
oxidation products through reaction with hydrogen peroxide, Atmos. Environ., 38:
4093-4098.
Claeys, M., R. Szmigielski, I. Kourtchev, P. Van der Veken, R. Vermeylen, W.
Maenhaut, M. Jaoui, T. Kleindienst, M. Lewandowski, J.H. Offenberg and E.O.
Edney. 2007. Hydroxydicarboxylic acids: markers for secondary organic aerosol
from the photooxidation of α-pinene, Environ. Sci. Technol., 41: 1628-1634.
Claeys, M., Y. Iinuma, R. Szmigielski, J.D. Surratt, F. Blockhuys, C. Van Alsenoy, O.
Böge, B. Sierau, Y. Gómez-González, R. Vermeylen, P. Van der Veken, M.
Shahgholi, A.W.H. Chan, H. Herrmann, J.H. Seinfeld and W. Maenhaut. 2009.
Terpenylic acid and related compounds from the oxidation of α-pinene:
Implications for new particle formation and growth above forests, Environ. Sci.
Technol., 43: 6976-6982.
Dal Maso, M., M. Kulmala, I. Riipinen, R. Wagner, T. Hussein, P. Aalto and K.
Lehtinen. 2005. Formation and growth of fresh atmospheric aerosols: eight years
of aerosol size distribution data from SMEAR II, Hyytiälä, Finland, Boreal Env.
Res., 10: 323-336.
Edney, E.O., T.E. Kleindienst, M. Jaoui, M. Lewandowski, J.H. Offenberg, W. Wang
and M. Claeys. 2005. Formation of 2-methyl tetrols and 2-methylglyceric acid in
secondary organic aerosol from laboratory irradiated isoprene/NOx/SO2/air
mixtures and their detection in ambient PM2.5 samples collected in the eastern
United States, Atmos. Environ., 39: 5281-5289.
Ezat, U. and F. Dulac. 1995. Size distribution of mineral aerosols at Amsterdam
Island and dry deposition rates in the southern Indian Ocean, C.R. Acad. Sci., Ser.
II, 320: 9-14.
Facchini, M.C., M. Rinaldi, S. Decesari, C. Carbone, E. Finessi, M. Mircea, S. Fuzzi,
D. Ceburnis, R. Flanagan, E.D. Nilsson, G. de Leeuw, M. Martino, J. Woeltjen and
C.D. O’Dowd. 2008. Primary submicron marine aerosol dominated by insoluble
organic colloids and aggregates, Geophys. Res. Lett., 35: L17814,
doi:10.1029/2008GL034210.

Project SD/AT/02 - Formation mechanisms, marker compounds and source apportionment for biogenic atmospheric
aerosols “BIOSOL”
SSD - Science for a Sustainable Development - Atmosphere 113
Feczko, T., H. Puxbaum, A. Kasper-Giebl, M. Handler, A. Limbeck, A. Gelencsér, C.
Pio, S. Preunkert and M. Legrand. 2007. Determination of water and alkaline
extractable atmospheric humic-like substances with the TU Vienna HULIS
analyzer in samples from six background sites in Europe, J. Geophys. Res., 112:
D23S10, doi:10.1029/2006JD008331.
Gómez-González, Y., J.D. Surratt, F. Cuyckens, R. Szmigielski, R. Vermeylen, M.
Jaoui, M. Lewandowski, J.H. Offenberg, T.E. Kleindienst, E.O. Edney, F. Blockhuys,
C. Van Alsenoy, W. Maenhaut and M. Claeys. 2008. Characterization of
organosulfates from the photooxidation of isoprene and unsaturated fatty acids in
ambient aerosol using liquid chromatography/(–)electrospray ionization mass
spectrometry, J. Mass Spectrom., 43: 371-382.
Gondwe, M., M. Krol, W. Klaassen, W. Gieskes and H. de Baar. 2004. Comparison
of modeled versus measured MSA:nss SO4= ratios: A global analysis, Global
Biogeochem. Cycles, 18: GB2006, doi:10.1029/2003GB002144.
Granier, C., G. Pétron, J.-F. Müller and G. Brasseur. 2000. The impact of natural and
anthropogenic hydrocarbons on the tropospheric budget of carbon monoxide,
Atmos. Environ., 34: 5255-5270.
Griffin, R.J., D.R. Cocker, J.H. Seinfeld and D. Dabdub. 1999. Estimate of global
atmospheric organic aerosol from oxidation of biogenic hydrocarbons, Geophys.
Res. Lett., 26: 2721-2724.
Guenther, A., C.N. Hewitt, D. Erickson, R. Fall, C. Geron, T. Graedel, P. Harley, L.
Klinger, M. Lerdau, W.A. Mckay, T. Pierce, B. Scholes, R. Steinbrecher, R.
Tallamraju, J. Taylor and P. Zimmerman. 1995. A global-model of natural volatile
organic-compound emissions, J. Geophys. Res., 100: 8873-8892.
Hallquist, M., J. Wenger, U. Baltensperger, Y. Rudich, D. Simpson, M. Claeys, J.
Dommen, N.M. Donahue, C. George, A.H. Goldstein, J.F. Hamilton, H. Herrmann,
T. Hoffmann, Y. Iinuma, M. Jang, M. Jenkin, J.-L. Jimenez, A. Kiendler-Scharr, W.
Maenhaut, G. McFiggans, T. Mentel, A. Monod, A.S.H. Prévôt, J.H. Seinfeld, J.D.
Surratt, R. Szmigielski and J. Wildt. 2009. The formation, properties and impact of
secondary organic aerosol: current and emerging issues, Atmos. Chem. Phys., 9:
5155-5236.
Hering, S.V. and S.K. Friedlander. 1982. Origins of aerosol sulfur size distributions in
the Los-Angeles basin, Atmos. Environ., 16: 2647-2656.
Hering, S., A. Eldering and J.H. Seinfeld. 1997. Bimodal character of accumulation
mode aerosol mass distributions in Southern California, Atmos. Environ., 31: 1-11.
Hirsikko, A., L. Laakso, U. Hõrrak, P. Aalto, V.-M. Kerminen and M. Kulmala. 2005.
Annual and size dependent variation of growth rates and ion concentration in
boreal forest, Boreal Env. Res., 10: 357-369.
Project SD/AT/02 - Formation mechanisms, marker compounds and source apportionment for biogenic atmospheric
aerosols “BIOSOL”
SSD - Science for a Sustainable Development - Atmosphere 114
Hoffmann, T., J.R. Odum, F. Bowman, D. Collins, D. Klockow, R.C. Flagan and J.H.
Seinfeld. 1997. Formation of organic aerosols from the oxidation of biogenic
hydrocarbons, J. Atmos. Chem., 26: 189-222.
Holzinger, R., A. Lee, K.T. Paw and A.H. Goldstein. 2005. Observations of oxidation
products above a forest imply biogenic emissions of very reactive compounds,
Atmos. Chem. Phys., 5: 67-75.
Hu, D., Q. Bian, T.W.Y. Li, A.K.H. Lau and J.Z. Yu. 2008. Contributions of isoprene,
monoterpenes, β-caryophyllene, and toluene to secondary organic aerosol in
Hong Kong during the summer of 2006, J. Geophys. Res., 113: D22206,
doi:10.1029/2008JD0/0437.
Iinuma, Y., O. Böge, T. Gnauk and H. Herrmann. 2004. Aerosol-chamber study of the
alpha-pinene/O3 reaction: influence of particle acidity on aerosol yields and products,
Atmos. Environ., 38: 761-773.
Iinuma, Y., C. Müller, T. Berndt, O. Böge, M. Claeys and H. Herrmann. 2007.
Evidence for the existence of organosulfates from β-pinene ozonolysis in ambient
secondary organic aerosol, Environ. Sci. Technol., 41: 6678-6683.
Ion, A.C., R. Vermeylen, I. Kourtchev, J. Cafmeyer, X. Chi, A. Gelencsér, W.
Maenhaut and M. Claeys. 2005. Polar organic compounds in rural PM2.5 aerosols
from K-puszta, Hungary, during a 2003 summer field campaign: sources and diel
variations, Atmos. Chem. Phys., 5: 1805-1814.
IPCC 2001. Climate Change 2001: The Scientific Basis. Contribution of Working Group
I to the Third Assessment Report of the Intergovernmental Panel on Climate
Change, Houghton, J.T. et al. (eds.). Cambridge Univ. Press, Cambridge.
IPCC 2007. Climate Change 2007 - The Physical Science Basis. Contribution of
Working Group I to the Fourth Assessment Report of the Intergovernmental Panel on
Climate Change, Solomon, S. et al. (eds.). Cambridge Univ. Press, Cambridge,
United Kingdom and New York, NY.
Jang, M.S., N.M. Czoschke, S. Lee and R.M. Kamens. 2002. Heterogeneous
atmospheric aerosol production by acid-catalyzed particle-phase reactions, Science,
298: 814-817.
John, W., S.M. Wall, J.L. Ondo and W. Winklmayr. 1990. Modes in the size
distributions of atmospheric inorganic aerosol, Atmos. Environ., A24: 2349-2359.
Kanakidou, M., J.H. Seinfeld, S.N. Pandis, I. Barnes, F.J. Dentener, M.C. Facchini, R.
Van Dingenen, B. Ervens, A. Nenes, C.J. Nielsen, E. Swietlicki, J.P. Putaud, Y.
Balkanski, S. Fuzzi, J. Horth, G.K. Moortgat, R. Winterhalter, C.E.L. Myhre, K.
Tsigaridis, E. Vignati, E.G. Stephanou and J. Wilson. 2005. Organic aerosol and
global climate modelling: a review, Atmos. Chem. Phys., 5: 1053-1123.
Kawamura, K. 1993. Identification of C2-C10 ω-oxocarboxylic acids, pyruvic acid, and
C2-C3 α-dicarbonyls in wet precipitation and aerosol samples by capillary GC and
GC/MS, Anal. Chem., 65: 3505-3511.
Project SD/AT/02 - Formation mechanisms, marker compounds and source apportionment for biogenic atmospheric
aerosols “BIOSOL”
SSD - Science for a Sustainable Development - Atmosphere 115
Kawamura, K. and K. Ikushima. 1993. Seasonal changes in the distribution of
dicarboxylic acids in the urban atmosphere, Environ. Sci. Technol., 27: 2227-2235.
Kawamura, K. and F. Sakaguchi. 1999. Molecular distributions of water soluble
dicarboxylic acids in marine aerosols over the Pacific Ocean including tropics, J.
Geophys. Res., 104: 3501-3509.
Kerminen, V.M. and A.S. Wexler. 1995. Growth laws for atmospheric aerosol-
particles - an examination of the bimodality of the accumulation-mode, Atmos.
Environ., 29: 3263-3275.
Kleindienst, T.E., M. Jaoui, M. Lewandowski, J.H. Offenberg, C.W. Lewis, P.V. Bhave
and E.O. Edney. 2007. Estimates of the contributions of biogenic and anthropogenic
hydrocarbons to secondary organic aerosol at a southeastern US location, Atmos.
Environ., 41: 8288-8300.
Korhonen, H., K.E.J. Lehtinen and M. Kulmala. 2004. Multicomponent aerosol
dynamics model UHMA: model development and validation, Atmos. Chem. Phys., 4:
757-771.
Kourtchev, I., T. Ruuskanen, W. Maenhaut, M. Kulmala and M. Claeys. 2005.
Observation of 2-methyltetrols and related photo-oxidation products of isoprene in
boreal forest aerosols from Hyytiälä, Finland, Atmos. Chem. Phys., 5: 2761-2770.
Kourtchev, I., T.M. Ruuskanen, P. Keronen, L. Sogacheva, M. Dal Maso, A. Reissell, X.
Chi, R. Vermeylen, M. Kulmala, W. Maenhaut and M. Claeys. 2008a. Determination
of isoprene and α-/β-pinene oxidation products in boreal forest aerosols from
Hyytiälä, Finland: Diel variations and possible link with particle formation events,
Plant Biology, 10: 138-149.
Kourtchev, I., T.M. Ruuskanen, P. Keronen, L. Sogacheva, M. Dal Maso, A. Reissell, X.
Chi, R. Vermeylen, M. Kulmala, W. Maenhaut and M. Claeys. 2008b. Determination
of isoprene and α-/β-pinene oxidation products in boreal forest aerosols from
Hyytiälä, Finland (vol 10, pg 138, 2008), Plant Biology, 10: 280. [NOTE: this paper
contains corrections for Kourtchev et al., 2008a].
Kourtchev, I., J. Warnke, W. Maenhaut, T. Hoffmann and M. Claeys. 2008c. Polar
organic marker compounds in PM2.5 aerosol from a mixed forest site in western
Germany, Chemosphere, 73: 1308-1314.
Kourtchev, I., L. Copolovici, M. Claeys and W. Maenhaut. 2009. Characterization of
atmospheric aerosols at a forested site in Central Europe, Environ. Sci. Technol.,
43: 4665-4671.
Kubátová, A., R. Vermeylen, M. Claeys, J. Cafmeyer and W. Maenhaut. 2002.
Organic compounds in urban aerosols from Gent, Belgium: Characterization,
sources, and seasonal differences, J. Geophys. Res., 107(D21): 8343,
doi:10.1029/2001JD000556.
Project SD/AT/02 - Formation mechanisms, marker compounds and source apportionment for biogenic atmospheric
aerosols “BIOSOL”
SSD - Science for a Sustainable Development - Atmosphere 116
Kulmala, M., H. Vehkamaki, T. Petäjä, M. Dal Maso, A. Lauri, V.M. Kerminen, W. Birmili
and P.H. McMurry. 2004a. Formation and growth rates of ultrafine atmospheric
particles: a review of observations, J. Aerosol Sci., 35: 143-176.
Kulmala, M., T. Suni, K.E.J. Lehtinen, M. Dal Maso, M. Boy, A. Reissell, Ü. Rannik,
P.P. Aalto, P. Keronen, H. Hakola, J. Bäck, T. Hoffmann, T. Vesala and P. Hari.
2004b. A new feedback mechanism linking forests, aerosols, and climate, Atmos.
Chem. Phys., 4: 557-562.
Kulmala, M., L. Laakso, K.E.J. Lehtinen, I. Riipinen, M. Dal Maso, T. Anttila, V.-M.
Kerminen, U. Hõrrak, M. Vana and H. Tammet. 2004c. Initial steps of aerosol
growth, Atmos. Chem. Phys., 4: 2553-2560.
Kulmala, M., K.E.J. Lehtinen and A. Laaksonen. 2006. Cluster activation theory as an
explanation of the linear dependence between formation rate of 3 nm particles and
sulphuric acid concentration, Atmos. Chem. Phys., 6: 787-793.
Kuokka, S., K. Teinila, K. Saarnio, M. Aurela, M. Sillanpaa, R. Hillamo, V.-M. Kerminen,
K. Pyy, E. Vartiainen, M. Kulmala, A.I. Skorokhod, N.F. Elansky and I.B. Belikov.
2007. Using a moving measurement platform for determining the chemical
composition of atmospheric aerosols between Moscow and Vladivostok, Atmos.
Chem. Phys., 7: 4793-4805.
Laakso, L., T. Anttila, K.E.J. Lehtinen, P.P. Aalto, M. Kulmala, U. Horrak, J. Paatero, M.
Hanke and F. Arnold. 2004. Kinetic nucleation and ions in boreal forest particle
formation events, Atmos. Chem. Phys., 4: 2353-2366.
Lappalainen, H.K., S. Sevanto, J. Bäck, T.M. Ruuskanen, P. Kolari, R. Taipale, J.
Rinne, M. Kulmala and P. Hari. 2009. Day-time concentrations of biogenic volatile
organic compounds in a boreal forest canopy and their relation to environmental
and biological factors, Atmos. Chem. Phys., 9: 5447-5459.
Leck, C. and E.K. Bigg. 2005a. Biogenic particles in the surface microlayer and
overlaying atmosphere in the central Arctic Ocean during summer, Tellus, 57B:
305-316.
Leck, C. and E.K. Bigg. 2005b. Evolution of the marine aerosol – a new perspective,
Geophys. Res. Lett., 32: L19803, doi:10.1029/2005GL023651.
Leck, C. and E.K. Bigg, 2008. Comparison of sources and nature of the tropical
aerosol with the summer high Arctic aerosol, Tellus, 60B: 118-126.
Lehtinen, K.E.J. and M. Kulmala. 2003. A model for particle formation and growth in the
atmosphere with molecular resolution in size, Atmos. Chem. Phys., 3: 251-257.
Lewandowski, M., M. Jaoui, J.H. Offenberg, T.E. Kleindienst, E.O. Edney, R.J.
Sheesley and J.J. Schauer. 2008. Primary and secondary contributions to ambient
PM in the midwestern United States, Environ. Sci. Technol., 42: 3303-3309.
Limbeck, A., H. Puxbaum, L. Otter and M.C. Scholes. 2001. Semivolatile behavior of
dicarboxylic acids and other polar organic species at a rural background site
(Nylsvley, RSA), Atmos. Environ., 35: 1853-1862.

Project SD/AT/02 - Formation mechanisms, marker compounds and source apportionment for biogenic atmospheric
aerosols “BIOSOL”
SSD - Science for a Sustainable Development - Atmosphere 117
Limbeck, A., M. Kulmala and H. Puxbaum. 2003. Secondary organic aerosol formation
in the atmosphere via heterogeneous reaction of gaseous isoprene on acidic
particles, Geophys. Res. Lett., 30 (19): 1996, doi:10.1029/2003GL017738.
Lindinger, W., A. Hansel and A. Jordan. 1998. On-line monitoring of volatile organic
compounds at pptv levels by means of proton-transfer-reaction mass spectrometry
(PTR-MS) - Medical applications, food control and environmental research, Int. J.
Mass Spectrom., 173: 191-241.
Lupu, A. and W. Maenhaut. 2002. Application and comparison of two statistical
trajectory techniques for identification of source regions of atmospheric aerosol
species, Atmos. Environ., 36: 5607-5618.
Lyubovtseva, Y.S., L. Sogacheva, M. Dal Maso, B. Bonn, P. Keronen and M.
Kulmala. 2005. Seasonal variations of trace gases, meteorological parameters,
and formation of aerosols in boreal forest, Boreal Env. Res., 10: 493-510.
Mader, B.T., J.J. Schauer, J.H. Seinfeld, R.C. Flagan, J.Z. Yu, H. Yang, H.J. Lim,
B.J. Turpin, J.T. Deminter, G. Heidemann, M.S. Bae, P. Quinn, T. Bates, D.J.
Eatough, B.J. Huebert, T. Bertram and S. Howell. 2003. Sampling methods used
for the collection of particle-phase organic and elemental carbon during ACE-Asia,
Atmos. Environ., 37: 1435-1449.
Maenhaut, W. 2007. Atmospheric particulate matter in Belgium, In: EMEP Particulate
Matter Assessment Report, Aas, W., P. Bruckmann, R. Derwent, N. Poisson, J.-P.
Putaud, L. Rouil, S. Vidic and K.-E. Yttri (eds.). EMEP/CCC-Report 8/2007, O-7726,
Norwegian Institute for Air Research, Kjeller, Norway, pp. 95-108.
Maenhaut, W. 2008. New Directions: Future needs for global monitoring and research
of aerosol chemical composition, Atmos. Environ., 42: 1070-1072.
Maenhaut, W. and M. Claeys. 2007. Characterisation and sources of carbonaceous
atmospheric aerosols, Belgian Science Policy, Scientific Support Plan for a
Sustainable Development Policy (SPSD II), Research Project EV/11, Final report, 92
pages. (D/2007/1191/52).
Maenhaut, W., R. Hillamo, T. Mäkelä, J.L. Jaffrezo, M.H. Bergin and C.I. Davidson.
1996a. A new cascade impactor for aerosol sampling with subsequent PIXE
analysis, Nucl. Instr. and Meth., B109/110: 482-487.
Maenhaut, W., I. Salma, J. Cafmeyer, H.J. Annegarn and M.O. Andreae. 1996b.
Regional atmospheric aerosol composition and sources in the eastern Transvaal,
South Africa, and impact of biomass burning, J Geophys. Res., 101: 23631-23650.
Maenhaut, W., X. Chi, J. Cafmeyer, I. Salma, P. Mikuška, A. Broškovičová and Z.
Večeřa. 2004. Investigations during summer field campaigns in central Europe on
the performance of a diffusion denuder for the elimination of sampling artifacts for
carbonaceous aerosols, J. Aerosol Sci., Abstracts of the European Aerosol
Conference 2004: S1069-S1070.
Project SD/AT/02 - Formation mechanisms, marker compounds and source apportionment for biogenic atmospheric
aerosols “BIOSOL”
SSD - Science for a Sustainable Development - Atmosphere 118
Maenhaut, W., N. Raes, X. Chi, J. Cafmeyer and W. Wang. 2008. Chemical
composition and mass closure for PM2.5 and PM10 aerosols at K-puszta, Hungary,
in summer 2006, X-Ray Spectrom., 37: 193-197.
Maenhaut, W., S. Nava, F. Lucarelli, W. Wang, X. Chi and M. Kulmala. 2011.
Chemical composition, impact from biomass burning, and mass closure for PM2.5
and PM10 aerosols at Hyytiälä, Finland, in summer 2007, X-Ray Spectrom., in
press, doi:10.1002/xrs.1302.
Mäkelä, J.M., P. Aalto, V. Jokinen, T. Pohja, A. Nissinen, S. Palmroth, T. Markkanen, K.
Seitsonen, H. Lihavainen and M. Kulmala. 1997. Observations of ultrafine aerosol
particle formation and growth in boreal forest, Geophys. Res. Lett., 24: 1219-1222.
Marple, V.A., K.L. Rubow and S.M. Behm. 1991. A microorifice uniform deposit
impactor (MOUDI): description, calibration and use, Aerosol Sci. Technol., 14:
434-446.
Matsumoto, G.I., K. Watanuki and T. Torii. 1988. Hydroxy acids in Antarctic lake
sediments and their geochemical significance, Org. Geochem., 13: 785-790.
Matsunaga, S., M. Mochida and K. Kawamura. 2003. Growth of organic aerosols by
biogenic semi-volatile carbonyls in the forestal atmosphere, Atmos. Environ., 37:
2045-2050.
Meng, Z.Y. and J.H. Seinfeld, 1994. On the source of the submicrometer droplet
mode of urban and regional aerosols, Aerosol Sci. Technol., 20: 253-265.
Meskhidze, N. and A. Nenes. 2006. Phytoplankton and cloudiness in the Southern
Ocean, Science, 314: 1419-1423.
Mikuška, P., Z. Večeřa, A. Broškovičová, M. Stepán, X. Chi and W. Maenhaut. 2003.
Development of a diffusion denuder for the elimination of sampling artifacts for
carbonaceous aerosols, J. Aerosol Sci., Abstracts of the European Aerosol
Conference 2003: S761-S762. (ISSN: 0021-8502).
Nawrot, T.S., R. Torfs, F. Fierens, S. De Henauw, P.H. Hoet, G. van Kersschaever, G.
de Backer and B. Nemery. 2007. Stronger associations between daily mortality and
fine particulate air pollution in summer than in winter: evidence from a heavily
polluted region in western Europe, J. Epidemiol. Commun. H., 61: 146-149.
Novakov, T. and J.E. Penner. 1993. Large contribution of organic aerosols to cloud-
condensation-nuclei concentrations, Nature, 365: 823-826.
O’Dowd, C.D., P. Aalto, K. Hameri, M. Kulmala and T. Hoffmann. 2002. Aerosol
formation - Atmospheric particles from organic vapours, Nature, 416: 497-498.
O’Dowd, C.D., M.C. Facchini, F. Cavalli, D. Ceburnis, M. Mircea, S. Decesari, S.
Fuzzi, Y.J. Yoon and J.-P. Putaud. 2004. Biogenically driven organic contribution
to marine aerosol, Nature, 431: 676-680.
Pandis, S.N., S.E. Paulson, J.H. Seinfeld and R.C. Flagan. 1991. Aerosol formation in
the photooxidation of isoprene and beta-pinene, Atmos. Environ., 25A: 997-1008.
Project SD/AT/02 - Formation mechanisms, marker compounds and source apportionment for biogenic atmospheric
aerosols “BIOSOL”
SSD - Science for a Sustainable Development - Atmosphere 119
Paulsen, D., J. Dommen, M. Kalberer, A.S.H. Prevot, R. Richter, M. Sax, M.
Steinbacher, E. Weingartner and U. Baltensperger. 2005. Secondary organic aerosol
formation by irradiation of 1,3,5-trimethylbenzene-NOx-H2O in a new reaction
chamber for atmospheric chemistry and physics, Environ. Sci. Technol., 39: 2668-
2678.
Penner, J.E. et al. 2001. Aerosols, their direct and indirect effects, In: Climate Change
2001: The Scientific Basis. Contribution of Working Group I to the Third Assessment
Report of the Intergovernmental Panel on Climate Change, Houghton, J.T. et al.
(eds.). Cambridge Univ. Press, Cambridge.
Pirjola, L. 1999. Effects of the increased UV radiation and biogenic VOC emissions on
ultrafine sulphate aerosol formation, J. Aerosol Sci., 30: 355-367.
Putaud, J.-P., F. Raes, R. Van Dingenen, U. Baltensperger, E. Brüggemann, M.-C.
Facchini, S. Decesari, S. Fuzzi, R. Gehrig, C. Hüglin, P. Laj, G. Lorbeer, W.
Maenhaut, N. Mihalopoulos, K. Müller, X. Querol, S. Rodriguez, J. Schneider, G.
Spindler, H. ten Brink, K. Tørseth and A. Wiedensohler. 2004. A European Aerosol
Phenomenology. 2: chemical characteristics of particulate matter at kerbside,
urban, rural and background sites in Europe, Atmos. Environ., 38: 2579-2595.
Puxbaum, H., A. Caseiro, A. Sánchez-Ochoa, A. Kasper-Giebl, M. Claeys, A.
Gelencsér, S. Preunkert, M. Legrand and C. Pio. 2007. Levoglucosan levels at
background sites in Europe for assessing the impact of biomass combustion on the
European aerosol background, J. Geophys. Res., 112: D23S05,
doi:10.1029/2006JD008114.
Ricard, V., J.-L. Jaffrezo, V.-M. Kerminen, R.E. Hillamo, K. Teinila and W. Maenhaut.
2002. Size distributions and modal parameters of aerosol constituents in northern
Finland during the European Arctic Aerosol Study, J. Geophys. Res., 107(D14):
4208, doi:10.1029/2001JD001130.
Riley, J.P. and R. Chester. 1971. Introduction to Marine Chemistry, Academic, New
York, 465 pages.
Salma, I., R. Ocskay, N. Raes and W. Maenhaut. 2005. Fine structure of mass size
distributions in urban environment, Atmos. Environ., 39: 5363-5374.
Saltzman, E.S., D.L. Savoie, J.M. Prospero and R.G. Zika. 1986. Methanesulfonic acid
and non-sea-salt sulfate in Pacific air: regional and seasonal variations, J. Atmos.
Chem., 4: 227-240.
Saxena, P. and L.M. Hildemann. 1996. Water-soluble organics in atmospheric
particles: A critical review of the literature and application of thermodynamics to
identify candidate compounds, J. Atmos. Chem., 24: 57-109.
Schmidl, C., L.L. Marr, A. Caseiro, P. Kotianova, A. Berner, H. Bauer, A. Kasper-
Giebl and H. Puxbaum. 2008. Chemical characterisation of fine particle emissions
from wood stove combustion of common woods growing in mid-European Alpine
regions, Atmos. Environ., 42: 126-141.

Project SD/AT/02 - Formation mechanisms, marker compounds and source apportionment for biogenic atmospheric
aerosols “BIOSOL”
SSD - Science for a Sustainable Development - Atmosphere 120
Sihto, S.L., M. Kulmala, V.M. Kerminen, M. Dal Maso, T. Petäjä, I. Riipinen, H.
Korhonen, F. Arnold, R. Janson, M. Boy, A. Laaksonen and K.E.J. Lehtinen. 2006.
Atmospheric sulphuric acid and aerosol formation: implications from atmospheric
measurements for nucleation and early growth mechanisms, Atmos. Chem. Phys.,
6: 4079-4091.
Solomon, P.A., personal communication, 2008.
Solomon, P.A., J.L. Moyers and R.A. Fletcher. 1983. High-volume dichotomous
sampler virtual impactor for the fractionation and collection of particles according
to aerodynamic size, Aerosol Sci. Technol., 2: 455-464.
Stelson, A.W. and J.H. Seinfeld.1982. Relative-humidity and temperature-dependence
of the ammonium-nitrate dissociation-constant, Atmos. Environ., 16: 983-992.
Suni, T., M. Kulmala, A. Hirsikko, T. Bergman, L. Laakso, P. Aalto, R. Leuning, H.
Cleugh, S. Zegelin, D. Hughes, E. van Gorsel, M. Kitchen, M. Vana, U. Hõrrak, S.
Mirme, A. Mirme, S. Sevanto, J. Twining and C. Tadros. 2008. Formation and
characteristics of ions and charged aerosol particles in a native Australian
Eucalypt forest, Atmos. Chem. Phys., 8: 129-139.
Surratt, J.D., S.M. Murphy, J.H. Kroll, N.L. Ng, L. Hildebrant, A. Sorooshian, R.
Szmigielski, R. Vermeylen, W. Maenhaut, M. Claeys, R.C. Flagan and J.H. Seinfeld.
2006. Chemical composition of secondary organic aerosol formed from the
photooxidation of isoprene, J. Phys. Chem. A, 110: 9665-9690.
Surratt, J.D., J.H. Kroll, T.E. Kleindienst, E.O. Edney, M. Claeys, A. Sorooshian, N.L.
Ng, J.H. Offenberg, M. Lewandowski, M. Jaoui, R.C. Flagan and J.H. Seinfeld. 2007.
Evidence for organosulfates in secondary organic aerosol, Environ. Sci. Technol.,
41: 517-527.
Surratt, J.D., Y. Gómez-González, A.W.H. Chan, R. Vermeylen, M. Shahgholi, T.E.
Kleindienst, E.O. Edney, J.H. Offenberg, M. Lewandowski, M. Jaoui, W.
Maenhaut, M. Claeys, R.C. Flagan and J.H. Seinfeld. 2008. Organosulfate
formation in biogenic secondary organic aerosol, J. Phys. Chem. A, 112: 8345-
8378.
Szmigielski, R., J.D. Surratt, R. Vermeylen, K. Szmigielska, J.H. Kroll, N.L. Ng, S.M.
Murphy, A. Sorooshian, J.H. Seinfeld and M. Claeys. 2007a. Characterization of
2-methylglyceric acid oligomers in secondary organic aerosol formed from the
photooxidation of isoprene using trimethylsilylation and gas chromatography / ion
trap mass spectrometry, J. Mass Spectrom., 42: 101-116.
Szmigielski, R., J.D. Surratt, Y. Gómez-González, P. Van der Veken, I. Kourtchev, R.
Vermeylen, F. Blockhuys, M. Jaoui, T.E. Kleindienst, M. Lewandowski, J.H.
Offenberg, E.O. Edney, J.H. Seinfeld, W. Maenhaut and M. Claeys. 2007b. 3-methyl-
1,2,3-butanetricarboxylic acid: An atmospheric tracer for terpene secondary organic
aerosol, Geophys. Res. Lett., 34: L24811, doi:10.1029/2007GL031338.

Project SD/AT/02 - Formation mechanisms, marker compounds and source apportionment for biogenic atmospheric
aerosols “BIOSOL”
SSD - Science for a Sustainable Development - Atmosphere 121
Tunved, P., H.C. Hansson, V.M. Kerminen, J. Strom, M. Dal Maso, H. Lihavainen, Y.
Viisanen, P.P. Aalto, M. Komppula and M. Kulmala. 2006. High natural aerosol
loading over boreal forests, Science, 312: 261-263.
Turpin, B.J., P. Saxena and E. Andrews. 2000. Measuring and simulating particulate
organics in the atmosphere: problems and prospects, Atmos. Environ., 34: 2983-
3013.
Viana, M., W. Maenhaut, H.M. ten Brink, X. Chi, E. Weijers, X. Querol, A. Alastuey,
P. Mikuška and Z. Večeřa. 2007. Comparative analysis of organic and elemental
carbon concentrations in carbonaceous aerosols in three European cities, Atmos.
Environ., 41: 5972-5983.
Wang, H.B., K. Kawamura and K. Yamazaki. 2006. Water-soluble dicarboxylic acids,
ketoacids and dicarbonyls in the atmospheric aerosols over the Southern Ocean
and western Pacific Ocean, J. Atmos. Chem., 53: 43-61.
Wang, W., I. Kourtchev, B. Graham, J. Cafmeyer, W. Maenhaut and M. Claeys.
2005. Characterization of oxygenated derivatives of isoprene related to
2-methyltetrols in Amazonian aerosols using trimethylsilylation and gas
chromatography/ion trap mass spectrometry, Rapid Commun. Mass Spectrom.,
19: 1343-1351.
Yli-Juuti, T., I. Riipinen, P.P. Aalto, T. Nieminen, W. Maenhaut, I.A. Janssens, M.
Claeys, I. Salma, R. Ocskay, A. Hoffer, K. Imre and M. Kulmala. 2009.
Characteristics of aerosol particle formation events at K-Puszta, Hungary, Boreal
Env. Res., 14: 683-698.
Zappoli, S., A. Andracchio, S. Fuzzi, M.C. Facchini, A. Gelencser, G. Kiss, Z. Krivacsy,
A. Molnar, E. Meszaros, H.C. Hansson, K. Rosman and Y. Zebuhr. 1999. Inorganic,
organic and macromolecular components of fine aerosol in different areas of Europe
in relation to their water solubility, Atmos. Environ., 33: 2733-2743.
Zhang, Q., J.L. Jimenez, M.R. Canagaratna, J.D. Allan, H. Coe, I. Ulbrich, M.R.
Alfarra, A. Takami, A.M. Middlebrook, Y.L. Sun, K. Dzepina, E. Dunlea, K.
Docherty, P.F. DeCarlo, D. Salcedo, T. Onasch, J.T. Jayne, T. Miyoshi, A.
Shimono, S. Hatakeyama, N. Takegawa, Y. Kondo, J. Schneider, F. Drewnick, S.
Borrmann, S. Weimer, K. Demerjian, P. Williams, K. Bower, R. Bahreini, L.
Cottrell, R.J. Griffin, J. Rautiainen, J.Y. Sun, Y.M. Zhang and D.R. Worsnop. 2007.
Ubiquity and dominance of oxygenated species in organic aerosols in
anthropogenically-influenced Northern Hemisphere midlatitudes, Geophys. Res.