formation constants and partial formation constants … · 2017-08-14 · coordinated with...
TRANSCRIPT
American Journal of Chemistry and Application 2015; 2(3): 37-46
Published online May 10, 2015 (http://www.aascit.org/journal/ajca)
ISSN: 2375-3765
Keywords 8-Hydroxyquinoline,
Potentiometric,
Formation Constant,
Heavy Metal Ions
Received: March 9, 2015
Revised: March 24, 2015
Accepted: March 25, 2015
Formation Constants and Partial Formation Constants of Some Metal Ions Coordinated with 8–Hydroxyquinoline by Potentiometric Titration
Mohamed M. Shahata
Environmental affairs Department, Assiut University Hospitals, Assiut University, Assiut, Egypt
Email address [email protected]
Citation Mohamed M. Shahata. Formation Constants and Partial Formation Constants of Some Metal Ions
Coordinated with 8–Hydroxyquinoline by Potentiometric Titration. American Journal of
Chemistry and Application. Vol. 2, No. 3, 2015, pp. 37-46.
Abstract The association equilibria of HQ and HQ–coordinated with some transition metal cations
such as: Al(III), Ca(II), Cd(II), Co(II), Cu(II), Fe(III), Mg(II), Ni(II), Pb(II) and Zn(II)
ions were studied using potentiometric technique. The association constant (Ka) of HQ
was calculated from the average number of protons attached per repeating unit in the HQ
(nA) at different pH values. This value of pKa which formed was found to be 6.75.The
titration curves revealed that the metal ion replaces protons and coordinates to HQ. In
addition, the use of such titration curves could be computed of the formation constants
(log β) of the different species exist at equilibrium. The formation constant (log β) for
different molar ratios of species such as 1 : 2, 1 : 1 and 2 : 1 for metal : 8-quilonol, in
solution were computed and the results were discussed. The value of ń and PL for the
metal ions under investigation were calculated at different pH values. The Formation
Constant (log β) of the coordinated 8-quilonol based on HQ–Metal ion were computed
using ń– PL system. Mathematical calculations of differential change of ń (∆ń) gave a
sharp signal for calculations of formation constant. From ń there are partial formation
constant (log β2, log β3, log β4and log β5) which indicate to the protonation degree. The
analyses of potentiometric data helped us to determine each value of the formation
constant and/or partial formation constant for the metal ions such as: Al(III), Ca(II),
Cd(II), Cu(II), Co(II), Fe(III), Mg(II), Ni(II), Pb(II) and Zn(II) coordinated with 8-
Hydroxyquinoline.
1. Introduction
Titration with a standard solution of strong base is the method of choice for the
characterization of a weak acid. Monitoring the titration progress by means of
potentiometric measurements with a pH glass electrode allows the accomplishment of
tasks of various complexities. From the simple quantitation of a single solute to the
determination of the composition of multi-component mixtures together with the acidity
constants of poly functional acids, computer programs [1-2] at various levels of
sophistication have been proposed, and are being continuously developed, in order to
allow systems of increasing complexity to be dealt with in agreement with the principles
of statistical analysis of data.
The dissociation constant is one of the most important characteristics of a

38 Mohamed M. Shahata: Formation Constants and Partial Formation Constants of Some Metal Ions Coordinated with
8–Hydroxyquinoline by Potentiometric Titration
pharmaceutical chemical moiety which has to be estimated
with accuracy. Poor solubility has issues not only with
formulating the drug; it also imposes problems in
evaluating the physicochemical properties of the molecule
itself. Ionization constant (pKa) is one among the parameter
to be estimated with accuracy, irrespective of solubility
constraints. [3]. The pKa is the negative logarithm of the
equilibrium constant (Ka) of the acid-base reaction of the
compound of interest. The importance of pKa in biologic
systems needs to preserve a relatively constant environment,
including control over the pH of the organism’s fluids. One
way to achieve this is through the use of "buffers". A buffer
is a compound which due to its acid-base chemistry reacts
to changes in the environment to preserve a near constant
pH that is near the pKa of the buffering compound.
Potentiometric methods not requiring titration with a base,
like sample addition or sample dilution, are seldom used. For
instance, pH measurements of sample solutions at a single
known concentration of weak acid are sometimes employed
to calculate Ka for classification of the acid strength of series
of similar substances.
Measured volumes of the sample solution, containing a
single weak acid at concentration C, are added stepwise to a
known volume Vo of water (the constancy of ionic strength
being an important prerequisite for obtaining easily
manageable data, an aqueous solution of an inert electrolyte
is preferable). In ordered to obtain either the concentration
C, or the acidity constant of the sample acid, Ka, or both,
the experimental variables V (the total volume of sample
added in correspondence of each step) and [H+] (the
corresponding hydronium ion concentration measured by a
calibrated glass electrode) can be processed by
computational methods according to the basic equation
describing the theoretical relation between these quantities
[4]. Analytical procedures are greatly simplified and their
reliability increased by the possibility of determining the
different analysis without the need for tedious, complex
separation which are frequently a source of errors. Such an
approach requires a new review of well-known analytical
reagents with well-established properties and features in
order to develop procedures for multi component analysis.
The study of 8–hydroxyquinoline (oxine) which has been
widely used as an analytical reagent for the determination
of metal ions. It forms insoluble complexes with a number
of metal ions in aqueous media. In other instances it is
necessary previously to remove interference by
precipitation or extraction with other reagents to achieve the
required selectivity [5]. The determination of different
metal ions in the same sample requires working in a
sequential manner, which results in prolonged times of
analysis. The stepwise protonation equilibria of the ligand
were studied (Eqs. 1 to 4) [6],
L-1 + H+↔ H L (1)
H L + H+↔ H2 L2+ (2)
H2 L2++ H+↔H3 L 2+ (3)
H3 L2+ + H +↔H4 L 2+ (4)
According to literature [7], K1 and Kn can be assigned to
the protonation constants of the analyte, while the values are
somewhat different from those of free 8–quinolinol. The
difference can be attributed to the solvent effect, since, the
free 8–quinolinol is insoluble in water and its protonation
constants were obtained in the mixture of 1,4–dioxane / water.
The formation constants of metal complexes may be
expressed either by the overall stability constants,β1, β2,
β3, …… βn, or by the stepwise stability constants K1, K2, ...,
Kn as follows (charges are omitted):
Kn = [MLn] / [MLn-1] [L] (5)
βn = [MLn] / [M] [L]n (6)
The stepwise stability constants are used for the formation
of MLn complexes. For the formation of protonated, hydroxo,
or polynuclear complex species, the overall stability
constants are used [8]:
β (MpHqLr) = [MpHqLr] / [M]p [H]q [L]r (7)
Negative q-values for [HL refer to the formation of mixed
hydroxo complexes or equilibria in which one or more
hydrogen ions which do not normally dissociate are liberated.
The binding properties of average molecular weight
towards metal ions in dilute aqueous solutions [9]. It was
possible to establish the following order for the different
metal ions to form increasingly stable complex species Ni(II)
< Cd(II) < Cu(II) < Pb(II). The difference in the average
molecular weight did not seem to have any influence on
complexation phenomenon.
Potentiometric titration technique can be used to determine
the hydrogen ion concentration in solutions at constant ionic
medium which contains an excess of, for example, sodium
ions; moreover, complex formation Mn+ (metal) ion and
coordinated compound (ligand) in the presence of H+ can be
studied using the glass electrode. The pH values of the mixed
solvent-water media were corrected by the method given by
Douheret [10] :
pH* = pH® – δ (8)
Where pH* is the corrected reading and pH® is the pH-
meter reading obtained in solvent–water mixture. The values
δ or the various properties of each organic solvent were
determined as recommended previously [9].
The electrical behavior of hydroxyquinoline sulfonic acid
and its complexes with Mn(II), Fe(II), Co(II), Ni(II) or Cu(I1)
as well as its salts with Li(I), Na(I) or K(I) were studied over
the temperature range 294-420K. All compounds behave like
semiconductors. The stability constants were calculated at
different temperatures in order to determine the
thermodynamic parameters ∆H, ∆G and ∆S for the
complexes studied. [11]
A series of complexes of divalent transition metal ions

American Journal of Chemistry and Application 2015; 2(3): 37-46 39
with malonyl bis(salicyloylhydrazone) (H4MSH) have been
prepared and characterized with the help of conductometric,
potentiometric methods. The proton–ligand and metal–ligand
stability constants were obtained pH-metrically. The
electrical conductivity of solid complexes was measured at
289 K. The low molar conductance values observed for these
complexes indicate that, they are non-electrolytes. They are
soluble to a limited extent in DMF and DMSO. The
elemental analyses of the complexes indicate that the
complexes have 1:1 and 2:1 (M:L) stoichiometry with the
existence of water, chloride, acetone molecules inside the
coordination sphere as evidence from the IR spectral studies.
Further, the complexes have been formulated by comparing
C, H, N & metal analysis data [12]. The protonation
constants of the ligand and the stability constants of their
metal complexes will be evaluated potentiometrically.
The complexation reaction between some oximes
including methyl-2-pyridylketone oxime (MPKO), phenyl-2-
pyridylketone oxime (PPKO) and diacetyl mono oxime
(DMO) with some transition and heavy metal ions: Co2+
, Ni2+
,
Zn2+
, Pb2+
, Fe2+
, Fe3+
, Cr3+
and La3+
has been studied
potentiometrically in aqueous solution at 25±0.1 ◦C and ionic
strength (µ) of 0.1M supported by KCl. The overall stability
constants logβ’s of respective species were obtained by
computer refinement of pH–volume data. The main species
in binary systems are ML, ML2, MLH, MLH2, ML2H,
ML2H2, M(OH)L, M(OH)2L, M(OH)L2 and M(OH)2L2
(LMPKO or PPKO or DMO)[13].
The association equilibria of PHQ and PHQ–coordinated
with some transition metal cations such as: Al(III), Ca(II),
Cd(II), Co(II), Cu(II), Fe(III), Mg(II), Ni(II), Pb(II) and Zn(II)
ions were studied using potentiometric technique. The
association constant (Ka) of PHQ was calculated from the
average number of protons attached per repeating unit in the
PHQ matrix (nA) at different pH values. This value of pKa
which formed was found to be 7.75.[14]
Kamal and co-workers [15-16], have prepared spectro
analytical solutions and using several spectroscopic
techniques, characterized coordination polymer based on
poly(8-hydroxyquinoline) complexed to some metal ions.
The insertion of Al(III) cation into poly(8-hydroxyquinoline)
(PHQ) instead of some metal ions such as Co(II), Ni(II),
Zn(II), Fe(III), Cu(II), Mg(II), Cr(III), Mn(II) and Mo(VI)
ions via cation-exchange mechanism has been studied. The
stability constantsfor PHQ coordination polymers with
different metal ions were calculated. The calculations
indicate that the largest stability constant and free energy
change correspond best to the 2:1 stoichiometry,
(2PHQ:1Mn+
) [17-18].
2. Experimental
2.1. Material
8–Hydroxyquinoline (8–HQ) was obtained from Aldrich
(chemical co.,US.).
A copper salt Cu (NO3)2 was obtained from chemically
pure of (Merck). All Materials employed in the present
investigation were of analytical reagent products from their
Analar grade nitrate salts (BDH) ;
Cu(NO3)2.3H2O, Ni(NO3)2.6H2O, Co(NO3)2, CaCl2,
MgCl2.6H2O, NH4Fe(SO4)2.12H2O, Al2(SO4)3.16H2O,
ZnSO4.7H2O, Cd(NO3)2.4H2O, and Pb(NO3)2 .
2.2. Instrumentation
The pH – measurements were made using Jenway 3305
pH–Meter accurate to ±0.01 pH unit with a glass calomel
electrode assembly. The pH–meter was standardized against
pH 4.0 and pH 10.0 buffers (prepared by dissolving buffer
capsules in definite amount of second deionized water).
Magnetic stirrer Jenway1000 was used for stirring the
solutions.
2.3. Preparation of the Solutions
2.3.1. Universal Buffer Solutions
A modified universal buffer series derived from that of
Britton [19] was prepared. The constituents of this series of
buffer were prepared as follow:-
(a) A solution of 0.4 M of each phosphoric and acetic
acids were prepared by accurate dilution of the A.R.
concentrated acids.
(b) A solution of 0.4 M boric acid was obtained by
dissolving the appropriate weight of the re-
crystallized acid in bi distilled water.
(c) A stock acid mixture was prepared by mixing equal
volumes of the three acids in a large bottle. The total
molarity of the acid mixture was thus mentioned at
0.4 M.
A series of buffer solutions (pH 3–12) were prepared as
follow: 150 ml of the acid mixture was placed in a 250 ml
measuring flask followed by the appropriate volume of 0.4 M
NaOH solution and then the flask was completed to mark
with bi distilled water. pH was measured with a Fisher
Scientific Accument Digital pH meter 810.
2.3.2. Preparation of Solutions for
Potentiometric Measurements
Generally, doubly distilled water was used for preparation
of all solutions employed.
NaOH solution: Sodium hydroxide (100 m mol L-1
)
carbonate-free NaOH solution was prepared and standardized
by titration against a standard solution of oxalic acid
HNO3 solution: A stock solution of (100 m mol L-1
) HNO3
was prepared and its molarity was checked by titration with
standard KOH solution.
Metal salts solutions: Stock solution of 100 m mol L-1
of
metals salt studied were prepared and standardized as
recommended procedure [20].
NaNO3 solution: A sodium nitrate (0.5 mol L-1
) stock
solution was also prepared.
The titrations were carried out at constant temperature 25
± 1oC. The stirring used was relatively long and the stirring
rate was relatively low and fixed for all experiments.

40 Mohamed M. Shahata: Formation Constants and Partial Formation Constants of Some Metal Ions Coordinated with
8–Hydroxyquinoline by Potentiometric Titration
3. Results and Discussion
3.1. Determination of the Stability Constant
When an increasing volume (V) of a solution containing
the weak acid HA at concentration (C) is added stepwise to a
volume (Vo) of solution containing the same acid at
concentration Co> 0, the amount (moles) of acid in the
solution is given by:
CoVo + CV (9)
Increases proportionally to the added volume (V) (note
that the same is not true for the concentration, unless V<<
Vo) . By expressing this amount in terms of its functional
relationship to experimental variable, V and [H+], equation
(10) is obtained [21]:
[ ]( )([ ] )(1 )
[ ]
w
a
K HF V V H
KH
++
+= ° + − + = CoVo + CV (10)
Where [H+] is measured variable of hydronium ion
concentration measured as a pH, pKa, is the acidity constant
of the weak acid. This equation defines an auxiliary variable
F, which is necessarily a linear function of V, in analogy with
the "Rigorous Gran function” [21] for weak acid titration.
The case presently of interest, not previously considered, is
multiple addition of a sample containing the weak acid or
highly conjugated substance (such as HQ) at concentration C
to a known volume of water or of an aqueous solution of an
inert electrolyte. By putting the initial concentration of weak
acid in the measured solution, (Co), equal to zero, the
equation (10) will be reduced to the equation:
[ ]( )([ ] )(1 )
[ ]
w
a
K HF V V H
KH
++
+= ° + − + = C V (11)
Or
[ ](1 )
a
HF H CV
K
+
= + = (12)
Where
( )([ ] )[ ]
wKH V V H
H
++= ° + − (13)
With moderately weak acids at moderate dilution
[ ][ ]
wKOH
H
−+ = is negligible with respect to [H
+], Then , the
equation (13) will be reduced to:
( )[ ]H V V H += ° + (14)
Therefore, equation (11) can, in most instances, be reduced
to the approximate form as:
[ ]( )(1 )
a
HF V V CV
K
+
= ° + + = (15)
Equations (11) – (15) can be used, in principle, for the
determination of the sample concentration C and they can be
rearranged to give equations having a different scope or a
wider one. For instance, to calculate hydrolysis of water (Kw)
when C is known equation (12) can be written as:
[ ] ( )aH H K CV H+ = − (16)
Therefore, equation (16) yields the acidity constant (Ka) as
the graphical or Least–squares slope of the transformed
experimental data. It can be observed that an Equation
equivalent to equation (16), for instance, the equation:
2[ ]
[ ]a
HK
CVH
V V
+
+=
−° +
(17)
This equation is used when acidity constant (Ka) is
calculated from a single measurement of pH. Alternatively,
by defining other suitable auxiliary variables X and Y that
can be calculated for each pair of experimental data V and
[H+], it is possible to rearrange equation (11) to obtain
different Linear equation of the form:
Y = a + b X (18)
Therefore, C and Ka can be obtained by numerical or
graphical linear fit of the values of X and Y, calculated from
the experimental data as:
}{2( )[ ] ( )[ ]aV V H K CV V V H
+ +° + = − ° + (19)
3.2. Determination of the pKa of
8-Hydroxyquinoline (HQ)
Fig. 1. Potentiometric titration curves of strong alkali (NaOH) for different
concentration of HQ as : a) 0.5, b) 1.0, c) 2.0, and d) 2.5 m mol L-1,
respectively.

American Journal of Chemistry and Application 2015; 2(3): 37-46 41
Different concentration of HQ which effect on the volume
of base consumed to give the same pH value in each
concentration, are shown in Fig. 1. Thus, from the height of
the half-pH raising range for these curves which
corresponding to the pH 6.50. It can be calculated that the
pKa for each concentration of 0.5, 1.0, 2.0 and 2.5 mM of HQ
gave pKa values. From these curves, it can be concluded that,
the value of pKa is not depend (±0.20) on the concentration
of HQ.
3.3. Potentiometric Titration Studies of PHQ
From the potentiometric titration curves, the parameter,
(nA) average number of protons associated with the ligand
(the substance under investigation, HQ) was calculated at
different pH values given by [22]:
1 2
1
( )( )
( )( )A
o cL
V V N En Y
V V T °
− ° + °= +
+ (20)
Where
Y : is the number of dissociable protons in HQ,
Vo : is the initial volume,
V1 and V2 : are the volume of alkali required to reach the
same pH in the presence ofmineral acid (HNO3) and (HNO3
+ HQ) solutions, respectively.
TcLo : is the total concentration of HQ,
No : is the normality of the standard alkali and,
Eo, is the initial concentration of the free mineral acid
(HNO3).
The proton–HQ formation curves obtained by plotting
nAvs. pH is represented in Fig.2.
The value of log K1H , the first proton association constant
is determined by interplotation at the half (nA) values from nA
vs. pH graph as seen in Fig.2 . The average value of Acidity
constant (pKa) was found to be 6.75.
The plotting of the differential of the average number of
protons associated with HQ,∆nA vs. pH give advantage than
the studies of nAvs. pH. This advantage that the ∆nA – pH
graph has a band at certain pH value corresponding to the
exact value of association constant, as shown in Fig. 3.
Fig. 2. Variation of the average number of protons associated (nA) for HQ vs.
pH
Fig. 3. Variation of the first derivatives of nA (∆nA) for HQ vs. pH.
3.4. Potentiometric Titration Studies of
HQ–Coordinated with Some Metal IONS
Fig. 4. Potentiometric Titration Curves of HQ–Cu(II) system curves as: a)
Free mineral acid (HNO3), b) HNO3 + HQ (0.1 m mol L-1), c) b + Cu(II) [1
Mn+ : 2 HQ], d) b + Cu(II) [1 Mn+ : 1 PHQ], and e) b + Cu(II) [2 Mn+ : 1
PHQ].
The potentiometric titration technique was also employed
for the determination of the formation constant (log β) of
HQ–metal complexes consisted of the pH–metric titration
curves of HQ in the absence and presence of metal ion (Mn+)
under investigation. Thus, the formation constant of binary
metal ion – polymer (M–HQ) complex was determined by
the titration carried out using different molar ratios of the
concentration of metal ions and/or 8- quilonol where, in each
one the total volume was kept constant (50 ml) aqueous
solution. The ionic strength was maintained constant by
using 0.1 molL-1 of supporting electrolyte (NaNO3).
Examination of the various titration curves of the different
metal ions (Mn+) and HQ (HQ : Mn+
) systems at different
molar ratios (1 : 2, 1 : 1 and 2 : 1) show that the higher shift
in the volume of alkali added for metal – HQ complex than
42 Mohamed M. Shahata: Formation Constants and Partial Formation Constants of Some Metal Ions Coordinated with
8–Hydroxyquinoline by Potentiometric Titration
the HQ alone. This indicates that the strong interaction
between each of the metal ions with HQ matrix via
complexation mechanism. The partition coefficient of each
metal between the two phases is a complex function of
different equilibrium constants involved ionization of HQ
and formation of the complex (HQ – Mn+). The pH range (3
– 10) was chosen because it facilitated the complex
extraction of the reagent and large number of metal ions
and/or transition metal ions. The titration curve of HQ–Cu(II)
system is shown in Fig.4.
Titration curves for some metal ions system, HQ - Mn+ ,
such as: Al(III) ,Ca(II) , Cd(II) , Cu(II) , Co(II) , Fe(III) ,
Mg(II) , Ni(II) , Pb(II) and Zn(II) ions are studied. Thus, the
replacement of hydrogen ion is due to complexation
mechanism.
From these titration curves, it is clear that the
potentiometric titration of free mineral acid curves (as curve
a in Fig.4) are well separated from 8-Hydroxyquinoline
titration curves (curves b), which also separated from the
HQ–metal titration curves due to the alkali consumed for
metal–8quinolinol interaction. The different molar ratio curve
is curve c which represent HQ - Mn+
with molar ratio (1 Mn+ :
2 HQ), curve d for (1M n+ : 1 HQ) and curve e for (2 M
n+ : 1
HQ).
3.5. Determination of the Association
Constant (pKa) of HQ–Coordinated with
Some Metal Ions
The metal–polymer stability constant (log β) were
estimated from the analysis of the curves drown between
ńandL
P relationship where ń, is the average number of ligand
(HQ) attached per metal ion (Mn+) and calculated by this
equation [22] :-
3 2
2
( )( )
( )o A CM
V V N En
V V n T
− ° + °=
+ ° (21)
and PL is the free ligand exponent of at several pH values and
can be calculated as follows:-
2
1 2 31 [ ] [ ] [ ] j
j o
L
oCL CM
H H H V VP
VT nT
β β β+ + ++ + + += ⋅
° − ° (22)
Where V1, V2 and V3 are the volumes of alkali required to
reach the same pH in the free mineral acid (HNO3), ligand
(HQ) + mineral acid and the mineral acid + ligand + metal in
potentiometric titration, respectively. The values of ń and PL
for the metal ions under investigation were calculated at
different pH values.
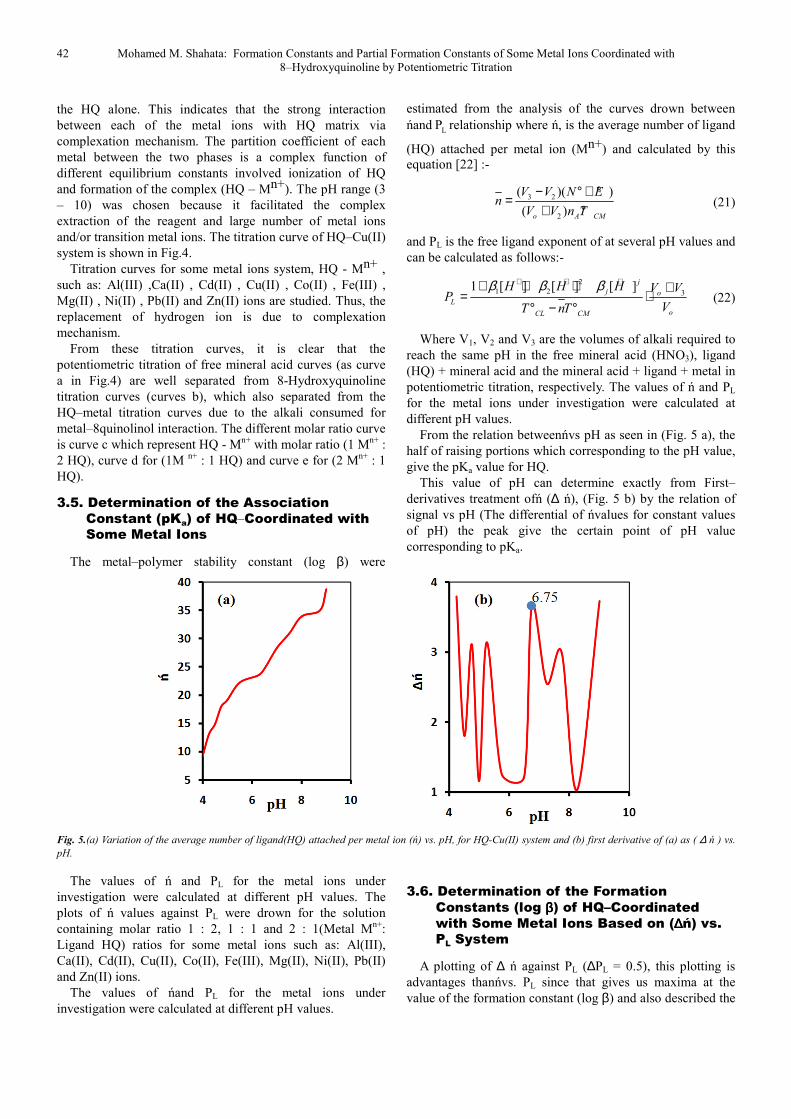
From the relation betweenńvs pH as seen in (Fig. 5 a), the
half of raising portions which corresponding to the pH value,
give the pKa value for HQ.
This value of pH can determine exactly from First–
derivatives treatment ofń (∆ ń), (Fig. 5 b) by the relation of
signal vs pH (The differential of ńvalues for constant values
of pH) the peak give the certain point of pH value
corresponding to pKa.
Fig. 5.(a) Variation of the average number of ligand(HQ) attached per metal ion (ń) vs. pH, for HQ-Cu(II) system and (b) first derivative of (a) as ( ∆ ń ) vs.
pH.
The values of ń and PL for the metal ions under
investigation were calculated at different pH values. The
plots of ń values against PL were drown for the solution
containing molar ratio 1 : 2, 1 : 1 and 2 : 1(Metal Mn+
:
Ligand HQ) ratios for some metal ions such as: Al(III),
Ca(II), Cd(II), Cu(II), Co(II), Fe(III), Mg(II), Ni(II), Pb(II)
and Zn(II) ions.
The values of ńand PL for the metal ions under
investigation were calculated at different pH values.
3.6. Determination of the Formation
Constants (log ββββ) of HQ–Coordinated
with Some Metal Ions Based on (∆∆∆∆ń) vs.
PL System
A plotting of ∆ ń against PL (∆PL = 0.5), this plotting is
advantages thanńvs. PL since that gives us maxima at the
value of the formation constant (log β) and also described the
American Journal of Chemistry and Application 2015; 2(3): 37-46 43
number of species could be formed from Ligand–metal
interaction by the number of maxima could be formed. The
curves of ∆ ń vs PL for Mn+
– HQ with the molar ratio ( 1 : 2,
1 : 1 and 2 : 1) were studied.
The analysis of potentiometric data presented that, in all
the investigated systems are formed according to the
protonation degree then give formation constant (log β) and
partial formation constant (log βp q) refers to the reaction [23]
as:
( )j z j p z
p q p qM L H M LH+ − + + −+ + = (23)
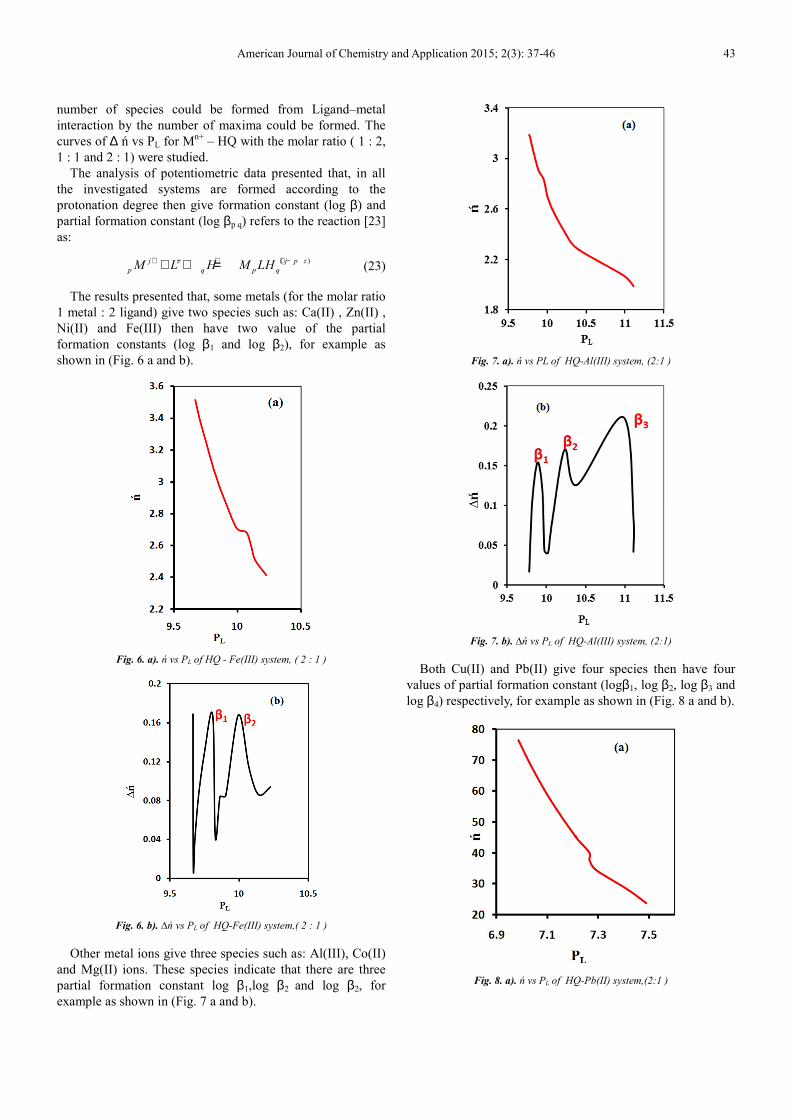
The results presented that, some metals (for the molar ratio
1 metal : 2 ligand) give two species such as: Ca(II) , Zn(II) ,
Ni(II) and Fe(III) then have two value of the partial
formation constants (log β1 and log β2), for example as
shown in (Fig. 6 a and b).
Fig. 6. a). ń vs PL of HQ - Fe(III) system, ( 2 : 1 )
Fig. 6. b). ∆ń vs PL of HQ-Fe(III) system,( 2 : 1 )
Other metal ions give three species such as: Al(III), Co(II)
and Mg(II) ions. These species indicate that there are three
partial formation constant log β1,log β2 and log β2, for
example as shown in (Fig. 7 a and b).
Fig. 7. a). ń vs PL of HQ-Al(III) system, (2:1 )
Fig. 7. b). ∆ń vs PL of HQ-Al(III) system, (2:1)
Both Cu(II) and Pb(II) give four species then have four
values of partial formation constant (logβ1, log β2, log β3 and
log β4) respectively, for example as shown in (Fig. 8 a and b).
Fig. 8. a). ń vs PL of HQ-Pb(II) system,(2:1 )

44 Mohamed M. Shahata: Formation Constants and Partial Formation Constants of Some Metal Ions Coordinated with
8–Hydroxyquinoline by Potentiometric Titration
Fig. 8. b). ∆ń vs PL of HQ-Pb(II) system,( 2 : 1 )
While, Cd(II) give five species then have five values of
partial formation constant (logβ1, logβ2, log β3, log β4 and log
β5) respectively, for example as shown in (Fig. 9 a and b).
Fig. 9. a). ń vs PL of HQ-Cd(II) system,( 2 : 1 )
Fig. 9. b). ∆ń vs PL of HQ-Cd(II) system,(2:1)
Also, The curves of ∆ ń vs PL for Mn+
– HQ with the molar
ratio ( 1 : 1 and 2 : 1) were studied andthe all values of the
formation and partial formation constants for HQ – Mn+
were
listed in Table 1
Table 1. Formation constants (log β) and partial formation constants (log βp q) values for metals coordinated with HQ at different ratios of Metal : ligand.
No M
Ions
Ratio
M : HQ
M-HQ
β1 β2 β3 β4 β5
1 Ca(II) 1 : 2 9.45 10.06
1 : 1 9.434 9.71
2 : 1 8.934 9.12 9.397
2 Zn(II) 1 : 2 9.73 9.95
1 : 1 10.74
2 : 1 10.03
3 Fe(III) 1 : 2 9.81 10
1 : 1 9.376 9.534 9.793 9.96
2 : 1 9.247 9.339
4 Ni(II) 1 : 2 9.95 10.1
1 : 1 10.25 10.987
2 : 1 10.023 10.86
5 Al(III) 1 : 2 9.89 10.23 10.98
1 : 1 9.349 9.426 9.552
2 : 1 9.027 9.132
6 Co(II) 1 : 2 9.59 9.66 9.69

American Journal of Chemistry and Application 2015; 2(3): 37-46 45
No M
Ions
Ratio
M : HQ
M-HQ
β1 β2 β3 β4 β5
1 : 1 10.127 10.419 10.845
2 : 1 10.031
7 Mg(II) 1 : 2 8.88 9.07 9.37
1 : 1 9.016 9.28 9.907
2 : 1 8.88 9.12 9.585 9.917
8 Cu(II) 1 : 2 8.35 8.43 8.54 8.65
1 : 1 8.443 8.497 8.655
2 : 1 8.228 8.397 8.564
9 Pb(II) 1 : 2 7.03 7.17 7.27 7.42
1 : 1 8.384 8.56 8.74 8.898
2 : 1 8.63 8.734 8.92 9.6778
10 Cd(II) 1 : 2 7.5 7.63 7.75 7.85 8.02
1 : 1 8.858 8.667 8.755 8.935 9.142
2 : 1 8.752 8.825 8.913 9.0 9.242
4. Conclusion
In the present paper protonation constants and complex
formation equilibria between 8-Hydroxyquinoline with some
transition and heavy metal ions including Al(III), Ca(II),
Cd(II), Cu(II), Co(II), Fe(III), Mg(II), Ni(II), Pb(II) and Zn(II)
ions have been studied in aqueous solution at 25.0±0.1 ◦C,
using glass electrode potentiometrically. The protonation
constants of the ligands and formation constants of the
resulting complexes were computed from titration data.
The overall protonation constants of ligands and the
stability of their metal complexes were calculated from
computer refinement of the pH–volume data. The results
presented that, some metals such as: Ca(II) , Zn(II) , Ni(II)
and Fe(III) (for the molar ratio 1 metal : 2 ligand) have two
values of the formation constants log β1and log β2. Other
metal ions such as: Al(III) , Co(II), and Mg(II) ions give
three partial formation constants (log β1, log β2 and log β3.
Both Cu(II) and Pb(II) have four values of partial formation
constants log β1, log β2, log β3 and log β4. While, Cd(II) have
five values of partial formation constants (logβ1, logβ2, log β3,
log β4 and log β5).
References
[1] Legget, D. J. (1985). Computational methods for the determination of formation constants, Plenum Press, New York,.
[2] Martell, A. E. and Motekaitis, R. J.( 1988). VCH, New York.
[3] Ravichandiran, V., Devarajan, V., Masilamani, K.(2011). Determination of ionization constant (pka) for poorly soluble drugs by using surfactants: a novel approach. Der Pharmacia Lettre, 3 (4)183-192.
[4] Macca, C. (1990). Linearized multiple standard additions for the potentiometric determination of weak acids. Talanta, 37, 1141-1149.
[5] Blanco, M., Coello, J., Gonzalez, F., Iturriaga, H. and Maspoch, S.(1989). Simultaneous determination of metal ions: Spectrophotometric determination of binary, ternary and quaternary mixtures of aluminium, iron, copper, titanium and
nickel by extraction with 8-hydroxyquinoline. Anal. Chim. Acta, 226, 271–279.
[6] Xun-Cheng Su, Zhi-Fen Zhou and Hua-Kuan Lin.(2001). Novel 8-hydroxyquinoline substituted open chain dioxotetraamine and its metal complexes: Synthesis and property studies in aqueous solution. Indian Journal of Chemistry, 40 A, 533–537.
[7] Stevenson, R. L. and Freiser, H.(1976). Tridentate ligands derived from substitution in the methyl group of 8-hydroxyquinaldine. Anal. Chem., 39(12), 1354- 1358.
[8] Laurih. J. Lajunen, Roberto Portanov, Juha Piispanen and Marlena Tolazzi.(1997).Hydroxycarboxylic acid complexes with protons and metal ions and the accompanying enthalpy changes- Part I: Aromatic ortho-Hydroxycarboxylic acid. Pure &Appl. Chem., Vol. 69, No. 2, 329-381.
[9] Catherine Morlay, Monique Cromer, Yolande Mouginot and Olivier Vittori. (1999). Potentiometric study of Cd(II) and Pb(II) complexation with two high molecular weight poly(acrylic acids); comparison with Cu(II) and Ni(II). Talanta, 48, 1159–1166.
[10] Douheret, G. (1975). Medium effects in aqueous organic solvents. Influence of solute on transfer parameters. Journal of Electroanalytical Chemistry and Interfacial Electrochemistry, 61(2), 228–232.
[11] Abd El Wahed, M.G., El Manakhly, K.A., El Kososy, N. (1995). Physicochemical studies of hydroxyquinoline sulfonic acid and its transition metal complexes. Materials Chemistry and Physics 41, 117-122.
[12] Askar, E.I., Shokry, H., Al. Hashmy, D.,(2010). Potentiometric and conductometric studies of malonyl bis(salicyloylhydrazone) and divalent metal complexes. Journal of Saudi Chemical Society, 14, 175–182.
[13] Hamid Reza Rajabi, Marzieyeh Sadat. Niband. (2008). Potentiometric study of binary complexes of methyl 2-pyridyl ketone oxime, phenyl 2-pyridyl ketone oxime and diacetyl monooxime with some transition and heavy metal ions in aqueous solution. Spectro chimica Acta Part A 71, 655–662.
[14] Mohamed M. Shahata, Determination of the Formation Constants of Some Metal Ions Coordinated with poly (8–Hydroxyquinoline). International Journal of Advanced Research (2014), Volume 2, Issue 6, 96-109
46 Mohamed M. Shahata: Formation Constants and Partial Formation Constants of Some Metal Ions Coordinated with
8–Hydroxyquinoline by Potentiometric Titration
[15] Mostafa M. Kamal, Seddique M. Ahmed, Mohamed M. Shahata and Yassien M. Temerk. (2002). Differential Pulse Polarographic (DPP) of Poly (8–Hydroxyquinoline) Matrix. Anal. and Bioanal. Chem., 372, 843 – 848.
[16] Ahmed, Seddique M., Shahata, Mohamed M., Kamal, Mostafa M.(2003). Spectrophotometric Studies of the Coordination polymers Based on Poly(8-Hydroxyquinoline) Matrix. J. Inorg. Organomet. Polym. 13, 171- 192.
[17] Kamal, Mostafa M., El- Sayed, Abd El-Aziz Y., Ahmed, Seddique M., Omran, Ahmed I., Shahata, Mohamed M.(2009). Cation exchange mobility on Poly(8-hydroxyquinoline) matrix. J. Inorg. Organomet. Polym. 19, 501- 506.
[18] Mohammed. M. Shahata, Seddique. M. Ahmed and Mostafa M. Kamal. (2013). Cathodic Stripping Differential Pulse Voltammetric Determination of Poly(8–Hydroxyquinoline) Matrix. IJPAC-International Journal of Pure and Applied Chemistry, 8 (3), 209-216.
[19] Britton, H.T.S. (1952). “Hydrogen Ions” Fourth Edition.
[20] Vogel A. I. (1989). Text book of quantitative inorganic analysis, 5th edn. EIBS – Longman. London, p. 326.
[21] Carlo Macca and Merkoci. (1994). Potentiometric characterization of weak acids by multiple sample addition—I. Linear equations and intrinsic performance of the method. Talanta, 41, (12), 2033–2042.
[22] Irving, H. and Rossotti, H. S. (1954). The calculation of formation curves of metal complexes from pH titration curves in mixed solvents. J. Chem. Soc., 2904- 2910.
[23] Alessandro De Roberties, Concetta De Stefano, Antonio Gianguzza and Silvio Sammartano. (1999). Binding of polyanions by biogenic amines III Formation and stability of protonated spermidine and spermine complexes with carboxylic ligands. Talanta, 48, 119–126.