formal modeling and analysis by simulation of data paths in digital
TRANSCRIPT

Formal Modeling and Analysis by Simulation ofData Paths in Digital Document Printers?
Venkatesh Kannan, Wil M.P. van der Aalst, and Marc Voorhoeve
Department of Mathematics and Computer Science,Eindhoven University of Technology, Eindhoven, The Netherlands.
{V.Kannan,W.M.P.V.D.Aalst,M.Voorhoeve}@tue.nl
Abstract. This paper reports on a challenging case study conducted inthe context of the Octopus project where CPN Tools is used to modeland analyze the embedded system of digital document printer. Modelingthe dynamic behavior of such systems in a predictable way is a majorchallenge. In this paper, we present the approach where colored Petri netsare used to model the system. Simulation is used to analyze the behaviorand performance. The challenge in modeling is to create building blocksthat enable flexibility in reconfiguration of architecture and design spaceexploration. CPN Tools and ProM (a process mining tool) are used tocollect and analyze the simulation results. We present the pros and consof both the conventional presentation of simulation results and usingProM. Using ProM it is possible to monitor the simulation is a refinedand flexible manner. Moreover, the same tool can be used to monitor thereal system and the simulated system making comparison easier.
1 Introduction
The Octopus project is a co-operation between Oce Technologies, the EmbeddedSystems Institute (ESI), and several research groups in the Netherlands. The aimof the project is to define new methods and tools to model and design embeddedsystems like printers, which interact in an adaptive way to changes during theirfunctioning. One of the branches of the Octopus project is the study of designof data paths in printers and copiers. A data path encompasses the trajectoryof image data from the source (for instance the network to which a printer isconnected) to the target (the imaging unit). Runtime changes in the environmentmay require use of different algorithms in the data path, deadlines for completionof processing may change, new jobs arrive randomly, and availability of resourcesalso changes. To realize such dynamic behavior in a predictable way is a majorchallenge. The Octopus project is exploring different approaches to model andanalyze such systems. This paper focuses on the use of colored Petri nets tomodel and study such systems. We report on the first phase of the project,in which we studied a slightly simplified version of an existing state-of-the-artimage processing pipeline at Oce implemented as an embedded system.
? Research carried out in the context of the Octopus project, with partial support ofthe Netherlands Ministry of Economic Affairs under the Senter TS program.

1.1 The Case Study
The industrial partner in the Octopus project, Oce Technologies, is a designerand manufacturer of systems that perform a variety of image processing functionson digital documents in addition to scanning, copying and printing. In additionto locally using the system for scanning and copying, users can also remotelyuse the system for image processing and printing. A generic architecture of anOce system used in this project is shown in Figure 1. [2]
Fig. 1: Architecture of Oce system.
As shown in Figure 1, the system has two input ports: Scanner and Controller.Users locally come to the system to submit jobs at the Scanner and remote jobsenter the system via the Controller. These jobs use the image processing (IP)components (ScanIP, IP1, IP2, PrintIP), system resources such as the memory,and USB bandwidth for the executing the jobs. Finally, there are two outputports where the jobs leave the system: Printer and Controller. Jobs that requireprinted outputs use the Printer and those that are to be stored in a storagedevice or sent to a remote user are sent via the Controller.
All the components mentioned above (Scanner, ScanIP, IP1, IP2, PrintIP)can be used in different combinations depending on how a document of a certainjob is requested to be processed by the user. Hence this gives rise to differentuse-cases of the system i.e. each job could use the system in a different way.The list of components used by a job defines the data path for that job. Somepossible data paths for jobs are listed and explained below:
– DirectCopy: Scanner ; ScanIP ; IP1 ; IP2 ; USBClient, PrintIP– ScanToStore: Scanner ; ScanIP ; IP1 ; USBClient– ScanToEmail: Scanner ; ScanIP ; IP1 ; IP2 ; USBClient– ProcessFromStore: USBClient ; IP1 ; IP2 ; USBClient– SimplePrint: USBClient ; PrintIP– PrintWithProcessing: USBClient ; IP2 ; PrintIP
The data path listed for DirectCopy means that the job is processed in orderby the components Scanner, ScanIP, IP1, IP2 and then simultaneously sent to
the Controller via the USBClient and also for printing through PrintIP. In thecase of the ProcessFromStore data path, a job is remotely sent via the Controllerand USBClient for processing by IP1 and IP2 after which the result is sent backto the remote user via the USBClient and the Controller. The interpretation forthe rest of the data paths is similar.
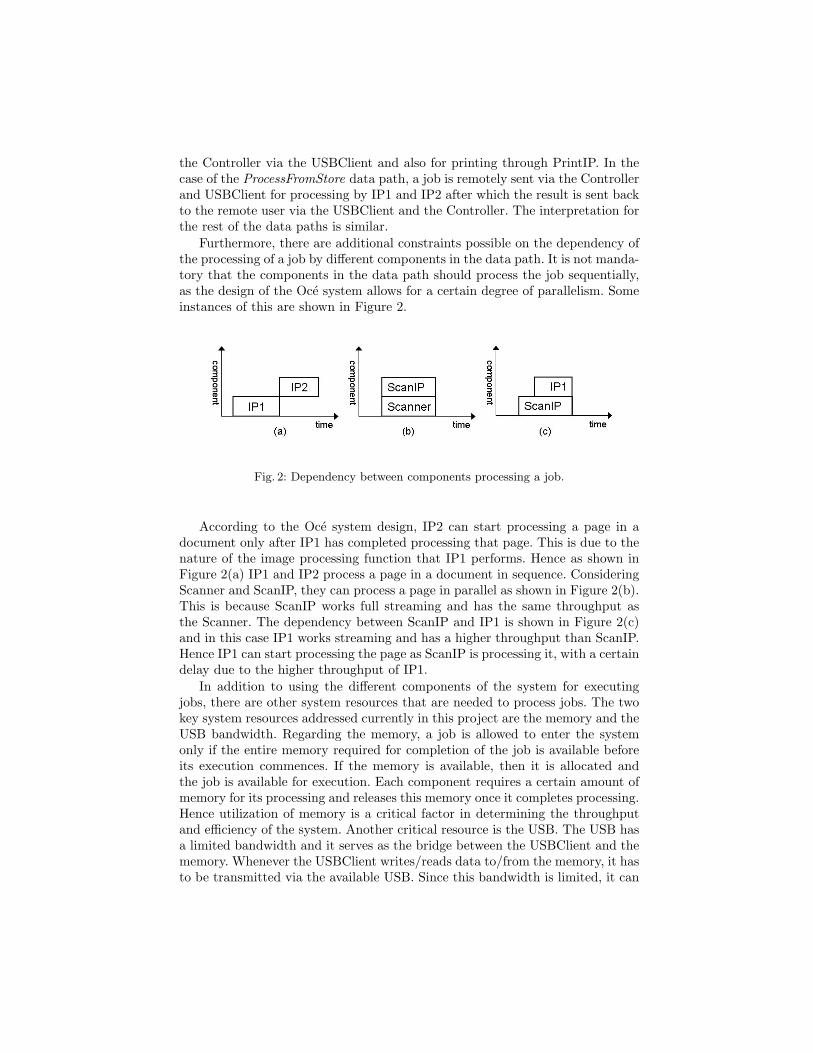
Furthermore, there are additional constraints possible on the dependency ofthe processing of a job by different components in the data path. It is not manda-tory that the components in the data path should process the job sequentially,as the design of the Oce system allows for a certain degree of parallelism. Someinstances of this are shown in Figure 2.
Fig. 2: Dependency between components processing a job.
According to the Oce system design, IP2 can start processing a page in adocument only after IP1 has completed processing that page. This is due to thenature of the image processing function that IP1 performs. Hence as shown inFigure 2(a) IP1 and IP2 process a page in a document in sequence. ConsideringScanner and ScanIP, they can process a page in parallel as shown in Figure 2(b).This is because ScanIP works full streaming and has the same throughput asthe Scanner. The dependency between ScanIP and IP1 is shown in Figure 2(c)and in this case IP1 works streaming and has a higher throughput than ScanIP.Hence IP1 can start processing the page as ScanIP is processing it, with a certaindelay due to the higher throughput of IP1.
In addition to using the different components of the system for executingjobs, there are other system resources that are needed to process jobs. The twokey system resources addressed currently in this project are the memory and theUSB bandwidth. Regarding the memory, a job is allowed to enter the systemonly if the entire memory required for completion of the job is available beforeits execution commences. If the memory is available, then it is allocated andthe job is available for execution. Each component requires a certain amount ofmemory for its processing and releases this memory once it completes processing.Hence utilization of memory is a critical factor in determining the throughputand efficiency of the system. Another critical resource is the USB. The USB hasa limited bandwidth and it serves as the bridge between the USBClient and thememory. Whenever the USBClient writes/reads data to/from the memory, it hasto be transmitted via the available USB. Since this bandwidth is limited, it can

be allocated only to a limited number of jobs at a time. This determines howfast the jobs can be transferred from the memory to the Controller or vice versa.
The overview of the system just given illustrates the complexity of the Ocsystem. The characteristics of critical system resources such as memory and USBbandwidth, and the components determine the overall performance. Moreover,resource conflicts need to be resolved to ensure a high performance and through-put. The resource conflicts include competition for system components, memoryavailability, and USB bandwidth.
1.2 The Approach
In our approach, colored Petri nets (CPN) are used to model the Oc system.The CPN modeling strategy [3] is aimed at providing flexibility for design spaceexploration of the system using the model. Hence, design of reusable buildingblocks is vital during the modeling process. Simulation of the model is used forperformance analysis to identify bottleneck resources, utilization of components,decisions during design space exploration and design of heuristic scheduling rules(in the future). CPN Tools is used for modeling, simulation and performanceanalysis of the system. Additionally, ProM, a versatile process mining tool, isused to provide further insights into the simulation results and also presentthese results to the domain user in different forms. Interestingly, ProM can beused to monitor both the simulated and the real system, thus facilitating easycomparison.
2 Modeling Using CPN
The modeling approach takes an architecture oriented perspective to model theOce system. The model, in addition to the system characteristics, includes thescheduling rules (First Come First Served) and is used to study the performanceof the system through simulation. Each component in the system is modeled asa subnet. Since the processing time for all the components, except the USB, canbe calculated before they start processing a job, the subnet for these compo-nents looks like the one shown in Figure 3. The transitions start and end modelthe beginning and completion of processing a job, while the places free and doreflect the occupancy of the component. In addition, there are two places thatcharacterize the subnet to each component: compInfo and paperInfo. The placecompInfo contains a token with information about the component, namely thecomponent ID, processing speed and the recovery time required by the compo-nent before starting the next job. The place paperInfo contains information onthe number of bytes the particular component processes for a specific paper size.The values of the tokens at places compInfo and paperInfo remain constant af-ter initialization and govern the behavior of the component. Since the behaviorof the USB is different from the other components, its model is different fromthe other components and is shown separately. The color sets for paperInfo andcompInfo used in the CPN Tools model are listed below.

colset PAPERINFO=record paper:STRING*inputSize:INT;colset COMPINFO=record compID:STRING*speed:INT*recovery:INT;
In the color set PAPERINFO, the record-element paper contains the infor-mation on the size of the paper, such as A4 or A3, and element inputSize denotesthe memory required for this size of paper. In the color set COMPINFO, theelement compID is used to name the component (scanner, scanIP, etc.), speeddenotes the processing speed of the component and recovery contains the infor-mation about the recovery time needed by the component between processingtwo jobs.
Fig. 3: Hierarchical subnet for each component
In Figure 3, the place jobQ contains tokens for the jobs that are available forthe components to process at any instance of time. The color of a token of typeJob contains information about the job ID, the use case and paper size of thejob. Hence, the component can calculate the time required to process this jobfrom the information available in the Job token, and the tokens at the placescompInfo and paperInfo. Once the processing is completed, transition end placesa token in place free with a certain delay, governed by the recovery time specificto each component, thus determining when the component can begin processingthe next available job. The color set for the type Job is as follows,
colset JOB=recordjobID:STRING*jobType:STRING*inputPaper:STRING*from:STRING*to:STRING*startTime:INT*endTime:INT timed;
The record element jobID is used to store a unique identifier for each job,jobType contains the use-case of the job (DirectCopy or ScanToEmail, etc.), and

the element inputPaper specifies what paper size is used in this job. The elementsfrom and to are used for the source and destination component IDs respectively,as the job is being processed by one component after another according to thedata path. The startTime and endTime are used by each component to containthe timestamps of start and estimated end of processing the job.
Fig. 4: Architectural view of the CPN model.
Figure 4 shows an abstract view of the model. New jobs for the system canbe created using the Job Generator subnet, which are placed as input to theScheduler subnet at the place newJob. The Scheduler subnet is the heart ofthe system that models the concepts including the scheduling rules, memorymanagement rules and routing each job step-by-step from one component to thenext depending on the data path of the use-case to which the job belongs. Fromthis it can be observed that the scheduling rules are modeled as being global tosystem and not local to any of the components or distributed.
Vital to the Scheduler’s task of routing jobs from one component to the nextis the information about the use-cases and the data paths. From the informationon data paths in Section 1.1, it can be inferred that each data path is a partialorder. Hence, a list of list (of color STRING) is used to represent the partialorder. An example of a data path represented in the Scheduler component isshown here.
ucID="DirectCopy",dataPath= [ ["scanner","scanIP"],["scanIP","IP1"],["IP1","IP2"],["IP2","printIP","USBup"],["USBup"],["printIP"]]

The data path of the use-case DirectCopy is explained in Section 1.1. In thisexample, each sublist inside the data path list contains two parts: the first ele-ment being the source component and the remaining being the destination(s).Hence, ["scanIP","IP1"] indicates that in the DirectCopy use-case, a job pro-cessed by scanIP will be processed by IP1 next. Similarly, ["IP2","printIP","USBup"]denotes that a job processed by IP2 will be processed simultaneously by printIPand USBupload in the next step.
The Scheduler picks a new job that enters the system from the place newJoband estimates the amount of total memory required for executing this job. Ifenough memory is available, the memory is allocated (the memory resource ismodeled as an integer token in the place memory) and the job is scheduled forthe first component in the data path of this job by placing a token of type Jobin the place jobQ, which will be consumed by the corresponding component forprocessing. When a component starts processing a job, it immediately places atoken in the startedJob place indicating this event. The Scheduler consumes thistoken to schedule the job to the next component in its data path, adding a delaythat depends on the component that just started, the next component in the datapath, and the dependency explained and shown in Figure 2 (a), (b) and (c). Thusthe logic in the Scheduler includes scheduling new jobs entering the system (fromplace newJob) and routing the existing jobs through the components accordingto the corresponding data paths.
As mentioned above, the Scheduler subnet also handles the memory manage-ment. This includes memory allocation and release for jobs that are executed.When a new job enters the system, the Scheduler schedules it only if the com-plete memory required for the job is available (checked against the token in theplace memory). During execution, part of the memory allocated may be releasedwhen a component completes processing a job. This memory release operationis also performed by the Scheduler subnet.
Modeling the USB component is different from the other components andcannot be models using the ”pattern” shown in Figure 5. As described earlier,for the USB, the time required to transmit a job (upstream or downstream) isnot constant and is governed by other jobs that might be transmitted at the sametime. This necessitates making the real-time behavior of the USB bus dependentof multiple jobs at the same time. It is to be noted that if only one job is beingtransmitted over the USB then a high MBps transmission rate is used, and whenmore than one job is being transmitted at the same time then a lower low MBpstransmission rate is used.
The model of the USB as shown in Figure 5 works primarily by monitoringtwo events observable in the USB when one or more jobs are being transmit-ted: (1) the event of a new job joining the transmission, and (2) the event ofcompletion of transmission of a job. Both these events govern the transmissionrates for the other jobs on the USB and hence determine the transmission times

Fig. 5: CPN model for the USB.
for the jobs. In the model shown in Figure 5, there are two transitions join andupdate, and two places trigger and USBjobList. The place USBjobList containsthe list of jobs that are currently being transmitted over the USB. Apart fromcontaining information about each job, it also contains the transmission rateassigned, the number of bytes remaining to be transmitted and the last timeof update for each job. Transition join adds a new job waiting at place in thatrequests use of the USB (if it can be accommodated) to the USBjobList, andplaces a token in place trigger. This enables transition update that checks thelist of jobs at place USBjobList and reassigns the transmission rates for all thejobs according to the number of jobs transmitted over the USB. The updatetransition also recalculates the number of bytes remaining to be transmitted foreach job since the last update time, estimates the job that will finish next andplaces a timed token at trigger, so that the transition update can remove thejobs whose transmissions have completed. The jobs whose transmission over theUSB is complete are placed in place out. Thus transition join catches the eventof new jobs joining the USB and the transition update catches the event of jobsleaving the USB, which are critical in determining the transmission time for asingle job.
3 Simulation and Analysis
This section presents some analysis methods used to study the results from thesimulation of the model. Section 3.1 presents the information collected in CPNTools through monitors and how it is used to measure relevant performancemetrics. Section 3.2 presents the use of the process mining tool ProM for analternative presentation and analysis of the simulation results. ProM uses eventlogs, which are recorded by CPN Tools. The event log contains details about theevents (i.e., transition firings) that take place in the simulation.
We are unable to share detailed data about the Oce system because thisinformation is highly confidential. Hence, the actual parameters and simulationresults should be seen as potential settings and outcomes.
For the simulation experiment to illustrate possible results obtained by CPNTools and ProM, 150 jobs are generated by the Job Generator component ofthe model in Figure 4 in each run. These jobs are created by picking a randomnumber of jobs from the six use-cases listed in Section 1.1. The arrival timesof jobs are distributed negative exponentially with an inter-arrival time of 2seconds.

3.1 Simulation Results
When performing simulation in CPN Tools, the different categories of moni-tors available can be used to collect the simulation results in different ways [1].Here, two examples of how different types of monitors are used to aggregate thesimulation results to performance analysis metrics are presented.
Table 1 presents the statistics produced by the data collection monitor thatwas used to aggregate the waiting times of jobs before their execution startsat each component. The averages provided by CPN Tools in the performancereport can be obtained by replicating the simulation for multiple runs. Thewaiting times of jobs thus obtained through monitors during simulations canbe used to identify the components that are probable bottleneck resources inthe system. Similarly, using the data collection monitor, the utilization timesfor each component can be obtained to determine the under- and over-utilizedcomponents in the system.
Name Avrg 90% Half Length 95% Half Length 99% Half Length
IP1
count iid 100.119400 0.134347 0.160568 0.212527max iid 3007.696600 4.862893 5.812036 7.692745min iid 0.000000 0.000000 0.000000 0.000000avrg iid 34.302562 1.301284 1.555269 2.058537
IP2
count iid 100.048200 0.133754 0.159861 0.211590max iid 2860.038400 37.247604 44.517618 58.923016min iid 0.000000 0.000000 0.000000 0.000000avrg iid 48.990676 0.935130 1.117649 1.479308
USB
count iid 174.983400 0.105168 0.125695 0.166368max iid 242724.770400 535.206794 639.668843 846.658458min iid 0.000000 0.000000 0.000000 0.000000avrg iid 23679.481434 143.889599 171.974075 227.622944
printIP
count iid 74.900800 0.144126 0.172257 0.227998max iid 96590.504600 524.005807 626.281639 828.939306min iid 0.000000 0.000000 0.000000 0.000000avrg iid 13155.451373 126.373949 151.039708 199.914452
scanner
count iid 75.136000 0.141720 0.169381 0.224191max iid 735681.475800 532.367990 636.275959 842.167675min iid 5406.491400 866.457382 1035.573160 1370.672942avrg iid 341606.033984 696.226511 832.116504 1101.380010
Table 1: Waiting times of jobs at the different components

From Table 1, it can be observed that the average waiting time for jobsin front of components Scanner and USB is higher than for the rest of thecomponents. For example, with 90confidence, the USB is seen to have an averagewaiting time of 23680 seconds, with a half length of 144 seconds, for jobs in thequeue in front of it. This is attributed to the scheduling rule that jobs have towait for memory allocation before entering the system for processing through theScanner or the USBdown. The simulation experiment here was conducted withminimal memory availability, and hence the longer queues. Also, the averagewaiting time in front of the printIP is also higher as it is the slowest componentin the system according to the design specifications.
The second example presented here uses the write-in-file monitor to log theevents when memory is allocated or released by the Scheduler component. Usingthis log of the time stamps and the amount of memory available, a simple toolcan be used to plot the chart shown in Figure 6. The chart depicts the amount ofmemory available in the system at each instant of time. Information about theutilization characteristics of the memory resource is a key input in designing thememory architecture, designing scheduling rules for optimal memory utilizationwith high system throughput and analyzing the waiting times in front of eachcomponent in the system.
Fig. 6: Memory Utilization chart
The above simulation results are typical for simulation tools, i.e., like mosttools, CPN Tools focuses on measuring key performance indicators such as uti-lization, throughput times, service levels, etc. Note that the BRITNeY Suite an-imation tool [5] can be used to add animations to CPN simulations. Moreover, itallows for dedicated interactive simulations. This facilitates the interaction withend users and domain experts (i.e., non-IT specialists).
3.2 Using ProM
ProM is a process mining tool, i.e., it is used to investigate real-life processes byanalyzing footprints of processes in the form of event logs, audit trails, database

entries, message exchanges, translation logs, etc. ProM offers a wide variety ofanalysis techniques. Because simulation can be seen as imitating real-life, it isinteresting to see what additional insights process mining techniques can provide.This section presents some of the plug-ins of ProM that have been explored inthe context of Oce’s systems. The plug-ins of ProM use event logs, which is listof events recording when each component starts and completes processing a job.These event logs have been generated using the approach described in [6].
Fuzzy Miner The fuzzy miner plug-in along with the animation part of itprovides a visualization of the simulation. The event log is used to replay thesimulation experiment on the fuzzy model of the system. Figure 7 shows a snap-shot during the animation. During the animation, jobs flow between componentsin the fuzzy model in accordance with the events during simulation. It providesa view of the queues in front of each component, which serves as an easy meansto identify key components, bottleneck resources and the utilization of compo-nents in the system. For example, from Figure 7 it can be observed that duringthis simulation run, the queue in front of printIP was longer, which can be at-tributed to it being the slowest component in the system. More importantly, thefuzzy miner animation provides live insight into the simulation run and is aneasier means of communication with the domain users, which is significant inthe context of the Octopus project.
Fig. 7: Fuzzy Miner Animation
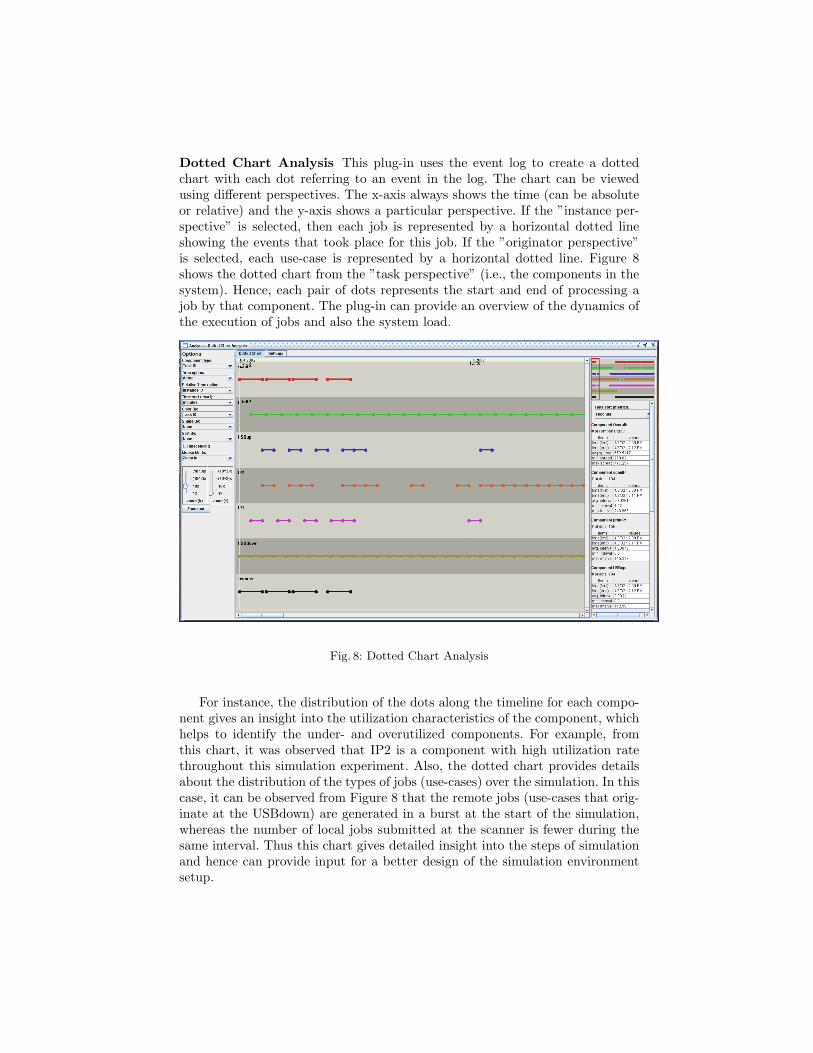
Dotted Chart Analysis This plug-in uses the event log to create a dottedchart with each dot referring to an event in the log. The chart can be viewedusing different perspectives. The x-axis always shows the time (can be absoluteor relative) and the y-axis shows a particular perspective. If the ”instance per-spective” is selected, then each job is represented by a horizontal dotted lineshowing the events that took place for this job. If the ”originator perspective”is selected, each use-case is represented by a horizontal dotted line. Figure 8shows the dotted chart from the ”task perspective” (i.e., the components in thesystem). Hence, each pair of dots represents the start and end of processing ajob by that component. The plug-in can provide an overview of the dynamics ofthe execution of jobs and also the system load.
Fig. 8: Dotted Chart Analysis
For instance, the distribution of the dots along the timeline for each compo-nent gives an insight into the utilization characteristics of the component, whichhelps to identify the under- and overutilized components. For example, fromthis chart, it was observed that IP2 is a component with high utilization ratethroughout this simulation experiment. Also, the dotted chart provides detailsabout the distribution of the types of jobs (use-cases) over the simulation. In thiscase, it can be observed from Figure 8 that the remote jobs (use-cases that orig-inate at the USBdown) are generated in a burst at the start of the simulation,whereas the number of local jobs submitted at the scanner is fewer during thesame interval. Thus this chart gives detailed insight into the steps of simulationand hence can provide input for a better design of the simulation environmentsetup.

Performance Sequence Diagram Analysis The performance sequence di-agram plug-in provides a means to assess the performance of the system. Theplug-in can provide information about behaviors that are common from theevent log. These patterns can be visualized from different perspectives such asthe components of the system and the data paths in the system. Figure 9 shows ascreenshot of the pattern diagram generated from the view of the components. Inthis context, the patterns depicted correspond to the different data paths listedin Section 1.1. Also, statistics about the throughput times for each pattern arepresented, which can be used to determine the patterns that seem to be commonbehavior, those that are rare and those that result in high throughput times.
On the other hand, this plug-in can be used to analyze an event log from theOce system to identify the data paths available thus assisting in identifying thearchitecture and behavior of the system and also in the modeling process.
Fig. 9: Pattern diagram - Performance Sequence Diagram Analysis
Trace Clustering Figure 9 shows the frequent patterns in the event log assequence diagrams. In the context of process and data mining many clusteringalgorithms are available. ProM supports various types of trace clustering. In Fig-ure 10 the result of applying the K-means clustering algorithm with a particulardistance metric is shown, where six clusters are identified. These correspond to

the different usecases or datapaths. For each cluster, the corresponding processmodel can be derived. Figure 10 shows two Petri nets. These nets have beendiscovered by applying the alpha algorithm [7] to two of the cluster. These dia-grams nicely show how the dependencies depicted in Figure 2 can be discovered.For this particular setting of the clustering algorithm, the basic use-cases arediscovered. However, other types of clustering and distance metrics can be usedto provide insights into the different data-paths.
Fig. 10: Using Trace Clustering the Different Use Cases can be Identified and the Cor-responding Detailed Process Models can be Discovered
Performance Analysis Figure 11 shows a detailed performance analysis of oneof the use-cases using the Performance Analysis with Petri net plug-in. The focusof the plug-in is to provide key performance indicators, which can be summonedin an intuitive way. For this, the event logs of the selected cluster are replayed inthe Petri net model of the use-case generated using the alpha algorithm. Fromthis simulation of a single use-case, performance indicators including averagethroughput time, minimum and maximum values, and standard deviation forthe use-case throughput are derived. These provide a detailed insight into partsof the system during the simulation experiment, in this case the six use-cases ofthe system.

Additionally, the color of the places in the Petri net indicates where in theprocess (datapath in this case) the jobs of this use-case spend most time. Forexample, we can observe and verify, based on the prior system knowledge, thatsince the PrintIP is the slowest component, jobs spend most time waiting in itsqueue.
Fig. 11: A Detailed Performance Analysis Is Performed For One of the Clusters Dis-covered
Social Network Analysis Figure 12 shows the result of using Social Net-work Analysis (SNA) on the event log. This plug-in is typically used to quantifyand analyze social interaction between people in business process environment.However, by mapping the roles played by people to components in this con-text, the analysis provides information about interaction statistics among thecomponents.
The analysis plug-in uses the SNA matrix generated by the social networkminer plug-in, which uses the data on causal dependency in hand over of workamong components, derived from the event log. As a result it is possible to showthe flow of work between the various components. The shape and size of thenodes give a direct indication of the utilization of the component. The heightof the node is directly proportional to the amount of work flowing into thecomponent and the width to the amount flowing out. The arc weights are an

indicator of the amount of work flowing between the components. This providesa quantification to analyze the interaction among the components.
Fig. 12: Social Network Analysis Applied to the Components of Oce’s System
3.3 Comparison and Discussion
Section 3.1 showed the classical simulation results obtained from monitors inCPN Tools. Parameters such as waiting times of jobs and utilization rates helpin identifying the critical resources and to study the system performance andbehavior. The averages and standard deviations of such parameters are helpfulin analyzing the overall performance of the system over the entire simulation.However, such classical simulation results typically do not present the dynamicsand detailed behavior of the system during the simulation.
On the other hand, Section 3.2 looks into some of the plug-ins available inthe process mining tool ProM and illustrates their application to event logs of aCPN simulation. They provide the advantage to observe the dynamics and de-tails of the system behavior and performance during the simulation experiment.

For instance, the fuzzy miner and the dotted chart plug-ins can show views ofutilization characteristics of components in the system from different perspec-tives. Also, the performance sequence diagram analysis presents patterns andtheir statistics (such as throughput times) helping in studying their occurrencesand impact on the system performance. Clustering techniques can be used togroup jobs and analyze each group individually. Hence, even though the clas-sical simulation results provide an overall view of the system performance andcharacteristics, ProM provides some added advantages in presenting the detailedview of the simulation process with insights into the dynamics of the system’sbehavior and simulation.
Another important observation is that process mining tools ProM can beused to observe and analyze real-world process and simulated processes. Cur-rently, system analysts tend to use different tools for monitoring real systemsand simulated systems. This is odd, since often the ultimate goal is to comparethe real system with the simulated system. (Recall that simulation is used tounderstand and improve real systems!)
4 Related Work
The use of CPN Tools as a simulation tool is described in [1]. In this paper, themonitor concept is described in detail. The BRITNeY Suite animation tool [5]extends the visualization and interaction functionality of CPN Tools. The anima-tion tool can be connected to the running simulation engine and used to presentthe simulated behavior in a domain specific and interactive manner. ProM isdescribed in [8]. The current release of ProM contains more than 230 plug-ins.In the paper, we could only show a few and we refer to www.processmining.orgfor details.
In [2] we modeled the basic components of Oce’s copiers using differentformalisms. In [9] the authors present the modeling of the features of a mo-bile phone. The work also involves identification and analysis of the interactionamong features, helping in identifying faults in specification and improvement ofthe architecture. In [10] the practical use of colored Petri nets is demonstrated byan industrial case study involving a flowmeter instrument that consists of hard-ware components performing estimation and calculation functions by interactingwith each other.
5 Conclusions and Future Work
In this paper, initial experiences with using colored Petri nets in Octopus projecthave been presented. Petri nets allow for modeling all the details and dynamicsof the embedded system used in this case study. This permits providing practicalinputs and solutions to real-world problems. A slightly simplified version of acurrently existing Oce system was used as the case study. In the modeling processthe goal was to identify building blocks to allow re-use of components in themodel. Also modeling the dynamic behavior of the USB is a significant solution

to future problems such as modeling memory bus and processors. CPN Toolsand ProM prove to be effective tools in analyzing and studying the performanceof the system. They provided insights into identifying the bottleneck resources,utilization of resources and system dynamics during execution of jobs. The prosand cons of the classical presentation of simulation results and the applicationof ProM in analyzing the results are also studied.
From the modeling perspective, the next steps are to model the completecopier systems at Oce, as opposed to the slightly simplified case studied here.Hence, it is essential to identify patterns and design re-usable building blocksin the CPN model. This will allow flexibility in exploring different system ar-chitectures and design decisions through the model. In addition, the analysis ofsimulation results using CPN Tools and ProM will be used to further explore thedesign space and build heuristic scheduling rules in the next steps of the project.We feel that it is important to use the same tools to monitor and analyze the realsystem and its simulated counterparts. This will allow for a better comparisonand a more detailed analysis as shown in this paper.
References
1. K. Jensen, L.M. Kristensen, and L. Wells. Coloured Petri Nets and CPN Tools formodeling and validation of concurrent systems. International Journal on SoftwareTools for Technology Transfer (STTT)., Volume 9, Numbers 3-4, June 2007.
2. G. Igna, V. Kannan, Y. Yang, T. Basten, M. Geilen, F. Vandraager, M. Voorho-eve, S. de Smet, and L. Somers. Formal Modeling and Scheduling of Data Paths ofDigital Document Printers. 6th International Conference FORMATS 2008, Pro-ceesings, September 15-17 2008.
3. K. Jensen. Coloured Petri Nets. Basic Concepts, Analysis Methods and PracticalUse. EATCS Monographs on Theoretical Computer Science, Springer-Verlag, 1992.
4. W.M.P. van der Aalst, J. Nakatumba, A. Rozinat, and N. Russell. Business ProcessSimulation: How to get it right? BPM-08-07, Eindhoven, BPMcenter.org, 25pp.
5. M. Westergaard, K.B. Lassen. The BRITNeY Suite Animation Tool. Proceedings ofthe 27th International Conference on Application Theory of Petri Nets and OtherModels of Concurrency (ICATPN 2006), Lecture Notes in Computer Science 4024,Springer, pages 431-440, 2006.
6. A.K. Alves de Medeiros, and C.W. Gunther. Scheduling with timed automata.Theor. Comput. Sci., 354(2):272–300, 2006.
7. W.M.P. van der Aalst, A.J.M.M. Weijters, and L. Maruster. Workflow Mining:Discovering Process Models from Event Logs. IEEE Transactions on Knowledgeand Data Engineering, 16(9):1128-1142, 2004.
8. W.M.P. van der Aalst, B.F. van Dongen, C.W. Gnther, R.S. Mans, A.K. Alvesde Medeiros, A. Rozinat, V. Rubin, M. Song, H.M.W. Verbeek, and A.J.M.M.Weijters. ProM 4.0: Comprehensive Support for Real Process Analysis. In J. Kleijnand A. Yakovlev, editors, Application and Theory of Petri Nets and Other Models ofConcurrency (ICATPN 2007), volume 4546 of Lecture Notes in Computer Science,pages 484-494. Springer-Verlag, Berlin, 2007.
9. L. Lorenstsen, A.-P. Touvinene, J. Xu. Modelling Feature Interaction Patterns inNokia Mobile Phones using Coloured Petri Nets and Design/CPN. In K. Jensen

(ed.) Proceedings of the Third Workshop and Tutorial on Practical Use of ColouredPetri Nets and CPN Tools, 2001.
10. L. Lorentsen. Modelling and Analysis of a Flowmeter System. Proceedings ofWorkshop and Tutorial on Practical Use of Coloured Petri Nets and Design/CPN,1999.