form - v - tata steel
TRANSCRIPT

FORM - V
(See Rule -14)
ENVIRONMENT STATEMENT FOR THE FINANCIAL YEAR ENDING THE 31st MARCH, 2017
SUKINDA CHROMITE MINE, TATA STEEL LTD.
PART-A
1. Name and address of the owner/ : Sukinda Chromite Mine Occupier of the industry, operation : Tata Steel Ltd., P.O-Kalarangiatta : Dist. - Jajpur, Orissa -755028 Agent : Mr.Rajesh Patel Nominated Owner : Mr.T V Narendran, Managing Director Tata Steel Ltd., Jamshedpur 2. Industry Category : Major
3. Production Capacity : Chrome Ore (ROM) : 2.4 MTPA : Pyroxenite Ore (ROM) : 0.5 MTPA : Chrome Concentrate : 0.65 MTPA 4. Year of establishment : 20.12.1960 5. Date of submission of previous : 29th September’ 2016 Environment Audit Report.
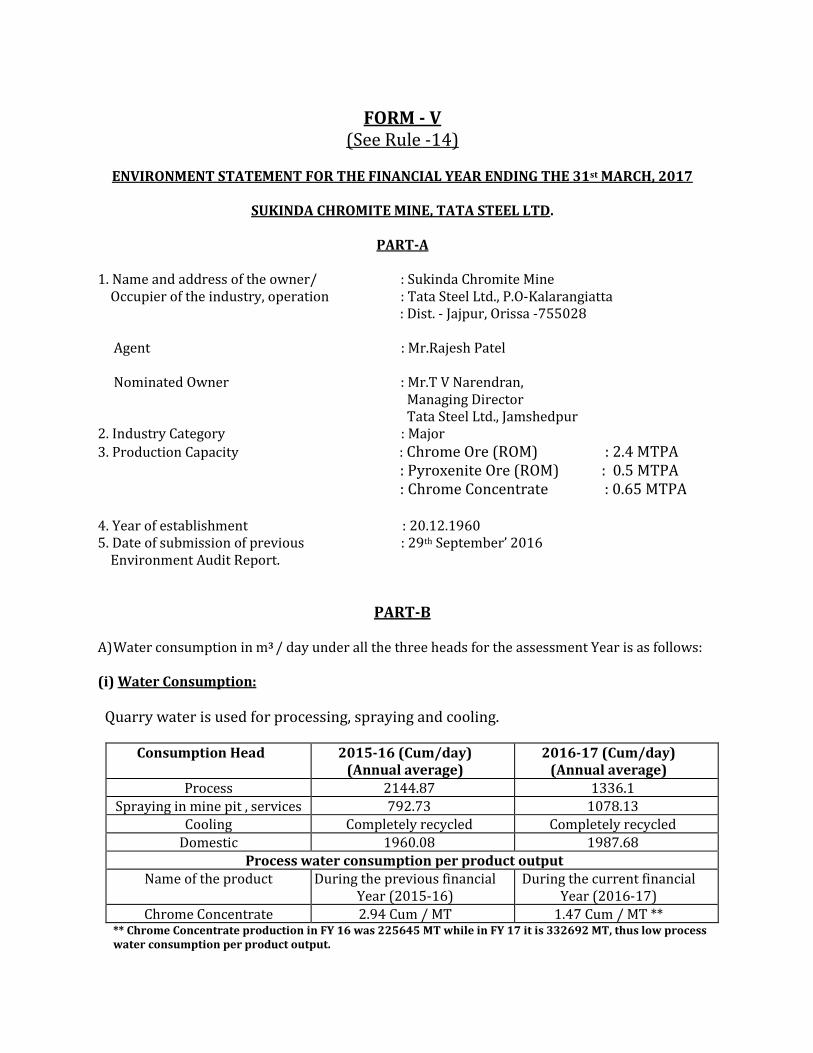
PART-B A) Water consumption in m3 / day under all the three heads for the assessment Year is as follows: (i) Water Consumption:
Quarry water is used for processing, spraying and cooling.
Consumption Head
2015-16 (Cum/day) (Annual average)
2016-17 (Cum/day) (Annual average)
Process 2144.87 1336.1 Spraying in mine pit , services 792.73 1078.13
Cooling Completely recycled Completely recycled Domestic 1960.08 1987.68
Process water consumption per product output Name of the product
During the previous financial
Year (2015-16) During the current financial
Year (2016-17) Chrome Concentrate 2.94 Cum / MT 1.47 Cum / MT **
** Chrome Concentrate production in FY 16 was 225645 MT while in FY 17 it is 332692 MT, thus low process water consumption per product output.
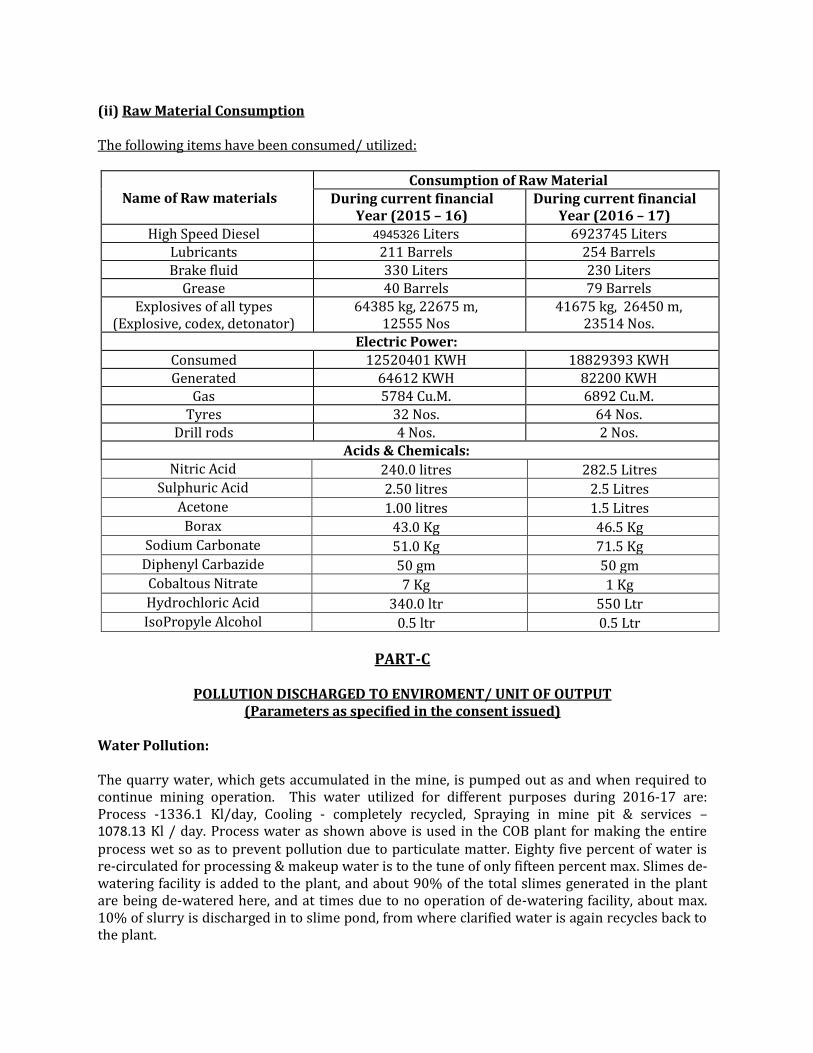
(ii) Raw Material Consumption The following items have been consumed/ utilized:
Name of Raw materials Consumption of Raw Material
During current financial Year (2015 – 16)
During current financial Year (2016 – 17)
High Speed Diesel 4945326 Liters 6923745 Liters Lubricants 211 Barrels 254 Barrels Brake fluid 330 Liters 230 Liters
Grease 40 Barrels 79 Barrels Explosives of all types
(Explosive, codex, detonator) 64385 kg, 22675 m,
12555 Nos 41675 kg, 26450 m,
23514 Nos. Electric Power:
Consumed 12520401 KWH 18829393 KWH Generated 64612 KWH 82200 KWH
Gas 5784 Cu.M. 6892 Cu.M. Tyres 32 Nos. 64 Nos.
Drill rods 4 Nos. 2 Nos. Acids & Chemicals:
Nitric Acid 240.0 litres 282.5 Litres Sulphuric Acid 2.50 litres 2.5 Litres
Acetone 1.00 litres 1.5 Litres Borax 43.0 Kg 46.5 Kg
Sodium Carbonate 51.0 Kg 71.5 Kg Diphenyl Carbazide 50 gm 50 gm Cobaltous Nitrate 7 Kg 1 Kg Hydrochloric Acid 340.0 ltr 550 Ltr IsoPropyle Alcohol 0.5 ltr 0.5 Ltr
PART-C
POLLUTION DISCHARGED TO ENVIROMENT/ UNIT OF OUTPUT (Parameters as specified in the consent issued)
Water Pollution: The quarry water, which gets accumulated in the mine, is pumped out as and when required to continue mining operation. This water utilized for different purposes during 2016-17 are: Process -1336.1 Kl/day, Cooling - completely recycled, Spraying in mine pit & services – 1078.13 Kl / day. Process water as shown above is used in the COB plant for making the entire process wet so as to prevent pollution due to particulate matter. Eighty five percent of water is re-circulated for processing & makeup water is to the tune of only fifteen percent max. Slimes de-watering facility is added to the plant, and about 90% of the total slimes generated in the plant are being de-watered here, and at times due to no operation of de-watering facility, about max. 10% of slurry is discharged in to slime pond, from where clarified water is again recycles back to the plant.
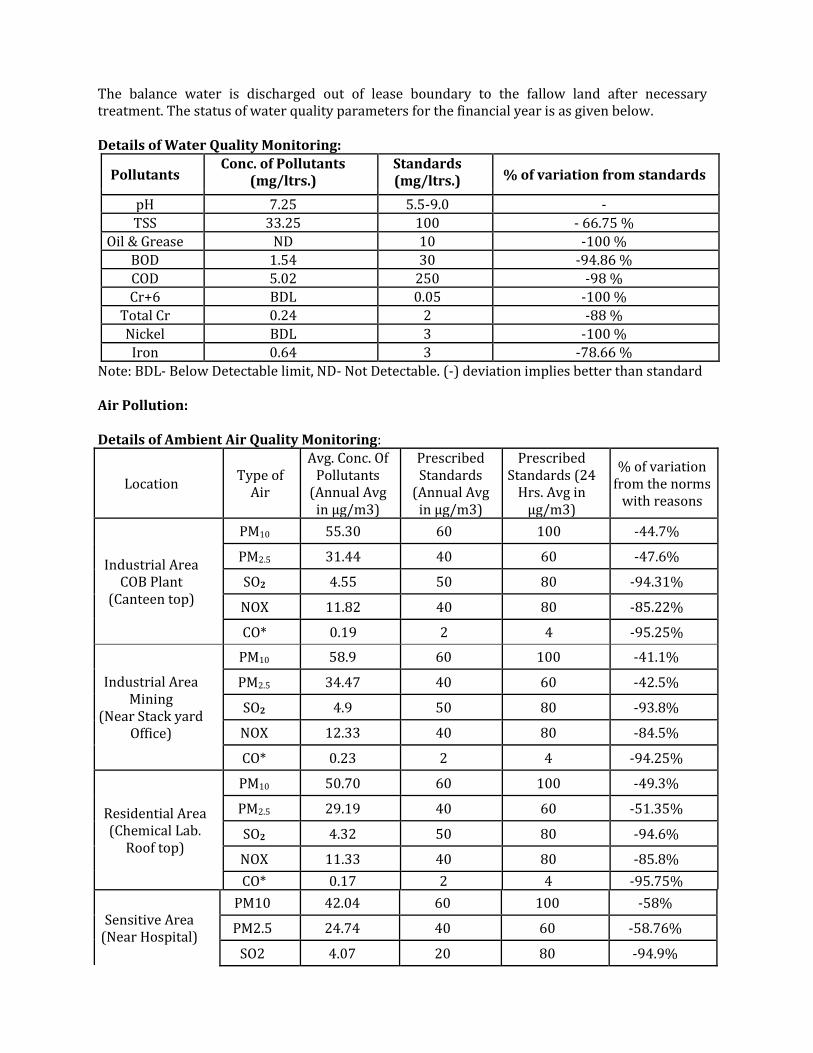
The balance water is discharged out of lease boundary to the fallow land after necessary treatment. The status of water quality parameters for the financial year is as given below. Details of Water Quality Monitoring:
Pollutants Conc. of Pollutants
(mg/ltrs.) Standards (mg/ltrs.) % of variation from standards
pH 7.25 5.5-9.0 -
TSS 33.25 100 - 66.75 %
Oil & Grease ND 10 -100 %
BOD 1.54 30 -94.86 %
COD 5.02 250 -98 %
Cr+6 BDL 0.05 -100 %
Total Cr 0.24 2 -88 %
Nickel BDL 3 -100 %
Iron 0.64 3 -78.66 %
Note: BDL- Below Detectable limit, ND- Not Detectable. (-) deviation implies better than standard Air Pollution: Details of Ambient Air Quality Monitoring:
Location Type of
Air
Avg. Conc. Of Pollutants
(Annual Avg in µg/m3)
Prescribed Standards
(Annual Avg in µg/m3)
Prescribed Standards (24
Hrs. Avg in µg/m3)
% of variation from the norms
with reasons
Industrial Area COB Plant
(Canteen top)
PM10 55.30 60 100 -44.7%
PM2.5 31.44 40 60 -47.6%
SO2 4.55 50 80 -94.31%
NOX 11.82 40 80 -85.22%
CO* 0.19 2 4 -95.25%
Industrial Area Mining
(Near Stack yard Office)
PM10 58.9 60 100 -41.1%
PM2.5 34.47 40 60 -42.5%
SO2 4.9 50 80 -93.8%
NOX 12.33 40 80 -84.5%
CO* 0.23 2 4 -94.25%
Residential Area (Chemical Lab.
Roof top)
PM10 50.70 60 100 -49.3%
PM2.5 29.19 40 60 -51.35%
SO2 4.32 50 80 -94.6%
NOX 11.33 40 80 -85.8%
CO* 0.17 2 4 -95.75%
Sensitive Area (Near Hospital)
PM10 42.04 60 100 -58%
PM2.5 24.74 40 60 -58.76%
SO2 4.07 20 80 -94.9%

NOX 10.44 30 80 -87%
CO* 0.13 2 4 -96.75%
Mining Complex
PM10 46.5 60 100 -53.5%
PM2.5 27.01 40 60 -55%
SO2 4.15 50 80 -94.85%
NOX 10.9 40 80 -86.37%
CO* 0.15 2 4 -96.25%
Near Tailing Pond
PM10 37.69 60 100 -62.3%
PM2.5 22.2 40 60 -63%
SO2 4.04 50 80 -95%
NOX 9.98 40 80 -87.5%
CO* 0.12 2 4 -97%
Note: *Unit of measure for CO is mg/m3 , (-) deviation implies better than standard This is an opencast mine and does not have any single point source of air pollution. Hence, quantitative estimation of air pollutants discharged in Kg/day cannot be ascertained. The above ambient air quality data shows that the concentrations of the pollutants are well within the permissible standards.
PART-D
HAZARDOUS WASTES
As specified under the Hazardous Waste (Management, Handling and Transboundary) Rules, 2008 and amendment thereof
Hazardous Wastes
Total Quantity During the Previous
Financial Year ( 2015-16) During the Current
Financial Year ( 2016-17) I) From Process: Used Oil Waste containing Oil Waste Battery ETP Sludge
40.6 MT 1.10 MT 166 Nos.
148.170 MT
41 MT
10.08 MT 178 Nos. 97.27 MT
II) From Pollution Control Facility: Waste oil from oil & grease
separation pit Sludge from oil and grease
separation pit
Included in the Item I
Included in the Item I

PART-E
SOLID WASTES
Sources
TOTAL QUALITY During the Current Year
(2015-16) During the Current Year
(2016-17) a) From Process: From Mining as Overburden From COB plant as Tailing From Canteen, Office, Colony etc b) From Pollution Control Facility c) i. Quantity recycled or reused within the unit ii. Quantity sold
General Office Waste iii. Quantity disposed
Mining overburden Canteen and colony waste
66.17 Lakh Cum 347774.638 MT
0.54 MT Not Applicable
Study under Progress
1.65 MT
6616921 Cum Organic wastes are disposed off in the bio gas plant & in compost pits.
50.3 Lakh Cum
454632 MT 0.75 MT
Not Applicable Study under Progress
1.3 MT
5030651 Cum Organic wastes are disposed off in the bio gas plant & in compost pits.
The slime generated from the beneficiation plant has a potential mineral value. So it is pumped into the tailing/slime pond where it is stored for future use.
PART-F
THE CHARACTERISTICS (in terms of composition and quantum) OF HAZARDOUS AS WELL AS SOLID WASTES AND INDICATE DISPOSAL PRACTICE ADOPTED FOR BOTH THESE
CATEGORIES OF WASTES.
The composition of hazardous wastes like used oil &waste containing oil are Gear oil: SP460, 320, 220 & 90, Hydraulic oil: 68, 10, 46, and 100, Mobil oil: 20W40, 30, 40 Transformer oil, Grease: Senogem EP2, KG 10. The composition of ETP sludge is compounds of Cr, Fe, Ni, Al, Si, etc. The composition of the solid wastes (overburden) contains nickeliferous limonite, serpentinite, and quartzite. DISPOSAL PRACTICE:- a) SOLID WASTES: The overburden is systematically and scientifically dumped on a geologically barren area and properly supported with hard material and the same is being reclaimed by plantation after being declared inactive.
The organic wastes from the canteen and other places are stored in buckets (3 cum capacity) which are later on disposed on the over burden dumps to enrich the nutrient content. This has been found to hasten the plant growth and the seeds contained in the vegetable waste have contributed to the green cover in the dumps. They are also disposed in compost pits.

The food and vegetable wastes from the canteens of the mine, plant, hospital, guest house, clubs etc. are processed in bio-gas plants (two nos.). While the gas generated is used for cooking, the waste is used as manure.
The municipal solid wastes (other than above) are segregated as per their characteristics e.g. paper, jute bags, tins, bottles, plastics, metal scraps etc. and are sold to a party at Cuttack for recycling. The inert material like building debris etc. is used as landfills development of landscapes etc. b) HAZARDOUS WASTE: ETP Sludge: ETP sludge removed from the ETP is kept in an impervious pit so that the moisture from the sludge gets evaporated and it becomes easy to handle the material. After drying, it is disposed by OSPCB authorized party “Orissa Waste Management Project, a Division of M/s Ramky Enviro Engineers Ltd” which disposes the ETP sludge at their Common Hazardous Waste- Treatment Storage Disposal Facility (CHWTSDF) located at Kanchichuan near Sukinda of Jajpur district. Used Oil: The waste oil generated at various sources is collected in leak proof barrels and then are kept under a covered roof and on concrete platforms (Capacity – 200 Kl) in the barrels very carefully and sealed properly to avoid any spillage or leakage. The storage area is properly fenced and caution board displayed. During transfer of waste oil to barrels, a trough is placed underneath in order to prevent land contamination due to oil spillage. Then at a fixed interval, these barrels are disposed through auction to the authorized recycler after due intimation to State Pollution Control Board. After dispatch of same, intimation of auction along with copy of manifest is also being sent to State Pollution Control Board Waste containing Oil: Oil soaked jutes, filter and filter materials are produced during the schedule maintenance and repair of the vehicles from the workshop. It is stored in the HDPE lined placer dumper buckets. The HDPE enclosure prevents contamination of land and water bodies. Oil soaked sand/soil are stored in a vat made before the oil and grease separation system. Water is added to make the waste free from oil. The oil containing water is led to oil and grease separation system and the sand/soil is disposed off like filters and filter material mentioned above. We have made an agreement with M/s West Bangal Waste Management Limited, a division of Ramky Enviro Engineers Limited located at Haldia, West Bangal to dispose the waste containing oil falling in line with the recent directive from Member Secretary, State Pollution Control Board, Orissa vide his letter no. 14315/ IND-IV-Misc,-256, dated 04.09.09.
c) WASTE BATTERIES :
The used lead acid batteries with diluted acid and caps intact are kept under a shed having impervious floor. Then at a fixed interval, these batteries are disposed through auction to the
authorized recycler after due intimation to State Pollution Control Board. After dispatch of same, intimation of auction along with copy of manifest is also being sent to State Pollution Control Board.
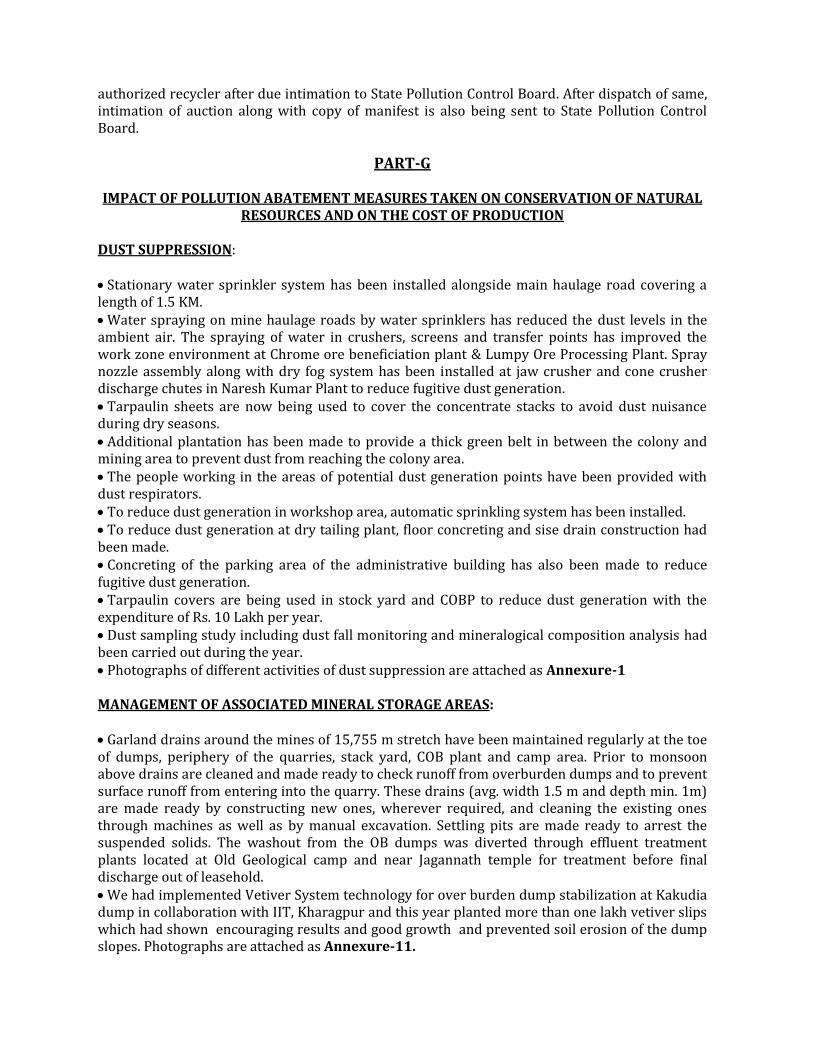
PART-G
IMPACT OF POLLUTION ABATEMENT MEASURES TAKEN ON CONSERVATION OF NATURAL RESOURCES AND ON THE COST OF PRODUCTION
DUST SUPPRESSION: Stationary water sprinkler system has been installed alongside main haulage road covering a length of 1.5 KM. Water spraying on mine haulage roads by water sprinklers has reduced the dust levels in the ambient air. The spraying of water in crushers, screens and transfer points has improved the work zone environment at Chrome ore beneficiation plant & Lumpy Ore Processing Plant. Spray nozzle assembly along with dry fog system has been installed at jaw crusher and cone crusher discharge chutes in Naresh Kumar Plant to reduce fugitive dust generation. Tarpaulin sheets are now being used to cover the concentrate stacks to avoid dust nuisance during dry seasons. Additional plantation has been made to provide a thick green belt in between the colony and mining area to prevent dust from reaching the colony area. The people working in the areas of potential dust generation points have been provided with dust respirators. To reduce dust generation in workshop area, automatic sprinkling system has been installed. To reduce dust generation at dry tailing plant, floor concreting and sise drain construction had been made. Concreting of the parking area of the administrative building has also been made to reduce fugitive dust generation. Tarpaulin covers are being used in stock yard and COBP to reduce dust generation with the expenditure of Rs. 10 Lakh per year. Dust sampling study including dust fall monitoring and mineralogical composition analysis had been carried out during the year. Photographs of different activities of dust suppression are attached as Annexure-1 MANAGEMENT OF ASSOCIATED MINERAL STORAGE AREAS: Garland drains around the mines of 15,755 m stretch have been maintained regularly at the toe of dumps, periphery of the quarries, stack yard, COB plant and camp area. Prior to monsoon above drains are cleaned and made ready to check runoff from overburden dumps and to prevent surface runoff from entering into the quarry. These drains (avg. width 1.5 m and depth min. 1m) are made ready by constructing new ones, wherever required, and cleaning the existing ones through machines as well as by manual excavation. Settling pits are made ready to arrest the suspended solids. The washout from the OB dumps was diverted through effluent treatment plants located at Old Geological camp and near Jagannath temple for treatment before final discharge out of leasehold. We had implemented Vetiver System technology for over burden dump stabilization at Kakudia dump in collaboration with IIT, Kharagpur and this year planted more than one lakh vetiver slips which had shown encouraging results and good growth and prevented soil erosion of the dump slopes. Photographs are attached as Annexure-11.

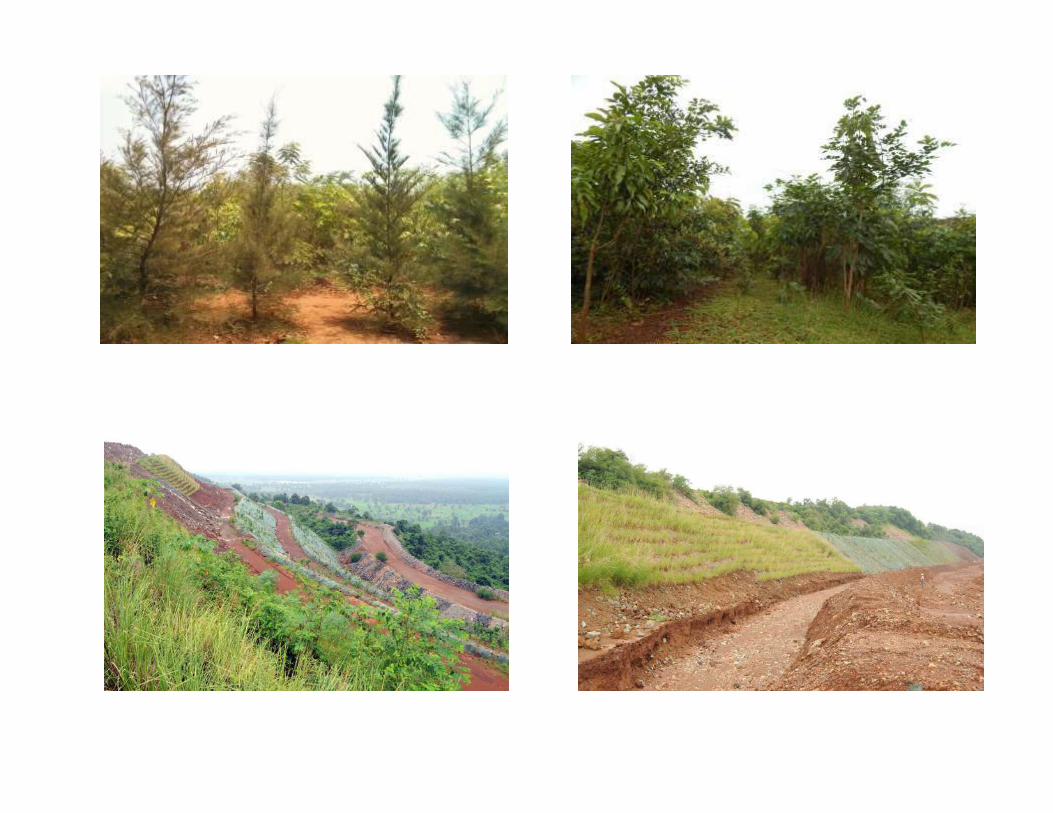
Hard rocky material was dumped at outer slope of running overburden dump benches to stop erosion of dump slope. Boulder patching had also been done on critical places of the dump to prevent wash out by channelizing the storm water through rocky patches. To prevent soil erosion and to stabilize the dump slope of associated minerals, 95,000 m2 slope area was planted with 33,000 Nos. of native variety plants during the year FY 2016-17. Besides this, more than 1,10,000 nos. of vetiver slips had been planted along the dump slopes for dump slope stabilization. We had also planted about 8000 plants in miyawaki method on the dump slope which had shown encouraging growth and survival. Company has engaged CIMFR for dump stability study and IMMT Bhubaneswar for dump soil testing during the year. NIT Rourkela has conducted a study on the drainage pattern of the mines and has suggested effective recommendations for proper drainage of storm water and to ensure dump slope stabilization. Photographs of dumps management activities are attaches as Annexure-2.
SOLID WASTE MANAGEMENT: Organic waste of canteen was put to the bio-gas plant made near canteen for the purpose. Organic waste of Hospital, Guest House& Valley club are also put to the bio-gas plant made near Valley club and other biodegradable waste including plant wastes are put in the overburden dumps to improve the nutrient content and thereby the plant growth. Each work place has been provided with containers for segregation of solid wastes depending on its characteristics for proper management. All the houses in the camp have been provided with two separate buckets for storage of degradable and non-degradable waste separately for safe disposal. Compost pits have been built from which compost is being used for plantation activities. WATER TREATMENT & RECYCLING: During 2016-17 company has spent nearly Rs. 65.00 Lakh towards mine water treatment to ensure that the water quality meets all the parameters as prescribe by the statutory authorities. The oil and grease separation system was in effective operation for treating workshop effluent. For operation & maintenance of the system the company has spent an amount of nearly Rs. 4 Lakh during the period. Herbal Treatment Plant is in use at our COB Plant for treatment of Hexavalent Chromium in the chrome concentrate. The water from tailing dam is recycled back to COBP for further reuse. Company has introduced single line intake system at COB Plant to monitor and reduce water consumption. One state- of- the- art, brand new integrated Effluent Treatment Plant with 4500 cum/hr capacity with on-line monitoring of parameters had been commissioned inside the mine for effective treatment of the mine discharge water and its recycling e and reuse. Rain water harvesting study had been conducted and one roof top harvesting structure had been constructed inside General Office premises which will be also extended to other buildings. Photographs of water treatment are attached as Annexure-3.

ENVIRONMETNAL MONITORING: An amount of Rs.49.63 Lakh was spent towards monitoring of various environmental
parameters. This consists of air quality monitoring at a frequency of twice in a week with 24 hourly sampling and water quality monitoring once in a month for all the parameters.
Weather monitoring is done through automatic weather monitoring station and compiled report on rain fall, humidity, temperature, wind speed, wind direction etc.
PREVENTION OF LAND CONTAMINATION: The entire area of the HEMM maintenance workshop has “Epoxy Flooring” for preventing any oil to reach the soil or ground. Usage of movable oil collection tray with built in pneumatic oil pump during any kind of HEMM maintenance to reduce oil leakage incidents. Targets have been put at various concerned locations to reduce the leakage/ spillage of oil which are monitored in a structured manner as per the laid down EMS procedure. Installation of one water column near the pit maintenance shop has reduced the lead distance significantly thereby reducing the diesel consumption considerably. Introduction of barrel handler for handling of oil barrels to reduce oil leakage and spillage. Introduction of off line oil cleaner resulting in enhancement of oil life (increased oil replacement interval) and thereby reducing waste oil generation. Modification of the hose kits in CAT dumper that has resulted in oil consumption. Separate dust bins have been provided at COB Plant and workshop for collection of oil soaked waste to prevent contamination of land. Photographs of Oil Separation Pit are attached as Annexure-4. AFFORESTATION: A total of 33,000 Nos. of saplings of native varieties were planted during 2016-17 to stabilize 95,000 sq.m. of overburden dumps. Apart from the above, we had distributed more than 6000 numbers of fruit bearing saplings to the nearby villagers for improvement of environment. The previous year plantations were maintained and the dead plants were replaced to maintain the original no. of plants planted at the beginning. Miyawaki method of plantation is being practiced on dump slopes covering area of nearly 3000 m2 which has resulted in better growth of plants. Vetiver system technology had been implemented for over burden dump stabilization at Kakudia dump and more about 110000 nos of vetiver slips had been planted during the year with considerable growth. Photographs attached as Annexure-11. On the above items, we have spent Rs. 75.5 Lakh. This cost does not include the plantation done by Tata Steel Rural Development Society in the nearby villages. We are also doing coir matting in scientific manner by proper terracing at 1 m height and plantation in every meter horizontally in staggered manner. Further to above, under the guidance of Dr. V. P Upadhyay, Director (S), MoEF, the unit has developed “Demonstration Plantation Plots” on experimental basis during 2011-12 & 2012-13 on Dump Surface and Dump Slope to gain in confidence and set standard operating procedures for its future reclamation and rehabilitation plans. The demonstration plantation plot on Dump surface and slope have been developed over an area of 2000 sq. m each wherein 10000 nos. of saplings of 22 native varieties has been planted. The species include Babul, Khaira, Bel, Kala

Sirisa, Kadamba, Neem, Mahaneem, Palas, Sissoo, Anala, Gambhar, Mahua, Mango, Karanja, Sagwan, Muchkunda, Jamun, Arjuna, Bahada, Barakoli, Harida. Growth of the plants has shown considerable growth in the last 4 years. Photographs of afforestation, coir matting & Demo plot are attached as Annexure-5. NOISE REDUCTION: In-house ambient noise monitoring is carried out once in three months and the noise level has been found to be within the prescribed norms of Noise Pollution (Regulation & Control) Rules, 2000. To reduce the noise level at source, a lot of work has been done at COB plant and in the machines. In all the places proper operational control procedures have been practiced for the same. In the crusher area polymer liners have been fitted to reduce noise. Constant monitoring and adjustment reduced the noise level by 4 dB in 30% of mining equipment deployed in mines, COBP, & LOP Plant All the shovels and haul pack cabins have been air conditioned to prevent adverse impact of dust and noise on the operators. To start with two dozer cabins have been made air conditioned. The DG sets working inside the camp have been provided with acoustic enclosures. The noise outside the acoustic enclosure, at the time of running DG sets measures to be within 45 - 65 dB. Employees working in the noisy areas have been provided earmuffs to reduce impact of noise. Noise mapping study of both core and buffer zone had been conducted. Photographs of noise reduction measures & noise monitoring data are attached as Annexure-6. BEAUTIFICATION: For landscaping and horticultural development in the colony and workplaces an amount of Rs.51 Lakh was spent including watering arrangement to different gardens and plantation sties. SANITATION & WATER SUPPLY: Towards potable water supply for the camp resident, Rs 34.5 lakhs were spent during 2016-17. For sanitation jobs in the residential areas as well as work place and for maintenance of sewer lines and storm water drains, an amount of Rs 50 Lakh was spent. Towards operation & maintenance of full-fledged STP an amount of Rs.6.84 lakh was spent during 2015-16. Company has spent Rs. 2.69 Lakhs for renovation of colony drains and septic tanks. Photographs of Sewage Treatment Plant are attached as Annexure-7. MALARIA ERADICATION: Mines took integrated mosquito control management program to eradicate malaria cases in the colony. For this Rs. 7 lakh was spent in FY 16-17. TSRDS has done several mobile treatment programs in different villages regarding diseases and their remedial measures with full checkup. Mosquito net have been procured by Tata steel for the villagers. Regular medicine distribution and anti-mosquito spray was being spread inside the colony area.

RESOURCE CONSERVATION: The establishment of Chrome ore beneficiation plant has been able to utilize low grade ore having no market to produce beneficiated ore of the desired market value. This has been the best example of our dedication towards the conservation of natural resources, which would otherwise have been wasted. The water from slime dam was also been re-circulated to COB plant for reuse. Tailing dewatering plant has been established in the Chrome Ore Beneficiation (COB) plant premises. Higher and instant recovery of clear water is now possible using filter press process. With this effort, we had achieved reduction in water consumption in the COB plant and eliminated loss of water from the tailing pond. To measure quantities of water used for various purposes like processing & cooling in COBP, sprinkling on mine haul rods and domestic/ human consumption, water meters are installed at the inlet points of each connections. In COB plant translucent sheets have been fixed on the roof for the purpose of reducing wastage of electricity and to reduce water consumption water recycling sump pump with automation was in operation. Documents have been made as per the provisions of ISO-14001: 2014 and targets have been put off reduce generation of solid waste/ overburden to prevent land degradation due to dumping. Composting of garden waste is done at major locations. Different measures have been taken to prevent oil leakage and spillage resulting reduction in 35% oil consumption by equipment and one environmental management programme is going on now for further conservation. Diesel pumps used for pumping water from Damsala River to drinking water treatment plant have been replaced with electric pumps resulting prevention of waste oil generation, leakage of lubricant and diesel, reduction of noise and air pollution. Installation of Fuel indicator, Magnetizer and HSD additives reduces fuel consumption in mining machinery compared to the base year. Vehicular exhaust monitoring for all diesel and petrol driven vehicles is done once in six months as per the provisions of EP Act, 1986.. It has also helped to optimize the HSD and petrol consumption by vehicles. Achieved reduction of oil leakage by 95% and grease by 10% in VS ball mill of COB plant over the years. COBP uses about 85% of re-circulated water. One pump with hydro cyclone and level sensors has been installed in COBP for arresting the washout beneficiated chrome ore concentrate to ensure mineral conservation. Flocculent dosing was changed from pump dosing to gravity dosing, which reduced 8000 running hour of 2 KW motor per year. With the expenditure of Rs. 1.2 Lakhs company has modified the tailing management system which results as reduction of 8000 hours of 75 KW motor per year. With the expenditure of Rs. 1.5 Lakh we installed a single pump to remove slurry during COB plant maintenance, which results reduction of 4 hours of 1850 KW machineries per year. We have installed sun reflectors in Chrome Ore Beneficiation Plant with the expenditure of Rs. 5 Lakhs, which results as 937 KWH energy per light per year. We have installed Turbo Ventilators in Chrome Ore Beneficiation Plant with the expenditure of Rs. 2.50 Lakhs, which results as 1753 KWH energy per year per turbo ventilator. Photographs of sun reflectors & turbo ventilator are attached as Annexure–8.
HEALTH MONITORING: All the employees do undergo periodical medical examination (PME) in hospital in every five years. However, as per the recent notification, PME of all the employees will have to be carried out once in three years for the employees who had attended the age of 45 years or more. As of now, no occupational disease had been reported in our Mine. Accordingly PME of all the departmental and contractor employees are undergone for IME and PME as per the above system. To improve the occupational health and removing the safety hazards at industrial work place, Wellness@Workplace program is also undertaken by the company. The medical facilities are also extended to the local community. Health initiatives in the nearby villages are taken care by our TSRDS unit. Company had conducted series of “health camps”, eye screening camps, blood donation camp, TB awareness camp, cataract screening camp and pulse polio camp etc. The hospital is equipped with all the modern medical equipment like, digital X’ Ray system, critical care equipment for the ICU, one critical care ambulance etc. which has enhanced the medical emergency care facilities to a significant level and served the purpose of the employees as well as the near-by community. ENVIRONMENT AWARENESS: To make the camp residents and local people aware on the environment, the mine celebrated World Environment Day on 5th June’ 2016. Padayatra and mass plantation in villages, was organized. To remember the occasion video show and meetings were organized in the camp and village. Also poster and slogan competition among school children were organized and 40 Nos. of prizes were distributed. “National Pollution Prevention Day” was observed on 2nd December’2016 with wide participation from the employees family members and the local community. As a part of our environment awareness initiative, we had organised a program called JAIBA KALA VIVIDHATA – bio diversity expressed through art and paint on 23rd and 24th January 2017 at Sukinda. A painting competition was organized on the following themes - Mythological Animals, Extinct Animals & Contemporary
Animals which was open for all. World Forestry Day was celebrated on 21st March’2016 with the theme of “Forests and Energy”. Plantation was done within the camp area to commemorate the event. Green Therapy – a workshop on herbal tribal medicine was organized in June 2016. Around 150 villagers and vedyas participated in it and enriched their knowledge about the traditional herbal medicines. Similarly the “Prajatiya Khadyotsab Festival” was also organized to create awareness on different food habits of the indigenous people from the natural sources and preservation of the traditional varieties of pulses like rice in presence of experts from research organizations of national repute to create awareness among the community. Mines Environment and Mineral Conservation week was observed by participation of most of the mines of Bhubaneswar region, under the aegis of Indian Bureau of Mines, Govt. of India. Our mine bagged total 5 number of prizes including the coveted “Par excellence” award for overall best

performance among all participating mines. Apart from it we also won trophies in segments such as Systematic and scientific development of mines, waste dump management and afforestation.. The mine also hosted the environment awareness programme amongst school children, organized by SGAT. Besides the above, from time to knowledge sharing sessions on environment, biodiversity and climate change are also organized by top industry leaders and domain experts to spread awareness among all stake holders. Drive has also been taken to combat climate change. Carbon foot prints of all the units & employees had been mapped and suitable action plan had been initiated to reduce the CO2 emission. Energy audit had also been conducted by ERDA and various actions had also been taken up to reduce the energy consumption level. In order to promote awareness among the employees and community, hoarding boards depicting environment related issues had been put at key locations. Biodiversity conservation program was started with the help of IUCN. The objective of this initiative was to adopt a comprehensive Biodiversity Conservation & Management Policy for Sukinda Chromite Mine to enhance the knowledge on biodiversity conservation among all the stake holders and develop collaborative activities for its implementation. The Comprehensive Biodiversity Plan had been prepared and is under implementation. Campaign for safe segregation and disposal of household waste was organized among camp ladies and environmental awareness was developed. Photos of different programmes conducted are attached in Annexure 12 PERIPHERAL DEVELOPMENT: The Tata Steel Rural Development Society, an independent body of Tata Steel is engaged in peripheral development activities in the nearby villages around the mine. During 2016-17 a total amount of Rs.464.79 Lakh were spent on various plantation programmes, civil projects, agricultural extensions, medical facilities, and sports, cultural and other developmental activities taken up in these villages. The above expenditure does not include statutory payments, the cost of in-built pollution control facilities in the Chrome ore beneficiation plant, and other equipment like wet drilling etc., the wages, medical facilities and other allowance/ facilities given to the concerned employees. The above abatement measures have resulted in improvement of air and water quality, reduction in noise levels, stabilization of dump slopes, conservation of natural resources, prevention of land contamination, proper management of hazardous wastes, greenery and aesthetics in the mine as well as residential areas.

PART-H
ADDITIONAL MEASURES/ INVESTMENT PROPOSAL FOR ENVIRONMENTAL PROTECTION INCLUDING ABATEMENT OF POLLUTION, PREVENTION OF POLLUTION
The following budgetary provisions have been made for 2016-17
Sl No. Item Plan (Lakh) Actual (Lakh)
1 Afforestation 84.19 75.5
2 Dust suppression 180 184.5
3 Treatment of mine discharge & recycling 55.00 65.00
4 Environment & weather , exhaust monitoring 49.63 49.63
5 Horticulture development 54.97 51
6 Drinking water supply 35.00 34.50
7 STP Operation & Maintenance 6.84 6.84
8 Sanitation 51.00 50.00
9 Herbal Treatment 5.00 5.00
9 Malaria Eradication 7.00 7.00
10 Garland drain & storm water drain 2.50 2.69
11 Family planning 1.00 00
12 Slime dam management 10.00 10.50
13 Environment awareness ( EMS) 10.00 13.00
14 Community development through TSRDS 455.28 464.79
15 Hazardous waste management 21.5 6.00
16 Bio medical waste 4.00 3.00
Total 1032.91 1028.95
PART-I
ANY OTHER PARTICULARS FOR IMPROVING THE QUALITY OF THE ENVIRONMENT
Company is committed for prevention of pollution, continual improvement of environmental performance, committed to comply with relevant environmental and other legislation, regulation & other requirements and continual effort are made to minimize the adverse environmental impacts of our activities, products or services.
The mine has already been certified to ISO-14001 (Environment Management System), ISO-9001 (Quality Management System), OHSAS–18001 (Occupational Health and Safety Assessment Series), (SA-8000) Social Accountability system and maintaining the systems satisfactorily.
Rain water harvesting study had been conducted and one roof top harvesting structure had been constructed inside General Office premises which will be also extended to other buildings.
Company has installed a new ETP in modules of 1500 KL/ hr each with total capacity 4500 KL/Hr with an expenditure of around 330 Lakh rupees to cater the future requirement of mine discharge water and surface runoff. The new sophisticated ETP has automated dosing system, clarifocculator, and flash mixture, dry sludge collection system, multi-bed filtration system etc.

Annexure – 1 Dust Control Measures
Stationary Water Sprinkling System

Photograph showing concrete roads
Photograph showing Chrome Concentrates covered with tarpaulins

Photograph showing covering of trucks by tarpaulin
Photograph showing Green Barrier
In front of Mine Office
Between Workshop and Colony Along Northern Boundary of Lease
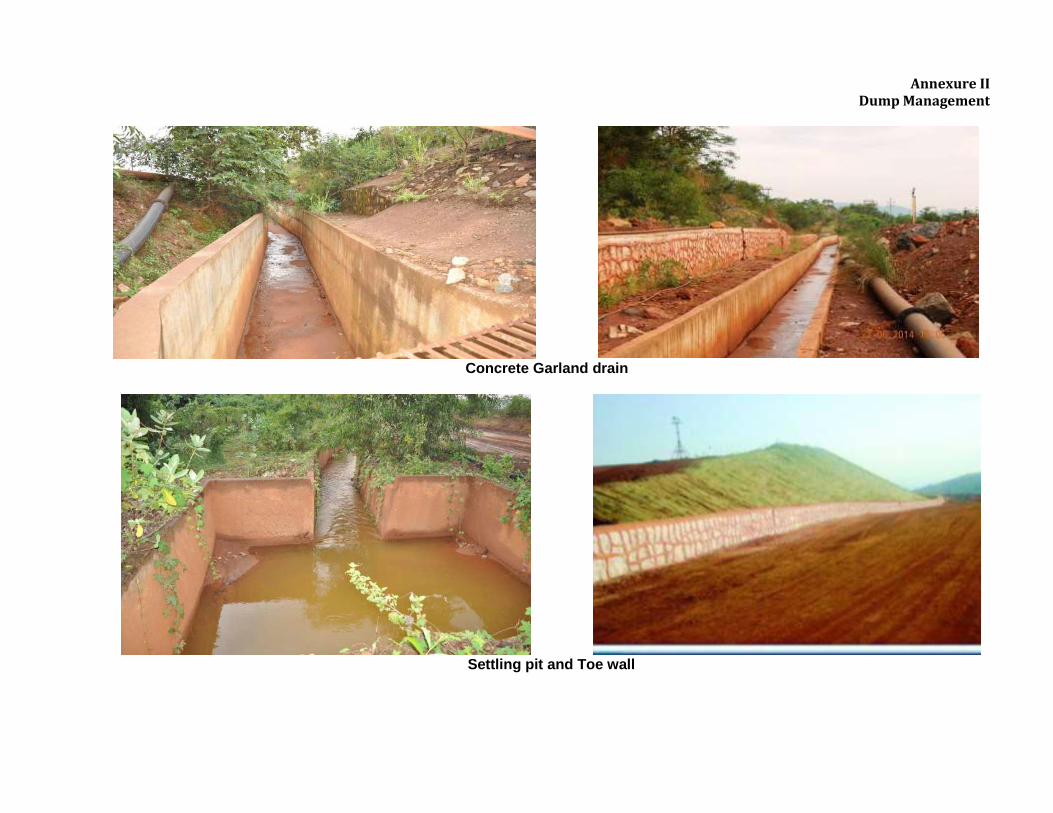
Annexure II Dump Management
Concrete Garland drain
Settling pit and Toe wall

Coir Matting on Dump
Inwardly Slope Dump Top

Plantation on dump area
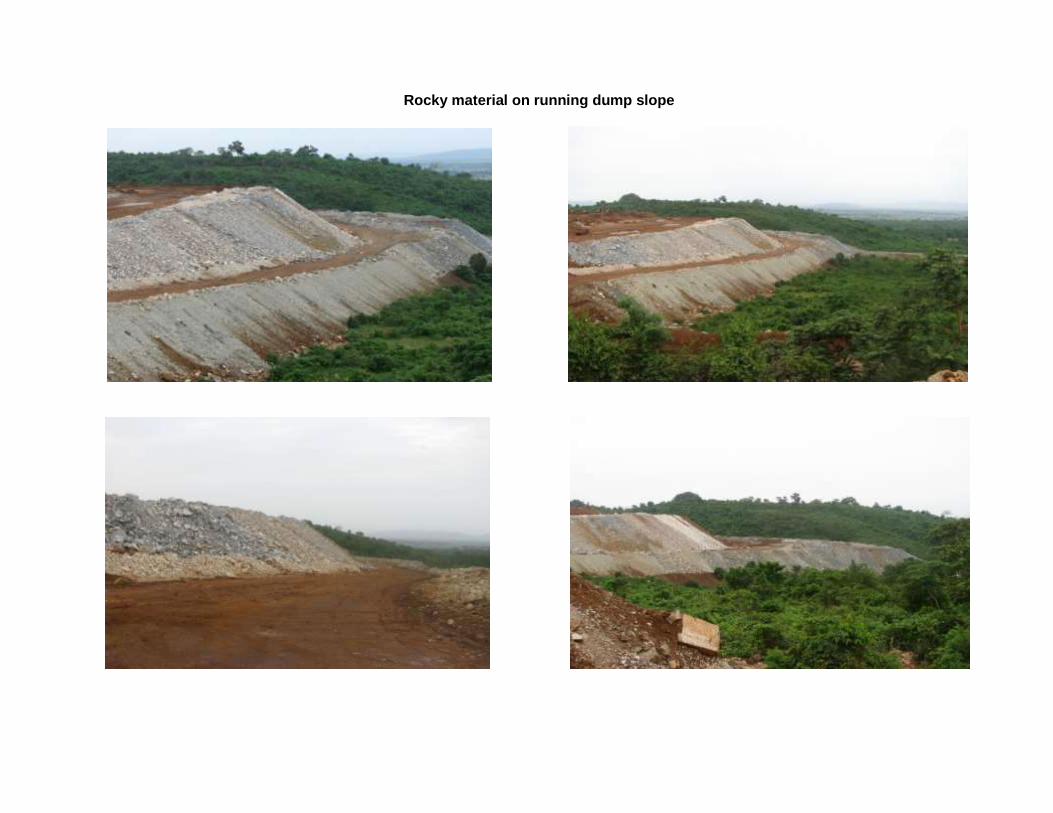
Rocky material on running dump slope

Toe wall along the dump

Drainage System (Concrete Channel)
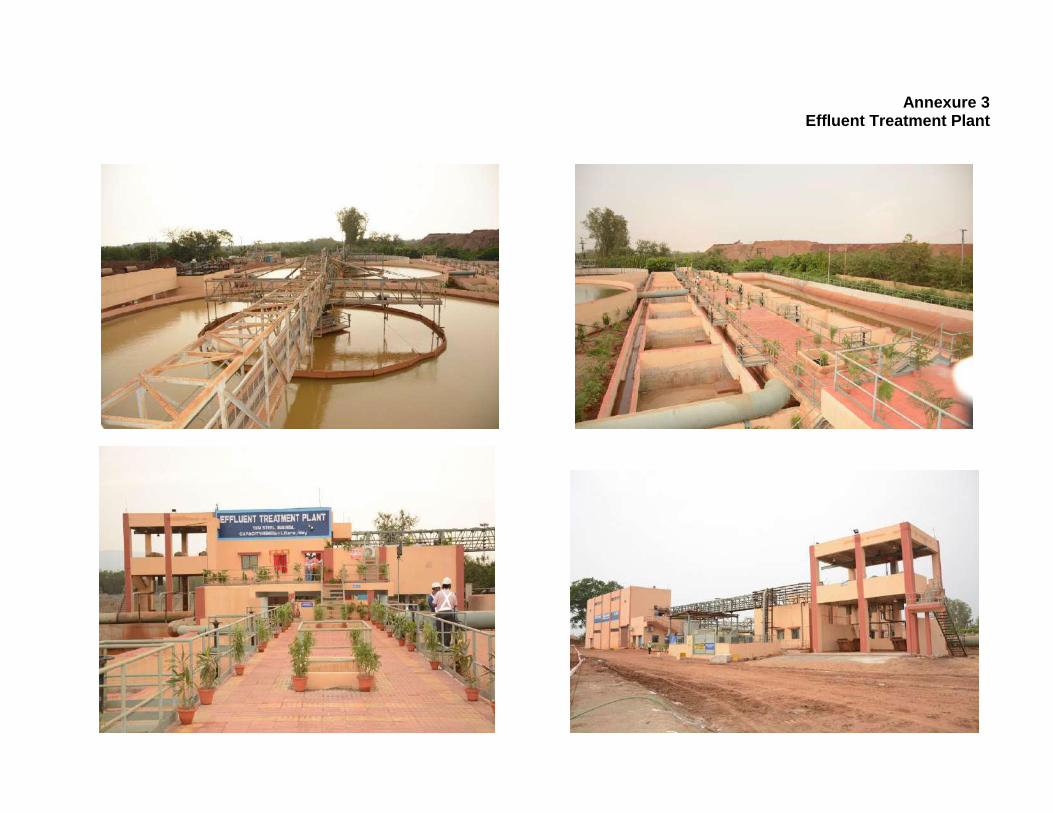
Annexure 3
Effluent Treatment Plant

Herbal Treatment Plant

Annexure IV Oil Separation Plant

Annexure V
Afforestation
Coir matting over dump
Plantation over dump

Annexure – VI Noise Control Measure
Acoustic enclosure for DG set
Air tight air conditioned cabin in HEMM

Annexure VII
Sewage Treatment Plant

Annexure VIII
Energy Conservation Measures
Pipe Lights
Turbo Ventilators
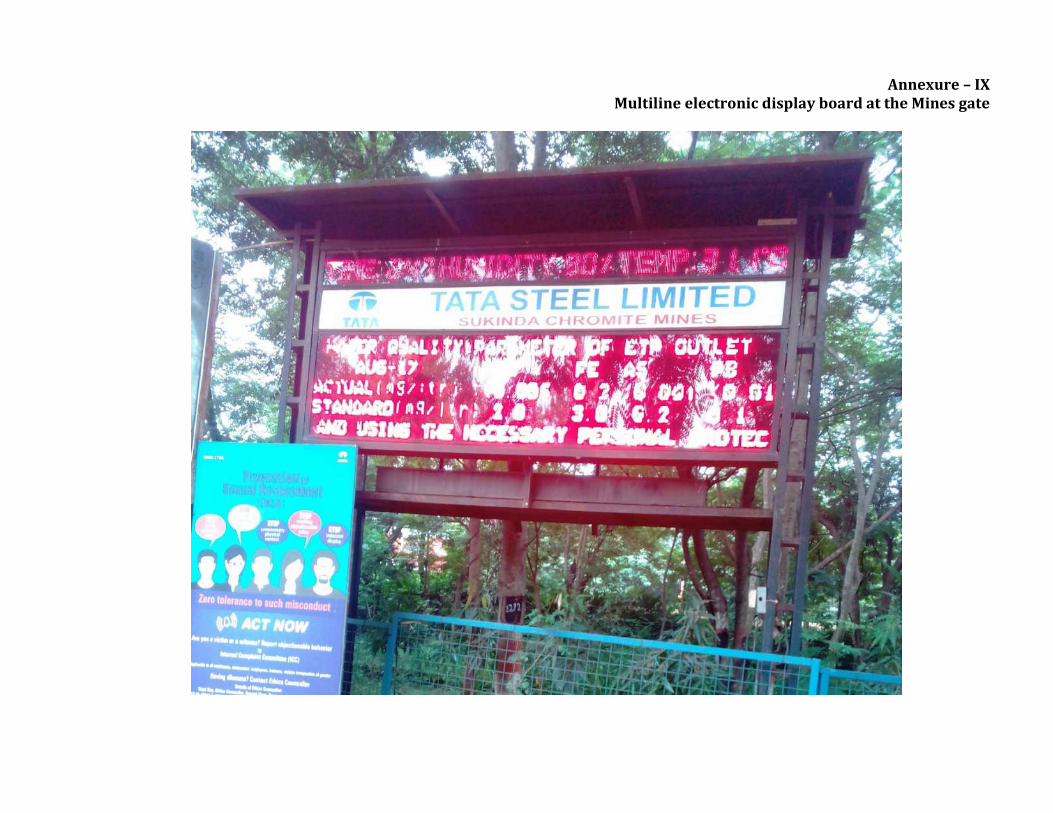
Annexure – IX Multiline electronic display board at the Mines gate

Annexure 10 Ambient Air Quality Report (Annual Average) April’ 16 to March 17
1. COB PLANT
Monthly Average PM10 µg/m3
PM2.5 µg/m3
SO2 µg/m3
NOx µg/m3
CO mg/m3
O3 µg/m3
Pb µg/m3
NH3 µg/m3
Benzene µg/m3
Benzo(a)Pyrene ng/m3
Arsenic ng/m3
Nickel ng/m3
Apr-16 59.56 33.42 4.97 11.76 0.21 6.74 BDL BDL 0.81 BDL BDL BDL
May-16 61.22 34.64 5.00 12.43 0.22 7.04 BDL BDL 0.81 BDL BDL BDL
Jun-16 55.22 31.52 4.56 11.8 0.2 6.3 BDL BDL 0.79 BDL BDL BDL
Jul-16 50.38 28.74 4.22 11.47 0.16 5.93 BDL BDL 0.74 BDL BDL BDL
Aug-16 46.22 26.77 4.13 10.97 0.14 5.89 BDL BDL 0.67 BDL BDL BDL
Sep-16 46.56 26.47 4.18 10.86 0.15 5.66 BDL BDL 0.70 BDL BDL BDL
Oct-16 56.63 32.45 4.58 12.05 0.2 5.39 BDL BDL 0.79 BDL BDL BDL
Nov-16 59.78 33.60 4.57 12.30 0.20 6.63 BDL BDL 0.81 BDL BDL BDL
Dec-16 60.67 34.4 4.98 12.56 0.24 7.1 BDL BDL 0.84 BDL BDL BDL
Jan-17 53.33 30.54 4.39 11.59 0.2 6.09 BDL BDL 0.74 BDL BDL BDL
Feb-17 56.25 31.81 4.48 11.95 0.19 6.25 BDL BDL 0.77 BDL BDL BDL
Mar-17 57.78 32.87 4.57 12.07 0.21 6.5 BDL BDL 0.78 BDL BDL BDL
ANNUAL
AVERAGE 55.30 31.44 4.55 11.82 0.19 6.29 BDL BDL 0.77 BDL BDL BDL
BDL VALUES 5 2 4 9 0.1 5 0.00005 20 0.1 0.1 0.05 0.05
2. STACK YARD
Monthly Average
PM10 µg/m3
PM2.5 µg/m3
SO2 µg/m3
NOx µg/m3
CO mg/m3
O3 µg/m3
Pb µg/m3
NH3 µg/m3
Benzene µg/m3
Benzo(a)Pyrene ng/m3
Arsenic ng/m3
Nickel ng/m3
Apr-16 64.00 36.41 5.38 12.18 0.25 7.16 BDL BDL 0.89 BDL BDL BDL
May-16 67.00 37.77 5.36 13.02 0.27 7.48 BDL BDL 0.90 BDL BDL BDL
Jun-16 60.00 34.18 4.83 12.32 0.24 6.78 BDL BDL 0.86 BDL BDL BDL
Jul-16 55.00 31.73 4.42 11.90 0.19 6.34 BDL BDL 0.80 BDL BDL BDL
Aug-16 50.00 29.30 4.29 11.48 0.17 6.33 BDL BDL 0.73 BDL BDL BDL
Sep-16 52.00 30.19 4.40 11.42 0.17 6.02 BDL BDL 0.75 BDL BDL BDL
Oct-16 62.00 35.13 4.98 12.54 0.24 5.63 BDL BDL 0.85 BDL BDL BDL
Nov-16 64.00 36.32 4.99 12.74 0.24 7.19 BDL BDL 0.88 BDL BDL BDL
Dec-16 68.00 38.58 5.47 13.14 0.28 7.57 BDL BDL 0.93 BDL BDL BDL
Jan-17 58.00 33.06 4.69 12.14 0.23 6.58 BDL BDL 0.81 BDL BDL BDL
Feb-17 62.00 35.15 4.96 12.46 0.24 6.9 BDL BDL 0.85 BDL BDL BDL
Mar-17 63.00 35.81 5.02 12.63 0.25 7.02 BDL BDL 0.85 BDL BDL BDL
ANNUAL
AVERAGE 58.90 34.47 4.90 12.33 0.23 6.75 BDL BDL 0.84 BDL BDL BDL

3. LABORATORY TOP
Monthly Average
PM10 µg/m3
PM2.5 µg/m3
SO2 µg/m3
NOx µg/m3
CO mg/m3
O3 µg/m3
Pb µg/m3
NH3 µg/m3
Benzene µg/m3
Benzo(a)Pyrene ng/m3
Arsenic ng/m3
Nickel ng/m3
Apr-16 54.33 31.24 4.63 11.23 0.18 6.32 BDL BDL 0.75 BDL BDL BDL
May-16 56.00 31.93 4.66 11.77 0.18 6.50 BDL BDL 0.73 BDL BDL BDL
Jun-16 51.00 29.54 4.32 11.38 0.17 5.84 BDL BDL 0.74 BDL BDL BDL
Jul-16 46.22 26.69 4.09 11.02 0.14 5.53 BDL BDL 0.66 BDL BDL BDL
Aug-16 41.89 24.81 4.13 10.57 0.13 5.63 BDL BDL 0.62 BDL BDL BDL
Sep-16 42.67 25.09 4.09 10.49 0.13 5.41 BDL BDL 0.65 BDL BDL BDL
Oct-16 52.13 30.13 4.35 11.51 0.17 5.26 BDL BDL 0.71 BDL BDL BDL
Nov-16 55.56 31.58 4.27 11.83 0.17 6.18 BDL BDL 0.73 BDL BDL BDL
Dec-16 56.11 31.82 4.54 12.01 0.21 6.61 BDL BDL 0.76 BDL BDL BDL
Jan-17 48.44 28.17 4.21 11.07 0.17 5.67 BDL BDL 0.68 BDL BDL BDL
Feb-17 51.63 29.75 4.21 11.45 0.16 5.84 BDL BDL 0.69 BDL BDL BDL
Mar-17 52.44 29.57 4.28 11.58 0.18 6.07 BDL BDL 0.7 BDL BDL BDL
ANNUAL
AVERAGE 50.70 29.19 4.32 11.33 0.17 5.91 BDL BDL 0.70 BDL BDL BDL
4.HOSPITALTOP
Monthly Average
PM10 µg/m3
PM2.5 µg/m3
SO2 µg/m3
NOx µg/m3
CO mg/m3
O3 µg/m3
Pb µg/m3
NH3 µg/m3
Benzene µg/m3
Benzo(a)Pyrene ng/m3
Arsenic ng/m3
Nickel ng/m3
Apr-16 44.89 26.22 4.19 10.43 0.14 5.36 BDL BDL 0.62 BDL BDL BDL
May-16 47.00 27.29 4.16 10.83 0.14 5.58 BDL BDL 0.63 BDL BDL BDL
Jun-16 42.00 24.74 4.08 10.51 0.14 5.31 BDL BDL 0.63 BDL BDL BDL
Jul-16 37.22 21.76 4.00 10.1 0.11 5.1 BDL BDL 0.55 BDL BDL BDL
Aug-16 34.78 20.44 4.02 9.88 0.11 5.19 BDL BDL 0.52 BDL BDL BDL
Sep-16 35.56 21.10 BDL 9.81 0.11 5.14 BDL BDL 0.55 BDL BDL BDL
Oct-16 43.5 25.46 4.04 10.6 0.13 5.05 BDL BDL 0.62 BDL BDL BDL
Nov-16 46.78 27.34 BDL 10.83 0.13 5.28 BDL BDL 0.6 BDL BDL BDL
Dec-16 46.89 27.03 4.11 11.11 0.15 5.59 BDL BDL 0.64 BDL BDL BDL
Jan-17 41 24.3 4.02 10.08 0.13 5.14 BDL BDL 0.57 BDL BDL BDL
Feb-17 42.5 26.35 4.04 10.4 0.13 5.13 BDL BDL 0.54 BDL BDL BDL
Mar-17 42.33 24.83 4.02 10.71 0.14 5.32 BDL BDL 0.58 BDL BDL BDL
ANNUAL
AVERAGE 42.04 24.74 4.07 10.44 0.13 5.27 BDL BDL 0.59 BDL BDL BDL
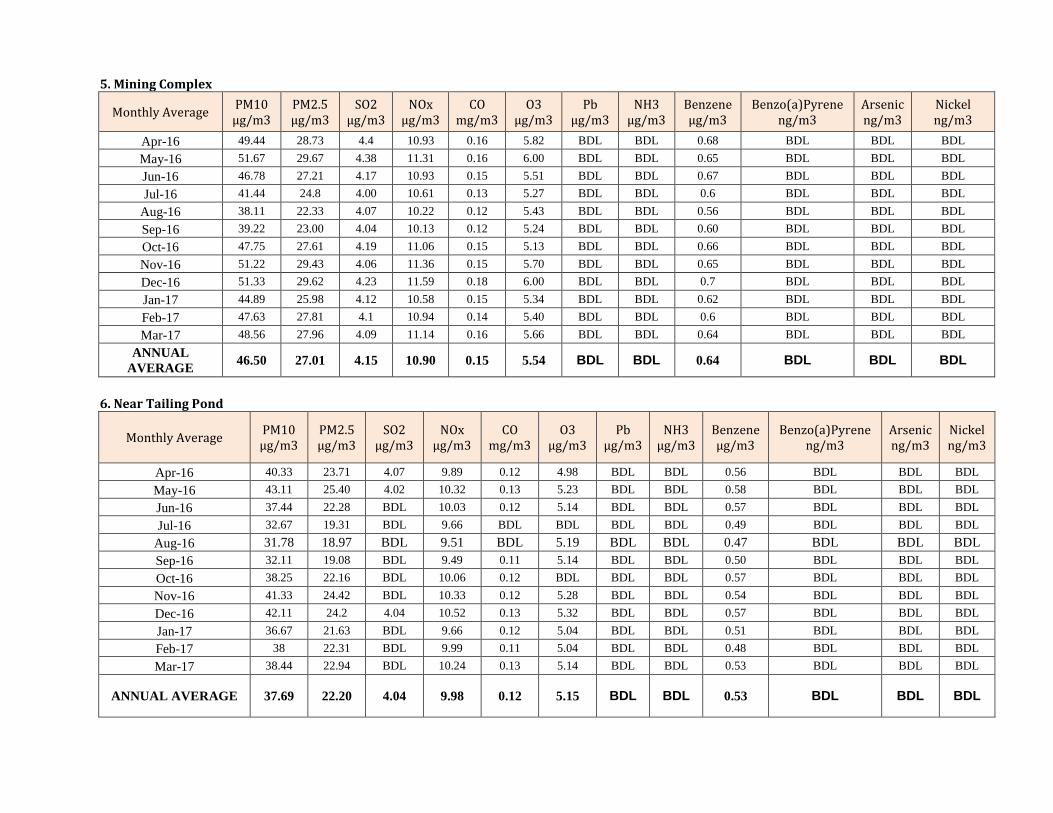
5. Mining Complex
Monthly Average PM10 µg/m3
PM2.5 µg/m3
SO2 µg/m3
NOx µg/m3
CO mg/m3
O3 µg/m3
Pb µg/m3
NH3 µg/m3
Benzene µg/m3
Benzo(a)Pyrene ng/m3
Arsenic ng/m3
Nickel ng/m3
Apr-16 49.44 28.73 4.4 10.93 0.16 5.82 BDL BDL 0.68 BDL BDL BDL
May-16 51.67 29.67 4.38 11.31 0.16 6.00 BDL BDL 0.65 BDL BDL BDL
Jun-16 46.78 27.21 4.17 10.93 0.15 5.51 BDL BDL 0.67 BDL BDL BDL
Jul-16 41.44 24.8 4.00 10.61 0.13 5.27 BDL BDL 0.6 BDL BDL BDL
Aug-16 38.11 22.33 4.07 10.22 0.12 5.43 BDL BDL 0.56 BDL BDL BDL
Sep-16 39.22 23.00 4.04 10.13 0.12 5.24 BDL BDL 0.60 BDL BDL BDL
Oct-16 47.75 27.61 4.19 11.06 0.15 5.13 BDL BDL 0.66 BDL BDL BDL
Nov-16 51.22 29.43 4.06 11.36 0.15 5.70 BDL BDL 0.65 BDL BDL BDL
Dec-16 51.33 29.62 4.23 11.59 0.18 6.00 BDL BDL 0.7 BDL BDL BDL
Jan-17 44.89 25.98 4.12 10.58 0.15 5.34 BDL BDL 0.62 BDL BDL BDL
Feb-17 47.63 27.81 4.1 10.94 0.14 5.40 BDL BDL 0.6 BDL BDL BDL
Mar-17 48.56 27.96 4.09 11.14 0.16 5.66 BDL BDL 0.64 BDL BDL BDL
ANNUAL
AVERAGE 46.50 27.01 4.15 10.90 0.15 5.54 BDL BDL 0.64 BDL BDL BDL
6. Near Tailing Pond
Monthly Average PM10 µg/m3
PM2.5 µg/m3
SO2 µg/m3
NOx µg/m3
CO mg/m3
O3 µg/m3
Pb µg/m3
NH3 µg/m3
Benzene µg/m3
Benzo(a)Pyrene ng/m3
Arsenic ng/m3
Nickel ng/m3
Apr-16 40.33 23.71 4.07 9.89 0.12 4.98 BDL BDL 0.56 BDL BDL BDL
May-16 43.11 25.40 4.02 10.32 0.13 5.23 BDL BDL 0.58 BDL BDL BDL
Jun-16 37.44 22.28 BDL 10.03 0.12 5.14 BDL BDL 0.57 BDL BDL BDL
Jul-16 32.67 19.31 BDL 9.66 BDL BDL BDL BDL 0.49 BDL BDL BDL
Aug-16 31.78 18.97 BDL 9.51 BDL 5.19 BDL BDL 0.47 BDL BDL BDL
Sep-16 32.11 19.08 BDL 9.49 0.11 5.14 BDL BDL 0.50 BDL BDL BDL
Oct-16 38.25 22.16 BDL 10.06 0.12 BDL BDL BDL 0.57 BDL BDL BDL
Nov-16 41.33 24.42 BDL 10.33 0.12 5.28 BDL BDL 0.54 BDL BDL BDL
Dec-16 42.11 24.2 4.04 10.52 0.13 5.32 BDL BDL 0.57 BDL BDL BDL
Jan-17 36.67 21.63 BDL 9.66 0.12 5.04 BDL BDL 0.51 BDL BDL BDL
Feb-17 38 22.31 BDL 9.99 0.11 5.04 BDL BDL 0.48 BDL BDL BDL
Mar-17 38.44 22.94 BDL 10.24 0.13 5.14 BDL BDL 0.53 BDL BDL BDL
ANNUAL AVERAGE 37.69 22.20 4.04 9.98 0.12 5.15 BDL BDL 0.53 BDL BDL BDL

Ambient Air Quality Report in buffer zone April’ 16 to March 17
Sl. No
Location Month of
Monitoring PM10 µg/m3
PM2.5 µg/m3
SO2 µg/m3
NOx µg/m3
CO mg/m3
O3 µg/m3
Pb µg/m3
NH3 µg/m3
Benzene µg/m3
Benzo(a) Pyrene ng/m3
Arsenic ng/m3
Nickel ng/m3
1 Birasal June'16 45 27.5 BDL 10.8 0.14 5.3 BDL BDL 0.68 BDL BDL BDL
Sep'16 35 20.4 BDL 10.1 0.12 BDL BDL BDL 0.59 BDL BDL BDL
Dec'16 52 29.5 BDL 10.9 0.16 5.8 BDL BDL 0.74 BDL BDL BDL
Mar'17 49 28.6 BDL 11.3 0.14 6 BDL BDL 0.71 BDL BDL BDL
2 Kanehipal June'16 39 23.4 BDL 10.2 0.12 5.3 BDL BDL 0.68 BDL BDL BDL
Sep'16 31 17.6 BDL 9.8 0.11 BDL BDL BDL 0.53 BDL BDL BDL
Dec'16 46 26.9 BDL 10.3 0.14 5.3 BDL BDL 0.69 BDL BDL BDL
Mar'17 46 26.5 BDL 10.1 0.12 5.4 BDL BDL 0.66 BDL BDL BDL
3 Kalarangiatta June'16 55 30.6 BDL 11.6 0.18 BDL BDL BDL 0.61 BDL BDL BDL
Sep'16 49 28.1 BDL 11.2 0.16 5.7 BDL BDL 0.66 BDL BDL BDL
Dec'16 63 35.4 4.8 12.1 0.23 6.9 BDL BDL 0.85 BDL BDL BDL
Mar'17 57 32.9 4.6 11.8 0.21 6.2 BDL BDL 0.78 BDL BDL BDL
4 Kaliapani June'16 41 25.8 BDL 10.4 0.13 6.1 BDL BDL 0.74 BDL BDL BDL
Sep'16 36 21.3 BDL 9.9 0.12 BDL BDL BDL 0.58 BDL BDL BDL
Dec'16 54 30.2 BDL 11.2 0.18 6.2 BDL BDL 0.77 BDL BDL BDL
Mar'17 41 26.4 BDL 9.6 0.1 5 BDL BDL 0.64 BDL BDL BDL
5 Kakudia June'16 33 18.2 BDL 9.2 BDL BDL BDL BDL 0.63 BDL BDL BDL
Sep'16 29 17.5 BDL BDL BDL BDL BDL BDL 0.5 BDL BDL BDL
Dec'16 42 25.7 BDL 9.9 0.13 BDL BDL BDL 0.64 BDL BDL BDL
Mar'17 36 21.8 BDL 9.4 0.1 BDL BDL BDL 0.59 BDL BDL BDL
6 Sendashara June'16 28 16.1 BDL BDL BDL BDL BDL BDL 0.56 BDL BDL BDL
Sep'16 31 18.1 BDL BDL BDL BDL BDL BDL 0.44 BDL BDL BDL
Dec'16 48 27.5 BDL 10.5 0.15 5.4 BDL BDL 0.7 BDL BDL BDL
Mar'17 31 16.9 BDL 9.1 BDL BDL BDL BDL 0.51 BDL BDL BDL
7 Laxmidharpr June'16 42 25.7 BDL 10.6 0.13 BDL BDL BDL 0.51 BDL BDL BDL
Sep'16 36 21.7 BDL 9.9 0.11 BDL BDL BDL 0.59 BDL BDL BDL
Dec'16 53 29.6 BDL 10.8 0.17 6.1 BDL BDL 0.76 BDL BDL BDL
Mar'17 45 26.4 BDL 9.8 0.12 5.4 BDL BDL 0.68 BDL BDL BDL
8 Sukarangi June'16 49 28.4 BDL 11.3 0.15 BDL BDL BDL 0.67 BDL BDL BDL
Sep'16 43 25.0 BDL 10.7 0.12 5.2 BDL BDL 0.53 BDL BDL BDL
Dec'16 59 33.1 4.4 11.3 0.2 6.6 BDL BDL 0.82 BDL BDL BDL

Mar'17 54 30.7 4.3 11.7 0.16 6.2 BDL BDL 0.76 BDL BDL BDL
9 Muruabil June'16 30 16.2 BDL BDL BDL BDL BDL BDL 0.54 BDL BDL BDL
Sep'16 27 15.8 BDL BDL BDL BDL BDL BDL 0.48 BDL BDL BDL
Dec'16 40 23.7 BDL 9.6 0.12 BDL BDL BDL 0.61 BDL BDL BDL
Mar'17 33 18.5 BDL BDL BDL BDL BDL BDL 0.55 BDL BDL BDL
10 Kharkhari June'16 42 24.9 BDL 10.5 0.13 BDL BDL BDL 0.68 BDL BDL BDL
Sep'16 38 22.2 BDL 10.1 0.11 BDL BDL BDL 0.62 BDL BDL BDL
Dec'16 52 29 BDL 9.9 0.15 5.8 BDL BDL 0.74 BDL BDL BDL
Mar'17 40 24.8 BDL 9.6 0.11 BDL BDL BDL 0.61 BDL BDL BDL
Annual Average in Buffer Zone
Sl.No Location PM10 µg/m3
PM2.5 µg/m3
SO2 µg/m3
NOx µg/m3
CO mg/m3
O3 µg/m3
Pb µg/m3
NH3 µg/m3
Benzene µg/m3
Benzo(a)Pyrene ng/m3
Arsenic ng/m3
Nickel ng/m3
1 Birasa Birasal AVERAGE 50.50 29.05 BDL 11.10 0.15 BDL BDL BDL 0.73 BDL BDL BDL
2 Kanehipal AVERAGE 46.00 26.70 BDL 10.20 0.13 BDL BDL BDL 0.68 BDL BDL BDL
3 Kalarangiatta AVERAGE 60.00 34.15 4.70 11.95 0.22 BDL BDL BDL 0.82 BDL BDL BDL
4 Kaliapani AVERAGE 47.50 28.30 BDL 10.40 0.14 BDL BDL BDL 0.71 BDL BDL BDL
5 Kakudia AVERAGE 39.00 23.75 BDL 9.65 0.12 BDL BDL BDL 0.62 BDL BDL BDL
6 Sendashara AVERAGE 39.50 22.20 BDL 9.80 0.15 BDL BDL BDL 0.61 BDL BDL BDL
7 Laxmidharpur AVERAGE 49.00 28.00 BDL 10.30 0.15 BDL BDL BDL 0.72 BDL BDL BDL
8 Sukarangi AVERAGE 56.50 31.90 4.35 11.50 0.18 BDL BDL BDL 0.79 BDL BDL BDL
9 Muruabil AVERAGE 36.50 21.10 BDL 9.60 0.12 BDL BDL BDL 0.58 BDL BDL BDL
10 Kharkhari AVERAGE 46.00 26.90 BDL 9.75 0.13 BDL BDL BDL 0.68 BDL BDL BDL

Water Quality Parameters of ETP - Inlet Sukinda Chromite Mine TATA STEEL LTD. (2016-2017)
Feb'16 Mar'16 Apr'16 May'16 June'16 July'16 Aug'16 Sep'16 Oct'16 Nov'16 Dec'16 Jan'17 Feb'17 Mar'17 AVERAGE
Inlet Inlet Inlet Inlet Inlet Inlet Inlet Inlet Inlet Inlet Inlet Inlet Inlet Inlet Inlet
1 Colour & Odour Hazan/- 5.0 /
U/O
CL &
U/O
CL &
U/O
CL &
U/O
CL &
U/O2 & U/O 3 & U/O 4 & U/O 3 & U/O 2 & U/O
CL &
U/O
CL &
U/O
CL &
U/O
CL &
U/O
CL &
U/O
3.5 & U/O
2 Suspended Solids mg/ltr 100 47 53 48 56 49 63 140 127 96 44 69 46 44 49 69.25
3 Particular Size of Suspended
Solids
µ(micr
on)<850 <850 <850 <850 <850 <850 <850 <850 <850 <850 <850 <850 <850 <850 <850 <850
4 PH -- 5.5-9.0 6.7 6.8 6.9 6.8 6.6 6.7 6.21 6.8 6.7 6.8 7.2 7.2 7.4 6.7 6.83
5 Temperature 0c.
Shall not
exceed 5ºC 25 25 25 25 25 25 25 25 25 25 25 25 25 25 25.00
6 Oil & Grease mg/ltr 10 0.7 0.9 0.8 0.9 1.1 0.94 1.1 1 1.1 0.8 0.08 0.09 1.1 0.86 ND
7 Total Residual Chlorine mg/ltr 1 ND ND ND ND ND ND ND ND ND ND ND ND ND ND ND
8 Amm. Nitrogen as N mg/ltr 50 0.39 0.44 0.39 0.46 0.52 0.64 0.72 0.66 0.53 0.36 0.48 0.58 0.44 0.39 0.51
9 Total Kjeldal Nitrogen as NH3 mg/ltr 100 1.27 1.52 1.46 1.63 1.78 1.97 2.12 1.92 1.77 1.24 1.36 1.49 1.31 1.48 1.63
10 Free Ammonia as NH3 mg/ltr 5 0.002 0.003 0.003 0.004 0.005 0.004 0.005 0.004 0.004 0.002 0.004 0.005 0.003 0.004 ND
11 BOD (3) days at 270c. mg/ltr 30 2.65 1.96 1.88 1.96 2.1 2.2 2.34 2.26 4.63 2.62 2.78 2.86 2.86 1.88 2.53
12 COD mg/ltr 250 6.7 5.85 4.9 5.74 6.42 6.57 7.28 7.12 12.8 6.6 7.4 7.8 7.41 5.78 7.15
13 Arsenic as As mg/ltr 0.2 BDL BDL BDL BDL BDL BDL BDL BDL BDL BDL BDL BDL BDL BDL BDL
14 Mercury as Hg mg/ltr 0.01 BDL BDL BDL BDL BDL BDL BDL BDL BDL BDL BDL BDL BDL BDL BDL
15 Lead as Pb mg/ltr 0.1 BDL BDL BDL BDL BDL BDL BDL BDL BDL BDL BDL BDL BDL BDL BDL
16 Cadmium as Cd mg/ltr 2 BDL BDL BDL BDL BDL BDL BDL BDL BDL BDL BDL BDL BDL BDL BDL
17 Hexa Chromium as Cr +6 mg/ltr 0.1 0.23 0.26 0.2 0.18 0.2 0.17 0.13 0.19 0.15 0.22 0.14 0.075 0.07 0.24 0.164
18 Total Chromium as Cr mg/ltr 2 0.28 0.38 0.33 0.29 0.37 0.31 0.21 0.23 0.28 0.26 0.17 0.16 0.34 0.36 0.28
19 Copper as Cu mg/ltr 3 BDL BDL BDL BDL BDL BDL BDL BDL BDL BDL BDL BDL BDL BDL BDL
20 Zinc as Zn mg/ltr 5 0.34 0.43 0.38 0.33 0.44 0.53 0.43 0.56 0.44 0.32 0.44 0.37 0.41 0.38 0.42
21 Selenium as Se mg/ltr 0.05 BDL BDL BDL BDL BDL BDL BDL BDL BDL BDL BDL BDL BDL BDL BDL
22 Nickel as Ni mg/ltr 3 BDL BDL BDL BDL BDL BDL BDL BDL BDL BDL BDL BDL BDL BDL BDL
23 Cyanide as CN mg/ltr 0.2 BDL BDL BDL BDL BDL BDL BDL BDL BDL BDL BDL BDL BDL BDL BDL
24 Fluoride as F mg/ltr 2 0.06 0.08 0.06 0.07 0.09 0.12 0.2 0.19 0.15 0.05 0.07 0.098 0.08 0.07 0.104
25 Diss. Phosphate as P mg/ltr 5 BDL BDL BDL BDL BDL BDL BDL BDL BDL BDL BDL BDL BDL BDL BDL
26 Sulphide as S mg/ltr 2 ND ND ND ND ND ND ND ND ND ND ND ND ND ND BDL
27 Phenolic Compounds as mg/ltr 1 BDL BDL BDL BDL BDL BDL BDL BDL BDL BDL BDL BDL BDL BDL BDL
28 Bio-assay Test
--
90%
survival
of fish
97% 97% 97% 97% 96% 97% 97% 97% 97% 97% 97% 97% 97% 97% 97.00%
29 Manganese as Mn mg/ltr 2 0.029 0.025 0.021 0.028 0.033 0.042 0.036 0.031 0.028 0.027 0.036 0.025 0.033 0.023 0.03
30 Iron as Fe mg/ltr 3 0.38 0.41 0.39 1.1 0.6 0.69 1.4 1.3 0.91 0.36 1.13 0.65 0.68 0.38 0.80
31 Vanadium as V mg/ltr 0.2 BDL BDL BDL BDL BDL BDL BDL BDL BDL BDL BDL BDL BDL BDL BDL
32 Nitrate Nitrogen mg/ltr 10 0.26 0.33 0.26 0.33 0.33 0.41 0.53 0.48 0.39 0.24 0.3 0.24 0.31 0.31 0.34
33 Pesticides (as Benzene hexa μg/l 10 Absent Absent Absent Absent Absent Absent Absent Absent Absent Absent Absent Absent Absent Absent Absent
NB :C.L. Colourless, O.L – Odourless, BDL- Below DetectableLlimit. ND- Not Detectable.
Sl.
NoParameter Unit
Standards
(In land
Surface
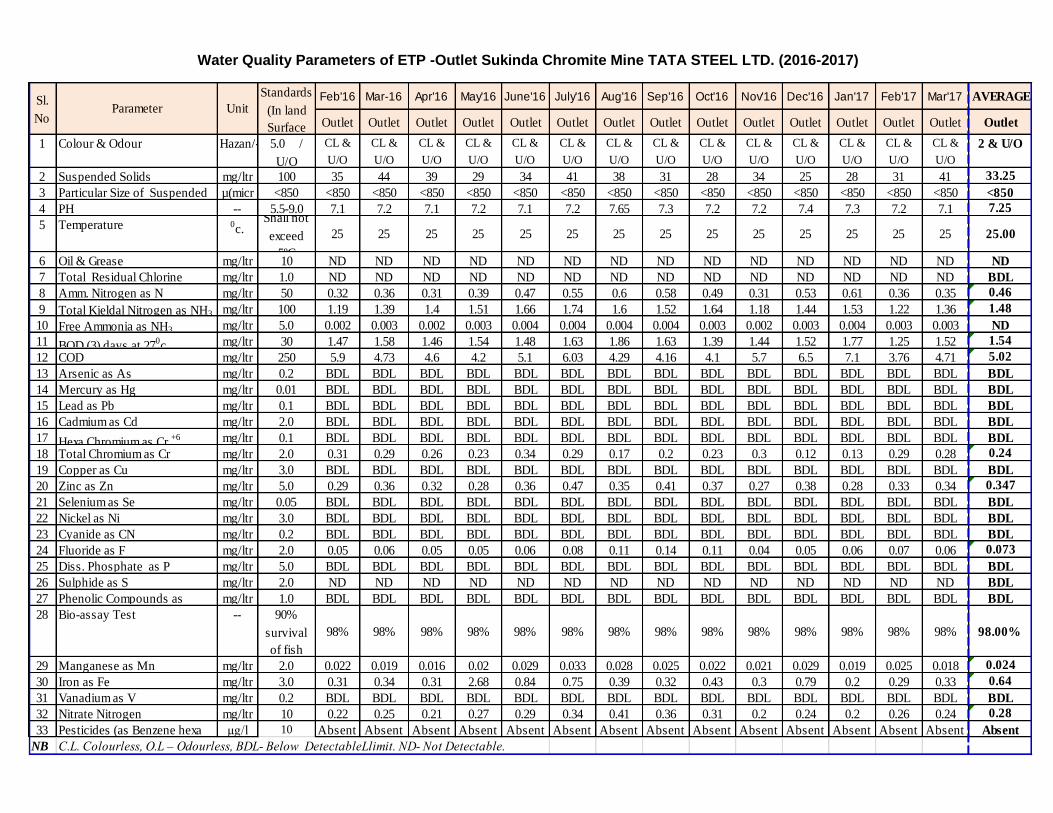
Water Quality Parameters of ETP -Outlet Sukinda Chromite Mine TATA STEEL LTD. (2016-2017)
Feb'16 Mar-16 Apr'16 May'16 June'16 July'16 Aug'16 Sep'16 Oct'16 Nov'16 Dec'16 Jan'17 Feb'17 Mar'17 AVERAGE
Outlet Outlet Outlet Outlet Outlet Outlet Outlet Outlet Outlet Outlet Outlet Outlet Outlet Outlet Outlet
1 Colour & Odour Hazan/- 5.0 /
U/O
CL &
U/O
CL &
U/O
CL &
U/O
CL &
U/O
CL &
U/O
CL &
U/O
CL &
U/O
CL &
U/O
CL &
U/O
CL &
U/O
CL &
U/O
CL &
U/O
CL &
U/O
CL &
U/O
2 & U/O
2 Suspended Solids mg/ltr 100 35 44 39 29 34 41 38 31 28 34 25 28 31 41 33.25
3 Particular Size of Suspended µ(micr <850 <850 <850 <850 <850 <850 <850 <850 <850 <850 <850 <850 <850 <850 <850 <850
4 PH -- 5.5-9.0 7.1 7.2 7.1 7.2 7.1 7.2 7.65 7.3 7.2 7.2 7.4 7.3 7.2 7.1 7.25
5 Temperature 0c.
Shall not
exceed
5ºC
25 25 25 25 25 25 25 25 25 25 25 25 25 25 25.00
6 Oil & Grease mg/ltr 10 ND ND ND ND ND ND ND ND ND ND ND ND ND ND ND
7 Total Residual Chlorine mg/ltr 1.0 ND ND ND ND ND ND ND ND ND ND ND ND ND ND BDL
8 Amm. Nitrogen as N mg/ltr 50 0.32 0.36 0.31 0.39 0.47 0.55 0.6 0.58 0.49 0.31 0.53 0.61 0.36 0.35 0.46
9 Total Kjeldal Nitrogen as NH3 mg/ltr 100 1.19 1.39 1.4 1.51 1.66 1.74 1.6 1.52 1.64 1.18 1.44 1.53 1.22 1.36 1.48
10 Free Ammonia as NH3 mg/ltr 5.0 0.002 0.003 0.002 0.003 0.004 0.004 0.004 0.004 0.003 0.002 0.003 0.004 0.003 0.003 ND
11 BOD (3) days at 270c. mg/ltr 30 1.47 1.58 1.46 1.54 1.48 1.63 1.86 1.63 1.39 1.44 1.52 1.77 1.25 1.52 1.54
12 COD mg/ltr 250 5.9 4.73 4.6 4.2 5.1 6.03 4.29 4.16 4.1 5.7 6.5 7.1 3.76 4.71 5.02
13 Arsenic as As mg/ltr 0.2 BDL BDL BDL BDL BDL BDL BDL BDL BDL BDL BDL BDL BDL BDL BDL
14 Mercury as Hg mg/ltr 0.01 BDL BDL BDL BDL BDL BDL BDL BDL BDL BDL BDL BDL BDL BDL BDL
15 Lead as Pb mg/ltr 0.1 BDL BDL BDL BDL BDL BDL BDL BDL BDL BDL BDL BDL BDL BDL BDL
16 Cadmium as Cd mg/ltr 2.0 BDL BDL BDL BDL BDL BDL BDL BDL BDL BDL BDL BDL BDL BDL BDL
17 Hexa Chromium as Cr +6 mg/ltr 0.1 BDL BDL BDL BDL BDL BDL BDL BDL BDL BDL BDL BDL BDL BDL BDL
18 Total Chromium as Cr mg/ltr 2.0 0.31 0.29 0.26 0.23 0.34 0.29 0.17 0.2 0.23 0.3 0.12 0.13 0.29 0.28 0.24
19 Copper as Cu mg/ltr 3.0 BDL BDL BDL BDL BDL BDL BDL BDL BDL BDL BDL BDL BDL BDL BDL
20 Zinc as Zn mg/ltr 5.0 0.29 0.36 0.32 0.28 0.36 0.47 0.35 0.41 0.37 0.27 0.38 0.28 0.33 0.34 0.347
21 Selenium as Se mg/ltr 0.05 BDL BDL BDL BDL BDL BDL BDL BDL BDL BDL BDL BDL BDL BDL BDL
22 Nickel as Ni mg/ltr 3.0 BDL BDL BDL BDL BDL BDL BDL BDL BDL BDL BDL BDL BDL BDL BDL
23 Cyanide as CN mg/ltr 0.2 BDL BDL BDL BDL BDL BDL BDL BDL BDL BDL BDL BDL BDL BDL BDL
24 Fluoride as F mg/ltr 2.0 0.05 0.06 0.05 0.05 0.06 0.08 0.11 0.14 0.11 0.04 0.05 0.06 0.07 0.06 0.073
25 Diss. Phosphate as P mg/ltr 5.0 BDL BDL BDL BDL BDL BDL BDL BDL BDL BDL BDL BDL BDL BDL BDL
26 Sulphide as S mg/ltr 2.0 ND ND ND ND ND ND ND ND ND ND ND ND ND ND BDL
27 Phenolic Compounds as mg/ltr 1.0 BDL BDL BDL BDL BDL BDL BDL BDL BDL BDL BDL BDL BDL BDL BDL
28 Bio-assay Test -- 90%
survival
of fish
98% 98% 98% 98% 98% 98% 98% 98% 98% 98% 98% 98% 98% 98% 98.00%
29 Manganese as Mn mg/ltr 2.0 0.022 0.019 0.016 0.02 0.029 0.033 0.028 0.025 0.022 0.021 0.029 0.019 0.025 0.018 0.024
30 Iron as Fe mg/ltr 3.0 0.31 0.34 0.31 2.68 0.84 0.75 0.39 0.32 0.43 0.3 0.79 0.2 0.29 0.33 0.64
31 Vanadium as V mg/ltr 0.2 BDL BDL BDL BDL BDL BDL BDL BDL BDL BDL BDL BDL BDL BDL BDL
32 Nitrate Nitrogen mg/ltr 10 0.22 0.25 0.21 0.27 0.29 0.34 0.41 0.36 0.31 0.2 0.24 0.2 0.26 0.24 0.28
33 Pesticides (as Benzene hexa μg/l 10 Absent Absent Absent Absent Absent Absent Absent Absent Absent Absent Absent Absent Absent Absent Absent
NB :C.L. Colourless, O.L – Odourless, BDL- Below DetectableLlimit. ND- Not Detectable.
Sl.
NoParameter Unit
Standards
(In land
Surface
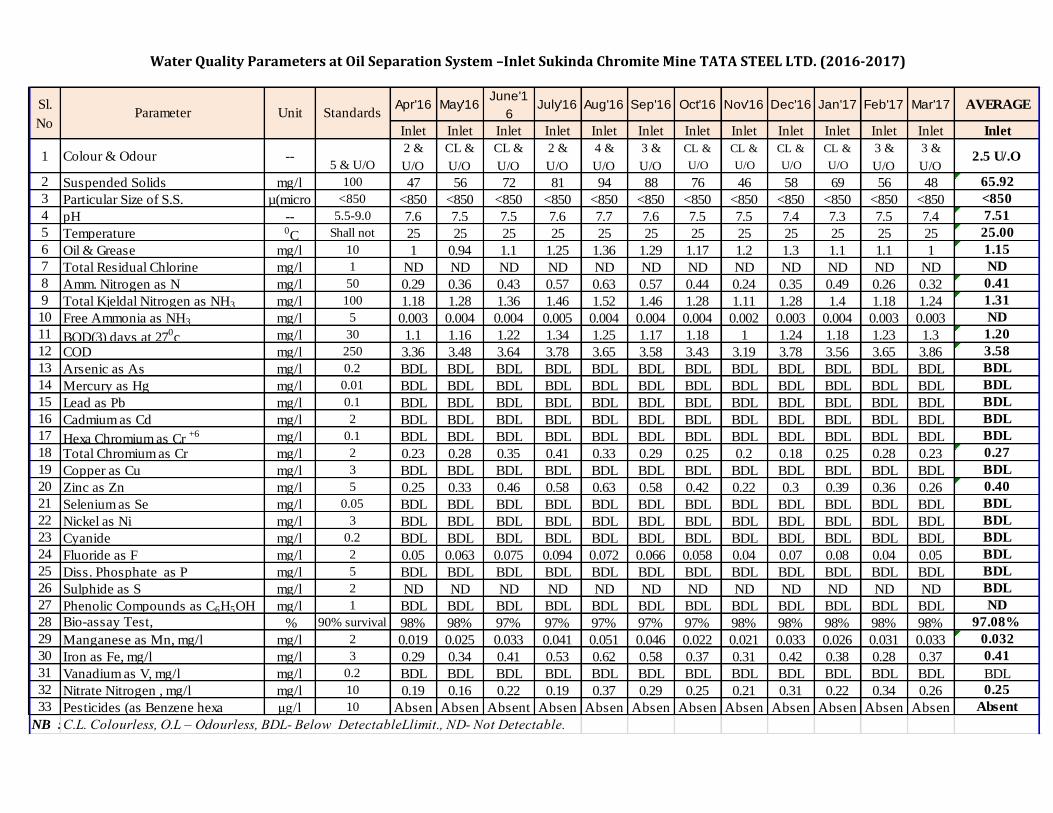
Water Quality Parameters at Oil Separation System –Inlet Sukinda Chromite Mine TATA STEEL LTD. (2016-2017)
Apr'16 May'16June'1
6July'16 Aug'16 Sep'16 Oct'16 Nov'16 Dec'16 Jan'17 Feb'17 Mar'17 AVERAGE
Inlet Inlet Inlet Inlet Inlet Inlet Inlet Inlet Inlet Inlet Inlet Inlet Inlet
1 Colour & Odour --5 & U/O
2 &
U/O
CL &
U/O
CL &
U/O
2 &
U/O
4 &
U/O
3 &
U/O
CL &
U/O
CL &
U/O
CL &
U/O
CL &
U/O
3 &
U/O
3 &
U/O2.5 U/.O
2 Suspended Solids mg/l 100 47 56 72 81 94 88 76 46 58 69 56 48 65.92
3 Particular Size of S.S. µ(micro <850 <850 <850 <850 <850 <850 <850 <850 <850 <850 <850 <850 <850 <850
4 pH -- 5.5-9.0 7.6 7.5 7.5 7.6 7.7 7.6 7.5 7.5 7.4 7.3 7.5 7.4 7.51
5 Temperature 0C Shall not 25 25 25 25 25 25 25 25 25 25 25 25 25.00
6 Oil & Grease mg/l 10 1 0.94 1.1 1.25 1.36 1.29 1.17 1.2 1.3 1.1 1.1 1 1.15
7 Total Residual Chlorine mg/l 1 ND ND ND ND ND ND ND ND ND ND ND ND ND
8 Amm. Nitrogen as N mg/l 50 0.29 0.36 0.43 0.57 0.63 0.57 0.44 0.24 0.35 0.49 0.26 0.32 0.41
9 Total Kjeldal Nitrogen as NH3 mg/l 100 1.18 1.28 1.36 1.46 1.52 1.46 1.28 1.11 1.28 1.4 1.18 1.24 1.31
10 Free Ammonia as NH3 mg/l 5 0.003 0.004 0.004 0.005 0.004 0.004 0.004 0.002 0.003 0.004 0.003 0.003 ND
11 BOD(3) days at 270c mg/l 30 1.1 1.16 1.22 1.34 1.25 1.17 1.18 1 1.24 1.18 1.23 1.3 1.20
12 COD mg/l 250 3.36 3.48 3.64 3.78 3.65 3.58 3.43 3.19 3.78 3.56 3.65 3.86 3.58
13 Arsenic as As mg/l 0.2 BDL BDL BDL BDL BDL BDL BDL BDL BDL BDL BDL BDL BDL
14 Mercury as Hg mg/l 0.01 BDL BDL BDL BDL BDL BDL BDL BDL BDL BDL BDL BDL BDL
15 Lead as Pb mg/l 0.1 BDL BDL BDL BDL BDL BDL BDL BDL BDL BDL BDL BDL BDL
16 Cadmium as Cd mg/l 2 BDL BDL BDL BDL BDL BDL BDL BDL BDL BDL BDL BDL BDL
17 Hexa Chromium as Cr +6 mg/l 0.1 BDL BDL BDL BDL BDL BDL BDL BDL BDL BDL BDL BDL BDL
18 Total Chromium as Cr mg/l 2 0.23 0.28 0.35 0.41 0.33 0.29 0.25 0.2 0.18 0.25 0.28 0.23 0.27
19 Copper as Cu mg/l 3 BDL BDL BDL BDL BDL BDL BDL BDL BDL BDL BDL BDL BDL
20 Zinc as Zn mg/l 5 0.25 0.33 0.46 0.58 0.63 0.58 0.42 0.22 0.3 0.39 0.36 0.26 0.40
21 Selenium as Se mg/l 0.05 BDL BDL BDL BDL BDL BDL BDL BDL BDL BDL BDL BDL BDL
22 Nickel as Ni mg/l 3 BDL BDL BDL BDL BDL BDL BDL BDL BDL BDL BDL BDL BDL
23 Cyanide mg/l 0.2 BDL BDL BDL BDL BDL BDL BDL BDL BDL BDL BDL BDL BDL
24 Fluoride as F mg/l 2 0.05 0.063 0.075 0.094 0.072 0.066 0.058 0.04 0.07 0.08 0.04 0.05 BDL
25 Diss. Phosphate as P mg/l 5 BDL BDL BDL BDL BDL BDL BDL BDL BDL BDL BDL BDL BDL
26 Sulphide as S mg/l 2 ND ND ND ND ND ND ND ND ND ND ND ND BDL
27 Phenolic Compounds as C6H5OH mg/l 1 BDL BDL BDL BDL BDL BDL BDL BDL BDL BDL BDL BDL ND
28 Bio-assay Test, % 90% survival 98% 98% 97% 97% 97% 97% 97% 98% 98% 98% 98% 98% 97.08%
29 Manganese as Mn, mg/l mg/l 2 0.019 0.025 0.033 0.041 0.051 0.046 0.022 0.021 0.033 0.026 0.031 0.033 0.032
30 Iron as Fe, mg/l mg/l 3 0.29 0.34 0.41 0.53 0.62 0.58 0.37 0.31 0.42 0.38 0.28 0.37 0.41
31 Vanadium as V, mg/l mg/l 0.2 BDL BDL BDL BDL BDL BDL BDL BDL BDL BDL BDL BDL BDL
32 Nitrate Nitrogen , mg/l mg/l 10 0.19 0.16 0.22 0.19 0.37 0.29 0.25 0.21 0.31 0.22 0.34 0.26 0.25
33 Pesticides (as Benzene hexa μg/l 10 Absen Absen Absent Absen Absen Absen Absen Absen Absen Absen Absen Absen Absent
NB :C.L. Colourless, O.L – Odourless, BDL- Below DetectableLlimit., ND- Not Detectable.
Sl.
NoParameter Unit Standards

Water Quality Parameters at Oil Separation System –Outlet Sukinda Chromite Mine TATA STEEL LTD. (2016-2017)
Apr'16 May'16June'1
6July'16 Aug'16 Sep'16 Oct'16 Nov'16 Dec'16 Jan'17 Feb'17 Mar'17 AVERAGE
Outlet Outlet Outlet Outlet Outlet Outlet Outlet Outlet Outlet Outlet Outlet Outlet Outlet
1 Colour & Odour --5 & U/O
CL &
U/O
CL &
U/O
CL &
U/O
CL &
U/O
CL &
U/O
CL &
U/O
CL &
U/O
CL &
U/O
CL &
U/O
CL &
U/O
CL &
U/O
CL &
U/OCL & U/O
2 Suspended Solids mg/l 100 29 34 63 49 38 36 31 22 27 23 29 29 34.17
3 Particular Size of S.S. µ(micro <850 <850 <850 <850 <850 <850 <850 <850 <850 <850 <850 <850 <850 <850
4 pH -- 5.5-9.0 7.2 7.1 7.2 7.2 7.3 7.2 7.2 7.1 7.1 7.1 7.2 7.2 7.18
5 Temperature 0C Shall not 25 25 25 25 25 25 25 25 25 25 25 25 25.00
6 Oil & Grease mg/l 10 ND ND ND 0.47 0.59 0.53 0.41 ND ND ND ND ND ND
7 Total Residual Chlorine mg/l 1 ND ND ND ND ND ND ND ND ND ND ND ND ND
8 Amm. Nitrogen as N mg/l 50 0.24 0.32 0.38 0.48 0.38 0.33 0.32 0.2 0.28 0.42 0.22 0.28 0.32
9 Total Kjeldal Nitrogen as NH3 mg/l 100 1.1 1.17 1.29 1.33 1.26 1.31 1.17 1.06 119 130 1.11 1.19 21.75
10 Free Ammonia as NH3 mg/l 5 0.002 0.003 0.004 0.004 0.004 0.005 0.004 0.002 0.003 0.003 0.003 0.002 ND
11 BOD(3) days at 270c mg/l 30 1 1.09 1.15 1.2 1.1 1 1.11 1 1.16 1 1.1 1.14 1.09
12 COD mg/l 250 2.94 3.17 3.42 3.56 3.39 3.26 3.29 2.79 3.49 2.87 3.27 3.42 3.24
13 Arsenic as As mg/l 0.2 BDL BDL BDL BDL BDL BDL BDL BDL BDL BDL BDL BDL BDL
14 Mercury as Hg mg/l 0.01 BDL BDL BDL BDL BDL BDL BDL BDL BDL BDL BDL BDL BDL
15 Lead as Pb mg/l 0.1 BDL BDL BDL BDL BDL BDL BDL BDL BDL BDL BDL BDL BDL
16 Cadmium as Cd mg/l 2 BDL BDL BDL BDL BDL BDL BDL BDL BDL BDL BDL BDL BDL
17 Hexa Chromium as Cr +6 mg/l 0.1 BDL BDL BDL BDL BDL BDL BDL BDL BDL BDL BDL BDL BDL
18 Total Chromium as Cr mg/l 2 0.19 0.23 0.29 0.37 0.26 0.22 0.18 0.16 0.15 0.19 0.22 0.19 0.221
19 Copper as Cu mg/l 3 BDL BDL BDL BDL BDL BDL BDL BDL BDL BDL BDL BDL BDL
20 Zinc as Zn mg/l 5 0.21 0.29 0.38 0.45 0.51 0.46 0.35 0.19 0.24 0.33 0.31 0.24 0.33
21 Selenium as Se mg/l 0.05 BDL BDL BDL BDL BDL BDL BDL BDL BDL BDL BDL BDL BDL
22 Nickel as Ni mg/l 3 BDL BDL BDL BDL BDL BDL BDL BDL BDL BDL BDL BDL BDL
23 Cyanide mg/l 0.2 BDL BDL BDL BDL BDL BDL BDL BDL BDL BDL BDL BDL BDL
24 Fluoride as F mg/l 2 0.05 0.057 0.068 0.081 0.06 0.057 0.046 0.04 0.05 0.05 0.03 0.04 BDL
25 Diss. Phosphate as P mg/l 5 BDL BDL BDL BDL BDL BDL BDL BDL BDL BDL BDL BDL BDL
26 Sulphide as S mg/l 2 ND ND ND ND ND ND ND ND ND ND ND ND BDL
27 Phenolic Compounds as C6H5OH mg/l 1 BDL BDL BDL BDL BDL BDL BDL BDL BDL BDL BDL BDL ND
28 Bio-assay Test, % 90% survival 98% 98% 98% 98% 98% 98% 98% 98% 98% 98% 98% 98% 98.00%
29 Manganese as Mn, mg/l mg/l 2 0.016 0.019 0.028 0.035 0.044 0.041 0.016 0.017 0.028 0.021 0.024 0.028 0.026
30 Iron as Fe, mg/l mg/l 3 0.27 0.31 0.36 0.41 0.48 0.43 0.31 0.26 0.36 0.29 0.21 0.31 0.33
31 Vanadium as V, mg/l mg/l 0.2 BDL BDL BDL BDL BDL BDL BDL BDL BDL BDL BDL BDL BDL
32 Nitrate Nitrogen , mg/l mg/l 10 0.18 0.13 0.17 0.15 0.23 0.2 0.19 0.19 0.24 0.18 0.26 0.22 0.20
33 Pesticides (as Benzene hexa μg/l 10 Absen Absen Absent Absen Absen Absen Absen Absen Absen Absen Absen Absen Absent
NB :C.L. Colourless, O.L – Odourless, BDL- Below DetectableLlimit., ND- Not Detectable.
Sl.
NoParameter Unit Standards

Water Quality Parameters of Domestic Effluent at Sukinda Chromite Mine TATA STEEL LTD. (2016-2017)
STANDARD INLET INLET INLET INLET INLET INLET INLET INLET INLET INLET INLET INLET INLET
Sl.
NoParameter Unit
Inlan Surface
Water Sewers
(Part-A Effluents)
Apr'16 May'16 June'16 July'16 Aug'16 Sep'16 Oct'16 Nov'16 Dec'16 Jan'17 Feb'17 Mar'17 Average
1 TSS mg/l 100 197 184 202 179 188 177 194 192 182 197 202 228 193.50
2 pH - 5.5-9.0 8.8 8.2 8.5 7.7 7.6 7.7 7.5 8.5 8.1 7.8 8.8 9.3 8.21
3 BOD (3) days at 27ْc mg/l 30 113 102 98 65 72 76.0 88 96 79 84 101 101 89.6
4 COD mg/l 250 326 311 287 196 219 198.0 239 282 244 239 328 299 264
5 Hexavalent Chromium as Cr+6 mg/l 0.1 BDL BDL BDL BDL BDL BDL BDL BDL BDL BDL BDL BDL BDL
6 Total Chromium as Cr mg/l 2.0 0.19 0.22 0.28 0.22 0.3 0.3 0.33 0.15 0.19 0.24 0.17 0.22 0.23
7 Oil & Grease mg/l 10 1.16 1.25 1.19 0.98 1.1 1.0 1.4 1 0.9 0.81 0.96 1.19 1.08
INLET OF DOMESTIC EFFLUENT
STANDARD OUTLET OUTLET OUTLET OUTLET OUTLET OUTLET OUTLET OUTLET OUTLET OUTLET OUTLET OUTLET OUTLET
Sl.
NoParameter Unit
Inlan Surface
Water Sewers
(Part-A Effluents)
Apr'16 May'16 June'16 July'16 Aug'16 Sep'16 Oct'16 Nov'16 Dec'16 Jan'17 Feb'17 Mar'17 Average
1 TSS mg/l 100 21 26 33 24 27 33.00 18 31 26 26 36 31 27.67
2 pH - 5.5-9.0 7.5 7.6 7.9 7.4 7.3 7.40 7.3 7.2 7.4 7.3 7.2 7.8 7.44
3 BOD (3) days at 27ْc mg/l 30 12.9 9.9 9.2 8.1 9.4 9.60 7.9 9.5 8.7 9.2 9.8 9.6 9.48
4 COD mg/l 250 37.4 28.7 26.4 23.9 28.1 21.80 23.6 28.8 25.3 27.1 31.6 30.1 27.73
5Hexavalent Chromium as
Cr+6
mg/l 0.1 BDL BDL BDL BDL BDL BDL BDL BDL BDL BDL BDL BDLBDL
6 Total Chromium as Cr mg/l 2.0 0.16 0.19 0.23 0.16 0.19 0.19 0.28 0.12 0.17 0.19 0.15 0.17 0.18
7 Oil & Grease mg/l 10 0.85 0.84 0.77 0.65 0.82 0.73 0.91 0.76 0.63 0.55 0.81 0.86 0.77
OUTLET OF DOMESTIC EFFLUENT
Noise survey report at COB plant, LOP plant of SCM TSL
SL.No. LOCATION
June'16 Sep'16 Dec'16 March'17
AVERAGE Noise level in dB(A)
Noise level in dB(A)
Noise level in dB(A)
Noise level in dB(A)
1 COB Plant Gate 69.1 70.4 69.5 70.8 70.2
2 Canteen 62.9 62.3 61.6 61.0 61.3
3 Work Shop 67.8 66.9 67.7 66.8 67.3
4 Office 57.2 58.5 59.6 60.9 60.3
5 D.G.Shed 91.4 90 89.1 87.7 88.4
6 MCC Room 65.4 66.1 67.4 68.1 67.8
7 Vibrating Screen 73.0 72.1 71.5 70.6 71.1
8 Scrubber 67.7 69 68.1 69.4 68.8
9 Control Room 65.3 64.7 66 65.4 65.7
10 Secondary Appron 67.2 66.3 65.7 64.8 65.3
11 Cone Crusher 68.7 70 69.1 70.4 69.8
12 DTJ Crusher 77.5 76.9 73.2 72.6 72.9
13 Concentrated Ore Loading 67.5 66.6 67.9 67.0 67.5
14 Wobbler area 73.1 74.4 73.5 74.8 74.2
15 Primary Apron feeder 75.1 73.7 75 73.6 74.3
16 C -1A 67.1 67.8 67.2 67.9 67.6
17 Shaking Table 78.3 77.4 76.5 75.6 76.1
18 Multiple Bin 76.9 78.2 79.5 80.8 80.2
19 H.T Room 65.8 65.2 64.3 63.7 64.0
20 Hydro Cyclone 67.0 66.1 65.2 64.3 64.8
21 Spirals 64.1 63.4 64 63.3 63.7
22 VS Ball Mill 91.2 92 93.1 93.9 93.5
23 C.6A 78.0 79.1 78.6 79.7 79.2
24 H.F Screen 75.9 75 75 74.1 74.6
25 Sieve band area 77.7 79 79.8 81.1 80.5
26 C3 74.2 73.6 74.7 74.1 74.4
27 C4 74.6 73.7 72.8 71.9 72.4
28 LOPP Sayaji Crusher 60.2 61.5 60.5 61.8 61.2
29 LOPP Screen 63.5 62.9 63.9 63.3 63.6
30 LOPP Control Room 63.4 62.5 62.4 61.5 62.0
31 LOPP Hopper 58.0 57.1 56.2 55.3 55.8

Ambient Noise Level Survey in Residential Areas of SCM, TSL from 6AM to 6AM (Next Day)
June'16 Sep'16 Dec'16 March'17
Noise level
in dB(A)
Noise level
in dB(A)
Noise level
in dB(A)
Noise
level in
dB(A)
1 6.00 Main Gate 64.5 65.8 67.1 68.4 66.5
2 6.30 Market Complex 58.1 57.5 56.1 55.2 56.7
3 7.00 Hospital 47.6 46.7 47.4 48.7 47.6
4 7.30 Post Office 43.3 44.6 43.7 43.1 43.7
5 8.00 Study Center 46 44.6 45.9 45 45.4
6 8.30 Water treatment Plant (D.G was not in operation)52.9 53.6 53 54.3 53.5
7 9.00 STP 51.3 50.4 49.5 48.9 50.0
8 9.30 Shishu Mandir <40 <40 <40 <40 <40
9 10.00 Children's Park 48.6 48 47.4 48.2 48.1
10 10.30 3RSF Qtrs 49.8 48.9 48 49.1 49.0
11 11.00 L2R Qtrs 52.9 54.2 55.5 54.6 54.3
12 11.30 Recreation Club 47.8 47.2 45.8 46.3 46.8
13 12.00 B4-B6 Block Qtrs 55.7 54.8 55.5 56.3 55.6
14 12.30 B3-B4 Block Qtrs 51.3 52.6 51.7 52.8 52.1
15 13.00 Geological Camp 45.1 43.7 45 44.1 44.5
16 13.30 Babu Line 51.7 52.4 51.8 51.1 51.8
17 14.00 Guest House 48.1 47.2 46.3 47.1 47.2
18 14.30 3R Qtrs 57.3 58.6 57.9 59 58.2
19 15.00 VT Centre 52.4 51.8 52.6 51.7 52.1
20 15.30 SS High school 45.9 45 46.1 46.6 45.9
21 16.00 2RF Qtrs 47.5 46.8 45.9 46.7 46.7
22 16.30 CT Qtrs <40 <40 <40 <40 <40
23 17.00 STP 46.5 47.6 47 48.1 47.3
24 17.30 Police Out Post 51 50.1 49.2 48.3 49.7
25 18.00 Jagannath Temple 47.2 48.5 49.8 50.3 49.0
26 18.30 GM Banglow 47.3 46.7 46.1 46.9 46.8
27 19.00 Market Complex 59.2 58.3 57.4 58.5 58.4
28 19.30 Laboratory 46.5 47.8 46.9 46 46.8
29 20.00 Chrome Vally Club 51 50.4 51.7 51 51.0
30 20.30 Atwal's Camp 47.1 46.2 45.3 46.1 46.2
31 21.00 Duplex Qtrs 44.7 43.8 45.1 51 46.2
32 21.30 FootBall Ground <40 <40 <40 <40 <40
33 22.00 B4-B6 Block Qtrs 42.1 43.4 42.5 49 44.3
34 22.30 Sisu Mandir <40 <40 <40 <40 <40
35 23.00 5 Star Qtrs 46 46.7 46.1 49.1 47.0
36 23.30 Stewart School <40 <40 48.5 50.5 <40
37 0.00 A9-A13 Qtrs 49.7 51 51.8 53.8 51.6
38 0.30 A14-A19 Qtrs 43.4 42.8 43.9 50 45.0
39 1.00 A-17 - A23 Qtrs <40 <40 <40 <40 <40
40 1.30 B1-B3 Block <40 <40 <40 <40 <40
41 2.00 Hospital <40 <40 <40 <40 <40
42 2.30 SBI <40 <40 <40 <40 <40
43 3.00 Jagannath Temple <40 <40 <40 <40 <40
44 3.30 TSRDS <40 <40 <40 <40 <40
45 4.00 Babu Line 42.2 42.9 43.7 43.1 43.0
46 4.30 Guest House Annexe <40 <40 <40 <40 <40
47 5.00 Banabharati Dance School<40 <40 <40 <40 <40
48 5.30 Main Gate 45.6 45 45.5 44.1 45.1
LocationsTime in
Hrs.Sl.No AVERAGE
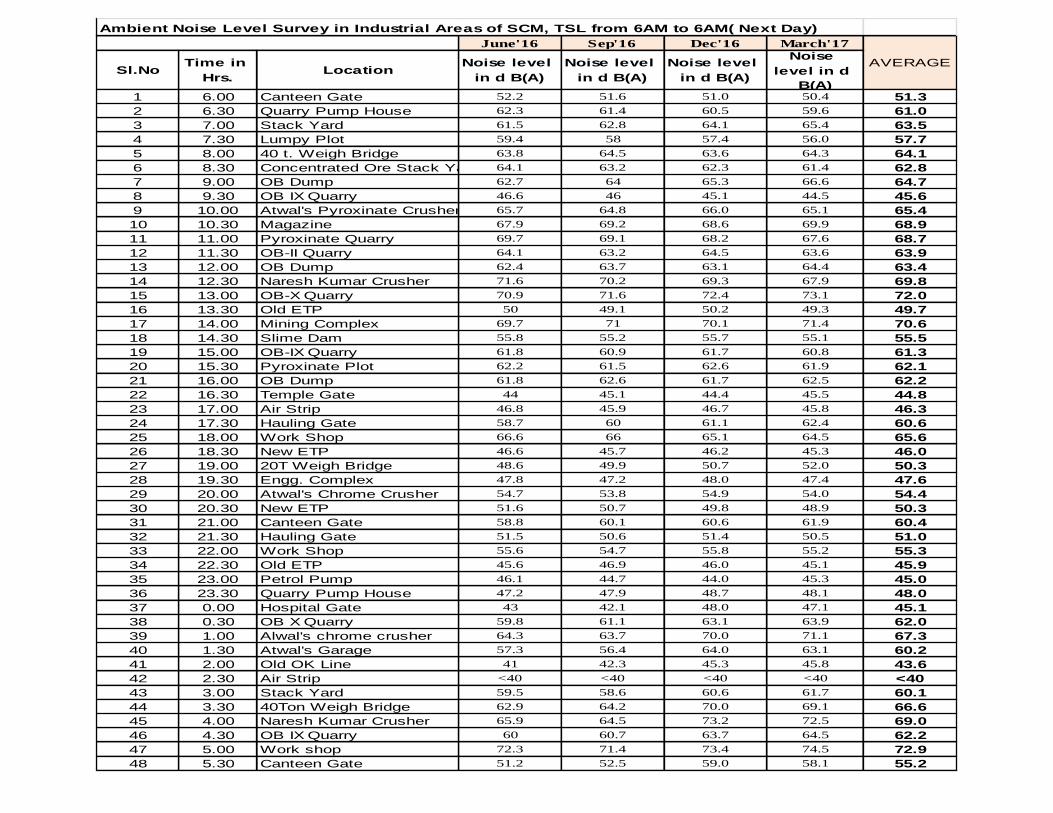
Ambient Noise Level Survey in Industrial Areas of SCM, TSL from 6AM to 6AM( Next Day)
June'16 Sep'16 Dec'16 March'17
Sl.NoTime in
Hrs.Location
Noise level
in d B(A)
Noise level
in d B(A)
Noise level
in d B(A)
Noise
level in d
B(A)1 6.00 Canteen Gate 52.2 51.6 51.0 50.4 51.3
2 6.30 Quarry Pump House 62.3 61.4 60.5 59.6 61.0
3 7.00 Stack Yard 61.5 62.8 64.1 65.4 63.5
4 7.30 Lumpy Plot 59.4 58 57.4 56.0 57.7
5 8.00 40 t. Weigh Bridge 63.8 64.5 63.6 64.3 64.1
6 8.30 Concentrated Ore Stack Yard 64.1 63.2 62.3 61.4 62.8
7 9.00 OB Dump 62.7 64 65.3 66.6 64.7
8 9.30 OB IX Quarry 46.6 46 45.1 44.5 45.6
9 10.00 Atwal's Pyroxinate Crusher 65.7 64.8 66.0 65.1 65.4
10 10.30 Magazine 67.9 69.2 68.6 69.9 68.9
11 11.00 Pyroxinate Quarry 69.7 69.1 68.2 67.6 68.7
12 11.30 OB-II Quarry 64.1 63.2 64.5 63.6 63.9
13 12.00 OB Dump 62.4 63.7 63.1 64.4 63.4
14 12.30 Naresh Kumar Crusher 71.6 70.2 69.3 67.9 69.8
15 13.00 OB-X Quarry 70.9 71.6 72.4 73.1 72.0
16 13.30 Old ETP 50 49.1 50.2 49.3 49.7
17 14.00 Mining Complex 69.7 71 70.1 71.4 70.6
18 14.30 Slime Dam 55.8 55.2 55.7 55.1 55.5
19 15.00 OB-IX Quarry 61.8 60.9 61.7 60.8 61.3
20 15.30 Pyroxinate Plot 62.2 61.5 62.6 61.9 62.1
21 16.00 OB Dump 61.8 62.6 61.7 62.5 62.2
22 16.30 Temple Gate 44 45.1 44.4 45.5 44.8
23 17.00 Air Strip 46.8 45.9 46.7 45.8 46.3
24 17.30 Hauling Gate 58.7 60 61.1 62.4 60.6
25 18.00 Work Shop 66.6 66 65.1 64.5 65.6
26 18.30 New ETP 46.6 45.7 46.2 45.3 46.0
27 19.00 20T Weigh Bridge 48.6 49.9 50.7 52.0 50.3
28 19.30 Engg. Complex 47.8 47.2 48.0 47.4 47.6
29 20.00 Atwal's Chrome Crusher 54.7 53.8 54.9 54.0 54.4
30 20.30 New ETP 51.6 50.7 49.8 48.9 50.3
31 21.00 Canteen Gate 58.8 60.1 60.6 61.9 60.4
32 21.30 Hauling Gate 51.5 50.6 51.4 50.5 51.0
33 22.00 Work Shop 55.6 54.7 55.8 55.2 55.3
34 22.30 Old ETP 45.6 46.9 46.0 45.1 45.9
35 23.00 Petrol Pump 46.1 44.7 44.0 45.3 45.0
36 23.30 Quarry Pump House 47.2 47.9 48.7 48.1 48.0
37 0.00 Hospital Gate 43 42.1 48.0 47.1 45.1
38 0.30 OB X Quarry 59.8 61.1 63.1 63.9 62.0
39 1.00 Alwal's chrome crusher 64.3 63.7 70.0 71.1 67.3
40 1.30 Atwal's Garage 57.3 56.4 64.0 63.1 60.2
41 2.00 Old OK Line 41 42.3 45.3 45.8 43.6
42 2.30 Air Strip <40 <40 <40 <40 <40
43 3.00 Stack Yard 59.5 58.6 60.6 61.7 60.1
44 3.30 40Ton Weigh Bridge 62.9 64.2 70.0 69.1 66.6
45 4.00 Naresh Kumar Crusher 65.9 64.5 73.2 72.5 69.0
46 4.30 OB IX Quarry 60 60.7 63.7 64.5 62.2
47 5.00 Work shop 72.3 71.4 73.4 74.5 72.9
48 5.30 Canteen Gate 51.2 52.5 59.0 58.1 55.2
AVERAGE
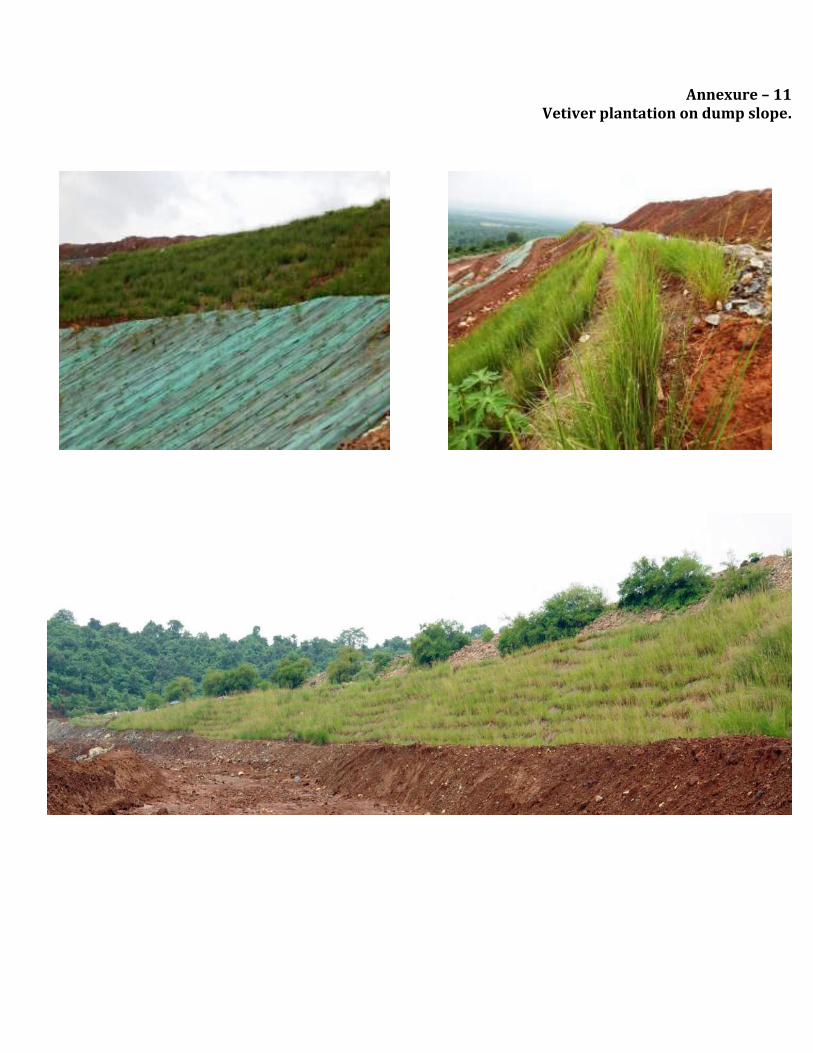
Annexure – 11 Vetiver plantation on dump slope.

Annexure – 12 Environment Awareness Programs
1. Jaiba Kala Vividhata
2. Prajatiya Khadyotsav

3. Snakes are Friends
4. SUKINDA ECORACE
5. World Environment Day