forgiveness versus financing - 「長期デフレの解明 ... · summary 4 theoretical insights of...
TRANSCRIPT
Forgiveness versus Financing: The determinants and impact of SME debt forbearance in Japan
Arito Ono (Chuo University)
Yukihiro Yasuda (Hitotsubashi University)
Summer Workshop on Economic Theory 20175 August 2017

Summary 2
Research question Does debt forbearance improve borrower
performance? Important research and policy question E.g., The HAMP in the U.S. (Agarwal et al. 2017)
Yes: Resolving a debt overhang problem in which the benefits of good borrower performance largely go to the lender Theory: Krugman (1998), Myers (1977) Empirics: Giroud et al. (2011), Kroszner (1998)
No: Debt forbearance may generate moral hazards on the part of borrowers and/or lenders Empirics: Kanz (2016), Inoue et al. (2010)

Summary 3
This paper
Examining the impact of Japan’s debt forbearance policy stipulated in the SME Financing Facilitation Act, based on theoretical predictions of Krugman’s (1988) “Financing vs. forgiving a debt overhang” Two types of debt forbearance “Financing”: Refinancing of a firm’s existing debts
including the extension of borrowing terms and the deferral of debt repayment (payment delay)
“Debt forgiveness”: Reduction in the amount of principal and/or interests (payment relief)

Summary 4
Theoretical insights of Krugman (1988) “Financing” gives lenders an option value; full
repayment if the debtor performs well in the future However, financing may distort the debtor’s
incentive (debt overhang problem). “Debt forgiveness” may resolve the problem
A tradeoff for lenders: inducing the borrower to make an effort vs. the cost of writing down existing claims
This paper
Summary 5
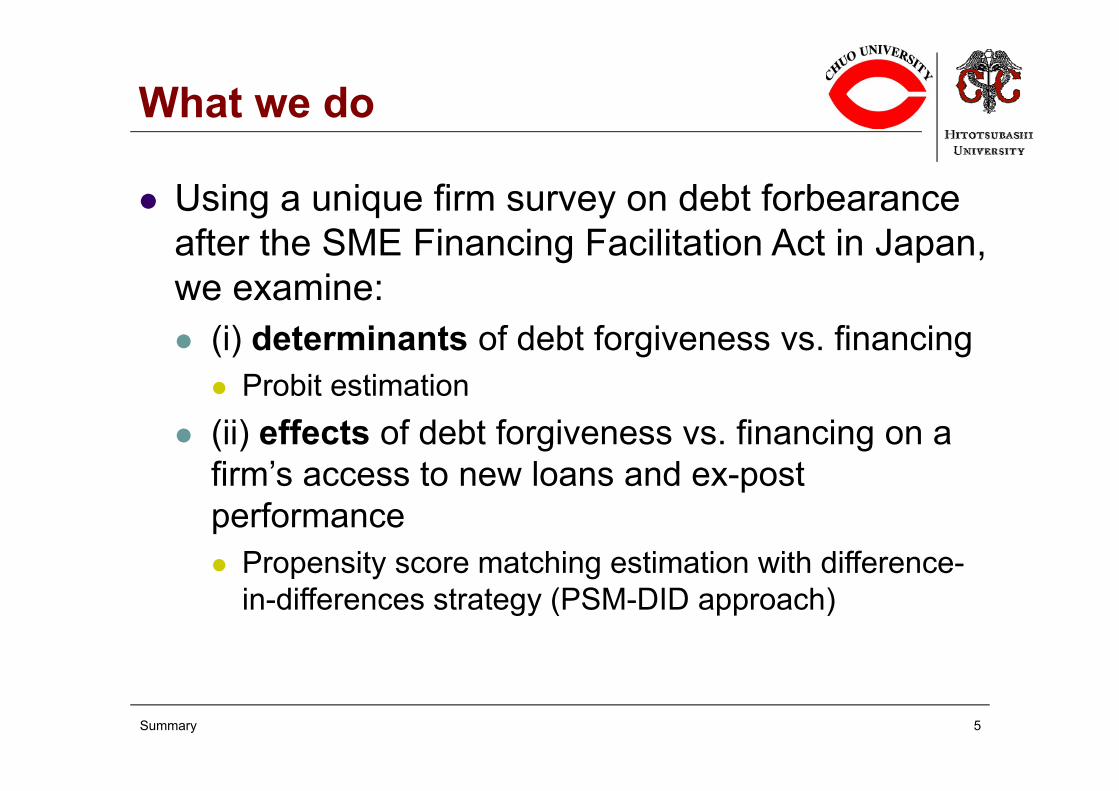
What we do
Using a unique firm survey on debt forbearance after the SME Financing Facilitation Act in Japan, we examine: (i) determinants of debt forgiveness vs. financing Probit estimation
(ii) effects of debt forgiveness vs. financing on a firm’s access to new loans and ex-post performance Propensity score matching estimation with difference-
in-differences strategy (PSM-DID approach)

Summary 6
What we do
Using a unique firm survey on debt forbearance after the SME Financing Facilitation Act in Japan, we examine: (iii) impacts of public credit guarantees (PCG),
which may aggravate the moral hazard problem on the part of lenders If loans are covered by PCG and lenders bear little
credit risk, PCG would increase lenders’ option value for “financing” and depress lenders’ incentives to urge business restructuring by firms

Summary 7
What we find
Our findings are mostly consistent with the theory of debt overhang
(i) Banks choose debt forgiveness for firms that are more creditworthy and profitable However, firms’ leverage does not affect the
likelihood of receiving debt forgiveness
(ii) Firms that received debt forgiveness had better access to new loans and showed better ex-post performance than firms that received financing

Summary 8
What we find
(iii) The effectiveness of debt forbearance is adversely affected by the PCG Compared to firms that had not received any debt
forbearance, firms that had received financing were more
leveraged and exhibited worse ex-post performance, especially when forborne loans were covered by PCG
firms that received debt forgiveness exhibited better performance, especially those without PCG

Summary 9
Outline of this presentation
Institutional background (Sec. 2 in the paper) Empirical hypotheses (Sec. 3) Literature review (Sec. 3.2)
Data, variables, and empirical approach (Sec. 4) Results (Sec. 5) Future works

Institutional background
10

Institutional background 11
SME Financing Facilitation Act
SME Financing Facilitation Act Period: Dec. 2009–Mar. 2013 Initially planned to end in Mar. 2011 but extended twice
It required financial institutions to make their best effort to respond positively to requests by client SME borrowers to amend loan contract terms
It allowed the amended loans to not be classified as nonperforming loans as long as borrowers made a credible business restructuring plan
# of applications: 4.37M, acceptance rate: 97.3%

Institutional background 12
Public credit guarantees
Emergency Credit Guarantee (ECG) program Period: Oct. 2008–Mar. 2011 The ratio of credit covered is 100%; banks bear
no credit risk 80–100% for the regular programs
If loans are covered by credit guarantees and lenders bear little credit risk, lenders are likely to “finance” existing loans

Empirical hypotheses
13

Empirical hypotheses 14
Empirical hypotheses
Hypothesis 1 (Determinants of the type of debt forbearance): Lenders choose forgiving if debtor firms face a debt overhang and the expected present value of their businesses is positive.
Hypothesis 2 (Effects of debt forbearance): Firms that received debt forgiveness have better access to new loans and show better ex-post performance than firms that received financing.

Empirical hypotheses 15
Empirical hypotheses
Hypothesis 3 (Determinants and effects of public credit guarantees): Lenders choose financing if a firm’s existing debt is covered by public credit guarantees. Public credit guarantees adversely affect the availability of new loans for and the ex-post performance of firms, especially of those that received financing.

Data, variables, and empirical approach
16

Data, variables, and empirical approach 17
Data
Constructing firm-level dataset from two sources The RIETI survey “Survey of Finance on the Aftermath of SME
Financing Facilitation Act (金融円滑化法終了後における金融実態調査),” Oct. 2014
Survey questionnaire was sent to 20,000 SMEs, and 6,002 firms responded (response rate 30.0%)
TSR database Ex-ante (i.e., before the firm received debt
forbearance) firm characteristics: 2008–2009 Ex-post firm characteristics: 2013–2014

Data, variables, and empirical approach 18
Sample selection
dum_DFNOB955
dum_DF 1NOB782
dum_DF_FORGIVENOB210 DF_TYPE 2
dum_DF_FINANCENOB572 DF_TYPE 1
dum_DF 0NOB173 DF_TYPE 0
Sample for the main analysis (Sections. 5.1 and 5.2)
Sample for the additional analysis (Section. 5.3)
Firms that had demand for debt forbearance but did not receive it

Data, variables, and empirical approach 19
Sample selection
Sample for the main analysis (Sections 5.1 and 5.2): 782 firms Firms that experienced debt forbearance, i.e.,
either debt forgiveness ( ) or financing ( )
Expanded sample for further analysis (Section 5.3): 955 firms In addition to firms that experienced debt
forberance ( ), we include 173 firms that had demand for but did not receive any debt forbearance ( )

All obs. inthe RIETI
surveyOur sample
Number of obs. 1,468 782
1. Term extension of up to one year 24.9% 25.4%
2. Term extension of more than a year 29.8% 33.6%
3. Deferral of principal 37.9% 41.2%
4. Reduction of interest rate 16.3% 19.1%
5. Partial write-off 7.8% 7.7%
6. Debt-equity swap 0.1% 0.0%
7. Debt-debt swap (e.g., subordinated debt) 0.9% 0.9%
8. Other 8.4% 1.3%
Financing (payment delay)
Forgiving (payment relief)
Data, variables, and empirical approach 20
Variables for debt forbearance
Distribution of types of debt forbearance for firms that received debt forbearance (
Note: This table presents the percentage shares of firms in terms of the type of debt forbearance they received (on the occasion of their first debt forbearance) between December 2009 and October 2014. Percentages add up to more than 100%, since firms may have received more than one type of debt forbearance for a particular loan.
dum_DF_FINANCE
dum_DF_FORGIVE

Data, variables, and empirical approach 21
Empirical approach: Determinants
Examination of H1 and the first part of H3: Probitestimation
Expected signs of coefficients , , 0: Banks select forgiving if a firm has a debt
overhang problem and its expected present value of repayment is positive (H1)
0: Banks select financing if a firm received public credit guarantees (first part of H3)

Data, variables, and empirical approach 22
Empirical approach: Effects
Examination of H2: PSM-DID (i) Match treatment firms (e.g., )
with control firms ( ) that have the closest propensity score
(ii) Compare the measures of credit availability and ex-post firm performance between the two groups Use difference-in-differences (DID) to difference out
time-invariant unobservable characteristics
Data, variables, and empirical approach 23
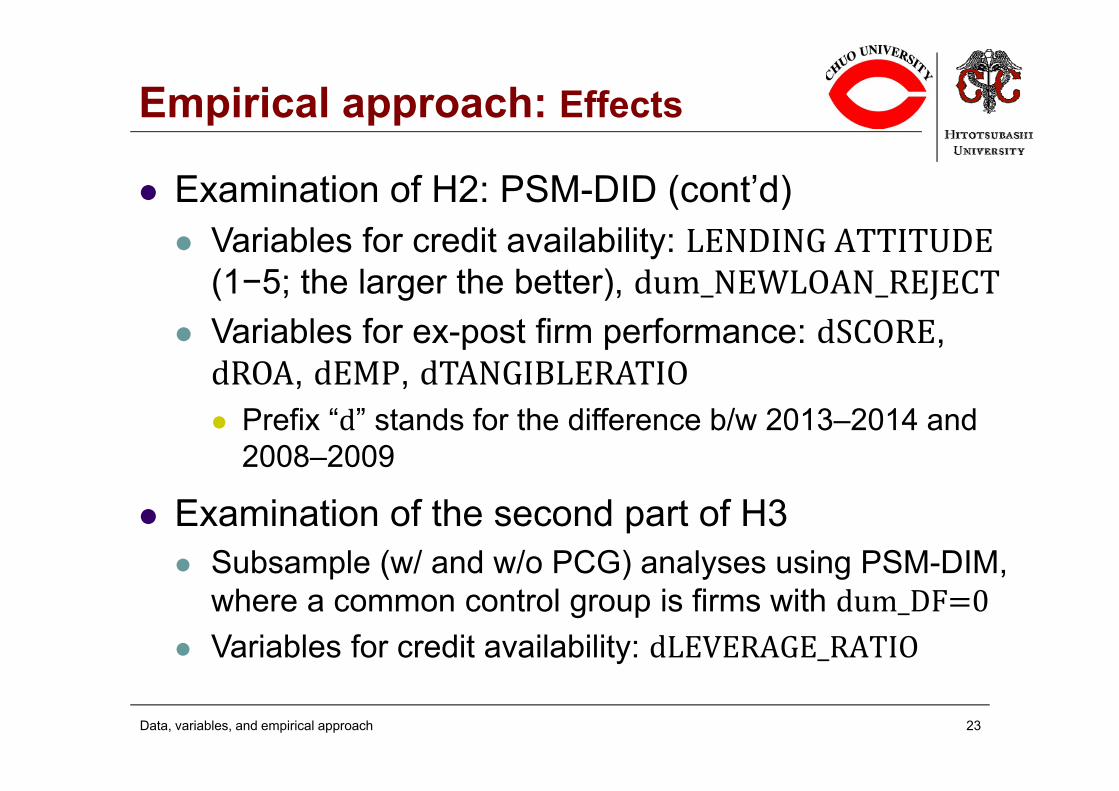
Empirical approach: Effects
Examination of H2: PSM-DID (cont’d) Variables for credit availability:
(1−5; the larger the better), Variables for ex-post firm performance: ,
, , Prefix “d” stands for the difference b/w 2013–2014 and
2008–2009
Examination of the second part of H3 Subsample (w/ and w/o PCG) analyses using PSM-DIM,
where a common control group is firms with dum_DF 0 Variables for credit availability: dLEVERAGE_RATIO

Results
24
Results 25
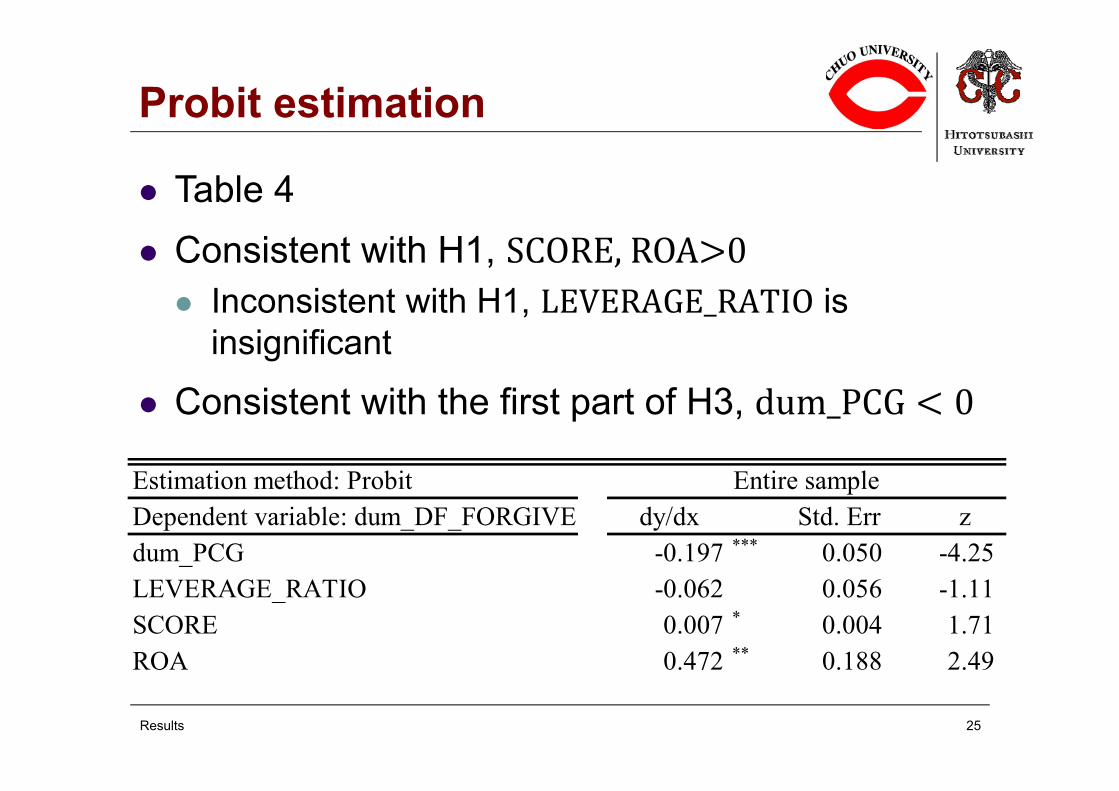
Probit estimation
Table 4 Consistent with H1, Inconsistent with H1, is
insignificant
Consistent with the first part of H3,
Estimation method: Probit Entire sampleDependent variable: dum_DF_FORGIVE dy/dx Std. Err zdum_PCG -0.197 *** 0.050 -4.25LEVERAGE_RATIO -0.062 0.056 -1.11SCORE 0.007 * 0.004 1.71ROA 0.472 ** 0.188 2.49

Entire sampleVariable Treated Controls Difference S.E. T-statLENDING_ATTITUDE Unmatched 3.295 3.050 0.245 *** 0.077 3.17
ATT 3.291 3.115 0.176 * 0.110 1.59dum_NEWLOAN_REJECT Unmatched 0.162 0.365 -0.202 *** 0.050 -4.09
ATT 0.178 0.383 -0.206 *** 0.073 -2.80
Results 26
PSM-DID (1): Credit availability
Table 5 Treated: Debt forgiveness, Controls: Financing Consistent with H2, lending attitude of the lender
that provided debt forgiveness was better on average, while the loan rejection rate for firms that received debt forgiveness was lower
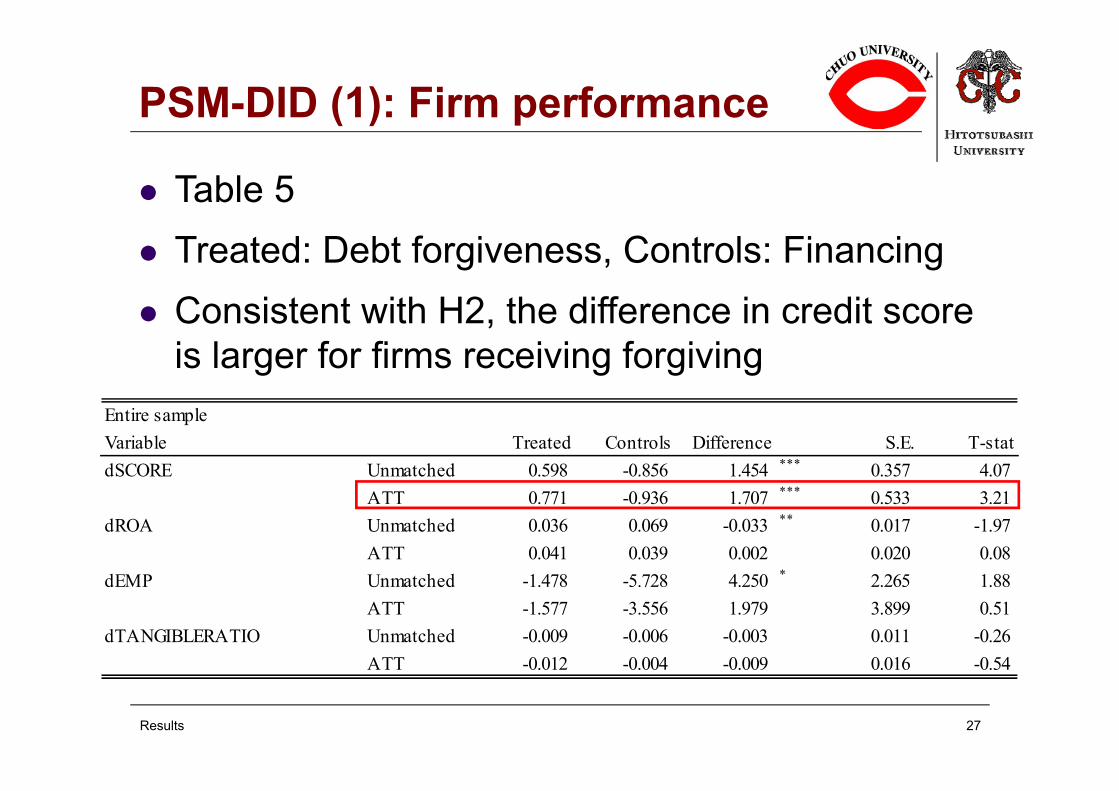
Entire sampleVariable Treated Controls Difference S.E. T-statdSCORE Unmatched 0.598 -0.856 1.454 *** 0.357 4.07
ATT 0.771 -0.936 1.707 *** 0.533 3.21dROA Unmatched 0.036 0.069 -0.033 ** 0.017 -1.97
ATT 0.041 0.039 0.002 0.020 0.08dEMP Unmatched -1.478 -5.728 4.250 * 2.265 1.88
ATT -1.577 -3.556 1.979 3.899 0.51dTANGIBLERATIO Unmatched -0.009 -0.006 -0.003 0.011 -0.26
ATT -0.012 -0.004 -0.009 0.016 -0.54
Results 27
PSM-DID (1): Firm performance
Table 5 Treated: Debt forgiveness, Controls: Financing Consistent with H2, the difference in credit score
is larger for firms receiving forgiving

Results 28
PSM-DID (2): Effect of PCG
Table 8: Subsamples of firms w/ and w/o PCG, using the expanded sample Treated (Panel A): financing w/ and w/o PCG Treated (Panel B): Debt forgiveness w/ and w/o
PCG Common control group: Firms that had demand for
but did not receive any debt forbearance

Results 29
PSM-DID (2): Effect of PCG
Firms that received financing w/ PCG showed a greater increase in the leverage ratio, a greater decrease in credit score and number of employees We do not find such effects for firms that received
financing w/o PCG
Firms that received debt forgiveness w/o PCGshowed a greater increase in credit score Firms that received debt forgiveness w/ PCG
experienced a greater decrease in number of employees
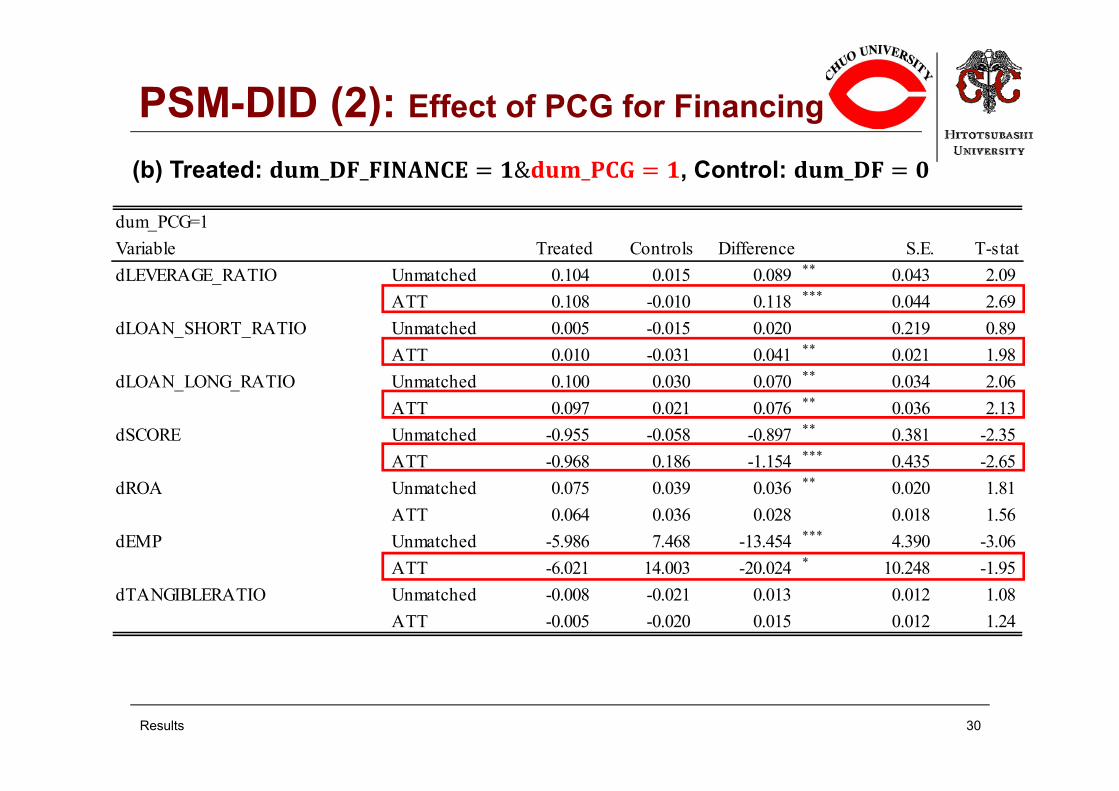
dum_PCG=1Variable Treated Controls Difference S.E. T-statdLEVERAGE_RATIO Unmatched 0.104 0.015 0.089 ** 0.043 2.09
ATT 0.108 -0.010 0.118 *** 0.044 2.69dLOAN_SHORT_RATIO Unmatched 0.005 -0.015 0.020 0.219 0.89
ATT 0.010 -0.031 0.041 ** 0.021 1.98dLOAN_LONG_RATIO Unmatched 0.100 0.030 0.070 ** 0.034 2.06
ATT 0.097 0.021 0.076 ** 0.036 2.13dSCORE Unmatched -0.955 -0.058 -0.897 ** 0.381 -2.35
ATT -0.968 0.186 -1.154 *** 0.435 -2.65dROA Unmatched 0.075 0.039 0.036 ** 0.020 1.81
ATT 0.064 0.036 0.028 0.018 1.56dEMP Unmatched -5.986 7.468 -13.454 *** 4.390 -3.06
ATT -6.021 14.003 -20.024 * 10.248 -1.95dTANGIBLERATIO Unmatched -0.008 -0.021 0.013 0.012 1.08
ATT -0.005 -0.020 0.015 0.012 1.24
Results 30
PSM-DID (2): Effect of PCG for Financing
(b) Treated: _ _ & _ , Control: _

dum_PCG=0Variable Treated Controls Difference S.E. T-statdLEVERAGE_RATIO Unmatched 0.015 0.015 0.000 0.046 0.00
ATT 0.015 -0.021 0.036 0.049 0.74dLOAN_SHORT_RATIO Unmatched -0.006 -0.015 0.009 0.027 0.33
ATT -0.006 -0.021 0.014 0.033 0.43dLOAN_LONG_RATIO Unmatched 0.021 0.030 -0.009 0.039 -0.22
ATT 0.021 0.000 0.022 0.042 0.52dSCORE Unmatched -0.234 -0.058 -0.176 0.605 -0.29
ATT -0.234 -0.075 -0.159 0.744 -0.21dROA Unmatched 0.031 0.039 -0.008 0.025 -0.30
ATT 0.031 0.041 -0.010 0.032 -0.31dEMP Unmatched -4.104 7.468 -11.572 11.084 -1.04
ATT -4.104 15.379 -19.483 12.700 -1.53dTANGIBLERATIO Unmatched 0.005 -0.021 0.026 * 0.014 1.81
ATT 0.005 -0.229 0.028 * 0.016 1.68
Results 31
PSM-DID (2): Effect of PCG for Financing
(c) Treated: _ _ & _ , Control: _

dum_PCG=1Variable Treated Controls Difference S.E. T-statdLEVERAGE_RATIO Unmatched 0.004 0.015 -0.011 0.042 -0.27
ATT -0.008 0.015 -0.023 0.042 -0.54dLOAN_SHORT_RATIO Unmatched -0.029 -0.015 -0.014 0.021 -0.65
ATT -0.034 -0.009 -0.025 0.023 -1.11dLOAN_LONG_RATIO Unmatched 0.033 0.030 0.002 0.036 0.07
ATT 0.026 0.024 0.002 0.037 0.07dSCORE Unmatched 0.514 -0.058 0.572 0.464 1.23
ATT 0.628 -0.161 0.789 0.530 1.49dROA Unmatched 0.045 0.039 0.006 0.016 0.41
ATT 0.045 0.032 0.013 0.015 0.88dEMP Unmatched -3.043 7.468 -10.511 7.824 -1.34
ATT -3.292 14.054 -17.347 * 10.466 -1.66dTANGIBLERATIO Unmatched -0.008 -0.021 0.013 0.013 1.03
ATT -0.010 -0.019 0.009 0.015 0.65
Results 32
PSM-DID (2): Effect of PCG for Forgiving
(b) Treated: _ _ & _ , Control: _

dum_PCG=0Variable Treated Controls Difference S.E. T-statdLEVERAGE_RATIO Unmatched 0.004 0.015 -0.011 0.048 -0.24
ATT -0.020 0.005 -0.025 0.040 -0.64dLOAN_SHORT_RATIO Unmatched -0.003 -0.015 0.012 0.024 0.48
ATT -0.018 -0.018 0.000 0.025 0.01dLOAN_LONG_RATIO Unmatched 0.007 0.030 -0.023 0.040 -0.57
ATT -0.003 0.023 -0.026 0.036 -0.71dSCORE Unmatched 0.773 -0.058 0.830 0.550 1.51
ATT 1.049 -0.191 1.240 * 0.648 1.91dROA Unmatched 0.017 0.039 -0.021 0.019 -1.11
ATT 0.016 0.023 -0.007 0.017 -0.41dEMP Unmatched 1.818 7.468 -5.650 12.232 -0.46
ATT 2.344 3.181 -0.837 9.444 -0.09dTANGIBLERATIO Unmatched -0.011 -0.021 0.010 0.014 0.68
ATT -0.011 -0.015 0.004 0.017 0.24
Results 33
PSM-DID (2): Effect of PCG for Forgiving
(c) Treated: _ _ & _ , Control: _

Future works
34
Future works 35
Future works
Addressing the possible selection bias problem Need an exogenous factor that affects the choice of
debt forgiveness Unexpected snow for leveraged Austrian ski hotels
(Girould et al. 2011) Area of land pledged by indebted households prior to the
debt relief policy in India (Kanz 2016)
Exploiting the heterogeneity among lenders Miyakawa and Ohashi (2016): Lenders’ incentive to
evergreen loans by restructuring existing debts temporarily differs depending on the strength of banks’ balance sheet

36
END OF PRESENTATION THANK YOU