forest reforms and forest products trade in...
TRANSCRIPT


Outline
About me Introduction to Beijing Forest Resources in China Research interests
About me
About my name: Lanhui Wang Wang (King in English, the #1 family name
in China, 7% of the total population) Lan is an orchid, one of the traditional
Chinese favorites with a fragrant smell Hui is parents expectation

My family

My work
Department of StatisticsSchool of Economics & ManagementBeijing Forestry University since 2002
Job DescriptionTeaching (Statistical theory and application)Researching Studying

My research
Forest Development Report for State Forestry Administration annually since 2003Evaluation of Grain for Green project in China (sponsored by China Reform Research Fund) Sampling Survey about the loss from Technical Barrier of Trade for Ministry of Commerce of China
On-going projectInternational Forestry and Forest Product Market Modeling in cooperation with the University of British Columbia Forecasting of China's forest product demand and supply Analysis of forest product trade with China Tariff and taxation impacts on domestic market

About Beijing Forestry U.> 30,000 students956 full-time teachers
15 schools, including: Forestry Biological Science Landscape Architecture Engineering Economics & Management

About China and Beijing

Location of Beijingheart of the rooster

About Beijing (Peking)What’s your impression of Beijing? Capital of China Tourism resorts & political center Location of 2008 Olympics Metropolis with over 12 million population
Something more Capital of six dynasties in history Traditional Chinese features: Hutong, Siheyuan, Gourmet

Distribution of China Forest
28%
12%
34%

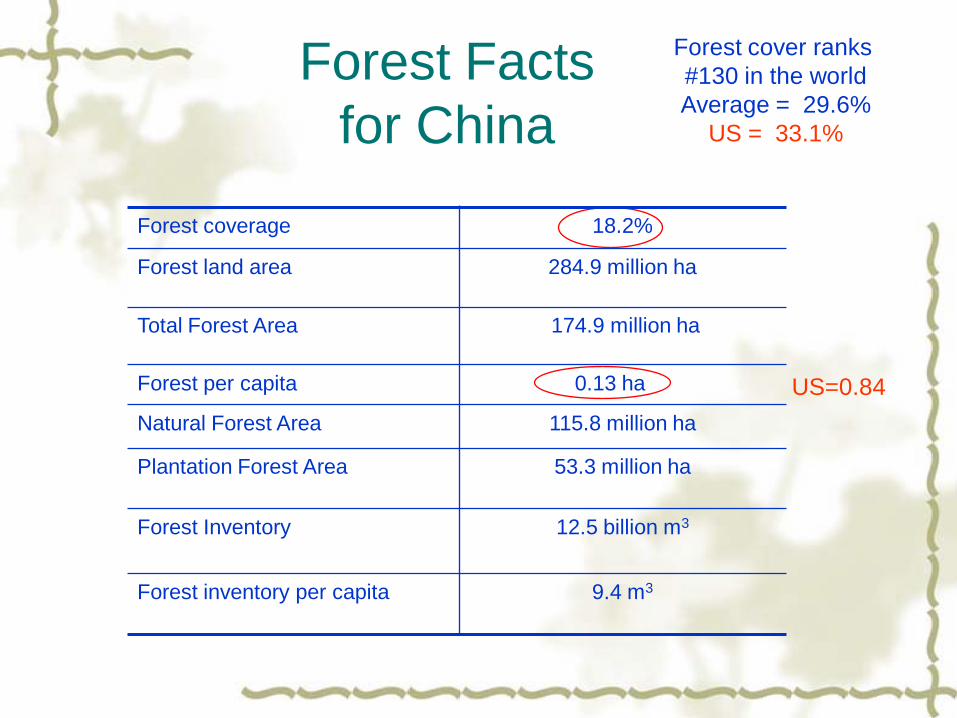
Forest Facts for China
Forest cover ranks #130 in the worldAverage = 29.6%
US = 33.1%
Forest coverage 18.2%
Forest land area 284.9 million ha
Total Forest Area 174.9 million ha
Forest per capita 0.13 ha
Natural Forest Area 115.8 million ha
Plantation Forest Area 53.3 million ha
Forest Inventory 12.5 billion m3
Forest inventory per capita 9.4 m3
US=0.84

What’s going on in China’s forests?
Reforms over the last 20 years have focused on: Protecting China’s natural forests Increasing its domestic wood supply and
processing capacity Opening up regulations and markets for
forests and forestry

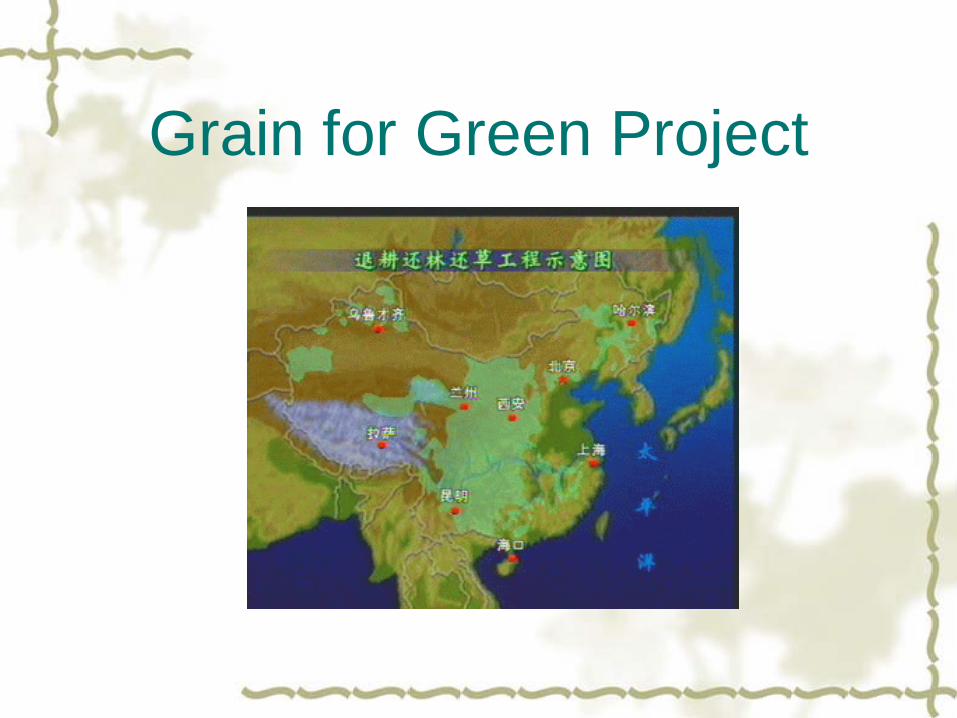
Grain for Green Project Farmland slope > 25 degrees (since 1999) Government provides seedlings for free Trees provide ecological and economic
benefits but not timber (e.g. soil stablization, fruits)
Government pays farmers to replace crops with trees

Grain for Green Project
Grain for Green Project

Grain for Green Project Different subsidy standards (grain and cash for seedling) Yangzi watershed 125
Yuan/mu/yr (mu=1/15 ha) Yellow river 75 Yuan/mu/yr Subsidy term depends on the
conversiotype
24 million ha land converted to forest land
Investment =130 billion Yuan by 2006

Grain for Green Project
before after

Grain for Green Project Environmental improvement
Economic benefits
Social aspectEmployment opportunitiesEducation

The Question is:
What will farmers do with the land after subsidies end?

Natural Forest Protection Project
Began in 1998 It protects natural forestlands, mainly along
parts of the Yangzi and Yellow rivers, and northeast ,northwest state-owned forest,

Natural Forest Protection 19.54 million m3
11.02 million m3
012 million m3

Natural Forest Protection
Effectively removes productive forestland from future harvest
Imposes great impacts on domestic wood production
68 million ha forest protected Promotes consciousness of
natural forest protection and legal harvest

Forest Land Tenure Reforms
Started in 2003:
70 year leases Not ownership, but transferable user rights Private companies may purchase Encourages investment Promotes forestry productivity

Forest Land Tenure Reforms

Forest Land Tenure Reforms Similar to the "Household Responsibility
System" in 1978 The second revolution in rural areas Market economy in forestland
Hope they can keep smiling.

Fast Growth Forest Program Establishes fast-growing plantations to substitute
for natural forests in 18 provinces Goal is to build up 13 million ha by 2015 (40% of
total consumption) Currently only planted 3.7 million ha
(underperforming)

Fast Growth Forest Distribution
Source: China Academy of Forestry

Fast Growth Forest Program
Goal is very ambitious and may not be achievable within the time frame
Wood shortfall is still severe and thus imports continue to rise

Summary of the programs
Grain for Green ProjectNatural Forest Protection ProgramForest Land Tenure ReformsFast Growth Forest Program

My Research Interests: Forest Products Market Modeling
China is the #1 forest products trading country (in value) in the world since 2005
Smile curve “both ends outside” Largest plywood, furniture and resin
exporter Largest roundwood importer

ProductionLog production declines post-1998 following harvest bans
Datasource: FAO database
Industrial Round Wood Production
01020304050607080
1961
1965
1969
1973
1977
1981
1985
1989
1993
1997
2001
2005
industrial round wood
Small scale factories are the majority of producers

Consumption
Datasource: FAO database
Consumption of forest products in China
0.00
50.00
100.00
150.00
200.00
250.00
1961
1964
1967
1970
1973
1976
1979
1982
1985
1988
1991
1994
1997
2000
2003
2006
Mill
ion
cubi
c m
eter
s
Sawlogs+Veneer logs Pulpwood Reconstituted panelsMiscellaneous products Fuelwood
Fuelwood: statistical disparity

Imports

Exports1. Bad debt from the US, fund chain broken for export-oriented companies, several hundred million owed by the US for the furniture industry2. Bankruptcy of some furniture factories in South China3. Labor cost rises
Will the rapid increase continue?

What are the factorsaffecting timber consumption?
Population? Macro-economy (GDP, disposable income)? Industry capacity? Price? Currency exchange rate? Technical change? Something else?

Structure analysis:timber consumption structure
1962 1986
0
100
200 Sawlogs+Veneer logs
Pulpwood
Reconstituted panelsMiscellaneous products
Fuelwood
1962
0
100
200 Sawlogs+Veneer logs
Pulpwood
Reconstituted panelsMiscellaneous products
Fuelwood
1986

Timber consumption structure
1992 2006
0
200
400
600 Sawlogs+Veneer logs
Pulpwood
Reconstituted panelsMiscellaneous products
Fuelwood
2002 2006
0
400
800
1200 Sawlogs+Veneer logs
Pulpwood
Reconstituted panelsMiscellaneous products
Fuelwood

What drives structural change over time?
Policy? Environmental consciousness? Price or income? Substitutions?
How do we capture these factors?

Areas of Interest:
What is the future trend for forest products trade in China?
What will be the trend for plywood, newsprint and some other major products?
What will be the trade potential between China and its main trade partners, eg US and Russia?
Who will be the main suppliers for logs to China? Who will buy China's forest products (plywood,
furniture, coated paper) and at what levels?

Areas of InterestsGiven the economic uncertainty and US slowdown, what impact will this have on Chinese wood industry and trade?
Will China be able to stay competitive even as its labor costs increase?
What regulatory policies impact forest products trade with China, from the Chinese side (fees, taxes, harvesting quotas) and the key partner side (tariffs, import quotas, interest rates)?
How can we measure these impacts and apply them to supply/demand forecasts?

Some findings Factors affecting timber consumption in China1. Output value of timber manufacturing industry 2. Paper and paper board production
China timber consumption is largely concentrated in the timber manufacturing industry.

Some findings
Factors affecting timber consumption in US
1. GDP per capita2. Population3. Single family housing starts

Methods PLS regression of multi-block variables based on the
Schmidt transformation (2 steps)1. Variable selection Multiblock variables to group independent variables into
different blocks according to physical meanings. Schimdt transformation to reduce duplicative information
between variables2. PLS regression PLS to reduce the colliearity problem between variables
selected.

Some findings (fitting chart)
China US
050
100150200250300350
1993
1994
1995
1996
1997
1998
1999
2000
2001
2002
2003
2004
2005
y (10
6 m
3)
obser ved pr edi ct ed
450000500000
550000600000
650000
1984
1986
1988
1990
1992
1994
1996
1998
2000
2002
2004
2006
predicted observed

Thank you !