forest carbon estimation using the forest vegetation ...to decrease from 0.4 to 6.6 tons/acre as...
TRANSCRIPT

United States Department of Agriculture
Forest Service
Northern Research Station
General Technical Report NRS-77
Forest Carbon estimation Using the Forest Vegetation simUlator: seVen things YoU need to Know
Coeli M. Hoover and Stephanie A. Rebain
AbstractInterest in options for forest-related greenhouse gas mitigation is growing, and so is the need to assess the carbon implications of forest management actions. Generating estimates of key carbon pools can be time consuming and cumbersome, and exploring the carbon consequences of management alternatives is often a complicated task. In response to this, carbon reporting capability has been added to the Forest Vegetation Simulator (FVS) growth and yield modeling system, allowing users to produce carbon reports along with traditional FVS outputs. All methods and computations are consistent with Intergovernmental Panel on Climate Change (IPCC) Good Practice Guidance and U.S. voluntary carbon accounting rules and guidelines. We briefly describe the FVS system, outline the carbon pools estimated, and provide an overview of the data requirements, capabilities, features, and limitations of the model and the carbon reports. We also review common questions and pitfalls encountered by users when running the model.
Visit our homepage at: http://www.nrs.fs.fed.us/
Published by: For additional copies:
USDA FOREST SERVICE USDA Forest Service11 CAMPUS BLVD., SUITE 200 Publications DistributionNEWTOWN SQUARE, PA 19073-3294 359 Main Road Delaware, OH 43015-8640February 2011 Fax: 740-368-0152
Manuscript received for publication May 2010
The AuthorsCOELI M. HOOVER is a research ecologist with the U. S. Forest Service, Northern Research Station, in Durham, NH. STEPHANIE A. REBAIN is a forester with the U. S. Forest Service, Forest Management Service Center, in Fort Collins, CO.
CoverCover art designed and drawn by Eric Fiegenbaum; used with his permission.
FVS Web site: http://www.fs.fed.us/fmsc/fvs/
�
INTRoduCTIoN
The growing number of climate change agreements and action plans at scales ranging from local to international has led to a greater need for information on forest carbon stocks now and in the future. While estimates and tools (Proctor et al. 2005, Smith and Heath 2008, Smith et al. 2007, U.S. EPA 2008, http://nrs.fs.fed.us/carbon/tools) are available at the county, state, and national levels, developing carbon estimates from inventory data for multiple forest stands or entire forests is generally an unwieldy process. As forest carbon markets and greenhouse gas policies continue to develop, the question of how forest management practices positively or negatively affect carbon storage becomes increasingly important to answer. Accounting for carbon in harvested wood presents an additional challenge when addressing questions related to management options and carbon storage.
Because of this increased demand for forest carbon information, a tool was needed to calculate forest carbon stocks at smaller scales and to estimate forest management impacts on carbon. The following criteria were established: the tool should be accessible to managers, include the ability to assess the carbon consequences of forest management treatments, and produce estimates consistent with most current U.S. and international carbon accounting rules and guidelines. The FVS carbon reports were developed to meet this need. We provide here a brief overview of the FVS growth and yield framework, including data requirements; describe the FVS carbon reports and their underlying calculations; discuss their capabilities, strengths, limitations, and appropriate use; and list seven questions and answers important to know when working with FVS.
FoReST VeGeTATIoN SImulAToR (FVS) oVeRVIeW
The Forest Vegetation Simulator (FVS) is the U.S. Forest Service’s nationally supported framework for forest growth and yield modeling. At its core, FVS is an individual-tree, distance-independent growth model; it predicts changes in tree diameter, height, crown ratio, and crown width, as well as mortality, over time. FVS has both empirical and theoretical components. For instance, diameter growth is predicted from equations fit from large datasets collected in a particular geographic area. Conversely, in many of the FVS geographic variants, density-related mortality is predicted by comparing the current stand density to a theoretical maximum density for that stand type. FVS originated as the Stand Prognosis Model in the �970s (Stage �973, Wykoff et al. �982) and, over time, growth equations developed for other parts of the United States were incorporated into the Prognosis framework. It has also been expanded to meet the needs of contemporary forest managers and is now a true stand dynamics model. Much of this expansion occurred through the addition of extensions to the core growth model. Extensions of FVS model impacts of various disturbance agents such as fire, insects, and disease, and they provide additional outputs such as economic analyses. As a result, model output pertains to a wide range of natural resource disciplines and includes variables related to stand density and structure, canopy cover, snag dynamics, fire hazard, and surface fuel loading, among others (see Appendix A for a partial listing of available FVS outputs). Users can also include standard forest management activities to see how they affect these forest attributes. Consequently, the FVS model is used extensively throughout the United States to support forest management decisionmaking; approximately 20 geographic variants, each with regionally appropriate default settings, are available (Crookston and Dixon 2005, Dixon 2002). A map and list of available FVS variants are provided in Appendix B.
2
FVS has specific input requirements and file formats. Input data may be stored in text files or within a database. Either way, a variety of site-specific data is input. Stand-level variables include a measure of site quality, such as site index or habitat type, slope, aspect, elevation, inventory design specifications, and other parameters (see Appendix C for a description of input variables). If these values are not provided, default values are used. Default values are also provided for forest floor and various diameter classes of down dead wood; users should enter their own data if available. Necessary tree-level variables include species and diameter. Additional variables such as tree status (live or dead), height, crown ratio, and others may be included; otherwise they will be estimated using default relationships. Each geographic variant has various submodels that describe growth and mortality; users should become familiar with the various model relationships and the input data requirements and structure, all of which are documented in publications on the FVS Web site.
The Fire and Fuels extension (FFe)Fire is a component of many forest ecosystems, and the Fire and Fuels Extension (FFE) (Reinhardt and Crookston 2003) was developed to provide managers with a way to assess the intensity and effects of potential fires and to model the effects of fuel management treatments on fire potential. Many components of stand-level carbon (e.g., snags, down dead wood, forest floor) are estimated and reported in the FFE, so carbon reporting functions are part of the FFE rather than a separate extension to the model system (for a detailed description of the development history, see Hoover and Rebain 2008). Calculation methods are consistent with the U.S. Carbon Accounting Rules and Guidelines for the �605(b) Voluntary Greenhouse Gas Reporting Program (available at http://www.eia.doe.gov/oiaf/�605/gdlins.html) and the Intergovernmental Panel on Climate Change (IPCC; Penman et al. 2003) Good Practice Guidance for national greenhouse gas inventories. A complete description of the carbon reporting methods and assumptions is provided in the Fire and Fuels Extension documentation (Rebain 20�0).
CARboN RepoRTS: poolS ANd opTIoNS
Two carbon reports can be requested: the Stand Carbon Report and the Harvested Carbon Report. The Stand Carbon Report includes the major carbon pools as defined by the U.S. Carbon Accounting Rules and Guidelines and the IPCC Good Practice Guidance: aboveground live tree, belowground live tree (coarse roots), belowground dead tree, standing dead trees, down dead wood, forest floor, and understory (shrubs/herbs). In addition, the merchantable portion of live tree carbon is reported, as well as total stand carbon, total carbon removed during harvest, and carbon released from fire (if harvests or fires are simulated). Users may choose measurement units: pool amounts can be reported in tons per acre, metric tons per hectare, or metric tons per acre, a hybrid unit. Carbon stock estimates are produced by applying conversion factors to the biomass estimates generated as part of the standard calculations carried out by FVS and the FFE. Biomass, expressed as dry weight, is assumed to be 50 percent carbon (Penman et al. 2003) for all pools except forest floor, which is estimated as 37 percent carbon (Smith and Heath 2002). Carbon pools in the Stand Carbon Report are defined as follows (for additional details, consult Hoover and Rebain 2008 or the Fire and Fuels Extension documentation):
• Total Aboveground Live: carbon in live trees, including stems, branches, and foliage. Choice of calculation methods: either volume based default FVS-FFE methods (Rebain 20�0, Reinhardt and Crookston 2003) or national biomass equations (Jenkins et al. 2003).
• Merchantable Aboveground Live: carbon in the merchantable portion of live trees; choice of calculation method as above.
• Belowground Live: carbon in coarse roots of live trees; carbon in fine roots is assumed to be part of the soil pool, not currently reported in FVS.
• Belowground Dead: carbon in coarse roots of dead or cut trees.

3
Figure 1.—Screen shot of sample Stand Carbon Report, with a thin from below simulated in 2015.
• Standing Dead: carbon in dead trees, including stems and any branches or foliage still present, but excluding roots.
• Down Dead Wood: all woody surface material regardless of size.
• Forest Floor: all surface organic material excluding wood (i.e., litter and duff); this definition is not an exact match with those used in �605(b) reporting. Under the �605(b) guidelines, fine woody debris (<3 inches) is included in the forest floor pool; in the FFE carbon reports, this material is included in the down dead wood pool. Future modifications include adding a category, fine woody debris, to the Stand Carbon Report and tracking this material separately.
• Herbs and Shrubs: carbon in live herbs and shrubs.
Other categories reported are Total Removed Carbon including carbon removed through cutting live or dead trees or hauling away surface fuel, and Carbon Released from Fire, which includes carbon in fuel consumed by simulated wildfires, prescribed burns, and pile-burns. This category is useful for comparing the carbon consequences of fuel management alternatives, because fire behavior, fuel consumption, and therefore carbon released, are based on the burn parameters entered. An example of the Stand Carbon Report, including a simulated thinning, is shown in Figure �. Note that the Total Removed Carbon column is non-zero only in the year of harvest, 2015.
Because FVS is a stand dynamics model, the carbon pools change over time. For instance, the aboveground and belowground live and dead pools are initially based on the inventory data provided, but then change due to tree growth, mortality, and removals. In the case shown in Figure �, the total aboveground live carbon is initially 46.8 tons/acre, then drops to 28.4 tons/acre after live trees are removed as part of the harvest, and then increases over the next 30 years to 34.9 tons/acre as the residual trees grow. Harvesting caused the live belowground carbon (live root carbon) to decrease from �0.4 to 6.6 tons/acre as some of this carbon is moved from the live belowground pool to the dead belowground pool. The dead belowground carbon decreases over time due to decay. The standing dead carbon then decreases over time from 3.3 to 0.2 tons/acre as these snags fall to the ground and become down dead wood.
Down dead wood and forest floor biomass are pools that users can initialize from inventory data. If site-specific data are not available, default values are provided for forest floor and various diameter classes of down dead wood. During a projection, these estimates fluctuate to take into account surface fuel decay as well as additions, such as litterfall, snagfall, and harvesting residues. As an example, in Figure �, the down dead wood increases from 4.6 tons/acre to �2.9 tons/acre, because, in this example, crown material was left as slash during the harvest. The
-------------------------------------------------------------------------------------------------------------- ****** CARBON REPORT VERSION 1.0 ****** STAND CARBON REPORT ALL VARIABLES ARE REPORTED IN TONS/ACRE
STAND ID: 11P MGMT ID: NONE-------------------------------------------------------------------------------------------------------------- Aboveground Live Belowground Forest Total Total Carbon ----------------- ----------------- Stand ------------------------- Stand Removed ReleasedYEAR Total Merch Live Dead Dead DDW Floor Shb/Hrb Carbon Carbon from Fire--------------------------------------------------------------------------------------------------------------2005 46.8 30.0 10.4 0.7 3.3 4.6 7.1 0.3 73.3 0.0 0.02015 28.4 20.5 6.6 5.3 2.0 12.9 7.3 0.3 62.7 11.9 0.02025 30.5 21.9 7.2 3.4 0.4 6.6 6.7 0.3 55.1 0.0 0.02035 32.6 23.5 7.7 2.3 0.2 4.3 6.8 0.3 54.2 0.0 0.02045 34.9 25.3 8.3 1.5 0.2 3.2 7.0 0.3 55.4 0.0 0.0

4
herb and shrub estimates are initially based on stand attributes such as dominant species and density, and they change over time as stand conditions change. More details can be found in the FVS and FFE documentation (Dixon 2002, Rebain 20�0, Reinhardt and Crookston 2003).
The Harvested Carbon Report tracks the fate of carbon in harvested merchantable material, including salvaged logs. Carbon in removed merchantable biomass is allocated into various pools and followed over time; for example, a product in use may be discarded, transferring carbon from the product pool into the landfill pool. Both merchantability specifications and allocation to harvested carbon pools differ by FVS variant. Choices made about units and methods of calculation for the Stand Carbon Report carry over to the Harvested Carbon Report. Carbon in harvested merchantable biomass is allocated following the methods of Smith et al. (2006) to the following pools:• Products in use• Products in landfills• Carbon emitted from combustion with energy
capture• Carbon emitted from combustion or decay without
energy capture
Carbon in forest products and in landfills is summarized in the Merchantable Carbon Stored column of the Harvested Carbon Report, while the Merchantable Carbon Removed column reflects all of the carbon in merchantable biomass that was removed from the stand and is the sum of the four pools above. Over time, stored carbon from a particular harvest will shift to one of the other categories.
An example of the Harvested Carbon Report is given in Figure 2. In this example, ��.9 tons/acre of carbon was removed from the stand during the harvest, but initially only 7.5 tons/acre of that was stored in forest products. Over time, carbon stored in forest products in use declines, as some moves to landfills and some decays or is burned. At the end of the simulation, 4.3 tons/acre of the initial removal was still storing carbon.
While carbon removed from the stand is reported in the year of harvest in the Stand Carbon Report, the carbon contained in earlier removals is not included, nor is the carbon accounted for once it leaves the stand. Consequently, if harvesting is simulated, you should request both reports and add the number in the Merchantable Carbon Stored column from the Harvested Carbon Report to the corresponding value
Figure 2.—Screen shot of sample Harvested Carbon Report, with a thin from below simulated in 2015. ------------------------------------------------------------------------------ ****** CARBON REPORT VERSION 1.0 ****** HARVESTED PRODUCTS REPORT ALL VARIABLES ARE REPORTED IN TONS/ACRE
STAND ID: 11P MGMT ID: NONE------------------------------------------------------------------------------ Merch Carbon ---------------YEAR Prducts Lndfill Energy Emissns Stored Removed------------------------------------------------------------------------------2005 0.0 0.0 0.0 0.0 0.0 0.02015 7.5 0.0 2.5 1.9 7.5 11.92025 3.8 1.6 3.6 2.9 5.4 11.92035 2.6 2.1 3.9 3.3 4.7 11.92045 2.1 2.2 4.1 3.5 4.3 11.9
5
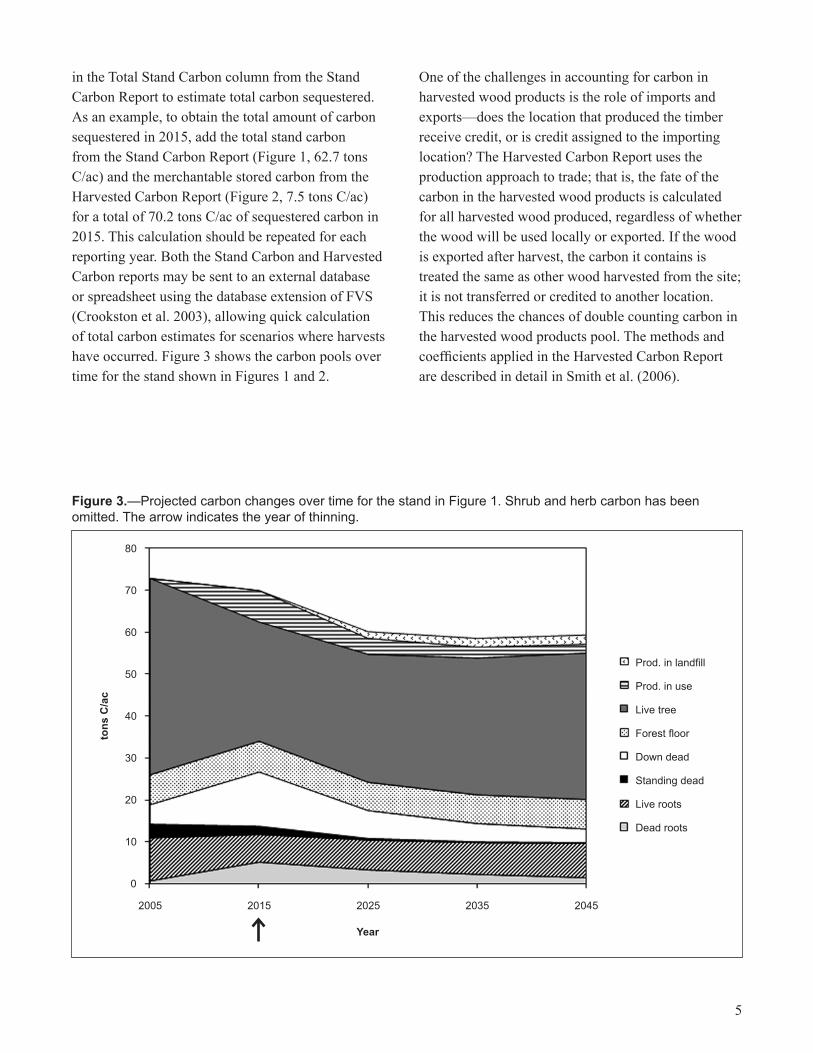
in the Total Stand Carbon column from the Stand Carbon Report to estimate total carbon sequestered. As an example, to obtain the total amount of carbon sequestered in 20�5, add the total stand carbon from the Stand Carbon Report (Figure �, 62.7 tons C/ac) and the merchantable stored carbon from the Harvested Carbon Report (Figure 2, 7.5 tons C/ac) for a total of 70.2 tons C/ac of sequestered carbon in 20�5. This calculation should be repeated for each reporting year. Both the Stand Carbon and Harvested Carbon reports may be sent to an external database or spreadsheet using the database extension of FVS (Crookston et al. 2003), allowing quick calculation of total carbon estimates for scenarios where harvests have occurred. Figure 3 shows the carbon pools over time for the stand shown in Figures � and 2.
One of the challenges in accounting for carbon in harvested wood products is the role of imports and exports—does the location that produced the timber receive credit, or is credit assigned to the importing location? The Harvested Carbon Report uses the production approach to trade; that is, the fate of the carbon in the harvested wood products is calculated for all harvested wood produced, regardless of whether the wood will be used locally or exported. If the wood is exported after harvest, the carbon it contains is treated the same as other wood harvested from the site; it is not transferred or credited to another location. This reduces the chances of double counting carbon in the harvested wood products pool. The methods and coefficients applied in the Harvested Carbon Report are described in detail in Smith et al. (2006).
Figure 3.—Projected carbon changes over time for the stand in Figure 1. Shrub and herb carbon has been omitted. The arrow indicates the year of thinning.
Prod. in landfill
Prod. in use
Live tree
Forest floor
Down dead
Standing dead
Live roots
Dead roots
80
70
60
50
40
30
20
10
0
2005 2015 2025 2035 2045
tons
C/a
c
Year
6
Increasingly, forest managers are being asked to consider the potential carbon consequences of forest management actions. The possibility of earning income from the sale of carbon credits further highlights the need for projections of forest carbon stocks into the future. While there are multiple carbon registries at this time, many require that forest carbon storage be “additional”—that is, above and beyond business as usual—to receive credit as an emission offset. Determining this baseline level of carbon storage can be difficult, but this is another area where the carbon reporting functions can help managers. Using data from an appropriately designed forest inventory, managers can generate baseline carbon stock estimates by simulating the “business as usual” management actions for any given tract. Alternative management scenarios can then be simulated, and the carbon stock estimates and average annual change can be compared for a variety of management alternatives in the same manner that FVS is generally used to compare the outcomes of various management options. For example, if “business as usual” is to rely on natural regeneration after a disturbance, you could simulate this in FVS and estimate carbon storage. To estimate carbon storage under a second scenario, one where desirable tree species are planted instead, a second simulation could be run with the planting specifications. By comparing the two simulations, you can determine how much (if any) additional carbon may be stored by planting trees instead of relying on natural regeneration.
GeNeRATING The RepoRTS – CARboN KeYWoRdS
The keywords needed to generate carbon reports can be found in the FFE menu in Suppose, the graphical user interface for FVS. Three main keywords relate to the carbon accounting functions. CarbRept requests the Stand Carbon Report and CarbCut requests the Harvested Carbon Report. The CarbCalc keyword is used to select the biomass prediction method, reporting units, and annual decay rate of coarse roots. To assist with output analysis, both reports can be sent to an external database or spreadsheet using the CarbRpts keyword in the database extension menu in Suppose. A secondary option for FVS users who are not as familiar with individual keywords is to request, adjust, and export the carbon reports by choosing “Select Outputs” and then “FFE Carbon Reports.”
example: bartlett experimental Forest The Bartlett Experimental Forest (BEF) is a northern hardwood forest of about 5,790 acres in the White Mountains of central New Hampshire. The BEF, originally 2,600 acres, was expanded to its present area in 2005 to meet ongoing research needs. The most recent inventory was conducted from 200� to 2003, before the expansion. All live stems 2 inches d.b.h. and over were tallied on 440 permanent cruise plots, which are generally 0.25 acres in size. This information on inventory design is used by FVS to produce the correct per acre expansion factors. The inventory data from these plots were run through the FVS system; the resulting current carbon stocks for BEF are given in Table �. Because the carbon stock estimates are produced by applying conversion factors to the standard biomass estimates generated by FVS and the FFE, the accuracy of the carbon reports depends on the accuracy and adequacy of the inventory data supplied by the user. Users need to make certain that their forest inventory design is appropriate and that a sufficient number of plots have been measured to ensure meeting the error level specified in the inventory design. Supplying as much information as possible will also

7
improve the projections and estimates; while tree height is not a required input variable, adding it will improve model performance. Similarly, if data on down dead wood and forest floor mass are available, including these instead of relying on regional default values is advised.
As a simple illustration, the data from BEF were used to run projections of carbon stocks over the next 40 years, with no management actions simulated. The current version of the northeast variant was used and local values were input for site index, slope, aspect, and elevation. Mortality and growth rates were left at their default settings, and seedlings were added periodically to simulate natural background regeneration (only a few of the geographic variants include automatic regeneration; aside from stump
sprouts, users must specify the size and amount of seedlings by species). Table 2 shows the carbon stocks from this base projection, including average annual change in carbon stocks for each �0-year period and for the entire projection. If harvesting is simulated, the Stand Carbon Report will include the carbon in logging slash (by default, crowns are added to the down dead wood and forest floor pools), while the Harvested Carbon Report includes merchantable carbon in wood products and landfills (see Figures � and 2 for examples of these reports). Again, users must add the value in the Merchantable Carbon Stored column from the Harvested Carbon Report to the value in the Total Stand Carbon column in the Stand Carbon Report to account for all pools when a harvest occurs. This must be done for each reporting year following a harvest.
Table 1.—Carbon stocks on the bartlett experimental Forest in 2005
pool Tons C/acre Tons C forest-wideAboveground live biomass 44.1 255,339Belowground live biomass 10.2 59,058Standing dead 2.9 16,791Belowground dead biomass 0.7 4,053Down dead wood 4.5 26,055Forest floor 7.3 42,267Shrubs and herbs 0.3 1,737Total 70.0 405,300
Table 2.—projected carbon stocks on the bartlett experimental Forest, 2005-2045
base Growth Scenario Average Annual ChangeYear (tons C/acre) (tons C/acre/yr) a 2005 70.0 2015 74.5 0.452025 78.8 0.432035 82.6 0.382045 86.1 0.352005-2045 0.40a Average annual change is for each 10-year period, e.g., 2005-2015, 2015-2025

8
CommoN QueSTIoNS: SeVeN ThINGS You Need To KNoW
Should carbon stocks be analyzed, or change calculated over time?The Stand Carbon Report provides an estimate of the amount, or stock, of carbon at a specified point in time. While carbon stock estimates are important, when comparing management alternatives it is most useful to compute the rate of change over time (average annual change). The average annual change in carbon stocks is similar to periodic annual increment and is simply calculated by taking the difference between the carbon stock at Time 2 and Time � and dividing by the number of years between the two. This gives the rate of change for that time period; note that short-term and long-term rates may differ for any given management alternative. When framing an analysis, the management objectives should be considered and the time frame should be chosen to reflect those objectives. For the BEF case study above (Table 2), the rate of average annual change in carbon from 2005 to 20�5 is:
(74.5 tons C/ac – 70 tons C/ac) / �0 years = 0.45 tons C/ac/year
This calculation can easily be made for any pool; e.g., live aboveground biomass only or all live biomass in trees. Users may be tempted to run FVS with a cycle length of � year to generate annual estimates, but this practice is discouraged because the default cycle lengths are related to the increment data on which the growth models were built. Using cycle lengths other than the default (�0 years in most variants) may result in underprediction or overprediction of stand attribute values relative to those obtained using the default (Wykoff et al. �982). A few �-year cycles within a simulation will not significantly bias simulation results, but creation of whole simulations with �-year cycles is discouraged. To produce annual estimates, it is good practice to compute average annual change as described above. In general, annual changes in
carbon stocks are difficult to field verify because the carbon increment for a single year will often be within the bounds of measurement error, while changes in carbon pools over a longer period are generally within detection limits.
FVS is a stochastic model; however, by default, the same random number seed is used and so the same simulation file produces the same results with each run. Random effects are incorporated in the model through the distribution of errors associated with the prediction of the logarithm of basal area increment. The effects of these differing diameter growth rates extend through most of the remaining components of the model (Dixon 2002). It is possible to reset the random number seed to produce variation in projection results with the RANNSEED keyword. Hamilton (�99�) suggests several projections should be made using different random seeds rather than relying on the results of a single simulation. When estimating carbon, it is good practice to follow this recommendation of multiple model runs in a stochastic manner to get some knowledge of the expected variation around the estimate.
does regeneration occur automatically in simulations?Probably not. Some FVS variants, such as Inland Empire, Eastern Montana, Central Idaho, and Southeast Alaska, have a full establishment model that predicts incoming regeneration over time. The rest of the variants do not—in these cases the only regeneration occurring automatically is from sprouting following a harvest or fire. As a result, depending on the length of your simulations and the types of management practices simulated, you may need to decide on regeneration rates and input them through keywords. Regeneration amounts may be derived from expert opinion or literature sources, or they may be inferred through other inventory data sources. Regeneration rates should be carefully considered since they may have a substantial impact on your simulation results.
9
does FVS estimate soil carbon?The soil carbon pool is currently not included in the carbon reports. Soil carbon stocks are highly variable across the landscape and do not respond to management actions in a uniform manner. While some estimates of soil carbon are available, they are quite general and for that reason are not included at this time. The status of forest soil carbon data and models is being monitored, and soil carbon may be included in the reports in the future.
What about cases where only live trees or large trees were inventoried? Will some car-bon pools be missing from the reports?The trees initially included in FVS simulations are those in your input dataset. To ensure all carbon pools are modeled, you must inventory small and dead trees, as well as large, live trees. If estimates of surface fuels (down dead wood) are available, they should be input to the model as well. If no surface fuel data are available, FVS dubs in initial values based on the forest type and other stand characteristics, depending on the variant you are running.
does FVS work for all forest types?FVS variants cover most forested areas of the United States. However, these variants were developed to generally describe forest growth in that region—each variant can and should be calibrated to local site conditions. Once a variant is selected, there are multiple ways to calibrate FVS to better match the site conditions (Hamilton �994, Ray et al. 2009, Vandendriesche and Haugen 2008). One simple thing is to make sure important variables that drive the growth and mortality equations are included in your input dataset. These vary by variant but typically include topographic variables (slope, aspect, and elevation) and site productivity variables (such as site index or habitat type). Reading the variant overview documentation for the specific area you are modeling is essential to know what to include. FVS also has a self-calibration feature that allows growth measurements to be entered and then used to adjust the default growth equations so that they better match a stand’s particular site conditions.
Which method of biomass calculation is the best choice?This depends on the scale of your analysis as well as on site factors. The default setting uses the regional volume equations from the National Volume Estimator Library, the standard method used by FVS. These volume estimates are then converted to biomass using species-specific pounds/cubic foot conversion factors. Because the volume equations do not include crown material, separate crown biomass equations are used to calculate the additional carbon in this portion of the tree. If you are working with just one geographic variant, this method is likely a good choice, since the equations are more local. If you are conducting analyses using several different geographic variants and comparing them, then you may wish to select the Jenkins et al. (2003) calculation option, which uses national biomass equations. This will eliminate possible differences in carbon estimates due to differences in the behavior of the regional volume equations. If the Jenkins et al. (2003) calculation option is chosen, it is used to calculate the live tree carbon in both the Stand Carbon Report and Harvested Carbon Report.
does FVS estimate carbon or carbon dioxide equivalents?The output units in the carbon reports are chosen by the user; while there are three choices, tons/acre, metric tons/hectare, or the hybrid unit of metric tons/acre, all output is in mass of carbon regardless of the unit selected. Those users who require output in terms of carbon dioxide will need to convert to carbon dioxide equivalent (CO2e), which is easily done by multiplying the mass of carbon by 44/�2, the molecular weight ratio of carbon dioxide to carbon. For nearly all reporting applications requiring the use of CO2e, the units are metric tons rather than English tons.

�0
lImITATIoNS oF The RepoRTS
The carbon reporting function was added to FVS primarily as a decision support tool for forest managers who need to address the carbon consequences of planned management actions and their alternatives. While this tool may be used to develop carbon sequestration estimates for carbon credit trading, the reports were not originally designed for this purpose and may not include some carbon pools that may be of interest to those engaged in reporting overall carbon emissions and sequestration. These include management related emissions such as the carbon emitted from equipment use when harvesting and transporting timber, transporting nursery stock for planting, etc. A complete carbon footprint analysis would include life-cycle analysis of all aspects of forest management, such as the emissions associated with the production, transportation, and application of fertilizer. FVS was designed as a growth and yield model; the carbon reporting functions simply convert standard FVS outputs to biomass and then to carbon using the assumptions detailed above and referenced in the model documentation. Full entity-wide carbon accounting is beyond the scope of FVS.
SummARY
By building on the existing capabilities of the FFE, we integrated easy-to-use, comprehensive carbon accounting capabilities into FVS. Managers familiar with the model can now estimate carbon stocks and assess the carbon implications of different management practices along with more traditional management objectives by using just a few additional keywords. It is important to note that the usual recommendations and guidance for running
simulations in FVS apply; the carbon reports simply build on standard FVS outputs. Those wishing to use the carbon reporting functions in FVS should be aware of the inventory and stand data requirements for their particular FVS variant, and calibrate the model to local conditions as much as possible. When using FVS for any purpose, including estimating carbon stocks, it is critical to begin with data from an appropriately designed forest inventory that meets a suitable level of error (generally ± �0 or 20 percent). FVS is constantly being improved and updated. As a result, the estimates of carbon may change based on the version of the software you are using. A list of bulletins describing updates and improvements to the various FVS components is maintained on the FVS Web site.
FVS is an extensive and complex model that can simulate nearly any forest management treatment. With this flexibility and complexity comes a fairly steep learning curve; it is strongly recommended that users have prior FVS experience or attend FVS training before attempting to use the model. Training sessions are held throughout the year; information on FVS training sessions can be found on the FVS Web site.
ACKNoWledGmeNTS
The authors would like to thank Linda Heath, Chad Keyser, and Mariko Yamasaki for feedback on an early draft of the manuscript. The final manuscript benefited from reviews and suggestions from Elizabeth Reinhardt, Robert Smith, Erin Smith-Mateja, and Michael VanDyck. We are grateful to Eric Fiegenbaum for creating the cover art and to Michael VanDyck for providing the map in Appendix B.

��
lITeRATuRe CITed
Crookston, N.L.; Dixon, G.E. 2005. The forest vegetation simulator: a review of its structure, content, and applications. Computers and Electronics in Agriculture. 49: 60-80.
Crookston, N.L.; Gammel, D.L.; Rebain, S.; Robinson, D.; Keyser, C. 2003. Users guide to the database extension of the forest vegetation simulator version 2.0. Internal Rep. Fort Collins, CO: U.S. Department of Agriculture, Forest Service, Forest Management Service Center. 58 p. (Last revised: March 20�0)
Dixon, G.E., comp. 2002. Essential FVS: A user’s guide to the Forest Vegetation Simulator. Internal Rep. Fort Collins, CO: U.S. Department of Agriculture, Forest Service, Forest Management Service Center. 220 p. (Last revised: February 2009)
Hamilton, D.A., Jr. �99�. Implications of random variation in the Stand Prognosis Model. Res. Note INT-394. Ogden, UT: U.S. Department of Agriculture, Forest Service, Intermountain Research Station. �� p.
Hamilton, D.A., Jr. �994. Uses and abuses of multipliers in the Stand Prognosis Model. Gen. Tech. Rep. INT-GTR-3�0. Ogden, UT: U.S. Department of Agriculture, Forest Service, Intermountain Research Station. 9 p.
Hoover, C.M.; Rebain, S. 2008. The Kane Experimental Forest carbon inventory: carbon reporting with FVS. In: Havis, R.N.; Crookston, N.L., comps. Third Forest Vegetation Simulator conference; 2007 February �3-�5; Fort Collins, CO. Proceedings RMRS-P-54. Fort Collins, CO: U.S. Department of Agriculture, Forest Service, Rocky Mountain Research Station: �7-22.
Jenkins, J.C.; Chojnacky, D.C.; Heath, L.S.; Birdsey, R.A. 2003. National-scale biomass estimators for United States tree species. Forest Science. 49: �2-35.
Penman, J.; Gytarsky, M.; Hiraishi, T.; Krug, T.; Kruger, D.; Pipatti, L.; Buendia, L.; Miwa, K.; Ngara, T.; Tanabe, K.; Wagner, F., eds. 2003. Good practice guidance for land use, land-use change and forestry. Intergovernmental Panel on Climate Change, Technical Support Unit. Institute for Global Environmental Strategies, Hayama, Kanagawa, Japan. http://www.ipcc-nggip.iges.or.jp
Proctor, P.; Heath, L.S.; Van Deusen, P.C.; Gove, J.H.; Smith, J.E. 2005. COLE: A web-based tool for interfacing with forest inventory data. In: McRoberts, R.E. et al., eds. Proceedings of the fourth annual forest inventory and analysis symposium; 2002 November �9-2�; New Orleans, LA. Gen. Tech. Rep. NC-252. St Paul, MN: U.S. Department of Agriculture, Forest Service, North Central Research Station: �67-�72.
Ray, D.G; Saunders, M.R.; Seymour, R.S. 2009. Recent changes to the northeast variant of the Forest Vegetation Simulator and some basic strategies for improving model outputs. Northern Journal of Applied Forestry. 26(�): 3�-34.
Rebain, S.A., comp. 20�0. The fire and fuels extension to the Forest Vegetation Simulator: updated model documentation. Internal Rep. Fort Collins, CO: U.S. Department of Agriculture, Forest Service, Forest Management Service Center. 366 p. (Last revised: September 20�0)
Reinhardt, E.; Crookston, N.L., tech. eds. 2003. The fire and fuels extension to the Forest Vegetation Simulator. Gen. Tech. Rep. RMRS-GTR-��6. Ogden, UT: U.S. Department of Agriculture, Forest Service, Rocky Mountain Research Station. 209 p.
Smith, J.E.; Heath, L.S. 2002. A model of forest floor carbon mass for United States forest types. Res. Pap. NE-722. Newtown Square, PA: U.S. Department of Agriculture, Forest Service, Northeastern Research Station. 37 p.

�2
Smith, J.E.; Heath, L.S. 2008. Forest carbon sequestration and products storage, Appendix C and Chapter 4 in: U.S. Agriculture and Forestry Greenhouse Gas Inventory: �990-2005. Tech. Bull. �92�. Washington, DC: U.S. Department of Agriculture, Global Change Program Office: 65-80, C–�-C–7.
Smith, J.E.; Heath, L.S.; Nichols, M.C. 2007. U.S. forest carbon calculation tool: forest-land carbon stocks and net annual stock change. Gen. Tech. Rep. NRS-�3. Newtown Square, PA: U.S. Department of Agriculture, Forest Service, Northern Research Station. 28 p.
Smith, J.E.; Heath, L.S.; Skog, K.E.; Birdsey, R.A. 2006. Methods for calculating forest ecosystem and harvested carbon with standard estimates for forest types of the United States. Gen. Tech. Rep. NE-343. Newtown Square, PA: U.S. Department of Agriculture, Forest Service, Northeastern Research Station. 2�6 p.
Stage, A.R. �973. Prognosis model for stand development. Res. Pap. INT-�37. Ogden, UT: U.S. Department of Agriculture, Forest Service, Intermountain Forest and Range Experiment Station. 20 p.
U.S. EPA. 2008. Inventory of U.S. greenhouse gas emissions and sinks: 1990 - 2006. EPA 430-R-08-005. Washington, DC: U.S. Environmental Protection Agency, Office of Atmospheric Programs.http://www.epa.gov/climatechange/emissions/usinventoryreport.htm
Vandendriesche, D.; Haugen, L. 2008. Comparison of FVS projection of oak decline on the Mark Twain National Forest to actual growth and mortality as measured over three FIA inventory cycles. In: Havis, R.N.; Crookston, N.L., comps. 2008. Third Forest Vegetation Simulator conference; 2007 February �3-�5; Fort Collins, CO. Proceedings RMRS-P-54. Fort Collins, CO: U.S. Department of Agriculture, Forest Service, Rocky Mountain Research Station: 68-80.
Wykoff, W.R.; Crookston, N.L.; Stage, A.R. �982. User’s guide to the Stand Prognosis Model. Gen. Tech. Rep. INT-�33. Ogden, UT: U.S. Department of Agriculture, Forest Service, Intermountain Forest and Range Experiment Station. ��2 p.
�3
AppeNdIx A – FVS ouTpuT TAbleS
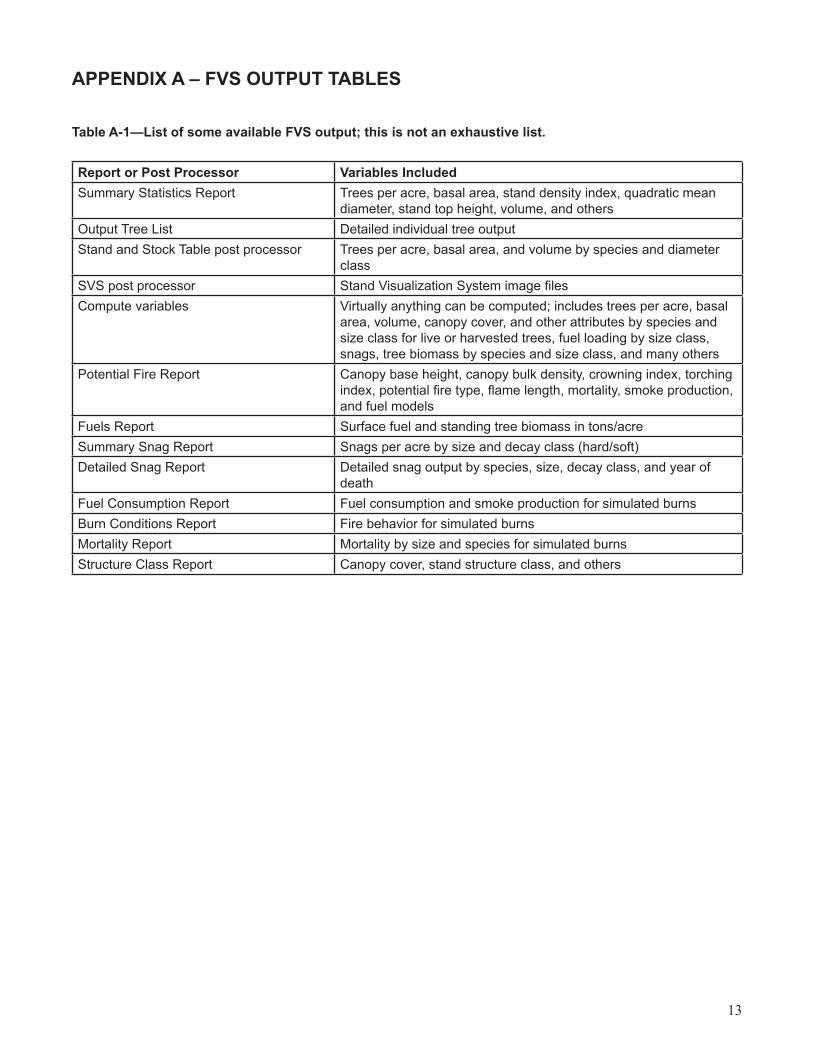
Table A-1—list of some available FVS output; this is not an exhaustive list.
Report or post processor Variables IncludedSummary Statistics Report Trees per acre, basal area, stand density index, quadratic mean
diameter, stand top height, volume, and othersOutput Tree List Detailed individual tree outputStand and Stock Table post processor Trees per acre, basal area, and volume by species and diameter
classSVS post processor Stand Visualization System image filesCompute variables Virtually anything can be computed; includes trees per acre, basal
area, volume, canopy cover, and other attributes by species and size class for live or harvested trees, fuel loading by size class, snags, tree biomass by species and size class, and many others
Potential Fire Report Canopy base height, canopy bulk density, crowning index, torching index, potential fire type, flame length, mortality, smoke production, and fuel models
Fuels Report Surface fuel and standing tree biomass in tons/acreSummary Snag Report Snags per acre by size and decay class (hard/soft)Detailed Snag Report Detailed snag output by species, size, decay class, and year of
deathFuel Consumption Report Fuel consumption and smoke production for simulated burnsBurn Conditions Report Fire behavior for simulated burnsMortality Report Mortality by size and species for simulated burnsStructure Class Report Canopy cover, stand structure class, and others
�4
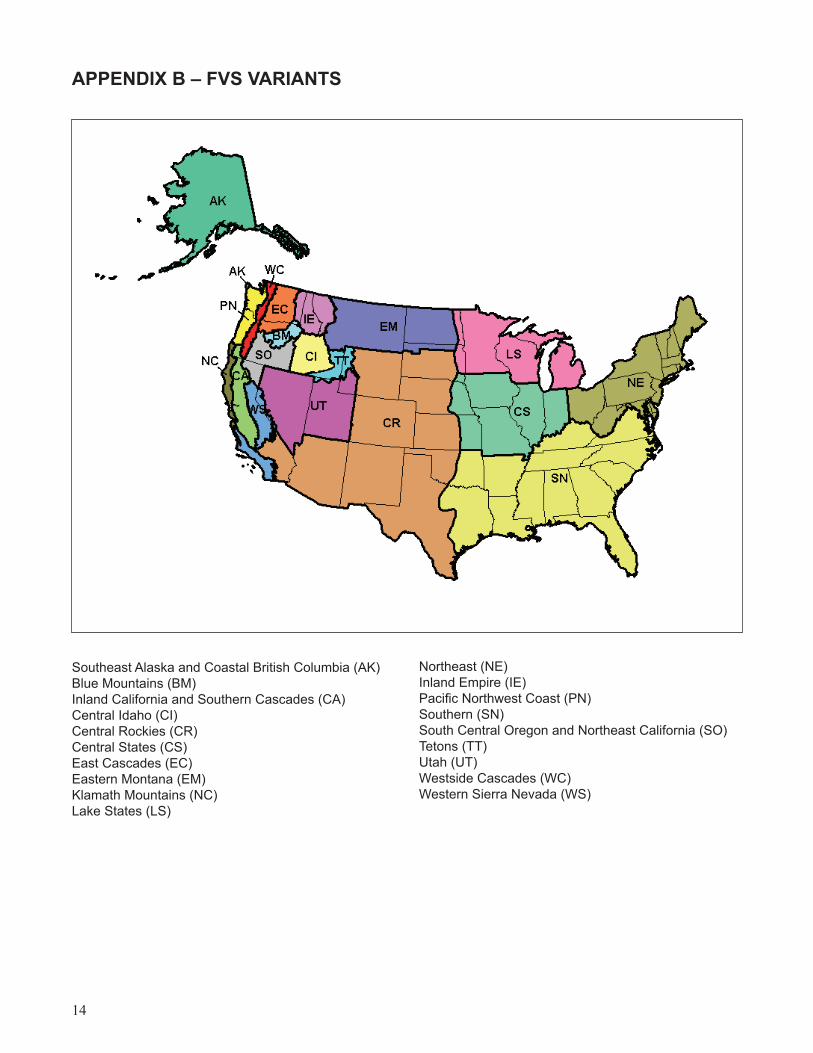
AppeNdIx b – FVS VARIANTS
Southeast Alaska and Coastal British Columbia (AK)Blue Mountains (BM)Inland California and Southern Cascades (CA)Central Idaho (CI)Central Rockies (CR)Central States (CS)East Cascades (EC)Eastern Montana (EM)Klamath Mountains (NC)Lake States (LS)
Northeast (NE)Inland Empire (IE)Pacific Northwest Coast (PN)Southern (SN)South Central Oregon and Northeast California (SO)Tetons (TT)Utah (UT)Westside Cascades (WC)Western Sierra Nevada (WS)
�5
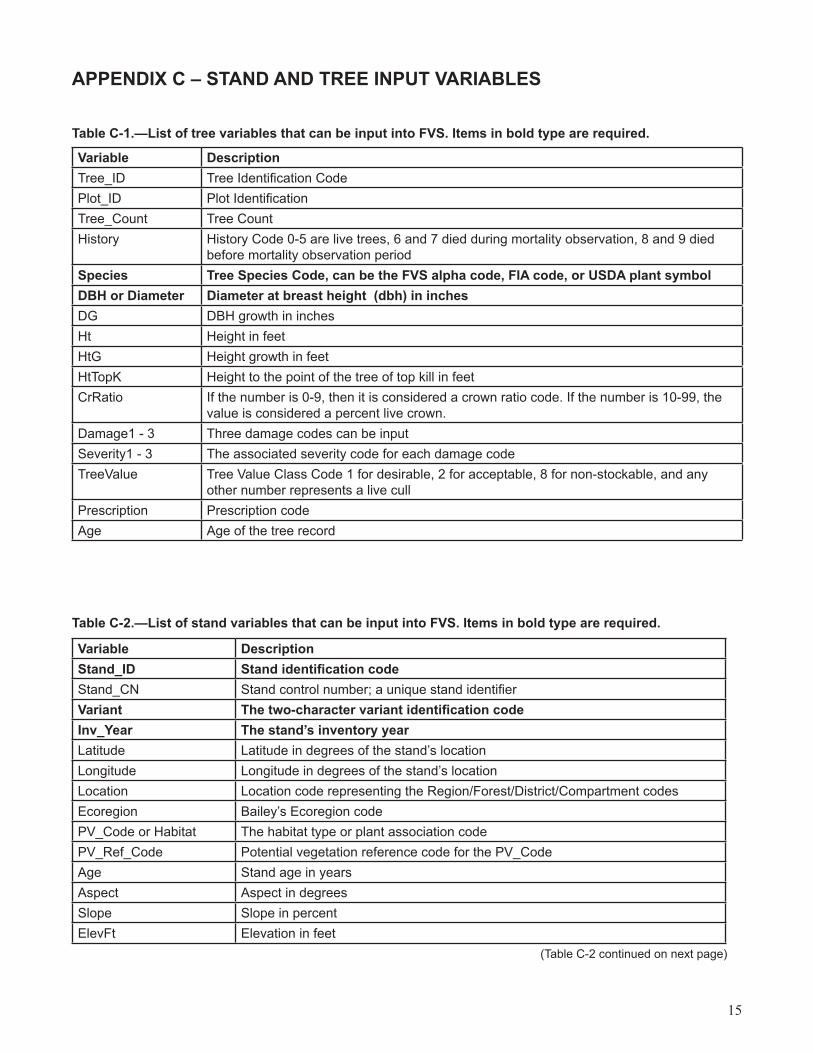
AppeNdIx C – STANd ANd TRee INpuT VARIAbleS
Table C-1.—list of tree variables that can be input into FVS. Items in bold type are required.
Variable descriptionTree_ID Tree Identification CodePlot_ID Plot IdentificationTree_Count Tree CountHistory History Code 0-5 are live trees, 6 and 7 died during mortality observation, 8 and 9 died
before mortality observation periodSpecies Tree Species Code, can be the FVS alpha code, FIA code, or uSdA plant symboldbh or diameter diameter at breast height (dbh) in inchesDG DBH growth in inchesHt Height in feetHtG Height growth in feetHtTopK Height to the point of the tree of top kill in feetCrRatio If the number is 0-9, then it is considered a crown ratio code. If the number is 10-99, the
value is considered a percent live crown.Damage1 - 3 Three damage codes can be inputSeverity1 - 3 The associated severity code for each damage code TreeValue Tree Value Class Code 1 for desirable, 2 for acceptable, 8 for non-stockable, and any
other number represents a live cullPrescription Prescription code Age Age of the tree record
Table C-2.—list of stand variables that can be input into FVS. Items in bold type are required.
Variable descriptionStand_Id Stand identification codeStand_CN Stand control number; a unique stand identifierVariant The two-character variant identification codeInv_Year The stand’s inventory year Latitude Latitude in degrees of the stand’s locationLongitude Longitude in degrees of the stand’s locationLocation Location code representing the Region/Forest/District/Compartment codesEcoregion Bailey’s Ecoregion code PV_Code or Habitat The habitat type or plant association codePV_Ref_Code Potential vegetation reference code for the PV_CodeAge Stand age in yearsAspect Aspect in degreesSlope Slope in percentElevFt Elevation in feet
(Table C-2 continued on next page)

�6
AppeNdIx C – STANd ANd TRee INpuT VARIAbleS (continued)
Table C-2. (continued)—list of stand variables that can be input into FVS. Items in bold type are required.
Variable descriptionbasal_Area_Factor basal area factor used in sampling large treesInv_plot_Size The inverse of the fixed plot size in acres used in sampling small treesbrk_dbh breakpoint dbh in inches between small tree and large tree plotsNum_Plots Number of plots NonStk_Plots Number of non-stockable plotsSam_Wt Sampling weight used to compute weighted averagesStk_Pcnt Stockable percentDG_Trans Diameter growth translation codeDG_Measure Diameter growth measurement periodHTG_Trans Height growth translation codeHTG_Measure Height growth measurement periodMort_Measure Mortality measurement periodMax_BA Maximum basal areaMax_SDI Maximum stand density index Site_Species Site species codeSite_Index Site index Model_Type Model type codeForest_Type Forest type code State FIA state codeCounty FIA county codeFuel_Model Fire behavior fuel modelFuel_0_25 Initial tons per acre of 0 to 0.25 inch fuel Fuel_25_1 Initial tons per acre of 0.25 to 1 inch fuel Fuel_1_3 Initial tons per acre of 1 to 3 inch fuelFuel_3_6 Initial tons per acre of 3 to 6 inch fuelFuel_6_12 Initial tons per acre of 6 to 12 inch fuelFuel_12_20 Initial tons per acre of 12 to 20 inch fuel Fuel_20_35 Initial tons per acre of 20 to 35 inch fuelFuel_35_50 Initial tons per acre of 35 to 50 inch fuelFuel_gt_50 Initial tons per acre of greater than 50 inch fuelFuel_Litter Initial tons per acre of litterFuel_Duff Initial tons per acre of duffPhoto_Ref Photo series reference number (1 – 32)Photo_Code Photo reference number

The U.S. Department of Agriculture (USDA) prohibits discrimination in all its programs and activities on the basis of race, color, national origin, sex, religion, age, disability, political beliefs, sexual orientation, and marital or family status. (Not all prohibited bases apply to all programs.) Persons with disabilities who require alternative means for communication of program information (Braille, large print, audiotape, etc.) should contact USDA’s TARGET Center at 202-720-2600 (voice and TDD). To file a complaint of discrimination, write USDA, Director, Office of Civil Rights, Room 326-W, Whitten Building, 1400 Independence Avenue SW, Washington, DC 20250-9410 or call 202-720-5964 (voice and TDD). USDA is an equal opportunity provider and employer.
Printed on recycled paper
Hoover, Coeli M.; Stephanie A. Rebain. 2011. Forest Carbon estimation using the Forest Vegetation Simulator: Seven Things You Need to Know. Gen. Tech. Rep. NRS-77. Newtown Square, PA: U.S. Department of Agriculture, Forest Service, Northern Research Station. 16 p.
Interest in options for forest-related greenhouse gas mitigation is growing, and so is the need to assess the carbon implications of forest management actions. Generating estimates of key carbon pools can be time consuming and cumbersome, and exploring the carbon consequences of management alternatives is often a complicated task. In response to this, carbon reporting capability has been added to the Forest Vegetation Simulator (FVS) growth and yield modeling system, allowing users to produce carbon reports along with traditional FVS outputs. All methods and computations are consistent with Intergovernmental Panel on Climate Change (IPCC) Good Practice Guidance and U.S. voluntary carbon accounting rules and guidelines. We briefly describe the FVS system, outline the carbon pools estimated, and provide an overview of the data requirements, capabilities, features, and limitations of the model and the carbon reports. We also review common questions and pitfalls encountered by users when running the model.
KEY WORDS: Forest Vegetation Simulator, forest carbon estimation, forest carbon sequestration, harvested wood products

www.nrs.fs.fed.us