foresight - higher school of economics 1-2016.pdf · glenn parry, oscar bustinza, ferran...
TRANSCRIPT

2016 Vol.10 No 1FORESIGHT
AND STI GOVERNANCEJOURNAL OF THE NATIONAL RESEARCH UNIVERSITY HIGHER SCHOOL OF ECONOMICS
ISSN 1995-459XeISSN 2312-9972
Applying Foresight to the Global Value Chains Studies
7
31
69
Defining Russia’s Technological Priorities
Quadruple Innovation Helix and Smart Specialization
IN THIS ISSUE

2 ФОРСАЙТ Т. 10 № 1 2016
StrategiesStrategiesInnovation and Economy
Publisher: National Research University Higher School of Economics
© National Research University Higher School of Economics, 2015
FORESIGHT AND STI GOVERNANCE
http://foresight-journal.hse.ru
Address: National Research University Higher School of Economics 20, Myasnitskaya str., Moscow, 101000, RussiaTel: +7 (495) 621-40-38 E-mail: [email protected]
Editor-in-Chief — Leonid Gokhberg, First Vice-Rector, HSE, and Director, ISSEK, HSE, Russian Federation
EDITORIAL BOARD
EDITORIAL COUNCIL
Тatiana Kuznetsova, HSE, Russian FederationDirk Meissner, HSE, Russian FederationYury Simachev, Russian Science FoundationThomas Thurner, HSE, Russian Federation, and University of Cape Town, South Africa
Institute for Statistical Studies and Economics of Knowledge
National Research University Higher School of Economics
Executive Editor — Marina BoykovaDevelopment Manager — Nataliya GavrilichevaLiterary Editors — Yakov Okhonko, Imogen WadeProofreaders — Ekaterina Malevannaya, Caitlin MontgomeryDesigner — Mariya SalzmannLayout — Mikhail Salazkin
Deputy Editor-in-Chief — Alexander Sokolov, HSE, Russian Federation
Periodicity — quarterly
ISSN 1995-459XeISSN 2312-9972
Igor Agamirzyan, Russian Venture CompanyАndrey Belousov, Administration of the President of the Russian FederationCristiano Cagnin, Center for Strategic Studies and Management (CGEE), BrasilElias Carayannis, George Washington University, United StatesMario Cervantes, Directorate for Science, Technology and Industry, OECDCharles Edquist, Lund University, SwedenTed Fuller, University of Lincoln, UKLuke Georghiou, University of Manchester, United KingdomKarel Haegeman, EU Joint Research Centre — Institute for Prospective Technological Studies (JRC-IPTS)Attila Havas, Institute of Economics, Hungarian Academy of SciencesМichael Keenan, Directorate for Science, Technology and Industry, OECDАlexander Khlunov, Russian Science FoundationAndrey Klepach, Bank for Development and Foreign Economic Affairs, Russian FederationМikhail Kovalchuk, National Research Centre «Kurchatov Institute», Russian FederationYaroslav Kuzminov, HSE, Russian FederationCarol S. Leonard, HSE, Russian Federation, and University of Oxford, United KingdomJonathan Linton, HSE, Russian Federation, and University of Ottawa, CanadaIan Miles, HSE, Russian Federation, and University of Manchester, United KingdomRongping Mu, Institute of Policy and Management, Chinese Academy of SciencesWolfgang Polt, Joanneum Research, AustriaSergey Polyakov, Foundation for Assistance to Small Innovative Enterprises, Russian FederationOzcan Saritas, HSE, Russian Federation, and University of Manchester, United KingdomKlaus Schuch, Centre for Social Innovation, AustriaNicholas Vonortas, George Washington University, United StatesAngela Wilkinson, OECD
2016 Т. 10 № 1 ФОРСАЙТ 3
StrategiesStrategiesInnovation and EconomyСтратегииImages of the FutureИнновации и экономика
Foresight and STI Governance (formerly Foresight-Russia) — a research journal established by the National Research University Higher School of Economics (HSE) and administered by the HSE Institute for Statistical Studies and Economics of Knowledge (ISSEK), located in Moscow, Russia. The mission of the journal is to support the creation of Foresight culture through dissemination of the best national and international practices of future-oriented innovation development. It also provides a framework for discussing S&T trends and policies.
• Foresight methodologies
• Results of Foresight studies
• Long-term priorities for social, economic and S&T development
• S&T and innovation trends and indicators
• S&T and innovation policies
• Strategic programmes of innovation development at national, regional, sectoral and corporate levels
• State-of-the-art methods and best practices of S&T analysis and Foresight.
The topical coverage of the journal makes it a unique Russian language title in its field. Foresight and STI Governance is published quarterly and distributed in Russia and abroad.
Research scholars, university professors, policy-makers, businessmen, expert community, post-graduates, undergraduates and others who are interested in S&T and innovation analyses, Foresight and policy issues.
INDEXING AND ABSTRACTING
Journal’s rankings in E-Library.RU Citation Index (impact factor for 2014)
1st — Studies of Science1st — Management
TOPICAL COVERAGE:
TARGET AUDIENCE:
ABOUT THE JOURNAL

StrategiesStrategies
NOTES FOR AUTHORS
Before submitting your article, please prepare your manuscript using the following guidelines:
Аrticles should be topical and original, should outline tasks (issues), describe the key results of the author’s research and his/her conclusions;
Manuscripts are to be submitted via e-mail: [email protected]
References References to other publications must be in Harvard style and carefully checked for completeness, accuracy and consistency.
Figures All figures should be of high quality, legible, and numbered consecutively with arabic numerals. All figures (charts, diagrams, line drawings, web pages/screenshots, and photographic images) should be submitted in electronic form preferably in color as separate files, that match the following parameters:Photo images – JPEG or TIFF format. Minimum resolution 300 dpi, image size not less than 1000x1000 pixCharts, diagrams, line drawings- EXCEL or EPS format
Headings Headings must be concise, with a clear indication of the distinction between the hierarchy of headings.
KeywordsPlease provide up to 10 keywords on the Article Title Page, which encapsulate the principal topics of the paper.
AbstractАn abstract should be: informative (no general words), original, relevant (reflects your paper’s key content and research findings); structured (follows the logics of the results presented in the paper), concise (between 250 and 300 words).
• Purpose (mandatory)• Design/methodology/approach (mandatory)• Findings (mandatory)• Research limitations/implications (if applicable)• Practical implications (if applicable)• Social implications (if applicable)• Originality/value (mandatory)
It is appropriate to describe the research methods/methodology if they are original or of interest for this particular research. For papers concerned with experimental work describe your data sources and data processing techniques.Describe your results as precisely and informatively as possible. Include your key theoretical and experimental results, factual information, and any interconnections and patterns shown. Give special priority in your abstract to new results and data with long-term impact, important discoveries and verified findings that contradict previous theories as well as data that you think have practical value.Conclusions could be associated with recommendations, estimates, suggestions, and hypotheses described in the paper.Information contained in the title should not be dublicated in the abstract . Try to avoid unnecessary introductory phrases (e.g. ‘the author of the paper considers…’).Use language typical of research and technical documents to compile your abstract and avoid complex grammatical constructions.The text of the abstract should include the key words of the paper.
Author Details (in English and native language) Details should be supplied on the Article Title Page, including:
• Full name of each author• Position, rank, academic degree• Affiliation of each author, at the time the research was completed• Full postal address of the affiliation• E-mail address of each author
Article Title To be submitted in native language and English. A title of not more than eight words should be provided.
Article Length Articles should be between 20000 and 60000 characters (incl. spaces). Optimal size is 40 000 characters.
Format All files should be submitted as a Word document.The text should be in Times New Roman 14 pt, 1.5 spaced and fit to the width, all margins should be 20 mm.

2016 Vol. 10 No 1 FORESIGHT AND STI GOVERNANCE 5
StrategiesStrategies
INNOVATION AND ECONOMY
Public Sector Supply Chain Management: A Triple Helix Approach to Aligning Innovative Environmental Initiatives
Azley Abd Razak, Martyn Rowling, Gareth White, Rachel Mason-Jones
43
Vol. 10 No 1 2016
CONTENTS
Foresight Applications to the Analysis of Global Value Chains
Tatyana Meshkova, Evgeny Moiseichev
69MASTER CLASS
STRATEGIES
Quadruple Innovation Helix and Smart Specialization: Knowledge Production and National Competitiveness
Elias Carayannis, Evangelos Grigoroudis
31
Approaches to the Formulation of Russia’s Technological Priorities
Alexey Ponomarev, Irina Dezhina
7
Internationalization of Product-Service Systems: Global, Regional or National Strategy?
Glenn Parry, Oscar Bustinza, Ferran Vendrell-Herrero, Nicholas O’Regan
16
Foreign Technology Transfer: An Assessment of Russia’s Economic Dependence on High-Tech Imports
Andrey Gnidchenko, Anastasia Mogilat, Olga Mikheeva, Vladimir Salnikov
53

6 FORESIGHT AND STI GOVERNANCE Vol. 10 No 1 2016
Strategies
STRATEGIES
2016 Vol. 10 No 1 FORESIGHT AND STI GOVERNANCE 7
Approaches to the Formulation of Russia’s Technological Priorities
Vice President for Strategy and Industry, Skoltech*; and Professor, Department of Educational Programmes, HSE ISSEK**. E-mail: [email protected]
Alexey Ponomarev
Abstract
The paper proposes a model for verifying ways to identify scientific-technological priorities in Russia and suggests instruments for their implementation
and adjustment. Our model for the identification of priorities is based on Russia’s socio-economic development goals, and takes into account the impact of different scientific and technological development scenarios on the implementation of models of socio-economic arrangement. Based on this logic, a group of technological priorities unchanged in face of the wider spectrum of national economic and social goals is suggested.
Global economic, social, and scientific-technological trends and their Russian projections are taken as exogenous
Keywords: S&T objectives; priorities; forecast; global trends; effects on the Russian economy; policy instruments
Citation: Dezhina I., Ponomarev A. (2016) Approaches to the Formulation of Russia’s Technological Priorities. Foresight and STI Governance, vol. 10, no 1, pp. 7–15. DOI: 10.17323/1995-459X.2016.1.7.15
factors for selecting technological priorities. The suggested approach is based on the assumption that a new system of priorities should ensure support for implementing strategic development goals and tasks in the medium- and long term, and aims to help define these goals and tasks more accurately.
As a result, the paper identifies two groups of priorities. The first group outlines the already institutionalized areas of technological development while the second group outlines fields for institutionalization in the near future. The proposed logic is illustrated through an analysis of five global trends and their applications in Russia, and we highlight which technologies will be driven by these global trends.
DOI: 10.17323/1995-459X.2016.1.7.15
Head of Research Group on Science and Industrial Policy, Skoltech. E-mail: [email protected] Dezhina
* Skoltech — Skolkovo Institute of Science and Technology. Address: Skolkovo Innovation Center, 3 Nobel Str., Moscow Region, 143026, Russian Federation** HSE ISSEK — Institute for Statistical Studies and Economics of Knowledge at the National Research University Higher School of Economics. Address: 11, Myasnitskaya str., Moscow, 101000, Russian Federation
2016 Vol. 10 No 1 FORESIGHT AND STI GOVERNANCE 7

8 FORESIGHT AND STI GOVERNANCE Vol. 10 No 1 2016
Strategies
1 Approved by the Government S&T Policy Commission on 21 July 1996, no 2727p-P8, no 2728p-P8.2 In particular documents such as the Concept of Long-term Socio-Economic Development of the Russian Federation for the Period up to the year 2020 (approved by Order no 1662-r of the Government of the Russian Federation dated 17 November 2008), the Strategy for Innovative Development of the Russian Federation 2020 (approved by Order no 2227-r of the Government of the Russian Federation dated 8 December 2011), and the National Security Strategy of the Russian Federation up to 2020 (approved by Decree no 537 of the President of the Russian Federation dated 12 May 2009).
The issue of target setting and selecting priority science and technology (S&T) areas has been actively discussed in Russia for more than twenty years. Since the first approved list of priority areas and corresponding critical technologies of 1996,1 the system of priorities at the national level has
only undergone minor modifications. On the one hand, this reflects an objective situation where the importance of the broadly defined S&T fields does not anticipate any rapid change. On the other hand, technological priorities within these areas have been extremely vague. Such a wide range of technologies is now classified as critical because it is impossible to effectively concentrate resources on individual technologies. Amid limited financial and human capital, the problem of identifying and structuring technological priorities is becoming ever more relevant. Another factor increasing the importance of rational selection is the changing foreign policy environment, which has an impact on opportunities and the ability to develop new technologies.This article looks to describe a possible approach to selecting, substantiating, and supporting technological development priority areas in Russia. This is based on the assumption that the priorities system should be geared towards pre-existing strategic goals and national development objectives in the long- and medium-term2 and should contribute to the refinement of these goals and objectives. From a methodological perspective, global socio-economic and S&T trends and the nature of their manifestation in the Russian context serve as input parameters, to be taken into account in the development of this system. The technological priorities thus formed are unchanged with respect to the broad spectrum of targeted socio-economic development models in the country.The paper is structured as follows. After defining the position of our approach among the numerous works on forecasting and selecting priority S&T areas, it examines the parameters underlying the selection of technological priorities. Existing and future groups of priorities are then described in terms of their influence on intra-Russian projections of global socio-economic development trends. The results of the analysis form the basis for a possible classification of Russian priorities, which considers two parameters: global market potential and the manner of developing new technologies (Russian developments or borrowing from foreign sources). The conclusion finally delineates potential instruments to implement S&T areas depending on their priority and suggests factors which could have an impact on the effectiveness of their use.
Forecasting and selecting S&T prioritiesThe problem of identifying and selecting priority S&T areas (critical technologies) and the associated ‘future projection’ (Foresight) has been studied for a long time by many researchers, continually looking to improve forecasting methods and expand the range of factors taken into account. We can date the emergence of this phenomenon back to the 1950s, when the RAND Corporation in the US developed the Delphi method to identify priority science and technology areas. Over the next two decades, Foresight studies were actively developed in four global centres: the US, Western Europe, Japan, and the USSR, and in the 1960s they started to improve the quantitative and qualitative methods used in technological Foresight studies. In the 1970s, Japan drafted its first national S&T Foresight based on methods developed in the US; following Japan’s experience, there was a spurt in mutual borrowings and adaptations of forecast and Foresight studies according to the specific characteristics of individual countries.One of the first theoretical works on technology Foresight is arguably the 1984 study conducted by the British researcher/sociologist Ben Martin and John Irvine, which was later refined conceptually to accommodate the notion of ‘technology Foresight’ [Martin, 2010]. Martin and Irvine formulated the principles of technology Foresight, including the need for close coordination between prospective areas of scientific research and the development of approaches to identify strategic priorities. In other words, we should not view scientific and technological development in isolation from the socio-economic context [Coates et al., 2001].An important aspect of identifying technological priorities is studying the mechanisms by which key technologies change (technological waves). Some of the best known among foreign specialists are works by Carlota Perez [Perez, 2002] and, in Russia, Sergey Glazev [Glazev, 1993], who has worked with his colleagues in this field for many years [Ivanov, 2015]. Scientific and technological development has been an important application of the socio-economic forecasting system, which was developed in the 1980s in the USSR and abroad [Bestuzhev-Lada, 1982].After S&T development forecasts for individual countries, comparative transnational forecast studies started to appear [Cuhls, Kuwahara, 1994]. Industry and corporate forecasts (Foresight studies) also started to gain popularity and undergo active development. It is worth noting that forecasts and Foresight studies are not equally popular in developed countries. For instance, in the US they are used predominantly to identify critical technologies [Wagner, Popper, 2003].
2016 Vol. 10 No 1 FORESIGHT AND STI GOVERNANCE 9
In recent years, substantial improvement has taken place in domestic forecast studies and in developing Foresight studies in Russia. Several theoretical works have been published [Gokhberg, 2014; Dynkin, 2011; Gaponenko, 2008], including some relating to specific sectors [Gokhberg, Filippov, 2014; Gaponenko, 2006]. Despite the successes achieved, no consensus has been reached as to how we should forecast future development as there is no one consolidated view regarding economic prospects. Much depends on the criteria initially stipulated, which, in turn, are defined by macro-factors, set in part by those who make strategic decisions at a specific moment in time.Forecasting takes place in paradigms of economic and political cycles. New demands can spring up at any time and criteria are updated as appropriate. Thus, at the present time, import substitution in Russia is of such importance when selecting technology priorities that it should not be excluded from future iterative procedures to identify and select priorities.
Methodological approaches to identifying prioritiesThe methods used to define scientific and technological priorities can be reduced to a sequence of several recognized steps. One — studying global development trends on a macro-level, in the socio-economic and foreign political spheres, in fields such as manufacturing, information dissemination and use, and so on; Two — formulating goals for the country in terms of socio-economic development indicators and foreign political and economic objectives; Three — constructing structural policy scenarios and selecting S&T priorities as components of these scenarios.Further assessments of available financial, human, and other forms of resources are then carried out for each of the structural policy scenarios and, based on these findings approaches to change in the research and development (R&D) sector are formulated. We note that a scientific development strategy proposing support of all fields of research without prioritization is not an option any longer despite renewed discussions from time to time about the need for extensive support for Russian theoretical studies [Smirnov, 2013].The current R&D structure in Russia highlights the fact that traditional scientific fields in Soviet times still dominate funding (physics, a number of engineering sciences), while support for medical and agricultural studies is still extremely modest [HSE, 2014, p. 107]. However, a variety of modern research areas are being implemented poorly in the engineering sciences. In particular, even in a dynamic field such as advanced production technologies, the competitiveness of research undertakings and certain Russian companies is low with localized achievements only in certain segments [Dezhina et al., 2015, p. 22]. The same can be said of photonics, where only laser research occupies a relatively strong position in Russia.We believe that a more up-to-date system of scientific and technological priorities requires the formation of scenarios in which — if only approximately — the views of representatives from the state, sciences and businesses could be coordinated in terms of the aims of and opportunities for the Russian economy and R&D sector. The scenarios need to make provisions to distribute limited resources for technological development. They need to take into account three key parameters: the chosen system of national goals in corresponding fields; global as well as Russian trends in the political, socio-economic spheres where there is a high degree of uncertainty; and analytical results of international and Russian experience in S&T development. These scenarios can only be built with certain assumptions regarding the dynamics of external factors that affect the S&T sphere.At the first stage, we need to identify those priorities, which do not change with respect to selecting development goals. The second stage involves a comparative assessment of the impact of resource distribution on the achievement of different groups of goals. The third stage consists of forming a complex variant of resource distribution for technological development in line with the system goals adopted by the relevant players. This paper will look at a possible algorithm for the first of the aforementioned stages.
Groups of current and prospective technological prioritiesSo far, Russia has adopted technological priorities, which can be conveniently categorized into three groups. The first is the already ‘institutionalized’ areas for technological development in the period up to 2020 and beyond. Here, one of the few guaranteed and accepted sources of funding is the defense and security sector, which expresses high demand for the development of certain technological areas. Aerospace and nuclear industries are two high-investment industries, which albeit limited in terms of commercial potential, fall into the same group. These are to a certain degree, derivatives of the national security sector.Another long-term (up to 2030) de facto strategy is maintaining the share in the oil market amid conflicting trends caused by the nature of consumption, energy saving initiatives, and the structure of corresponding markets. This is a programmed, rather than institutionalized, demand for domestic R&D and technology, which until recently was held back by the considerable supply of international oil-related services.Finally, foreign political objectives and corresponding technological priorities linked to strengthening Russia’s position in its own territories in the Far East and Arctic have also been set.
Ponomarev А., Dezhina I., pp. 7–15
10 FORESIGHT AND STI GOVERNANCE Vol. 10 No 1 2016
Strategies
The second group of priorities comprises areas planned for ‘institutionalization’ after 2015. The various policy documents and guaranteed funding identify pharmaceuticals, shipbuilding, and a number of other areas. However, in terms of the amount and effectiveness of support, it is still difficult to unambiguously categorize these priorities as institutionalized.Changes in external conditions, including existing economic sanctions, call for the following structural changes:• a fundamental expansion of the agricultural sector and food industry in order to satisfy the majority
of domestic demand for food, including drinking water;• import substitution of a significant proportion of end consumer goods — from light industry goods
to resources for the housing and utilities sector;• a qualitative improvement in the health care system and derivative pharmaceutical and medical
industries;• solutions to acute environmental problems in the most vulnerable regions and megalopolises.
With all the differences in the areas listed above, their development presents a demand for various technologies: ways to design and produce technological equipment and materials (to replace some of the imported next-generation equipment when expanding production), compact energy sources (to solve some environmental problems, for example, with transport), and a number of critical biotechnological developments, etc.
Global trends and their Russian projectionsContinuous forecast and Foresight studies [Gokhberg, 2014; Berger, 2013; Dynkin, 2011] make it possible to identify global trends affecting S&T development up to 2030. These include:
1. Regionalization of energy markets, expanding the use of alternative energy sources, improving energy saving methods while maintaining a significant share of hydrocarbons in global energy consumption, and a possible major change in the structure of hydrocarbon fuel supplied to the market;
2. Regionalization of goods production and reindustrialization of developed countries;3. Change in the demographic structure of developed countries amid ageing populations;4. Growing financial and intellectual stratification and the formation of new stable social strata;5. New stage of digitalization in the social and economic spheres.
With reference to technological development, these trends require optimal environmental conditions to be maintained (including from the perspective of virology), as well as food security, balanced composition, number and geographical distribution of the population (including an understanding of rational employment), and localization and customization of production. Russian projects for each of these trends have their own specific features.
EnergyIn the energy sector, a contraction in the hydrocarbon markets in the 2015–2018 period, extreme oil price volatility, a reduction in gas prices and an overall fall in energy resource trading margins is forecasted. From a macroeconomic perspective, this will help maintain relatively low ruble exchange rates. Due to the exhaustion of accessible deposits in Russia and the increasing dependence on imported extraction technologies and equipment, foreign currency revenue will suffer a significant decline.As a result, the Russian oil extraction industry will show long-term demand — at least until 2030 — for oil extraction technology and equipment for tight deposits. In view of the price instability and critical value of rational extraction margins to the budget, this demand should be for next-generation technologies allowing for the required level of profitability. The sanctions are making it more difficult to access foreign technologies of this type, and the fall in the rouble exchange rate is undermining the economic efficiency of the industry. As a result, we can expect a rise in demand for domestic extraction technologies the development of which will require predominantly theoretical research in specialized disciplines (geophysics, geochemistry, hydrodynamics, combustion physics, etc.) and the development of improvement technologies in materials engineering and general engineering.According to experts, the trend of regionalizing energy markets will bring about demand for new technologies in South East Asia, including in China. With Russia’s successes in corresponding research and technologies, it can be expected to compete with global oil services companies on these markets. Another favourable factor is the growing independence of the Chinese economy from the US. As such, in the medium-term the formation of a development programme for oil services and oil production engineering industries is very possible, including coordinated research (2015–2020) and the subsequent development of corresponding areas in 2020–2030.A similar programme relating to hydrocarbon supplies is possible if the demand for new technologies from domestic extraction and oil services companies is realized and if there are calls for research institutions
2016 Vol. 10 No 1 FORESIGHT AND STI GOVERNANCE 11
(prospecting and extraction), as well as for engineering companies (equipment production). Ultimately, demand for R&D into technologies, equipment, and materials is important. Since there are few domestic developments in this sphere, active borrowing from global experience is needed for future development, especially in the period 2015–2020, as well as a roll-out of corresponding engineering projects in 2017–2025.
Localization of production and reindustrializationDeveloped industrial countries are rolling out programmes to maintain or increase existing goods production. This process runs counter to the trends at the end of the 1980s when production was being moved to countries with cheaper labour [Dezhina, Ponomarev, 2014] and the ‘stripped back growth’ of whole regions of developed countries. External factors causing this trend include:• the easier diffusion of technologies in the new digital space and the difficulty of monopolizing
intellectual income from the use of such technologies (US, Europe);• a path towards political and economic autonomy from former powers (China);• the increased role of small and medium businesses as drivers of technological progress in the value
added chain.The scientific and technological basis for this trend is the accelerating development of key elements of modern production technologies using not only ‘improvements’, but also breakthrough developments that are based on dynamic research in modelling, optimization, big data analysis, nanotechnology, and materials engineering.A key aspect of social and political demand for new production technologies in Russia and globally is linked to the possibility of decentralizing improvements to these technologies outside of hyper-industrialized regions, which allows employment problems to be solved and local economies to improve. This trend takes on particular importance in Russia due to the low level of mobility caused both by the economic and cultural climate. The transition to technologies allowing for the efficient customization of goods is giving rise to demand for applied research, as well as a broad spectrum of basic R&D for creating new materials and improving engineering design models. Advanced production technologies respond to an extremely broad array of challenges — from the stratification of society to the digitalization of socio-economic spheres.In the Russian economy, the demand for R&D in new production technologies is in turn driving engineering, including engineering geared towards the production of equipment for commodity industries. However, corresponding technological priorities can only be formulated by looking for common ground in the requirements of a wide range of major customers, including the oil and gas sector, space and nuclear industries, and the regional and local industries that rely on small and medium businesses.Priorities can be implemented through a system of projects. These projects create demand for:• in the medium term — for initial orders from engineering for the oil and gas industry (and power
engineering in general) and the aerospace and nuclear industries;• supply (willingness to engage in development and production) predominantly from medium-
sized companies and consortiums of potential equipment producers and a wide range of small and medium materials producers.
Taking into account the disparate nature of corporate and state investment in advanced production technologies in developed countries and the opportunities for the Russian economy, a niche may be created by a number of measures specific to Russia. Primarily this involves stimulating in-depth, ‘non-competitive’, long-term cooperation between potential producers and ‘initial customers’. Such cooperation can take place through vertical consortiums of major players, which may be the end-consumers of new technologies, potential developers and producers of technologies and materials, or research structures. A key role can also be played by the support offered for cooperation with ‘initial customers’ to develop the very best universal technological specifications for the products of potential suppliers of technologies, equipment, and materials. This makes it possible to establish a relatively large initial portfolio of orders and to concentrate small-scale initial resources on developing new products.The specific form of cooperation might be between, for instance, companies in the space, nuclear and engineering industries agreeing to a set of specifications on new domestic CAD, CAE, and CAM blocks. Ultimately, we should not disregard approaches such as ‘re-engineering’ which looks to make maximum use of legal (licensed) copying and borrowing of technologies, followed by subsequent localization and redevelopment. This approach requires the concentration of various types of resources in multi-disciplinary centres where there is a high level of scientific potential and a profile, which are willing and motivated to engage in significant medium-term adjustments.
Demographic changesThe change in the size and structure of Russia’s population has manifested itself amid slight growth in the duration of the population’s working life and a delay among youth in entering the labour market. Growth
Ponomarev А., Dezhina I., pp. 7–15
12 FORESIGHT AND STI GOVERNANCE Vol. 10 No 1 2016
Strategies
in the birth rate in the last decade has predetermined the labour dynamics in Russia for the period up to 2030. Those industries of the economy showing demand for low-qualified workers have until recently absorbed predominantly migrants, following partial naturalization. It is difficult to predict the short-term development of trends such as the changing structure of employment and motivations, migrant flows, quality of life and workforce distribution, formal and concealed unemployment, labour supply and demand in regions, and structural imbalances in personnel training.At the same time, there is a clear trend of an ageing population, which is increasing demand for employment in line with age peculiarities and for specific goods and services. Particular demands are being made on the health care system to support the activity of the elderly. Modern biomedical research, which needs far more investment than the Russian R&D sector, does not offer any hope of competitive Russian methods and procedures emerging in the medium term. In this time frame, the Russian health care sector needs to borrow the latest methods and solutions, rather than relying on local breakthroughs. Around the world, advanced biomedical research is now conducted on neurotechnologies and genetics. It is reflected in some of the largest foreign projects of recent years, funded by both civilian and military sources. In Russia, however, extremely modest sums are channelled into areas that will be key in overcoming the demographic and migration problems facing the country.This trend is stimulating the development of several areas in which Russia has certain initial resources and qualities. These include:• digital technologies to expand virtual interaction and carry out a broad spectrum of household tasks
for individuals with limited physical capabilities;• advanced manufacturing technologies calling for part-time and remote working;• biomedical technologies for health care purposes;• agricultural technologies, the importance of which will increase as the employment structure in
Russia changes and demands increase regarding food quality.Thus, demographic trends create demand primarily for certain types of advanced biomedical, advanced production, and digital technologies.
Stratification of the population and new stratification
The Russian projection of this trend manifests in the growing monopolization of the economy, worsening business conditions for SMEs, and deepening pay gap between high and low earners at major companies. Intra-country differentiation is growing and economic growth prospects in many regions remain hazy.The digital industry could provide a response to these challenges in part by creating the necessary conditions to earn through digital networks. The development of digital technologies is leading to the emergence of next-generation hardware, including optoelectronics and quantum data processing. At the same time, there is growing demand for advanced manufacturing technologies as one of the mechanisms to offset regional imbalances, which helps distribute employment and create jobs with low investment barriers.
Digitalization of society and the economyThis trend is widely discussed in the international and Russian professional sphere as well as in many social organizations. A whole series of forecasts have been prepared in this sphere [Naional Research Council, 1998; Lane, Kalil, 2005; National Photonics Initiative, 2013] with a particular focus on photonics and new production technologies.Overall, Russia is following the trend’s global trajectory, but with some slight differences. These primarily concern the low market volumes, modest expertise in hardware and devices, and the lack of major software developments. The professional community recognizes the productivity of concentrating efforts in certain mainstream areas in this field to create globally competitive and compatible modules and components. All of this helps to stimulate R&D in self-learning systems (next-generation artificial intelligence), hardware (in particular, optoelectronic devices and devices based on new quantum materials), data analysis, and the development of virtual environments.
Formation of a Russian system of technological prioritiesTo identify those technologies that could be justifiably developed from the perspective of the goals and objectives in national structural policy and Russian projections of global socio-economic trends, we need to start by examining existing technological priority systems. Global experience in identifying priority S&T areas shows that they are similar in many countries, despite their different levels of industrial development. As a rule, these priorities include:• biotechnology;• next-generation information technologies;

2016 Vol. 10 No 1 FORESIGHT AND STI GOVERNANCE 13
• energy and energy saving technologies;• new materials.
For Russia, this traditional list is confined to certain niches in mainstream global priorities where breaking into the international scene and achieving global competitiveness is possible, but where the research base is lacking amid growing demand from several sectors that are critical to national goals. The priorities identified in this way can be broken down further to technological areas of the following types:• those with potential for independent development (limited number of areas);• those operating through ‘borrowing and development’;• those which are subsidiary to the development of various sectors of the Russian economy, which are
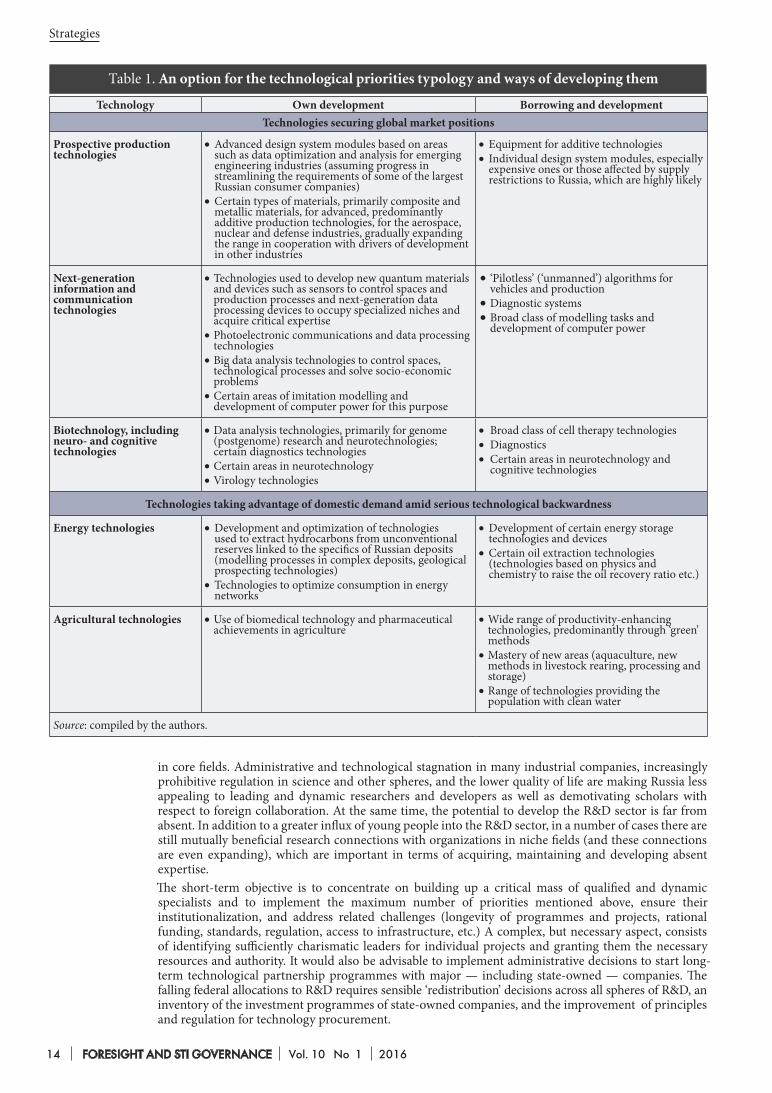
dependent on searching for, locating and, where necessary, adapting foreign technologies.We propose classifying the analyzed technologies analysed in a global context according to two parameters: the level (areas with global market potential, or taking advantage of demand but technologically backward) and methods of development (domestic or borrowed developments). A possible structure of technological priorities is given in Table 1. Advanced production, information and communication, and biotechnologies are classified as potentially competitive technologies on global markets. The second group of priority technologies includes energy and agricultural technologies, demand for which comes from the relevant sectors even when there is significant backwardness in the sector. In all of these the ‘new materials’ factor is present, which is hard to view separately in view of the diversity of subjects that it covers. The connection between materials engineering and other areas in this structure appears to be more rational.
Instruments and opportunities to implement new Russian prioritiesRussia and the rest of the world have now amassed an abundant toolkit to implement priority S&T areas. In order to identify the most effective instruments, we propose identifying S&T priorities, which have been coordinated with structural priorities for economic development. We must also identify the priorities, which have not yet been recognized as breakthrough areas where retention of technological receptiveness and ensuring a certain level of competence are important. In the latter case, resources need to be invested to develop expertise that could be in demand in the next 10–15 years when defining new technological areas of structural priorities.For S&T priorities coordinated with structural and economic priorities, instruments to support companies, which establish fruitful long-term cooperation (consortiums) to implement key programmes on a national scale are the most effective. Through these initiatives, the following practical measures may be adopted:• raising initial orders from key Russian companies for globally competitive next-generation
technologies;• setting up consortiums on a private or public-private basis to develop such technologies;• developing and implementing a coordinated research programme focused on these developments.
The main elements of development and implementing this type of initiatives might be:• preparing detailed analytical reports on the state and development of areas, coordinating them with
key companies (potential producers and consumers) and arranging expert assessments by leading global specialists;
• setting up scientific and technological councils as ‘collective general designers’ and having them prepare coordinated interdepartmental R&D programmes;
• setting up consortiums and coordinating technological objectives and work plans between them and potential customers;
• raising initial orders from groups of core consumer companies;• making changes to state programmes;• developing (where required) additional mechanisms – legislative, normative, administrative – to
stimulate work through initiatives.Technological receptiveness requires a different approach based on an analysis of mainstream areas in the global S&T landscape by international experts and consultants based in Russian research institutions and which would include the reorientation of connected work and the formation of new research groups. This needs to be then followed with the development of mechanisms to reorient these groups to new areas, including instruments to change their financing, attract foreign partners, and support academic mobility. A system of information sharing with industry and stimulating small innovative businesses are other important elements of technological receptiveness.Finally, the human factor has to be taken into account. Selecting and implementing all types of priorities involves overcoming low motivation among the directors of all types of companies, authorities, and a significant number of scientific and technological organizations to engage in responsible forward planning
Ponomarev А., Dezhina I., pp. 7–15
14 FORESIGHT AND STI GOVERNANCE Vol. 10 No 1 2016
Strategies
Table 1. An option for the technological priorities typology and ways of developing them
in core fields. Administrative and technological stagnation in many industrial companies, increasingly prohibitive regulation in science and other spheres, and the lower quality of life are making Russia less appealing to leading and dynamic researchers and developers as well as demotivating scholars with respect to foreign collaboration. At the same time, the potential to develop the R&D sector is far from absent. In addition to a greater influx of young people into the R&D sector, in a number of cases there are still mutually beneficial research connections with organizations in niche fields (and these connections are even expanding), which are important in terms of acquiring, maintaining and developing absent expertise.The short-term objective is to concentrate on building up a critical mass of qualified and dynamic specialists and to implement the maximum number of priorities mentioned above, ensure their institutionalization, and address related challenges (longevity of programmes and projects, rational funding, standards, regulation, access to infrastructure, etc.) A complex, but necessary aspect, consists of identifying sufficiently charismatic leaders for individual projects and granting them the necessary resources and authority. It would also be advisable to implement administrative decisions to start long-term technological partnership programmes with major — including state-owned — companies. The falling federal allocations to R&D requires sensible ‘redistribution’ decisions across all spheres of R&D, an inventory of the investment programmes of state-owned companies, and the improvement of principles and regulation for technology procurement.
Technology Own development Borrowing and developmentTechnologies securing global market positions
Prospective production technologies
•Advanced design system modules based on areas such as data optimization and analysis for emerging engineering industries (assuming progress in streamlining the requirements of some of the largest Russian consumer companies)
•Certain types of materials, primarily composite and metallic materials, for advanced, predominantly additive production technologies, for the aerospace, nuclear and defense industries, gradually expanding the range in cooperation with drivers of development in other industries
•Equipment for additive technologies•Individual design system modules, especially
expensive ones or those affected by supply restrictions to Russia, which are highly likely
Next-generation information and communication technologies
•Technologies used to develop new quantum materials and devices such as sensors to control spaces and production processes and next-generation data processing devices to occupy specialized niches and acquire critical expertise
•Photoelectronic communications and data processing technologies
•Big data analysis technologies to control spaces, technological processes and solve socio-economic problems
•Certain areas of imitation modelling and development of computer power for this purpose
•‘Pilotless’ (‘unmanned’) algorithms for vehicles and production
•Diagnostic systems•Broad class of modelling tasks and
development of computer power
Biotechnology, including neuro- and cognitive technologies
•Data analysis technologies, primarily for genome (postgenome) research and neurotechnologies; certain diagnostics technologies
•Certain areas in neurotechnology•Virology technologies
• Broad class of cell therapy technologies•Diagnostics•Certain areas in neurotechnology and
cognitive technologies
Technologies taking advantage of domestic demand amid serious technological backwardness
Energy technologies •Development and optimization of technologies used to extract hydrocarbons from unconventional reserves linked to the specifics of Russian deposits (modelling processes in complex deposits, geological prospecting technologies)
•Technologies to optimize consumption in energy networks
•Development of certain energy storage technologies and devices
•Certain oil extraction technologies (technologies based on physics and chemistry to raise the oil recovery ratio etc.)
Agricultural technologies •Use of biomedical technology and pharmaceutical achievements in agriculture
•Wide range of productivity-enhancing technologies, predominantly through ‘green’ methods
•Mastery of new areas (aquaculture, new methods in livestock rearing, processing and storage)
•Range of technologies providing the population with clean water
Source: compiled by the authors.
2016 Vol. 10 No 1 FORESIGHT AND STI GOVERNANCE 15
ConclusionsThe methodical approaches presented in this paper help us to identify technological trends which are worth developing in view of the challenges faced in fields such as energy and energy saving, the geographical distribution of goods production, demographic structure and the ageing population, financial and intellectual stratification, and the digitalization of socio-economic spheres. The technological priorities that were examined, however, do not change according to the different possible socio-economic structure models in the country.Among the technological priorities offering responses to these challenges are next-generation information and communication technologies, advanced production technologies, and bio-, neuro-, cognitive, energy and agricultural technologies. Each of these spheres is broken down into narrower fields; the latter can be developed either through domestic R&D or the borrowing of technologies.The selection of policy instruments depends on whether the identified field is an institutionalized priority area or an area requiring support to maintain its technological receptiveness. Among the measures of particular importance, it is worth noting financial, organizational and regulatory measures, as well as more delicate instruments that motivate actors to develop and use domestic technologies.The assumptions, approaches, and assessments made do not claim to be comprehensive. This paper has presented a model and an arguably credible approach towards identifying technological priorities as well as possible mechanisms to adjust and implement the latter.
Berger S. (2013) Making in America. From innovation to market, Cambridge, MA: MIT Press.Bestuzhev-Lada I. (1982) Rabochaya kniga po prognozirovaniyu [Working book on forecasting]. Moscow: Mysl’
(in Russian).Coates V., Farooque M., Klavans R., Lapid K., Linstone H.A., Pistorius C., Porter A.L. (2012) On the Future of
Technological Forecasting. Technological Forecasting and Social Change, vol. 67, no 1, pp. 1–17.Cuhls K., Kuwahara T. (1994) Outlook for Japanese and German Future Technology, Comparing Technology Forecast
Surveys, Heidelberg: Physica-Verlag.Dezhina I., Ponomarev A. (2014) Perspektivnye proizvodstvennye tekhnologii: novye aktsenty v razvitii
promyshlennosti [Advanced Manufacturing: New Emphasis in Industrial Development]. Foresight-Russia, vol. 8, no 2, pp. 16–29.
Dezhina I., Ponomarev A., Frolov A. (2015) Perspektivnye proizvodstvennye tekhnologii v Rossii: kontury novoi politiki [Advanced Manufacturing Technologies in Russia: Outlines of a New Policy]. Foresight-Russia, vol. 9, no 1, pp. 20–31.
Dynkin A. (ed.) (2011) Strategicheskii global’nyi prognoz 2030. Rasshirennyi variant [Strategic global forecast 2030. Expanded version], Мoscow: Magistr (in Russian).
Gaponenko N. (2008) Forsait: teoriya, metodologiya, opyt [Foresight: theory, methodology, experience], Мoscow: YUNITI-DANA (in Russian).
Gaponenko N. (ed.) (2006) Nanotekhnologii: Forsait [Nanotechnologies: Foresight], Мoscow: Sovremennaya economika i pravo (in Russian).
Glazyev S. (1993) Teoriya dolgosrochnogo tekhniko-ekonomicheskogo razvitiya [Theory of the long-term technical-economic development], Мoscow: Vladar (in Russian).
Gokhberg L. (ed.) (2014) Prognoz nauchno-tekhnologicheskogo razvitiya Rossii: 2030 [Russian S&T Foresight 2030] (ed. L. Gokhberg), Мoscow: RF Ministry of Education and Science, NRU Higher School of Economics (in Russian).
Gokhberg L., Filippov L. (eds.) (2014) Prognoz nauchno-tekhnologicheskogo razvitiya Rossii: 2030. Energoeffektivnost’ i energosberezhenie [Forecast of scientific-technological development of Russia: 2030. Energy efficiency and energy saving], Мoscow: RF Ministry of Education and Science, NRU Higher School of Economics (in Russian).
HSE (2014) Indikatory nauki: 2014. Statisticheskii sbornik [Science and Technology Indicators in the Russian Federation: 2014. Data Book], Moscow: HSE (in Russian).
Irvine J.M., Martin B.R. (1984) Foresight in Science: Picking the Winners, London: Pinter.Ivanov V. Innovatsionnaya paradigma XXI [Innovation paradigm XXI], Мoscow: Nauka (in Russian).Lane N., Kalil T. (2005) The National Nanotechnology Initiative: Present at the Creation. Issues in Science and
Technology, Summer 2005, pp.49–55.Martin B.R. (2010) The Origins of the Concept of ‘Foresight’ in Science and Technology: An Insider’s Perspective.
Technological Forecasting and Social Change, vol. 77, no 9, pp.1438–1447. National Photonics Initiative (2013) Lighting the Path to a Competitive Secure Future. Available at: http://spie.org/
Documents/AboutSPIE/NPI_Launch_Slides_23_May_2013.pdf, accessed 24.06.2014.National Research Council (1998) Harnessing Light: Optical Science and Engineering for the 21st Century, Washington,
D.C.: National Academy Press.Perez С. (2002) Technological Revolutions and Financial Capital: The Dynamics of Bubbles and Golden Ages, London:
Edward Elgar.Smirnov S. (2013) Kakaya nauka nam nuzhna: mnenie akademikov [Which science we need: Opinion of
academicians]. Nauka i Zhizn’, 09.04.2013. Available at: http://www.nkj.ru/news/21988/, accessed 24.06.2015 (in Russian).
Wagner C., Popper S. (2003) Identifying critical technologies in the United States: A review of the federal effort. Journal of Forecasting, no 22 (2/3), pp. 113–128.
References
Ponomarev А., Dezhina I., pp. 7–15

16 FORESIGHT AND STI GOVERNANCE Vol. 10 No 1 2016
Strategies
16 FORESIGHT AND STI GOVERNANCE Vol. 10 No 1 2016
Innovation and Economy
Internationalization of Product-Service Systems: Global, Regional or National Strategy?
Glenn Parry
Abstract
Highly dynamic market environment, knowledge creation and technology advancement demands that producers/providers need to be more
efficient and effective in meeting existing and future consumer needs and expectations. In this regard, companies strive, as deeply as possible, to diversify a range of proposed products as well as strategies for their commercialisation.
Using the case of music industry, this paper explores the validity of national, regional or global strategies in the provision of a product service system. The authors surveyed over 70,000 respondents from fifteen geographically spread countries which account for more than 85% of the
Citation: Parry G., Bustinza O., Vendrell-Herrero F., O’Regan N. (2016) Internationalization of Product-Service Systems: Global, Regional or National Strategy? Foresight and STI Governance, vol. 10, no 1, pp. 16–29. DOI: 10.17323/1995-459x.2016.1.16.29
global revenues of the industry. The analysis of the survey results identified a homogeneous group of so-called Out of Touch consumers characterized by their attitude: they are interested in and have money for, but no-longer purchase music. The authors attempt to ascertain if and how re-engaging the group in music purchase would achieve a significant sales increase. The analysis explores how potential consumers might respond to, or are able to be influenced by, value offerings in fifteen different countries.
Findings suggest that firms may employ global strategies for supply of products and services, but regional strategies are required to define the appropriate bundles to re-engage Out of Touch consumers.
DOI: 10.17323/1995-459x.2016.1.16.29
Keywords: globalisation; regionalisation; internationalization; product services bundles; relationships value propositions; music industry
Associate Professor, Bristol Business School, University of the West of England, UK. Address: BS16 1QY Bristol, United Kingdom. E-mail: [email protected]
Oscar BustinzaAssociate Professor, Universidad de Granada, Spain. Address: 18071 Granada, Spain. E-mail: [email protected]
Ferran Vendrell-HerreroLecturer, University of Birmingham, UK. Address: B15 2TT Birmingham, United Kingdom.
E-mail: [email protected]
Nicholas O’ReganProfessor, Bristol Business School. E-mail: Nicholas.O’[email protected]
2016 Vol. 10 No 1 FORESIGHT AND STI GOVERNANCE 17
Parry G. et al., pp. 16–29
The ever-changing and highly dynamic market environment demands that producers/providers be more efficient and effective in meeting existing and future consumer needs and expectations [O’Regan, 2012]. In addition, the creation of new knowledge and technologies has re-enforced
differentiation for some firms [Neu, Brown, 2005]. To address such challenges, firms need to explore ways to achieve, retain, or regain competitive advantage. The exploitation of business opportunities often requires new business models that create value for both the company and consumer [Breunig et al., 2013]. Consumer input to product and service development has been likened to an ‘arms-length research team’ [Berthon et al., 2007]. Consumers are now more engaged as value co-creators with provider firms and so value is created together with engaged consumers [Chandra, Coviello, 2010]. To ensure competitive advantage underpinned by differentiation, products should ideally be co-created with partners and emphasis should be placed on the value perceived by the consumer [Vargo, Lusch, 2008]. Lusch et al. include the wider stakeholder community in the co-creation of value with the consumer [Lusch et al., 2010]. It is clear that consumers are becoming more dynamic and less willing to passively accept what is available in the marketplace [Kucuk, Krishnamurthy, 2007]. Consumers whose demands are unmet by firms may seek to fill the niche in the marketplace through co-creating suitable alternative offerings [Berthon et al., 2007, p. 40].Firms are becoming increasingly international and it is challenging to achieve competitive advantage through co-creation of value with globally diverse consumers [Rugman, 2009]. Despite claims that business now operates on a global basis, most companies operate on a regional or multi-domestic basis [Briscoe et al., 2009]. Previous research and existing frameworks for international business have built from a traditional strategy based on ‘the vertical integration of supply and production activities to control the cost, disciplined research to create superior products; and a dominant market position to provide economies of scale’ [Wise, Baumgartner, 1999, p. 134]. This ‘upstream’ approach is supplier-centric and does not address the importance of downstream consumer activities. Consumer activity can be used to expand the value chain by ‘shifting to customer allegiance’: and changes the role of the consumer who, as a result of internet technology, can become actively engaged in shaping and assessing a firm’s products [Rugman, Verbeke, 2003]. This paper explores the validity of global, regional,1 and country specific strategies with regards to the downstream consumer facing activity of a Global Multi National Enterprise (MNE). Global MNEs provide the corporate strategy and organizational structure for their regional subsidiaries, which tend to be largely homogeneous at the global level [Djelic, Quack, 2003]. With the changing role of the consumer, it is relevant to analyze whether such homogeneity meets the needs and requirements of consumers. We explore this using a dataset created by an international MNE and capturing consumer preferences and purchasing attitudes from 15 countries from the broad triad regions of Japan, Western Europe, and North America. This paper examines propositions contingent with strategy at the geographical level of analysis: global, region, or country specific. Our focus is placed upon a single consumer group whose attitude towards the purchase of goods may be described as Out of Touch. This important group embodies potential consumers who have the means and resources to make purchases but who have not done so recently. They represent a significant potential market, ranging from 8% in Sweden, to 10% in the USA, 25% in India, and up to 33% in the Netherlands. Re-engaging these consumers would significantly increase revenues for the industry. The analysis explores how potential consumers might respond to, or are able to be influenced by, value offerings in 15 different countries. This sheds light on whether the strategy for re-engagement of consumers is a matter of global, regional, or national strategy implementation.
Theoretical frameworkChoosing scale of internationalization strategiesFrom a firm perspective, the Uppsala School [Johanson, Vahlne, 1977] presents international expansion as a sequential process. Growth extends from the country to regions, with increasing geographical distance from the home base presented as a proxy for increasing risk [Kogut, Singh, 1988]. More recently, the Uppsala School has added a networking perspective, which purports that firms, as well as their suppliers and consumers, are in a network that is beneficial to each in terms of knowledge exchange and commitment [Johanson, Vahlne, 1997]. The challenge of setting strategy at global or regional level results from the internationalization of a national firm. Internationalization provides the opportunity for firms to gain revenue in many markets [Kafouros et al., 2008], which in turn provides an opportunity for growth and value capture. International market diversification is attractive for MNEs as it provides a means to gain more stable revenues than would be received by a similar sized domestic firm [Rugman, 2009]. It is argued that growth from internationalization involves the transfer of resources across national borders, where country selection and entry mode choice are the key strategic decisions [Madhok, 1997].
1 Hereinafter, a region referred as a group of neighboring countries belonging to a certain geographical region (Ed.).
18 FORESIGHT AND STI GOVERNANCE Vol. 10 No 1 2016
Strategies
Academics continue to explore whether an internationalized business is necessarily a truly global, multi-national business, or if the construct more accurately relates to regional and multi-local business activities [Schmid, Kotulla, 2011]. Yip [Yip, 2003] proposes that a firm must set a clear global strategy before determining their regional and national strategies. This assumes that a hierarchy in decision making exists, which could arguably not give sufficient recognition to the consumer as a resource/asset for the firm as part of the strategic value creation process [DeSarbo et al., 2001; Vargo, Lusch, 2004]. Global strategy assumes that global strategic intent can dictate regional and national strategic actions, a sequence Rugman and Verbeke [Rugman, Verbeke, 2003] suggest is unlikely to occur. Rugman’s work suggests that MNEs are, in practice, operating regionalized strategies [Rugman, Oh, 2008]. Others propose a strategic model that includes national, regional, and global levels, each distinct but inter-related [Ghemawat, 2005]. In all cases, firms are challenged with finding an optimum strategy between the adoption of a global standard of leading practice and adaptation to national or regional difference, thus balancing globalization, regionalization, and multi-national activities [Ghoshal, Westney, 1993; Husted, Allen, 2006]. In all cases, data analysis at the country-level is required to produce evidence to support regional or global claims [Dunning et al., 2007]. It is proposed that the transfer of standard practice requires that homogeneous market conditions exist across national boundaries, including regulations, custom, tradition, and consumer characteristics [Katsikeas et al., 2006]. Such interaction is assumed to bring a convergence across cultural, political, and economic life [Giddens, 2011]. The transfer of global resources and practice leads to a phenomena where there is an attempt to standardize and subjugate the local [Ritzer, 2003], creating a dialectic between global and national [Hargrave et al., 2009]. Whilst goods, services, and people have significant freedom of movement across the world, a transition towards homogeneity between multiple nations is contested [Robertson, Khondker, 1998]. Management approaches and technologies may be globally convergent, but the context of MNE operations is derived from national cultures [De Jong et al., 2011]. Any global initiatives necessarily require regional teams that both understand their regional operating context to implement them effectively [Ghemawat, 2005] and the local consumer market, such that the value proposition can be clearly designed and communicated [DeSarbo et al., 2001] since contextual differences between markets may lead to significantly different outcomes [Evans et al., 2008]. This has been described as globalization [Ritzer, 2003], where global and national interpenetrate, creating heterogeneity rather than homogeneity [Pieterse, 2009].
Music industry contextMost of the content of the music industry has international appeal [IFPI, 2011] and historically consumers have been known to share a range of similar preferences all over the world. However, strategies to approach or interact with consumers could be substantially different at the national level. For example, Bakker [Bakker, 2006] — in an exhaustive review of the evolution of the multinational business in the music industry during the second half of the 20th century — argues that MNEs extracted the maximum profits by transferring their property rights catalogue to national subsidiaries or intermediaries, who understand better the nature of national markets. The existence of local subsidiaries with property rights provides evidence that the MNEs were employing local consumer strategies during the later 20th century, before revenues started to decrease due to the digitization of music. This work questions whether technological change, driven by internet adoption, may have modified the optimal strategy.Whilst the concept of globalization has no agreed single definition, in the music industry it is viewed as a homogenizing force affecting all aspects of the industry [Ho, 2003]. Academic discussion on the nature of music content that globalization is linked to necessarily includes a discussion about the globalization of the music industry [Stokes, 2004]. Globalization has been linked to the creation of music as a commoditized disposable item; part of a move towards a homogenized global culture [Feld, 2001]. However, despite the global success of some artists, studies have shown that consumers retain a bias towards domestic music [Ferreira, Waldfogel, 2010]. The internet has made music available to a global audience, with online sites disseminating and providing access to mainstream as well as niche music [Brynjolfsson et al., 2006]. The internet provides firms with global reach and coherence for a business operating along the lines of a global strategy [Yip, 2003]. Offering music via the internet makes it easier for firms to provide a globally standard offer. Standard value propositions that deliver music content to customers via web platforms can be created that can serve the global customer base. A standard global consumer facing offer means that the unseen ‘back-office’ functions of the business can be rationalized and where regional differences are required, these points of difference may be more easily coordinated. Global headquarters manage the transfer of innovations [Dellestrand, 2011] and provide support to a network of national and regional operational and marketing functions. Restructuring value chains is seldom limited to geographic boundaries, instead it often transgresses national borders [Bustinza et al., 2013a]. Supply chain data on different artist’s sales on particular platforms from across multiple countries is often quoted, such as the global number of YouTube views, demonstrating that some global standardization is already happening. There are financial incentives for standardization as product standardization leads to efficient financial performance [Ballard et al., 2009]. International revenue growth is important as there is a clear

2016 Vol. 10 No 1 FORESIGHT AND STI GOVERNANCE 19
correlation between digitalization (i.e. broadband, file sharing services) and revenue decline in the music industry, principally due to a decrease in physical sales [IFPI, 2011]. Many intermediary operations and associated firms have been removed from the music supply chain as digital music formats are traded online, replacing traditional physical sales with online service products [Graham et al., 2004]. Music firms who previously made their money from physical format sales, such as CD and vinyl, are now seeking additional value and revenue through online digital music services in a process that has been described as the ‘servitization of the music industry’ [Parry et al., 2012; Vandemerwe, Rada, 1988]. Although a body of research has analyzed upstream supply chain management, far less is to be found with a focus on the downstream value chain management of sales channels, where consumers are engaged and service-based advantages are available [Singer, Donoso, 2008; Wise, Baumgartner, 1999]. Downstream, the global music market is constructed to target the most profitable categories of recorded music [Negus, 1999]. Music industry MNEs retain national marketing and operation functions in all their major country markets, such that the consumer end of the value chain- the point of exchange and use of the product [O’Cass, Ngo, 2011] — may be less amenable to integration into global models [Bustinza et al., 2013b]. However, superior performance may be achieved by creating unique value offerings from a global standard portfolio tailored to a local/regional context [Ngo, O’Cass, 2009]. As music moves towards more service-oriented models of delivery, music distributors are exploring suitable international alliances with exclusive platform producers. The goal is to create value propositions that allow distributors to gain market position and revenues while regaining a degree of control in the value chain [Swatman et al., 2006]. Internationalization of the music industry exposes the content to a larger audience as well as helps return investments made in developing and marketing music technologies [Hitt et al., 1994]. Empirical evidence show the performance of manufacturing firms begins to decrease after a certain level of international expansion because managing complex international operations proves costly. However, multinational service firms are likely to perform differently, with studies suggesting that high levels of international diversity tend to increase service firm performance [Contractor et al., 2007]. This may imply that a multinational — if not truly global [Rugman, Oh, 2008] — or regional strategy may work for service firms.
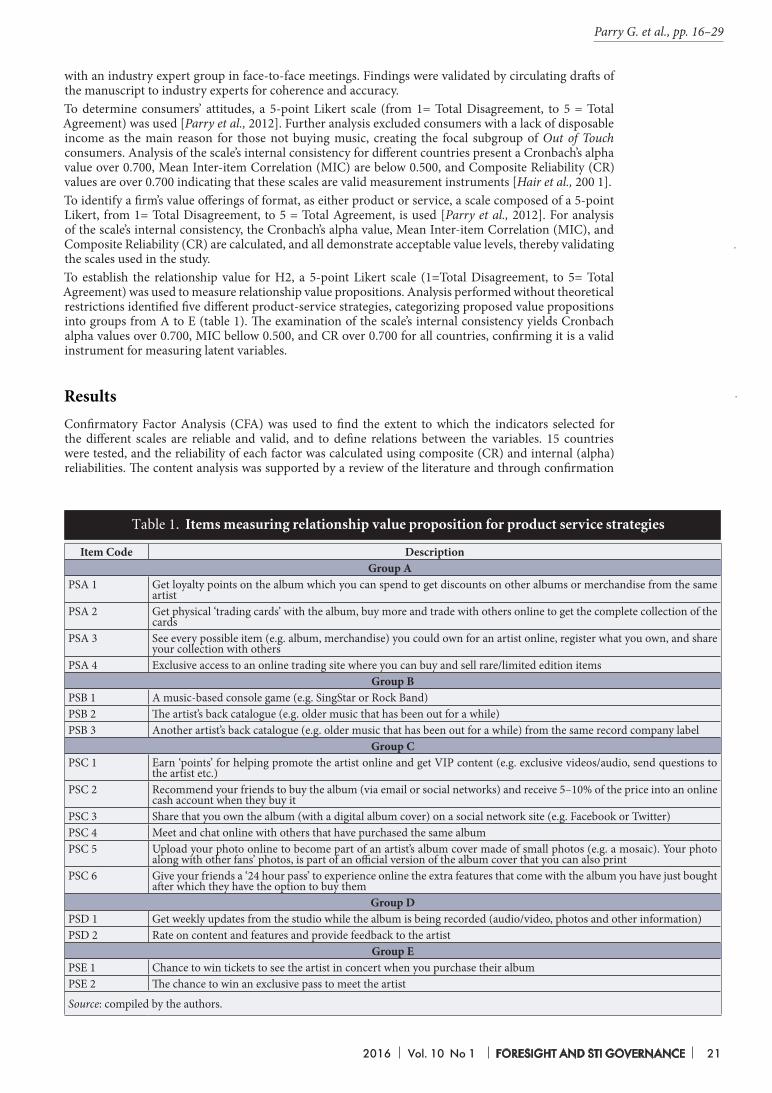
Context and hypothesesMusic industry MNEs have extensive global experience and yet retain national subsidiaries in their key markets [Bakker, 2006; Johanson, Vahlne, 1977]. They have also conducted extensive international research to gain an understanding of the consumers in these markets [Chandra, Coviello, 2010]. Empirical studies based on UK consumer data have led to the creation of groups of potential music consumers clustered by their attitudes towards music [Parry et al., 2012]. This study was conducted among a select sample of people who have disposable income but do not currently engage in value exchanges. This group is described as Out of Touch. Analysis of this group in the UK indicated that they had a positive attitude towards music purchase and so potentially could be engaged in other markets through provision of suitable value offerings. The main objective for firms is to create and maintain value [Sirmon et al., 2007], and the Out of Touch group is a potentially interesting unit for this global study as they represent around 20% of potential global consumers; hence, offering the greatest potential for future value capture. Finding the appropriate strategy is proving to be a challenge for MNEs. A global strategy means using a common approach to meet the needs of consumers who may have disparate or fragmented requirements [Brynjolfsson et al., 2006]. In contrast, it has been stated that to be successful, firms must utilize their knowledge gained in other markets and adapt that knowledge to national contexts, suggesting either regional or national strategies [Boisot, 1998]. Irrespective of the level of sales, market orientation becomes highly significant as it demonstrates the extent of a firm’s engagement in marketing activities and consumer intelligence [Morgan et al., 2009]. Empirical research suggests that market orientation is a generic determinant of firm performance [Ellis, 2006; Kirca et al., 2005]. Whilst there can be no single approach to product strategy in international markets [Hultman et al., 2009], the key market resource of firms is an understanding of the different preferences of consumers, or potential consumers in a market [Vargo, Lusch, 2004]. Knowledge of the national market allows for the development of specific consumer segments [Srivastava et al., 2001]. Music MNEs are also able to have operations and management functions geo-located in all their major market countries. Firms may target a broad range of consumers or a focused audience with a specific need or preference [Boone et al., 2002]. Value propositions are used by firms to engage consumers and encourage them to purchase products. Relationship value [Payne, Holt, 2001] denotes if it is possible to engage with and influence consumers, to increase the likelihood of purchase [Afuah, 2002; Bustinza et al., 2013a]. Value captured is the worth, usually monetary, which firms secure through value exchange with consumers who purchase their offering [Lepak et al., 2007]. This study builds upon previous work that empirically examines consumer attitudes to value offerings [Parry et al., 2012] and potential behaviour at the point of value in use [O’Cass, Ngo, 2011]. Parry et al. [Parry et al., 2012] found that consumers’ purchasing patterns are dependent on the sales format as they perceive utility differently when buying music as a product [CD, vinyl] than as a service
Parry G. et al., pp. 16–29

20 FORESIGHT AND STI GOVERNANCE Vol. 10 No 1 2016
Strategies
Relationship value propositions (Product
Service Strategies)
Out of Touch Music Consumer Group
Product Service
Value Offerings (Product Service Portfolio)
H2
H1
H1a H1b
(streaming, downloads). Following this research, we expect that reengagement with the Out of Touch segment will depend on the sales formats offered by firms in a market, with some consumers retaining a preference for physical format and others engaging in digital streaming and download. From the consumer’s perspective, we propose that if firms are to deliver value propositions [Ordanini, Pasini, 2008] that create value in use [Prahalad, Ramaswamy, 2000], then the attitudes of potential consumers must be matched by the marketing strategy. We must find homogeneity among attitudes to music at the national, regional, or global level. This proposal leads to the formulation of the following set of hypotheses:Hypothesis 1. Music consumers displaying an Out of Touch attitude are positively related to purchasing music. Hypothesis 1a: Music consumers displaying an Out of Touch attitude are positively related to purchasing music in product format. Hypothesis 1b. Music consumers displaying an Out of Touch attitude are positively related to purchasing music in service format. Value is determined by the consumer’s response to a bundle of value deliverables in terms of product, service, and the customer relationship [O’Cass, Ngo, 2011; Vargo, Lusch, 2004] such that it is possible, using the appropriate mix of value offerings [Ngo, O’Cass, 2009], to engage with and influence consumers and increase their likelihood of making a purchase [Bustinza et al., 2013a]. According to this argument, and considering the particular characteristics of potential music consumers, it is expected that specific value strategies can positively influence consumer attitudes. Hypothesis 2: Relationship value strategies can target the consumers with an Out of Touch attitude and increase their propensity towards purchasing music.Having stated the hypotheses, we developed a model of relationships and this is shown in Figure 1.
MethodologyTo examine these hypotheses it is necessary to carry out an empirical investigation. The study population comprises resident music consumers from 15 countries that account for more than 85% of the global revenues of the music industry and represent a broad geographical representation. The statistical software SPSS 20.0 and EQS 6.2 was used to analyze the data included in the sample. The questionnaire and responses were provided by one of the big four global music firms. The utilized questionnaire underwent iterative development for a number of years within the company’s market research division. The researchers were able to influence current questions and add new ones where appropriate. The questionnaire was extensive and the researchers worked with a subset of questions that directly related to the attributes and characteristics of consumer behaviour and active strategies relevant to this study. The subset of questions, planned paper, proposed hypothesis, empirical tests and assumptions were discussed
Fig. 1. Model to measure attitudes relating to direct and mediating relationships for Out of Touch consumers
Source: compiled by the authors.
2016 Vol. 10 No 1 FORESIGHT AND STI GOVERNANCE 21
with an industry expert group in face-to-face meetings. Findings were validated by circulating drafts of the manuscript to industry experts for coherence and accuracy.To determine consumers’ attitudes, a 5-point Likert scale (from 1= Total Disagreement, to 5 = Total Agreement) was used [Parry et al., 2012]. Further analysis excluded consumers with a lack of disposable income as the main reason for those not buying music, creating the focal subgroup of Out of Touch consumers. Analysis of the scale’s internal consistency for different countries present a Cronbach’s alpha value over 0.700, Mean Inter-item Correlation (MIC) are below 0.500, and Composite Reliability (CR) values are over 0.700 indicating that these scales are valid measurement instruments [Hair et al., 200 1].To identify a firm’s value offerings of format, as either product or service, a scale composed of a 5-point Likert, from 1= Total Disagreement, to 5 = Total Agreement, is used [Parry et al., 2012]. For analysis of the scale’s internal consistency, the Cronbach’s alpha value, Mean Inter-item Correlation (MIC), and Composite Reliability (CR) are calculated, and all demonstrate acceptable value levels, thereby validating the scales used in the study. To establish the relationship value for H2, a 5-point Likert scale (1=Total Disagreement, to 5= Total Agreement) was used to measure relationship value propositions. Analysis performed without theoretical restrictions identified five different product-service strategies, categorizing proposed value propositions into groups from A to E (table 1). The examination of the scale’s internal consistency yields Cronbach alpha values over 0.700, MIC bellow 0.500, and CR over 0.700 for all countries, confirming it is a valid instrument for measuring latent variables.
ResultsConfirmatory Factor Analysis (CFA) was used to find the extent to which the indicators selected for the different scales are reliable and valid, and to define relations between the variables. 15 countries were tested, and the reliability of each factor was calculated using composite (CR) and internal (alpha) reliabilities. The content analysis was supported by a review of the literature and through confirmation
Тable 1. Items measuring relationship value proposition for product service strategies
Item Code DescriptionGroup A
PSA 1 Get loyalty points on the album which you can spend to get discounts on other albums or merchandise from the same artist
PSA 2 Get physical ‘trading cards’ with the album, buy more and trade with others online to get the complete collection of the cards
PSA 3 See every possible item (e.g. album, merchandise) you could own for an artist online, register what you own, and share your collection with others
PSA 4 Exclusive access to an online trading site where you can buy and sell rare/limited edition itemsGroup B
PSB 1 A music-based console game (e.g. SingStar or Rock Band) PSB 2 The artist’s back catalogue (e.g. older music that has been out for a while)PSB 3 Another artist’s back catalogue (e.g. older music that has been out for a while) from the same record company label
Group CPSC 1 Earn ‘points’ for helping promote the artist online and get VIP content (e.g. exclusive videos/audio, send questions to
the artist etc.)PSC 2 Recommend your friends to buy the album (via email or social networks) and receive 5–10% of the price into an online
cash account when they buy itPSC 3 Share that you own the album (with a digital album cover) on a social network site (e.g. Facebook or Twitter)PSC 4 Meet and chat online with others that have purchased the same albumPSC 5 Upload your photo online to become part of an artist’s album cover made of small photos (e.g. a mosaic). Your photo
along with other fans’ photos, is part of an official version of the album cover that you can also printPSC 6 Give your friends a ‘24 hour pass’ to experience online the extra features that come with the album you have just bought
after which they have the option to buy themGroup D
PSD 1 Get weekly updates from the studio while the album is being recorded (audio/video, photos and other information)PSD 2 Rate on content and features and provide feedback to the artist
Group EPSE 1 Chance to win tickets to see the artist in concert when you purchase their albumPSE 2 The chance to win an exclusive pass to meet the artist
Source: compiled by the authors.
Parry G. et al., pp. 16–29
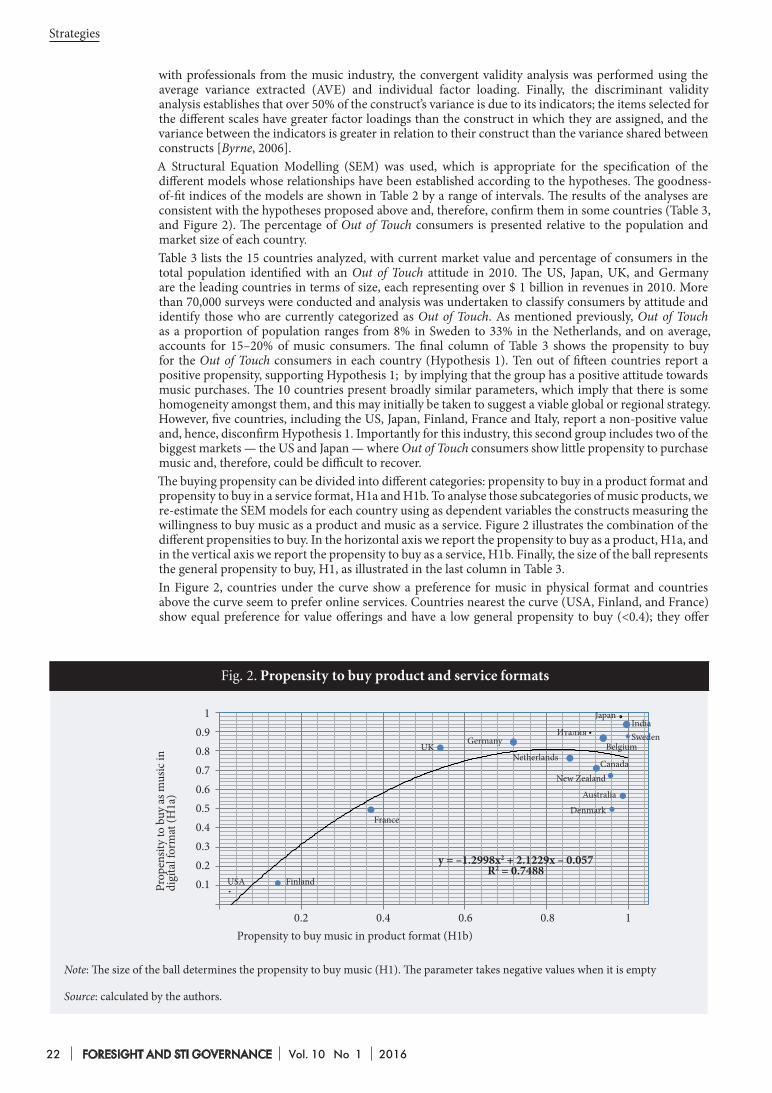
22 FORESIGHT AND STI GOVERNANCE Vol. 10 No 1 2016
Strategies
0.2 0.4 0.6 0.8 1
10.90.80.70.60.50.40.30.20.1
y = –1.2998x2 + 2.1229x – 0.057R2 = 0.7488
Prop
ensit
y to
buy
as m
usic
in
digi
tal f
orm
at (H
1а)
Propensity to buy music in product format (H1b)
USA Finland
France
UKGermany
Netherlands
JapanIndiaSweden
BelgiumИталия
CanadaNew Zealand
Australia
Denmark
Fig. 2. Propensity to buy product and service formats
Source: calculated by the authors.
Note: The size of the ball determines the propensity to buy music (H1). The parameter takes negative values when it is empty
with professionals from the music industry, the convergent validity analysis was performed using the average variance extracted (AVE) and individual factor loading. Finally, the discriminant validity analysis establishes that over 50% of the construct’s variance is due to its indicators; the items selected for the different scales have greater factor loadings than the construct in which they are assigned, and the variance between the indicators is greater in relation to their construct than the variance shared between constructs [Byrne, 2006]. A Structural Equation Modelling (SEM) was used, which is appropriate for the specification of the different models whose relationships have been established according to the hypotheses. The goodness-of-fit indices of the models are shown in Table 2 by a range of intervals. The results of the analyses are consistent with the hypotheses proposed above and, therefore, confirm them in some countries (Table 3, and Figure 2). The percentage of Out of Touch consumers is presented relative to the population and market size of each country. Table 3 lists the 15 countries analyzed, with current market value and percentage of consumers in the total population identified with an Out of Touch attitude in 2010. The US, Japan, UK, and Germany are the leading countries in terms of size, each representing over $ 1 billion in revenues in 2010. More than 70,000 surveys were conducted and analysis was undertaken to classify consumers by attitude and identify those who are currently categorized as Out of Touch. As mentioned previously, Out of Touch as a proportion of population ranges from 8% in Sweden to 33% in the Netherlands, and on average, accounts for 15–20% of music consumers. The final column of Table 3 shows the propensity to buy for the Out of Touch consumers in each country (Hypothesis 1). Ten out of fifteen countries report a positive propensity, supporting Hypothesis 1; by implying that the group has a positive attitude towards music purchases. The 10 countries present broadly similar parameters, which imply that there is some homogeneity amongst them, and this may initially be taken to suggest a viable global or regional strategy. However, five countries, including the US, Japan, Finland, France and Italy, report a non-positive value and, hence, disconfirm Hypothesis 1. Importantly for this industry, this second group includes two of the biggest markets — the US and Japan — where Out of Touch consumers show little propensity to purchase music and, therefore, could be difficult to recover. The buying propensity can be divided into different categories: propensity to buy in a product format and propensity to buy in a service format, H1a and H1b. To analyse those subcategories of music products, we re-estimate the SEM models for each country using as dependent variables the constructs measuring the willingness to buy music as a product and music as a service. Figure 2 illustrates the combination of the different propensities to buy. In the horizontal axis we report the propensity to buy as a product, H1a, and in the vertical axis we report the propensity to buy as a service, H1b. Finally, the size of the ball represents the general propensity to buy, H1, as illustrated in the last column in Table 3.In Figure 2, countries under the curve show a preference for music in physical format and countries above the curve seem to prefer online services. Countries nearest the curve (USA, Finland, and France) show equal preference for value offerings and have a low general propensity to buy (<0.4); they offer
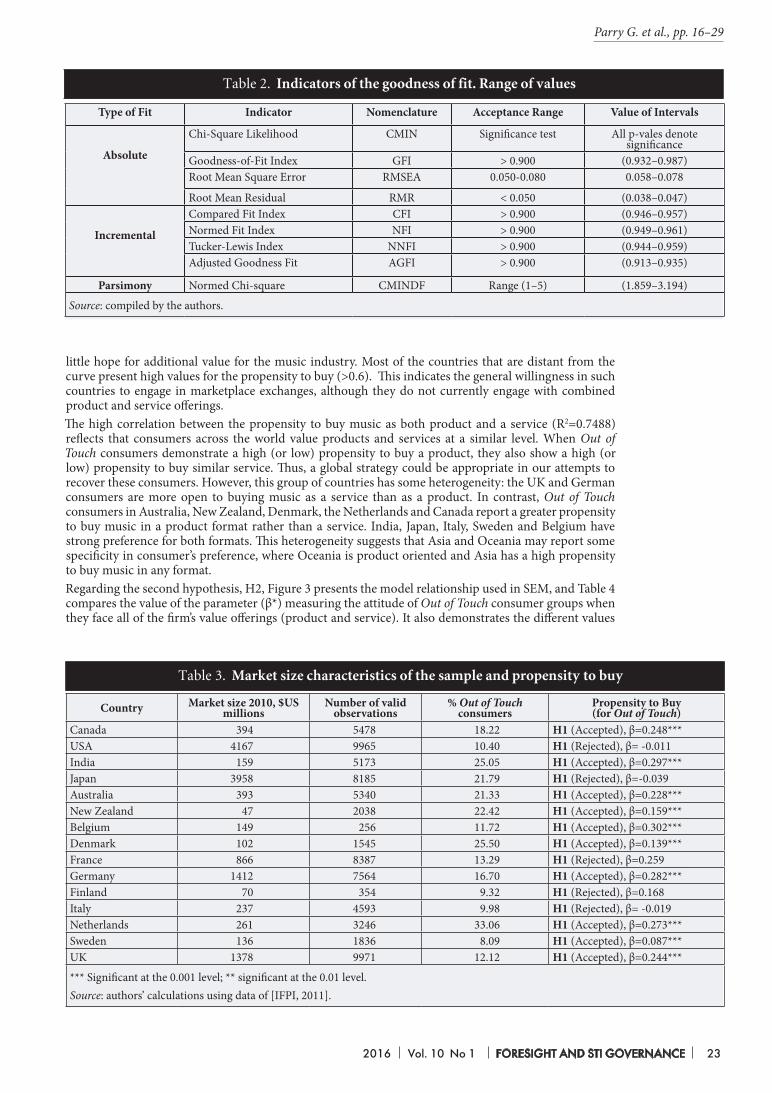
2016 Vol. 10 No 1 FORESIGHT AND STI GOVERNANCE 23
Type of Fit Indicator Nomenclature Acceptance Range Value of Intervals
Absolute
Chi-Square Likelihood CMIN Significance test All p-vales denote significance
Goodness-of-Fit Index GFI > 0.900 (0.932–0.987)Root Mean Square Error RMSEA 0.050-0.080 0.058–0.078
Root Mean Residual RMR < 0.050 (0.038–0.047)
Incremental
Compared Fit Index CFI > 0.900 (0.946–0.957)Normed Fit Index NFI > 0.900 (0.949–0.961)Tucker-Lewis Index NNFI > 0.900 (0.944–0.959)Adjusted Goodness Fit AGFI > 0.900 (0.913–0.935)
Parsimony Normed Chi-square CMINDF Range (1–5) (1.859–3.194)
Source: compiled by the authors.
little hope for additional value for the music industry. Most of the countries that are distant from the curve present high values for the propensity to buy (>0.6). This indicates the general willingness in such countries to engage in marketplace exchanges, although they do not currently engage with combined product and service offerings. The high correlation between the propensity to buy music as both product and a service (R2=0.7488) reflects that consumers across the world value products and services at a similar level. When Out of Touch consumers demonstrate a high (or low) propensity to buy a product, they also show a high (or low) propensity to buy similar service. Thus, a global strategy could be appropriate in our attempts to recover these consumers. However, this group of countries has some heterogeneity: the UK and German consumers are more open to buying music as a service than as a product. In contrast, Out of Touch consumers in Australia, New Zealand, Denmark, the Netherlands and Canada report a greater propensity to buy music in a product format rather than a service. India, Japan, Italy, Sweden and Belgium have strong preference for both formats. This heterogeneity suggests that Asia and Oceania may report some specificity in consumer’s preference, where Oceania is product oriented and Asia has a high propensity to buy music in any format.Regarding the second hypothesis, H2, Figure 3 presents the model relationship used in SEM, and Table 4 compares the value of the parameter (β*) measuring the attitude of Out of Touch consumer groups when they face all of the firm’s value offerings (product and service). It also demonstrates the different values
Тable 2. Indicators of the goodness of fit. Range of values
Тable 3. Market size characteristics of the sample and propensity to buy
Country Market size 2010, $US millions
Number of valid observations
% Out of Touch consumers
Propensity to Buy (for Out of Touch)
Canada 394 5478 18.22 H1 (Accepted), β=0.248***USA 4167 9965 10.40 H1 (Rejected), β= -0.011India 159 5173 25.05 H1 (Accepted), β=0.297***Japan 3958 8185 21.79 H1 (Rejected), β=-0.039Australia 393 5340 21.33 H1 (Accepted), β=0.228***New Zealand 47 2038 22.42 H1 (Accepted), β=0.159***Belgium 149 256 11.72 H1 (Accepted), β=0.302***Denmark 102 1545 25.50 H1 (Accepted), β=0.139***France 866 8387 13.29 H1 (Rejected), β=0.259Germany 1412 7564 16.70 H1 (Accepted), β=0.282***Finland 70 354 9.32 H1 (Rejected), β=0.168Italy 237 4593 9.98 H1 (Rejected), β= -0.019Netherlands 261 3246 33.06 H1 (Accepted), β=0.273***Sweden 136 1836 8.09 H1 (Accepted), β=0.087***UK 1378 9971 12.12 H1 (Accepted), β=0.244***
*** Significant at the 0.001 level; ** significant at the 0.01 level.Source: authors’ calculations using data of [IFPI, 2011].
Parry G. et al., pp. 16–29
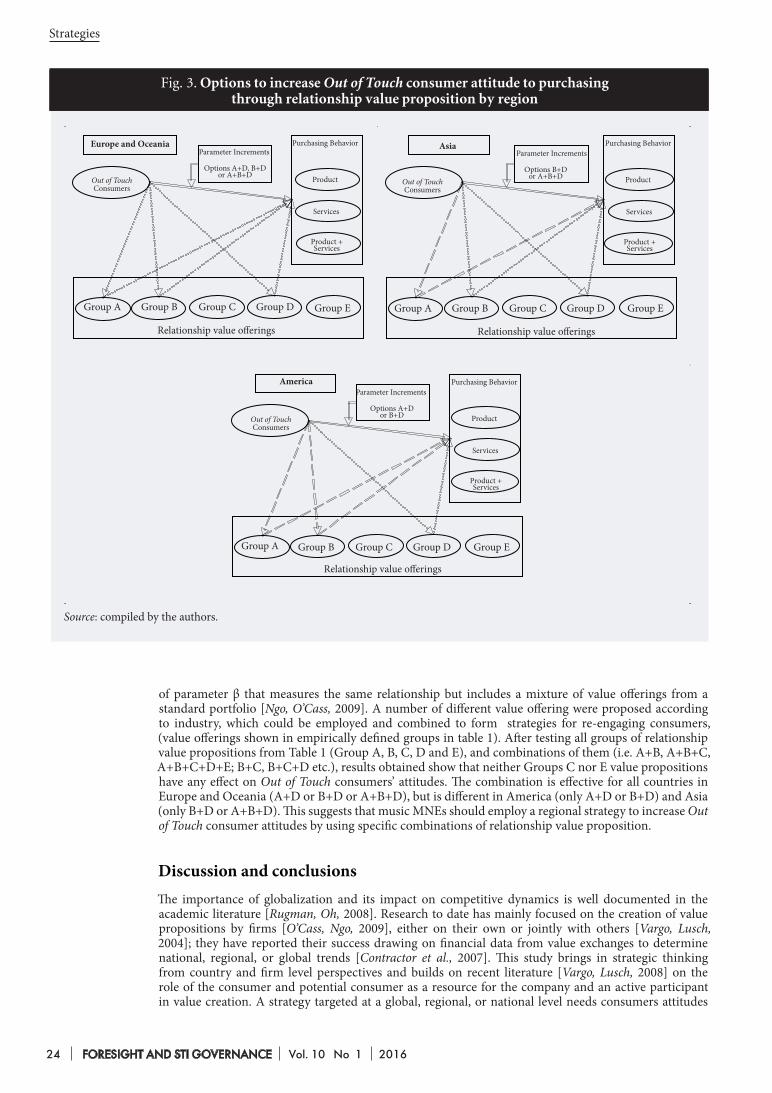
24 FORESIGHT AND STI GOVERNANCE Vol. 10 No 1 2016
Strategies
Relationship value offerings
Group А Group B Group C Group D
Out of Touch Consumers
Parameter Increments
Options A+D, B+D or A+B+D
Group А
Out of Touch Consumers
Europe and Oceania
Relationship value offerings
Relationship value offerings
Group E
Purchasing Behavior
Product
Services
Product + Services
Group А Group B Group C Group D Group E
Out of Touch Consumers
Parameter Increments
Options B+D or A+B+D
Purchasing Behavior
Product
Services
Product + Services
Group B Group C Group D Group E
Parameter Increments
Options A+D or B+D
Purchasing Behavior
Product
Services
Product + Services
Asia
America
Fig. 3. Options to increase Out of Touch consumer attitude to purchasing through relationship value proposition by region
Source: compiled by the authors.
of parameter β that measures the same relationship but includes a mixture of value offerings from a standard portfolio [Ngo, O’Cass, 2009]. A number of different value offering were proposed according to industry, which could be employed and combined to form strategies for re-engaging consumers, (value offerings shown in empirically defined groups in table 1). After testing all groups of relationship value propositions from Table 1 (Group A, B, C, D and E), and combinations of them (i.e. A+B, A+B+C, A+B+C+D+E; B+C, B+C+D etc.), results obtained show that neither Groups C nor E value propositions have any effect on Out of Touch consumers’ attitudes. The combination is effective for all countries in Europe and Oceania (A+D or B+D or A+B+D), but is different in America (only A+D or B+D) and Asia (only B+D or A+B+D). This suggests that music MNEs should employ a regional strategy to increase Out of Touch consumer attitudes by using specific combinations of relationship value proposition.
Discussion and conclusionsThe importance of globalization and its impact on competitive dynamics is well documented in the academic literature [Rugman, Oh, 2008]. Research to date has mainly focused on the creation of value propositions by firms [O’Cass, Ngo, 2009], either on their own or jointly with others [Vargo, Lusch, 2004]; they have reported their success drawing on financial data from value exchanges to determine national, regional, or global trends [Contractor et al., 2007]. This study brings in strategic thinking from country and firm level perspectives and builds on recent literature [Vargo, Lusch, 2008] on the role of the consumer and potential consumer as a resource for the company and an active participant in value creation. A strategy targeted at a global, regional, or national level needs consumers attitudes
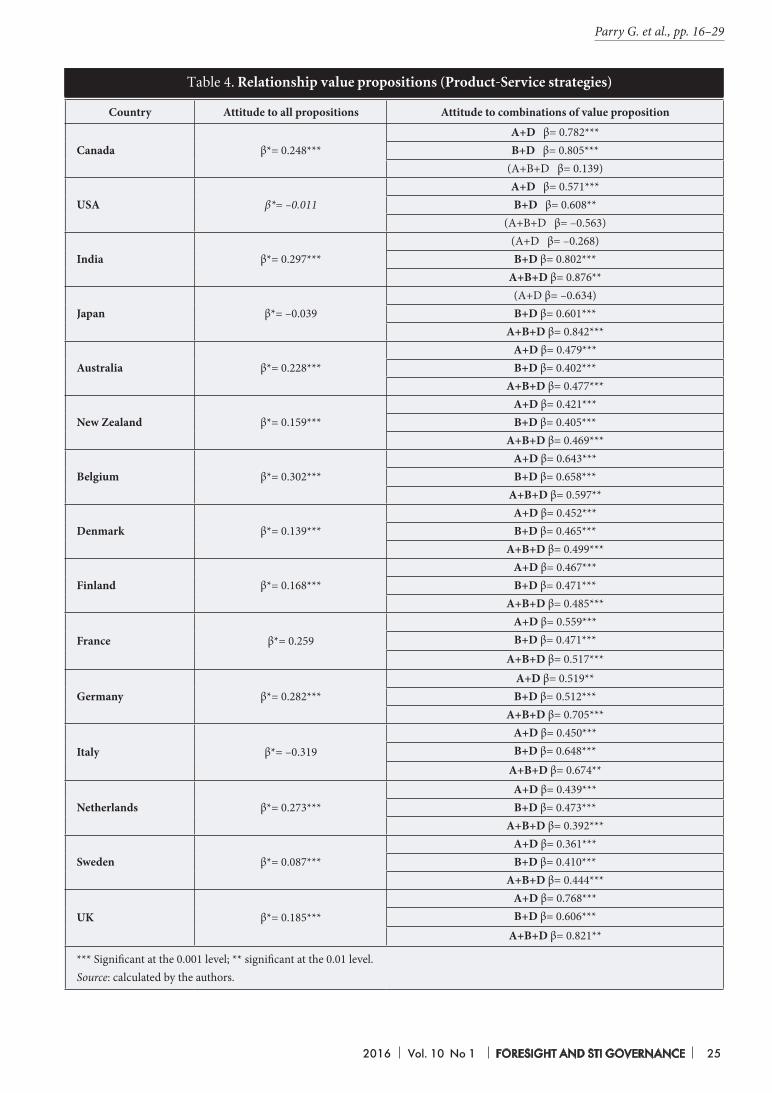
2016 Vol. 10 No 1 FORESIGHT AND STI GOVERNANCE 25
Country Attitude to all propositions Attitude to combinations of value proposition
Canada β*= 0.248***A+D β= 0.782***B+D β= 0.805***
(A+B+D β= 0.139)
USA β*= –0.011A+D β= 0.571***B+D β= 0.608**
(A+B+D β= –0.563)
India β*= 0.297***(A+D β= –0.268)B+D β= 0.802***
A+B+D β= 0.876**
Japan β*= –0.039(A+D β= –0.634)B+D β= 0.601***
A+B+D β= 0.842***
Australia β*= 0.228***A+D β= 0.479***B+D β= 0.402***
A+B+D β= 0.477***
New Zealand β*= 0.159***A+D β= 0.421***B+D β= 0.405***
A+B+D β= 0.469***
Belgium β*= 0.302***A+D β= 0.643***B+D β= 0.658***
A+B+D β= 0.597**
Denmark β*= 0.139***A+D β= 0.452***B+D β= 0.465***
A+B+D β= 0.499***
Finland β*= 0.168***A+D β= 0.467***B+D β= 0.471***
A+B+D β= 0.485***
France β*= 0.259A+D β= 0.559***B+D β= 0.471***
A+B+D β= 0.517***
Germany β*= 0.282***A+D β= 0.519**B+D β= 0.512***
A+B+D β= 0.705***
Italy β*= –0.319A+D β= 0.450***B+D β= 0.648***
A+B+D β= 0.674**
Netherlands β*= 0.273***A+D β= 0.439***B+D β= 0.473***
A+B+D β= 0.392***
Sweden β*= 0.087***A+D β= 0.361***B+D β= 0.410***
A+B+D β= 0.444***
UK β*= 0.185***A+D β= 0.768***B+D β= 0.606***
A+B+D β= 0.821**
*** Significant at the 0.001 level; ** significant at the 0.01 level.Source: calculated by the authors.
Тable 4. Relationship value propositions (Product-Service strategies)
Parry G. et al., pp. 16–29
26 FORESIGHT AND STI GOVERNANCE Vol. 10 No 1 2016
Strategies
to be homogenous at the same level of analysis, since strategies have to be inflexible if the firm is to obtain competitive advantage. Accordingly, this study contributes to this field by exploring the attitude of consumers who are positively disposed to a value offering, yet currently have limited engagement and are a source of potentially unrealized revenue. These consumers do not appear in corporate reported data and yet form a potentially significant source of future income. An investigation into the attitude to offerings facilitates an understanding of consumers’ perception of value offering, and provides an exogenous perspective on how strategy can be crafted to create or maintain value for consumers [O’Cass, Ngo, 2011] at an appropriate level of analysis. This level could be global [Yip, 2003], regional [Rugman, Oh, 2008; Rugman, Verbeke, 2003], national, or distinct yet interrelated [Ghemawat, 2005]. The conclusions agree with DeSarbo et al. [DeSarbo et al., 2001] and provide empirical evidence of the importance of consumer value analysis when firms deal with heterogeneous markets.This paper also contributes to the understanding that product and services need to be managed in different ways [Bustinza et al., 2013a]. Services are more amenable to global upstream delivery, whereas product format relies upon national or regional assets [Graham et al., 2004]. Findings revealed some regional level of preference that may be influenced by national or regional specific factors [Dunning et al., 2007]. However, in the case of consumer attitudes to a different product or service, it is found that the selection of the value offering provided becomes the critical determinant of the value creation process [Breunig et al., 2013; Parry et al., 2012]. The study also explores the potential of bundling product, service, and relationship value propositions [O’Cass, Ngo, 2011; Vargo, Lusch, 2004]. The findings indicate that specific bundles of related products and services re-engaged Out of Touch consumers at the regional level of analysis. Empirical analysis shows that contrary to the optimal strategies based on national subsidiaries during the second half of the 20th century [Bakker, 2006], regional strategies are preferable in creating value and regional teams within firms. Further, these are important when developing knowledge as they facilitate understanding of the heterogeneity of regions, as described by Ritzer [Ritzer, 2003]. While a strategy to provide value offerings globally may be appropriate in the digital domain [Yip, 2003], the value bundles offered to consumers are more effective if they are made to match regional consumer market requirements; this would provide an important strategic contribution. A global delivery system offering a portfolio of product and service may then be configured to regionally bundle offers that are appropriate to the identified consumer value propositions.
Managerial relevance The analysis of consumers explores the extent to which homogeneity exists in their attitudes towards a product/service offer and if it does, at what level: global, regional, or national. Where such homogeneity exists, strategies should support the provision of value offer at the appropriate level. The analysis here has found a large group of consumers with the resources to buy but who did not make any purchases. This group is termed Out of Touch, and their behaviour was explored across 15 countries.We focused on the group’s attitudes to purchasing different value offerings and then analysed national markets in an effort to identify the appropriate level of commonality [Dunning et al., 2007]. The analysis shows that homogeneity exists in consumer attitudes across many countries and the Out of Touch consumers can be re-engaged following the analysis and identification of appropriate offers, which facilitate the transfer of standard strategy and practice across national borders [Katsikeas et al., 2006]. However, statistical analysis showed that in four important markets (US, Japan, France, and Italy), potentially valuable consumers did not have a high propensity to buy. This is both a concern and an opportunity for managers in the music industry. Our analysis indicates that a global strategy that seeks to engage the Out of Touch grouping will potentially succeed in many markets, but it would not succeed in two of the global largest markets, the United States and Japan, and the two key European markets of Italy and France. Overall, these markets account for approximately 60% of industry revenues. This is interesting as it demonstrates that care must be taken when assessing strategy, particularly when strategies are being transferred between countries. What works in a number of smaller markets may not work in larger ones and vice versa. Future work could seek to understand why this is the case. Repetition of the analysis undertaken, where data are available may help reveal whether strategies employed successfully are appropriate and transferrable, or why failures occurred. The study also concludes that the music industry is not global but rather regionally based, suggesting that large firms should employ regional managers or teams.
Future lines of research and limitationsGoing forward, as we gain larger and more detailed data, we will be able to identify accurately people from around the world who have specific attitudes towards products or services. With this level of granularity and using digital media strategies, it may be possible to utilize global strategies to target consumers segmented by attitude rather than geography. Further, we may be able to understand why strategy may or may not be transferrable between nations.The data used in this paper are unique and rich but face some limitations that affect to what extent we can generalize from the results. The timeframe of this research is limited to early 2011, and hence we do not
2016 Vol. 10 No 1 FORESIGHT AND STI GOVERNANCE 27
capture changes in attitudes over time. A longitudinal study may help provide a greater understanding of preference evolution in markets. The purchase propensity is based on survey responses (attitudes) rather than actual data on consumer behaviour. Whilst we are confident that significant differences in the estimated propensity parameters relate to different value perceptions, we do not observe actual purchase behaviour where there is a monetary exchange. We have assumed that the different music formats are of equal quality around the world and have not taken on board national differences, competition, and piracy that may influence attitudes.
Afuah A. (2002) Mapping technological capabilities into product markets and competitive advantage: The case of cholesterol drugs. Strategic Management Journal, vol. 23, no 2, pp. 171–179.
Bakker G. (2006) The making of a music multinational: PolyGram’s international businesses, 1945–1998. The Business History Review, vol. 80, no 1, pp. 81–123.
Ballard D.J., Ogola G., Fleming N.S., Heck D., Gunderson J., Mehta R., Khetan R., Kerr J.D. (2009) The Impact of Standardized Order Sets on Quality and Financial Outcomes. Patient Safety: New Directions and Alternative Approaches (Vol. 2: Culture and Redesign) (eds. K. Henriksen, J.B. Battles, M.A. Keyes), Rockville, MD: U.S. Agency for Healthcare Research and Quality.
Berthon P., Pitt L., McCarthy I., Kates S. (2007) When customers get clever: Managerial approaches to dealing with creative consumers. Business Horizons, vol. 50, no 1, pp. 39–47.
Boisot M. (1998) Knowledge assets: Securing competitive advantage in the information economy. New York: Oxford University Press.
Boone C., Van Witteloostuijn A., Carroll G.R. (2002) Resource distributions and market partitioning: Dutch daily newspapers, 1968 to 1994. American Sociological Review, vol. 67, no 3, pp. 408–431.
Breunig K.J., Kvålshaugen R., Hydle K.M. (2014) Knowing your boundaries: Integration opportunities in international professional service firms. Journal of World Business, vol. 49, no 4, pp. 502–511. DOI: 10.1016/j.jwb.2013.12.004.
Briscoe D.R., Schuler R.S., Claus L. (2009) International Human Resource Management: Policies and practices for multinational enterprises (Global HRM) (3rd ed.), New York: Routledge.
Brynjolfsson E., Hu Y., Smith M.D. (2006) From niches to riches: Anatomy of the long tail. Sloan Management Review, vol. 47, no 4, pp. 67–71.
Bustinza O.F., Parry G.C., Vendrell-Herrero F. (2013a) Supply and demand chain management: The effect of adding services to product offerings. Supply Chain Management: An International Journal, vol.18, no 6, pp. 618–629.
Bustinza O.F., Vendrell-Herrero F., Parry G.C., Myrthianos V. (2013b) Music Business Models and Piracy. Industrial Management & Data Systems, vol. 113, no 1, pp. 4–22.
Byrne B.M. (2006) Structural equation modeling with EQS: Basic concepts, applications, and programming, New York: Psychology Press.
Chandra Y., Coviello N. (2010) Broadening the concept of international entrepreneurship: ‘Consumers as International Entrepreneurs’. Journal of World Business, vol. 45, no 3, pp. 228–236.
Contractor F.J., Kumar V., Kundu S.K. (2007) Nature of the relationship between international expansion and performance: The case of emerging market firms. Journal of World Business, vol. 42, no 4, pp. 401–417.
De Jong G., Phan T.B., Van Ees H. (2011) Does the meta-environment determine firm performance? Theory and evidence from European multinational enterprises. International Business Review, vol. 20, no 4, pp. 454–465.
Dellestrand H. (2011) Subsidiary embeddedness as a determinant of divisional headquarters involvement in innovation transfer processes. Journal of International Management, vol. 17, no 3, pp. 229–242.
DeSarbo W.S., Jedidi K., Sinha I. (2001) Customer value analysis in a heterogeneous market. Strategic Management Journal, vol. 22, no 9, pp. 845–857.
Djelic M.L., Quack S. (2003) Globalization and institutions: Redefining the rules of the economic game, Cheltenham: Edward Elgar.
Dunning J.H., Fujita M., Yakova N. (2007) Some macro-data on the regionalization/globalization debate: A comment on the Rugman/Verbeke analysis. Journal of International Business Studies, vol. 38, pp. 177–199.
Ellis P.D. (2006) Market orientation and performance: A meta‐analysis and cross‐national comparisons. Journal of Management Studies, vol. 43, no 5, pp. 1089–1107.
Evans J., Mavondo F.T., Bridson K. (2008) Psychic distance: Antecedents, retail strategy implications, and performance outcomes. Journal of International Marketing, vol. 16, no 2, pp. 32–63.
Feld S. (2001) A sweet lullaby for world music. Globalization, vol. 12, no 1, pp. 189–216. Ferreira F., Waldfogel J. (2010) Pop internationalism: Has a half century of World music trade displaced local culture?
(NBER Working Paper 15964), Cambridge, MA: National Bureau of Economic Research. Ghemawat P. (2005) Regional strategies for global leadership. Harvard Business Review, vol. 83, no 12, pp. 98–108. Ghoshal S., Westney D.E. (1993) Organization theory and the multinational corporations, New York: St Martin’s Press.Giddens A. (2011) Runaway world: How globalization is reshaping our lives, London: Profile Books. Graham G., Burnes B., Lewis G.J., Langer J. (2004) The transformation of the music industry supply chain: A major
label perspective. International Journal of Operations & Production Management, vol. 24, no 11, pp. 1087–1103. Hair J.F., Anderson R.E., Tatham R.L., Black W. (2001) Multivariate data analysis, London: Prentice Hall Pearson
Education.
References
Parry G. et al., pp. 16–29
28 FORESIGHT AND STI GOVERNANCE Vol. 10 No 1 2016
Strategies
Hargrave T.J., van de Ven A.H. (2009) Institutional work as the creative embrace of contradiction. Institutional work: Actors and agency in institutional studies of organizations (eds. T.B. Lawrence, R. Suddaby, B. Leca), New York: Cambridge University Press, pp. 120–140.
Hitt M. A., Hoskisson R.E., Ireland R.D. (1994) A mid-range theory of the interactive effects of international and product diversification on innovation and performance. Journal of Management, vol. 20, no 2, pp. 297–326.
Ho W.C. (2003) Between globalisation and localisation: A study of Hong Kong popular music. Popular Music, vol. 22, no 2, pp. 143–157.
Hultman M., Robson M.J., Katsikeas C.S. (2009) Export product strategy fit and performance: An empirical investigation. Journal of International Marketing, vol. 17, no 4, pp. 1–23.
Husted B.W., Allen D.B. (2006) Corporate social responsibility in the multinational enterprise: Strategic and institutional approaches. Journal of International Business Studies, vol. 37, no 6, pp. 838–849.
IFPI (2011) IFPI digital music report 2011: Music at the touch of a button. London: IFPI. Available at: www.ifpi.org/content/library/DMR2011.pdf, accessed 24.06.2015.
Johanson J., Vahlne J.E. (1977) The internationalization process of the firm: A model of knowledge development and increasing foreign market commitments. Journal of International Business Studies, vol. 8, no 1, pp. 23–32.
Kafouros M.I., Buckley P.J., Sharp J.A., Wang C. (2008) The role of internationalization in explaining innovation performance. Technovation, vol. 28, no 1–2, pp. 63–74.
Katsikeas C.S., Samiee S., Theodosiou M. (2006) Strategy fit and performance consequences of international marketing standardization. Strategic Management Journal, vol. 27, no 9, pp. 867–890.
Kirca A.H., Jayachandran S., Bearden W.O. (2005) Market orientation: A meta-analytic review and assessment of its antecedents and impact on performance. Journal of Marketing, vol. 69, no 2, pp. 24–41.
Kogut B., Singh H. (1988) The effect of national culture on the choice of entry mode. Journal of International Business Studies, vol. 19, no 3, pp. 411–432.
Kucuk U.S., Krishnamurthy S. (2007) An analysis of consumer power on the Internet. Technovation, vol. 27, no 1–2, pp. 47–56.
Lepak D., Smith K.G., Taylor M.S. (2007) Value creation and value capture: A multilevel perspective. Academy of Management Review, vol. 32, no 1, pp. 180–194.
Lusch R.F., Vargo S.L., Tanniru M. (2010) Service, value networks and learning. Journal of the Academy of Marketing Science, vol. 38, no 1, pp. 19–31.
Madhok A. (1997) Cost, value and foreign market entry mode: The transaction and the firm. Strategic Management Journal, vol. 18, no 1, pp. 39–61.
Morgan N.A., Vorhies D.W., Mason C.H. (2009) Market orientation, marketing capabilities, and firm performance. Strategic Management Journal, vol. 30, no 8, pp. 909–920.
Negus K. (1999) Music genres and corporate cultures, London: Psychology Press. Neu W.A., Brown S. (2005) Forming successful business-to-business services in goods-dominant firms. Journal of
Service Research, vol. 8, no 1, pp. 3–17.Ngo L.V., O’Cass A. (2009) Creating value offerings via operant resource-based capabilities. Industrial Marketing
Management, vol. 38, no 1, pp. 45–59. O’Cass A., Ngo L.V. (2011) Examining the firm’s value creation process: A managerial perspective of the firm’s value
offering strategy and performance. British Journal of Management, vol. 22, no 4, pp. 646–671. Ordanini A., Pasini P. (2008) Service co-production and value co-creation: The case for a service-oriented architecture
(SOA). European Management Journal, vol. 26, no 5, pp. 289–297. O’Regan N. (2012) Entrepreneurship and innovation: Overview. Strategic Change, vol. 21, no 5–6, pp. 193–198. DOI:
10.1002/jsc.1903Ltd.Parry G., Bustinza O.F., Vendrell-Herrero F. (2012) Servitisation and value co-production in the UK music
industry: An empirical study of consumer attitudes. International Journal of Production Economics, vol. 135, no 1, pp. 320–332.
Payne A., Holt S. (2001) Diagnosing customer value: Integrating the value process and relationship marketing. British Journal of Management, vol. 12, no 7, pp. 159–182.
Pieterse J.N. (2009) Globalization and culture: Global mélange, London: Rowman & Littlefield Publishers. Prahalad C.K., Ramaswamy V. (2000) Co-opting customer competence. Harvard Business Review, vol. 78, no 1,
pp. 79–87.Ritzer G. (2003) Rethinking globalization: Glocalization/grobalization and something/nothing. Sociological Theory,
vol. 21, no 3, pp. 193–209. Robertson R., Khondker H.H. (1998) Discourses of globalization. International Sociology, vol. 13, no 1, pp. 25–40. Rugman A.M. (2009) Theoretical aspects of MNEs from emerging markets. Emerging multinationals in emerging
markets (eds. R. Ramamurti, J.V. Singh), Cambridge: Cambridge University Press, pp. 42–63.Rugman A.M., Oh C.H. (2008) Korea’s multinationals in a regional world. Journal of World Business, vol. 43, no 1,
pp. 5–15.Rugman A.M., Verbeke A. (2003) Regional multinationals and triad strategy. Leadership in international business
education and research (Series: Research in global strategic management, vol. 8) (ed. A.M. Rugman), London: Emerald Group Publishing, pp. 253–268.
Schmid S., Kotulla T. (2011) 50 years of research on international standardization and adaptation: From a systematic literature analysis to a theoretical framework. International Business Review, vol. 20, no 5, pp. 491–507.
Singer M., Donoso P. (2008) Upstream or downstream in the value chain? Journal of Business Research, vol. 61, no 6, pp. 669–677.
Sirmon D.G., Hitt M.A., Ireland R.D. (2007) Managing firm resources in dynamic environments to create value: Looking inside the black box. Academy of Management Review, vol. 32, no 1, pp. 273–292.

2016 Vol. 10 No 1 FORESIGHT AND STI GOVERNANCE 29
Srivastava R.K., Fahey L., Christensen H.K. (2001) The resource-based view and marketing: The role of market-based assets in gaining competitive advantage. Journal of Management, vol. 27, no 6, pp. 777–802.
Stokes M. (2004) Music and the global order. Annual Review of Anthropology, vol. 33, pp. 47–72.Swatman P.M.C., Krueger C., Van Der Beek K. (2006) The changing digital content landscape: An evaluation of
e-business model development in European online news and music. Internet Research, vol. 16, no 1, pp. 53–80. Vandermerwe S., Rada J. (1988) Servitization of Business: Adding Value by Adding Services. European Management
Journal, vol. 6, pp. 314–324. Available at: http://dx.doi.org/10.1016/0263-2373(88)90033‐3, accessed 14.08.2015.Vargo S.L., Lusch R.F. (2004) Evolving to a new dominant logic for marketing. Journal of Marketing, vol. 68, no 1,
pp. 1–17. Vargo S.L., Lusch R.F. (2008) From goods to service(s): Divergences and convergences of logics. Industrial Marketing
Management, vol. 37, no 3, pp. 254–259.Wise R., Baumgartner P. (1999) Go downstream. Harvard Business Review, vol. 77, no 5, pp. 133–141.Yip G. (2003) Total global strategy II, Prentice Hall, Upper Saddle River, NJ: Pearson Education International.
Parry G. et al., pp. 16–29

30 FORESIGHT AND STI GOVERNANCE Vol. 10 No 1 2016
Innovation and Economy
INNOVATION AND ECONOMY
2016 Vol. 10 No 1 FORESIGHT AND STI GOVERNANCE 31
Quadruple Innovation Helix and Smart Specialization: Knowledge Production
and National Competitiveness
Abstract
Professor, School of Business, The George Washington University,Address: 2201 G Street, NW, Duquès Hall, Washington, D.C. 20052, USA. E-mail: [email protected]
Elias Carayannis
Investing more in research, innovation and entrepreneurship is at the heart of Europe 2020 and the only way to achieve smart, sustainable, and inclusive
growth. Smart specialization emerges as a key element for place-based innovation policies. The paper explains the linkage between knowledge creation, innovation output and enhancing regional and national competitiveness. We present the six major steps that every nation/region should follow to establish a smart specialization strategy based on the basic principles as described in the EU Research and Innovation Strategies for Smart Specialization (RIS3), accompanied by some examples of excellence from the Nordic countries.
Special emphasis is paid to issues of applying the Quadruple Helix approach in the context of RIS3. This
concept extends the triple helix paradigm by presuming that society is a key actor in innovation processes along with academia, industry, and government. The society is frequently the end user of innovation and thus has a strong influence on the generation of knowledge and technologies via its demand and user function.
Our analysis allows concluding that a quadruple helix approach is suitable for developing smart specialization strategies despite the greater efforts this entails. There is an urgent need to reconsider measures to keep the momentum generated in the original initiative and demonstrate the value of this exercise. Furthermore, there is a growing need to measure the impact and quantify the value of smart specialization.
Faculty Associate Professor, School of Production Engineering and Management, Technical University of Crete. Address: University Campus, Kounoupidiana, 73100, Chania, Greece. E-mail: [email protected]
Evangelos Grigoroudis
Keywords: Smart Specialization Strategy; Innovation- Productivity-Competitiveness; Quadruple Innovation Helix; Mode 3 Knowledge; 3C’s; SKARSE; RIS3
DOI: 10.17323/1995-459x.2016.1.31.42
Citation: Carayannis E., Grigoroudis E. (2016) Quadruple Innovation Helix and Smart Specialization: Knowledge Production and National Competitiveness. Foresight and STI Governance, vol. 10, no 1, pp. 31–42. DOI: 10.17323/1995-459x.2016.1.31.42

32 FORESIGHT AND STI GOVERNANCE Vol. 10 No 1 2016
Innovation and Economy
The European Union has set out its vision for Europe’s social market economy in the Europe 2020 strategy which aims at confronting structural weaknesses through progress in three mutually reinforcing priorities [European Commission, 2012]:
• Smart growth, based on knowledge and innovation;• Sustainable growth, promoting a more resource efficient, greener and competitive economy;• Inclusive growth, fostering a high employment economy delivering economic, social and territorial
cohesion.Investing more in research, innovation and entrepreneurship is at the heart of Europe 2020 and formed a crucial part of Europe’s response to the economic crisis.The European Union involves many different countries and regions, each with its own special ecosystem for research, development and innovation, and with a distinct economic background and industrial structure. With the aim to develop regions, the European Union is actively promoting the development of smart specialization strategies by regions. A smart specialization strategy, however, needs to differentiate between regions and cannot be formulated on a national level alone. There might be significant differences between regions dedicated for international export or agriculture for instance. Instead, different regions face varying challenges and also possess unique abilities which a smart specialization strategy needs to take into account [Midtkandal, Sorvik, 2012]. Thus, being smart is not copying other regions’ great ideas, particularly if a region which is developing a specialization strategy differs significantly from the region from where the strategy originates. Essentially, the idea is to develop a strategy for one’s own region based on its strengths. Smart specialization strategies can be based on existing strategies, as long as they are made for the region in question and can be empirically proven to be accurate [Foray et al., 2012].The main aim of this paper is to explore the linkages between Innovation, Productivity and Competitiveness (IPC). Carayannis and Sagi emphasize that innovation and competitiveness are intrinsically unified; although one does not cause the other, both are necessary for competitiveness and for each other [Carayannis, Sagi, 2001]. We also explain the connection between knowledge creation, diffusion and innovation flow. According to Carayannis [Carayannis, 2001], ‘Mode 3’ knowledge system and Quadruple Innovation Helix models could serve as the foundation for diverse smart specialization strategies as they place a stronger focus on openness and cooperation in innovation, and in particular, the dynamically intertwined processes of co-opetition, co-evolution and co-specialization. The smart specialization approach is helping regions upgrade their research and innovation strategies based on a number of key principles including the implementation of multi-level governance. By applying a Quadruple Helix approach, regional policymakers are more likely to enable a place-based entrepreneurial process of discovery, which would then generate intensive experimentation and discoveries thus enhancing at the same time innovativeness [Carayannis et al., 2015; Gackstatter et al., 2014].The paper proceeds as follows. The first section discusses the mode 3 knowledge production system followed by an analysis of the interconnectedness of innovation, productivity and competitiveness. Then we introduce the shift from the Triple Helix to Quadruple Innovation Model and outline how the Quadruple Helix can be an architectural innovation blueprint to support regional innovation strategy-making. The concluding section discusses the principles of smart specialization.
Mode 3 Knowledge Production SystemThe emerging glocalization (globalisation — localisation) frontier of converging systems, networks and sectors of innovation occurs in the context of a knowledge economy and society. It is strongly driven by increasingly complex, non-linear, and dynamic processes of knowledge creation, diffusion and use which eventually create a challenge to re-conceptualize, if not re-invent, the ways and means of knowledge production, utilization and renewal but also storage and accessibility. Perceptions from different parts of the world and diverse human, socio-economic, technological, and cultural contexts are interwoven to generate an emerging new worldview on how specialized knowledge emerges. Such knowledge is embedded in a particular socio-technical context, and can serve as the unit
‘Smart Specialization Strategy’ means the national or regional innovation strategies which set priorities in order to build competitive advantage by developing and matching research and innovation strengths to business needs in order to address emerging opportunities and market developments in a coherent manner, while avoiding duplication and fragmentation of effort. A smart specialization strategy may take the form of, or be included in a national or regional research and innovation strategic policy framework.’Source: [European Commission, 2014].
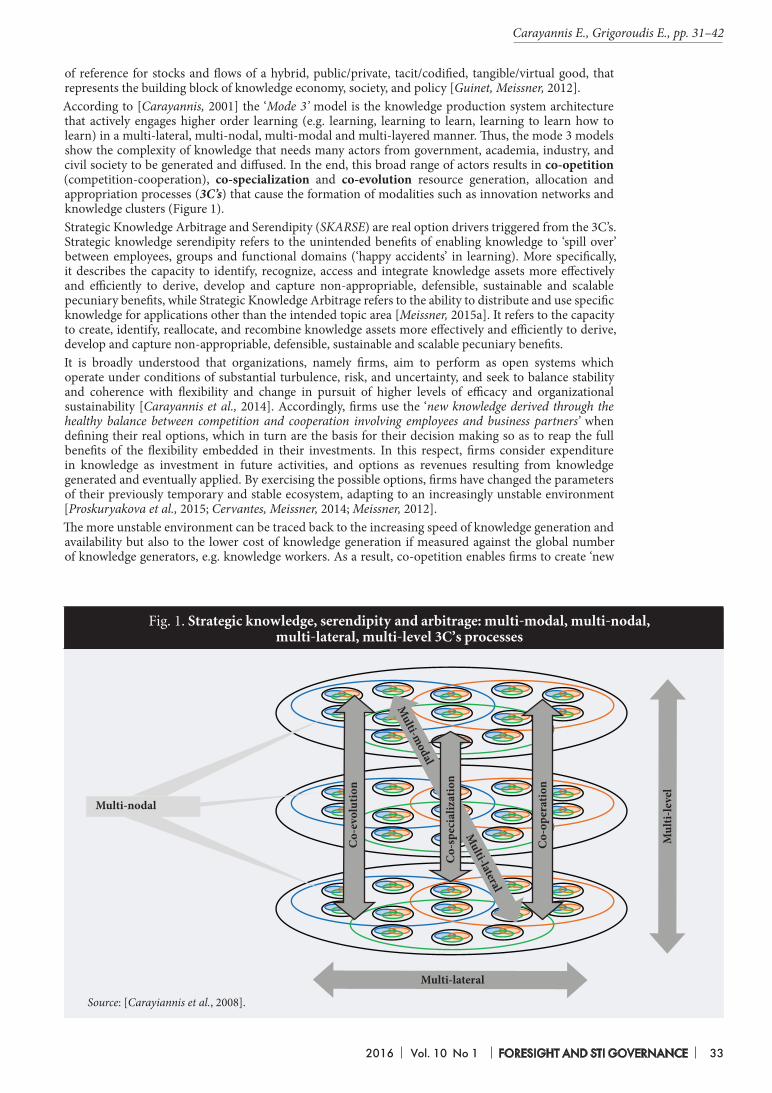
2016 Vol. 10 No 1 FORESIGHT AND STI GOVERNANCE 33
of reference for stocks and flows of a hybrid, public/private, tacit/codified, tangible/virtual good, that represents the building block of knowledge economy, society, and policy [Guinet, Meissner, 2012].According to [Carayannis, 2001] the ‘Mode 3’ model is the knowledge production system architecture that actively engages higher order learning (e.g. learning, learning to learn, learning to learn how to learn) in a multi-lateral, multi-nodal, multi-modal and multi-layered manner. Thus, the mode 3 models show the complexity of knowledge that needs many actors from government, academia, industry, and civil society to be generated and diffused. In the end, this broad range of actors results in co-opetition (competition-cooperation), co-specialization and co-evolution resource generation, allocation and appropriation processes (3C’s) that cause the formation of modalities such as innovation networks and knowledge clusters (Figure 1).Strategic Knowledge Arbitrage and Serendipity (SKARSE) are real option drivers triggered from the 3C’s. Strategic knowledge serendipity refers to the unintended benefits of enabling knowledge to ‘spill over’ between employees, groups and functional domains (‘happy accidents’ in learning). More specifically, it describes the capacity to identify, recognize, access and integrate knowledge assets more effectively and efficiently to derive, develop and capture non-appropriable, defensible, sustainable and scalable pecuniary benefits, while Strategic Knowledge Arbitrage refers to the ability to distribute and use specific knowledge for applications other than the intended topic area [Meissner, 2015a]. It refers to the capacity to create, identify, reallocate, and recombine knowledge assets more effectively and efficiently to derive, develop and capture non-appropriable, defensible, sustainable and scalable pecuniary benefits.It is broadly understood that organizations, namely firms, aim to perform as open systems which operate under conditions of substantial turbulence, risk, and uncertainty, and seek to balance stability and coherence with flexibility and change in pursuit of higher levels of efficacy and organizational sustainability [Carayannis et al., 2014]. Accordingly, firms use the ‘new knowledge derived through the healthy balance between competition and cooperation involving employees and business partners’ when defining their real options, which in turn are the basis for their decision making so as to reap the full benefits of the flexibility embedded in their investments. In this respect, firms consider expenditure in knowledge as investment in future activities, and options as revenues resulting from knowledge generated and eventually applied. By exercising the possible options, firms have changed the parameters of their previously temporary and stable ecosystem, adapting to an increasingly unstable environment [Proskuryakova et al., 2015; Cervantes, Meissner, 2014; Meissner, 2012]. The more unstable environment can be traced back to the increasing speed of knowledge generation and availability but also to the lower cost of knowledge generation if measured against the global number of knowledge generators, e.g. knowledge workers. As a result, co-opetition enables firms to create ‘new
Multi-nodal
Multi-lateral
Mul
ti-le
vel
Co-
oper
atio
n
Co-
spec
ializ
atio
n
Co-
evol
utio
nM
ulti-modal
Multi-lateral
Fig. 1. Strategic knowledge, serendipity and arbitrage: multi-modal, multi-nodal, multi-lateral, multi-level 3C’s processes
Source: [Carayiannis et al., 2008].
Carayannis E., Grigoroudis E., pp. 31–42
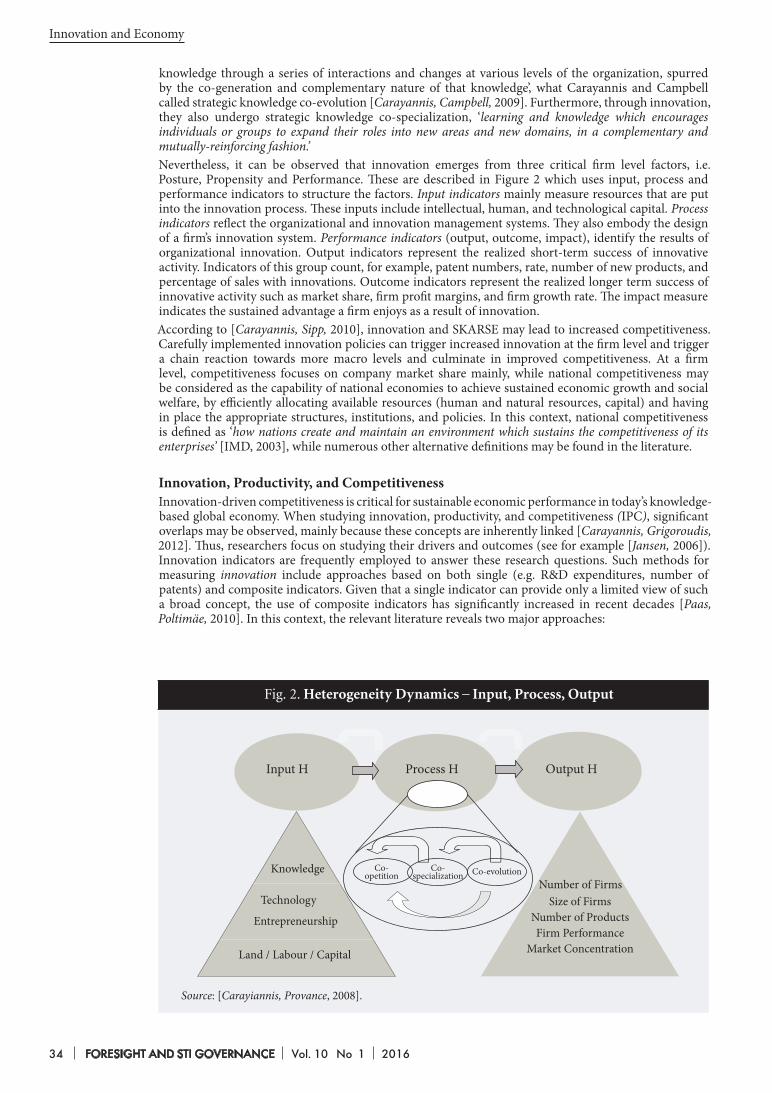
34 FORESIGHT AND STI GOVERNANCE Vol. 10 No 1 2016
Innovation and Economy
knowledge through a series of interactions and changes at various levels of the organization, spurred by the co-generation and complementary nature of that knowledge’, what Carayannis and Campbell called strategic knowledge co-evolution [Carayannis, Campbell, 2009]. Furthermore, through innovation, they also undergo strategic knowledge co-specialization, ‘learning and knowledge which encourages individuals or groups to expand their roles into new areas and new domains, in a complementary and mutually-reinforcing fashion.’Nevertheless, it can be observed that innovation emerges from three critical firm level factors, i.e. Posture, Propensity and Performance. These are described in Figure 2 which uses input, process and performance indicators to structure the factors. Input indicators mainly measure resources that are put into the innovation process. These inputs include intellectual, human, and technological capital. Process indicators reflect the organizational and innovation management systems. They also embody the design of a firm’s innovation system. Performance indicators (output, outcome, impact), identify the results of organizational innovation. Output indicators represent the realized short-term success of innovative activity. Indicators of this group count, for example, patent numbers, rate, number of new products, and percentage of sales with innovations. Outcome indicators represent the realized longer term success of innovative activity such as market share, firm profit margins, and firm growth rate. The impact measure indicates the sustained advantage a firm enjoys as a result of innovation.According to [Carayannis, Sipp, 2010], innovation and SKARSE may lead to increased competitiveness. Carefully implemented innovation policies can trigger increased innovation at the firm level and trigger a chain reaction towards more macro levels and culminate in improved competitiveness. At a firm level, competitiveness focuses on company market share mainly, while national competitiveness may be considered as the capability of national economies to achieve sustained economic growth and social welfare, by efficiently allocating available resources (human and natural resources, capital) and having in place the appropriate structures, institutions, and policies. In this context, national competitiveness is defined as ‘how nations create and maintain an environment which sustains the competitiveness of its enterprises’ [IMD, 2003], while numerous other alternative definitions may be found in the literature.
Innovation, Productivity, and CompetitivenessInnovation-driven competitiveness is critical for sustainable economic performance in today’s knowledge-based global economy. When studying innovation, productivity, and competitiveness (IPC), significant overlaps may be observed, mainly because these concepts are inherently linked [Carayannis, Grigoroudis, 2012]. Thus, researchers focus on studying their drivers and outcomes (see for example [Jansen, 2006]). Innovation indicators are frequently employed to answer these research questions. Such methods for measuring innovation include approaches based on both single (e.g. R&D expenditures, number of patents) and composite indicators. Given that a single indicator can provide only a limited view of such a broad concept, the use of composite indicators has significantly increased in recent decades [Paas, Poltimäe, 2010]. In this context, the relevant literature reveals two major approaches:
Input H Process H Output H
Co-specialization Co-evolutionKnowledge
Technology
Entrepreneurship
Land / Labour / Capital
Number of FirmsSize of Firms
Number of ProductsFirm Performance
Market Concentration
Fig. 2. Heterogeneity Dynamics – Input, Process, Output
Source: [Carayiannis, Provance, 2008].
Со-opetition
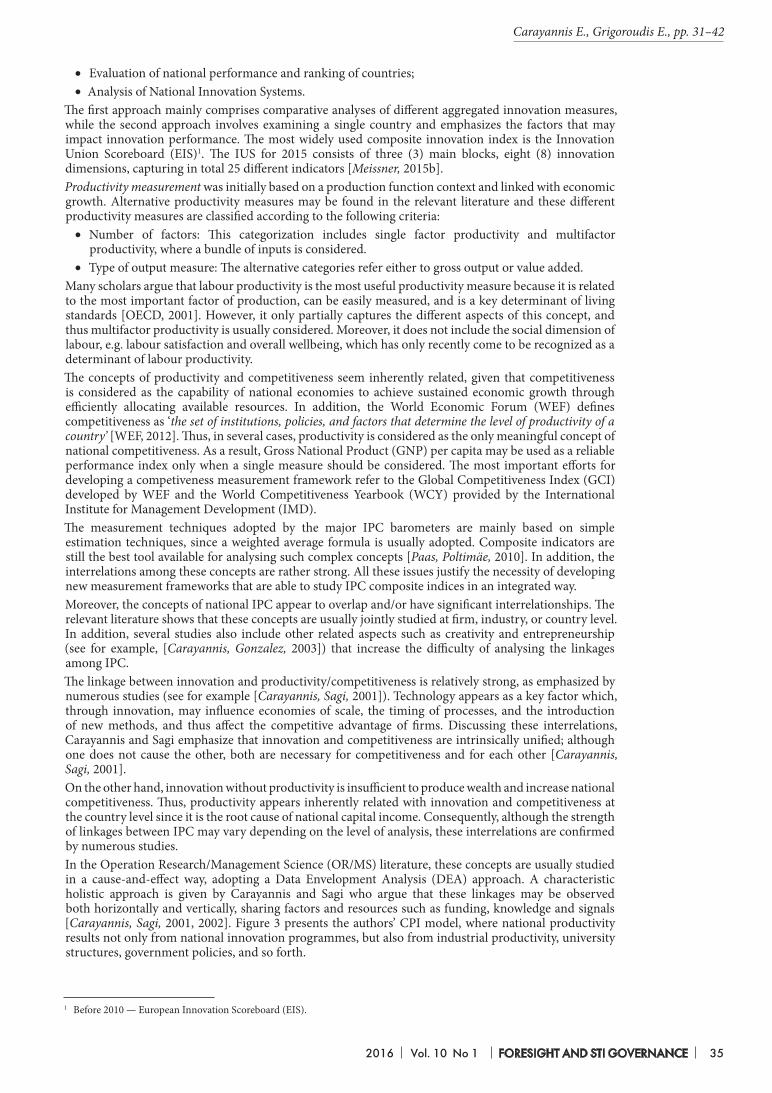
2016 Vol. 10 No 1 FORESIGHT AND STI GOVERNANCE 35
• Evaluation of national performance and ranking of countries;•Analysis of National Innovation Systems.
The first approach mainly comprises comparative analyses of different aggregated innovation measures, while the second approach involves examining a single country and emphasizes the factors that may impact innovation performance. The most widely used composite innovation index is the Innovation Union Scoreboard (EIS)1. The IUS for 2015 consists of three (3) main blocks, eight (8) innovation dimensions, capturing in total 25 different indicators [Meissner, 2015b].Productivity measurement was initially based on a production function context and linked with economic growth. Alternative productivity measures may be found in the relevant literature and these different productivity measures are classified according to the following criteria:• Number of factors: This categorization includes single factor productivity and multifactor
productivity, where a bundle of inputs is considered. • Type of output measure: The alternative categories refer either to gross output or value added.
Many scholars argue that labour productivity is the most useful productivity measure because it is related to the most important factor of production, can be easily measured, and is a key determinant of living standards [OECD, 2001]. However, it only partially captures the different aspects of this concept, and thus multifactor productivity is usually considered. Moreover, it does not include the social dimension of labour, e.g. labour satisfaction and overall wellbeing, which has only recently come to be recognized as a determinant of labour productivity. The concepts of productivity and competitiveness seem inherently related, given that competitiveness is considered as the capability of national economies to achieve sustained economic growth through efficiently allocating available resources. In addition, the World Economic Forum (WEF) defines competitiveness as ‘the set of institutions, policies, and factors that determine the level of productivity of a country’ [WEF, 2012]. Thus, in several cases, productivity is considered as the only meaningful concept of national competitiveness. As a result, Gross National Product (GNP) per capita may be used as a reliable performance index only when a single measure should be considered. The most important efforts for developing a competiveness measurement framework refer to the Global Competitiveness Index (GCI) developed by WEF and the World Competitiveness Yearbook (WCY) provided by the International Institute for Management Development (IMD).The measurement techniques adopted by the major IPC barometers are mainly based on simple estimation techniques, since a weighted average formula is usually adopted. Composite indicators are still the best tool available for analysing such complex concepts [Paas, Poltimäe, 2010]. In addition, the interrelations among these concepts are rather strong. All these issues justify the necessity of developing new measurement frameworks that are able to study IPC composite indices in an integrated way.Moreover, the concepts of national IPC appear to overlap and/or have significant interrelationships. The relevant literature shows that these concepts are usually jointly studied at firm, industry, or country level. In addition, several studies also include other related aspects such as creativity and entrepreneurship (see for example, [Carayannis, Gonzalez, 2003]) that increase the difficulty of analysing the linkages among IPC.The linkage between innovation and productivity/competitiveness is relatively strong, as emphasized by numerous studies (see for example [Carayannis, Sagi, 2001]). Technology appears as a key factor which, through innovation, may influence economies of scale, the timing of processes, and the introduction of new methods, and thus affect the competitive advantage of firms. Discussing these interrelations, Carayannis and Sagi emphasize that innovation and competitiveness are intrinsically unified; although one does not cause the other, both are necessary for competitiveness and for each other [Carayannis, Sagi, 2001].On the other hand, innovation without productivity is insufficient to produce wealth and increase national competitiveness. Thus, productivity appears inherently related with innovation and competitiveness at the country level since it is the root cause of national capital income. Consequently, although the strength of linkages between IPC may vary depending on the level of analysis, these interrelations are confirmed by numerous studies.In the Operation Research/Management Science (OR/MS) literature, these concepts are usually studied in a cause-and-effect way, adopting a Data Envelopment Analysis (DEA) approach. A characteristic holistic approach is given by Carayannis and Sagi who argue that these linkages may be observed both horizontally and vertically, sharing factors and resources such as funding, knowledge and signals [Carayannis, Sagi, 2001, 2002]. Figure 3 presents the authors’ CPI model, where national productivity results not only from national innovation programmes, but also from industrial productivity, university structures, government policies, and so forth.
1 Before 2010 — European Innovation Scoreboard (EIS).
Carayannis E., Grigoroudis E., pp. 31–42
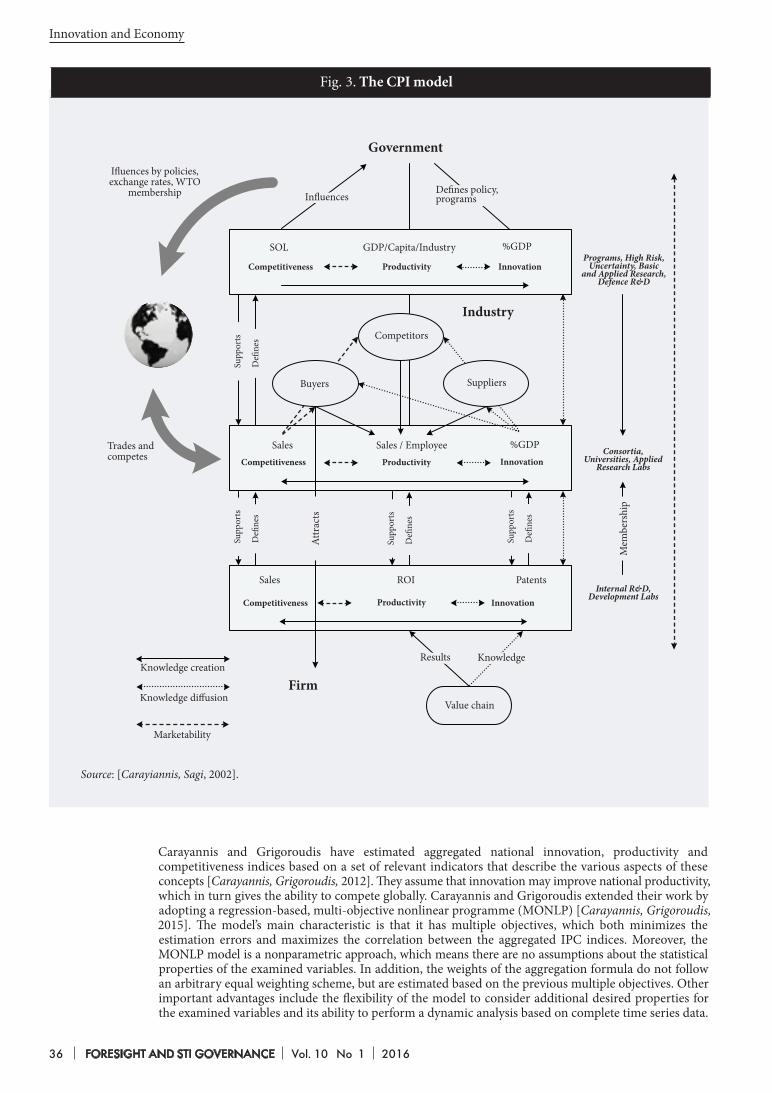
36 FORESIGHT AND STI GOVERNANCE Vol. 10 No 1 2016
Innovation and Economy
Carayannis and Grigoroudis have estimated aggregated national innovation, productivity and competitiveness indices based on a set of relevant indicators that describe the various aspects of these concepts [Carayannis, Grigoroudis, 2012]. They assume that innovation may improve national productivity, which in turn gives the ability to compete globally. Carayannis and Grigoroudis extended their work by adopting a regression-based, multi-objective nonlinear programme (MONLP) [Carayannis, Grigoroudis, 2015]. The model’s main characteristic is that it has multiple objectives, which both minimizes the estimation errors and maximizes the correlation between the aggregated IPC indices. Moreover, the MONLP model is a nonparametric approach, which means there are no assumptions about the statistical properties of the examined variables. In addition, the weights of the aggregation formula do not follow an arbitrary equal weighting scheme, but are estimated based on the previous multiple objectives. Other important advantages include the flexibility of the model to consider additional desired properties for the examined variables and its ability to perform a dynamic analysis based on complete time series data.
Fig. 3. The CPI model
Government
Industry
Firm
Ifluences by policies, exchange rates, WTO
membership
Trades and competes
Knowledge creation
Knowledge diffusion
Marketability
Value chain
InfluencesDefines policy, programs
SOL GDP/Capita/Industry %GDP
Sales
Competitors
Sales / Employee %GDPCompetitiveness Innovation
Competitiveness Innovation
Sales PatentsROI
Results Knowledge
Competitiveness Productivity InnovationInternal R&D,
Development Labs
Consortia, Universities, Applied
Research Labs
Programs, High Risk, Uncertainty, Basic
and Applied Research, Defence R&D
Attr
acts
Supp
orts
Defi
nes
Supp
orts
Defi
nes
Supp
orts
Defi
nes
Supp
orts
Defi
nes
Source: [Carayiannis, Sagi, 2002].
Buyers Suppliers
Productivity
Productivity
Mem
bers
hip
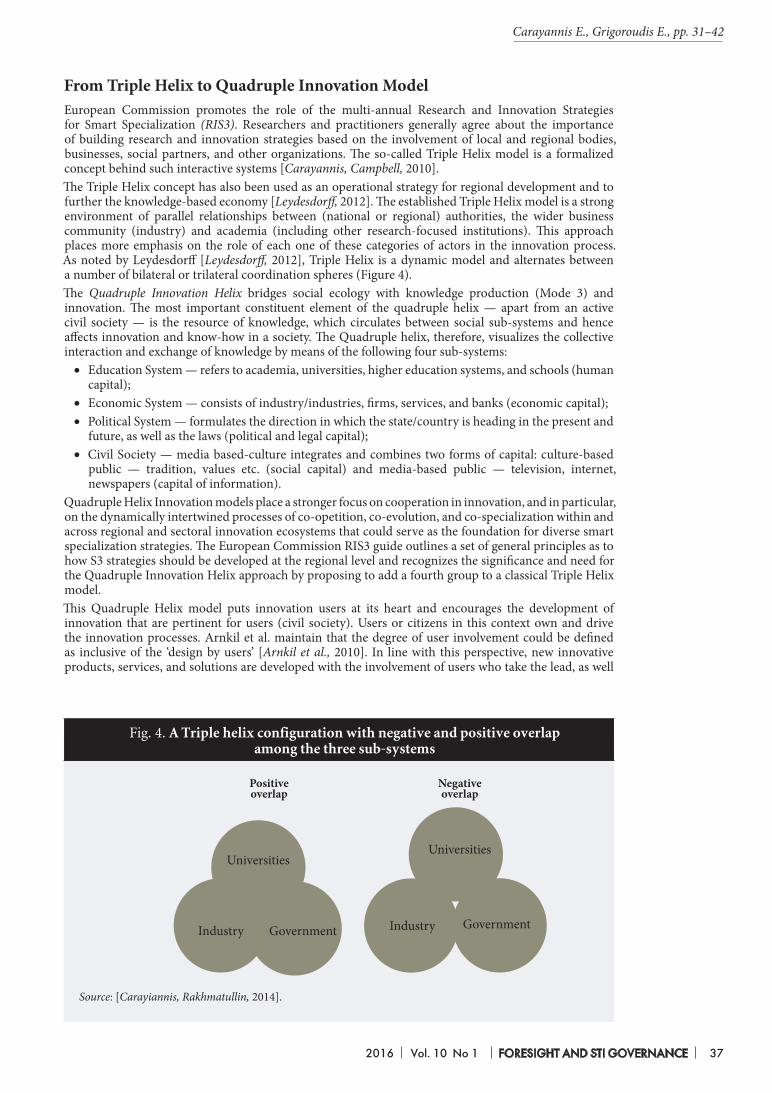
2016 Vol. 10 No 1 FORESIGHT AND STI GOVERNANCE 37
From Triple Helix to Quadruple Innovation ModelEuropean Commission promotes the role of the multi-annual Research and Innovation Strategies for Smart Specialization (RIS3). Researchers and practitioners generally agree about the importance of building research and innovation strategies based on the involvement of local and regional bodies, businesses, social partners, and other organizations. The so-called Triple Helix model is a formalized concept behind such interactive systems [Carayannis, Campbell, 2010].The Triple Helix concept has also been used as an operational strategy for regional development and to further the knowledge-based economy [Leydesdorff, 2012]. The established Triple Helix model is a strong environment of parallel relationships between (national or regional) authorities, the wider business community (industry) and academia (including other research-focused institutions). This approach places more emphasis on the role of each one of these categories of actors in the innovation process. As noted by Leydesdorff [Leydesdorff, 2012], Triple Helix is a dynamic model and alternates between a number of bilateral or trilateral coordination spheres (Figure 4).The Quadruple Innovation Helix bridges social ecology with knowledge production (Mode 3) and innovation. The most important constituent element of the quadruple helix — apart from an active civil society — is the resource of knowledge, which circulates between social sub-systems and hence affects innovation and know-how in a society. The Quadruple helix, therefore, visualizes the collective interaction and exchange of knowledge by means of the following four sub-systems:• Education System — refers to academia, universities, higher education systems, and schools (human
capital);• Economic System — consists of industry/industries, firms, services, and banks (economic capital);• Political System — formulates the direction in which the state/country is heading in the present and
future, as well as the laws (political and legal capital);• Civil Society — media based-culture integrates and combines two forms of capital: culture-based
public — tradition, values etc. (social capital) and media-based public — television, internet, newspapers (capital of information).
Quadruple Helix Innovation models place a stronger focus on cooperation in innovation, and in particular, on the dynamically intertwined processes of co-opetition, co-evolution, and co-specialization within and across regional and sectoral innovation ecosystems that could serve as the foundation for diverse smart specialization strategies. The European Commission RIS3 guide outlines a set of general principles as to how S3 strategies should be developed at the regional level and recognizes the significance and need for the Quadruple Innovation Helix approach by proposing to add a fourth group to a classical Triple Helix model.This Quadruple Helix model puts innovation users at its heart and encourages the development of innovation that are pertinent for users (civil society). Users or citizens in this context own and drive the innovation processes. Arnkil et al. maintain that the degree of user involvement could be defined as inclusive of the ‘design by users’ [Arnkil et al., 2010]. In line with this perspective, new innovative products, services, and solutions are developed with the involvement of users who take the lead, as well
UniversitiesUniversities
Industry Government GovernmentIndustry
Fig. 4. A Triple helix configuration with negative and positive overlap among the three sub-systems
Source: [Carayiannis, Rakhmatullin, 2014].
Positive overlap
Negative overlap
Carayannis E., Grigoroudis E., pp. 31–42
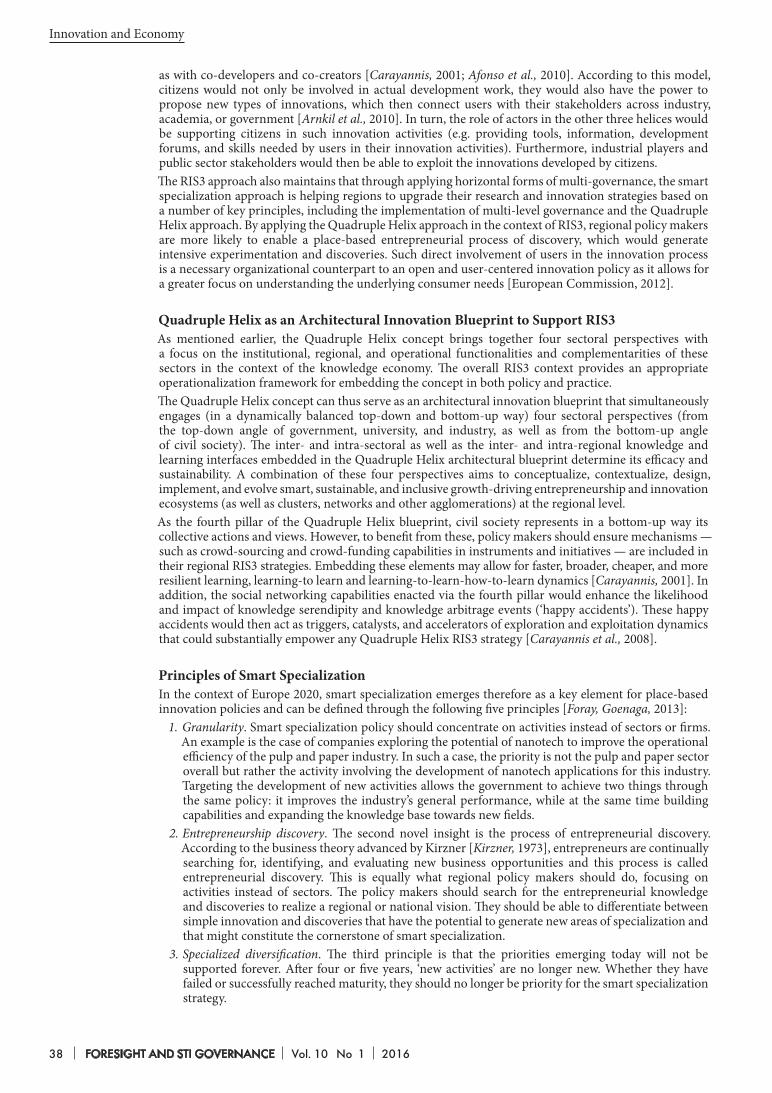
38 FORESIGHT AND STI GOVERNANCE Vol. 10 No 1 2016
Innovation and Economy
as with co-developers and co-creators [Carayannis, 2001; Afonso et al., 2010]. According to this model, citizens would not only be involved in actual development work, they would also have the power to propose new types of innovations, which then connect users with their stakeholders across industry, academia, or government [Arnkil et al., 2010]. In turn, the role of actors in the other three helices would be supporting citizens in such innovation activities (e.g. providing tools, information, development forums, and skills needed by users in their innovation activities). Furthermore, industrial players and public sector stakeholders would then be able to exploit the innovations developed by citizens.The RIS3 approach also maintains that through applying horizontal forms of multi-governance, the smart specialization approach is helping regions to upgrade their research and innovation strategies based on a number of key principles, including the implementation of multi-level governance and the Quadruple Helix approach. By applying the Quadruple Helix approach in the context of RIS3, regional policy makers are more likely to enable a place-based entrepreneurial process of discovery, which would generate intensive experimentation and discoveries. Such direct involvement of users in the innovation process is a necessary organizational counterpart to an open and user-centered innovation policy as it allows for a greater focus on understanding the underlying consumer needs [European Commission, 2012].
Quadruple Helix as an Architectural Innovation Blueprint to Support RIS3As mentioned earlier, the Quadruple Helix concept brings together four sectoral perspectives with a focus on the institutional, regional, and operational functionalities and complementarities of these sectors in the context of the knowledge economy. The overall RIS3 context provides an appropriate operationalization framework for embedding the concept in both policy and practice.The Quadruple Helix concept can thus serve as an architectural innovation blueprint that simultaneously engages (in a dynamically balanced top-down and bottom-up way) four sectoral perspectives (from the top-down angle of government, university, and industry, as well as from the bottom-up angle of civil society). The inter- and intra-sectoral as well as the inter- and intra-regional knowledge and learning interfaces embedded in the Quadruple Helix architectural blueprint determine its efficacy and sustainability. A combination of these four perspectives aims to conceptualize, contextualize, design, implement, and evolve smart, sustainable, and inclusive growth-driving entrepreneurship and innovation ecosystems (as well as clusters, networks and other agglomerations) at the regional level.As the fourth pillar of the Quadruple Helix blueprint, civil society represents in a bottom-up way its collective actions and views. However, to benefit from these, policy makers should ensure mechanisms — such as crowd-sourcing and crowd-funding capabilities in instruments and initiatives — are included in their regional RIS3 strategies. Embedding these elements may allow for faster, broader, cheaper, and more resilient learning, learning-to learn and learning-to-learn-how-to-learn dynamics [Carayannis, 2001]. In addition, the social networking capabilities enacted via the fourth pillar would enhance the likelihood and impact of knowledge serendipity and knowledge arbitrage events (‘happy accidents’). These happy accidents would then act as triggers, catalysts, and accelerators of exploration and exploitation dynamics that could substantially empower any Quadruple Helix RIS3 strategy [Carayannis et al., 2008].
Principles of Smart SpecializationIn the context of Europe 2020, smart specialization emerges therefore as a key element for place-based innovation policies and can be defined through the following five principles [Foray, Goenaga, 2013]:
1. Granularity. Smart specialization policy should concentrate on activities instead of sectors or firms. An example is the case of companies exploring the potential of nanotech to improve the operational efficiency of the pulp and paper industry. In such a case, the priority is not the pulp and paper sector overall but rather the activity involving the development of nanotech applications for this industry. Targeting the development of new activities allows the government to achieve two things through the same policy: it improves the industry’s general performance, while at the same time building capabilities and expanding the knowledge base towards new fields.
2. Entrepreneurship discovery. The second novel insight is the process of entrepreneurial discovery. According to the business theory advanced by Kirzner [Kirzner, 1973], entrepreneurs are continually searching for, identifying, and evaluating new business opportunities and this process is called entrepreneurial discovery. This is equally what regional policy makers should do, focusing on activities instead of sectors. The policy makers should search for the entrepreneurial knowledge and discoveries to realize a regional or national vision. They should be able to differentiate between simple innovation and discoveries that have the potential to generate new areas of specialization and that might constitute the cornerstone of smart specialization.
3. Specialized diversification. The third principle is that the priorities emerging today will not be supported forever. After four or five years, ‘new activities’ are no longer new. Whether they have failed or successfully reached maturity, they should no longer be priority for the smart specialization strategy.
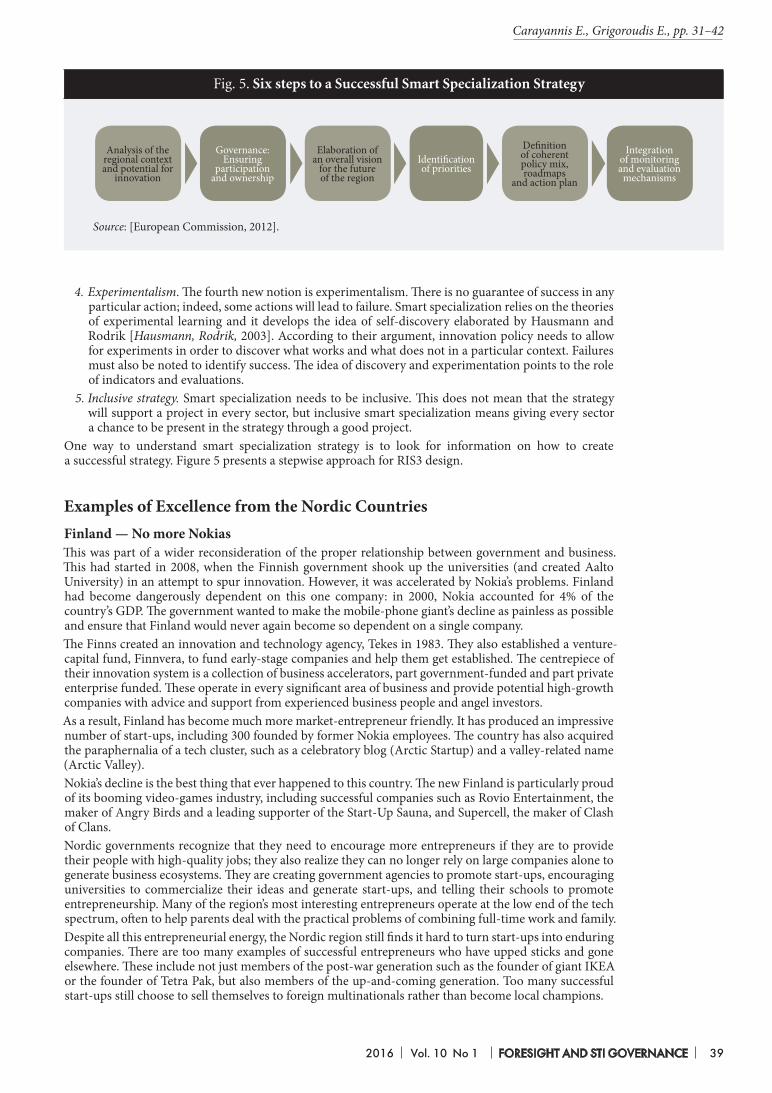
2016 Vol. 10 No 1 FORESIGHT AND STI GOVERNANCE 39
4. Experimentalism. The fourth new notion is experimentalism. There is no guarantee of success in any particular action; indeed, some actions will lead to failure. Smart specialization relies on the theories of experimental learning and it develops the idea of self-discovery elaborated by Hausmann and Rodrik [Hausmann, Rodrik, 2003]. According to their argument, innovation policy needs to allow for experiments in order to discover what works and what does not in a particular context. Failures must also be noted to identify success. The idea of discovery and experimentation points to the role of indicators and evaluations.
5. Inclusive strategy. Smart specialization needs to be inclusive. This does not mean that the strategy will support a project in every sector, but inclusive smart specialization means giving every sector a chance to be present in the strategy through a good project.
One way to understand smart specialization strategy is to look for information on how to create a successful strategy. Figure 5 presents a stepwise approach for RIS3 design.
Examples of Excellence from the Nordic CountriesFinland — No more NokiasThis was part of a wider reconsideration of the proper relationship between government and business. This had started in 2008, when the Finnish government shook up the universities (and created Aalto University) in an attempt to spur innovation. However, it was accelerated by Nokia’s problems. Finland had become dangerously dependent on this one company: in 2000, Nokia accounted for 4% of the country’s GDP. The government wanted to make the mobile-phone giant’s decline as painless as possible and ensure that Finland would never again become so dependent on a single company.The Finns created an innovation and technology agency, Tekes in 1983. They also established a venture-capital fund, Finnvera, to fund early-stage companies and help them get established. The centrepiece of their innovation system is a collection of business accelerators, part government-funded and part private enterprise funded. These operate in every significant area of business and provide potential high-growth companies with advice and support from experienced business people and angel investors.As a result, Finland has become much more market-entrepreneur friendly. It has produced an impressive number of start-ups, including 300 founded by former Nokia employees. The country has also acquired the paraphernalia of a tech cluster, such as a celebratory blog (Arctic Startup) and a valley-related name (Arctic Valley).Nokia’s decline is the best thing that ever happened to this country. The new Finland is particularly proud of its booming video-games industry, including successful companies such as Rovio Entertainment, the maker of Angry Birds and a leading supporter of the Start-Up Sauna, and Supercell, the maker of Clash of Clans. Nordic governments recognize that they need to encourage more entrepreneurs if they are to provide their people with high-quality jobs; they also realize they can no longer rely on large companies alone to generate business ecosystems. They are creating government agencies to promote start-ups, encouraging universities to commercialize their ideas and generate start-ups, and telling their schools to promote entrepreneurship. Many of the region’s most interesting entrepreneurs operate at the low end of the tech spectrum, often to help parents deal with the practical problems of combining full-time work and family.Despite all this entrepreneurial energy, the Nordic region still finds it hard to turn start-ups into enduring companies. There are too many examples of successful entrepreneurs who have upped sticks and gone elsewhere. These include not just members of the post-war generation such as the founder of giant IKEA or the founder of Tetra Pak, but also members of the up-and-coming generation. Too many successful start-ups still choose to sell themselves to foreign multinationals rather than become local champions.
Analysis of the regional context and potential for
innovation
Governance: Ensuring
participation and ownership
Elaboration of an overall vision
for the future of the region
Identification of priorities
Definition of coherent policy mix, roadmaps
and action plan
Integration of monitoring and evaluation mechanisms
Fig. 5. Six steps to a Successful Smart Specialization Strategy
Source: [European Commission, 2012].
Carayannis E., Grigoroudis E., pp. 31–42

40 FORESIGHT AND STI GOVERNANCE Vol. 10 No 1 2016
Innovation and Economy
Nevertheless, there is reason to hope that the entrepreneurial boom will also produce a new generation of global champions. One example is Rovio Entertainment, with the game Angry Birds. Having produced one big hit, most games companies would have started looking for the next one, but instead Rovio set about turning Angry Birds into a brand and extending its reach. It drew up licensing agreements with a range of companies to make Angry Birds-branded products, including toys, chocolate, and theme parks. It raised capital from outside investors such as Microsoft, which chipped in USD 42 million. Rovio now has 500 employees in Finland and had a turnover of USD 100 million in 2011 [Carayannis, Rakhmatullin, 2014].
The Ostrobothnia case in FinlandA number of attempts have been made by researchers and policy makers to evaluate different aspects of the Triple Helix model in the context of regional innovation systems, and this can indeed be extended to cover the Quadruple Helix concept.One example is a recent exercise carried out by the Regional Council of Ostrobothnia in Finland that initiated a project to develop a method for measuring Quadruple Helix connectedness and gaps [Virkkala et al., 2014]. The results of this study would then be used as factual evidence for improving RIS multi-level governance. The S3 Guide focuses on connectedness within the Quadruple Helix approach, which it uses as a conceptual framework for good regional governance, enabling a coherent approach. In this regard, smart specialization (or S3) presents itself not just as a continuation of what we have done already under the umbrella of RIS but rather as a way of questioning existing RIS practices and removing dysfunctional policy arrangements, which hinder growth and development.Therefore, one of the objectives of this guideline is to develop a self-assessment and evaluation tool, which could be used by regional policy makers to measure their region’s progress in adopting, adapting and deploying the Quadruple Helix (QH) approach in their RIS3. The Fifth Report on Economic, Social and Territorial Cohesion prepared by the European Commission [European Commission, 2010] also suggested improving monitoring and evaluation systems across the EU to track performance and to help fine-tune efforts as needed to guarantee that pre-defined objectives are achieved in the most effective manner. This requires a clear strategic vision of what the programme aims to achieve and how success will be recognized and measured. Furthermore, it also requires a greater recourse to rigorous evaluation methods — both longitudinal and latitudinal, i.e. cross-sectoral, multi-level, and across time and space. Such evaluation approaches would help make continuous improvements when formulating and implementing QH modalities and systems within the RIS3 context [Carayannis, Rakhmatullin, 2014].
ConclusionThe paper looked at the relationship between the quadruple innovation helix and the smart specialization approaches towards knowledge production and enhancing regional and national competitiveness. National and regional innovation systems, however, go reasonably beyond the knowledge and technology production as postulated in the triple helix paradigm. The latter presumes that knowledge and technology originate from the partially overlapping activities of academia, industry, and government. In addition, the paradigm states that knowledge and technology are transferred to industry, which is ultimately the main driver of innovation. The weakness of this approach is found in the absence of the public sphere, namely society which is frequently the end user of innovation and thus has a strong influence on the generation of knowledge and technologies via its demand and user function. Therefore, the quadruple helix extends the triple helix paradigm by incorporating the societal function, which serves as a source for understanding the circulation of knowledge and technology for innovation diffusion and application. In addition, smart specialization strategies frequently developed for regional economic development and innovation competitiveness need to be extended towards the societal dimension to give them more long-term impact. Accordingly, the approaches towards developing regional strategies need to be reconsidered and at least partially redone mainly because of changing demands, in both quantitative and qualitative terms.Regional strategies typically focus on the regional capabilities to innovate. Nevertheless, the fields of application are often markets, which are not limited to the regional dimension but are increasingly global. Hence it is essential when developing regional strategies to take account of societal developments more broadly, beyond the regional level only. In this respect, developing regional strategies becomes a more complex and challenging task for the following reasons:•A regional development strategy typically involves SWOT analysis of regional innovation related
competences. Including the societal dimension in the regional analysis requires additional competences in societal demand analysis and profound knowledge of different societal characteristics in diverse markets, which is frequently difficult to obtain at regional level;
• The value of including global societal developments into regional strategy development needs to be clearly communicated to the related regional actors and stakeholders. Frequently, this is an issue
2016 Vol. 10 No 1 FORESIGHT AND STI GOVERNANCE 41
which is hardly recognized by regional stakeholders who believe in naturally bringing their region forward without regard for developments in other places;
•Any regional innovation strategy requires updating, which imposes additional threat on the regional actors. When such exercise is done for the first time, regional stakeholders are typically supportive and contribute; yet often, this momentum is lost when it comes to updating or repeating the exercise.
In the final analysis, we can conclude that a quadruple helix approach is suitable for developing smart specialization strategies despite the greater efforts this entails. Furthermore, there is an urgent need to reconsider measures to keep the momentum generated in the original initiative and demonstrate the value of this exercise. Finally, there is a growing need to measure the impact and quantify the value of from smart specialization.
Afonso O., Monteiro S., Thompson M.J.R. (2010) A growth model for the Quadruple Helix innovation theory (NIPE Working Paper 12), Braga: Universidade do Minho.
Arnkil R., Järvensivu A., Koski P., Piirainen T. (2010) Exploring Quadruple Helix: Outlining user-oriented innovation models (Final Report on Quadruple Helix Research for the CLIQ project, Working Papers 85/2010), Tampere: University of Tampere.
Carayannis E., Sagi J. (2001) New vs old economy: Insights on competitiveness in the global IT industry. Technovation, vol. 21, no 8, pp. 501–514.
Carayannis E.G. (2001) The strategic management of technological learning: Learning to learn and learning to learn-how-to-learn as drivers of strategic choice and firm performance in global, technology-driven markets, Boca Raton, FL: CRC Press.
Carayannis E.G., Campbell D.F.J. (2009) ‘Mode 3’ and ‘Quadruple Helix’: Toward a 21st century fractal innovation ecosystem. International Journal of Technology Management, vol. 46, no 3/4, pp. 201–234.
Carayannis E.G., Campbell D.F.J. (2010) Triple Helix, Quadruple Helix and Quintuple Helix, and how do knowledge, innovation and the environment relate to each other? A proposed framework for a transdisciplinary analysis of sustainable development and social ecology. International Journal of Social Ecology and Sustainable Development, vol. 1, no 1, pp. 41–69.
Carayannis E.G., Gonzalez E. (2003) Creativity and innovation = Competitiveness? When, how and why? The International Handbook on Innovation (ed. L.V. Shavinina), Boston: Elsevier Science, pp. 587–605.
Carayannis E.G., Grigoroudis E. (2012) Linking innovation, productivity and competitiveness: Implications for policy and practice. Journal of Technology Transfer, vol. 39, no 2, pp. 199–218.
Carayannis E.G., Grigoroudis E. (2015) Using multiobjective mathematical programming to link national competitiveness, productivity and innovation. Annals of Operations Research (forthcoming).
Carayannis E.G., Grigoroudis E., Sindakis S., Walter C. (2014) Business Model Innovation as antecedent of sustainable enterprise excellence and resilience. Journal of the Knowledge Economy, vol. 5, no 3, pp. 440–463.
Carayannis E.G., Kaloudis A., Mariussen A. (2008) Diversity in the knowledge economy and society: Heterogeneity, innovation and entrepreneurship, Cheltenham: Edward Elgar Publishing.
Carayannis E.G., Meissner D., Edelkina A. (2015) Targeted innovation policy and practice intelligence (TIP2E): Concepts and implications for theory, policy and practice. The Journal of Technology Transfer (forthcoming). DOI: 10.1007/s10961-015-9433-8.
Carayannis E.G., Provance M. (2008) Measuring firm innovativeness: Towards a composite innovation index built on firm innovative posture, propensity and performance attributes. International Journal of Innovation and Regional Development, vol. 1, no 1, pp. 90–107.
Carayannis E.G., Rakhmatullin R. (2014) The Quadruple/Quintuple Innovation Helixes and Smart Specialization Strategies for sustainable and inclusive growth in Europe and beyond. Journal of the Knowledge Economy, vol. 5, no 2, pp. 212–239.
Carayannis E.G., Sagi J. (2002) Exploiting opportunities of the new economy: Developing nations in support of the ICT industry. Technovation, vol. 22, no 8, pp. 517–524.
Carayannis E.G., Sipp C.M. (2010) Why, when and how are real options used in strategic technology venturing? Journal of the Knowledge Economy, vol. 1, no 2, pp. 70–85.
Cervantes M., Meissner D. (2014) Commercialising Public Research under the Open Innovation Model: New Trends. Foresight-Russia, vol. 8, no 3, pp. 70–81.
European Commission (2010) The fifth report on economic, social and territorial cohesion: The future of cohesion, Brussels: European Commission.
European Commission (2012) RIS3 guide, Brussels: European Commission.European Commission (2014) Smart specialization and Europe’s growth agenda, Brussels: European Commission.Foray D., Goddard J., Beldarrain X.G., Landabaso M., McCann P., Morgan K., Nauwelaers C., Ortega‐Argilés R.,
Mulatero F. (2012) Guide to Research and Innovation Strategies for Smart Specialisations (RIS 3), Brussels: European Commission.
Foray D., Goenaga X. (2013) The goals of Smart Specialization: S3 policy brief series (JRC Scientific and Policy Reports), Brussels: European Commission.
Gackstatter S., Kotsemir M., Meissner D. (2014) Building an Innovation-Driven Economy — The Case of BRIC and GCC Countries. Foresight, vol. 16, no 4, pp. 293–308.
References
Carayannis E., Grigoroudis E., pp. 31–42

42 FORESIGHT AND STI GOVERNANCE Vol. 10 No 1 2016
Innovation and Economy
Guinet J., Meissner D. (2012) Otkrytye innovatsii: effekty dlya korporativnykh strategii, gosudarstvennoi politiki i mezhdunarodnogo «peretoka» issledovanii i razrabotok [Open Innovation: Implications for Corporate Strategies, Government Policy and International R&D Spillovers]. Foresight-Russia, vol. 6, no 1, pp. 26–36 (in Russian).
Hausmann R., Rodrik D. (2003) Economic development as self-discovery. Journal of Development Economics, vol. 72, no 2, pp. 603–633.
IMD (2003) World competitiveness yearbook 2003, Lausanne: Institute for Management Development.Jansen J.J.P. (2006) Exploratory innovation, exploitative innovation and performance: Effects of organizational
antecedents and environmental moderators. Management Science, vol. 52, no 11, pp. 1661–1674.Kirzner I.M. (1973) Competition and Entrepreneurship, Chicago: The University of Chicago Press.Leydesdorff L. (2012) The Triple Helix, Quadruple Helix, …, and an N-Tuple of Helices: Explanatory models for
analyzing the knowledge-based economy. Journal of the Knowledge Economy, vol. 3, no 1, pp. 25–35.Meissner D. (2012) Ekonomicheskie effekty “peretoka” rezul’tatov nauchno-tekhnicheskoi i innovatsionnoi
deyatel’nosti [The Economic Impact of Spillovers from R&D and Innovation]. Foresight-Russia, vol. 6, no 4, pp. 20–31 (in Russian).
Meissner D. (2014) Approaches for developing national STI strategies. STI Policy Review, vol. 5, no 1, pp. 34–56. Meissner D. (2015a) Public-Private Partnership Models for Science, Technology, and Innovation Cooperation.
Journal of the Knowledge Economy (forthcoming). DOI: 10.1007/s13132-015-0310-3.Meissner D. (2015b) Measuring Innovation — A Discussion of Innovation Indicators at the National Level (The Swiss
Science and Innovation Council Working Paper no 3, SSIC Secretariat Series), Bern: Swiss Science and Innovation Council.
Midtkandal I., Sörvik J. (2012) What is smart specialisation? Nordregio News, no 5. Available at: http://www.nordregio.se/en/Metameny/Nordregio-News/2012/Smart-Specialisation/Context, accessed 14.05.2015.
OECD (2001) Measuring productivity: Measurement of aggregate and industry-level productivity growth, Paris: OECD.Paas T., Poltimäe H. (2010) A comparative analysis of national innovation performance: The Baltic States in the EU
context (Working Paper 78), Tartu: University of Tartu.Proskuryakova L., Meissner D., Rudnik P. (2015) The use of technology platforms as a policy tool to address research
challenges and technology transfer. The Journal of Technology Transfer (online publication). Available at: http://link.springer.com/article/10.1007/s10961-014-9373-8#/page-1, accessed 12.02.2016.
Virkkala S., Mäenpää A., Mariussen A. (eds.) (2014) The Ostrobothnian model of smart specialization (Proceedings of the University of Vaasa, Reports 195), Vaasa: University of Vaasa. Available at: http://www.uva.fi/materiaali/pdf/isbn_978-952-476-577-0.pdf, accessed 26.09.2015.
WEF (2012) The global competitiveness report 2012–2013, Geneva: World Economic Forum.
Public Sector Supply Chain Management: A Triple Helix Approach to Aligning Innovative
Environmental Initiatives
Lecturer, University of the West of England. Address: Coldharbour Ln, Bristol BS16 1QY, UK. E-mail: [email protected]
Azley Abd Razak
Abstract
This paper argues that in order to deliver greater levels of sustainable performance, environmental strategy should be addressed at the supply chain level and not just at the level of the individual organisation. It demonstrates the similarities between the environmental statements of companies in both the private and public sectors and proposes that public sector organisations, by virtue of their considerable spend with private sector organisations, are in a powerful position to encourage and support environmental initiatives throughout their supply chains. Drawing upon Triple Helix Theory the paper discusses the
importance of unifying the efforts of government, industry and academia in order to identify and operationalise innovative thinking in economies. It explores the roles of public and private sector organisations along with universities in developing environmental strategies and practices within supply chains. Environmental Management Systems (EMS) are discussed and the Eco-Management and Audit Scheme (EMAS) is identified as a potential mechanism for structuring and reporting the collaborative environmental improvement performance of supply chains.
Lecturer, University of South Wales. Address: Treforest Pontypridd CF37 1DL, UK. E-mail: [email protected]
Martyn Rowling
Citation: Abd Razak A., Rowling M., White G., Mason-Jones R. (2016) Public Sector Supply Chain Management: A Triple Helix Approach to Aligning Innovative Environmental Initiatives. Foresight and STI Governance, vol. 10, no 1, pp. 43–52. DOI: 10.17323/1995-459x.2016.1.43.52
Keywords: green supply chain management; performance; university; industry; engagement; alignment
Gareth White
Rachel Mason-Jones
Senior Lecturer, University of South Wales. E-mail: [email protected]
Senior Lecturer, University of South Wales. E-mail: [email protected]
DOI: 10.17323/1995-459x.2016.1.43.52
2016 Vol. 10 No 1 FORESIGHT AND STI GOVERNANCE 43
44 FORESIGHT AND STI GOVERNANCE Vol. 10 No 1 2016
Innovation and Economy
The relationship between the holistic performance of supply chains and the satisfaction of end consumers is strong. Diverse globalized markets require tailored yet flexible supply strategies [Butner, 2010; Piercy et al., 2010; Hameri, Hintsa, 2009; Jain, Benyoucef, 2008; Blowfield, 2005;
Childerhouse, Towill, 2000; Shi et al., 1997]. However, spatially distributed supply lines also introduce increased political, economic, and natural risks to already complex operations [Wilding, 2012; Manuj, Mentzer, 2008]. The risks and difficulties associated with ever-expanding globalized supply chains have subsequently led to a significant rise in strategies to repatriate sources of supply where possible [Brosze, 2010; Hameri, Hintsa, 2009; Christopher et al., 2006].
The importance of managing ‘green’ issues in organizations has been recognized for a considerable length of time [Plant et al., 2015; White et al., 2014a; White, James, 2014; Chan et al., 2013; Pane Haden et al., 2009] and corporate attitudes towards the environment have become of increasing concern to the public [DEFRA, 2011; Clark, 2004]. Environmental issues are pertinent to both public and private sector organizations and they are increasingly becoming key elements of many organizations’ strategies; further, there is an expectation to evidence the environmental performance of the supply chain. Given the continuing pressures to improve profitability and manage risks, Supply Chain Managers walk a thin line between balancing cost reduction and maintaining the provision of service and supply [Manuj, Mentzer, 2008; Hong-Minh et al., 2000].
This paper proposes that by aligning the efforts of government, university, and private sector organizations in supply chains through the framework of EMAS, greater potential holistic environmental performance can be achieved. This improved performance, when aligned correctly with stakeholder requirements, will also be of added economic and social benefit to those organizations comprising the supply chain. The approach can also be of assistance to small and medium sized organizations that account for the majority of national economic activity [URS, 2010] and typically experience great difficulty in developing and implementing quality and environmental management systems [White et al., 2009; 2014a]. It may also be a valuable initiative that will minimize the potentially deleterious effect of increased levels of manufacturing, should the trend to repatriate sources of supply continue.
Public and Private Sector Strategic ProcurementProcurement can be divided broadly into that which is undertaken in the private sector and that which is undertaken in the public sector. Collectively they comprise a considerable proportion of national economic activity [Hoctor, Keating, 2009]. Both public and private sector procurement face similar problems with respect to balancing cost reductions against quality of supply and service, although the public sector tends to be more highly regulated, and therefore constrained [Linnaet al., 2010; Schapper et al., 2006].
The public sector traditionally has viewed procurement as a clerical activity and has based purchasing decisions on the issue of cost [Quayle, Quayle, 2000]. The importance of the procurement function is now recognized, and increasingly plays a strategic role within public sector organizations. This change has been driven by increasingly complex product choices, heightened use of technology, a switch in focus from cost to best value, and in line with this paper’s perspective, an increased consideration of environmental issues [Zheng et al., 2007; Beukers et al., 2006; Paulraj et al., 2006; Gelderman, van Weele, 2005; McCue, Gianakis, 2001; Cavinato, 1999; Reck, Long, 1988; Caddick, Dale, 1987]. Many authors agree that procurement has become increasingly recognized at the corporate level with some suggesting that it should be considered equally important like other strategically significant functions such as marketing, finance, and operations [Paulraj et al., 2006; Cavinato, 1999; Rink, Fox, 1999; McIvor et al., 1997]. Despite this, it has been observed that public sector procurement is still focused on reducing transaction costs and fails to consider the total acquisition costs of products [Staples, Dalrymple, 2011].
Developing an effective and strategic procurement function is becoming increasingly a priority for managers who recognize that it has a definitive role in the ultimate success of the public sector [Deasy et al., 2014; Matthews, 2005]. Despite the increasing recognition of the need to develop a strategic approach to public sector procurement, the academic focus has largely been based on the private sector [Murray, 2001] and on conceptual frameworks [Cousins et al., 2006], although it is recognized that some researchers have attempted to address this [Quayle, 1998; Quayle, Quayle, 2000; Beukers et al.,2006].
Some argue that strategic procurement can incur costs for organizations, particularly with the introduction of e-business [Angeles, Nath, 2007]. This includes costs including purchase of technology and associated training, and learning curve and maintenance costs, which potentially increase business risk. However, it can also be shown that the long-term benefits of developing strategic procurement practices far outweigh the up-front costs, with many agreeing that such an approach actually improves the financial performance of an organization [Vickery et al., 2003; Carr, Smeltzer, 1999; Carter, Narasimhan, 1996]. Biemans and Brand claimed ‘that the strategic management of procurement may trim procurement expenditure between 5–15 per cent over a three-year period’ [Biemans, Brand, 1995, p. 400]. At the same time, recent austerity measures have further stressed the importance of controlling public expenditure,

2016 Vol. 10 No 1 FORESIGHT AND STI GOVERNANCE 45
exemplified by a KMPG survey of senior executives in the public sector that indicated 67% were ‘planning to reduce procurement costs’ [KPMG, 2010].
Although there are many differences between the public and private sectors, and the literature often treats them as separate entities, they are in fact mutually dependent. The public sector spends on all manner of inputs, while services are outsourced to private sector organizations. Consequently, the public sector is a source of potential business for the private sector; correspondingly, private sector companies are potentially sources of innovation and increased value for money for the public sector.
Public sector organizations are therefore in a position to direct and influence the strategic goals of their suppliers, through introducing mandatory contractual requirements, or suggesting and supporting complementary initiatives. The next section discusses the importance of addressing environmental issues at the level of the supply chain and not just at the level of the individual organization. This affords the opportunity of utilizing public sector procurement strategy to influence the increasing importance of the environmental performance of entire supply chains.
Environmental Dimension of Strategic Procurement
The internal motivation to improve environmental performance is primarily driven by its potential economic benefits [Markley, Davies, 2007], but organizations are also facing increasing external pressure to reduce their environmental impact. These pressures arise from legislation that governs the effects of their actions and often imposes targets for emissions and waste reduction [White et al., 2014a; 2014b; Chan et al., 2013]. External pressure also arises from the market’s complex expectations that an organization will endeavour to act responsibly for the long-term benefit of the wider society [DEFRA, 2011]. This expectation for responsible behaviour is increasingly being extended to the supply chain, with supply chains of companies being expected to perform within required boundaries. Consequently, the strategic directions of organizations are not based upon financial measures alone [Finkbeiner et al., 1998].
Therefore, environmental strategy can be seen as a common focus among a wide variety of organizations. Indeed, it may be argued that the aim of any organization’s environmental strategy is to reduce and then minimize its deleterious effect upon the environment, even if the means by which they translate the requirements into action vary widely. Table 1 presents excerpts of the environmental policies and statements of a sample of public and private sector organizations, taken from documents freely available via their websites, and shows their similar intentions toward environmental management and improvement. Organizations in different fields recognize their responsibility towards the wider environment. Some also state their responsibility toward improving society and others make reference to specific measures of performance such as the reduction of fossil fuel and carbon dioxide emissions. Cardiff Council in Wales, in agreement with the assertions made in this paper, highlights the importance of collaborative working and partnering to improve environmental performance.
Therefore, it is reasonable to deduce that the environmental strategies of organizations within supply chains and networks share similar overall aims, which are fundamentally to manage and improve their impact upon the environment. In practice however, there is evidence to show that some organizations are compelled to act individualistically and pursue the attainment of their own immediate operational and environmental goals rather than focus on the holistic performance of the supply chain. This prevents other organizations in the supply chain from making improvements in their own environmental performance [White et al., 2014b]. This self-interested approach, while beneficial to the individual organization and its environmental performance, may affect the holistic environmental improvement potential of supply chain leading to a reduced competitive advantage. Treating ‘green’ issues at the level of the supply chain rather than the individual organization may, therefore, be an approach that yields greater overall environmental impact and benefit.
Reiterating the point made in the previous sections, public sector organizations are in a position to direct and influence their suppliers; therefore, to some degree, the environmental activities of entire supply chains. However, adopting this approach implies that the strategic role of the public sector procurement function may become even more significant. This is somewhat problematic since the function already faces considerable pressures in meeting current requirements and challenges. Rather than burdening an already highly pressured discipline, the next section draws on Triple Helix theory to recognize the complementary roles of government, industry, and universities in delivering innovation and how they may be aligned to address the increasingly important aspect of supply chain environmental performance improvement.
Triple HelixThe evolutionary Triple Helix model was developed by Etzkowitz & Leydesdorff [Etzkowitz, Leydesdorff,1995]. It describes the different degrees of collaboration between the three main actors
Abd Razak A. et al., pp. 43–52
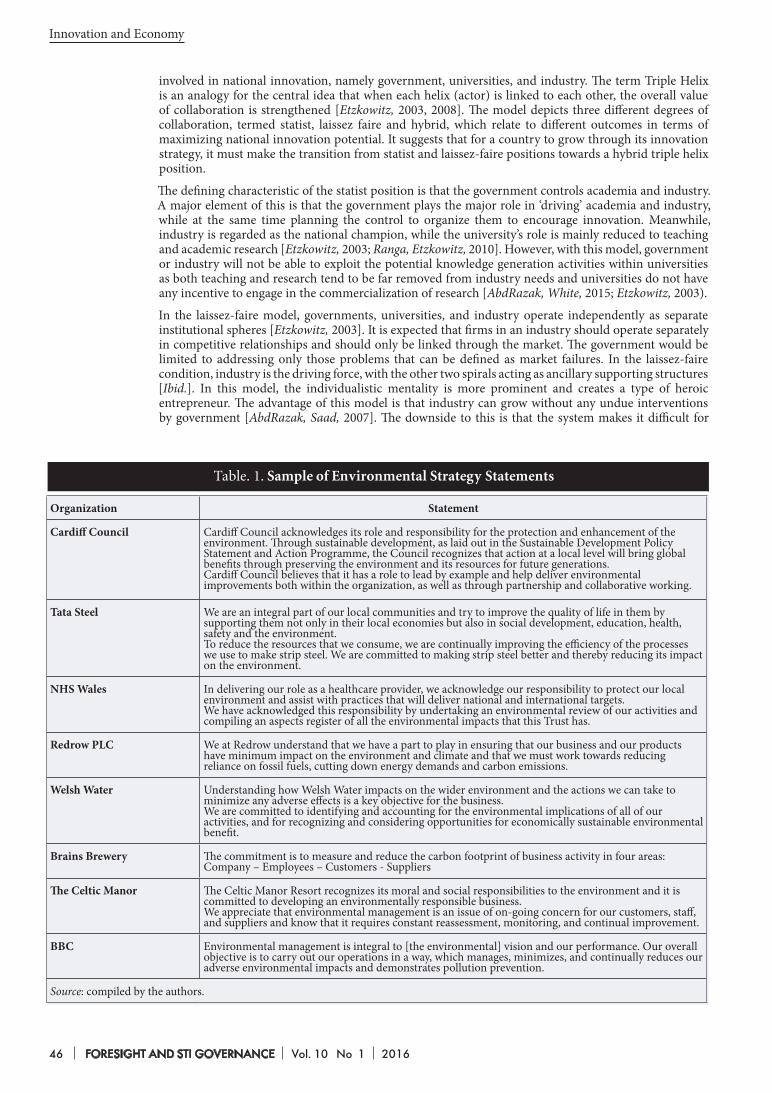
46 FORESIGHT AND STI GOVERNANCE Vol. 10 No 1 2016
Innovation and Economy
involved in national innovation, namely government, universities, and industry. The term Triple Helix is an analogy for the central idea that when each helix (actor) is linked to each other, the overall value of collaboration is strengthened [Etzkowitz, 2003, 2008]. The model depicts three different degrees of collaboration, termed statist, laissez faire and hybrid, which relate to different outcomes in terms of maximizing national innovation potential. It suggests that for a country to grow through its innovation strategy, it must make the transition from statist and laissez-faire positions towards a hybrid triple helix position.
The defining characteristic of the statist position is that the govern ment controls academia and industry. A major element of this is that the government plays the major role in ‘driving’ academia and industry, while at the same time planning the control to organize them to encourage innovation. Meanwhile, industry is regarded as the national champion, while the university’s role is mainly reduced to teaching and academic research [Etzkowitz, 2003; Ranga, Etzkowitz, 2010]. However, with this model, government or industry will not be able to exploit the potential knowledge generation activities within universities as both teaching and research tend to be far removed from industry needs and universities do not have any incentive to engage in the commercialization of research [AbdRazak, White, 2015; Etzkowitz, 2003).
In the laissez-faire model, governments, universities, and industry operate independently as separate institutional spheres [Etzkowitz, 2003]. It is expected that firms in an industry should operate separately in competitive relationships and should only be linked through the market. The government would be limited to addressing only those problems that can be defined as market failures. In the laissez-faire condition, industry is the driving force, with the other two spirals acting as ancillary supporting structures [Ibid.]. In this model, the individualistic mentality is more prominent and creates a type of heroic entrepreneur. The advantage of this model is that industry can grow without any undue interventions by government [AbdRazak, Saad, 2007]. The downside to this is that the system makes it difficult for
Organization Statement
Cardiff Council Cardiff Council acknowledges its role and responsibility for the protection and enhancement of the environment. Through sustainable development, as laid out in the Sustainable Development Policy Statement and Action Programme, the Council recognizes that action at a local level will bring global benefits through preserving the environment and its resources for future generations. Cardiff Council believes that it has a role to lead by example and help deliver environmental improvements both within the organization, as well as through partnership and collaborative working.
Tata Steel We are an integral part of our local communities and try to improve the quality of life in them by supporting them not only in their local economies but also in social development, education, health, safety and the environment.To reduce the resources that we consume, we are continually improving the efficiency of the processes we use to make strip steel. We are committed to making strip steel better and thereby reducing its impact on the environment.
NHS Wales In delivering our role as a healthcare provider, we acknowledge our responsibility to protect our local environment and assist with practices that will deliver national and international targets. We have acknowledged this responsibility by undertaking an environmental review of our activities and compiling an aspects register of all the environmental impacts that this Trust has.
Redrow PLC We at Redrow understand that we have a part to play in ensuring that our business and our products have minimum impact on the environment and climate and that we must work towards reducing reliance on fossil fuels, cutting down energy demands and carbon emissions.
Welsh Water Understanding how Welsh Water impacts on the wider environment and the actions we can take to minimize any adverse effects is a key objective for the business.We are committed to identifying and accounting for the environmental implications of all of our activities, and for recognizing and considering opportunities for economically sustainable environmental benefit.
Brains Brewery The commitment is to measure and reduce the carbon footprint of business activity in four areas: Company – Employees – Customers - Suppliers
The Celtic Manor The Celtic Manor Resort recognizes its moral and social responsibilities to the environment and it is committed to developing an environmentally responsible business. We appreciate that environmental management is an issue of on-going concern for our customers, staff, and suppliers and know that it requires constant reassessment, monitoring, and continual improvement.
BBC Environmental management is integral to [the environmental] vision and our performance. Our overall objective is to carry out our operations in a way, which manages, minimizes, and continually reduces our adverse environmental impacts and demonstrates pollution prevention.
Source: compiled by the authors.
Table. 1. Sample of Environmental Strategy Statements
2016 Vol. 10 No 1 FORESIGHT AND STI GOVERNANCE 47
the three institutional spheres to interact to maximize the synergy in the relationships [Etzkowitz, 2008]. Industries can be very strong in their own area but lacking in understanding and ability to capture the dynamic needs of their external environment that includes customers, suppliers, and other institutions [Etzkowitz, 2002; AbdRazak, Saad,2007; Ranga, Etzkowitz, 2010].
Both the statist and laissez-faire positions are seen to compromise the innovation potential of a nation since they do not lead to the degree and type of collaboration that capitalizes on the synergies between actors as described in the hybrid Triple Helix position. According to Etzkowitz, if countries evolve from these states it will help all three actors and the nation to achieve their long-term strategic goals [Etzkowitz, 2003].
One of the key aspects of the hybrid Triple Helix model is the emphasis on the importance of academia in the capitalization of knowledge. Etzkowitz believes that universities need to be the main drivers of its development [Etzkowitz, 2003]. Universities are expected to take on a generating role in directing regional economic development through ‘academic entrepreneurial’ activities that share common characteristics with the traditional roles of industry and the government in economic regulation [Etzkowitz, Leydesdorff, 1997, 1999]. The development of the ‘entrepreneurial university’ is a unique feature of the evolutionary Triple Helix model of innovation. Etzkowitz et al. [Etzkowitz et al., 2000, p. 326] define this new type of university as the ‘amalgam of teaching and research, applied and basic, entrepreneurial and scholastic interests’. The development of entrepreneurial universities is seen as key to the dynamic processes of evolution required to enhance innovation. Etzkowitz and Klofsten describe the hybrid Triple Helix position as characterized by the following elements [Etzkowitz, Klofsten, 2005]:
1. A prominent role for the university in innovation, on a par with industry and government in a knowledge-based society.
2. A movement towards collaborative relationships among the three major institutional spheres in which innovation policy is an outcome of their interactions rather than a prescription from the government. According to Inzelt, one of the roles of government within the Triple Helix is to encourage industry by minimizing the risk of partnership building with a strong scientific base [Inzelt, 2004].
3. In addition to fulfilling their traditional functions, each institutional sphere also ‘takes the role of the other’ [Etzkowitz, Klofsten, 2005].
Benefits and Challenges of Hybrid Triple Helix CooperationMartin [Martin, 2000] and Schartninger et al. [Schartninger et al., 2001] have all emphasized that businesses in the private sector can increase their innovation capacity and improve their competitive positions through collaboration with universities. This provides access to basic and applied research, economically relevant scientific and technological knowledge, prototypes that can be developed and tested, and enables the businesses to get support in finding solutions for their products’ problems. Meanwhile, universities gain benefits from cooperating with industry by adding financial resources, new technical knowledge and good practices, and access to industrial information and applied knowledge for academic research and teaching [Martin, 2000].
Nieminen and Kaukonen [Nieminen, Kaukonen, 2001] describe how the involvement in joint technological development projects with other organizations and scientific and technological institutions, namely universities, is a promising approach for firms looking for real competitive advantages through technological differentiation. These findings exemplify the view of Etzkowitz and Leydesdorff [Etzkowitz, Leydesdorff, 1997] that the university-industry relationship emerges as a sophisticated instrument for the reinforcement of firms’ competitive position through adopting advanced, innovative, and value-added technologies.
A wide range of barriers has been recognized in the literature including not appreciating other perspectives or not understanding other sectors’ demands and contexts [de Castro et al., 2000]. This is problematic since Etzkowitz [Etzkowitz, 2003] state that for a hybrid Triple Helix status to be achieved each institution should keep its own distinctive characteristics, while at the same time assuming the role of the other and gaining value from each other.
Differences in university and industry agendas in terms of research generation, for instance, may hinder the relationship. Industry, on the one hand, seeks commercialization whereas universities often seek knowledge-driven innovation. Therefore, collaboration with industry is likely to increase pressure for short-term research, thereby negatively affecting long-term basic and curiosity-driven research [Lee, 1997]. Industry-orientated drive for research or, as Feller [Feller, 1990] notes, the privatization of research, may actually slow down the rate of technological and knowledge-driven, university-led, research and innovation needs.
The differing perspectives on intellectual property represent another source of conflict, with entrepreneurs finding it difficult to figure out the academic ontological principles related to the universality of
Abd Razak A. et al., pp. 43–52
48 FORESIGHT AND STI GOVERNANCE Vol. 10 No 1 2016
Innovation and Economy
knowledge that do not coexist well with private property values [Nieminen, Kaukonen, 2001]. A clash between organizational cultures is also another potential barrier [Wolff, 1994], with partners having to set up project management and ‘skunk’ teams to unify cultural differences. Differences in culture may generate their own set of associated problems and sources of conflict such as communication problems. For instance, the academic language tends to be eclectic and speculative, while the entrepreneurial one tends to be more focused and practical [Nieminen, Kaukonen, 2001].
PropositionThe hybrid Triple Helix model offers a useful conceptualization of how government, university, and industry can be organized to deliver innovation in economies. It can be argued that the cascading of transnational environmental objectives into organizational goals should be capable of aligning the actions of the three groups of actors, but evidence shows that this is not always the case [White et al., 2015]. Triple Helix theory and practice state that the collaborative efforts of actors are capable of delivering greater overall benefits than if each were to pursue their own goals individually. This arrangement is simple to envisage, although its practical execution is more complicated. The primary challenge lies in aligning the needs and expectations of each of the actors and developing the necessary collaborative relationships. The use of the public sector as a driver for this by enabling a coordinated approach to supply chain management and research funding development would enable the Triple Helix to flourish effectively.
The pursuit of environmental improvement may be a common factor that can be used to align the efforts and initiatives of Triple Helix actors. Government is concerned with meeting transnational agendas such as those that derive from the Bruntland Report [UN, 1987]. Organizations (i.e. firms) are challenged with meeting the requirements of national environmental standards and regulations as well as satisfying the expectations of an increasingly environmentally aware customer and stakeholder base. Universities are interested in both acquiring knowledge of the current environmental, organizational and sociological conditions, and in developing new knowledge and technologies that can improve those conditions.
Environmental Management SystemsThe environmental management systems (EMS) ISO 14001 and the Eco-Management and Audit Scheme (EMAS) are the most common approaches organizations take toward improving their environmental performance [EMAS, 2006; Ruzicka, 2004; Chemical Week, 1997]. Initially seen and promoted as different approaches, they are now complementary with EMAS and conceived as a development of, and logical progression from, the attainment of ISO 14001 certification [Palomares-Soler, Thimme, 1996; Klaver, Jonker, 1998; IEMA, 2009; Chemical Week, 1998; Roberts, 1995a; 1995b; 1996].
The benefits of an effective EMS can be greater than simply an improvement in environmental performance. There may be internal operational and cost benefits as well as positive effects upon environmentally aware employees. Furthermore, the external benefits may also include the acquisition of additional business resulting from improved perceptions of company image [White, Lomax, 2010; Hillary, 2004; IEMA, 2009; Strachan et al., 1997).
The challenges of implementing EMAS are however significant and are not simply related to cost and resource issues [White et al., 2014a]: knowledge of relevant legislation, the need to publicly disclose operational information, and difficulty in establishing relevant and realistic measures of performance all present further difficulties [IEMA, 2011; Hillary, 2004; Honkasalo, 1998; Klaver, Jonker, 1998]. In the United Kingdom, the BS8555 ‘Acorn’ scheme [IEMA, 2009] provides a common pathway for SMEs to work towards EMAS and ISO 14001 certification. The attainment of ISO 14001 certification provides assurance that the environmental management systems are robust, while EMAS certification requires the public disclosure of environmental initiatives and mishaps.
EMAS and the Roles of Triple Helix ActorsThrough stipulating the pursuit of EMAS throughout their supply chains, public sector organizations are capable of driving efforts toward realizing the national environmental strategy. This, in turn, aids in the attainment of transnational environmental objectives and agreements. EMAS thus becomes the ‘mutually shared value’ that stimulates actors’ efforts within the Triple Helix model.
Consequently, organizations within public sector supply chains are tasked with publicly disclosing their environmental initiatives. They also focus more on improving their environmental impact rather than becoming preoccupied with the robustness of their internal environmental management systems. This measurable ‘real world’ improvement, and the public disclosure of efforts, means that stakeholders of
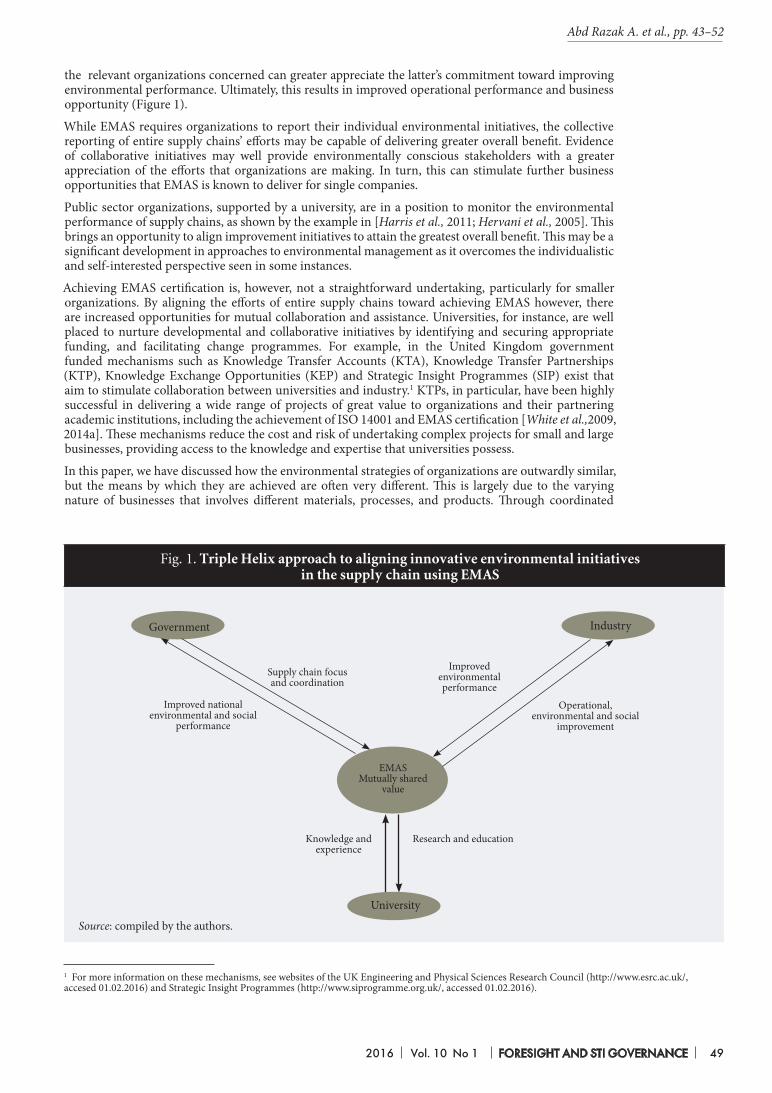
2016 Vol. 10 No 1 FORESIGHT AND STI GOVERNANCE 49
the relevant organizations concerned can greater appreciate the latter’s commitment toward improving environmental performance. Ultimately, this results in improved operational performance and business opportunity (Figure 1).
While EMAS requires organizations to report their individual environmental initiatives, the collective reporting of entire supply chains’ efforts may be capable of delivering greater overall benefit. Evidence of collaborative initiatives may well provide environmentally conscious stakeholders with a greater appreciation of the efforts that organizations are making. In turn, this can stimulate further business opportunities that EMAS is known to deliver for single companies.
Public sector organizations, supported by a university, are in a position to monitor the environmental performance of supply chains, as shown by the example in [Harris et al., 2011; Hervani et al., 2005]. This brings an opportunity to align improvement initiatives to attain the greatest overall benefit. This may be a significant development in approaches to environmental management as it overcomes the individualistic and self-interested perspective seen in some instances.
Achieving EMAS certification is, however, not a straightforward undertaking, particularly for smaller organizations. By aligning the efforts of entire supply chains toward achieving EMAS however, there are increased opportunities for mutual collaboration and assistance. Universities, for instance, are well placed to nurture developmental and collaborative initiatives by identifying and securing appropriate funding, and facilitating change programmes. For example, in the United Kingdom government funded mechanisms such as Knowledge Transfer Accounts (KTA), Knowledge Transfer Partnerships (KTP), Knowledge Exchange Opportunities (KEP) and Strategic Insight Programmes (SIP) exist that aim to stimulate collaboration between universities and industry.1 KTPs, in particular, have been highly successful in delivering a wide range of projects of great value to organizations and their partnering academic institutions, including the achievement of ISO 14001 and EMAS certification [White et al.,2009, 2014a]. These mechanisms reduce the cost and risk of undertaking complex projects for small and large businesses, providing access to the knowledge and expertise that universities possess.
In this paper, we have discussed how the environmental strategies of organizations are outwardly similar, but the means by which they are achieved are often very different. This is largely due to the varying nature of businesses that involves different materials, processes, and products. Through coordinated
Government
Improved national environmental and social
performance
Supply chain focusand coordination
Improved environmental
performance
Research and education
EMAS Mutually shared
value
Knowledge andexperience
Fig. 1. Triple Helix approach to aligning innovative environmental initiatives in the supply chain using EMAS
Source: compiled by the authors.
Operational, environmental and social
improvement
1 For more information on these mechanisms, see websites of the UK Engineering and Physical Sciences Research Council (http://www.esrc.ac.uk/, accesed 01.02.2016) and Strategic Insight Programmes (http://www.siprogramme.org.uk/, accessed 01.02.2016).
Industry
University
Abd Razak A. et al., pp. 43–52

50 FORESIGHT AND STI GOVERNANCE Vol. 10 No 1 2016
Innovation and Economy
Angeles R., Nath R. (2007) Business-to-business e-procurement: Success factors and challenges to implementation. Supply Chain Management: An International Journal, vol. 12, no 2, pp. 104–115.
Beukers M., Versendaal J., Batenburg R., Brinkkemper S. (2006) The procurement alignment framework construction and application. Wirtschaftsinformatik, vol. 48, no 5, pp. 323–330.
Biemans W.M., Brand M.J. (1995) Reverse marketing: A synergy of purchasing and relationship marketing. International Journal of Purchasing & Materials Management, vol. 31, no 3, pp. 29–37.
Blowfield M.E. (2005) Going global: How to identify and manage societal expectations in supply chains (and the consequences of failure). Corporate Governance, vol. 5, no 3, pp. 119–128.
Brosze T. (2010) Future Global Supply Chain Logistics: Coming Back Closer to Home as a Consequence of Rising Energy Cost? Paper presented at the EARTO Annual Conference, Gothenburg, 20th May 2010, Fir Rwth Aachen. Available at: http://www.earto.eu/fileadmin/content/01_Seminars___Conferences/AC_2010/2-Tobias-Brosze.pdf, accessed 04.12.2012.
Butner K. (2010) The smarter supply chain of the future. Strategy and Leadership, vol. 38, no 1, pp. 22–31.Caddick J., Dale B. (1987) The Determination of Purchasing Objectives and Strategies: Some Key Influences.
International Journal of Physical Distribution & Materials Management, vol. 17, no 3, pp. 5–16.Carr A., Smeltzer L. (1999) The Relationship of strategic purchasing to supply chain management. European Journal
of Purchasing & Supply Chain Management, vol. 5, no 1, pp. 43–51.Carter J.R., Narasimhan R. (1996) Is purchasing really strategic? International Journal of Supply Chain Management,
vol. 32, no 1, pp. 20–28.Cavinato J. (1999) A general methodology for determining a fit between supply chain logistics and five stages
of strategic management. International Journal of Physical Distribution & Logistics Management, vol. 29, no 3, pp. 162–180.
Chan H.K., Wang X., White G.R.T., Yip N. (2013) An Extended Fuzzy-AHP Approach for the Evaluation of Green Product Designs. IEE Transactions on Engineering Management, vol. 60, no 2, pp. 327–339.
Chemical Week (1997) Leads on EMAS Sites. Chemical Week, vol. 159, no 37, p. 8.Chemical Week (1998) EU Prepares EMAS Overhaul. Chemical Week, vol. 160, no 23, p. 6.Childerhouse P., Towill D. (2000) Engineering supply chains to match customer requirements. Logistics Information
Management, vol. 13, no 6, pp. 337–346.Christopher M., Peck H., Towill D. (2006) A taxonomy for selecting global supply chain strategies. The International
Journal of Logistics Management, vol. 17, no 2, pp. 277–287.Clark D. (2004) The Rough Guide to Ethical Shopping, London: Penguin.Cousins P., Lawson B., Squire B. (2006) An empirical taxonomy of purchasing functions. International Journal
of Operations & Production Management, vol. 26, no 7, pp. 775–794.de Castro E.A., Rodrigues C., Esteves C., da Rosa Pires A. (2000) The triple helix model as a motor for the creative
use of telematics. Research Policy, vol. 29, pp. 193–203.Deasy M., White G.R.T., Parfitt S., Ringwald K. (2014) Asymmetric Procurement in the Public Sector. Strategic
Change, vol. 23, no 1–2, pp. 21–29.DEFRA (2011) Attitudes and Knowledge Relating to Biodiversity and the Natural Environment 2007–2011, London:
Department for Environment, Food & Rural Affairs.EMAS (2006) EMAS in figures (EMAS Newsletter 2006). Available at: http://www.iema.net/stream.php/download/
readingroom/article/EMAS%20Newsletters/EMAS%20Newsletter%202006%20issue%204%20EMAS%20in%20Education.pdf, accessed 07.07.2009.
Etzkowitz H. (2002) Incubation of Incubators: Innovation as a Triple Helix of University-Industry-Government Networks. Science & Public Policy, vol.29, no 2, pp. 115–128.
Etzkowitz H. (2003) Innovation in innovation: The Triple Helix of university-industry-government relation. Social Science Information, vol. 42, no 3, pp. 293–338.
Etzkowitz H. (2008) Triple Helix Innovation: Industry, University and Government in Action. London; New York: Routledge.
Etzkowitz H., Klofsten M. (2005) The innovating region: Toward a theory of knowledge-based regional development. R&D Management, vol.35, no 3, pp. 243–255.
Etzkowitz H., Leydesdorff L. (1995) The Triple Helix: University-industry-government relations. A laboratory for knowledge based economic development. EASST Review. European Society for the Study of Science & Technology, vol. 14, no 1, pp. 18–36.
Etzkowitz H., Leydesdorff L. (1997) Universities in the Global Knowledge Economy: The Triple Helix of University-Industry-Government Relations, London: Cassell Academic.
collaboration throughout the supply chain, supported by university knowledge and expertise, the available resources can be focused on discovering and developing technologies for the greatest overall environmental improvements of the supply chain. Furthermore, as universities are likely to be involved in the monitoring and development of multiple public sector organization supply chains, there are greater opportunities for identifying and sharing knowledge and technologies across businesses and sectors. This improvement in technological competitive advantage is a key outcome of successful hybrid Triple Helix operation and leads to national economic improvement.
References

2016 Vol. 10 No 1 FORESIGHT AND STI GOVERNANCE 51
Etzkowitz H., Leydesdorff L. (1999) The future location of research and technology transfer. Journal of Technology Transfer, vol.24, no 2–3, pp. 111–123.
Etzkowitz H., Webster A., Gebhardt C., Cantisano Terra B.R. (2000) The Future of the University and the University of the Future: Evolution of Ivory Tower to Entrepreneurial Paradigm. Research Policy, vol. 29, pp. 313–330.
Feller I. (1990) Universities as engines of R&D-based growth: They think they can. Research Policy, vol. 19, pp. 335–348.
Finkbeiner M., Wiedmann M., Saur K. (1998) A comprehensive approach towards product and organisation related environmental management tools. The International Journal of Life Cycle Assessment, vol. 3, no 3, pp. 169–178.
Gelderman R., van Weele A. (2005) Purchasing Portfolio Models: A critique and update. Journal of Supply Chain Management, vol. 41, no 3, pp. 19 –28.
Hameri A.P., Hintsa J. (2009) Assessing the drivers of change for cross-border supply chains. International Journal of Physical Distribution & Logistics Management, vol. 39, no 9, pp. 741–761.
Harris I., Naim M., Palmer A., Potter A., Mumford C. (2011) Assessing the Impact of Cost Optimization Based on Infrastructure Modelling on CO2 Emissions. International Journal of Production Economics, vol. 131, no 1, pp. 313–321.
Hervani A., Helms M., Sarkis J. (2005) Performance measurement for green supply chain management. Benchmarking: An International Journal, vol. 12, no 4, pp. 330–353.
Hillary R. (2004) Environmental management systems and the smaller enterprise. Journal of Cleaner Production, vol. 12, pp. 561–569.
Hoctor K., Keating I. (2009) Back to Business Local Solutions, London: British Chambers of Commerce, Local Government Association.
Hong-MinhS.M., DisneyS.M., Naim M.M. (2000) The dynamics of emergency transhipment supply chains. International Journal of Physical Distribution & Logistics Management, vol. 30, no 9, pp. 788–816.
Honkasalo A. (1998) The EMAS Scheme: A management tool and instrument of environmental policy. Journal of Cleaner Production, vol. 6, pp. 119–128.
IEMA (2009) IEMA Acorn Scheme. Available at: http://www.iema.net/ems/acorn_scheme, accessed 07.07.2009.IEMA (2011) The EMAS Regulation. Available at: http://www.iema.net/ems/emas/regulation, accessed 15.09.2011.Inzelt A. (2004) The evolution of university – industry – government relationships during transition. Research Policy,
vol. 33, pp. 975–995.Jain V., Benyoucef L. (2008) Managing long supply chain networks: Some emerging issues and challenges. Journal
of Manufacturing Technology Management, vol. 19, no 4, pp. 469–496.Klaver J., Jonker J. (1998) The significance of recent EMS standards as an impetus for improvement. Eco-Management
& Auditing, vol. 5, no 1, pp. 1–5.KPMG (2010) The Public Sector Austerity Agenda \– What will it mean for suppliers?Available at: http://www.kpmg.
co.uk/email/Restructuring/165160/Story02.html, accessed 03.07.2012.Lee A. (1997) Working together? Academic literacies, co-production and professional partnerships, Literacy and
Numeracy Studies, vol. 7, no 2, pp. 65–82.Linna P., Pekkola S., Ukko J., Melkas H. (2010) Defining and measuring productivity in the public sector: Managerial
perceptions. International Journal of Public Sector Management, vol. 23, no 3, pp. 300–320.Manuj I., Mentzer J.T. (2008) Global supply chain risk management strategies. International Journal of Physical
Distribution & Logistics Management, vol. 38, no 3, pp. 192–223.Markley M.J., Davis L. (2007) Exploring future competitive advantage through sustainable supply chains. International
Journal of Physical Distribution & Logistics Management, vol. 37, no 9, pp. 763–774.Martin M. (ed.) (2000) The Management of University-Industry Relations: Five Institutional Case Studies from Africa,
Europe, Latin America and the Pacific Region, Paris: UNESCO. Matthews D. (2005) Strategic procurement in the public sector: A mask for financial and administrative policy.
Journal of Public Procurement, vol. 5, no 3, pp. 388–389.McCue C.P., Gianakis G.A. (2001) Public Purchasing: Who’s minding the store? Journal of Public Procurement,
vol. 1, no 1, pp. 71–95.McIvor R., Humphreys P., McAleer E. (1997) The Evolution of the purchasing function. Journal of Strategic Change,
vol. 6, pp. 165–179.Murray G. (2001) Improving purchasing contribution — The purchasing strategy of buying council. International
Journal of Public Sector Management, vol. 14, no 5, pp. 391–410.Nieminen M., Kaukonen E. (2001) Universities and R&D Networking in a Knowledge-Based Economy, Helsinki: Sitra. Palomares-Soler M., Thimme P.M. (1996) EMAS and ISO 14001 compared. European Environmental Law Review,
vol. 5, no 8–9, pp. 247–251.Pane Haden S.S., Oyler J.D., Humphreys J.H. (2009) Historical, practical and theoretical perspectives on green
management. Management Decision, vol. 47, no 7, pp. 1041–1055.Paulraj A., Chen I., Flynn J. (2006) Levels of Strategic Purchasing: Impact on supply integration and performance.
Journal of Purchasing and Supply Chain Management, vol. 12, pp. 107–122.Piercy N.F, Cravens D.W., Lane N. (2010) Thinking strategically about pricing decisions. Journal of Business Strategy,
vol. 31, no 5, pp. 38–48.Plant E., Yusen X., White G.R.T. (2015) Green Supply Chain Management in Chinese Electronic Manufacturing
Organisations: An analysis of senior managements’ perceptions. International Journal of Social Ecology and Sustainable Development, vol. 6, no 3, pp. 21–30.
Quayle M. (1998) The impact of strategic procurement in the UK Government sector. International Journal of Public Sector Management, vol. 11, no 5, pp. 397–413.
Quayle M., Quayle S. (2000) The Impact of Strategic Procurement in the UK further and higher education sectors. The International Journal of Public Sector Management, vol. 13, no 3, pp. 260–284.
Abd Razak A. et al., pp. 43–52
52 FORESIGHT AND STI GOVERNANCE Vol. 10 No 1 2016
Innovation and Economy
Ranga M., Etzkowitz H. (2010) Creative reconstruction —Towards a triple helix innovation strategy in Central and Eastern Europe Countries. Theory and Practice of Triple Helix Model in Developing Countries: Issues and Challenges (eds.M. Saad, G. Zawdie), London: Routledge, pp. 249–282.
Razak A.A., Saad M. (2007)The role of universities in the evolution of the Triple Helix culture of innovation network: The case of Malaysia. International Journal of Technology Management and Sustainable Development,vol.6, no 3, pp. 211–225.
Razak A.A., White G.R.T. (2015) The Triple Helix Model for Innovation: A holistic exploration of barriers and enablers. International Journal of Business Performance and Supply Chain Modelling, vol. 7, no 3, pp. 278–291.
Reck R., Long B. (1998) Purchasing: A Competitive Weapon. Journal of Purchasing and Material Management, vol. 24, no 3, pp. 2–8.
Rink D., Fox H. (1999) Strategic procurement planning across the products sales cycle: A conceptualisation. Journal of Marketing Theory and Practice, vol. 7, no 2,pp. 28–42.
Roberts M. (1995a) Akzo Nobel, Ciba first for EMAS. Chemical Week, vol. 157, no 9, p. 41.Roberts M. (1995b) Transatlantic sparks over EMAS, ISO 14001.Chemical Week, vol. 157, no 5, p. 14.Roberts M. (1996) National guidelines cover part of EMAS. Chemical Week, vol. 158, no 7, p. 15.Ruzicka P. (2004) The EMAS scheme in the Czech Republic. Czech Industry, no 11, p. 1.Schapper P., Matla J.N., Gilbert D. (2006) An analytical framework for the management and reform of public
procurement. Journal of Public Procurement, vol. 6, no 1, pp. 1–26.Schartinger D., Schibany A., Gassler H. (2001) Interactive relations between universities and firms: Empirical
evidence for Austria. The Journal of Technology Transfer, vol.26, no 3, pp. 255–268. Shi. Y., Gregory. M., Naylor. M. (1997) International manufacturing configuration map: A self assessment tool
of international manufacturing capabilities. Integrated Manufacturing Systems, vol. 8, pp. 273–282.Staples W., Dalrymple J. (2011) Exploring Infrastructure Procurement by Australian State Governments. International
Journal of Managing Projects in Business, vol. 4, no 3, pp. 512–523.Strachan P., Haque M., McCulloch A. (1997) The Eco-Management and Audit Scheme: Recent experiences of UK
participating organizations. European Environment, no 7, pp. 25–33.UN (1987) Report of the World Commission on Environment and Development: Our Common Future, Vienna: United
Nations. Available at: http://www.un-documents.net/wced-ocf.htm, аccessed 02.02.2014.URS (2010) The City’s Role in Providing for the Public Equity Financing Needs of UK SMEs, London: URS Corporation. Vickery S., Jayaram J., Droge C., Calantone R. (2003) The effects of an integrative supply chain strategy on customer
service and financial performance: An analysis of discrete verse indirect relationships. Journal of Operations Management, vol. 21, no 5, pp. 523–539.
White G.R.T., James P. (2014) Extension of Process Mapping for the Identification of ‘Green Waste’. Benchmarking: An International Journal, vol. 21, no 5, pp. 835–850.
White G.R.T., Lomax M. (2010) Environmental Management Systems: Costs, benefits and an activity theory approach to understanding their knowledge-generating capabilities. The Environmentalist, no 100, pp. 12–16.
White G.R.T., Lomax M., Parry G. (2014a) The Implementation of an Environmental Management System in the Not for Profit Sector. Benchmarking: An International Journal, vol. 21, no 4, pp. 509–526.
White G.R.T., Samson P., Rowland-Jones R., Thomas A.J. (2009) The implementation of a quality management system in the not-for-profit sector. The TQM Journal, vol. 21, no 3, pp. 273–283.
White G.R.T., Sarpong D., Ndrecaj V. (2015) Sustainable packaging: Regulations and operational challenges in a manufacturing SME. International Journal of Social Ecology and Sustainable Development, vol. 6, no 3, pp. 31–40.
White G.R.T., Wang X., Li D. (2014b) Inter-Organisational Green Packaging Design: A case study of influencing factors and constraints in the automotive supply chain. International Journal of Production Research, vol. 53, no 21, pp. 6551–6566.
Wilding R. (2012) The Logistics of the Games. Management Focus, no 32, pp. 22–23.Wolff M.F. (2006) Global innovation models changing. Research Technology Management, vol. 49, no 4, pp. 5–6.Zheng J., Knight L., Harland C., Humby S., James K. (2007) An analysis of research into the future of purchasing and
supply management. Journal of Purchasing & Supply Management, vol. 13, no 1, pp. 69–83.
2016 Vol. 10 No 1 FORESIGHT AND STI GOVERNANCE 53
Foreign Technology Transfer: An Assessment of Russia’s Economic Dependence on High-Tech Imports
Leading Expert, CMASF*; Research Fellow, HSE CBR**. E-mail: [email protected]
Andrey Gnidchenko
Abstract
The article examines Russia’s dependence on high-tech imported goods. We improve the OECD high-technology product classification by increasing
the level of disaggregation, accounting for new goods, ensuring comparability over time, and differentiating goods by technological level on quite high levels of disaggregation. We describe the major trends in the world market for high-tech goods and identify the leading countries in each sector (most frequently, China, Germany, Republic of Korea, Switzerland, and Singapore) primarily by calculating net exports of high-tech goods in these sectors. We also assess Russian competitive positions in the global market for high-tech goods by sectors, applying
the newly developed competitiveness index, and measure Russian dependence on high-tech goods imported from countries that recently imposed sanctions against Russia. We show that Russia’s economy is highly dependent on imports of pharmaceutical goods and medical equipment, machinery and equipment (except nuclear reactors, fuel elements, engines and turbines), and electrical equipment. The sectors with most imports originating from ‘sanction-imposing’ countries are aircraft, medical and optical equipment, engines and turbines, and pharmaceutical goods. Computers and electronic equipment are at the opposite pole: in these sectors, China is the world leader and the key partner for Russia.
Leading Economist, Bank of Russia ***. E-mail: [email protected]
Anastasia Mogilat
Keywords: hi-tech products; Russian external trade; technology and national security; global competition
Expert, CMASF. E-mail: [email protected]
Olga Mikheeva
Head of the Real Sector Department, CMASF; Leading Research Fellow, HSE CBR. E-mail: [email protected]
Vladimir Salnikov
* CMASF — Center for Macroeconomic Analysis and Short-term Forecasting.Address: 47, Nakhimovsky ave., Moscow 117418, Russian Federation.** HSE CBR — Centre for Basic Research at the National Research University Higher School of Economics. Address: 20, Myasnitskaya str., Moscow 101000, Russian Federation.*** Bank of Russia — Central Bank of the Russian Federation. Address: 12, Neglinnaya str., Moscow 107016, Russian Federation.
DOI: 10.17323/1995-459x.2016.1.53.67
Citation: Gnidchenko А., Mogilat А., Mikheeva О., Salnikov V. (2016) Foreign Technology Transfer: An Assessment of Russia’s Economic Dependence on High-Tech Imports. Foresight and STI Governance, vol. 10, no 1, pp. 53–67. DOI: 10.17323/1995-459x.2016.1.53.67

54 FORESIGHT AND STI GOVERNANCE Vol. 10 No 1 2016
Innovation and Economy
Technology Transfer through High-tech ImportsResearch into international technology transfer peaked in the 1970s–1980s. As a general rule, scientific studies of the period focused on the relationship between research and development (R&D) and productivity in particular economic sectors or other indicators of technological development1. Nestor Terleckyj [Terleckyj, 1974] identified two types of impact R&D can have on productivity in industrial sectors2: a direct impact on a sector where R&D is taking place and an indirect impact on other sectors through the use of intermediate and investment goods from sectors where R&D is being conducted.3 Terleckyj showed the relative strength of an indirect impact from R&D compared with a direct impact. Furthermore, in a similar analysis that Terleckyj carried out at a later date on non-industrial sectors, he demonstrated that the direct impact of R&D was extremely small and that the indirect impact was quite large [Terleckyj, 1980].Frederic Scherer [Scherer, 1982] developed a matrix of technological processes in the US based on data on R&D carried out at 443 corporations representing 276 sectors and national patent activity. By breaking down R&D sectors of origin and use into internal and imported from other industries4, he showed that the latter had a more pronounced impact on growth in productivity. However, the results were inconsistent. Within two years, more detailed research by Zvi Griliches and Frank Lichtenberg [Griliches, Lichtenberg, 1984] demonstrated that it was more R&D sector of origin than sector of use that had a positive impact on growth in productivity.In the 1990s, a number of important studies were carried out in the US showing, on the one hand, that growth in productivity in sectors producing intermediate products has an impact on growth in productivity in those sectors which demand such products [Wolff, Nadiri, 1993]. On the other hand, based on statistics on the share of imports in GDP and total investment in R&D, it was shown that the total factor productivity of a country is heavily dependent on R&D investment in that country’s trading partners [Coe, Helpman, 1995]. This result proved to be an important step towards empirical corroboration of technology transfer through goods imports.5
Specialists at the OECD Directorate for Science, Technology and Industry published an in-depth study on technology transfer through goods imports between 10 member states [Papaconstantinou et al., 1996]6 which contains several interesting findings. First, R&D expenditure is predominantly concentrated in only a certain number of 35 sectors: the top five in which R&D is carried out account for between 60% and 80% of R&D expenditure, while the top five sectors which use R&D in the form of intermediate and investment goods make up only 40–50% of expenditure. Thus, the supply of high-tech goods is far more centralized than demand.7 Furthermore, while demand varies by sector, technology supply predominantly originates in industrial sectors. Second, in seven of the ten OECD member states studied (Australia, Canada, Denmark, France, Italy, the Netherlands, and the United Kingdom i.e. not US, Germany and Japan), technology imports were more important than domestic R&D, which points to its value as a technology diffusion mechanism. Finally, the authors broke down imports into intermediate and investment goods and revealed the virtually equal importance of both channels with a slight advantage of the former.As Wolfgang Keller [Keller, 2000] showed in his case study of eight OECD member states, unlike the typical country structure (from the perspective of the share of technological leaders), goods imports even have an impact on total factor productivity in developed economies. According to Keller’s assessment, in view of the differences in imports structure, this effect is most pronounced in developing countries. His analysis also corroborated the fact that the productivity of OECD member states is more dependent on domestic R&D than foreign. He predicted the opposite for developing countries, with high-tech imports the main channel of technology transfer.Similar studies were carried out for investment goods which showed that imports of investment goods play a greater role in technology transfer compared with intermediate and finished goods [Xu, Wang, 1999]. Subsequently, however, no consensus has been reached on these findings: different studies value investment and intermediate goods differently. A later approach examined the differentiation of the
1 The level of technological development is most frequently taken to mean total factor productivity in a production function.2 The idea of conceiving R&D as an additional factor of production alongside labour and capital was first formulated by Zvi
Griliches [Griliches, 1973].3 The input-output model was used to assess the indirect impact of R&D. Calculations have been carried out for the US economy.4 For every single patent, the sectors of origin and expected use were identified, together with the cost of the R&D associated with
the patent in US dollars, which was then distributed among the sectors of use, allowing a matrix resembling the input-output model to be formulated. The row total in the technological process matrices showed R&D sector of origin, the column total R&D sector of use, and diagonals R&D carried out and used in a single sector.
5 Imports of specific goods were not examined at the time, so the conclusions were derived exclusively by combining the factors ‘share of imports in GDP’ and ‘total investment in R&D abroad’ and were extremely general. However, this work was unique as it was one of the first to summarize data on a relatively large number of countries — 22.
6 Like in Terleckyj’s work, to model the connections between economic sectors in OECD member states, the authors used the input-output model.
7 We note that this fact is fully in line with Terleckyj’s findings described above on the stronger indirect impact of R&D on productivity.
2016 Vol. 10 No 1 FORESIGHT AND STI GOVERNANCE 55
capital structure (imported investment goods) in a production function as one of the most important sources of difference in the total factor productivity of countries [Caselli, Wilson, 2004].8 It was shown that high-tech types of capital (computers, aerospace, communications and electrical equipment) can only be used effectively in countries that are developed from the perspective of human capital, the amount of foreign direct investment (FDI) and intellectual property rights protection.Recent works have studied in greater depth the dependent relationship between the effectiveness of technology transfer through goods imports and the characteristics of a country [Stone, Shepherd, 2011]. Key parameters for intermediate goods are access to funding and a qualified work force, and for investment goods access to funding and macroeconomic stability.9
Imports as a channel for technology transfer have been examined alongside other factors in the academic literature, predominantly FDI. One of the first works devoted to goods imports and FDI as a channel for technology transfer [Lichtenberg, van Pottelsberghe de la Potterie, 1998] concluded that there was a weak effect on the productivity of incoming FDI, unlike outgoing, under high import volumes. This is also corroborated by subsequent studies [Zhu, Jeon, 2007; Krammer, 2014].10
Finally, there is evidence of a positive impact of high-tech goods imports on exports. Thus, imports of intermediate goods from OECD countries provoked higher export growth in Chinese businesses than imports from other countries. On the whole, imports of this category of goods had a greater effect from the perspective of export growth in sectors with high R&D intensity [Feng et al., 2012]. This effect results from the growth in productivity, reduction in costs and local stakeholders gaining access to technologies clearing the way to foreign markets, all caused by imports of intermediate and investment goods [Bas, Strauss-Kahn, 2014].11
From the above literature review, we can draw several important conclusions:• it would be sensible to limit the analysis of technology transfer to the main transfer channel of high-
tech imports;• high-tech intermediate and investment goods should be viewed together: there are no signs of
a preference for either as channels for technology transfer;• high-tech imports are an integral part of modern economies’ foreign economic activity, especially
in emerging economies. Thus, an inter-country comparison would be effective in determining dependence on imports;
• in order to adequately evaluate the current technological level of a sector, analysis needs to take account of the volume of both goods imports and exports.
Approaches to Classifying High-Tech GoodsTo determine the technological level of a sector or product, three approaches are generally used in global practice.1) Industry sectors are ranked according to their technological level based on data on the ratio of R&D expenditure to added value or output.In the second version of the ISIC classification (International Standard Industrial Classification of All Economic Activities) in 1997, the OECD Directorate for Science, Technology and Industry proposed grouping economic sectors by technological level depending on the intensity of R&D expenditure, calculated as the ratio of R&D spending to added value [Hatzichronoglou, 1997]. Sectors were therefore divided into four groups: high-technology, medium-high technology, medium-low technology and low-technology. Later, in ISIC version three, sectors were grouped based on assessments of their R&D expenditure relative to the added value of the output and gross production volume. Under this variant, the make-up of the groups changed somewhat: the high-technology group included sectors such as aircraft production, office equipment and computer equipment, radio, TV and communications equipment, medical and precision instruments, and pharmaceuticals, and the medium-high-technology group covered other machinery and equipment not elsewhere classified (electrical machinery, motor vehicles and railroad transport) and chemicals, excluding pharmaceuticals [OECD, 2011].2) Industrial goods are ranked according to their technological level based on data on R&D expenditure per unit of output.Together with the German Fraunhofer Institute in 1994, the OECD Secretariat drafted a list of high-tech goods in line with the Standard International Trade Classification (SITC), version 3. Products were
8 The capital structure in this model has an impact on productivity due to the fact that all nine types identified have different levels of effectiveness domestically. For the majority of developing countries, the authors note that imports of certain types of investment goods serve as a fairly accurate measure of the amount of investment in that type of equipment.
9 World Bank business surveys are one source: country conditions are assessed through the perception of company directors. As expected, the importance of financial restrictions when importing investment goods has been confirmed by business data in India [Bas, Berthou, 2012].
10 The importance of FDI has been confirmed, limited though it is. Factors such as the level of telephone communications [Zhu, Jeon, 2007] and non-resident patents in the country [Krammer, 2014] have also been studied.
11 This channel could take the form of creating new goods never produced before in the country thanks to access to imported intermediate goods which had never been imported before [Colantone, Crino, 2014].
Gnidchenko А. et al., pp. 53–67
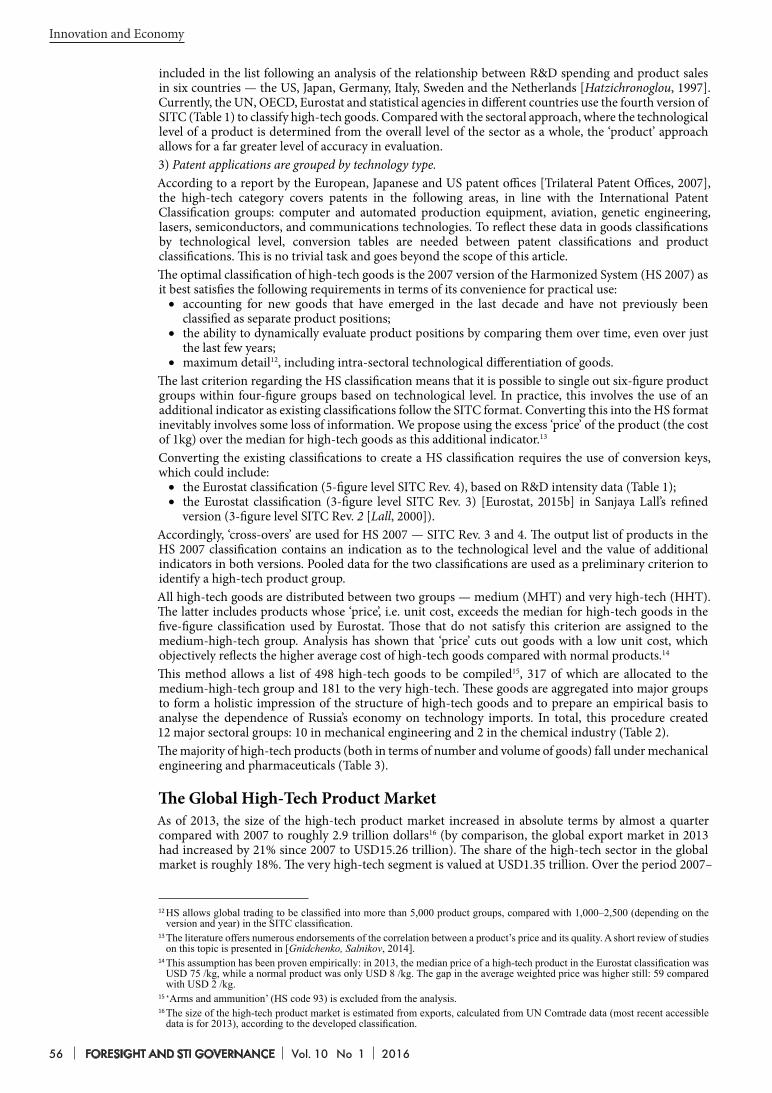
56 FORESIGHT AND STI GOVERNANCE Vol. 10 No 1 2016
Innovation and Economy
included in the list following an analysis of the relationship between R&D spending and product sales in six countries — the US, Japan, Germany, Italy, Sweden and the Netherlands [Hatzichronoglou, 1997]. Currently, the UN, OECD, Eurostat and statistical agencies in different countries use the fourth version of SITC (Table 1) to classify high-tech goods. Compared with the sectoral approach, where the technological level of a product is determined from the overall level of the sector as a whole, the ‘product’ approach allows for a far greater level of accuracy in evaluation.3) Patent applications are grouped by technology type.According to a report by the European, Japanese and US patent offices [Trilateral Patent Offices, 2007], the high-tech category covers patents in the following areas, in line with the International Patent Classification groups: computer and automated production equipment, aviation, genetic engineering, lasers, semiconductors, and communications technologies. To reflect these data in goods classifications by technological level, conversion tables are needed between patent classifications and product classifications. This is no trivial task and goes beyond the scope of this article.The optimal classification of high-tech goods is the 2007 version of the Harmonized System (HS 2007) as it best satisfies the following requirements in terms of its convenience for practical use:• accounting for new goods that have emerged in the last decade and have not previously been
classified as separate product positions;• the ability to dynamically evaluate product positions by comparing them over time, even over just
the last few years;• maximum detail12, including intra-sectoral technological differentiation of goods.
The last criterion regarding the HS classification means that it is possible to single out six-figure product groups within four-figure groups based on technological level. In practice, this involves the use of an additional indicator as existing classifications follow the SITC format. Converting this into the HS format inevitably involves some loss of information. We propose using the excess ‘price’ of the product (the cost of 1kg) over the median for high-tech goods as this additional indicator.13
Converting the existing classifications to create a HS classification requires the use of conversion keys, which could include:• the Eurostat classification (5-figure level SITC Rev. 4), based on R&D intensity data (Table 1);• the Eurostat classification (3-figure level SITC Rev. 3) [Eurostat, 2015b] in Sanjaya Lall’s refined
version (3-figure level SITC Rev. 2 [Lall, 2000]).Accordingly, ‘cross-overs’ are used for HS 2007 — SITC Rev. 3 and 4. The output list of products in the HS 2007 classification contains an indication as to the technological level and the value of additional indicators in both versions. Pooled data for the two classifications are used as a preliminary criterion to identify a high-tech product group.All high-tech goods are distributed between two groups — medium (MHT) and very high-tech (HHT). The latter includes products whose ‘price’, i.e. unit cost, exceeds the median for high-tech goods in the five-figure classification used by Eurostat. Those that do not satisfy this criterion are assigned to the medium-high-tech group. Analysis has shown that ‘price’ cuts out goods with a low unit cost, which objectively reflects the higher average cost of high-tech goods compared with normal products.14
This method allows a list of 498 high-tech goods to be compiled15, 317 of which are allocated to the medium-high-tech group and 181 to the very high-tech. These goods are aggregated into major groups to form a holistic impression of the structure of high-tech goods and to prepare an empirical basis to analyse the dependence of Russia’s economy on technology imports. In total, this procedure created 12 major sectoral groups: 10 in mechanical engineering and 2 in the chemical industry (Table 2).The majority of high-tech products (both in terms of number and volume of goods) fall under mechanical engineering and pharmaceuticals (Table 3).
The Global High-Tech Product MarketAs of 2013, the size of the high-tech product market increased in absolute terms by almost a quarter compared with 2007 to roughly 2.9 trillion dollars16 (by comparison, the global export market in 2013 had increased by 21% since 2007 to USD15.26 trillion). The share of the high-tech sector in the global market is roughly 18%. The very high-tech segment is valued at USD1.35 trillion. Over the period 2007–
12 HS allows global trading to be classified into more than 5,000 product groups, compared with 1,000–2,500 (depending on the version and year) in the SITC classification.
13 The literature offers numerous endorsements of the correlation between a product’s price and its quality. A short review of studies on this topic is presented in [Gnidchenko, Salnikov, 2014].
14 This assumption has been proven empirically: in 2013, the median price of a high-tech product in the Eurostat classification was USD 75 /kg, while a normal product was only USD 8 /kg. The gap in the average weighted price was higher still: 59 compared with USD 2 /kg.
15 ‘Arms and ammunition’ (HS code 93) is excluded from the analysis.16 The size of the high-tech product market is estimated from exports, calculated from UN Comtrade data (most recent accessible
data is for 2013), according to the developed classification.
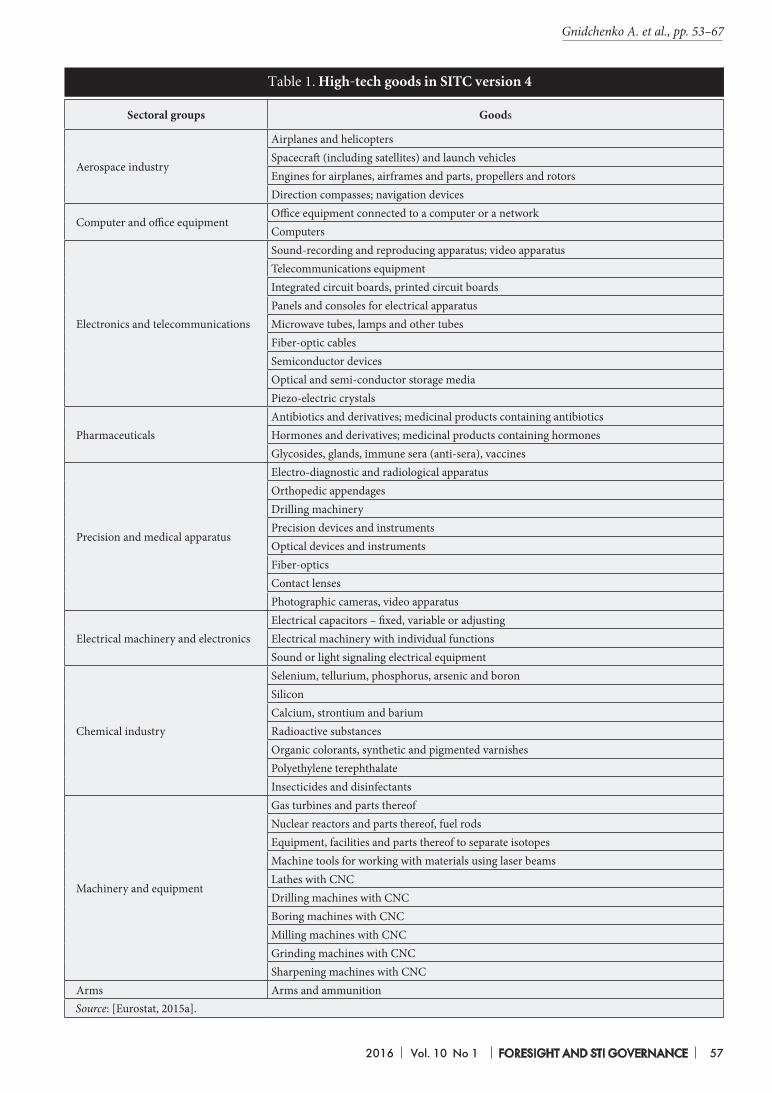
2016 Vol. 10 No 1 FORESIGHT AND STI GOVERNANCE 57
Тable 1. High-tech goods in SITC version 4
Sectoral groups Goods
Aerospace industry
Airplanes and helicoptersSpacecraft (including satellites) and launch vehiclesEngines for airplanes, airframes and parts, propellers and rotorsDirection compasses; navigation devices
Computer and office equipmentOffice equipment connected to a computer or a networkComputers
Electronics and telecommunications
Sound-recording and reproducing apparatus; video apparatusTelecommunications equipmentIntegrated circuit boards, printed circuit boardsPanels and consoles for electrical apparatusMicrowave tubes, lamps and other tubesFiber-optic cablesSemiconductor devicesOptical and semi-conductor storage mediaPiezo-electric crystals
PharmaceuticalsAntibiotics and derivatives; medicinal products containing antibioticsHormones and derivatives; medicinal products containing hormonesGlycosides, glands, immune sera (anti-sera), vaccines
Precision and medical apparatus
Electro-diagnostic and radiological apparatusOrthopedic appendagesDrilling machineryPrecision devices and instrumentsOptical devices and instrumentsFiber-opticsContact lensesPhotographic cameras, video apparatus
Electrical machinery and electronicsElectrical capacitors – fixed, variable or adjustingElectrical machinery with individual functionsSound or light signaling electrical equipment
Chemical industry
Selenium, tellurium, phosphorus, arsenic and boronSiliconCalcium, strontium and bariumRadioactive substancesOrganic colorants, synthetic and pigmented varnishesPolyethylene terephthalateInsecticides and disinfectants
Machinery and equipment
Gas turbines and parts thereofNuclear reactors and parts thereof, fuel rodsEquipment, facilities and parts thereof to separate isotopesMachine tools for working with materials using laser beamsLathes with CNCDrilling machines with CNCBoring machines with CNCMilling machines with CNCGrinding machines with CNCSharpening machines with CNC
Arms Arms and ammunitionSource: [Eurostat, 2015a].
Gnidchenko А. et al., pp. 53–67

58 FORESIGHT AND STI GOVERNANCE Vol. 10 No 1 2016
Innovation and Economy
Tech
nolo
gica
l lev
el
Tota
l
Chemical Industry Mechanical Engineering
Phar
mac
eutic
als
Che
mis
try
(exc
ludi
ng
phar
mac
eutic
als)
Nuc
lear
tech
nolo
gies
Engi
nes a
nd tu
rbin
es
Mac
hine
ry a
nd e
quip
men
t (e
xclu
ding
nuc
lear
te
chno
logi
es, e
ngin
es a
nd
turb
ines
)
Rad
io, T
V, co
mm
unic
atio
ns
Oth
er el
ectr
ical
equ
ipm
ent
Com
pute
r equ
ipm
ent
Opt
ical
equ
ipm
ent
Med
ical
equ
ipm
ent
Prec
isio
n in
stru
men
ts
Air
craft
Number of goods (6-figure HS 2007)HT 498 29 90 4 23 38 68 103 9 42 20 57 15
MHT 317 14 59 3 15 36 34 98 4 24 3 25 2HHT 181 15 31 1 8 2 34 5 5 18 17 32 13
Global imports in 2013 (billions of dollars)HT 3477 469 125 5 132 91 1301 408 403 103 77 174 189
MHT 1530 305 87 4 27 88 328 392 130 80 10 77 2HHT 1947 164 38 1 105 3 973 16 273 23 66 98 187
Global imports structure in 2013 (%)HT 100 13.5 3.6 0.1 3.8 2.6 37.4 11.7 11.6 3.0 2.2 5.0 5.4
MHT 100 19.9 5.7 0.3 1.8 5.8 21.4 25.6 8.5 5.2 0.7 5.0 0.1HHT 100 8.4 2.0 0.03 5.4 0.2 50.0 0.8 14.0 1.2 3.4 5.0 9.6
Global net exports in 2013 (billions of dollars)HT –187 5 –9 –0.4 –12 1 –203 17 –273 8 –1 5 –5
MHT 13 0.3 0.2 0.2 0.2 2 –31 18 -1 10 0.3 1 0.4HHT –200 5 –9 –1 –12 –1 –172 –0.3 –273 –2 –2 3 –6
Legend: HT — high-tech exports; MHT — medium-high-tech exports; HHT — very high-tech exports.
Source: authors’ calculations from UN Comtrade database.
Тable 3. Distribution of high-tech goods by major group
Тable 2. Proposed classification based on major groups
Major group OKVED code HS 2007 code
Chemical IndustryPharmaceuticals 24.4 30Chemistry (excluding pharmaceuticals) DG, DH 28-29, 31-40
Mechanical EngineeringNuclear technologies 28.30.2 8401Engines and turbines DK 8406-8412Machinery and equipment (excluding nuclear technologies, engines and turbines) DK 8402-8405, 8413-8470, 8472, 847310, 847321, 847329, 847340, 847350, 8474-
8487Radio, TV, communications DL 8517-8529, 8533-8534, 8540-8542Other electrical equipment DL 8501-8516, 8530-8532, 8535-8539, 8543-8548Computer equipment DL 8471, 847330Optical equipment DL 9001-9013Medical equipment DL 9018-9022Precision instruments DL 9014-9017, 9023, 91Aircraft DM 86-89
Source: compiled by the authors from UN Comtrade database.
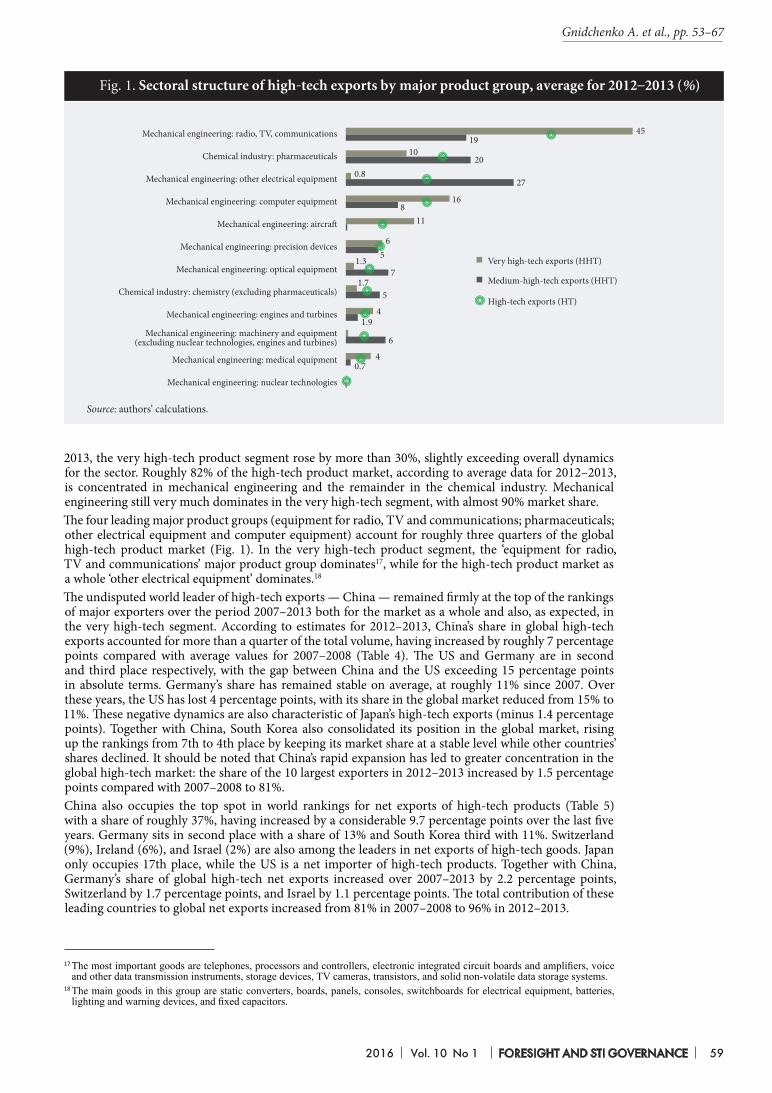
2016 Vol. 10 No 1 FORESIGHT AND STI GOVERNANCE 59
2013, the very high-tech product segment rose by more than 30%, slightly exceeding overall dynamics for the sector. Roughly 82% of the high-tech product market, according to average data for 2012–2013, is concentrated in mechanical engineering and the remainder in the chemical industry. Mechanical engineering still very much dominates in the very high-tech segment, with almost 90% market share.The four leading major product groups (equipment for radio, TV and communications; pharmaceuticals; other electrical equipment and computer equipment) account for roughly three quarters of the global high-tech product market (Fig. 1). In the very high-tech product segment, the ‘equipment for radio, TV and communications’ major product group dominates17, while for the high-tech product market as a whole ‘other electrical equipment’ dominates.18
The undisputed world leader of high-tech exports — China — remained firmly at the top of the rankings of major exporters over the period 2007–2013 both for the market as a whole and also, as expected, in the very high-tech segment. According to estimates for 2012–2013, China’s share in global high-tech exports accounted for more than a quarter of the total volume, having increased by roughly 7 percentage points compared with average values for 2007–2008 (Table 4). The US and Germany are in second and third place respectively, with the gap between China and the US exceeding 15 percentage points in absolute terms. Germany’s share has remained stable on average, at roughly 11% since 2007. Over these years, the US has lost 4 percentage points, with its share in the global market reduced from 15% to 11%. These negative dynamics are also characteristic of Japan’s high-tech exports (minus 1.4 percentage points). Together with China, South Korea also consolidated its position in the global market, rising up the rankings from 7th to 4th place by keeping its market share at a stable level while other countries’ shares declined. It should be noted that China’s rapid expansion has led to greater concentration in the global high-tech market: the share of the 10 largest exporters in 2012–2013 increased by 1.5 percentage points compared with 2007–2008 to 81%.China also occupies the top spot in world rankings for net exports of high-tech products (Table 5) with a share of roughly 37%, having increased by a considerable 9.7 percentage points over the last five years. Germany sits in second place with a share of 13% and South Korea third with 11%. Switzerland (9%), Ireland (6%), and Israel (2%) are also among the leaders in net exports of high-tech goods. Japan only occupies 17th place, while the US is a net importer of high-tech products. Together with China, Germany’s share of global high-tech net exports increased over 2007–2013 by 2.2 percentage points, Switzerland by 1.7 percentage points, and Israel by 1.1 percentage points. The total contribution of these leading countries to global net exports increased from 81% in 2007–2008 to 96% in 2012–2013.
Very high-tech exports (ННТ)
Medium-high-tech exports (ННТ)
High-tech exports (НТ)
Source: authors’ calculations.
Fig. 1. Sectoral structure of high-tech exports by major product group, average for 2012–2013 (%)
17 The most important goods are telephones, processors and controllers, electronic integrated circuit boards and amplifiers, voice and other data transmission instruments, storage devices, TV cameras, transistors, and solid non-volatile data storage systems.
18 The main goods in this group are static converters, boards, panels, consoles, switchboards for electrical equipment, batteries, lighting and warning devices, and fixed capacitors.
Mechanical engineering: radio, TV, communications
Chemical industry: pharmaceuticals
Mechanical engineering: other electrical equipment
Mechanical engineering: computer equipment
Mechanical engineering: aircraft
Mechanical engineering: precision devices
Mechanical engineering: optical equipment
Chemical industry: chemistry (excluding pharmaceuticals)
Mechanical engineering: engines and turbines
Mechanical engineering: medical equipment
Mechanical engineering: nuclear technologies
Mechanical engineering: machinery and equipment (excluding nuclear technologies, engines and turbines)
0.74
6
1.94
51.7
71.3
65
11
168
0.827
2010
1945
Gnidchenko А. et al., pp. 53–67
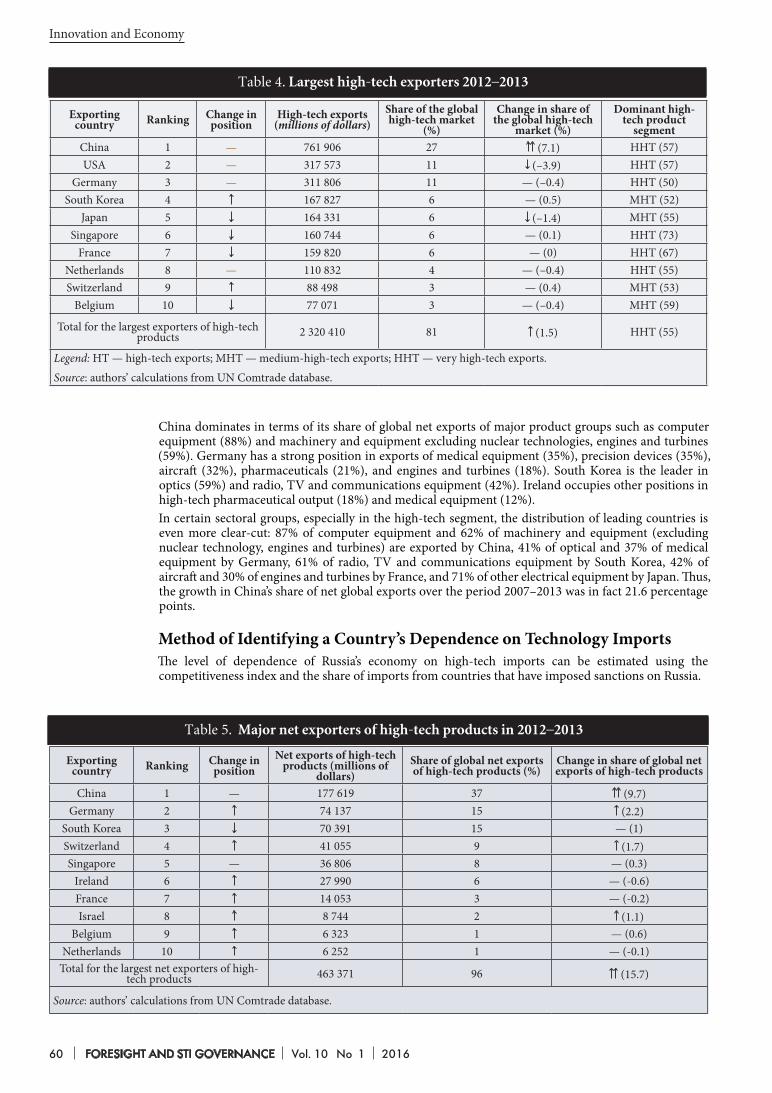
60 FORESIGHT AND STI GOVERNANCE Vol. 10 No 1 2016
Innovation and Economy
China dominates in terms of its share of global net exports of major product groups such as computer equipment (88%) and machinery and equipment excluding nuclear technologies, engines and turbines (59%). Germany has a strong position in exports of medical equipment (35%), precision devices (35%), aircraft (32%), pharmaceuticals (21%), and engines and turbines (18%). South Korea is the leader in optics (59%) and radio, TV and communications equipment (42%). Ireland occupies other positions in high-tech pharmaceutical output (18%) and medical equipment (12%).In certain sectoral groups, especially in the high-tech segment, the distribution of leading countries is even more clear-cut: 87% of computer equipment and 62% of machinery and equipment (excluding nuclear technology, engines and turbines) are exported by China, 41% of optical and 37% of medical equipment by Germany, 61% of radio, TV and communications equipment by South Korea, 42% of aircraft and 30% of engines and turbines by France, and 71% of other electrical equipment by Japan. Thus, the growth in China’s share of net global exports over the period 2007–2013 was in fact 21.6 percentage points.
Method of Identifying a Country’s Dependence on Technology ImportsThe level of dependence of Russia’s economy on high-tech imports can be estimated using the competitiveness index and the share of imports from countries that have imposed sanctions on Russia.
Тable 4. Largest high-tech exporters 2012–2013
Exporting country Ranking Change in
positionHigh-tech exports
(millions of dollars)Share of the global high-tech market
(%)
Change in share of the global high-tech
market (%)
Dominant high-tech product
segmentChina 1 — 761 906 27 (7.1) HHT (57)USA 2 — 317 573 11 (–3.9) HHT (57)
Germany 3 — 311 806 11 — (–0.4) HHT (50)South Korea 4 167 827 6 — (0.5) MHT (52)
Japan 5 164 331 6 (–1.4) MHT (55)Singapore 6 160 744 6 — (0.1) HHT (73)
France 7 159 820 6 — (0) HHT (67)Netherlands 8 — 110 832 4 — (–0.4) HHT (55)Switzerland 9 88 498 3 — (0.4) MHT (53)
Belgium 10 77 071 3 — (–0.4) MHT (59)
Total for the largest exporters of high-tech products 2 320 410 81 (1.5) HHT (55)
Legend: HT — high-tech exports; MHT — medium-high-tech exports; HHT — very high-tech exports.
Source: authors’ calculations from UN Comtrade database.
Exporting country Ranking Change in
positionNet exports of high-tech
products (millions of dollars)
Share of global net exports of high-tech products (%)
Change in share of global net exports of high-tech products
China 1 — 177 619 37 (9.7)Germany 2 74 137 15 (2.2)
South Korea 3 70 391 15 — (1)Switzerland 4 41 055 9 (1.7)Singapore 5 — 36 806 8 — (0.3)
Ireland 6 27 990 6 — (-0.6)France 7 14 053 3 — (-0.2)Israel 8 8 744 2 (1.1)
Belgium 9 6 323 1 — (0.6)Netherlands 10 6 252 1 — (-0.1)
Total for the largest net exporters of high-tech products 463 371 96 (15.7)
Source: authors’ calculations from UN Comtrade database.
Тable 5. Major net exporters of high-tech products in 2012–2013
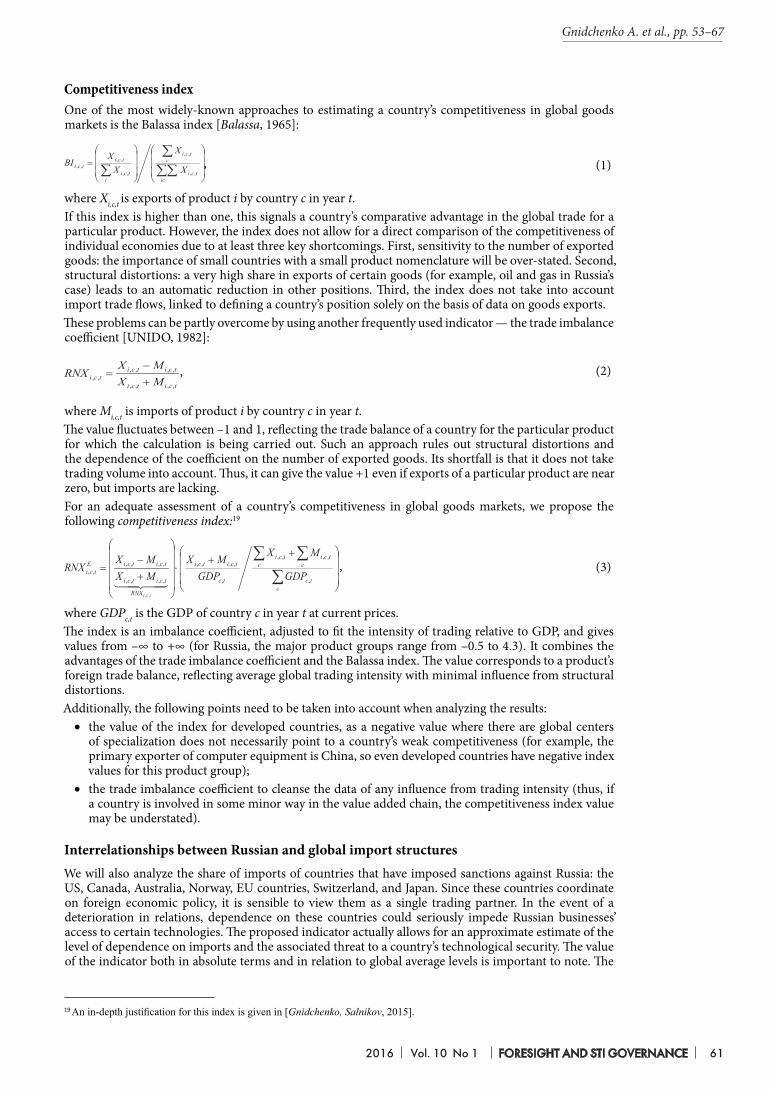
2016 Vol. 10 No 1 FORESIGHT AND STI GOVERNANCE 61
Competitiveness indexOne of the most widely-known approaches to estimating a country’s competitiveness in global goods markets is the Balassa index [Balassa, 1965]:
=
∑∑∑
∑ic
tci
ctci
itci
tcitci X
X
XX
BI,,
,,
,,
,,,, ,
where Xi,c,t is exports of product i by country c in year t.If this index is higher than one, this signals a country’s comparative advantage in the global trade for a particular product. However, the index does not allow for a direct comparison of the competitiveness of individual economies due to at least three key shortcomings. First, sensitivity to the number of exported goods: the importance of small countries with a small product nomenclature will be over-stated. Second, structural distortions: a very high share in exports of certain goods (for example, oil and gas in Russia’s case) leads to an automatic reduction in other positions. Third, the index does not take into account import trade flows, linked to defining a country’s position solely on the basis of data on goods exports.These problems can be partly overcome by using another frequently used indicator — the trade imbalance coefficient [UNIDO, 1982]:
tcitci
tcitcitci MX
MXRNX
,,,,
,,,,,, +
−= ,
where Mi,c,t is imports of product i by country c in year t.The value fluctuates between –1 and 1, reflecting the trade balance of a country for the particular product for which the calculation is being carried out. Such an approach rules out structural distortions and the dependence of the coefficient on the number of exported goods. Its shortfall is that it does not take trading volume into account. Thus, it can give the value +1 even if exports of a particular product are near zero, but imports are lacking.For an adequate assessment of a country’s competitiveness in global goods markets, we propose the following competitiveness index:19
++
⋅
+−
=∑
∑∑
ctc
ctci
ctci
tc
tcitci
RNX
tcitci
tcitciEtci GDP
MX
GDPMX
MXMX
RNX
tci
,
,,,,
,
,,,,
,,,,
,,,,,,
,,
,
where GDPc,t is the GDP of country c in year t at current prices.The index is an imbalance coefficient, adjusted to fit the intensity of trading relative to GDP, and gives values from –∞ to +∞ (for Russia, the major product groups range from –0.5 to 4.3). It combines the advantages of the trade imbalance coefficient and the Balassa index. The value corresponds to a product’s foreign trade balance, reflecting average global trading intensity with minimal influence from structural distortions.Additionally, the following points need to be taken into account when analyzing the results:• the value of the index for developed countries, as a negative value where there are global centers
of specialization does not necessarily point to a country’s weak competitiveness (for example, the primary exporter of computer equipment is China, so even developed countries have negative index values for this product group);
• the trade imbalance coefficient to cleanse the data of any influence from trading intensity (thus, if a country is involved in some minor way in the value added chain, the competitiveness index value may be understated).
Interrelationships between Russian and global import structuresWe will also analyze the share of imports of countries that have imposed sanctions against Russia: the US, Canada, Australia, Norway, EU countries, Switzerland, and Japan. Since these countries coordinate on foreign economic policy, it is sensible to view them as a single trading partner. In the event of a deterioration in relations, dependence on these countries could seriously impede Russian businesses’ access to certain technologies. The proposed indicator actually allows for an approximate estimate of the level of dependence on imports and the associated threat to a country’s technological security. The value of the indicator both in absolute terms and in relation to global average levels is important to note. The
19 An in-depth justification for this index is given in [Gnidchenko, Salnikov, 2015].
(1)
(2)
(3)
Gnidchenko А. et al., pp. 53–67
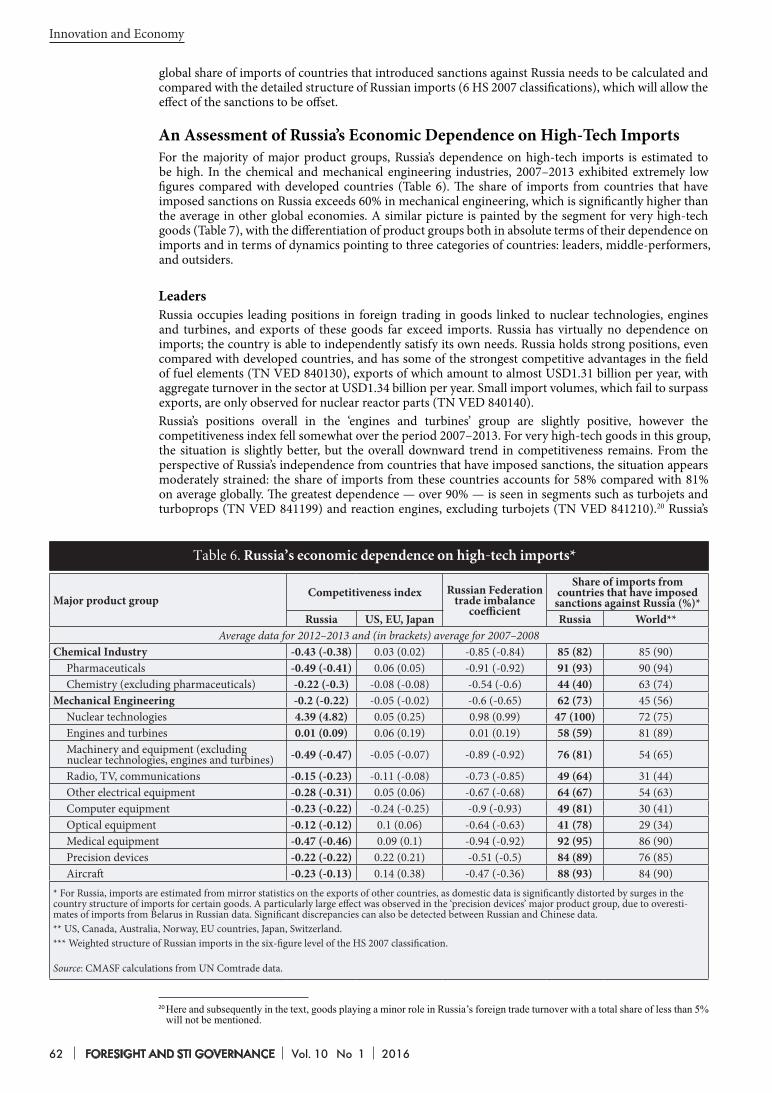
62 FORESIGHT AND STI GOVERNANCE Vol. 10 No 1 2016
Innovation and Economy
global share of imports of countries that introduced sanctions against Russia needs to be calculated and compared with the detailed structure of Russian imports (6 HS 2007 classifications), which will allow the effect of the sanctions to be offset.
An Assessment of Russia’s Economic Dependence on High-Tech ImportsFor the majority of major product groups, Russia’s dependence on high-tech imports is estimated to be high. In the chemical and mechanical engineering industries, 2007–2013 exhibited extremely low figures compared with developed countries (Table 6). The share of imports from countries that have imposed sanctions on Russia exceeds 60% in mechanical engineering, which is significantly higher than the average in other global economies. A similar picture is painted by the segment for very high-tech goods (Table 7), with the differentiation of product groups both in absolute terms of their dependence on imports and in terms of dynamics pointing to three categories of countries: leaders, middle-performers, and outsiders.
LeadersRussia occupies leading positions in foreign trading in goods linked to nuclear technologies, engines and turbines, and exports of these goods far exceed imports. Russia has virtually no dependence on imports; the country is able to independently satisfy its own needs. Russia holds strong positions, even compared with developed countries, and has some of the strongest competitive advantages in the field of fuel elements (TN VED 840130), exports of which amount to almost USD1.31 billion per year, with aggregate turnover in the sector at USD1.34 billion per year. Small import volumes, which fail to surpass exports, are only observed for nuclear reactor parts (TN VED 840140).Russia’s positions overall in the ‘engines and turbines’ group are slightly positive, however the competitiveness index fell somewhat over the period 2007–2013. For very high-tech goods in this group, the situation is slightly better, but the overall downward trend in competitiveness remains. From the perspective of Russia’s independence from countries that have imposed sanctions, the situation appears moderately strained: the share of imports from these countries accounts for 58% compared with 81% on average globally. The greatest dependence — over 90% — is seen in segments such as turbojets and turboprops (TN VED 841199) and reaction engines, excluding turbojets (TN VED 841210).20 Russia’s
Major product groupCompetitiveness index Russian Federation
trade imbalance coefficient
Share of imports from countries that have imposed
sanctions against Russia (%)*Russia US, EU, Japan Russia World**
Average data for 2012–2013 and (in brackets) average for 2007–2008Chemical Industry -0.43 (-0.38) 0.03 (0.02) -0.85 (-0.84) 85 (82) 85 (90)
Pharmaceuticals -0.49 (-0.41) 0.06 (0.05) -0.91 (-0.92) 91 (93) 90 (94)Chemistry (excluding pharmaceuticals) -0.22 (-0.3) -0.08 (-0.08) -0.54 (-0.6) 44 (40) 63 (74)
Mechanical Engineering -0.2 (-0.22) -0.05 (-0.02) -0.6 (-0.65) 62 (73) 45 (56)Nuclear technologies 4.39 (4.82) 0.05 (0.25) 0.98 (0.99) 47 (100) 72 (75)Engines and turbines 0.01 (0.09) 0.06 (0.19) 0.01 (0.19) 58 (59) 81 (89)Machinery and equipment (excluding
nuclear technologies, engines and turbines) -0.49 (-0.47) -0.05 (-0.07) -0.89 (-0.92) 76 (81) 54 (65)
Radio, TV, communications -0.15 (-0.23) -0.11 (-0.08) -0.73 (-0.85) 49 (64) 31 (44)Other electrical equipment -0.28 (-0.31) 0.05 (0.06) -0.67 (-0.68) 64 (67) 54 (63)Computer equipment -0.23 (-0.22) -0.24 (-0.25) -0.9 (-0.93) 49 (81) 30 (41)Optical equipment -0.12 (-0.12) 0.1 (0.06) -0.64 (-0.63) 41 (78) 29 (34)Medical equipment -0.47 (-0.46) 0.09 (0.1) -0.94 (-0.92) 92 (95) 86 (90)Precision devices -0.22 (-0.22) 0.22 (0.21) -0.51 (-0.5) 84 (89) 76 (85)Aircraft -0.23 (-0.13) 0.14 (0.38) -0.47 (-0.36) 88 (93) 84 (90)
* For Russia, imports are estimated from mirror statistics on the exports of other countries, as domestic data is significantly distorted by surges in the country structure of imports for certain goods. A particularly large effect was observed in the ‘precision devices’ major product group, due to overesti-mates of imports from Belarus in Russian data. Significant discrepancies can also be detected between Russian and Chinese data.** US, Canada, Australia, Norway, EU countries, Japan, Switzerland.*** Weighted structure of Russian imports in the six-figure level of the HS 2007 classification.
Source: CMASF calculations from UN Comtrade data.
Тable 6. Russia’s economic dependence on high-tech imports*
20 Here and subsequently in the text, goods playing a minor role in Russia’s foreign trade turnover with a total share of less than 5% will not be mentioned.
2016 Vol. 10 No 1 FORESIGHT AND STI GOVERNANCE 63
key partners in this sector are Ukraine (36% of imports in 2012–2013), Germany (16%), Italy and France (7% each), the UK (5%), and the US (4%).Analysis of the specific nature of the specialization in certain goods means that Russia can be categorized as a niche producer. The competitiveness index of developed countries, which is positive for a wide range of goods, is only significantly positive in the case of Russia for turbojets with thrust over 25 kN (TN VED 841112), reaction engines, excluding turbojets (TN VED 841210), and gas turbines with a maximum power of 5,000 kW (TN VED 841181). For water turbines and water wheels (TN VED 841090), Russia lost its leadership over the course of the analyzed time period, while for turboprops with power over 1,100 kW (TN VED 841122) and without, its critical dependence on imports has significantly intensified.
Middle-performers7 major product groups can be classed as middle-performers.For the ‘chemistry (excluding pharmaceuticals)’ group, Russia’s competitiveness can be described as slightly negative. In the very high-tech segment, the situation is somewhat worse than for high-tech goods on average. Russia’s competitiveness in this major group is on the whole worse than that of developed economies. With the significant overall reduction in Russia’s dependence on imports, especially from the countries that have imposed sanctions, this figure increased slightly over the period 2007–2013, which can be explained by the change in the product structure of imports: a fall in the share of polyethylene terephthalate (TN VED 390760) and an increase in the share of natural uranium (TN VED 284410).The dependence of developed countries is determined by the position of uranium in the imports structure, whereas Russia, in addition to natural uranium, imports polyethylene terephthalate, herbicides (TN VED 380893), fungicides (TN VED 380892), and insecticides (TN VED 380891). Over the period 2007–2013, Russia consolidated its competitiveness for three main goods: polyethylene terephthalate (TN VED 390760), herbicides (TN VED 380893), and radioactive elements and isotopes (TN VED 284440). The largest decrease was seen in polypeptide hormones (TN VED 293719) and alkali and alkaline earth metals (TN VED 280512).For the ‘optical equipment’ group, Russia still maintains moderate and stable but weak positions. From 2007 onwards, there was a sharp decline in Russia’s dependence on imports from countries imposing sanctions — from 78% to 41%, however, this was largely due to growth in China’s share of imports from 21% to 88% for one of the largest product positions — liquid crystal instruments and devices (TN VED 901380). Dependence on imports of other goods from the ‘sanctioning’ countries, taking into account import volumes, did not reduce that dramatically on average — from 81% to 68%.
Major product groupCompetitiveness index
Russian Federation
trade imbalance coefficient
Share of imports from countries that have imposed
sanctions against Russia (%)*Russia US, EU, Japan Russia World**
Average data for 2012–2013 and (in brackets) average for 2007–2008Chemical Industry -0.33 (-0.35) 0.01 (0.00) -0.83 (-0.85) 82 (77) 93 (96)
Pharmaceuticals -0.31 (-0.32) 0.06 (0.08) -0.89 (-0.93) 97 (98) 95 (96)Chemistry (excluding pharmaceuticals) -0.44 (-0.45) -0.22 (-0.25) -0.67 (-0.53) 37 (30) 80 (94)
Mechanical Engineering -0.18 (-0.2) -0.07 (0.01) -0.63 (-0.66) 61 (77) 44 (58)Nuclear technologies 0.04 (1.33) 0.74 (0.34) 0.07 (0.69) 46 (100) 89 (91)Engines and turbines 0.06 (0.12) 0.03 (0.21) 0.1 (0.31) 55 (56) 83 (90)Machinery and equipment (excluding nuclear
technologies, engines and turbines) -0.09 (-0.09) -0.29 (-0.21) -0.25 (-0.28) 85 (79) 43 (62)
Radio, TV, communications -0.14 (-0.23) -0.11 (-0.04) -0.79 (-0.86) 45 (68) 29 (44)Other electrical equipment 0.04 (-0.02) 0.19 (0.19) 0.15 (-0.14) 78 (75) 45 (54)Computer equipment -0.25 (-0.22) -0.31 (-0.31) -0.92 (-0.94) 38 (80) 27 (41)Optical equipment -0.25 (-0.22) 0.18 (0.16) -0.55 (-0.62) 70 (83) 68 (63)Medical equipment -0.5 (-0.48) 0.09 (0.11) -0.95 (-0.93) 91 (95) 86 (90)Precision devices -0.26 (-0.28) 0.23 (0.23) -0.65 (-0.63) 90 (94) 77 (87)Aircraft -0.24 (-0.14) 0.14 (0.38) -0.5 (-0.36) 88 (93) 84 (90)
* US, Canada, Australia, Norway, EU countries, Japan, Switzerland.** Weighted structure of Russian imports in the six-figure level of the HS 2007 classification.
Source: CMASF calculations from UN Comtrade data (Russian imports from mirror statistics).
Тable 7. The Russian economy’s dependence on very high-tech imports*
Gnidchenko А. et al., pp. 53–67
64 FORESIGHT AND STI GOVERNANCE Vol. 10 No 1 2016
Innovation and Economy
Among its specialist areas are lasers (TN VED 901320), for which its competitiveness index moved from the negative into the positive over the period 2007–2013, lenses, prisms and mirrors (TN VED 900190), and monoculars and telescopes (TN VED 900580). A slight increase was recorded for all types of microscopes (TN VED 901210, 901180), excluding stereoscopic (TN 901110), which demonstrated acute negative trends. Of the major product groups, Russia’s competitiveness worsened for telescopic sights (TN VED 901310), binoculars (TN VED 900510), and projection screens (TN VED 901060).Russia’s competitiveness in precision devices can be described as moderately weak and relatively stable over the period 2007–2013 amid consistently positive values among developed countries. Russia’s dependence on imports from countries that have imposed sanctions is overall high for this sector (84%), especially for devices used in physical or chemical analysis (TN VED 902780), flow and liquid level control (TN VED 902610), liquid and gas characteristic control (TN VED 902680), and devices based on optical radiation (TN VED 902750). However, over the period 2007–2013, it reduced slightly due to growth in the shares of South Korea, China, and several other countries in imports of a wide range of highly important goods and a reduction in Germany’s share. The greatest reduction in the share of imports from ‘sanctioning’ countries was recorded in product groups such as automatic regulation and control devices (TN VED 903289), topographical, meteorological and geophysical devices (TN VED 901580), and parts for such devices (TN VED 901590).For the majority of product groups, Russia’s competitiveness index is in the negative. The exceptions are only aerospace navigation devices (TN VED 901420, 901480), demonstration instruments and models (TN VED 902300), and parts for compasses and navigation devices (TN VED 901490).21 For the majority of other goods, Russia finds itself highly dependent on imports. The worst situation is encountered with devices to detect and measure ionizing radiation (TN VED 903010): while in 2007–2008 the Russia’s competitiveness index was positive, in 2012–2013 it fell to –0.4. The competitiveness index is no higher than –0.4 for several other product groups too, including topographical, meteorological and geophysical devices and parts, flow and liquid level control, devices based on optical radiation, and devices for liquid and gas characteristic control.Over the period 2007–2013, Russia’s positions in the aircraft sector somewhat deteriorated, unlike developed countries, whose high competitiveness still shows negative trends, due to the gradual reduction in their share of the global market. The majority of goods in this group are very high-tech. Russia’s dependence on imports of aircraft from countries that have imposed sanctions is extremely high (88%), one of the most notable figures among the major product groups.22 The main countries supplying high-tech aircraft to Russia are France and the US, while developing countries are very poorly represented due to the specifics of the market. The key imported goods in this sector are airplanes with a mass over 15 t (TN VED 880240), spacecraft (TN VED 880260), and aircraft parts (TN VED 880330, 880390). For helicopters with a mass over 2 t (TN VED 880212) and for aircraft parts (TN VED 880390), the export-import balance has suffered a significant downturn, making a considerable contribution to the reduction in the sector’s overall competitiveness. Over the period 2007–2013, this figure increased slightly only for airplanes with a mass between 2 and 15 t (TN VED 880230) and airframes (TN VED 880320). For other goods, the country’s positions remain stable.In the ‘other electrical equipment’ group, Russia is maintaining stable but negative positions, while in the very high-tech goods segment,23 the competitiveness index over the period 2007–2013 moved into the positive. Russia’s dependence on countries imposing sanctions is relatively high due to the high proportion of German imports — 20% compared with 17% from China, with the gap gradually declining.24 Russia mostly imports power generators (TN VED 850239, 850220, 850212, 850211), boards, panels, and consoles (TN VED 853710), and lighting and visual warning devices (TN VED 851220) from Germany and static converters (TN VED 850440) and AC motors (TN VED 850153, 850140) from China. For almost all other goods, excluding lead batteries (TN VED 850710), Russia’s share of imports from countries imposing sanctions fell over the period 2007–2013.Specializing in signal generators and apparatus with specific functions (TN VED 854320) and equipment for rail and tram lines (TN VED 853010) does not offer Russia any significant advantages as these product groups are traded in comparatively small volumes. As for the rest, the highest level of dependence on imports is recorded in electrodes (TN VED 854519), machinery for metal welding (TN VED 851531) and electric generator sets (TN VED 850239, 850220). A significant improvement in Russia’s position over the period 2007–2013 is linked to these areas. A downturn in competitiveness has occurred in the major product groups of AC motors (TN VED 850152, 850153) and electrodes used in ovens (TN VED 854511).
21 It should be noted that in 2007–2013, Russia’s competitiveness in these areas intensified.22 A key contribution to this figure came from long-range aircraft, for which Russia’s dependence on imports from developed
countries is as high as 98%.23 The main products in the segment are electrodes used in ovens (TN VED 854511), polyphase AC motors with a power rating
over 75 kW (TN VED 850153), lead batteries (TN VED 850720), luminescent lamps with an incandescent cathode (TN VED 853931), and liquid-filled transformers (TN VED 850421).
24 Third place is occupied by Ukraine with 8%.
2016 Vol. 10 No 1 FORESIGHT AND STI GOVERNANCE 65
As for the ‘computer equipment’ group, Russia’s position has remained firmly negative. Despite a slightly more optimistic competitiveness index value, the trade imbalance coefficient points to imports far exceeding exports, which reflects the low level of trading intensity as a result of the country’s poor integration in global added value chains in this sphere. Developed economies are still characterized by a negative competitiveness index as China remains the undisputed leader of global exports. Over the period 2007–2013, its share rose from 36% to 43% and from 12% to 42% of Russia’s imports — mostly due to major products such as portable computer equipment (TN VED 847130) accounting for roughly 44% of imports in this product group. Interestingly, by 2012–2013, Russia’s dependence on imports from countries that have imposed sanctions dropped to virtually zero in this product area, while other goods remained almost unchanged, fluctuating between 65–85%. Therefore, while for the group overall Russia’s dependence on imports from ‘sanctioning’ countries over the period 2007–2013 declined from 81% to 49%, if we exclude portable computer equipment from the calculations, the shift is far more modest — from 86% to only 80%.We note that for this group Russia’s product specialism structure is virtually the same as that of the US, EU, and Japan. This means that there is a strong specialist center among developing countries —primarily, China which exports goods to developed countries, among others. Thus, Russia’s dependence on computer imports cannot be deemed excessive, but rather in line with global trends.For the ‘radio, TV and communications’ product group, the assessment of the previous group is generally fitting: Russia’s competitiveness index is firmly in the negative with a slight positive trend. This does not mean that the situation is critical due to the significant dependence on imports of this category of goods in developed countries too. Russia’s share of imports from countries that have imposed sanctions is relatively small in this sector, while dynamics are on the whole positive. As for the ‘computer equipment’ group, the main contribution to global exports and Russia’s imports comes from China. On a detailed level, over the period 2007–2013 Russia reduced its dependence on countries that have imposed sanctions for an extremely wide range of goods: telephones for mobile communications networks (TN VED 851712),25 voice and image processing systems (TN VED 851762), television receivers (TN VED 852872), processors and controllers (TN VED 854231), and many more (due to a global trend of China’s and other South East Asian countries’ growing competitiveness in this area).The situation with certain goods, however, was far less homogeneous than that of computer equipment. Despite the fact that developed countries are dependent on imports of the majority of product groups, they have their own areas of specialism, exporting radar equipment (TN VED 852610), processors and controllers (TN VED 854231), and storage devices (TN VED 854232). Russia’s competitiveness, even compared with developed countries, is only strong in radar equipment. The clearest dependence is seen in imports of voice and image transmission equipment (TN VED 851761), radio electronics (TN VED 852990), and radio navigation devices (TN VED 852691).
Outsiders3 major product groups can be classed as outsiders.Russia’s dependence on imports of pharmaceuticals is extremely high, while developed countries have fairly strong positions in this market. A similar situation can be seen in the very high-tech pharmaceuticals segment. In this area, Russia has been relatively highly and consistently dependent on imports from sanctions-imposing countries: their share of imports is over 90%, which is generally in line with the global average. Russia’s main partners in this product group are Germany and Belgium, with 19% and 13% of imports respectively. The strongest dependence on imports in major product groups can be observed in anti-sera (TN VED 300210), drugs containing alkaloids (TN VED 300440), corticosteroid hormones (TN VED 300432), and insulin (TN VED 300431).The level of concentration on the pharmaceutical market is extremely high – over 60% of Russian and global imports are in the product group ‘other medicinal products’ (TN VED 300490), which severely restricts the possibility of an in-depth analysis of the imports structure. Nevertheless, we can deduce that Russia has a direct dependence on imports (in the majority of cases, with negative trends) given the very strong competitiveness of the US, EU, and Japan across all product lines. Particularly pronounced is Russia’s dependence on drugs containing vitamins (TN VED 300450) and alkaloids.For the product group ‘machinery and equipment (excluding nuclear technologies, engines and turbines)’, Russia’s competitiveness index and trade imbalance coefficient are in a very poor position — roughly
–0.5 and –0.9 respectively. The positions of developed countries are generally balanced and cannot unequivocally be qualified as weak or strong. Russia’s economic dependence on imports of machinery and equipment in this group from countries that have imposed sanctions remains moderate overall
25 For telephones for mobile communications networks, over the period 2007–2013 there was an increase in the concentration of imports due to China taking up a dominant position in terms of export volumes to Russia. At the start of this period, countries such as Hungary, South Korea, and Finland competed directly with China. We note also that Russia’s imports in this group fell from more than USD 4 to 2.4 billion. This may be due to the growing share of imports of smartphones and tablets which can be classified as portable computer equipment (TN VED 847130).
Gnidchenko А. et al., pp. 53–67
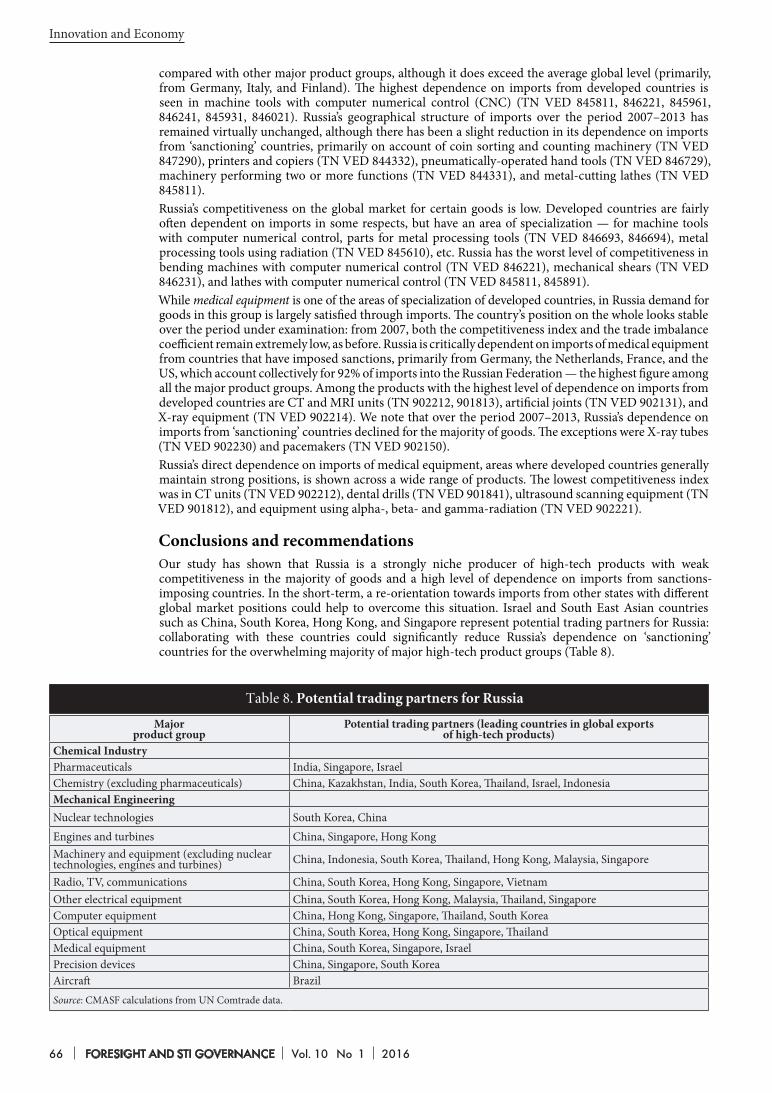
66 FORESIGHT AND STI GOVERNANCE Vol. 10 No 1 2016
Innovation and Economy
Majorproduct group
Potential trading partners (leading countries in global exports of high-tech products)
Chemical Industry Pharmaceuticals India, Singapore, IsraelChemistry (excluding pharmaceuticals) China, Kazakhstan, India, South Korea, Thailand, Israel, IndonesiaMechanical Engineering Nuclear technologies South Korea, ChinaEngines and turbines China, Singapore, Hong KongMachinery and equipment (excluding nuclear technologies, engines and turbines) China, Indonesia, South Korea, Thailand, Hong Kong, Malaysia, Singapore
Radio, TV, communications China, South Korea, Hong Kong, Singapore, VietnamOther electrical equipment China, South Korea, Hong Kong, Malaysia, Thailand, SingaporeComputer equipment China, Hong Kong, Singapore, Thailand, South KoreaOptical equipment China, South Korea, Hong Kong, Singapore, ThailandMedical equipment China, South Korea, Singapore, IsraelPrecision devices China, Singapore, South KoreaAircraft BrazilSource: CMASF calculations from UN Comtrade data.
Тable 8. Potential trading partners for Russia
compared with other major product groups, although it does exceed the average global level (primarily, from Germany, Italy, and Finland). The highest dependence on imports from developed countries is seen in machine tools with computer numerical control (CNC) (TN VED 845811, 846221, 845961, 846241, 845931, 846021). Russia’s geographical structure of imports over the period 2007–2013 has remained virtually unchanged, although there has been a slight reduction in its dependence on imports from ‘sanctioning’ countries, primarily on account of coin sorting and counting machinery (TN VED 847290), printers and copiers (TN VED 844332), pneumatically-operated hand tools (TN VED 846729), machinery performing two or more functions (TN VED 844331), and metal-cutting lathes (TN VED 845811).Russia’s competitiveness on the global market for certain goods is low. Developed countries are fairly often dependent on imports in some respects, but have an area of specialization — for machine tools with computer numerical control, parts for metal processing tools (TN VED 846693, 846694), metal processing tools using radiation (TN VED 845610), etc. Russia has the worst level of competitiveness in bending machines with computer numerical control (TN VED 846221), mechanical shears (TN VED 846231), and lathes with computer numerical control (TN VED 845811, 845891).While medical equipment is one of the areas of specialization of developed countries, in Russia demand for goods in this group is largely satisfied through imports. The country’s position on the whole looks stable over the period under examination: from 2007, both the competitiveness index and the trade imbalance coefficient remain extremely low, as before. Russia is critically dependent on imports of medical equipment from countries that have imposed sanctions, primarily from Germany, the Netherlands, France, and the US, which account collectively for 92% of imports into the Russian Federation — the highest figure among all the major product groups. Among the products with the highest level of dependence on imports from developed countries are CT and MRI units (TN 902212, 901813), artificial joints (TN VED 902131), and X-ray equipment (TN VED 902214). We note that over the period 2007–2013, Russia’s dependence on imports from ‘sanctioning’ countries declined for the majority of goods. The exceptions were X-ray tubes (TN VED 902230) and pacemakers (TN VED 902150).Russia’s direct dependence on imports of medical equipment, areas where developed countries generally maintain strong positions, is shown across a wide range of products. The lowest competitiveness index was in CT units (TN VED 902212), dental drills (TN VED 901841), ultrasound scanning equipment (TN VED 901812), and equipment using alpha-, beta- and gamma-radiation (TN VED 902221).
Conclusions and recommendationsOur study has shown that Russia is a strongly niche producer of high-tech products with weak competitiveness in the majority of goods and a high level of dependence on imports from sanctions-imposing countries. In the short-term, a re-orientation towards imports from other states with different global market positions could help to overcome this situation. Israel and South East Asian countries such as China, South Korea, Hong Kong, and Singapore represent potential trading partners for Russia: collaborating with these countries could significantly reduce Russia’s dependence on ‘sanctioning’ countries for the overwhelming majority of major high-tech product groups (Table 8).
2016 Vol. 10 No 1 FORESIGHT AND STI GOVERNANCE 67
In the long-term, Russian production requires further development, especially for those goods with a very high share of imports from countries that have imposed sanctions:• in the pharmaceutical industry this primarily relates to anti-sera and drugs containing alkaloids,
hormones and insulin;• in mechanical engineering, civilian aircraft, medical equipment and precision devices (within these
groups dependence can be seen across a wide range of goods);• in other mechanical engineering sectors, where the overall dependence on imports is still moderate,
this includes product groups such as machine tools with computer numerical control, generator units, and microscopes.
ReferencesBalassa B. (1965) Trade Liberalization and Revealed Comparative Advantage. Manchester School of Economic and Social Studies, vol. 33,
no 2, pp. 99–123.Bas M., Berthou A. (2012) The Decision to Import Capital Goods in India: Firms’ Financial Factors Matter. World Bank Economic Review,
vol. 26, no 3, pp. 486–513.Bas M., Strauss-Kahn V. (2014) Does Importing More Inputs Raise Exports? Firm-Level Evidence from France. Review of World Economics,
vol. 150, no 2, pp. 241–275.Caselli F., Wilson D. (2004) Importing Technology // Journal of Monetary Economics, vol. 51, no 1, pp. 1–32.Coe D., Helpman E. (1995) International R&D Spillovers. European Economic Review, no 39, pp. 859–887.Colantone I., Crino R. (2014) New Imported Inputs, New Domestic Products. Journal of International Economics, vol. 92, no 1, pp. 147–165.Eurostat (2015a) Eurostat indicators on High-tech industry and Knowledge-intensive services. Annex 5 — High-tech aggregation by SITC
Rev. 4, Luxembourg: Eurostat. Available at: http://ec.europa.eu/eurostat/cache/metadata/Annexes/htec_esms_an5.pdf, accessed 15.09.2015.
Eurostat (2015b) LALL’s technological classification of export. Luxembourg: Eurostat. Available at: http://ec.europa.eu/eurostat/ramon/documents/lall/LALL_SITC_Rev_3.zip, accessed 15.09.2015.
Feng L., Li Z., Swenson D. (2012) The Connection between Imported Intermediate Inputs and Exports: Evidence from Chinese Firms (NBER Working Paper no 18260), Cambridge, MA: National Bureau of Economic Research.
Gnidchenko А., Salnikov V. (2014) Tsenovaya konkurentosposobnost’ rossiiskoi vneshnei torgovli [Russian Foreign Trade Price Competitiveness]. Voprosy Ekonomiki, no 1, pp. 108–129 (in Russian).
Gnidchenko A., Salnikov V. (2015) Net Comparative Advantage Index: Overcoming the Drawbacks of the Existing Indices (NRU HSE Basic Research Program Working Paper WP BRP 119/EC/2015), Moscow: National Research University Higher School of Economics.
Griliches Z. (1973) Research Expenditures and Growth Accounting // Science and Technology in Economic Growth / Ed. B. Williams. New York: John Wiley & Sons, Halsted Press, pp. 59–95.
Griliches Z., Lichtenberg F. (1984) Interindustry Technology Flows and Productivity Growth: A Reexamination. Review of Economics and Statistics, vol. 66, no 2, pp. 324–329.
Hatzichronoglou T. (1997) Revision of the High-Technology Sector and Product Classification (OECD Science, Technology and Industry Working Paper no 1997/02), Paris: OECD.
Keller W. (2000) Do Trade Patterns and Technology Flows Affect Productivity Growth? World Bank Economic Review, vol. 14, no 1, pp. 17–47.
Krammer S. (2014) Assessing the Relative Importance of Multiple Channels for Embodied and Disembodied Technological Spillovers. Technological Forecasting and Social Change, vol. 81, pp. 272–286.
Lall S. (2000) The Technological Structure and Performance of Developing Country Manufactured Exports, 1985–1998 (University of Oxford QEH Working Paper no 44), Oxford: University of Oxford.
Lichtenberg F., van Pottelsberghe de la Potterie B. (1998) International R&D Spillovers: A Re-Examination (NBER Working Paper no 5668), Cambridge, MA: National Bureau of Economic Research.
OECD (2011) ISIC rev. 3. Technology intensity definition. Classification of manufacturing industries into categories based on R&D intensities, Paris: OECD. Available at: http://www.oecd.org/sti/ind/48350231.pdf, accessed 12.09.2015.
Papaconstantinou G., Sakurai N., Wyckoff A. (1996) Embodied Technology Diffusion: An Empirical Analysis for 10 OECD Countries (OECD Science, Technology and Industry Working Paper no 1996/01), Paris: OECD.
Scherer F. (1982) Inter-Industry Technology Flows and Productivity Growth. Review of Economics and Statistics, vol. 64, no 4, pp. 627–634.Stone S., Shepherd B. (2011) Dynamic Gains from Trade: The Role of Intermediate Inputs and Equipment Inputs (OECD Trade Policy Paper
no 110), Paris: OECD.Terleckyj N. (1974) Effects of R&D on the Productivity Growth of Industries: An Exploratory Study, Washington, D.C.: National Planning
Association.Terleckyj N. (1980) Direct and Indirect Effects of Industrial Research and Development on the Productivity Growth of Industries. New
Developments in Productivity Measurement (еds. J. Kendrick, B. Vaccara), Chicago: University of Chicago Press, pp. 357–386.Trilateral Patent Offices (2007) Trilateral Statistical Report. 2007 Edition. Munich: European Patent Office, Japan Patent Office, United States
Patent and Trademark Office. Available at: http://www.trilateral.net/statistics/tsr/2007/TSR.pdf, accessed 21.09.2015.UNIDO (1982) Changing Patterns of Trade in World Industry: An Empirical Study on Revealed Comparative Advantage, New York: United
Nations.Wolff E., Nadiri I. (1993) Spillover Effects, Linkage Structure, and Research and Development. Structural Change and Economic Dynamics,
vol. 4, no 2, pp. 315–331.Xu B., Wang J. (1999) Capital Goods Trade and R&D Spillovers in the OECD. Canadian Journal of Economics, vol. 32, pp. 1258–1274.Zhu L., Jeon B. (2007) International R&D Spillovers: Trade, FDI, and Information Technology as Spillover Channels. Review of International
Economics, vol. 15, no 5, pp. 955–976.
This article was written with support from the Russian Ministry of Education and Science based on materials from the project ‘Scenario analysis of the impact of Russia’s science and technology development on the macro-economic situation in the long-term’ (Subsidy Agreement No. 02.603.21.0003, unique ID NIR RFMEFI60314X0003) and within the framework of NRU HSE’s Basic Research Programme for 2015 (T3-12), using state subsidy funds allocated to the university to support leading universities in the Russian Federation to increase the competitiveness among the leading global scientific research centres.
Gnidchenko А. et al., pp. 53–67

68 FORESIGHT AND STI GOVERNANCE Vol. 10 No 1 2016
Master Class
МАСТЕР-КЛАСС
2016 Vol. 10 No 1 FORESIGHT AND STI GOVERNANCE 692016 Т. 10 № 1 ФОРСАЙТ 69
Foresight Applications to the Analysis of Global Value Chains
Director, OECD – HSE Partnership Centre, Institute for Statistical Studies and Economics of Knowledge (ISSEK); and Assistant Professor, School of World Economy,
Faculty of World Economy and International Affairs. E-mail: [email protected]
Tatyana Meshkova
Abstract
The objective of this paper is to analyze the scope for improving the empirical and methodological foundation of global value chains (GVCs) research and
for making relevant political decisions, primarily through applying Foresight methodology. The authors review the major trends of global value chains’ development, specific features of Russia’s participation in them, and the necessary steps to increase the quality and efficiency of this participation, in particular in the changing geopolitical context. Special attention was paid to the theoretical, methodological, and empirical aspects of GVC research which are far from adequate (we primarily mean international databases such as TiVA and WIOD developed with the participation of the OECD and the WTO): they need to be supplemented with advanced tools to improve their forecasting potential, as well as their practical and strategic orientation. To this
end, approaches which would make it possible to research the interconnections between global processes and trends with regional and national innovation-based development tendencies become of crucial importance. The application of Foresight methodology may significantly contribute to researching the GVC phenomenon, being a major logical step towards creating advanced research and policy tools to mobilise available resources and coordinate stakeholders’ actions to increase global competitiveness. The paper presents several case studies which describe the practical application of Foresight methodology to analyze Russian participation in various GVCs, giving examples of specific product and service groups. The authors conclude that both full-scale Foresight studies and specific components thereof could be applied for the purposes of GVC analysis, strategic planning, and political decision making.
Analyst, ISSEK OECD – HSE Partnership Centre. E-mail: [email protected]
Evgeny Moiseichev
Keywords: global value-added chains (GVCs); trade; competition; globalization; innovation; Foresight
National Research University Higher School of Economics (NRU HSE) Address: 20, Myasnitskaya str., Moscow 101000, Russian Federation
DOI: 10.17323/1995-459x.2016.1.69.82
Citation: Meshkova T., Moiseichev E. (2016) Foresight Applications to the Analysis of Global Value Chains. Foresight and STI Governance, vol. 10, no 1, pp. 69–82. DOI: 10.17323/1995-459x.2016.1.69.82
70 FORESIGHT AND STI GOVERNANCE Vol. 10 No 1 2016
Master Class
Both developed and developing countries, irrespective of their technological level and income per capita, are involved in global value chains (GVCs), which play a key role in the modern global economy. Global stakeholders have long shown considerable interest in analyzing the structure
of global trading in terms of added value and value chains and in identifying current and potential opportunities to embed companies in these chains on country and industry levels. A relatively new phenomenon, GVCs have been the focus of attention for many leading international organizations, including the OECD, UNCTAD, WTO, and G20, with their experts studying the possible positive and negative effects of inclusion in global chains for certain countries and the global economy as a whole. In parallel, the methodological and empirical foundations for studies on GVCs have been continually improved and the heuristic value and reliability of research results have been developed to further justify the ensuing political recommendations elaborated herein.From a methodological perspective, current GVC studies exhibit the following trends:• the spread of the so-called industrialist approach, which consists of examining the effects of a chain
on the local level of certain industries and clusters;• looking at the regional and national features of innovation systems which play a decisive role in the
transition to the industrialist approach and make it possible to explain the mechanisms underpinning real changes at the level of firms and companies in a specific country through involvement in GVCs;
• increasing the forecasting potential of GVC research to aid in strategic planning and political decision making with regard to involvement in GVCs.
In this paper, we look to combine these three approaches and to analyze the potential to improve the methodological and empirical foundations for GVC research and Russia’s long-term strategic planning regarding involvement in GVCs, primarily using elements of the Foresight methodology. We will look at case studies of specific groups of goods and services with an innovative component. Finally, we will briefly analyze the essential features and main trends of GVC development, the key features and indicators of Russia’s involvement in GVCs, and the theoretical, empirical, and methodological opportunities and limitations of global chain research.
Global Value Chains as an Element of the Global EconomyAs a modern global economic phenomenon, GVCs clearly demonstrate the pros and cons of intensifying mutual interactions between countries and can serve as a response to the challenges facing them. In a globalized economy, it is not only the final product itself that draws specific attention, from the perspective of employment and development, but also the performance of the companies involved in creating the final product. Developing countries frequently see becoming part of GVCs as opportunities for adding value in a product and strengthening their competitiveness by improving conditions for international business and attracting foreign investment [OECD et al., 2013, 2014].In general terms, a GVC is a mechanism for increasing value in the process of creating a final product, which might comprise the various technological stages of production and design and marketing [Sturgeon, 2001]. Within each global chain there are:• forward linkages through exports of primary goods and services, which are then imported back in
the form of a finished product (producers of parts and components for complex products with high added value);
• backward linkages, which form around the production and export of finished goods and services and import of primary goods and services (leading producers of finished products) [OECD, 2013].
The Structure of International Cooperation through GVCsOver the period 1995–2009, the extent to which many countries were involved in GVCs rose on average by 5–10% (OECD, 2013) (Fig. 1). Roughly 40% of total exports by OECD countries is made up of added value created abroad. Since 1995, South Korea, India, and China have most improved their position in GVCs, with their GVC participation index1 ranging from 10% to 20%.Over the 15-year period under investigation, the average share of services’ added value in gross exports by OECD member states and their partners also rose [OECD, WTO, 2013] (Fig. 2). The largest growth in this figure was seen in some of the largest EU economies (Germany, UK, Italy), as well as India and the US, whose added value in services accounts for on average 40–50% of gross exports. For Russia, this figure remained virtually unchanged at 30%.The high economic growth rates in several developing countries are generally linked to their increased involvement in GVCs through the use of imported components and materials in the production of goods, including those destined for export. While extensive, in relative terms this growth is however still
1 A country’s GVC participation index is calculated as the sum of two indicators: the share of the import component in a country’s total exports and the share of exported goods and services used as imported components in other countries’ exports.

2016 Vol. 10 No 1 FORESIGHT AND STI GOVERNANCE 71
ineffective. According to data from international studies, the largest share of global added value is created in the services sector, not in production.Fig. 3 shows the different specialties of companies in GVCs according to their profitability. The highest profits are reported in those businesses that are furthest removed in time from the direct assembly of the product, i.e. those involved in the design or after-sales service. The highest-income segments of GVCs, represented by only a narrow group of stakeholders, lay down strategic benchmarks for countries and companies embedding themselves in global chains.
Russia’s Position in GVCsWith a GVC participation index of 51.8, Russia has high global economic integration – 25th place out of 57 [OECD, WTO, 2013]. However, the nature of Russia’s GVC participation remains very much geared towards primary materials (see Fig. 1 above).In terms of participation in backward chains, which form around exports of finished goods and services involving foreign contractors and intermediaries, Russia lags far behind OECD member states [OECD,
Arg
entin
a
Aust
ralia
Braz
il
Can
ada
Chi
na
Fran
ce
Ger
man
y
Indi
a
Indo
nesia
Italy
Japa
n
Sout
h Ko
rea
Mex
ico
Russ
ia
Saud
i Ara
bia
Sout
h A
fric
a
Turk
ey UK
USA
70
60
50
40
30
20
10
Fig. 1. GVC Participation Index for Major Global Economies in 1995–2009 (%)
Source: [OECD, 2013].
Arg
entin
a
Aust
ralia
Braz
il
Can
ada
Chi
na EU
Fran
ce
Ger
man
y
Indi
a
Indo
nesia
Italy
Japa
n
Sout
h Ko
rea
Mex
ico
Russ
ia
Saud
i Ara
bia
Sout
h A
fric
a
Turk
ey UK
USA
70
60
50
40
30
20
10
Fig. 2. Proportion of Added Value in Services in the Gross Exports of Major Global Economies in 1995–2009 (%)
Source: OECD/WTO TiVA database. Available at: http://www.oecd.org/sti/ind/measuringtradeinvalue-addedanoecd-wtojointinitiative.htm, accessed 05.011.2015.
Participation in GVC forward linkagesParticipation in GVC backward linkages
GVC Participation Index for 1995
Meshkova Т., Moiseichev Е., pp. 69–82
2009
1995
72 FORESIGHT AND STI GOVERNANCE Vol. 10 No 1 2016
Master Class
2013] due to the high share of primary goods in its export structure (Fig. 4). Its GVC participation index was 13.7 in 2015, which is the sixth lowest score [OECD, 2015a] after major primary economies such as Indonesia, Brazil, Colombia, Brunei, and Saudi Arabia.Russia’s participation in GVCs is primarily — in 86% of cases — through forward linkages, especially in mining, the chemical industry and metallurgy, wholesale and retail trade, and the transport and telecommunications sectors. In other words, other countries use goods exported by Russia primarily as primary materials or components in their own production.2 This specialty does not allow for a high share of added value to be created within Russia. Resources exported by Russian companies are returned to the economy in the form of finished foreign goods with a mark-up, which is made higher still by tariff and non-tariff trade restrictions. However, Russia’s share of added value in imported goods often exceeds the foreign component.Thus, the current format of Russia’s participation in GVCs does not allow it to achieve any of the potential long-term benefits. At the same time, the complex geopolitical climate and pessimistic forecasts regarding future economic growth in Russia should not hold back efforts to take advantage of Russia’s competitive advantages, minimize possible risks, and maximize the positive effects of participation in global chains.3 This work should in particular consist of identifying opportunities in sectors where Russia has a chance of occupying leading positions in backward linkages in the foreseeable future.
GVCs as an Object of Study and Strategic PlanningGrowth in the political and economic value of GVCs has attracted the attention of experts and decision makers. At the same time, the theoretical, methodological, and empirical resources for studying global chains have expanded. In his proposal for consolidation and further transformation of the OECD [Gurría, 2015], the OECD Secretary General Angel Gurría highlighted the heuristic value of research in this field and noted that analysis of the added value of gross exports and GVCs in fact made it possible to ‘decode the trade genome’, and so this work needs to be continued, applying the results of research in real trade negotiations.
The Theoretical and Empirical Basis for Studies on GVCsThe notion of a valued added chain emerged in the 1960s–1970s. There are two main schools of thought on the study of value chains – internationalism and industrialism [Morrison et al., 2008].The first school is made up of North American researchers, primarily headed by the director of the Center on Globalization, Governance and Competitiveness at Duke University, Garry Gereffi [Gereffi, 1999; Gereffi, Kaplinsky, 2001; Kaplinsky, 2004]; several European academics including a leading specialist at the Institute of Development Studies at the University of Sussex, Rafael Kaplinsky [Kaplinsky, 2000]; a researcher at the Danish Institute for International Studies, Peter Gibbon [Gibbon, 2001, 2003]; and others. The industrialist school is made up of specialists based at the Institute of Development Studies at the University of Sussex [Humphrey et al., 2000; Humphrey, Schmitz, 2002].
Added value
Higher
Lower
Time
Development of concepts, R&D
Design
Branding
Production
Marketing
Distribution
Sales and after-sales service
Fig. 3. Relationship between Company Profits and Position in GVCs
Source: [Kaplinsky, 2013].
2 The proportion of oil and gas in Russian exports is as high as 70% [Federal Customs Service, 2015].3 For more on the risks and benefits of participating in GVCs, see: [Meshkova, Moiseichev, 2015].
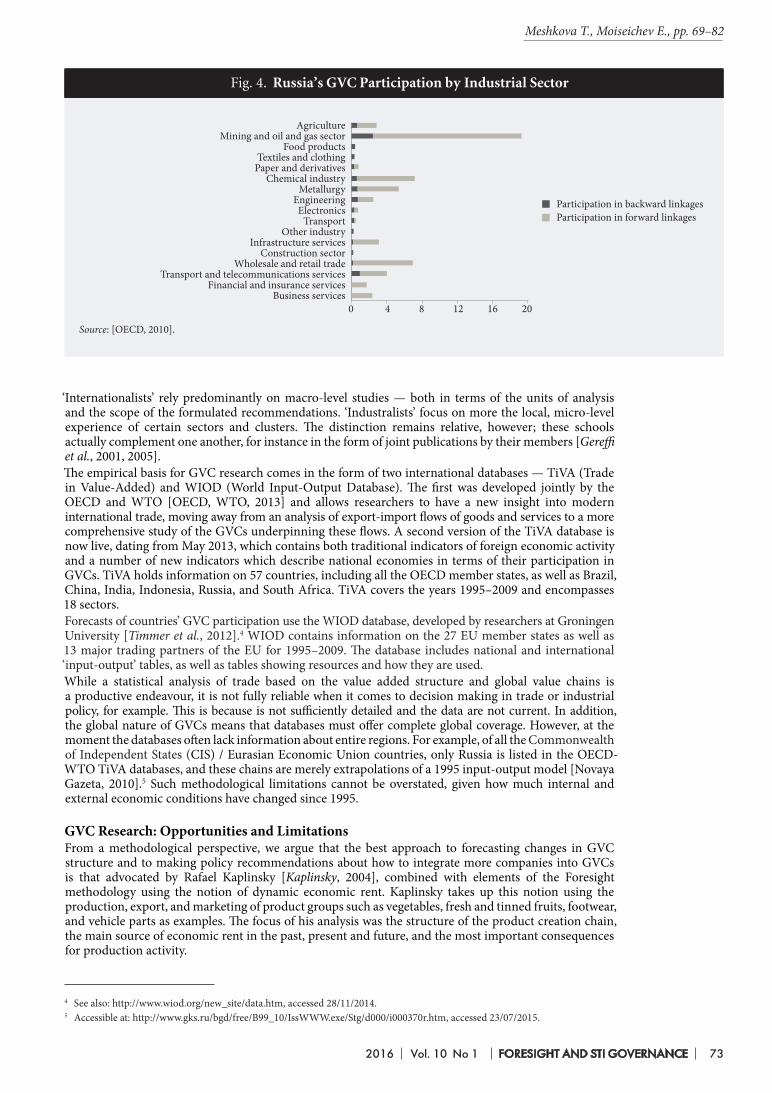
2016 Vol. 10 No 1 FORESIGHT AND STI GOVERNANCE 73
‘Internationalists’ rely predominantly on macro-level studies — both in terms of the units of analysis and the scope of the formulated recommendations. ‘Industralists’ focus on more the local, micro-level experience of certain sectors and clusters. The distinction remains relative, however; these schools actually complement one another, for instance in the form of joint publications by their members [Gereffi et al., 2001, 2005].The empirical basis for GVC research comes in the form of two international databases — TiVA (Trade in Value-Added) and WIOD (World Input-Output Database). The first was developed jointly by the OECD and WTO [OECD, WTO, 2013] and allows researchers to have a new insight into modern international trade, moving away from an analysis of export-import flows of goods and services to a more comprehensive study of the GVCs underpinning these flows. A second version of the TiVA database is now live, dating from May 2013, which contains both traditional indicators of foreign economic activity and a number of new indicators which describe national economies in terms of their participation in GVCs. TiVA holds information on 57 countries, including all the OECD member states, as well as Brazil, China, India, Indonesia, Russia, and South Africa. TiVA covers the years 1995–2009 and encompasses 18 sectors.Forecasts of countries’ GVC participation use the WIOD database, developed by researchers at Groningen University [Timmer et al., 2012].4 WIOD contains information on the 27 EU member states as well as 13 major trading partners of the EU for 1995–2009. The database includes national and international ‘input-output’ tables, as well as tables showing resources and how they are used.While a statistical analysis of trade based on the value added structure and global value chains is a productive endeavour, it is not fully reliable when it comes to decision making in trade or industrial policy, for example. This is because is not sufficiently detailed and the data are not current. In addition, the global nature of GVCs means that databases must offer complete global coverage. However, at the moment the databases often lack information about entire regions. For example, of all the Commonwealth of Independent States (CIS) / Eurasian Economic Union countries, only Russia is listed in the OECD-WTO TiVA databases, and these chains are merely extrapolations of a 1995 input-output model [Novaya Gazeta, 2010].5 Such methodological limitations cannot be overstated, given how much internal and external economic conditions have changed since 1995.
GVC Research: Opportunities and LimitationsFrom a methodological perspective, we argue that the best approach to forecasting changes in GVC structure and to making policy recommendations about how to integrate more companies into GVCs is that advocated by Rafael Kaplinsky [Kaplinsky, 2004], combined with elements of the Foresight methodology using the notion of dynamic economic rent. Kaplinsky takes up this notion using the production, export, and marketing of product groups such as vegetables, fresh and tinned fruits, footwear, and vehicle parts as examples. The focus of his analysis was the structure of the product creation chain, the main source of economic rent in the past, present and future, and the most important consequences for production activity.
AgricultureMining and oil and gas sector
Food productsTextiles and clothing
Paper and derivativesChemical industry
MetallurgyEngineeringElectronics
TransportOther industry
Infrastructure servicesConstruction sector
Wholesale and retail tradeTransport and telecommunications services
Financial and insurance servicesBusiness services
Participation in backward linkagesParticipation in forward linkages
0 4 8 12 16 20
Fig. 4. Russia’s GVC Participation by Industrial Sector
Source: [OECD, 2010].
4 See also: http://www.wiod.org/new_site/data.htm, accessed 28/11/2014.5 Accessible at: http://www.gks.ru/bgd/free/B99_10/IssWWW.exe/Stg/d000/i000370r.htm, accessed 23/07/2015.
Meshkova Т., Moiseichev Е., pp. 69–82
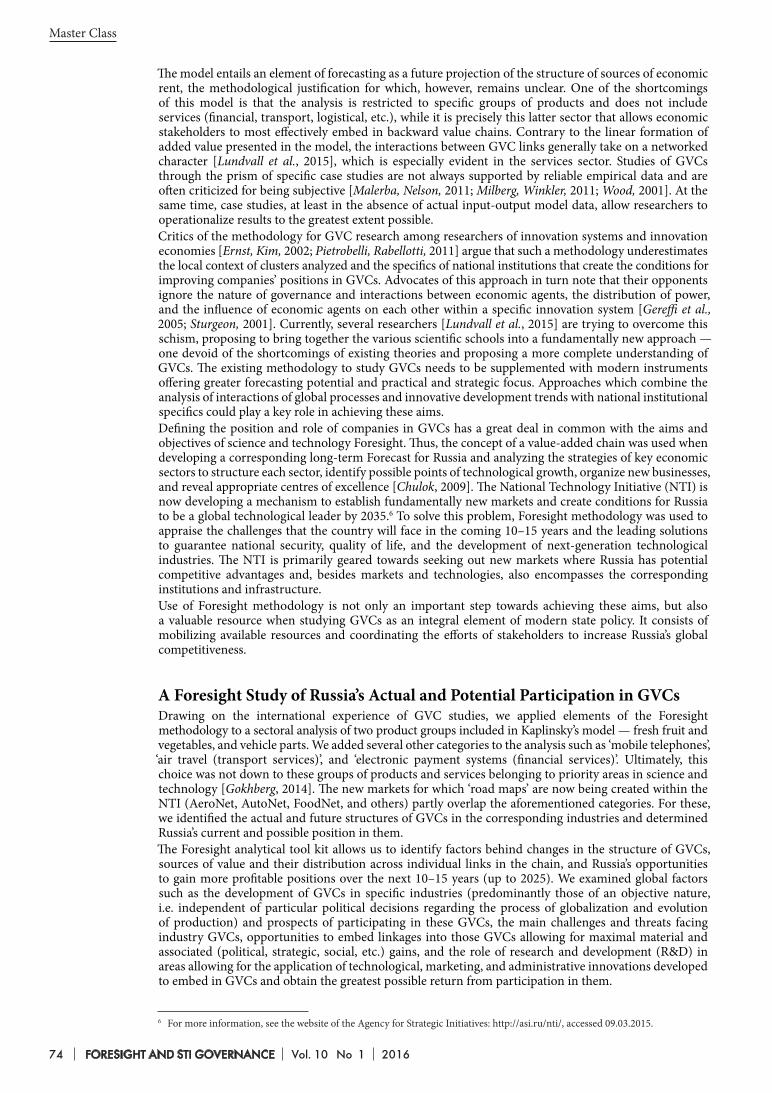
74 FORESIGHT AND STI GOVERNANCE Vol. 10 No 1 2016
Master Class
The model entails an element of forecasting as a future projection of the structure of sources of economic rent, the methodological justification for which, however, remains unclear. One of the shortcomings of this model is that the analysis is restricted to specific groups of products and does not include services (financial, transport, logistical, etc.), while it is precisely this latter sector that allows economic stakeholders to most effectively embed in backward value chains. Contrary to the linear formation of added value presented in the model, the interactions between GVC links generally take on a networked character [Lundvall et al., 2015], which is especially evident in the services sector. Studies of GVCs through the prism of specific case studies are not always supported by reliable empirical data and are often criticized for being subjective [Malerba, Nelson, 2011; Milberg, Winkler, 2011; Wood, 2001]. At the same time, case studies, at least in the absence of actual input-output model data, allow researchers to operationalize results to the greatest extent possible.Critics of the methodology for GVC research among researchers of innovation systems and innovation economies [Ernst, Kim, 2002; Pietrobelli, Rabellotti, 2011] argue that such a methodology underestimates the local context of clusters analyzed and the specifics of national institutions that create the conditions for improving companies’ positions in GVCs. Advocates of this approach in turn note that their opponents ignore the nature of governance and interactions between economic agents, the distribution of power, and the influence of economic agents on each other within a specific innovation system [Gereffi et al., 2005; Sturgeon, 2001]. Currently, several researchers [Lundvall et al., 2015] are trying to overcome this schism, proposing to bring together the various scientific schools into a fundamentally new approach — one devoid of the shortcomings of existing theories and proposing a more complete understanding of GVCs. The existing methodology to study GVCs needs to be supplemented with modern instruments offering greater forecasting potential and practical and strategic focus. Approaches which combine the analysis of interactions of global processes and innovative development trends with national institutional specifics could play a key role in achieving these aims.Defining the position and role of companies in GVCs has a great deal in common with the aims and objectives of science and technology Foresight. Thus, the concept of a value-added chain was used when developing a corresponding long-term Forecast for Russia and analyzing the strategies of key economic sectors to structure each sector, identify possible points of technological growth, organize new businesses, and reveal appropriate centres of excellence [Chulok, 2009]. The National Technology Initiative (NTI) is now developing a mechanism to establish fundamentally new markets and create conditions for Russia to be a global technological leader by 2035.6 To solve this problem, Foresight methodology was used to appraise the challenges that the country will face in the coming 10–15 years and the leading solutions to guarantee national security, quality of life, and the development of next-generation technological industries. The NTI is primarily geared towards seeking out new markets where Russia has potential competitive advantages and, besides markets and technologies, also encompasses the corresponding institutions and infrastructure.Use of Foresight methodology is not only an important step towards achieving these aims, but also a valuable resource when studying GVCs as an integral element of modern state policy. It consists of mobilizing available resources and coordinating the efforts of stakeholders to increase Russia’s global competitiveness.
A Foresight Study of Russia’s Actual and Potential Participation in GVCsDrawing on the international experience of GVC studies, we applied elements of the Foresight methodology to a sectoral analysis of two product groups included in Kaplinsky’s model — fresh fruit and vegetables, and vehicle parts. We added several other categories to the analysis such as ‘mobile telephones’, ‘air travel (transport services)’, and ‘electronic payment systems (financial services)’. Ultimately, this choice was not down to these groups of products and services belonging to priority areas in science and technology [Gokhberg, 2014]. The new markets for which ‘road maps’ are now being created within the NTI (AeroNet, AutoNet, FoodNet, and others) partly overlap the aforementioned categories. For these, we identified the actual and future structures of GVCs in the corresponding industries and determined Russia’s current and possible position in them.The Foresight analytical tool kit allows us to identify factors behind changes in the structure of GVCs, sources of value and their distribution across individual links in the chain, and Russia’s opportunities to gain more profitable positions over the next 10–15 years (up to 2025). We examined global factors such as the development of GVCs in specific industries (predominantly those of an objective nature, i.e. independent of particular political decisions regarding the process of globalization and evolution of production) and prospects of participating in these GVCs, the main challenges and threats facing industry GVCs, opportunities to embed linkages into those GVCs allowing for maximal material and associated (political, strategic, social, etc.) gains, and the role of research and development (R&D) in areas allowing for the application of technological, marketing, and administrative innovations developed to embed in GVCs and obtain the greatest possible return from participation in them.
6 For more information, see the website of the Agency for Strategic Initiatives: http://asi.ru/nti/, accessed 09.03.2015.

2016 Vol. 10 No 1 FORESIGHT AND STI GOVERNANCE 75
Kaplinsky’s model was supplemented with a set of policy (primarily state) measures to integrate Russia more deeply and productively in GVCs. Following international recommendations [OECD et al., 2013; 2014], we identified so-called horizontal and industry (sectoral) measures for each group of products and services. International experience of countries’ participation in GVCs, including through collaboration between OECD member states, several international organizations and their partners, showed the fundamental importance of a range of horizontal political measures to a successful strategy to embed in GVCs: development of infrastructure and communications, support for the business environment, the financial sphere, science and innovation, education and employment, macroeconomic stability, and others.A targeted industry-specific (sectoral) policy, while not sufficient in itself, is an important addition to the measures listed above. A sectoral approach (for instance, the use of tariff and other trade restrictions, subsidies, export regulations, restrictions on foreign investment, etc.) could at best provide positive changes in a specific industry (most frequently in a group of companies). However, such an approach could not produce a positive cumulative effect for the economy overall. ‘Horizontal’ measures including in the science, technology and innovation sphere, are in line with the approach advocated by the innovation economics school [Cooke, 2001; Etzkowitz, Leydesdorff, 2000; Lundvall et al., 2015; Pietrobelli, Rabellotti, 2011] to identify the relationship between the nature of participation in GVCs and the specifics of national innovation systems.
Agriculture: Fresh Fruit and Vegetables
Description and Russia’s Current Position in the ChainGVCs in the production and sale of fresh fruit and vegetables are made up of the following links: seed-farming, cultivation, processing and packaging of crops, export, and retail trade. In theory, Russia is involved in each of these, occupying other positions to a lesser extent in export and seed-farming. At the same time, seed-farming is now the most profitable segment of the entire chain: the size of the global seed market for fruit and vegetables is over 6 billion US dollars. With current annual growth at 28%, by 2018 it could reach 13 billion dollars [Ken Research, 2014].
Global TrendsThe key global trends in agriculture overall and in fresh fruit and vegetables cultivation in particular include: increasing competition in seed-farming, development of genetic engineering, expanded international cooperation in food security, overcoming the problems of starvation and access to food in less developed countries, and growing demand for environmentally friendly, natural farm produce in the more economically developed countries.
Challenges and ThreatsRussia is considered to be a country with a traditionally developed agricultural sector but one that makes very little use of its GVC potential in terms of growing fresh fruit and vegetables. After the collapse of the USSR, the country played virtually no role in the selection and export of seeds and development of new products, despite the critical value of this sector from a food security perspective. The shortage (strictly speaking) of free land for experimental fields and inadequate support for domestic R&D in seed-farming hamper effective involvement in GVCs in Russia.
Opportunities Attaining more profitable positions in ‘agrarian’ GVCs is a particularly pressing challenge for Russia in light of the country’s recent policy of import substitution and development of the domestic agricultural produce market. The ‘counter-sanction’ import restrictions introduced in the summer of 2014 served as a catalyst to transform the GVCs in which Russia was involved. Currently, Russian retailers are moving away from EU member states and the US in favour of Russian producers or suppliers from Latin America, Turkey, Iran, China, and Vietnam; this trend has a direct impact on the future prospects of the industry and national economy overall. The practical aim of the government’s policy should be to ensure far-reaching access to sales channels for as large a number of domestic and foreign producers as possible and to recover from the damage caused by the departure of Western partners from the market while maintaining high quality standards in agriculture and ensuring that produce is affordable for the population. In the long-term, achieving these aims requires a healthy and equitable distribution of economic rent across all GVC participants, including small- and medium-sized producers alongside larger players.One of the most pressing areas of R&D in agriculture today is the development of genetically modified produce and fertilizers which meet environmental and food security standards. The main opportunity here for Russia lies in developing export seed-farming and import substitution through revitalizing the scientific and technological foundations underpinning the industry.
Meshkova Т., Moiseichev Е., pp. 69–82
76 FORESIGHT AND STI GOVERNANCE Vol. 10 No 1 2016
Master Class
Regulatory InstrumentsFrom a strategic perspective, Russian industrial policy in the fresh fruit and vegetables segment should involve support for seed-farming companies. Russia needs to revitalize the scientific and human resources lost over the early 1990s, improve the business climate, and attract investment alongside targeted regulation of the industry to make it easier for seed-farming companies to access external and internal markets.
Prospects of Improving Russia’s PositionOne of the most important conditions for Russia to be able to embed itself into agricultural GVCs is having strong seed-farming and retail links. The remaining links, while not guaranteeing the same high yields, nevertheless also deserve appropriate support to provide a complete production cycle.
Air TravelDescription and Russia’s Current Position in the ChainAir travel is linked into an entire network of GVCs encompassing information and communication technology (ICT) infrastructure, retail (including travel agents), airlines, aircraft construction, and land-based infrastructure. Airports are the most influential players in this GVC, something long acknowledged by researchers of industry-specific markets [DiLorenzo, 1996; Vasigh et al., 2013, 2014; Zhang, Round, 2011]. Russian aviation, which is embedded in all links of the chain, is held back from integrating into global logistics by the underdeveloped market mechanisms for the industry’s regulation due to high air travel tariffs and the fact that Russia has not adopted international logistical standards for electronic registration and handling of freight.
Global TrendsAircraft construction and air travel are extremely important in terms of economic development (in particular in the context of logistical systems and science-intensive sectors) and act as technology donors, enabling a multiplier effect on a national level. Aviation GVCs are characterized by their scale and complexity. The global trends in this area include:• increasing international competition;• growth in passenger and freight numbers;• developing inter-state collaboration in the form of air travel alliances;• rapid modernization of aircraft fleets and digitalization of air travel registration and tracking;• an increase in the proportion of regional and local journeys in most countries.
Challenges and ThreatsThe strong correlation between ticket prices and fuel prices, high price elasticity of demand, and the shortage of personnel as a consequence of the high cost of pilot training are among the challenges facing Russian GVC participants in the field of air travel. All these factors are fraught with losses for all participants in the chain. For example, in 2015 the Central Bank of the Russian Federation transitioned to a floating exchange rate for the rouble, which led to the costs of leasing for carriers exceeding the admissible limit and led to numerous bankruptcies [Kukushkin, 2015; RZD-Partner, 2015].The domestic air travel market in Russia has been experiencing considerable difficulties in ensuring a sufficient level of profitability [Belousov, 2013; Kukushkin, 2015; Bessarabova, Sologub, 2015]. In the interests of connecting Russia’s vast expanse of territory, the government had to subsidize unprofitable routes to distant and isolated communities [Belousov, 2014]. The international market guarantees high profits with higher competition.
Opportunities The prospects for Russia being more involved in aviation GVCs are linked to the realization of competitive advantages in freight transportation and the expansion of the regional and local flights market. Both niches are still poorly developed compared with foreign markets, although they are gradually expanding [RZD-Partner, 2015; RBC, 2015; RBC.research, 2015]. The role of R&D in this area could be in optimizing electronic ticket reservation equipment, introducing a unified standard for online freight registration, personalizing services, and in modernizing aircraft fleet. Ultimately, innovations aimed at cutting costs and increasing the profitability of airlines and the industry overall are all important.7
7 An example might be consultancy and project services offered by the Innovation Centre for Civil Aviation to realize the transit potential of Russia’s airspace, reduce the financial burden on airlines, improve industry legislation, develop domestic freight, regional and local air travel, optimize the mechanisms and infrastructure to ensure that civilian aircraft are suitable for use in summer, and introduce an e-Freight international standard for electronic registration and handling of freight (available at: http://www.c-ca.ru/ru/company.html, accessed 29.07.2015).
2016 Vol. 10 No 1 FORESIGHT AND STI GOVERNANCE 77
Regulatory InstrumentsThe prospects of domestic players in the air travel market (in particular, the carriers themselves) remain hazy in the medium-term. Developments over the next five to ten years will be threatened by the volatility of the rouble exchange rate and geopolitical instability, meaning that the need for state support will remain.The ‘Plan of Priority Measures to Ensure Stable Economic Development and Social Stability in 2015’ approved by the Russian Government sets out measures to support the air travel market, among other things. In particular, there are plans to gradually reduce VAT on domestic flights to zero, increase subsidies for carriers to maintain the network of routes to distant and difficult-to-access communities, expand state support to lease aircraft for regional travel, and jointly finance domestic air travel not only at the expense of regions of the Russian Federation, but also all links of the transport infrastructure – airports, airlines, investors, etc.The efficiency of land-based infrastructure can be guaranteed by traditional anti-monopoly policy measures. For example, this may be by approving investment demands on leaseholders, operators and owners of bulk fuel installations and infrastructure monopolies, developing competitive procedures to transfer the land-based production facilities of airports to operators and investors, adopting a state (tariff) regulation system for aircraft storage and refueling services linked to the implementation of an investment programme, and excise-free imports of aviation fuel for five years.The aircraft construction industry plays a very important role in the development of GVCs. Russia has the potential to keep a vertically integrated production model, heavily dependent on exports, and therefore on political and economic shocks — restricted access to credit resources, technological sanctions, etc. The conditions are such that implementing an import substitution policy by developing domestic scientific and production facilities (especially for critical technologies) and diversifying external partners becomes a matter of national security. In the long-term, such measures will partly make it possible to move over to the use of domestic aircraft, protecting leaseholders from foreign currency shocks.The expansion of the air travel market will be helped by the development of transport integrators and services using domestic ICT innovations, including computer systems to optimize the aircraft fleet and routes, electronic ticket reservation mechanisms, selecting the most profitable tariffs, introducing a unified online freight registration standard, etc. The development of human capital, including subsidizing pilot re-training, training personnel for civil aviation based on forecasts of passenger and freight turnover, and improving statistical analysis of data in line with the recommendations of the International Civil Aviation Organization (ICAO) and experiences of countries with lowest accident rates will all be of critical importance. Important industry-specific measures should include the introduction of the international e-Freight and e-Cargo standards in the electronic registration and handling of freight and harmonization of these mechanisms across different forms of transport.Finally, it would be sensible to further integrate Russia into international transport institutions, including the International Transport Forum (ITF), OECD-ITF Joint Transport Research Centre (JTRC), EU-Russia Transport Dialogue, Northern Dimension Partnership on Transportation and Logistics (NDPTL), ICAO, and others.
Prospects of Improving Russia’s PositionTo gain as much as possible from involvement in aviation GVCs, Russia needs to create a network of modern airports, increase competitiveness in aircraft construction, and develop the regional and local flights market.
Mobile Telephones and SmartphonesDescription and Russia’s Current Position in the ChainThe main GVC links in the field of mobile telephones and smartphones are product R&D, production, packaging, export, and retail trade. Russia’s involvement in these links is almost non-existent. The production link in this GVC is largely located in East Asia while the science-intensive links are controlled by companies in Western countries and Japan. In isolated cases, domestic players act as GVC coordinators (the most striking example of which is the company Yota). However, the overwhelming majority of domestic actors buy in standard devices from Asia, focusing more on marketing and sales, while a small group of retailers sell goods purchased abroad.
Global TrendsDevelopment of this market is tied in with the growing complexity of production and increasing international competition, the emergence of new players on the market, intensifying international cooperation, and the transfer of production facilities to South East Asian countries. The never-ending changes in users’ demands and preferences (for example, the spike in the popularity of smartphones), rapid obsolescence of products in the industry, and the transformation of final markets in the wake of technological and behavioural dynamics continue to be perceptible trends.
Meshkova Т., Moiseichev Е., pp. 69–82
78 FORESIGHT AND STI GOVERNANCE Vol. 10 No 1 2016
Master Class
Challenges and ThreatsThe influence of Russian GVC participants in the field of mobile telephones and smartphones is almost entirely restricted to CIS countries. Domestic companies are primarily occupied with re-selling foreign products on the domestic market with a corresponding mark-up. Against the global backdrop, they are of little importance.One of the main challenges is the rapid technological improvement of devices combined with their fast obsolescence. In parallel, countries which have key (or blocking) technologies are becoming more isolated. The status of undisputed technological leaders allows them to further improve their products and innovate. This means that countries which find themselves on the technological periphery for various reasons (including patent restrictions, shortage of skilled workers, insufficient scientific potential, lack of corresponding infrastructure, technological sanctions, etc.) are deprived of opportunities in this sector.
Opportunities Russian participants of the mobile telephone and smartphone market have some of the best starting positions in design and R&D. In this particular area, they could compete with middle and upper price bracket foreign manufacturers for consumers in CIS countries, Eastern Europe, and the former Soviet Union. Mobile communications technologies will undergo dynamic changes over the next few decades but will likely remain profitable. Hence, domestic companies now need to conquer new markets and occupy strategically profitable positions.
Regulatory InstrumentsSince the bulk of the profits in these GVCs are generated by the R&D and marketing links, robust personnel as well as education, science, technology and innovation policies are required in order to realize existing opportunities. An important element of this could be to improve the image of engineering disciplines and encourage those studying ICT and design. It would be advisable for the government to offer support to core higher education institutions, finance additional publicly-funded positions, introduce effective mechanisms for academic mobility among students and academics, and attract recognized foreign specialists from countries with the latest technologies and leading developments in ICT.The government also needs to focus its efforts on specific science and technology capacities. In this context, the greatest value comes from the skillsets of Russian developers in the computer-aided design of components and new technologies to work with multimedia information [Gokhberg, 2014]. Such a broad approach to the development of ICT requires priority support for innovative industrial clusters through innovation policy [OECD, 2015b]. Special and industry-specific measures are redundant here as the dynamics of the industry of mobile communications devices, as one area of the comprehensive development of a digital economy, will over time reduce the technological gap between domestic and foreign developers.
Prospects of Improving Russia’s PositionThe high profitability of certain GVC links in the field of mobile communications will sooner or later start to decline as access to existing technologies expands. A key role in this process will be played by so-called disruptive innovations, which create new markets and shake up existing ones. As a result, any market forecast today cannot be considered entirely reliable. This does not however lessen the value of long-term science and technology forecasting, including the use of the Foresight methodology. In view of Russia’s existing scientific and technological capacities and high quality human capital, the country has the capability to expand its presence in the science-intensive and profitable links of corresponding GVCs — R&D, design, and sales.
Vehicle Parts
Description and Russia’s Current Position in the ChainThe main GVC links in the vehicle parts trade are design, production, and sales. Production is a modular system, or platform, comprising design, manufacture, and assembly. Businesses performing the most technologically complex operations (pressing, manufacturing engines and gear boxes, electronic components, etc.) are situated closest to the central offices of the companies, while the assembly plants are closest to the sales markets. Assembly, together with design, amasses the greatest proportion of added value, while the contribution of industrial production to added value is minimal. In Russia, the design segment is virtually non-existent, while the remainder is developing within global car manufacturers operating in the country.
Global TrendsOn a global map of the vehicle manufacturing industry, the design and sales segments are controlled by a few international corporations with numerous production facilities in developing countries. The oligopolistic trend of this market is growing while the number of independent parts manufacturers
2016 Vol. 10 No 1 FORESIGHT AND STI GOVERNANCE 79
shrinking. They are gradually becoming dependent on the auto-giants, setting up joint ventures, entering strategic alliances, or end up being absorbed like certain local manufacturers.A similar situation is now observed in Russia: domestic manufacturers are being drawn into international cooperation, embedding themselves in the GVCs of larger and more successful global players and losing their autonomy. According to leading foreign experts, the vehicle parts manufacturing industry still offers no prospects when it comes to improving a company’s standing in the corresponding GVCs [Gereffi et al., 2005; Humphrey, Schmitz, 2002; Kaplinsky, 2004].
Challenges and ThreatsIn the current conditions and the foreseeable future, not a single Russian car manufacturer will succeed, all things being equal, in building a globally competitive value-added chain. Without this, the Russian auto industry could be doomed to lagging behind and playing a game of catch-up at the same time as seeing further declines in profitability. Domestic manufacturers have the necessary skills in parts manufacturing, but lag behind foreign companies in design and sales, which require a higher level of intellectual and innovative potential. Russia’s labour resources are more expensive and less qualified than those in the Asia Pacific region.International industrial cooperation between the Russian auto industry and stronger foreign partners in the form of joint assembly facilities only further reinforce the backwardness of the industry, while the most profitable links — design and sales — are left to the global giants which amass the bulk of the income. This is characteristic of the situation in many developing countries. Experts see a way out of this situation in reducing state support for national GVC participants and investing in other, more economically promising industries [Humphrey et al., 2000]. On the whole, such a recommendation is fair for Russia too, but it does not take into account the strategic importance of the automotive industry to the country’s economy and the importance of the scientific, technological and production potential accumulated in the industry. Therefore, a subsidy policy remains the only sensible course of action for the time being.
Opportunities In the short- and medium-term, the development of vehicle parts manufacturing in Russia will be largely inert with gradual increases in foreign presence on the market and a reduction in economic rent. In the 40–50 year horizon, this trajectory will reach a dead-end. At the same time, by 2050 or earlier, opportunities will open up for the Russian auto industry that are linked to the spread of cars, alternative, modern, electric cars, cars running on fuel cells, compressed air, hydrogen, etc. The role of R&D could also be important in the development of ‘smart’ cities, which involve a move away from personal vehicles in favour of efficient, fast, environmentally-friendly, and cheap public transport in global megalopolises, including contemporary policy tools and business models such as car-sharing [HSE, 2016].
Regulatory InstrumentsThe demand of city-dwellers for personal vehicles will most likely fall considerably by the middle of this century. This scenario could be extremely advantageous to Russia, as domestic manufacturers have done far more groundwork in the sphere of freight and public transport. Overall, given the country’s current situation in GVCs, labour and employment regulation is extremely important in the vehicle construction industry. Professional association rules and expanded worker rights could lead to additional costs for manufacturers and make it harder to compete on price for consumers.The government’s main efforts should be directed at supporting technological development and innovation, long-term forecasting, ‘predicting’ the future of the vehicle construction industry using the Foresight methodology, training personnel, and investing in technology to take over from today’s vehicles. A special example of this could be the development of public transport systems in major cities and encouraging people to move away from using personal vehicles.
Prospects of Improving Russia’s PositionThe indefinitely distant prospects do not detract from the accurate assessments of the current position of Russia’s vehicle parts industry as described in [Humphrey et al., 2000], which note the small chances of embedding into global GVCs. Subsidies to the industry will only grow in the future and human resources will start to decline. Only a radical transformation of the market and consumer preferences will be able to overcome this situation, which are hardly likely in the foreseeable future.
Electronic Payment SystemsDescription and Russia’s Current Position in the ChainGVCs in the financial services sphere cannot be described as a usual chain of links. Unlike more traditional manufacturing industries, financial services are organized more according to network principles, and the activities of certain links are fully automated. An example of this networked distribution of
Meshkova Т., Moiseichev Е., pp. 69–82
80 FORESIGHT AND STI GOVERNANCE Vol. 10 No 1 2016
Master Class
tasks between participants in the banking sector chain is the specialist ‘UniCredit’ centres located in different countries.8 For example, bank branches in Ireland specialize in asset management, in Germany in investment banking services, in Austria in mortgage lending, and in credit card services in Turkey [Backer et al., 2014].The domestic financial services market formed relatively recently and has huge potential due to its relative diversity in terms of the range of services on offer, comparable with any developed foreign market. Alongside non-residents, domestic players are also present on the market with their numbers continually growing. One perceptible market trend is also the growth in the share of cashless payments as a consequence of the rapid development of Internet banking, electronic money, and the non-bank credit institutions segment.
Global TrendsElectronic payment systems are one of the fastest growing industries in the financial sector. The largest among these are Visa, MasterCard, American Express, DinersClub, JCB (Japan), and UnionPay (China). UnionPay has shown the highest growth trends: since 2010 it has been the leader in the number of cards issued, but still occupies only a tiny share of the Russian market. The global development of the electronic payment systems sector is characterized by growing competition, expansion of the range and coverage of non-bank financial services, and e-commerce.
Challenges and ThreatsThe dependence of the banking sector on foreign players, the emergence on the domestic market of new foreign payment operators, and the low level of competitiveness of domestic financial services are among the risks and threats to the development of electronic payment systems in Russia. The political climate also has an impact on the state of the sector. Some of the largest Russian banks have been affected by foreign sanctions: Gazprombank, Sberbank, VTB Bank, Bank of Moscow, Rosselkhoz, and Vnesheconombank [US Department of State, 2014; EU Newsroom, 2015]. The imposed restrictions prevent Russia from effectively participating in the corresponding GVCs.
Opportunities The introduction of sanctions against a number of players in the Russian banking sector served as further encouragement for the creation of a national payment card system (NPCS) to process transactions within Russia using international cards. The NPCS clearing centre was opened on March 31, 2015. The development of the e-commerce market and the NPCS was a pledge of Russia’s effective participation in financial services GVCs, as this affords Russia greater independence in its national economy, and in the long-term allows it to set up an international payment system like the China’s UnionPay, in part through integration with CIS and Eurasian Economic Union countries.
Regulatory InstrumentsConsolidation of Russia’s position in these GVCs could be aided by expanding the scale and increasing the efficiency of activities and raising the reputation of the NPCS to a level comparable with equivalent foreign and international payment systems; optimizing the Russian bank state oversight system (primarily through the Central Bank); and continuing with a policy to reinvigorate the banking sector and improve core legislation, including through the adoption of international standards. In the education sector, we need to raise the financial literacy of the Russian population.Industry-specific recommendations could include developing the regulatory and legal framework, human capital, and R&D in ICT to support the industry’s current activities and develop optimal mechanisms for transactions and data protection. The stability of Russia’s position will in many ways depend on the effectiveness of its collaboration with strategic partners through new international initiatives in the financial sphere, such as the New Development Bank BRICS (NDB BRICS) and Asian Infrastructure Investment Bank (AIIB) set up by the Shanghai Cooperation Organization Development Bank (SCO Development Bank).
Prospects of Improving Russia’s PositionProtecting the domestic financial market is critically important to Russia by creating competitive domestic equivalents to foreign electronic payment systems and taking up influential positions in new international financial organizations.
ConclusionGVCs are now starting to become both a more widespread mechanism in the global economy and an object of research and strategic planning on both national and international levels. Although existing
8 Available at: https://www.unicreditgroup.eu/en.html, accessed 21.07.2015.
2016 Vol. 10 No 1 FORESIGHT AND STI GOVERNANCE 81
approaches to GVC research in many ways complement one another, the theoretical foundations are not without fault. Core studies are now being worked on predominantly by scholars taking an innovation economy approach. The empirical and methodological foundations for studies on GVCs are improving and the reliability of research findings and their forecasting value increasing. In addition, the rationale for policy recommendations from research is strengthening and opportunities for strategic planning are expanding.Results of tests using a Foresight methodology confirm the effectiveness of these tools in terms of studying GVCs both when using it as an integrated methodology and when using just certain elements of Foresight. In particular, we are talking about identifying global trends affecting the development of GVCs, identifying risks, threats, and vulnerabilities of chains in which Russia is involved, analyzing ‘weak signals’ and ‘joker’ events, and examining the stability of existing GVCs and carrying out SWOT analyses. Lists of cutting-edge R&D areas and descriptions of potential results can be used to assess the potential of new GVCs and radically change the country’s position in existing chains. The communications platforms developed in Foresight studies could be used to discuss the problems of GVCs with key actors: companies in the real sector of the economy, regional clusters, higher education institutions, research institutions, technology platforms, business associations, government authorities, and other interested parties.An important stage of developing a comprehensive long-term strategy to embed Russia in GVCs is identifying so-called ‘windows of opportunity’, which are the most promising from the perspective of fruitful participation and of achieving a leading position in developmental economic areas. Of those examined in this article, GVCs in financial services, air travel, agriculture, and information and communication technologies all offer opportunities. However, efforts to integrate into existing (or even dying) GVCs with a high level of competition and stable group of major players (the automotive industry) would appear counterproductive.The principles and methods used to identify the positions and roles of companies in GVCs are in many ways tied to the aims and objectives decided upon when developing Russia’s Long-Term Science and Technology Development Forecast. Therefore, conceptual approaches to studying the interactions in global chains and innovative development trends are of particular value for research, both at a state level, taking into account the specific nature of the national innovation system, and at an institutional level, on the level of individual companies and firms.
The authors would like to express their gratitude to all those involved in the ‘Organization for Economic Co-operation and Development (OECD) Analysis of Leading Areas of Research in the field of Science, Technology and Innovation and Development of Information and Analytical Systems for Collaboration with the OECD in Priority Areas of Science, Technology and Innovation Policy’ project (code: 2015-14-573-0022-002) carried out by NRU HSE further to its obligations under Subsidy Agreement No. 14.602.21.0011 as part of the special federal programme ‘Research and Development in Russian Priority S&T Development Areas in 2014-2020’, including the students in the Faculty of World Economy and International Affairs at NRU HSE Yuliya Bodrova and Dmitriy Kalugin who took part in the industry analysis.
8 Available at: https://www.unicreditgroup.eu/en.html, accessed 21.07.2015.
Belousov A. (2013) Loukost. Saga. Zatmenie [Low-Cost. Saga. Eclipse]. Ekspert [Expert], 04.03.2013. Available at: http://expert.ru/ural/2013/09/loukost-saga-zatmenie/, accessed 24.07.2015 (in Russian).
Belousov A. (2014) Polet subsidii [Flight of the subsidy]. Ekspert [Expert], 07.07.2014. Available at: http://expert.ru/ural/2014/28/polet-subsidij_1/, accessed 24.07.2015 (in Russian).
Bessarabova M., Sologub A. (2015) Rossiiskie aviakompanii snizhayut tseny [Russian Airlines Cut Prices]. Delovoi Peterburg, 03.03.2015. Available at: http://www.dp.ru/a/2015/03/03/Prizemlenie_cen/, accessed 24.07.2015 (in Russian).
Chulok A. (2009) Prognoz perspektiv nauchno-tekhnologicheskogo razvitiya klyuchevykh sektorov rossiiskoi ekonomiki: budushchie zadachi [Forecast of S&T Development Prospects of the Key Economy Sectors in Russia: Future Tasks]. Foresight-Russia, vol. 3, no 3, pp. 30–36 (in Russian).
Cooke P.N. (2001) Regional innovation systems, clusters, and the knowledge economy, Oxford: Oxford University Press.
De Backer К., Miroudot S. (2014) Mapping Global Value Chains (Working Paper Series no 1677), Frankfurt am Main: European Central Bank.
DiLorenzo T.J. (1996) The myth of natural monopoly. The Review of Austrian Economics, vol. 9, pp. 43–58. DOI:10.1007/BF01103329.
Ernst D., Kim L. (2002) Global production networks, knowledge diffusion, and local capability formation. Research Policy, vol. 31, pp. 1417–1429. DOI:10.1016/s0048-7333(02)00072-0.
Etzkowitz H., Leydesdorff L. (2000) The Dynamics of Innovation: From National Systems and “Mode 2” to a Triple Helix of University–Industry–Government Relations. Research Policy, vol. 29, pp. 109–123.
EU Newsroom (2015) EU sanctions against Russia over Ukraine crisis. Available at: http://europa.eu/newsroom/highlights/special-coverage/eu_sanctions/index_en.htm, accessed 31.12.2015.
Meshkova Т., Moiseichev Е., pp. 69–82
References
82 FORESIGHT AND STI GOVERNANCE Vol. 10 No 1 2016
Master Class
Federal Customs Service (2015) Tovarnaya struktura eksporta Rossiiskoi Federatsii so vsemi stranami: yanvar’-dekabr’ 2014 g. [Structure of Russian commodities exports to all countries in January-December 2014]. Available at: http://customs.ru/index2.php?option=com_content&view=article&id=20490&Itemid=1978, accessed 24.07.2015 (in Russian).
Gereffi G. (1999) International trade and industrial upgrading in the apparel commodity chain. Journal of International Economics, vol. 48, pp. 37–70. DOI:10.1016/S0022-1996(98)00075-0.
Gereffi G., Humphrey J., Kaplinsky R., Sturgeon T.J. (2001) Introduction: Globalisation, Value Chains and Development, Brighton: Institute of Development Studies.
Gereffi G., Humphrey J., Sturgeon T. (2005) The governance of global value chains. Review of International Political Economy, vol. 12, no 1, pp. 78–104. DOI:10.1080/09692290500049805.
Gereffi G., Kaplinsky R. (2001) The value of value chains: Spreading the gains from globalization, Brighton: Institute of Development Studies.
Gibbon P. (2001) Upgrading Primary Production: A Global Commodity Chain Approach. World Development, vol. 29, no 2, pp. 345–363. DOI: 10.1016/S0305-750X(00)00093-0.
Gibbon P. (2003) The African Growth and Opportunity Act and the Global Commodity Chain for Clothing. World Development (Part special issue: Links between poverty and environment degradation in Latin America), vol. 31, no 11, pp. 1809–1827. DOI: 10.1016/j.worlddev.2003.06.002.
Gokhberg L. (ed.) (2014) Prognoz nauchno-tekhnologicheskogo razvitiya Rossii: 2030 [Russia’s Long-term S&T Foresight 2030], Moscow: Russian Ministry of Science and Education, HSE (in Russian).
Gurría A. (2015) “21 for 21”: A Proposal for Consolidation and Further Transformation of the OECD, Paris: OECD. Available at: http://www.oecd.org/about/secretary-general/21-for-21-A-Proposal-for-Consolidation-and-Further- Transformation-of-the-OECD.pdf, accessed 08.12.2015.
HSE (2016) Global’nye tekhnologicheskie trendy [Global Technology Trends] (ed. L. Gokhberg), Moscow: HSE (in Russian).
Humphrey J., Lecler Y., Salerno M.S. (еds.) (2000) Global strategies and local realities: The auto industry in emerging markets, New York; Basingstoke: Macmillan Press; St. Martin’s Press.
Humphrey J., Schmitz H. (2002) How does insertion in global value chains affect upgrading in industrial clusters? Regional Studies, vol. 36, pp. 1017–1027. DOI:10.1080/0034340022000022198.
Kaplinsky R. (2000) Spreading the gains from globalisation: What can be learned from value chain analysis? Journal of Development Studies, vol. 37, no 2, pp. 117–146.
Kaplinsky R. (2004) Spreading the Gains from Globalization: What Can Be Learned from Value-Chain Analysis? Problems of Economic Transition, vol. 47, no 2, pp. 74–115.
Kaplinsky R. (2013) Global Value Chains: Where They Came From, Where They Are Going and Why This Is Important (IKD Working Paper no 68), Milton Keynes, UK: The Open University.
Ken Research (2014) Russia seed industry outlook to 2018 — Cost-effective non-hybrid seeds to drive market growth, Gurgaon: Ken Research.
Kukushkin M. (2015) Nichego lichnogo [Nothing Personal]. RBK+. Vozdushnyi transport [RBC+. Air Transport], no 1, 18.05.2015. Available at: http://www.rbcplus.ru/news/5555b15e7a8aa901410298bf, accessed 24.07.2015 (in Russian).
Lundvall B.-A., Jurowetzki R., Lema R. (2015) Combining the Global Value Chain and the Innovation System perspectives (Paper presented at the DRUID Academy conference in Rebild, Aalborg, Denmark, January 21-23, 2015). Available at: http://druid8.sit.aau.dk/acc_papers/p8ym61f17dacl4e0v3afdaitvntv.pdf, accessed 12.11.2015.
Malerba F., Nelson R. (2011) Learning and catching up in different sectoral systems: Evidence from six industries. Industrial and Corporate Change, vol. 20, no 6, pp. 1645–1675. DOI:10.1093/icc/dtr062.
Meshkova T., Moiseichev E. (2015) Mirovye tendentsii razvitiya global’nykh tsepochek sozdaniya dobavlennoi stoimosti i uchastie v nikh Rossii [Global Value Chains: World Trends and the Russia’s Involvement]. Vestnik Finansovogo Universiteta [Bulletin of the Financial University], no 1(85), pp. 83–97 (in Russian).
Milberg W., Winkler D. (2011) Economic and social upgrading in global production networks: Problems of theory and measurement. International Labour Review, vol. 150, no 3–4, pp. 341–365.
Morrison, A., Pietrobelli, C., Rabellotti, R. (2008) Global Value Chains and Technological Capabilities: A Framework to Study Learning and Innovation in Developing Countries. Oxford Development Studies, vol. 36, no 1, pp. 39–58. DOI: 10.1080/13600810701848144.
Novaya Gazeta (2010) Ushla na bazu [Gone to Base]. Novaya Gazeta, 27.09.2010. Available at: http://www.novayagazeta.ru/politics/1563.html, accessed 23.07.2015 (in Russian).
OECD (2010) Global Value Chains: Russian Federation (A descriptive note), Paris: OECD. Available at: http://www.oecd.org/sti/ind/GVCs%20-%20RUSSIAN%20FEDERATION.pdf, accessed 17.10.2015.
OECD (2013) Interconnected Economies: Benefiting from Global Value Chains, Paris: OECD.OECD (2015a) Input-Output Tables, Available at: http://www.oecd.org/sti/ind/input-outputtables.htm, accessed
03.12.2015.OECD (2015b) Digital Economy Outlook 2015, Paris: OECD.OECD, World Bank (2015) Inclusive Global Value Chains: Policy options in trade and complementary areas for GVC
Integration by small and medium enterprises and low-income developing countries (Report prepared for submission to G20 Trade Ministers Meeting, Istanbul, Turkey, 6 October 2015), Paris: OECD, World Bank Group.
OECD, WTO (2013) OECD-WTO: Statistics on Trade in Value Added, Paris: OECD.OECD, WTO, UNCTAD (2013) Implications of Global Value Chains for Trade, Investment, Development and Jobs,
Paris: OECD, WTO, UNCTAD.OECD, WTO, World Bank Group (2014) Global Value Chains: Challenges, Opportunities, and Implications for Policy
(Report prepared for submission to the G20 Trade Ministers Meeting, Sydney, Australia), Paris: OECD, WTO, World Bank Group.

2016 Vol. 10 No 1 FORESIGHT AND STI GOVERNANCE 83
Pietrobelli C., Rabellotti R. (2011) Global Value Chains Meet Innovation Systems: Are There Learning Opportunities for Developing Countries? World Development, vol. 39, no 7, pp. 1261–1269. DOI: 10.1016/j.worlddev.2010.05.013.
RBC (2015) Rossiiskie aviakompanii vpervye obognali RZhD po chislu passazhirov [Airlines in Russia for the first time ahead of Railways in terms of passengers]. Available at: http://www.rbc.ru/rbcfreenews/55b7a50a9a79478b69ec4526, accessed 29.07.2015 (in Russian).
RBC.research (2015) Grazhdanskaya aviatsiya v Rossii: regulyarnye soobshcheniya 2014 [Civil Aviation in Russia: Regular Reports 2014], Moscow: RBK Marketingovye Issledovaniya [RBC Marketing Research] (in Russian).
RZD-Partner (2015) Rynok gruzovykh aviatsionnykh perevozok v Rossii rastet [Market cargo air transportation in Russia is growing]. Available at: http://www.rzd-partner.ru/news/aviaperevozki/rynok-gruzovykh-aviatsionnykh-perevozok-v-rossii-rastet/, accessed 29.07.2015 (in Russian).
Sturgeon T.J. (2001) How Do We Define Value Chains and Production Networks? IDS Bulletin, vol. 32, no 3, pp. 9–18. DOI: 10.1111/j.1759-5436.2001.mp32003002.x.
Timmer M., Erumban A.A., Gouma R., Los B., Temurshoev U., de Vries G.J., Arto I. (2012) The World Input-Output database (WIOD): Сontents, sources and methods, Brussels: European Commission. Available at: http://www.wiod.org/publications/source_docs/WIOD_sources.pdf, accessed 05.11.2015.
U.S. Department of State (2014) Russia and Ukraine Sanctions, Department of the Treasury. Available at: http://www.state.gov/e/eb/tfs/spi/ukrainerussia/index.htm, accessed: 31.12.2014.
Vasigh B., Erfani G., Sherman B. (2015) Airport Performance and Ownership Structure: Evidence from the United Kingdom, United States, and Latin America. Journal of Aviation Technology & Engineering, vol. 4, no 2, pp. 40–49. DOI: 10.7771/2159-6670.1100.
Vasigh B., Fleming K., Tacker T. (2013) Introduction to Air Transport Economics: From Theory to Applications, Aldershot: Ashgate Publishing.
Wood A. (2001) Value Chains: An Economist’s Perspective. IDS Bulletin, vol. 32, no 3, pp. 41–45. DOI: 10.1111/j.1759-5436.2001.mp32003005.x.
Zhang Y., Round D.K. (2011) Price wars and price collusion in China’s airline markets. International Journal of Industrial Organization, vol. 29, no 4, pp. 361–372. DOI: 10.1016/j.ijindorg.2010.07.005.