foreign investment and firm productivity: a meta-analysis
TRANSCRIPT
Foreign Investment and Firm Productivity
A Meta-Analysis
John McQuinnab and Iulia Siedschlagab c
Abstract Empirical estimates of the effects of foreign investment on productivity in both
manufacturing and service firms vary widely between countries A meta-analysis of the existing
empirical estimates allows us to econometrically examine the between estimates variation From
this empirical analysis we reach conclusions about the country-specific factors driving the variation
found in the empirical studies while controlling for study and estimation characteristics Our
evidence suggests that those service firms likely to experience increases in productivity following
foreign acquisition are located in more economically advanced although less open economies with
high human capital more efficient financial markets more product market competition and stricter
employment protection legislation In addition RampD intensity measures such as the number of RampD
personnel intensity and business expenditure on RampD intensity and specialisation in high-tech
exports are positively linked to productivity gains following foreign acquisitions We find both
similarities and differences between the effect of foreign acquisition on productivity in service and
manufacturing firms
Key Words Foreign investment Productivity Meta-analysis JEL Classification F16 F23 J24 Corresponding Author iuliasiedschlagesriie a Economic and Social Research Institute Dublin b Department of Economics Trinity College Dublin c Institute for International Integration Studies Trinity College Dublin
2
1 Introduction
Most of the literature on foreign investment considers productivity spillovers from foreign direct
investment1 (FDI) while more recent literature explores the direct impact of foreign acquisition on
firm productivity While many of these studies focus on the manufacturing sector only recent
studies focus on the impact of foreign acquisition on service firms To our knowledge only Kaitila et
al (2013) and Schiffbauer et al (2009) examine the direct effect of foreign acquisition on
productivity in service firms These studies find a great deal of variation between countries This
paper examines the effect of foreign acquisition on productivity in both services and manufacturing
using a meta-analysis to account for between estimate heterogeneity and controlling for
methodology while also considering the variation of the effects between countries
As mentioned above previous empirical research on the effect of foreign acquisitions on firm
productivity indicates a great deal of heterogeneity between countries (see Table 1) This paper is
motivated by explaining this variation using the meta-analysis as an empirical examination of the
estimates to give insight into variation and guide further research Using the meta-analysis
methodology allows us to explain the between estimate variation In particular we examine the
determinants of country and study variation on the effect of foreign acquisition on productivity in
service firms
The motivation for performing a meta-analysis rather than a literature review lies in the advantage
of using an empirical quantitative and objective approach over a more subjective review of the
literature
Key to the understanding of the relationship between foreign acquisition and productivity is the
absorptive capacity or the ability of acquired firms to assimilate knowledge or productive capabilities
from the acquiring firm as suggested by Meyer and Sinani (2009) and Girma (2005) An acquired
firm can also increase productivity through imperfect copying or imitating the parent firmrsquos
practices Meyer and Sinani (2009) describe a non-linear relationship with demonstration effects at
low levels of economic development and decreasing with further economic development while
absorptive capacity increases with greater economic development above a threshold level
Moreover factors such as economic and financial development human capital and the institutional
framework of the acquired firmrsquos country are also likely to determine the effect of foreign
acquisitions on productivity We investigate these relationships in this paper
This paper focuses on country-specific variation of the existing empirical estimates on the effects of
foreign acquisitions on firm productivity In particular our research seeks to answer the following
research questions
(1) Do study and estimate characteristics matter
(2) Which particular country characteristics drive the variation found for the effect of foreign
acquisition on firm productivity
Using the meta-analysis methodology we quantify the effects of country and study characteristics
explaining the variation of empirical estimates across studies and countries We also identify
similarities and differences between service and manufacturing firms
[Table 1 about here]
1 For a review of this literature see Meyer and Sinani (2009)
3
2 Theoretical Framework
Markusen (1984) Helpman (1984) and Markusen and Maskus (2003) classify in two broad categories
(vertical and horizontal) the motivation for FDI In the case of the vertical motivation the objective
of FDI is to enable the firm to produce in more competitive economies to reduce labour and
operating costs In contrast in the case of the horizontal motivation the firm is motivated by access
to new markets Other literature on FDI considers four key aims resource market efficiency or
strategic asset seeking (Dunning 1998) Given these motivations to engage in FDI Meyer and Sinani
(2009) discuss productivity spillovers linked to FDI and describe the role of economic and
institutional development in a countryrsquos absorptive capacity Absorptive capacity is important to the
acquired firmrsquos ability to realise gains from foreign acquisition They describe the absorptive capacity
of firms as the capacity to utilise acquired knowledge from FDI spillovers Nevertheless firms in
countries with low economic and institutional development can benefit from FDI spillovers from
imperfect copying of advanced practices known as demonstration effects However the productivity
gains from demonstration effects decline with economic development We build on these concepts
and apply them to the direct transfer of productivity-enhancing knowledge from foreign to domestic
firms through the channel of foreign acquisition In particular we examine the country-specific
factors and how these affect firm absorptive capacity as in Meyer and Sinani (2009) Criscuolo and
Narula (2008) and Borensztein et al (1998)
We follow Meyer and Sinani (2009) and use GDP per capita as a direct measure of economic
development controlling for the size of the economy As described above at low levels of economic
development absorptive capacity will be low and productivity gains are limited to copying the
parent firmrsquos practices through demonstration effects However absorptive capacity increases with
economic development and may be greater at higher levels of income once a threshold level has
been met We examine human capital measured by tertiary educational attainment as in Meyer and
Sinani (2009) and RampD intensity measured by RampD personnel per thousand and business expenditure
on RampD as a percent of GDP (Barrios et al 2004 and Kinoshita 2001) We also consider high-tech
industry specialisation measured by the share of exports relating to technology- intensive sectors
Moreover developed institutions tend to be associated with strong productivity (Acemoglu et al
2005) In particular we will examine broad institutional development through government
effectiveness as well as the strictness of both product market regulation and employment protection
legislation Government effectiveness is a broad proxy for institutional development with less
developed institutions having inadequate legal protection of intangible assets poor infrastructure
and inefficient markets increasing firm costs (Bloningen 2005) The strictness of product market
regulation is a proxy measure of competition covering barriers to trade investment
entrepreneurship and state control whereas employment protection legislation covers the
strictness of labour market legislation and therefore labour market rigidities The relationship
between product market competition and firm productivity following foreign acquisition is expected
to be negative (Nicoletti and Scarpetta 2005) On the other hand the relationship between
employment protection legislation and firm productivity can be both positive and negative Stricter
employment protection legislation may encourage investment in human capital and thus increase
absorptive capacity (Acemoglu and Pischke 1999 Belot et al 2007) Nevertheless a negative effect
is also possible in that stricter employment protection legislation make labour markets less flexible
4
and discourage productivity-enhancing restructuring of firms due to high firing costs (Martin and
Scarpetta 2011 Bentolila and Bertola 1990)
Alfaro et al (2004) argue that the absorptive capacity of firms achieving productivity gains following
FDI derives from the development of financial markets Efficient financial markets are necessary to
lower transaction costs ensure the efficient allocation of capital and hence drive firm technology
and productivity growth as suggested by King and Levine (1993ab) Beck et al (2000) and Levine et al
(2000) We extend this argument testing whether developed financial markets are positively linked
to productivity changes following acquisition As a result we include measures of financial market
development and efficiency domestic credit as a of GDP as a measure of financial development
and stock market capitalisation as a percent of GDP as a proxy for financial market efficiency
Finally trade openness may be an alternative channel to foreign acquisition through which links to
the international economy may be achieved Hence for highly open economies there may be a
substitution effect with foreign acquisition of firms Thus more open economies exhibit lower trade
protection and the firm may substitute the decision to engage in FDI with international trade as
suggested by Bloningen (2005) and Helpman (2003) We use a measure of trade openness to test
what impact this relationship may have on firm productivity following acquisition
3 Data Description
As the literature on the direct effect of foreign acquisition on firm productivity is very recent data
was collected from 24 papers including 22 studies which estimate the direct effect of foreign
acquisition on productivity in manufacturing firms and two papers which estimate the effect in
service firms Data collected on study characteristics included the effect estimate the number of
observations used in estimations and either the standard error or the t-statistic All estimated effects
of foreign acquisition on service firms were extracted from each paper giving a total of 207 pooled
observations for service firms and 636 pooled observations for manufacturing firms
Table 4 shows the countries included in both the service and manufacturing firm samples We
include a range of country characteristics in our specification as described in Table A1
In order to relate the country level data to the effect estimates simple averages of the country
characteristics were calculated over the time period of the studies In some cases data was missing
Where missing data was limited we used data for the nearest year available
The samples include a large number of studies varying widely in methodology by the number of
observations used in the estimation the measurement of productivity and the econometric model
used in estimation Thus we include a number of variables to control for this variation namely a
variable for the number of observations a dummy variable for the productivity measures and a
dummy variable indicating the methodology used in estimation
While only two studies are used to obtain estimates of the direct effect of foreign acquisition on
service firm productivity many estimates use variations of methodologies For instance while both
studies use the propensity score matching methodology many estimates in Kaitila et al (2013) use
the nearest neighbour matching methodology while also producing estimates using the epanechikov
kernel matching methodology Schiffbauer et al (2009) used only the epanechikov kernel matching
methodology An efficiency-bias trade-off exists between these two matching methodologies with
5
nearest neighbour matching using the best match hence attaining least bias whereas kernel
matching utilises all available information achieving minimum variance although with greater bias It
is ambiguous as to which matching method should be used so we include a variable to control for
kernel matching and test for a statistically significant difference from nearest neighbour matching
For the manufacturing sample there is more variation in the methodologies used allowing for the
inclusion of a dummy variable indicating those studies which use a propensity score matching
methodology
Furthermore Kaitila et al (2013) produced estimates using two different measures of labour
productivity turnover per employee (LPT) and value added per employee (LPV) whereas Schiffbauer
et al (2009) uses both LPV and an estimate of total factor productivity (TFP) obtained by estimating
the residual of a production function While Kaitila et al (2013) discuss some of the cross country
differences a more objective perspective of the existing research can be produced by empirical
means Hence it is important to account for between estimate heterogeneity in the measurement
of productivity with a dummy variable indicating LPT for the services sample and TFP in the
manufacturing sample
Tables 2 and 3 show summary statistics of the continuous variables for both services and
manufacturing The pooled average of the t-statistic for the services sample is negative and close to
zero while the t-statistic for manufacturing firms is positive although with a slightly larger standard
deviation Summary statistics for country characteristics indicated a good deal of variation of country
characteristics
[Tables 2-4 about here]
4 Empirical Methodology
The meta-analysis has been increasingly used since the early model proposed by Stanley and Jarrell
(1989) Stanley and Jarrell (1989) suggest a regression model with a number of study characteristics
as independent variables and the effects estimates found in the literature as the dependent variable
However the estimated effects are likely to be heteroscedastic given the variety of methodologies
samples and measurements in the literature Therefore Stanley and Jarrell (1989) suggest reducing
the heteroscedasticity present in the model by using a Weighted Least Squares (WLS) model with
the standard error as the weight This implies that the effect estimate is divided by the standard
error and it becomes the t-statistic An additional advantage of using the t-statistic as the dependent
variable is that it is dimensionless ie it is a standardised estimate comparable across studies which
use different units of measurement
The meta-analysis has been used in the foreign investment and trade literature For example Goumlrg
and Strobl (2001) analyse productivity spillovers arising from the presence of multinational
companies and apply an ordinary-least-square (OLS) model controlling for a number of study
characteristics As suggested by Stanley and Jarrell (1989) Goumlrg and Strobl (2001) use the t-statistic
as a dimensionless measure of effect as their dependent variable More recently Martins and Yang
(2009) adopt a similar approach also using an OLS methodology examining both the effect estimate
and the t-statistic as dependent variables in the exporting and firm productivity literature Following
6
Goumlrg and Strobl (2001) and Martins and Yang (2009) we use the standardised t-statistic in an OLS
methodology as a dimensionless independent variable
In addition many studies focus on the characteristics of the countries included in their analysis For
instance the International Study Group on Exports and Productivity (2008) considers country
characteristicsrsquo variation across a number of studies estimating exporter premia Similarly Meyer
and Sinani (2009) a meta-analysis of the literature on FDI productivity spillovers also explore the
variation in country characteristics Meyer and Sinani (2009) extend the linear model to include non-
linear effects of country variation controlling for study characteristics Furthermore they adopt a
random effects meta-regression approach which accounts for heterogeneity between study effects
again using the t-statistic as the dependent variable If heterogeneity between estimates is not
estimated to be large then a fixed-effect meta-analysis estimator may be used otherwise a random
effects estimator is appropriate Therefore given the heterogeneity of varying methodologies used
in the literature Meyer and Sinani (2009) apply a random effects meta-regression to their data We
also use this methodology in our analysis
We follow the approach of Meyer and Sinani (2009) described above and use both OLS and random
effects meta-regression models In the context of a meta-analysis fixed and random effects are
based on assumptions about the heterogeneity of the effects across studies rather than the variation
of firms across time (Hedges and Vevea 1998) Thus the fixed-effect model assumes that the effect
size in the population is homogenous across estimates whereas the random effects model assumes
that each effect estimate is heterogeneous and varies in size Longhi et al (2005) suggest quantifying
heterogeneity and test whether the heterogeneity is statistically significant using the Chochranrsquos Q
statistics defined as
119876 = 119888119894 ndash c
2
119907119894 ~ 120594119896minus1
2
119870
119894=1
c =
119888119894119907119894
119870
119894=1
1119907119894
119870
119894=1
Where K is the number of effect sizes 119888119894 refers to the estimated effects from the studies and c is
the average of these effects weighted by the inverses of the estimated variances 119907119894 Q is distributed
following a 1205942 distribution with k ndash 1 degrees of freedom and tests the null hypothesis that the
estimated effects are homogenous If the test rejects this hypothesis in favour of a heterogeneous
effect then the heterogeneity may be explained by the use of study and country characteristics in
the random effects model otherwise a fixed-effect model is used Nevertheless Longhi et al (2005)
also suggest that 119876 is likely to be rejected in large samples of observations even when the individual
effect sizes do not vary substantially
Our estimates of Cochranrsquos Q strongly reject the null hypothesis of no heterogeneity in both the
services and manufacturing samples and we proceed in using the random effects model In addition
the rejection of Cochranrsquos Q suggests that we should not follow the WLS approach used in Stanley
and Jarrell (1989) and Stanley (2005) as WLS is equivalent to the fixed-effect model
7
The random effects model includes two additive estimates of variance the variance within
estimates 1205902 and also an estimate of the variance between estimates 1205912 If 1205912 = 0 there is no
between estimate variation and this is the fixed-effect model While 1205902 can be obtained from the
standard errors in the literature the between estimate τ2 must be estimated by restricted maximum
likelihood from the fitted values of a regression weighted by 120596 the between study variance where
1205912 is restricted to non-negative values with an initial iteration at 1205912 = 0 The meta-regression model
also estimates the covariates weighted by 120596 in the fixed-effect model and 120603 in the random effects
model which includes both the within estimate variance 1205912 and the between estimate variance 1205902
Therefore the fixed-effects model ignores the between estimate variance and is estimated as
follows
yi = α + βXi + βZi + 120576i 119908ℎ119890119903119890 120576i ~ 119873 0 1205901198942
120596i = 1
1205901198942
The random effects model includes an additive component of variance as described above This
random effects meta-analysis model extends the fixed-effect model by adding the between study
variance
yi = α + βXi + βZi + 120576i + 120583i 119908ℎ119890119903119890 120576i ~ 119873 0 1205901198942 119886119899119889 120583i ~ 119873 0 1205912
120603119894 =1
1205901198942 + 120591 2
where yi refers to the estimated effect of foreign acquisition on productivity Xi is a list of study
controls Zi is a list of country variation variables (described in the data description above) 120576i is an
error term normally distributed around mean zero with variance 1205901198942 and 120583i is an error term normally
distributed around mean zero with variance 1205912
5 Results
Tables 5-7 show the results obtained with the random effects estimators2
[Tables 5-7 about here]
As discussed above 1205912rsquos lower bound is zero at which point all the between study variation is
explained by the covariates We find that 1205912 is quite small and close to zero for the services sample
suggesting that most heterogeneity is explained by the study and country characteristics included in
the model specifications Larger values for 1205912 are found for the manufacturing sample reflecting the
larger number of studies included in the sample (22 studies in the full sample for manufacturing) and
hence greater between study variance Also shown in the random effects regressions is the value for
I2 defined as (Q-df)Q I2 is interpreted as the percentage variation across an estimate which is due to
heterogeneity and in all models this value indicates that a very large proportion of the variation
between estimates (997 - 100) is attributable to heterogeneity Finally as many of the variables
are highly correlated we test for multicollinearity using the variance inflation factor test All models
2 These results are consistent with the OLS estimates which are shown in Tables A2-A4 in the Appendix
8
have variance inflation factors below five However multicollinearity between some of the country
characteristic variables means that many of these variables may only be examined separately in
different model specifications
51 Study Controls
We control for a number of estimation characteristics to reflect sample measurement and
methodological approaches in the estimates For instance we control for the number of
observations used in each study the measurement of productivity and the methodology In the case
of manufacturing we control for those studies which use the propensity score matching
methodology As all studies for service firms use the propensity score matching methodology we
instead control for the matching type to test for a statistically significant difference
Some of the estimate characteristics show a statistically significant relationship mostly in the
random effects rather than the OLS models The results for study controls suggest that the number
of observations used in each study estimate of the effect of foreign acquisition on firm productivity
do matter although weaker evidence is found for the measurement of productivity We find a
positive relationship between the number of observations and the effect of foreign acquisition on
firm productivity for manufacturing In contrast for the services sample we find a negative
relationship although this is no longer significant when many country characteristics are included in
the model For both the services and manufacturing samples we find some evidence to suggest that
the type of productivity has a statistically significant effect on the t-statistic however this evidence is
not strong In the services sample we control for productivity measured by turnover per employee
(LPT) and find LPT has a statistically significant negative relationship with the t-statistic in many of
the model specifications Furthermore the manufacturing sample shows a negative statistically
significant link between the t-statistic and the TFP measure of productivity for some model
specifications in the random effects models (only two models in the OLS models)
We do not find any evidence that the methodology used in the services sample kernel matching has
any effect on the t-statistic of the studies In contrast the manufacturing regressions show some
evidence that the propensity score matching methodology has a statistically significant negative link
with the t-statistic However this is not present when many country characteristic covariates are
included and in many of the models the links are no longer significant when the random effects
methodology is used
52 Country Variables
Our empirical findings suggest that absorptive capacity plays a role in the transfer of productivity-
enhancing knowledge from the acquiring firm to the acquired firm in the services sector In contrast
the evidence for manufacturing points towards demonstration effects as the mode of productivity
growth We find evidence to suggest a positive link between service firm productivity growth from
foreign acquisition and the economic development of the country However this is only significant
when many other country covariates are included as shown in Table 7 Nevertheless we do not find
any evidence to suggest a link between the size of the economy and service firm productivity While
the size of the economy does not matter some evidence indicates that the level of development of
the economy plays a role in the absorptive capacity of the firms being acquired Moreover we find
mixed evidence for the link between firm productivity and human capital for service firms in the
9
post-acquisition period However when other country covariates are controlled for the evidence
shows a positive link between human capital and firm productivity following foreign acquisition This
adds further evidence to the positive role of absorptive capacity in service firms as suggested by
Borensztein et al (1998)
Furthermore RampD intensity measures such as RampD personnel intensity business expenditure on
RampD as a percent of GDP (BERD) as well as the share of technology-intensive exports show a positive
link with service firm productivity as suggested by Barrios et al (2004) and Kinoshita (2001)
In addition strong evidence is found to suggest a negative link with the trade openness of the
economy suggesting lower productivity gains to foreign acquisition in more open economies with
lower trade protection
Some evidence is found for a positive link between financial development and the effect of foreign
acquisition on service firm productivity although this is no longer significant when other country
characteristics are included in the model We find that the efficiency of financial markets is positively
linked with firm productivity following foreign acquisition This suggests that the efficiency of the
financial markets is linked to service firmrsquos ability to absorb productivity increases following foreign
acquisition
With respect to institutions we found that less competitive product markets were linked to
decreases in service firm productivity following foreign acquisition consistent with Nicoletti and
Scarpetta (2005) Furthermore overall government effectiveness showed a positive link with service
firm productivity following foreign acquisition again suggesting that effective institutions play an
important role in the absorptive capacity and productivity of service firms (Acemoglu et al 2005) On
the other hand stricter employment protection legislation showed a positive relationship with
productivity in foreign acquired firms Stricter employment protection increases the incentives for
firms to invest in human capital and thus increases both absorptive capacity and firm productivity
through this channel (Acemoglu and Pischke 1999 Belot et al 2007)
We also find that the share of technology-intensive exports shows a positive link with service firm
productivity following foreign acquisition demonstrating further evidence for the role of absorptive
capacity in increasing productivity following acquisition similar to empirical evidence provided by
Barrios et al (2004)
The effect of foreign acquisitions on the productivity of manufacturing firms differs a good deal from
service firms Unlike service firms the evidence for manufacturing firm productivity following
foreign acquisition shows a strong negative link with the economic development of the country and
some evidence shows a positive relationship with the size of the economy This would suggest
productivity increases through demonstration effects (Meyer and Sinani 2009) and a vertical
motivation for foreign acquisition ie acquiring firms in less developed but more competitive
countries in terms of cost (Markusen and Maskus 2003) While some evidence does suggest a
negative relationship between trade openness and manufacturing firm productivity as in the services
sample the evidence for this is not strong and loses significance when other country covariates are
included Also human capital shows contrasting relationships between services and manufacturing
with the evidence indicating that manufacturing firm productivity is negatively linked to human
capital This would seem to suggest that foreign acquisition increases the productivity of
manufacturing firms located in lower human capital countries through demonstration effects as
10
opposed to the service sector where evidence suggests existing levels of high human capital increase
the firmrsquos ability to absorb the transfer of knowledge Furthermore measures of RampD intensity
capital such as BERD intensity and RampD personnel intensity also show a negative link for
manufacturing differing from the positive link found for services
While manufacturing firm productivity following foreign acquisition show evidence of a positive link
with financial development the evidence is weak for services and is no longer significant when other
country characteristics are included in the model In contrast manufacturing firms show evidence of
a negative link with firm productivity following acquisition and the efficiency of the financial system
whereas services show a positive link
In contrast to services we find that employment protection legislation has a negative link with
manufacturing firm productivity hindering productivity-enhancing labour restructuring as suggested
by Martin and Scarpetta (2011) and Bentolila and Bertola (1990) This suggests that a flexible labour
market allowing firm restructuring is important for manufacturing firm productivity growth following
foreign acquisition
Finally in countries with a high share of technology-intensive exports foreign acquisition led to
higher firm productivity for both manufacturing and service firms
6 Conclusions
We used a meta-regression model to explain the variation of the estimates on the effects of foreign
acquisition on firm productivity across studies and countries Our results suggest that those service
firms most likely to experience increases in productivity following foreign acquisition are located in
more economically developed countries in countries with large human capital and higher RampD
intensity (measured by RampD personnel intensity and business expenditure on RampD intensity) as well
as greater high-tech export specialisation In addition productivity appears to increase following
acquisition in countries with more efficient financial markets more competitive product markets
more effective government and stricter employment protection legislation These results indicate
that absorptive capacity is an important factor in achieving productivity gains following foreign
acquisition in service firms similar to the argument suggested by Meyer and Sinani (2009) in their
meta-analysis of the literature on productivity spillovers from FDI However service firm productivity
gains are lower in more open economies
The effect of foreign acquisitions on firm productivity varies between service and manufacturing
firms as well as between countries of different economic development As a result effective policy
design should be targeted to account for differences between the two sectors and between
countries
For service firms absorptive capacity is greater in more developed economies with higher human
capital Investment in RampD intensity will increase absorptive capacity and hence the productivity
gains experienced by foreign acquired service firms In these countries increasing product market
competition and increasing both the effectiveness of government and the strictness of employment
protection legislation will enable foreign acquisitions to achieve greater productivity increases
Nevertheless the productivity gains will be lower in more open economies In addition enhancing
the efficiency of the financial system will also stimulate service firm productivity
11
Similar to the service sector it appears that in manufacturing firms greater technology-intensive
export specialisation enables productivity following foreign acquisition with larger economies
gaining the most
Better access to credit will increase productivity gains following acquisition for manufacturing firms
Moreover a policy trade-off exists with respect to employment protection legislation in that stricter
EPL is likely to increase productivity in service firms following acquisition but decrease productivity in
manufacturing firms Hence the policy approach should be tailored to each sector with less strict EPL
for manufacturing industries to allow increased productivity growth through restructuring
Productivity is one measure of firm performance another policy relevant firm performance measure
is employment Indeed productivity gains and losses may be made through reducing or increasing
employment As with the empirical estimates on the effect of foreign acquisitions on productivity
the effect on employment also varies widely between countries A meta-analysis of empirical
estimates of the effects of foreign acquisitions on employment would help to explain this
heterogeneity controlling for country and estimation characteristics
Once again further research could use the meta-analysis methodology to provide a more objective
analysis of the empirical estimates and distinguish between services and manufacturing firms
However the existing analyses of the effect of foreign acquisition of service firms on employment
are limited to only a small number of countries mostly small open advanced economies and further
research needs to be completed for a wider variety of countries including middle and low income
countries
References
Acemoglu D Johnson S and Robinson J (2005) ldquoChapter 6 Institutions as a fundamental cause of long-run growthrdquo in Aghion P and Durlauf S N Ed Handbook of Economic Growth Volume 1A Oxford Elsevier
Acemoglua D and Pischke J S (1999) ldquoBeyond Becker Training in imperfect labour marketsrdquo The
Economic Journal Vol 109 pp 112-142
Aitken B J and Harrison A E (1999) ldquoDo Domestic Firms Benefit from Direct Foreign Investment Evidence from Venezuelardquo American Economic Review American Economic Association Vol 89 No 3 pp 605-618
Alfraro L Chanda A Kalemli-Ozcan S and Sayek S (2004) ldquoFDI and economic growth the role of local financial marketsrdquo Journal of International Economics Vol 64 pp 89-112
Arnold J M and Javorcik B S (2009) ldquoGifted kids or pushy parents Foreign direct investment and plant productivity in Indonesiardquo Journal of International Economics Vol 79 pp 42-53
Balsvik R and Haller S A (2010) ldquoPicking Lemons or Picking Cherries Domestic and Foreign Acquisitions in Norwegian Manufacturingrdquo Scandinavian Journal of Economics Wiley Blackwell Vol 112 No 2 pp 361-387
Bandick R (2011) ldquoForeign Acquisition Wages and Productivityrdquo The World Economy pp 931-951
12
Barrios S Dimelis S Louri H and Stroblt E (2004) ldquoEfficiency Spillovers from Foreign Direct
Investment in the EU Periphery A Comparative Study of Greece Ireland and Spainrdquo Review of
World Economics Vol 140 No 4 pp 688-705
Barro R and Lee J (2010) A New Data Set of Educational Attainment in the World 1950-2010 NBER Working Paper No 15902
Beck T Levine R Loayza N (2000) ldquoFinance and the sources of growthrdquo Journal of Financial
Economics Vol 58 pp 261-300
Belot M Boonez J and Van Ours J (2007) ldquoWelfare-Improving Employment Protectionrdquo
Economica Vol 74 pp 381-396
Bentolila S and Bertola G (1990) ldquoFiring Costs and Labour Demand How bad is Eurosclerosisrdquo
Review of Economic Studies Vol 57 pp 381-402
Bertrand O and Zitouna H (2008) ldquoMampA and target firmsrsquo performance are cross-border MampA different Some evidence from French firm-level datardquo Applied Economics Vol 40 No 17 pp 2221-2238
Blonigen B (2005) ldquoA review of the empirical literature on FDI determinantsrdquo NBER Working Paper
No 11299 NBER
Borensztein E Gregorio J amp Lee J (1998) ldquoHow does foreign direct investment affect economic growthrdquo Journal of International Economics Vol 45 pp 115-135
Card D and Krueger A B (1995) ldquoTime Series Minimum-Wage Studies A Meta-analysisrdquo The American Economic Review Vol 85 No 2 Papers and Proceedings of the Hundreth and Seventh Annual Meetings of the American Economic Association Washington DC January 8-6 1995 pp 238-243
Conyon M J Girma S Thompson S and Wright P W (2002) ldquoThe productivity and wage effects of foreign acquisition in the United Kingdomrdquo The Journal of Industrial Economics Vol 50 No 1 pp 85ndash102
Criscuolo P and Narula R (2008) ldquoA Novel approach to National Technological Accumulation and
Absorptive Capacity Aggregating Cohen and Levinthalrdquo European Journal of Development
Researchrdquo Vol 20 No 1 pp 56-73
Damijan J P de Sousa J and Lamotte O (2008) ldquoDoes international openness affect productivity of local firms Evidence from Southeastern Europerdquo LICOS Discussion Papers 21908 LICOS - Centre for Institutions and Economic Performance K U Leuven
Dunning J (1998) ldquoLocation and the Multinational Enterprise A Neglected Factorrdquo Journal of International Business Studies Vol 29 No 1 pp 45-66
Fukao K Ito K and Kwon K (2005) ldquoDo out-in MampAs bring higher TFP to Japan An empirical analysis based on micro-data on Japanese manufacturing firmsrdquo Journal of the Japanese and International Economies Vol 19 No 2 Analytical Issues in JapanUS Trade and Foreign Direct Investment pp 272-301
13
Fukao K Ito K Kwon H U and Takizawa M (2008) ldquoCross-Border Acquisitions and Target Firms Performance Evidence from Japanese Firm-Level Datardquo published in T Ito and A K Rose International Financial Issues in the Pacific Rim Global Imbalances Financial Liberalization and Exchange Rate Policy NBER-EASE Vol 17 pp 347ndash389
Fukao K and Murakami Y (2005) ldquoDo Foreign Firms Bring Greater Total Factor Productivity to Japanrdquo Journal of the Asia Pacific Economy Vol 10 No 2 pp 237-254
Gioia C and Thomsen S (2002) ldquoInternational Mergers and Acquisitions and the Market for Lemons International Acquisitions and Firm Performance in Denmark 1990-1997rdquo Copenhagen Business School Working Paper
Girma S (2005) ldquoTechnology Transfer from Acquisition FDI and the Absorptive Capacity of Domestic Firms An Empirical Investigationrdquo Open Economies Review Vol 16 No 2 pp 175-187
Girma S Kneller R and Pisu M (2007) ldquoDo exporters have anything to learn from foreign multinationalsrdquo European Economic Review Vol 51 No 4 pp 993-1010
Goumlrg H and Strobl E (2001) ldquoMultinational Companies and Productivity Spillovers a Meta-
Analysisrdquo The Economic Journal Vol 111 pp F723-F739
Greenaway D amp Guariglia A and Yu Z (2005) ldquoThe More the Better Foreign Ownership and Corporate Performance in China Publicationrdquo Leverhulme Centre Discussion Papers 0905 University of Nottingham GEP
Griffith R (1999) ldquoUsing the ARD Establishment Level Data to Look at Foreign Ownership and Productivity in the United Kingdomrdquo The Economic Journal Vol 109 pp 416-442
Hanley A and Zervos V (2007) ldquoThe Performance of UK Takeovers Does the Nationality of Acquirers Matterrdquo International Journal of the Economics of Business Taylor and Francis Journals Vol 14 No 2 pp 283-297
Harris R and Robinson C (2002) ldquoThe Effect of Foreign acquisitions on total factor productivity plant level evidence from the UK manufacturing 1987-1992rdquo The Review of Economics and Statistics Vol 84 No 3 pp 562-568
Harris R Siegel D S and Wright M (2005) ldquoAssessing the impact of management buyouts on economic efficiency plant-level evidence from the United Kingdomrdquo The Review of Economics and Statistics Vol 87 No 1 pp 148-153
Hedges L V and Vevea J L (1998) ldquoFixed and Random Effects Models in Meta-analysisrdquo
Psychological Methods Vol 3 No 4 pp 486-504
Helpman E (1984) ldquoA Simple Theory of International Trade with Multinational Corporationsrdquo Journal of Political Economy Vol 92 No 3 pp 451-471
Helpman E Melitz M J and Yeaple S R (2003) ldquoExport versus FDI CEPR Discussion Papers 3741 Centre for Economic Policy Research
Heston A Summers R and Aten B (2011) Penn World Table Version 70 Center for International
Comparisons of Production Income and Prices at the University of Pennsylvania
14
International Study Group on Exports and Productivity (ISGEP) (2008) ldquoUnderstanding Cross-
Country Differences in Exporter Premia Comparable Evidence for 14 Countriesrdquo Review of World
Economics Vol 144 No 4 pp 596-635
Kaitila V Mc Quinn J Siedschlag I and Zhang X (2013) ldquoInternational Investment and Firm Performance Empirical Evidence from Small Open Economiesrdquo ESRI Working Paper Forthcoming
Karpaty P (2007) ldquoProductivity Effects of Foreign Acquisitions in Swedish Manufacturing The FDI Productivityrdquo International Journal of the Economics of Business Vol 14 No 2 pp 241-260
Kaufmann D Kraay A and Mastruzzi M (2010) ldquoThe Worldwide Governance Indicators Methodology and Analytical Issuesrdquo World Bank Policy Research Working Paper No 5430
King R Levine R (1993a) ldquoFinance and growth Schumpeter might be rightrdquo Quarterly Journal of Economics Vol 108 pp 717-738
King R Levine R (1993b) ldquoFinance entrepreneurship and growth theory and evidencerdquo Journal
of Monetary Economics Vol 32 pp 513-542
Kinoshita Y (2001) ldquoRampD and technology spillovers via FDI Innovation and absorptive capacityrdquo CEPR Discussion Paper 2775 Center for Economic Policy Research
Levine R Loayza N Beck T (2000) ldquoFinancial intermediation and growth causality and causesrdquo
Journal of Monetary Economics Vol 46 No 1 pp 31-77
Longhi L Nijkamp P and Poot J (2005) ldquoA Meta-analytic Assessment of the Effect of Immigration on Wagesrdquo Journal of Economic Surveys Vol 19 No 3 pp 451-477
Markusen J R (1984) ldquoMultinationals Multi-Plant Economies and the Gains from Trade Journal of International Economics Vol 16 No 3-4 pp 205-226
Markusen J R and Maskus K E (2003) ldquoGeneral Equilibrium approaches to the Multinational Firm A review of Theory and Evidencerdquo in Choi E K and Harrigan J Ed Handbook of International Trade London Blackwell
Martin J P and Scarpetta S (2012) ldquoSetting It Right Employment Protection Labour Reallocation
and Productivityrdquo De Economist Vol 160 pp 89-116
Martins P S Yang Y (2009) ldquoThe Impact of Exporting on Firm Productivity a Meta-analysis of the
Learning-by-exporting hypothesisrdquo Review of World Economics Vol 145 pp 431-445
McGuckin R H and Nguyen S V (1995) ldquoOn Productivity and Plant Ownership Change New Evidence from the Longitudinal Research Databaserdquo The RAND Journal of Economics Blackwell Publishing Vol 26 No 2 pp 257-276
Meyer K E and Sinani E (2009) ldquoWhen and where does foreign direct investment generate
positive spillovers A Meta-analysisrdquo Journal of International Business Studies vol 40 pp 1075-
109
Nicoletti G and Scarpetta S (2005) ldquoProduct Market Reforms and Employment in OECD Countriesrdquo OECD Economics Department Working Papers No 472 OECD Publishing
15
OECD (2010) Employment Protection Legislation Strictness of employment protection legislation collective dismissals OECD Employment and Labour Market Statistics (database)
OECD (2011) Main Science and Technology Indicators (MSTI) Main Science and Technology Indicators (database)
OECD (2011) ldquoProduct Market Regulationrdquo Product Market Regulations (database)
Oulton N (1998) ldquoLabour Productivity and Foreign Ownership in the UKrdquo NIESR Discussion Papers
143 National Institute of Economic and Social Research
Piscitello L and Rabbiosi L (2005) ldquoThe impact of inward FDI on local companies labour productivity evidence from the Italian caserdquo International Journal of the Economics of Business Vol 12 No 1 pp 35 -51
Salis S (2008) ldquoForeign Acquisition and Firm Productivity Evidence from Sloveniardquo The World Economy Vol 31 No 8 pp 1030-1048
Schiffbauer M Siedschlag I and Ruane F (2009) ldquoDo Foreign Mergers amp Acquisitions Boost Firm Productivityrdquo ESRI Working paper No 305 ESRI
Stanley T D and Jarrell S B (1989) ldquoMeta-regression analysis A Quantitative Method of
Literature Surveysrdquo Journal of Economic Surveys Vol 3 No 2 pp 161-170
Stanley T D (2005) ldquoBeyond Publication Biasrdquo Journal of Economic Surveys Vol 19 No 3 pp
309-345
Sharp S (1998) ldquosbe23 Meta-analysis regressionrdquo Stata Technical Bulletin STB-42 pp 16-22
The World Bank (2011) ldquoWorld Development Indicatorsrdquo World Development Indicators (dataset)
16
Table 1 Literature review on post-acquisition impact of foreign acquisition on firm productivity
Study Country Sample Period
Methodology Productivity Type Effect on Productivity
McGuckin and Nguyen (1995)
US 1977-1987 OLS Labour productivity with some TFP
+
Outlon (1998)
UK 1995 OLS Labour productivity +
Aitken and Harrison (1999)
Venezuela 1976 through 1989 except 1980
OLS TFP +
Griffith (1999)
UK 1980-1992 OLS Difference in Difference and Systems GMM
TFP +
Conyon Girma Thompson and Wright (2002)
UK 1989-1994
OLS and Instrumental variable estimation to control for the endogeneity of wages
Labour productivity + for foreign acquisition Not significant for domestic acquisition
Harris and Robinson (2002)
UK 1987ndash1992 Systems GMM TFP -
Gioia and Thomsen (2002)
Denmark 1990-1997 Selection-adjustment factor (inverse Millrsquos ratio) from probit and controlled for this in OLS
TFP + - for selection adjusted estimates
Fukao Ito and Kwon (2005)
Japan 1994ndash2000 Propensity score matching and difference-in-difference
TFP + for US and European-acquired firms Not significant for MNEs from other regions have no effect
Fukao and Murakami (2005)
Japan 1994ndash1998 OLS Labour productivity and TFP
+ for foreign acquisitions Not significant for domestic acquisition and other independent firms
17
Table 1 Literature review on post-acquisition impact on foreign acquisition on firm productivity (ctd)
Study Country Sample Period
Methodology Productivity Type Effect on Productivity
Girma (2005)
UK 1989-1996 Propensity score matching and difference-in-difference
Industry TFP +
Harris Siegel and Wright (2005)
UK 1994-1998 Panel data using systems GMM
TFP and labour productivity
+
Piscitello and Rabbiosi (2005)
Italy 1994ndash 1997 OLS
Labour productivity +
Girma Kneller and Pisu (2007)
UK 1988-1996 Propensity score matching and difference-in-difference
TFP index +
Hanley and Zervos (2007)
UK 1990-1996 OLS and instrument for wages using a two stage least squares estimator
Labour productivity as a function of a skills proxy
-
Karpaty (2007)
Sweden 1986ndash2002 Propensity score matching and difference-in-difference
TFP +
Bertrand and Zitouna (2008)
France 1993-2000 Propensity score matching and difference-in-difference
TFP +
Damijan de Sousa and Lamotte (2008)
Bosnia-Herzegovina Bulgaria Croatia Macedonia Romania and Slovenia
1994-2002 GMM TFP + for four out of six countries
18
Table 1 Literature review on post-acquisition impact of foreign acquisition on firm productivity (ctd)
Study Country Sample Period
Methodology Productivity Type Effect on Productivity
Fukao Ito Kwon and Takizawa (2008)
Japan 1994- 2001 Propensity score matching and difference-in-difference
TFP +
Salis (2008) Slovenia 1994-1999 Propensity score matching and difference-in-difference matching
TFP Not significant
Arnold and Javorcik (2009)
Indonesia 1983-2001 Propensity score matching and difference-in-difference
TFP and labour productivity
+
Greenaway Guaraglia and Yu(2009)
China 2000-2005 First-difference Generalized Method of Moments
TFP + for Joint-ventures + initially for foreign ownership - once foreign ownership reaches beyond 64
Schiffbauer et al (2009)
UK 1999-2007 Propensity score matching and difference-in-difference
TFP and labour productivity
Not significant from foreign acquisitions on TFP in the aggregate + for RampD-intensive manufacturing acquirer and - for marketing-intensive manufacturing acquirer + for labour productivity in manufacturing Not significant in services
Balsvick and Haller (2010)
Norway 1992-2004 OLS TFP and labour productivity
- for domestic acquisition + for foreign acquisition
Bandick (2011)
Sweden 1993ndash2002 Propensity score matching and difference-in-differences
TFP + after vertical foreign acquisition only but not significant after a horizontal foreign acquisition
Kaitila Mc Quinn Siedschlag and Zhang (2013)
Austria Belgium the Netherlands Denmark Finland and Sweden
2000-2009 Propensity score matching and difference-in-differences
Labour Productivity - although heterogeneity between countries
19
Table 2 Summary Statistics - Services
Obs Mean Std Dev Min Max
t-statistic 207 -023 167 -465 445 Number of Observations 207 299 198 25 767 Trade Openness ( of GDP) 207 10665 2864 5418 15410 GDP Size (Billions PPP) 207 30900 28900 13800 159000 GDP (PPP) per Capita
207 34293 1605 31759 36196
Human Capital 207 2165 444 1393 2517 Financial Development 207 14746 3037 11100 18244 Market Cap as a of GDP
207 7313 2829 3022 14667
Government Effectiveness
207 188 016 165 215
Employment Protection Legislation 207 198 033 072 219 Product Regulation
207 134 019 091 161
BERD as a of GDP 207 181 066 098 277 RampD Personnel per 000
207 1516 441 1018 2350
Technology share of Exports 207 1031 874 230 3675
Table 3 Summary Statistics - Manufacturing
Obs Mean Std Dev Min Max
t-statistic 636 176 404 -397 4658 Number of Observations 636 22377 40482 5 225954 Trade Openness ( of GDP)
636 6680 3680 1780 15400
GDP Size (Billions PPP)
636 103000 143000 451 456000
GDP (PPP) per Capita 636 27587 8301 2541 41757 Human Capital 604 1770 708 213 2640 Financial Development 636 13389 7271 1913 29800 Market Cap as a of GDP 559 7201 3233 300 14667 Government Effectiveness 390 156 061 -108 215 Employment Protection Legislation 564 173 079 060 349 BERD as a of GDP 589 170 064 037 277 RampD Personnel per 000 589 1301 369 428 2350 Technology Share of Exports 589 2692 2304 014 7810
Note Due to substantial missing values data on product market regulation was not available for the
manufacturing dataset
20
Table 4 Countries included in sample
Manufacturing Sample Services Sample
Austria
Austria
Belgium
Belgium Bosnia amp Herzegovina Denmark
Bulgaria
Finland Croatia
Netherlands
Denmark
Sweden Finland
UK
France Indonesia Italy Japan Netherlands Norway Romania Slovenia Sweden UK Venezuela
21
Table 5 The Effect of Country Characteristics on the Productivity of Firms following Foreign Acquisition in Manufacturing Random Effects
(1) (2) (3) (4) (5) (6) (7) (8) (9) (10) Ln No of Observations 0473 0544 0430 0537 0586 0463 0625 0593 0607 0617
(0094) (0092) (0094) (0089) (0094) (0094) (0099) (0095) (0099) (0099)
Productivity (TFP) Dummy -0181 -1018 -0769 -0466 -0775 -0114 -0390 -0585 -0701 -1066
(0413) (0436) (0428) (0382) (0415) (0414) (0412) (0414) (0424) (0455)
Methodology (PSM) Dummy -0735 -0910 -0372 -0098 -0663 -0977 -0759 -0710 -0991 -0779
(0484) (0470) (0494) (0452) (0515) (0475) (0483) (0511) (0488) (0561)
Ln GDP size 0235
(0114)
Ln GDP per Capita
-1413
(0308)
Trade Openness
-0023
(0006)
Human Capital
-0086
(0021)
RampD Personnel per lsquo000
-0112
(0045)
Financial Development
0005
(0002)
Market Capitalisation as a of GDP
-0008
(0005)
BERD as a of GDP
-0607
(0255)
Technology share of Exports
0046
(0023)
Employment Protection Legislation
-0455
(0257)
Constant -7601 13055 0706 -0637 -0518 -1852 -1578 -1080 -2755 -1171
(3118) (3252) (0994) (0759) (0890) (0854) (0925) (0828) (0946) (0862)
Observations 636 636 636 604 589 636 559
589 544 564 τ
2 1356 1322 1336 1036 1249 1351 1338
1250 1315 1290 REML Log -1157 -1148 -1155 -1021 -1049 -1160 -1018
-1048 -9846 -1012 F-statistic 3468 3975 3774 3499 3928 3533 3520 3912 3845 3652 Q 2580e+08 2440e+08 2600e+08 1640e+08 1850e+08 3450e+08 1820e+08 1850e+08 1820e+08 1830e+08 I2 1000 1000 1000 1000 1000 1000 1000 1000 1000 1000
Standard errors in parentheses
plt001 plt005 plt01 Dependent Variable T-statistic
22
Table 6 The Effect of Country Characteristics on the Productivity of Firms following Foreign Acquisition in Services Random Effects
(1) (2) (3) (4) (5) (6) (7) (8) (9) (10) (11) (12) Ln No of Observations -0523 -0513 -0093 -0327 -0507 -0458 -0778 -0532 -0479 -0513 -0577 -0590
(0145) (0144) (0131) (0181) (0142) (0142) (0152) (0135) (0138) (0125) (0142) (0138)
Productivity (LPT) Dummy -0412 -0398 -0298 -0339 -0381 -0322 -0474 -0403 -0384 -0162 -0480 -0316
(0228) (0227) (0193) (0229) (0223) (0223) (0219) (0212) (0217) (0198) (0223) (0217)
Kernel Matching Dummy 0093 0132 -0089 0083 0165 0115 -0048 0195 0017 0181 0221 -0026
(0240) (0235) (0200) (0234) (0231) (0229) (0229) (0220) (0226) (0203) (0231) (0225)
Ln GDP size 0117
(0222)
Ln GDP per Capita
1789
(2406)
Trade Openness
-0032
(0004)
Human Capital
-0054
(0032)
RampD Personnel per lsquo000
0072
(0025)
Financial Development
0012
(0004)
Market Capitalisation as a of GDP
0018
(0004)
BERD as a of GDP
0876
(0161)
Technology share of Exports
0075
(0017)
Government effectiveness
5008
(0602)
Employment Protection Legislation
0663
(0207)
Product Market Regulation
-2674
(0572)
Constant -0301 -15986 3874 2856 1545 0594 2926 1191 1198 -6855 1515 6716
(5772) (25152) (0702) (0812) (0895) (1023) (0782) (0809) (0850) (1348) (0877) (1154)
Observations 207 207 207 207 207 207 207 207 207 207 207 207 τ
2 2626 2622 1885 2593 2527 2497 2417 2291 2400 1956 2501 2371
REML Log -2098 -2073 -1804 -2104 -2081 -2088 -2054 -1963 -2033 -1791 -2050 -1986 F-statistic 3897 3971 2516 4586 6023 6699 8552 1181 8984 2241 6584 9705 Q 143789 138841 98359 143410 143681 143270 122239 121448 125428 108584 121450 130250 I2 0999 0999 0998 0999 0999 0999 0998 0998 0998 0998 0998 0998
Standard errors in parentheses
plt001 plt005 plt01 Dependent Variable T-statistic
23
Table 7 The Effect of Country Characteristics on the Productivity of Firms following Foreign Acquisition in Services and Manufacturing Random Effects
Services Manufacturing (1) (2) (3) (4) (5) (1) (2) (3) (4) (5) Ln No of Observations -0523 -0519 0001 -0226 -0216 0473 0491 0478 0443 0500
(0145) (0146) (0128) (0153) (0153) (0094) (0091) (0093) (0093) (0098)
Productivity (TFP) Dummy
-0181 -1189 -1293 -0941 -0859
(0413) (0431) (0450) (0405) (0407)
Methodology (PSM) Dummy
-0735 -0416 -0335 -0033 -0019
(0484) (0474) (0484) (0479) (0478)
Productivity (LPT) Dummy -0412 -0406 -0256 -0327 -0311
(0228) (0229) (0185) (0184) (0186)
Kernel Matching Dummy 0093 0113 -0056 0013 0011
(0240) (0243) (0197) (0196) (0196)
Ln GDP size 0117 0076 -0034 -0093 -0078 0235 0610 0528 0475 0301
(0222) (0232) (0188) (0186) (0188) (0114) (0125) (0161) (0150) (0179)
Ln GDP per Capita
1552 9969 13952 13763
-2200 -2081 -1574 -1404
(2519) (2188) (2633) (2647)
(0343) (0373) (0394) (0405)
Trade Openness
-0039 -0043 -0042
-0006 -0005 0000
(0004) (0004) (0004)
(0008) (0007) (0008)
Human Capital
0085 0081
-0029 -0080
(0032) (0033)
(0028) (0040)
Financial Development
0003
0007
(0003)
(0004)
Constant -0301 -15456 -99171 -139356 -138236 -7601 4943 6481 2882 4995
(5772) (25260) (21915) (26437) (26502) (3118) (3603) (4070) (4847) (4984)
Observations 207 207 207 207 207 636 636 636 604 604 τ
2 2626 2634 1712 1662 1665 1356 1278 1279 9963 9933
REML Log -2098 -2087 -1707 -1708 -1762 -1157 -1138 -1143 -1015 -1019 F-statistic 3897 3184 2215 2055 1802 3468 3764 3146 2485 2220 Q 143789 137145 81107 80128 80082 2580e+08 2440e+08 2160e+08 1620e+08 1620e+08 I2 0999 0999 0998 0998 0998 1000 1000 1000 1000 1000
Standard errors in parentheses
plt001 plt005 plt01 Dependent Variable T-statistic
24
Table A1
Name Description Source
Country size GDP in US dollars 2000 constant prices World Development Indicators 2011 (httpdataworldbankorg)
Economic development
GDP per capita (Purchasing Power Parity) in US dollars 2005 constant prices
Heston Summers and Aten (2011) Penn World Tables
Trade openness Total of exports and imports divided by GDP in US dollars 2005 constant prices
Heston Summers and Aten (2011) Penn World Tables
Human capital The percent of the population over 25 with tertiary education Barro and Lee (2010) dataset
RampD intensity RampD personnel per thousand employed OECD Main Science and Technology indicators 2011 (wwwoecdorgstimsti)
RampD intensity Business expenditure on RampD as a percent of GDP OECD Main Science and Technology indicators 2011 (wwwoecdorgstimsti)
Financial development
Domestic credit provided by the banking sector as a percent of GDP World Development Indicators 2011 (httpdataworldbankorg)
Efficiency of the financial markets
stock market capitalisation of listed companies as a percent of GDP World Development Indicators 2011 (httpdataworldbankorg)
Government effectiveness
Ranging from -25 indicating weak government performance to +25 indicating strong government performance This captures public perception of the quality of public services the civil service the degree of independence from political pressure the quality of policy formulation and implementation and the credibility of the government to such policies
World Governance Indicators 2010 (httpinfoworldbankorggovernancewgiindexasp)
Strictness of employment protection
Ranging from 0 to 6 with higher values indicating stricter employment protection legislation This summarises employment procedures notice severance pay and difficulty of dismissal
OECD 2010 (wwwoecdorgemploymentprotection)
Product market regulation
Ranging from 0 to 6 with higher values indicating more regulated product markets This variable summarises barriers to entrepreneurship trade investment and state control
OECD 2011 (wwwoecdorgeconomypmr)
High-tech industry specialisation
export share of technology-intensive industries (aerospace electricity instruments office and computers and pharmaceuticals)
OECD Main Science and Technology indicators 2011 (wwwoecdorgstimsti)
25
Table A2 The Effect of Country Characteristics on the Productivity of Firms following Foreign Acquisition in Manufacturing OLS
(1) (2) (3) (4) (5) (6) (7) (8) (9) (10) Ln No of Observations 0474 0551 0429 0551 0599 0466 0627 0610 0606 0634
(0083) (0090) (0079) (0086) (0094) (0082) (0107) (0093) (0105) (0113)
Productivity (TFP) Dummy -0284 -1143 -0897 -0624 -0899 -0221 -0514 -0681 -0820 -1181
(0571) (0627) (0649) (0577) (0618) (0585) (0582) (0607) (0610) (0706)
Methodology (PSM) Dummy -0733 -0908 -0351 -0087 -0609 -0993 -0769 -0637 -0994 -0664
(0390) (0315) (0361) (0295) (0301) (0333) (0307) (0324) (0307) (0322)
Ln GDP size 0259
(0164)
Ln GDP per Capita
-1466
(0354)
Trade Openness
-0024
(0006)
Human Capital
-0092
(0026)
RampD Personnel per lsquo000
-0124
(0032)
Financial Development
0005
(0003)
Market Capitalisation as a of GDP
-0009
(0005)
BERD as a of GDP
-0699
(0166)
Technology share of Exports
0049
(0019)
Employment Protection Legislation
-0556
(0205)
Constant -8234 13577 0860 -0591 -0447 -1877 -1496 -1063 -2794 -1126
(4637) (3834) (0582) (0552) (0615) (0702) (0542) (0509) (0716) (0563)
Observations 636 636 636 604 589 636 559
589 544 564 R
2 0181 0203 0196 0192 0215 0184 0202 0215 0222 0212
Adjusted R2 0176 0198 0191 0187 0209 0178 0196 0210 0216 0206
F-statistic 3583 3866 4121 5308 5377 4329 2871
5266 3155 4040 RMSE 3671 3621 3637 3205 3517 3666 3650
3516 3617 3568 Robust standard errors in parentheses
plt001 plt005 plt01 Dependent Variable T-statistic
26
Table A3 The Effect of Country Characteristics on the Productivity of Firms following Foreign Acquisition in Services OLS
(1) (2) (3) (4) (5) (6) (7) (8) (9) (10) (11) (12) Ln No of Observations -0523 -0513 -0095 -0328 -0507 -0460 -0779 -0532 -0481 -0515 -0575 -0592
(0128) (0127) (0121) (0175) (0124) (0118) (0148) (0122) (0117) (0112) (0127) (0126)
Productivity (LPT) Dummy -0413 -0399 -0299 -0340 -0382 -0323 -0475 -0404 -0385 -0164 -0480 -0317
(0226) (0227) (0197) (0227) (0224) (0223) (0216) (0212) (0219) (0208) (0218) (0218)
Kernel Matching Dummy 0093 0131 -0090 0083 0164 0115 -0048 0194 0017 0180 0220 -0026
(0241) (0236) (0206) (0235) (0232) (0228) (0230) (0222) (0227) (0205) (0231) (0229)
Ln GDP size 0115
(0178)
Ln GDP per Capita
1756
(2007)
Trade Openness
-0032
(0004)
Human Capital
-0054
(0031)
RampD Personnel per lsquo000
0072
(0023)
Financial Development
0012
(0004)
Market Capitalisation as a of GDP
0018
(0004)
BERD as a of GDP
0876
(0160)
Technology share of Exports
0075
(0017)
Government effectiveness
5002
(0608)
Employment Protection Legislation
0659
(0227)
Product Market Regulation
-2668
(0507)
Constant -0255 -15639 3889 2853 1548 0603 2933 1192 1211 -6829 1515 6721
(4602) (21071) (0646) (0687) (0724) (0786) (0686) (0675) (0654) (1299) (0784) (1142)
Observations 207 207 207 207 207 207 207 207 207 207 207 207 R
2 00721 00733 0333 00837 0107 0118 0145 0190 0151 0308 0115 0162
Adjusted R2 00537 00549 0320 00655 00895 0100 0128 0174 0134 0294 00979 0145
F-statistic 5099 5357 2712 6102 7208 6332 9050 1264 8651 2511 7452 1031 RMSE 1622 1621 1375 1611 1591 1581 1556 1515 1551 1400 1583 1541 Robust standard errors in parentheses
plt001 plt005 plt01 Dependent Variable T-statistic
27
Table A4 The Effect of Country Characteristics on the Productivity of Firms following Foreign Acquisition in Services and Manufacturing OLS
Services Manufacturing (1) (2) (3) (4) (5) (1) (2) (3) (4) (5) Ln No of Observations -0523 -0519 0000 -0226 -0217 0474 0493 0479 0448 0510
(0128) (0129) (0124) (0162) (0162) (0083) (0082) (0079) (0078) (0082)
Productivity (TFP) Dummy
-0284 -1279 -1390 -1069 -0970
(0571) (0625) (0665) (0594) (0603)
Methodology (PSM) Dummy
-0733 -0390 -0303 -0001 0014
(0390) (0346) (0345) (0273) (0275)
Productivity (LPT) Dummy -0413 -0406 -0258 -0328 -0313
(0226) (0226) (0191) (0186) (0185)
Kernel Matching Dummy 0093 0112 -0056 0012 0011
(0241) (0244) (0198) (0194) (0194)
Ln GDP size 0115 0075 -0035 -0094 -0079 0259 0638 0545 0498 0307
(0178) (0185) (0173) (0169) (0169) (0164) (0151) (0148) (0127) (0118)
Ln GDP per Capita
1523 9925 13916 13728
-2270 -2136 -1619 -1430
(2048) (2160) (2515) (2574)
(0311) (0312) (0326) (0286)
Trade Openness
-0039 -0043 -0042
-0007 -0005 0000
(0004) (0004) (0004)
(0005) (0004) (0004)
Human Capital
0085 0081
-0031 -0086
(0033) (0034)
(0032) (0024)
Financial Development
0003
0008
(0003)
(0004)
Constant -0255 -15120 -98695 -138948 -137831 -8234 4913 6610 2795 5087
(4602) (21028) (22332) (26084) (26551) (4637) (5262) (5271) (3554) (3738)
Observations 207 207 207 207 207 636 636 636 604 604 R
2 00721 00738 0399 0420 0421 0181 0236 0237 0234 0239
Adjusted R2 00537 00507 0381 0399 0398 0176 0230 0230 0225 0229
F-statistic 5099 4286 2890 2632 2300 3583 3553 3430 3350 3335 RMSE 1622 1624 1311 1292 1293 3671 3548 3549 3129 3122 Robust standard errors in parentheses
plt001 plt005 plt01 Dependent Variable T-statistic

2
1 Introduction
Most of the literature on foreign investment considers productivity spillovers from foreign direct
investment1 (FDI) while more recent literature explores the direct impact of foreign acquisition on
firm productivity While many of these studies focus on the manufacturing sector only recent
studies focus on the impact of foreign acquisition on service firms To our knowledge only Kaitila et
al (2013) and Schiffbauer et al (2009) examine the direct effect of foreign acquisition on
productivity in service firms These studies find a great deal of variation between countries This
paper examines the effect of foreign acquisition on productivity in both services and manufacturing
using a meta-analysis to account for between estimate heterogeneity and controlling for
methodology while also considering the variation of the effects between countries
As mentioned above previous empirical research on the effect of foreign acquisitions on firm
productivity indicates a great deal of heterogeneity between countries (see Table 1) This paper is
motivated by explaining this variation using the meta-analysis as an empirical examination of the
estimates to give insight into variation and guide further research Using the meta-analysis
methodology allows us to explain the between estimate variation In particular we examine the
determinants of country and study variation on the effect of foreign acquisition on productivity in
service firms
The motivation for performing a meta-analysis rather than a literature review lies in the advantage
of using an empirical quantitative and objective approach over a more subjective review of the
literature
Key to the understanding of the relationship between foreign acquisition and productivity is the
absorptive capacity or the ability of acquired firms to assimilate knowledge or productive capabilities
from the acquiring firm as suggested by Meyer and Sinani (2009) and Girma (2005) An acquired
firm can also increase productivity through imperfect copying or imitating the parent firmrsquos
practices Meyer and Sinani (2009) describe a non-linear relationship with demonstration effects at
low levels of economic development and decreasing with further economic development while
absorptive capacity increases with greater economic development above a threshold level
Moreover factors such as economic and financial development human capital and the institutional
framework of the acquired firmrsquos country are also likely to determine the effect of foreign
acquisitions on productivity We investigate these relationships in this paper
This paper focuses on country-specific variation of the existing empirical estimates on the effects of
foreign acquisitions on firm productivity In particular our research seeks to answer the following
research questions
(1) Do study and estimate characteristics matter
(2) Which particular country characteristics drive the variation found for the effect of foreign
acquisition on firm productivity
Using the meta-analysis methodology we quantify the effects of country and study characteristics
explaining the variation of empirical estimates across studies and countries We also identify
similarities and differences between service and manufacturing firms
[Table 1 about here]
1 For a review of this literature see Meyer and Sinani (2009)
3
2 Theoretical Framework
Markusen (1984) Helpman (1984) and Markusen and Maskus (2003) classify in two broad categories
(vertical and horizontal) the motivation for FDI In the case of the vertical motivation the objective
of FDI is to enable the firm to produce in more competitive economies to reduce labour and
operating costs In contrast in the case of the horizontal motivation the firm is motivated by access
to new markets Other literature on FDI considers four key aims resource market efficiency or
strategic asset seeking (Dunning 1998) Given these motivations to engage in FDI Meyer and Sinani
(2009) discuss productivity spillovers linked to FDI and describe the role of economic and
institutional development in a countryrsquos absorptive capacity Absorptive capacity is important to the
acquired firmrsquos ability to realise gains from foreign acquisition They describe the absorptive capacity
of firms as the capacity to utilise acquired knowledge from FDI spillovers Nevertheless firms in
countries with low economic and institutional development can benefit from FDI spillovers from
imperfect copying of advanced practices known as demonstration effects However the productivity
gains from demonstration effects decline with economic development We build on these concepts
and apply them to the direct transfer of productivity-enhancing knowledge from foreign to domestic
firms through the channel of foreign acquisition In particular we examine the country-specific
factors and how these affect firm absorptive capacity as in Meyer and Sinani (2009) Criscuolo and
Narula (2008) and Borensztein et al (1998)
We follow Meyer and Sinani (2009) and use GDP per capita as a direct measure of economic
development controlling for the size of the economy As described above at low levels of economic
development absorptive capacity will be low and productivity gains are limited to copying the
parent firmrsquos practices through demonstration effects However absorptive capacity increases with
economic development and may be greater at higher levels of income once a threshold level has
been met We examine human capital measured by tertiary educational attainment as in Meyer and
Sinani (2009) and RampD intensity measured by RampD personnel per thousand and business expenditure
on RampD as a percent of GDP (Barrios et al 2004 and Kinoshita 2001) We also consider high-tech
industry specialisation measured by the share of exports relating to technology- intensive sectors
Moreover developed institutions tend to be associated with strong productivity (Acemoglu et al
2005) In particular we will examine broad institutional development through government
effectiveness as well as the strictness of both product market regulation and employment protection
legislation Government effectiveness is a broad proxy for institutional development with less
developed institutions having inadequate legal protection of intangible assets poor infrastructure
and inefficient markets increasing firm costs (Bloningen 2005) The strictness of product market
regulation is a proxy measure of competition covering barriers to trade investment
entrepreneurship and state control whereas employment protection legislation covers the
strictness of labour market legislation and therefore labour market rigidities The relationship
between product market competition and firm productivity following foreign acquisition is expected
to be negative (Nicoletti and Scarpetta 2005) On the other hand the relationship between
employment protection legislation and firm productivity can be both positive and negative Stricter
employment protection legislation may encourage investment in human capital and thus increase
absorptive capacity (Acemoglu and Pischke 1999 Belot et al 2007) Nevertheless a negative effect
is also possible in that stricter employment protection legislation make labour markets less flexible
4
and discourage productivity-enhancing restructuring of firms due to high firing costs (Martin and
Scarpetta 2011 Bentolila and Bertola 1990)
Alfaro et al (2004) argue that the absorptive capacity of firms achieving productivity gains following
FDI derives from the development of financial markets Efficient financial markets are necessary to
lower transaction costs ensure the efficient allocation of capital and hence drive firm technology
and productivity growth as suggested by King and Levine (1993ab) Beck et al (2000) and Levine et al
(2000) We extend this argument testing whether developed financial markets are positively linked
to productivity changes following acquisition As a result we include measures of financial market
development and efficiency domestic credit as a of GDP as a measure of financial development
and stock market capitalisation as a percent of GDP as a proxy for financial market efficiency
Finally trade openness may be an alternative channel to foreign acquisition through which links to
the international economy may be achieved Hence for highly open economies there may be a
substitution effect with foreign acquisition of firms Thus more open economies exhibit lower trade
protection and the firm may substitute the decision to engage in FDI with international trade as
suggested by Bloningen (2005) and Helpman (2003) We use a measure of trade openness to test
what impact this relationship may have on firm productivity following acquisition
3 Data Description
As the literature on the direct effect of foreign acquisition on firm productivity is very recent data
was collected from 24 papers including 22 studies which estimate the direct effect of foreign
acquisition on productivity in manufacturing firms and two papers which estimate the effect in
service firms Data collected on study characteristics included the effect estimate the number of
observations used in estimations and either the standard error or the t-statistic All estimated effects
of foreign acquisition on service firms were extracted from each paper giving a total of 207 pooled
observations for service firms and 636 pooled observations for manufacturing firms
Table 4 shows the countries included in both the service and manufacturing firm samples We
include a range of country characteristics in our specification as described in Table A1
In order to relate the country level data to the effect estimates simple averages of the country
characteristics were calculated over the time period of the studies In some cases data was missing
Where missing data was limited we used data for the nearest year available
The samples include a large number of studies varying widely in methodology by the number of
observations used in the estimation the measurement of productivity and the econometric model
used in estimation Thus we include a number of variables to control for this variation namely a
variable for the number of observations a dummy variable for the productivity measures and a
dummy variable indicating the methodology used in estimation
While only two studies are used to obtain estimates of the direct effect of foreign acquisition on
service firm productivity many estimates use variations of methodologies For instance while both
studies use the propensity score matching methodology many estimates in Kaitila et al (2013) use
the nearest neighbour matching methodology while also producing estimates using the epanechikov
kernel matching methodology Schiffbauer et al (2009) used only the epanechikov kernel matching
methodology An efficiency-bias trade-off exists between these two matching methodologies with
5
nearest neighbour matching using the best match hence attaining least bias whereas kernel
matching utilises all available information achieving minimum variance although with greater bias It
is ambiguous as to which matching method should be used so we include a variable to control for
kernel matching and test for a statistically significant difference from nearest neighbour matching
For the manufacturing sample there is more variation in the methodologies used allowing for the
inclusion of a dummy variable indicating those studies which use a propensity score matching
methodology
Furthermore Kaitila et al (2013) produced estimates using two different measures of labour
productivity turnover per employee (LPT) and value added per employee (LPV) whereas Schiffbauer
et al (2009) uses both LPV and an estimate of total factor productivity (TFP) obtained by estimating
the residual of a production function While Kaitila et al (2013) discuss some of the cross country
differences a more objective perspective of the existing research can be produced by empirical
means Hence it is important to account for between estimate heterogeneity in the measurement
of productivity with a dummy variable indicating LPT for the services sample and TFP in the
manufacturing sample
Tables 2 and 3 show summary statistics of the continuous variables for both services and
manufacturing The pooled average of the t-statistic for the services sample is negative and close to
zero while the t-statistic for manufacturing firms is positive although with a slightly larger standard
deviation Summary statistics for country characteristics indicated a good deal of variation of country
characteristics
[Tables 2-4 about here]
4 Empirical Methodology
The meta-analysis has been increasingly used since the early model proposed by Stanley and Jarrell
(1989) Stanley and Jarrell (1989) suggest a regression model with a number of study characteristics
as independent variables and the effects estimates found in the literature as the dependent variable
However the estimated effects are likely to be heteroscedastic given the variety of methodologies
samples and measurements in the literature Therefore Stanley and Jarrell (1989) suggest reducing
the heteroscedasticity present in the model by using a Weighted Least Squares (WLS) model with
the standard error as the weight This implies that the effect estimate is divided by the standard
error and it becomes the t-statistic An additional advantage of using the t-statistic as the dependent
variable is that it is dimensionless ie it is a standardised estimate comparable across studies which
use different units of measurement
The meta-analysis has been used in the foreign investment and trade literature For example Goumlrg
and Strobl (2001) analyse productivity spillovers arising from the presence of multinational
companies and apply an ordinary-least-square (OLS) model controlling for a number of study
characteristics As suggested by Stanley and Jarrell (1989) Goumlrg and Strobl (2001) use the t-statistic
as a dimensionless measure of effect as their dependent variable More recently Martins and Yang
(2009) adopt a similar approach also using an OLS methodology examining both the effect estimate
and the t-statistic as dependent variables in the exporting and firm productivity literature Following
6
Goumlrg and Strobl (2001) and Martins and Yang (2009) we use the standardised t-statistic in an OLS
methodology as a dimensionless independent variable
In addition many studies focus on the characteristics of the countries included in their analysis For
instance the International Study Group on Exports and Productivity (2008) considers country
characteristicsrsquo variation across a number of studies estimating exporter premia Similarly Meyer
and Sinani (2009) a meta-analysis of the literature on FDI productivity spillovers also explore the
variation in country characteristics Meyer and Sinani (2009) extend the linear model to include non-
linear effects of country variation controlling for study characteristics Furthermore they adopt a
random effects meta-regression approach which accounts for heterogeneity between study effects
again using the t-statistic as the dependent variable If heterogeneity between estimates is not
estimated to be large then a fixed-effect meta-analysis estimator may be used otherwise a random
effects estimator is appropriate Therefore given the heterogeneity of varying methodologies used
in the literature Meyer and Sinani (2009) apply a random effects meta-regression to their data We
also use this methodology in our analysis
We follow the approach of Meyer and Sinani (2009) described above and use both OLS and random
effects meta-regression models In the context of a meta-analysis fixed and random effects are
based on assumptions about the heterogeneity of the effects across studies rather than the variation
of firms across time (Hedges and Vevea 1998) Thus the fixed-effect model assumes that the effect
size in the population is homogenous across estimates whereas the random effects model assumes
that each effect estimate is heterogeneous and varies in size Longhi et al (2005) suggest quantifying
heterogeneity and test whether the heterogeneity is statistically significant using the Chochranrsquos Q
statistics defined as
119876 = 119888119894 ndash c
2
119907119894 ~ 120594119896minus1
2
119870
119894=1
c =
119888119894119907119894
119870
119894=1
1119907119894
119870
119894=1
Where K is the number of effect sizes 119888119894 refers to the estimated effects from the studies and c is
the average of these effects weighted by the inverses of the estimated variances 119907119894 Q is distributed
following a 1205942 distribution with k ndash 1 degrees of freedom and tests the null hypothesis that the
estimated effects are homogenous If the test rejects this hypothesis in favour of a heterogeneous
effect then the heterogeneity may be explained by the use of study and country characteristics in
the random effects model otherwise a fixed-effect model is used Nevertheless Longhi et al (2005)
also suggest that 119876 is likely to be rejected in large samples of observations even when the individual
effect sizes do not vary substantially
Our estimates of Cochranrsquos Q strongly reject the null hypothesis of no heterogeneity in both the
services and manufacturing samples and we proceed in using the random effects model In addition
the rejection of Cochranrsquos Q suggests that we should not follow the WLS approach used in Stanley
and Jarrell (1989) and Stanley (2005) as WLS is equivalent to the fixed-effect model
7
The random effects model includes two additive estimates of variance the variance within
estimates 1205902 and also an estimate of the variance between estimates 1205912 If 1205912 = 0 there is no
between estimate variation and this is the fixed-effect model While 1205902 can be obtained from the
standard errors in the literature the between estimate τ2 must be estimated by restricted maximum
likelihood from the fitted values of a regression weighted by 120596 the between study variance where
1205912 is restricted to non-negative values with an initial iteration at 1205912 = 0 The meta-regression model
also estimates the covariates weighted by 120596 in the fixed-effect model and 120603 in the random effects
model which includes both the within estimate variance 1205912 and the between estimate variance 1205902
Therefore the fixed-effects model ignores the between estimate variance and is estimated as
follows
yi = α + βXi + βZi + 120576i 119908ℎ119890119903119890 120576i ~ 119873 0 1205901198942
120596i = 1
1205901198942
The random effects model includes an additive component of variance as described above This
random effects meta-analysis model extends the fixed-effect model by adding the between study
variance
yi = α + βXi + βZi + 120576i + 120583i 119908ℎ119890119903119890 120576i ~ 119873 0 1205901198942 119886119899119889 120583i ~ 119873 0 1205912
120603119894 =1
1205901198942 + 120591 2
where yi refers to the estimated effect of foreign acquisition on productivity Xi is a list of study
controls Zi is a list of country variation variables (described in the data description above) 120576i is an
error term normally distributed around mean zero with variance 1205901198942 and 120583i is an error term normally
distributed around mean zero with variance 1205912
5 Results
Tables 5-7 show the results obtained with the random effects estimators2
[Tables 5-7 about here]
As discussed above 1205912rsquos lower bound is zero at which point all the between study variation is
explained by the covariates We find that 1205912 is quite small and close to zero for the services sample
suggesting that most heterogeneity is explained by the study and country characteristics included in
the model specifications Larger values for 1205912 are found for the manufacturing sample reflecting the
larger number of studies included in the sample (22 studies in the full sample for manufacturing) and
hence greater between study variance Also shown in the random effects regressions is the value for
I2 defined as (Q-df)Q I2 is interpreted as the percentage variation across an estimate which is due to
heterogeneity and in all models this value indicates that a very large proportion of the variation
between estimates (997 - 100) is attributable to heterogeneity Finally as many of the variables
are highly correlated we test for multicollinearity using the variance inflation factor test All models
2 These results are consistent with the OLS estimates which are shown in Tables A2-A4 in the Appendix
8
have variance inflation factors below five However multicollinearity between some of the country
characteristic variables means that many of these variables may only be examined separately in
different model specifications
51 Study Controls
We control for a number of estimation characteristics to reflect sample measurement and
methodological approaches in the estimates For instance we control for the number of
observations used in each study the measurement of productivity and the methodology In the case
of manufacturing we control for those studies which use the propensity score matching
methodology As all studies for service firms use the propensity score matching methodology we
instead control for the matching type to test for a statistically significant difference
Some of the estimate characteristics show a statistically significant relationship mostly in the
random effects rather than the OLS models The results for study controls suggest that the number
of observations used in each study estimate of the effect of foreign acquisition on firm productivity
do matter although weaker evidence is found for the measurement of productivity We find a
positive relationship between the number of observations and the effect of foreign acquisition on
firm productivity for manufacturing In contrast for the services sample we find a negative
relationship although this is no longer significant when many country characteristics are included in
the model For both the services and manufacturing samples we find some evidence to suggest that
the type of productivity has a statistically significant effect on the t-statistic however this evidence is
not strong In the services sample we control for productivity measured by turnover per employee
(LPT) and find LPT has a statistically significant negative relationship with the t-statistic in many of
the model specifications Furthermore the manufacturing sample shows a negative statistically
significant link between the t-statistic and the TFP measure of productivity for some model
specifications in the random effects models (only two models in the OLS models)
We do not find any evidence that the methodology used in the services sample kernel matching has
any effect on the t-statistic of the studies In contrast the manufacturing regressions show some
evidence that the propensity score matching methodology has a statistically significant negative link
with the t-statistic However this is not present when many country characteristic covariates are
included and in many of the models the links are no longer significant when the random effects
methodology is used
52 Country Variables
Our empirical findings suggest that absorptive capacity plays a role in the transfer of productivity-
enhancing knowledge from the acquiring firm to the acquired firm in the services sector In contrast
the evidence for manufacturing points towards demonstration effects as the mode of productivity
growth We find evidence to suggest a positive link between service firm productivity growth from
foreign acquisition and the economic development of the country However this is only significant
when many other country covariates are included as shown in Table 7 Nevertheless we do not find
any evidence to suggest a link between the size of the economy and service firm productivity While
the size of the economy does not matter some evidence indicates that the level of development of
the economy plays a role in the absorptive capacity of the firms being acquired Moreover we find
mixed evidence for the link between firm productivity and human capital for service firms in the
9
post-acquisition period However when other country covariates are controlled for the evidence
shows a positive link between human capital and firm productivity following foreign acquisition This
adds further evidence to the positive role of absorptive capacity in service firms as suggested by
Borensztein et al (1998)
Furthermore RampD intensity measures such as RampD personnel intensity business expenditure on
RampD as a percent of GDP (BERD) as well as the share of technology-intensive exports show a positive
link with service firm productivity as suggested by Barrios et al (2004) and Kinoshita (2001)
In addition strong evidence is found to suggest a negative link with the trade openness of the
economy suggesting lower productivity gains to foreign acquisition in more open economies with
lower trade protection
Some evidence is found for a positive link between financial development and the effect of foreign
acquisition on service firm productivity although this is no longer significant when other country
characteristics are included in the model We find that the efficiency of financial markets is positively
linked with firm productivity following foreign acquisition This suggests that the efficiency of the
financial markets is linked to service firmrsquos ability to absorb productivity increases following foreign
acquisition
With respect to institutions we found that less competitive product markets were linked to
decreases in service firm productivity following foreign acquisition consistent with Nicoletti and
Scarpetta (2005) Furthermore overall government effectiveness showed a positive link with service
firm productivity following foreign acquisition again suggesting that effective institutions play an
important role in the absorptive capacity and productivity of service firms (Acemoglu et al 2005) On
the other hand stricter employment protection legislation showed a positive relationship with
productivity in foreign acquired firms Stricter employment protection increases the incentives for
firms to invest in human capital and thus increases both absorptive capacity and firm productivity
through this channel (Acemoglu and Pischke 1999 Belot et al 2007)
We also find that the share of technology-intensive exports shows a positive link with service firm
productivity following foreign acquisition demonstrating further evidence for the role of absorptive
capacity in increasing productivity following acquisition similar to empirical evidence provided by
Barrios et al (2004)
The effect of foreign acquisitions on the productivity of manufacturing firms differs a good deal from
service firms Unlike service firms the evidence for manufacturing firm productivity following
foreign acquisition shows a strong negative link with the economic development of the country and
some evidence shows a positive relationship with the size of the economy This would suggest
productivity increases through demonstration effects (Meyer and Sinani 2009) and a vertical
motivation for foreign acquisition ie acquiring firms in less developed but more competitive
countries in terms of cost (Markusen and Maskus 2003) While some evidence does suggest a
negative relationship between trade openness and manufacturing firm productivity as in the services
sample the evidence for this is not strong and loses significance when other country covariates are
included Also human capital shows contrasting relationships between services and manufacturing
with the evidence indicating that manufacturing firm productivity is negatively linked to human
capital This would seem to suggest that foreign acquisition increases the productivity of
manufacturing firms located in lower human capital countries through demonstration effects as
10
opposed to the service sector where evidence suggests existing levels of high human capital increase
the firmrsquos ability to absorb the transfer of knowledge Furthermore measures of RampD intensity
capital such as BERD intensity and RampD personnel intensity also show a negative link for
manufacturing differing from the positive link found for services
While manufacturing firm productivity following foreign acquisition show evidence of a positive link
with financial development the evidence is weak for services and is no longer significant when other
country characteristics are included in the model In contrast manufacturing firms show evidence of
a negative link with firm productivity following acquisition and the efficiency of the financial system
whereas services show a positive link
In contrast to services we find that employment protection legislation has a negative link with
manufacturing firm productivity hindering productivity-enhancing labour restructuring as suggested
by Martin and Scarpetta (2011) and Bentolila and Bertola (1990) This suggests that a flexible labour
market allowing firm restructuring is important for manufacturing firm productivity growth following
foreign acquisition
Finally in countries with a high share of technology-intensive exports foreign acquisition led to
higher firm productivity for both manufacturing and service firms
6 Conclusions
We used a meta-regression model to explain the variation of the estimates on the effects of foreign
acquisition on firm productivity across studies and countries Our results suggest that those service
firms most likely to experience increases in productivity following foreign acquisition are located in
more economically developed countries in countries with large human capital and higher RampD
intensity (measured by RampD personnel intensity and business expenditure on RampD intensity) as well
as greater high-tech export specialisation In addition productivity appears to increase following
acquisition in countries with more efficient financial markets more competitive product markets
more effective government and stricter employment protection legislation These results indicate
that absorptive capacity is an important factor in achieving productivity gains following foreign
acquisition in service firms similar to the argument suggested by Meyer and Sinani (2009) in their
meta-analysis of the literature on productivity spillovers from FDI However service firm productivity
gains are lower in more open economies
The effect of foreign acquisitions on firm productivity varies between service and manufacturing
firms as well as between countries of different economic development As a result effective policy
design should be targeted to account for differences between the two sectors and between
countries
For service firms absorptive capacity is greater in more developed economies with higher human
capital Investment in RampD intensity will increase absorptive capacity and hence the productivity
gains experienced by foreign acquired service firms In these countries increasing product market
competition and increasing both the effectiveness of government and the strictness of employment
protection legislation will enable foreign acquisitions to achieve greater productivity increases
Nevertheless the productivity gains will be lower in more open economies In addition enhancing
the efficiency of the financial system will also stimulate service firm productivity
11
Similar to the service sector it appears that in manufacturing firms greater technology-intensive
export specialisation enables productivity following foreign acquisition with larger economies
gaining the most
Better access to credit will increase productivity gains following acquisition for manufacturing firms
Moreover a policy trade-off exists with respect to employment protection legislation in that stricter
EPL is likely to increase productivity in service firms following acquisition but decrease productivity in
manufacturing firms Hence the policy approach should be tailored to each sector with less strict EPL
for manufacturing industries to allow increased productivity growth through restructuring
Productivity is one measure of firm performance another policy relevant firm performance measure
is employment Indeed productivity gains and losses may be made through reducing or increasing
employment As with the empirical estimates on the effect of foreign acquisitions on productivity
the effect on employment also varies widely between countries A meta-analysis of empirical
estimates of the effects of foreign acquisitions on employment would help to explain this
heterogeneity controlling for country and estimation characteristics
Once again further research could use the meta-analysis methodology to provide a more objective
analysis of the empirical estimates and distinguish between services and manufacturing firms
However the existing analyses of the effect of foreign acquisition of service firms on employment
are limited to only a small number of countries mostly small open advanced economies and further
research needs to be completed for a wider variety of countries including middle and low income
countries
References
Acemoglu D Johnson S and Robinson J (2005) ldquoChapter 6 Institutions as a fundamental cause of long-run growthrdquo in Aghion P and Durlauf S N Ed Handbook of Economic Growth Volume 1A Oxford Elsevier
Acemoglua D and Pischke J S (1999) ldquoBeyond Becker Training in imperfect labour marketsrdquo The
Economic Journal Vol 109 pp 112-142
Aitken B J and Harrison A E (1999) ldquoDo Domestic Firms Benefit from Direct Foreign Investment Evidence from Venezuelardquo American Economic Review American Economic Association Vol 89 No 3 pp 605-618
Alfraro L Chanda A Kalemli-Ozcan S and Sayek S (2004) ldquoFDI and economic growth the role of local financial marketsrdquo Journal of International Economics Vol 64 pp 89-112
Arnold J M and Javorcik B S (2009) ldquoGifted kids or pushy parents Foreign direct investment and plant productivity in Indonesiardquo Journal of International Economics Vol 79 pp 42-53
Balsvik R and Haller S A (2010) ldquoPicking Lemons or Picking Cherries Domestic and Foreign Acquisitions in Norwegian Manufacturingrdquo Scandinavian Journal of Economics Wiley Blackwell Vol 112 No 2 pp 361-387
Bandick R (2011) ldquoForeign Acquisition Wages and Productivityrdquo The World Economy pp 931-951
12
Barrios S Dimelis S Louri H and Stroblt E (2004) ldquoEfficiency Spillovers from Foreign Direct
Investment in the EU Periphery A Comparative Study of Greece Ireland and Spainrdquo Review of
World Economics Vol 140 No 4 pp 688-705
Barro R and Lee J (2010) A New Data Set of Educational Attainment in the World 1950-2010 NBER Working Paper No 15902
Beck T Levine R Loayza N (2000) ldquoFinance and the sources of growthrdquo Journal of Financial
Economics Vol 58 pp 261-300
Belot M Boonez J and Van Ours J (2007) ldquoWelfare-Improving Employment Protectionrdquo
Economica Vol 74 pp 381-396
Bentolila S and Bertola G (1990) ldquoFiring Costs and Labour Demand How bad is Eurosclerosisrdquo
Review of Economic Studies Vol 57 pp 381-402
Bertrand O and Zitouna H (2008) ldquoMampA and target firmsrsquo performance are cross-border MampA different Some evidence from French firm-level datardquo Applied Economics Vol 40 No 17 pp 2221-2238
Blonigen B (2005) ldquoA review of the empirical literature on FDI determinantsrdquo NBER Working Paper
No 11299 NBER
Borensztein E Gregorio J amp Lee J (1998) ldquoHow does foreign direct investment affect economic growthrdquo Journal of International Economics Vol 45 pp 115-135
Card D and Krueger A B (1995) ldquoTime Series Minimum-Wage Studies A Meta-analysisrdquo The American Economic Review Vol 85 No 2 Papers and Proceedings of the Hundreth and Seventh Annual Meetings of the American Economic Association Washington DC January 8-6 1995 pp 238-243
Conyon M J Girma S Thompson S and Wright P W (2002) ldquoThe productivity and wage effects of foreign acquisition in the United Kingdomrdquo The Journal of Industrial Economics Vol 50 No 1 pp 85ndash102
Criscuolo P and Narula R (2008) ldquoA Novel approach to National Technological Accumulation and
Absorptive Capacity Aggregating Cohen and Levinthalrdquo European Journal of Development
Researchrdquo Vol 20 No 1 pp 56-73
Damijan J P de Sousa J and Lamotte O (2008) ldquoDoes international openness affect productivity of local firms Evidence from Southeastern Europerdquo LICOS Discussion Papers 21908 LICOS - Centre for Institutions and Economic Performance K U Leuven
Dunning J (1998) ldquoLocation and the Multinational Enterprise A Neglected Factorrdquo Journal of International Business Studies Vol 29 No 1 pp 45-66
Fukao K Ito K and Kwon K (2005) ldquoDo out-in MampAs bring higher TFP to Japan An empirical analysis based on micro-data on Japanese manufacturing firmsrdquo Journal of the Japanese and International Economies Vol 19 No 2 Analytical Issues in JapanUS Trade and Foreign Direct Investment pp 272-301
13
Fukao K Ito K Kwon H U and Takizawa M (2008) ldquoCross-Border Acquisitions and Target Firms Performance Evidence from Japanese Firm-Level Datardquo published in T Ito and A K Rose International Financial Issues in the Pacific Rim Global Imbalances Financial Liberalization and Exchange Rate Policy NBER-EASE Vol 17 pp 347ndash389
Fukao K and Murakami Y (2005) ldquoDo Foreign Firms Bring Greater Total Factor Productivity to Japanrdquo Journal of the Asia Pacific Economy Vol 10 No 2 pp 237-254
Gioia C and Thomsen S (2002) ldquoInternational Mergers and Acquisitions and the Market for Lemons International Acquisitions and Firm Performance in Denmark 1990-1997rdquo Copenhagen Business School Working Paper
Girma S (2005) ldquoTechnology Transfer from Acquisition FDI and the Absorptive Capacity of Domestic Firms An Empirical Investigationrdquo Open Economies Review Vol 16 No 2 pp 175-187
Girma S Kneller R and Pisu M (2007) ldquoDo exporters have anything to learn from foreign multinationalsrdquo European Economic Review Vol 51 No 4 pp 993-1010
Goumlrg H and Strobl E (2001) ldquoMultinational Companies and Productivity Spillovers a Meta-
Analysisrdquo The Economic Journal Vol 111 pp F723-F739
Greenaway D amp Guariglia A and Yu Z (2005) ldquoThe More the Better Foreign Ownership and Corporate Performance in China Publicationrdquo Leverhulme Centre Discussion Papers 0905 University of Nottingham GEP
Griffith R (1999) ldquoUsing the ARD Establishment Level Data to Look at Foreign Ownership and Productivity in the United Kingdomrdquo The Economic Journal Vol 109 pp 416-442
Hanley A and Zervos V (2007) ldquoThe Performance of UK Takeovers Does the Nationality of Acquirers Matterrdquo International Journal of the Economics of Business Taylor and Francis Journals Vol 14 No 2 pp 283-297
Harris R and Robinson C (2002) ldquoThe Effect of Foreign acquisitions on total factor productivity plant level evidence from the UK manufacturing 1987-1992rdquo The Review of Economics and Statistics Vol 84 No 3 pp 562-568
Harris R Siegel D S and Wright M (2005) ldquoAssessing the impact of management buyouts on economic efficiency plant-level evidence from the United Kingdomrdquo The Review of Economics and Statistics Vol 87 No 1 pp 148-153
Hedges L V and Vevea J L (1998) ldquoFixed and Random Effects Models in Meta-analysisrdquo
Psychological Methods Vol 3 No 4 pp 486-504
Helpman E (1984) ldquoA Simple Theory of International Trade with Multinational Corporationsrdquo Journal of Political Economy Vol 92 No 3 pp 451-471
Helpman E Melitz M J and Yeaple S R (2003) ldquoExport versus FDI CEPR Discussion Papers 3741 Centre for Economic Policy Research
Heston A Summers R and Aten B (2011) Penn World Table Version 70 Center for International
Comparisons of Production Income and Prices at the University of Pennsylvania
14
International Study Group on Exports and Productivity (ISGEP) (2008) ldquoUnderstanding Cross-
Country Differences in Exporter Premia Comparable Evidence for 14 Countriesrdquo Review of World
Economics Vol 144 No 4 pp 596-635
Kaitila V Mc Quinn J Siedschlag I and Zhang X (2013) ldquoInternational Investment and Firm Performance Empirical Evidence from Small Open Economiesrdquo ESRI Working Paper Forthcoming
Karpaty P (2007) ldquoProductivity Effects of Foreign Acquisitions in Swedish Manufacturing The FDI Productivityrdquo International Journal of the Economics of Business Vol 14 No 2 pp 241-260
Kaufmann D Kraay A and Mastruzzi M (2010) ldquoThe Worldwide Governance Indicators Methodology and Analytical Issuesrdquo World Bank Policy Research Working Paper No 5430
King R Levine R (1993a) ldquoFinance and growth Schumpeter might be rightrdquo Quarterly Journal of Economics Vol 108 pp 717-738
King R Levine R (1993b) ldquoFinance entrepreneurship and growth theory and evidencerdquo Journal
of Monetary Economics Vol 32 pp 513-542
Kinoshita Y (2001) ldquoRampD and technology spillovers via FDI Innovation and absorptive capacityrdquo CEPR Discussion Paper 2775 Center for Economic Policy Research
Levine R Loayza N Beck T (2000) ldquoFinancial intermediation and growth causality and causesrdquo
Journal of Monetary Economics Vol 46 No 1 pp 31-77
Longhi L Nijkamp P and Poot J (2005) ldquoA Meta-analytic Assessment of the Effect of Immigration on Wagesrdquo Journal of Economic Surveys Vol 19 No 3 pp 451-477
Markusen J R (1984) ldquoMultinationals Multi-Plant Economies and the Gains from Trade Journal of International Economics Vol 16 No 3-4 pp 205-226
Markusen J R and Maskus K E (2003) ldquoGeneral Equilibrium approaches to the Multinational Firm A review of Theory and Evidencerdquo in Choi E K and Harrigan J Ed Handbook of International Trade London Blackwell
Martin J P and Scarpetta S (2012) ldquoSetting It Right Employment Protection Labour Reallocation
and Productivityrdquo De Economist Vol 160 pp 89-116
Martins P S Yang Y (2009) ldquoThe Impact of Exporting on Firm Productivity a Meta-analysis of the
Learning-by-exporting hypothesisrdquo Review of World Economics Vol 145 pp 431-445
McGuckin R H and Nguyen S V (1995) ldquoOn Productivity and Plant Ownership Change New Evidence from the Longitudinal Research Databaserdquo The RAND Journal of Economics Blackwell Publishing Vol 26 No 2 pp 257-276
Meyer K E and Sinani E (2009) ldquoWhen and where does foreign direct investment generate
positive spillovers A Meta-analysisrdquo Journal of International Business Studies vol 40 pp 1075-
109
Nicoletti G and Scarpetta S (2005) ldquoProduct Market Reforms and Employment in OECD Countriesrdquo OECD Economics Department Working Papers No 472 OECD Publishing
15
OECD (2010) Employment Protection Legislation Strictness of employment protection legislation collective dismissals OECD Employment and Labour Market Statistics (database)
OECD (2011) Main Science and Technology Indicators (MSTI) Main Science and Technology Indicators (database)
OECD (2011) ldquoProduct Market Regulationrdquo Product Market Regulations (database)
Oulton N (1998) ldquoLabour Productivity and Foreign Ownership in the UKrdquo NIESR Discussion Papers
143 National Institute of Economic and Social Research
Piscitello L and Rabbiosi L (2005) ldquoThe impact of inward FDI on local companies labour productivity evidence from the Italian caserdquo International Journal of the Economics of Business Vol 12 No 1 pp 35 -51
Salis S (2008) ldquoForeign Acquisition and Firm Productivity Evidence from Sloveniardquo The World Economy Vol 31 No 8 pp 1030-1048
Schiffbauer M Siedschlag I and Ruane F (2009) ldquoDo Foreign Mergers amp Acquisitions Boost Firm Productivityrdquo ESRI Working paper No 305 ESRI
Stanley T D and Jarrell S B (1989) ldquoMeta-regression analysis A Quantitative Method of
Literature Surveysrdquo Journal of Economic Surveys Vol 3 No 2 pp 161-170
Stanley T D (2005) ldquoBeyond Publication Biasrdquo Journal of Economic Surveys Vol 19 No 3 pp
309-345
Sharp S (1998) ldquosbe23 Meta-analysis regressionrdquo Stata Technical Bulletin STB-42 pp 16-22
The World Bank (2011) ldquoWorld Development Indicatorsrdquo World Development Indicators (dataset)
16
Table 1 Literature review on post-acquisition impact of foreign acquisition on firm productivity
Study Country Sample Period
Methodology Productivity Type Effect on Productivity
McGuckin and Nguyen (1995)
US 1977-1987 OLS Labour productivity with some TFP
+
Outlon (1998)
UK 1995 OLS Labour productivity +
Aitken and Harrison (1999)
Venezuela 1976 through 1989 except 1980
OLS TFP +
Griffith (1999)
UK 1980-1992 OLS Difference in Difference and Systems GMM
TFP +
Conyon Girma Thompson and Wright (2002)
UK 1989-1994
OLS and Instrumental variable estimation to control for the endogeneity of wages
Labour productivity + for foreign acquisition Not significant for domestic acquisition
Harris and Robinson (2002)
UK 1987ndash1992 Systems GMM TFP -
Gioia and Thomsen (2002)
Denmark 1990-1997 Selection-adjustment factor (inverse Millrsquos ratio) from probit and controlled for this in OLS
TFP + - for selection adjusted estimates
Fukao Ito and Kwon (2005)
Japan 1994ndash2000 Propensity score matching and difference-in-difference
TFP + for US and European-acquired firms Not significant for MNEs from other regions have no effect
Fukao and Murakami (2005)
Japan 1994ndash1998 OLS Labour productivity and TFP
+ for foreign acquisitions Not significant for domestic acquisition and other independent firms
17
Table 1 Literature review on post-acquisition impact on foreign acquisition on firm productivity (ctd)
Study Country Sample Period
Methodology Productivity Type Effect on Productivity
Girma (2005)
UK 1989-1996 Propensity score matching and difference-in-difference
Industry TFP +
Harris Siegel and Wright (2005)
UK 1994-1998 Panel data using systems GMM
TFP and labour productivity
+
Piscitello and Rabbiosi (2005)
Italy 1994ndash 1997 OLS
Labour productivity +
Girma Kneller and Pisu (2007)
UK 1988-1996 Propensity score matching and difference-in-difference
TFP index +
Hanley and Zervos (2007)
UK 1990-1996 OLS and instrument for wages using a two stage least squares estimator
Labour productivity as a function of a skills proxy
-
Karpaty (2007)
Sweden 1986ndash2002 Propensity score matching and difference-in-difference
TFP +
Bertrand and Zitouna (2008)
France 1993-2000 Propensity score matching and difference-in-difference
TFP +
Damijan de Sousa and Lamotte (2008)
Bosnia-Herzegovina Bulgaria Croatia Macedonia Romania and Slovenia
1994-2002 GMM TFP + for four out of six countries
18
Table 1 Literature review on post-acquisition impact of foreign acquisition on firm productivity (ctd)
Study Country Sample Period
Methodology Productivity Type Effect on Productivity
Fukao Ito Kwon and Takizawa (2008)
Japan 1994- 2001 Propensity score matching and difference-in-difference
TFP +
Salis (2008) Slovenia 1994-1999 Propensity score matching and difference-in-difference matching
TFP Not significant
Arnold and Javorcik (2009)
Indonesia 1983-2001 Propensity score matching and difference-in-difference
TFP and labour productivity
+
Greenaway Guaraglia and Yu(2009)
China 2000-2005 First-difference Generalized Method of Moments
TFP + for Joint-ventures + initially for foreign ownership - once foreign ownership reaches beyond 64
Schiffbauer et al (2009)
UK 1999-2007 Propensity score matching and difference-in-difference
TFP and labour productivity
Not significant from foreign acquisitions on TFP in the aggregate + for RampD-intensive manufacturing acquirer and - for marketing-intensive manufacturing acquirer + for labour productivity in manufacturing Not significant in services
Balsvick and Haller (2010)
Norway 1992-2004 OLS TFP and labour productivity
- for domestic acquisition + for foreign acquisition
Bandick (2011)
Sweden 1993ndash2002 Propensity score matching and difference-in-differences
TFP + after vertical foreign acquisition only but not significant after a horizontal foreign acquisition
Kaitila Mc Quinn Siedschlag and Zhang (2013)
Austria Belgium the Netherlands Denmark Finland and Sweden
2000-2009 Propensity score matching and difference-in-differences
Labour Productivity - although heterogeneity between countries
19
Table 2 Summary Statistics - Services
Obs Mean Std Dev Min Max
t-statistic 207 -023 167 -465 445 Number of Observations 207 299 198 25 767 Trade Openness ( of GDP) 207 10665 2864 5418 15410 GDP Size (Billions PPP) 207 30900 28900 13800 159000 GDP (PPP) per Capita
207 34293 1605 31759 36196
Human Capital 207 2165 444 1393 2517 Financial Development 207 14746 3037 11100 18244 Market Cap as a of GDP
207 7313 2829 3022 14667
Government Effectiveness
207 188 016 165 215
Employment Protection Legislation 207 198 033 072 219 Product Regulation
207 134 019 091 161
BERD as a of GDP 207 181 066 098 277 RampD Personnel per 000
207 1516 441 1018 2350
Technology share of Exports 207 1031 874 230 3675
Table 3 Summary Statistics - Manufacturing
Obs Mean Std Dev Min Max
t-statistic 636 176 404 -397 4658 Number of Observations 636 22377 40482 5 225954 Trade Openness ( of GDP)
636 6680 3680 1780 15400
GDP Size (Billions PPP)
636 103000 143000 451 456000
GDP (PPP) per Capita 636 27587 8301 2541 41757 Human Capital 604 1770 708 213 2640 Financial Development 636 13389 7271 1913 29800 Market Cap as a of GDP 559 7201 3233 300 14667 Government Effectiveness 390 156 061 -108 215 Employment Protection Legislation 564 173 079 060 349 BERD as a of GDP 589 170 064 037 277 RampD Personnel per 000 589 1301 369 428 2350 Technology Share of Exports 589 2692 2304 014 7810
Note Due to substantial missing values data on product market regulation was not available for the
manufacturing dataset
20
Table 4 Countries included in sample
Manufacturing Sample Services Sample
Austria
Austria
Belgium
Belgium Bosnia amp Herzegovina Denmark
Bulgaria
Finland Croatia
Netherlands
Denmark
Sweden Finland
UK
France Indonesia Italy Japan Netherlands Norway Romania Slovenia Sweden UK Venezuela
21
Table 5 The Effect of Country Characteristics on the Productivity of Firms following Foreign Acquisition in Manufacturing Random Effects
(1) (2) (3) (4) (5) (6) (7) (8) (9) (10) Ln No of Observations 0473 0544 0430 0537 0586 0463 0625 0593 0607 0617
(0094) (0092) (0094) (0089) (0094) (0094) (0099) (0095) (0099) (0099)
Productivity (TFP) Dummy -0181 -1018 -0769 -0466 -0775 -0114 -0390 -0585 -0701 -1066
(0413) (0436) (0428) (0382) (0415) (0414) (0412) (0414) (0424) (0455)
Methodology (PSM) Dummy -0735 -0910 -0372 -0098 -0663 -0977 -0759 -0710 -0991 -0779
(0484) (0470) (0494) (0452) (0515) (0475) (0483) (0511) (0488) (0561)
Ln GDP size 0235
(0114)
Ln GDP per Capita
-1413
(0308)
Trade Openness
-0023
(0006)
Human Capital
-0086
(0021)
RampD Personnel per lsquo000
-0112
(0045)
Financial Development
0005
(0002)
Market Capitalisation as a of GDP
-0008
(0005)
BERD as a of GDP
-0607
(0255)
Technology share of Exports
0046
(0023)
Employment Protection Legislation
-0455
(0257)
Constant -7601 13055 0706 -0637 -0518 -1852 -1578 -1080 -2755 -1171
(3118) (3252) (0994) (0759) (0890) (0854) (0925) (0828) (0946) (0862)
Observations 636 636 636 604 589 636 559
589 544 564 τ
2 1356 1322 1336 1036 1249 1351 1338
1250 1315 1290 REML Log -1157 -1148 -1155 -1021 -1049 -1160 -1018
-1048 -9846 -1012 F-statistic 3468 3975 3774 3499 3928 3533 3520 3912 3845 3652 Q 2580e+08 2440e+08 2600e+08 1640e+08 1850e+08 3450e+08 1820e+08 1850e+08 1820e+08 1830e+08 I2 1000 1000 1000 1000 1000 1000 1000 1000 1000 1000
Standard errors in parentheses
plt001 plt005 plt01 Dependent Variable T-statistic
22
Table 6 The Effect of Country Characteristics on the Productivity of Firms following Foreign Acquisition in Services Random Effects
(1) (2) (3) (4) (5) (6) (7) (8) (9) (10) (11) (12) Ln No of Observations -0523 -0513 -0093 -0327 -0507 -0458 -0778 -0532 -0479 -0513 -0577 -0590
(0145) (0144) (0131) (0181) (0142) (0142) (0152) (0135) (0138) (0125) (0142) (0138)
Productivity (LPT) Dummy -0412 -0398 -0298 -0339 -0381 -0322 -0474 -0403 -0384 -0162 -0480 -0316
(0228) (0227) (0193) (0229) (0223) (0223) (0219) (0212) (0217) (0198) (0223) (0217)
Kernel Matching Dummy 0093 0132 -0089 0083 0165 0115 -0048 0195 0017 0181 0221 -0026
(0240) (0235) (0200) (0234) (0231) (0229) (0229) (0220) (0226) (0203) (0231) (0225)
Ln GDP size 0117
(0222)
Ln GDP per Capita
1789
(2406)
Trade Openness
-0032
(0004)
Human Capital
-0054
(0032)
RampD Personnel per lsquo000
0072
(0025)
Financial Development
0012
(0004)
Market Capitalisation as a of GDP
0018
(0004)
BERD as a of GDP
0876
(0161)
Technology share of Exports
0075
(0017)
Government effectiveness
5008
(0602)
Employment Protection Legislation
0663
(0207)
Product Market Regulation
-2674
(0572)
Constant -0301 -15986 3874 2856 1545 0594 2926 1191 1198 -6855 1515 6716
(5772) (25152) (0702) (0812) (0895) (1023) (0782) (0809) (0850) (1348) (0877) (1154)
Observations 207 207 207 207 207 207 207 207 207 207 207 207 τ
2 2626 2622 1885 2593 2527 2497 2417 2291 2400 1956 2501 2371
REML Log -2098 -2073 -1804 -2104 -2081 -2088 -2054 -1963 -2033 -1791 -2050 -1986 F-statistic 3897 3971 2516 4586 6023 6699 8552 1181 8984 2241 6584 9705 Q 143789 138841 98359 143410 143681 143270 122239 121448 125428 108584 121450 130250 I2 0999 0999 0998 0999 0999 0999 0998 0998 0998 0998 0998 0998
Standard errors in parentheses
plt001 plt005 plt01 Dependent Variable T-statistic
23
Table 7 The Effect of Country Characteristics on the Productivity of Firms following Foreign Acquisition in Services and Manufacturing Random Effects
Services Manufacturing (1) (2) (3) (4) (5) (1) (2) (3) (4) (5) Ln No of Observations -0523 -0519 0001 -0226 -0216 0473 0491 0478 0443 0500
(0145) (0146) (0128) (0153) (0153) (0094) (0091) (0093) (0093) (0098)
Productivity (TFP) Dummy
-0181 -1189 -1293 -0941 -0859
(0413) (0431) (0450) (0405) (0407)
Methodology (PSM) Dummy
-0735 -0416 -0335 -0033 -0019
(0484) (0474) (0484) (0479) (0478)
Productivity (LPT) Dummy -0412 -0406 -0256 -0327 -0311
(0228) (0229) (0185) (0184) (0186)
Kernel Matching Dummy 0093 0113 -0056 0013 0011
(0240) (0243) (0197) (0196) (0196)
Ln GDP size 0117 0076 -0034 -0093 -0078 0235 0610 0528 0475 0301
(0222) (0232) (0188) (0186) (0188) (0114) (0125) (0161) (0150) (0179)
Ln GDP per Capita
1552 9969 13952 13763
-2200 -2081 -1574 -1404
(2519) (2188) (2633) (2647)
(0343) (0373) (0394) (0405)
Trade Openness
-0039 -0043 -0042
-0006 -0005 0000
(0004) (0004) (0004)
(0008) (0007) (0008)
Human Capital
0085 0081
-0029 -0080
(0032) (0033)
(0028) (0040)
Financial Development
0003
0007
(0003)
(0004)
Constant -0301 -15456 -99171 -139356 -138236 -7601 4943 6481 2882 4995
(5772) (25260) (21915) (26437) (26502) (3118) (3603) (4070) (4847) (4984)
Observations 207 207 207 207 207 636 636 636 604 604 τ
2 2626 2634 1712 1662 1665 1356 1278 1279 9963 9933
REML Log -2098 -2087 -1707 -1708 -1762 -1157 -1138 -1143 -1015 -1019 F-statistic 3897 3184 2215 2055 1802 3468 3764 3146 2485 2220 Q 143789 137145 81107 80128 80082 2580e+08 2440e+08 2160e+08 1620e+08 1620e+08 I2 0999 0999 0998 0998 0998 1000 1000 1000 1000 1000
Standard errors in parentheses
plt001 plt005 plt01 Dependent Variable T-statistic
24
Table A1
Name Description Source
Country size GDP in US dollars 2000 constant prices World Development Indicators 2011 (httpdataworldbankorg)
Economic development
GDP per capita (Purchasing Power Parity) in US dollars 2005 constant prices
Heston Summers and Aten (2011) Penn World Tables
Trade openness Total of exports and imports divided by GDP in US dollars 2005 constant prices
Heston Summers and Aten (2011) Penn World Tables
Human capital The percent of the population over 25 with tertiary education Barro and Lee (2010) dataset
RampD intensity RampD personnel per thousand employed OECD Main Science and Technology indicators 2011 (wwwoecdorgstimsti)
RampD intensity Business expenditure on RampD as a percent of GDP OECD Main Science and Technology indicators 2011 (wwwoecdorgstimsti)
Financial development
Domestic credit provided by the banking sector as a percent of GDP World Development Indicators 2011 (httpdataworldbankorg)
Efficiency of the financial markets
stock market capitalisation of listed companies as a percent of GDP World Development Indicators 2011 (httpdataworldbankorg)
Government effectiveness
Ranging from -25 indicating weak government performance to +25 indicating strong government performance This captures public perception of the quality of public services the civil service the degree of independence from political pressure the quality of policy formulation and implementation and the credibility of the government to such policies
World Governance Indicators 2010 (httpinfoworldbankorggovernancewgiindexasp)
Strictness of employment protection
Ranging from 0 to 6 with higher values indicating stricter employment protection legislation This summarises employment procedures notice severance pay and difficulty of dismissal
OECD 2010 (wwwoecdorgemploymentprotection)
Product market regulation
Ranging from 0 to 6 with higher values indicating more regulated product markets This variable summarises barriers to entrepreneurship trade investment and state control
OECD 2011 (wwwoecdorgeconomypmr)
High-tech industry specialisation
export share of technology-intensive industries (aerospace electricity instruments office and computers and pharmaceuticals)
OECD Main Science and Technology indicators 2011 (wwwoecdorgstimsti)
25
Table A2 The Effect of Country Characteristics on the Productivity of Firms following Foreign Acquisition in Manufacturing OLS
(1) (2) (3) (4) (5) (6) (7) (8) (9) (10) Ln No of Observations 0474 0551 0429 0551 0599 0466 0627 0610 0606 0634
(0083) (0090) (0079) (0086) (0094) (0082) (0107) (0093) (0105) (0113)
Productivity (TFP) Dummy -0284 -1143 -0897 -0624 -0899 -0221 -0514 -0681 -0820 -1181
(0571) (0627) (0649) (0577) (0618) (0585) (0582) (0607) (0610) (0706)
Methodology (PSM) Dummy -0733 -0908 -0351 -0087 -0609 -0993 -0769 -0637 -0994 -0664
(0390) (0315) (0361) (0295) (0301) (0333) (0307) (0324) (0307) (0322)
Ln GDP size 0259
(0164)
Ln GDP per Capita
-1466
(0354)
Trade Openness
-0024
(0006)
Human Capital
-0092
(0026)
RampD Personnel per lsquo000
-0124
(0032)
Financial Development
0005
(0003)
Market Capitalisation as a of GDP
-0009
(0005)
BERD as a of GDP
-0699
(0166)
Technology share of Exports
0049
(0019)
Employment Protection Legislation
-0556
(0205)
Constant -8234 13577 0860 -0591 -0447 -1877 -1496 -1063 -2794 -1126
(4637) (3834) (0582) (0552) (0615) (0702) (0542) (0509) (0716) (0563)
Observations 636 636 636 604 589 636 559
589 544 564 R
2 0181 0203 0196 0192 0215 0184 0202 0215 0222 0212
Adjusted R2 0176 0198 0191 0187 0209 0178 0196 0210 0216 0206
F-statistic 3583 3866 4121 5308 5377 4329 2871
5266 3155 4040 RMSE 3671 3621 3637 3205 3517 3666 3650
3516 3617 3568 Robust standard errors in parentheses
plt001 plt005 plt01 Dependent Variable T-statistic
26
Table A3 The Effect of Country Characteristics on the Productivity of Firms following Foreign Acquisition in Services OLS
(1) (2) (3) (4) (5) (6) (7) (8) (9) (10) (11) (12) Ln No of Observations -0523 -0513 -0095 -0328 -0507 -0460 -0779 -0532 -0481 -0515 -0575 -0592
(0128) (0127) (0121) (0175) (0124) (0118) (0148) (0122) (0117) (0112) (0127) (0126)
Productivity (LPT) Dummy -0413 -0399 -0299 -0340 -0382 -0323 -0475 -0404 -0385 -0164 -0480 -0317
(0226) (0227) (0197) (0227) (0224) (0223) (0216) (0212) (0219) (0208) (0218) (0218)
Kernel Matching Dummy 0093 0131 -0090 0083 0164 0115 -0048 0194 0017 0180 0220 -0026
(0241) (0236) (0206) (0235) (0232) (0228) (0230) (0222) (0227) (0205) (0231) (0229)
Ln GDP size 0115
(0178)
Ln GDP per Capita
1756
(2007)
Trade Openness
-0032
(0004)
Human Capital
-0054
(0031)
RampD Personnel per lsquo000
0072
(0023)
Financial Development
0012
(0004)
Market Capitalisation as a of GDP
0018
(0004)
BERD as a of GDP
0876
(0160)
Technology share of Exports
0075
(0017)
Government effectiveness
5002
(0608)
Employment Protection Legislation
0659
(0227)
Product Market Regulation
-2668
(0507)
Constant -0255 -15639 3889 2853 1548 0603 2933 1192 1211 -6829 1515 6721
(4602) (21071) (0646) (0687) (0724) (0786) (0686) (0675) (0654) (1299) (0784) (1142)
Observations 207 207 207 207 207 207 207 207 207 207 207 207 R
2 00721 00733 0333 00837 0107 0118 0145 0190 0151 0308 0115 0162
Adjusted R2 00537 00549 0320 00655 00895 0100 0128 0174 0134 0294 00979 0145
F-statistic 5099 5357 2712 6102 7208 6332 9050 1264 8651 2511 7452 1031 RMSE 1622 1621 1375 1611 1591 1581 1556 1515 1551 1400 1583 1541 Robust standard errors in parentheses
plt001 plt005 plt01 Dependent Variable T-statistic
27
Table A4 The Effect of Country Characteristics on the Productivity of Firms following Foreign Acquisition in Services and Manufacturing OLS
Services Manufacturing (1) (2) (3) (4) (5) (1) (2) (3) (4) (5) Ln No of Observations -0523 -0519 0000 -0226 -0217 0474 0493 0479 0448 0510
(0128) (0129) (0124) (0162) (0162) (0083) (0082) (0079) (0078) (0082)
Productivity (TFP) Dummy
-0284 -1279 -1390 -1069 -0970
(0571) (0625) (0665) (0594) (0603)
Methodology (PSM) Dummy
-0733 -0390 -0303 -0001 0014
(0390) (0346) (0345) (0273) (0275)
Productivity (LPT) Dummy -0413 -0406 -0258 -0328 -0313
(0226) (0226) (0191) (0186) (0185)
Kernel Matching Dummy 0093 0112 -0056 0012 0011
(0241) (0244) (0198) (0194) (0194)
Ln GDP size 0115 0075 -0035 -0094 -0079 0259 0638 0545 0498 0307
(0178) (0185) (0173) (0169) (0169) (0164) (0151) (0148) (0127) (0118)
Ln GDP per Capita
1523 9925 13916 13728
-2270 -2136 -1619 -1430
(2048) (2160) (2515) (2574)
(0311) (0312) (0326) (0286)
Trade Openness
-0039 -0043 -0042
-0007 -0005 0000
(0004) (0004) (0004)
(0005) (0004) (0004)
Human Capital
0085 0081
-0031 -0086
(0033) (0034)
(0032) (0024)
Financial Development
0003
0008
(0003)
(0004)
Constant -0255 -15120 -98695 -138948 -137831 -8234 4913 6610 2795 5087
(4602) (21028) (22332) (26084) (26551) (4637) (5262) (5271) (3554) (3738)
Observations 207 207 207 207 207 636 636 636 604 604 R
2 00721 00738 0399 0420 0421 0181 0236 0237 0234 0239
Adjusted R2 00537 00507 0381 0399 0398 0176 0230 0230 0225 0229
F-statistic 5099 4286 2890 2632 2300 3583 3553 3430 3350 3335 RMSE 1622 1624 1311 1292 1293 3671 3548 3549 3129 3122 Robust standard errors in parentheses
plt001 plt005 plt01 Dependent Variable T-statistic
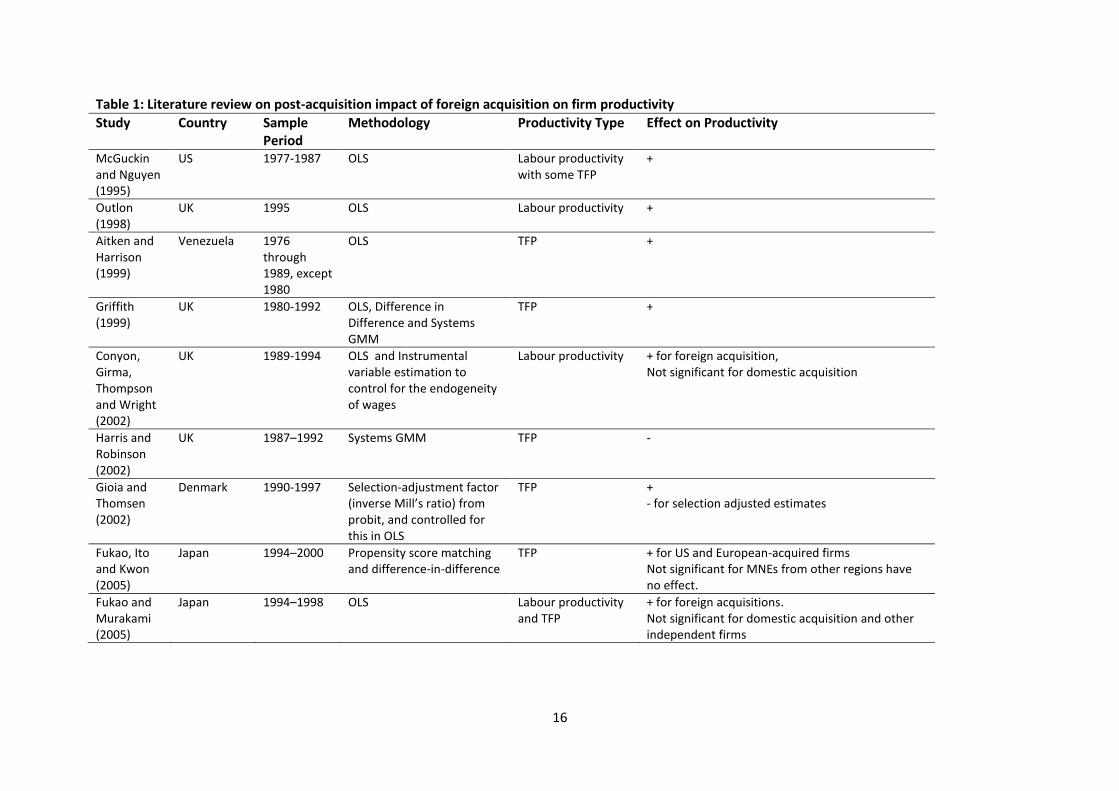
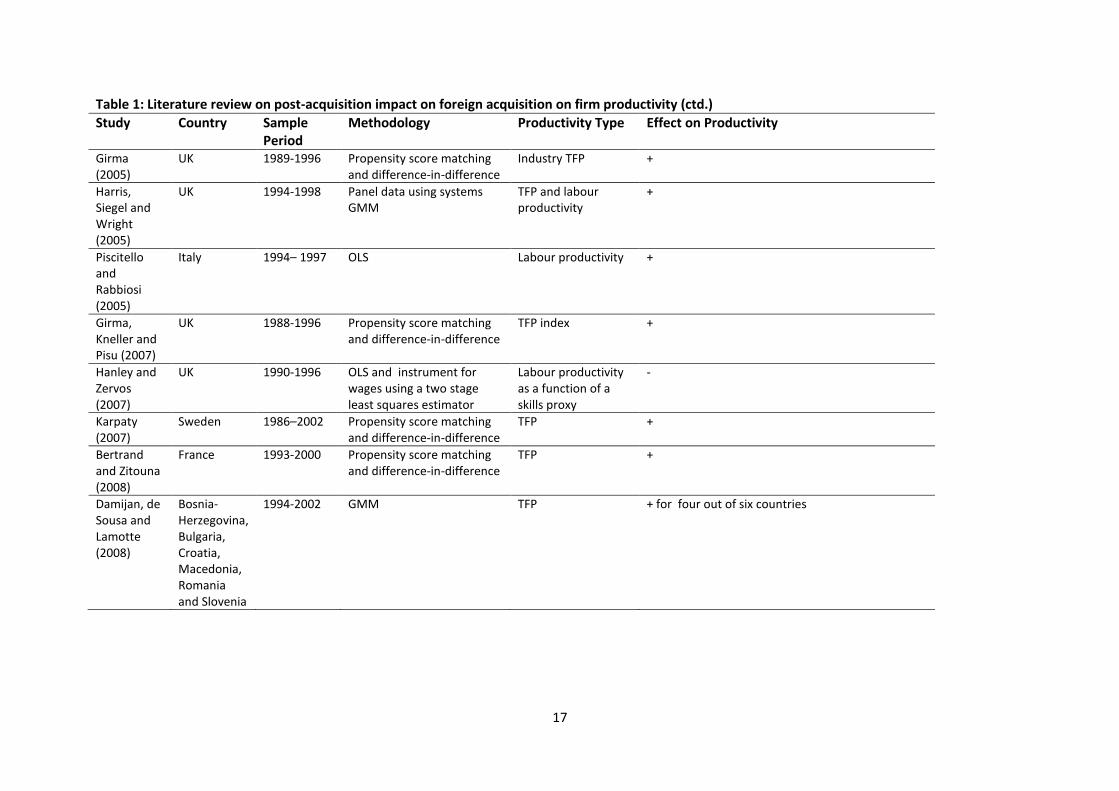
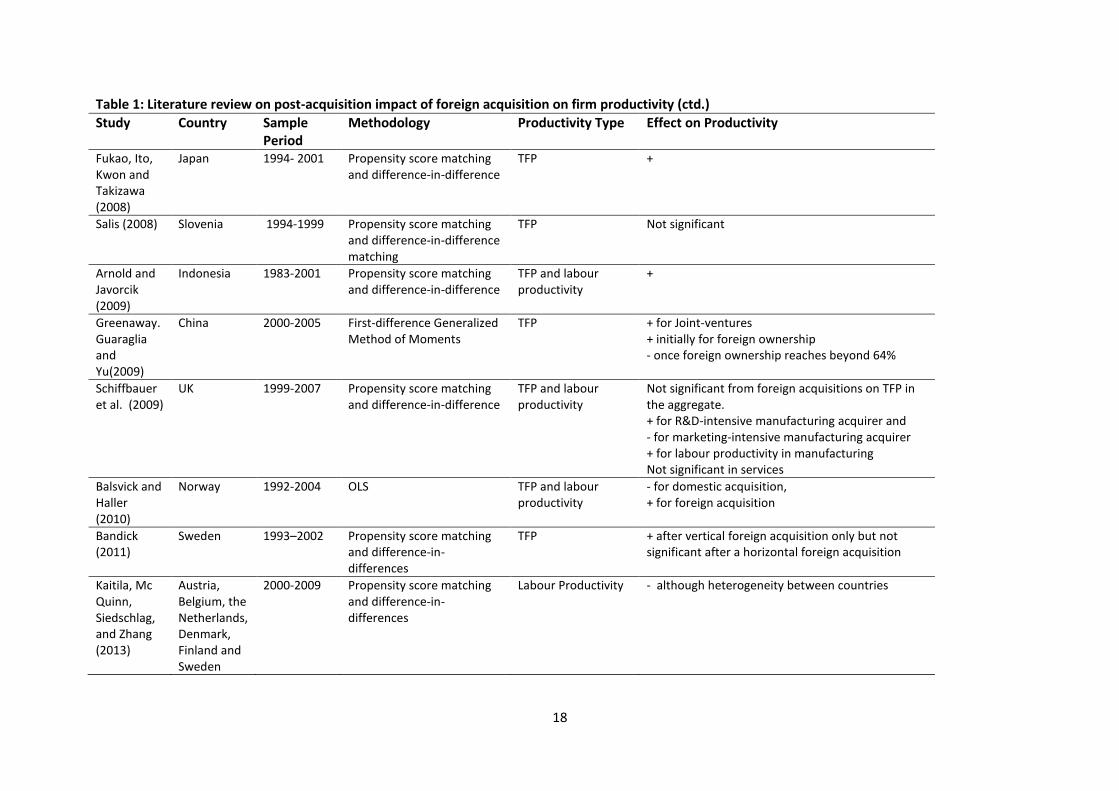
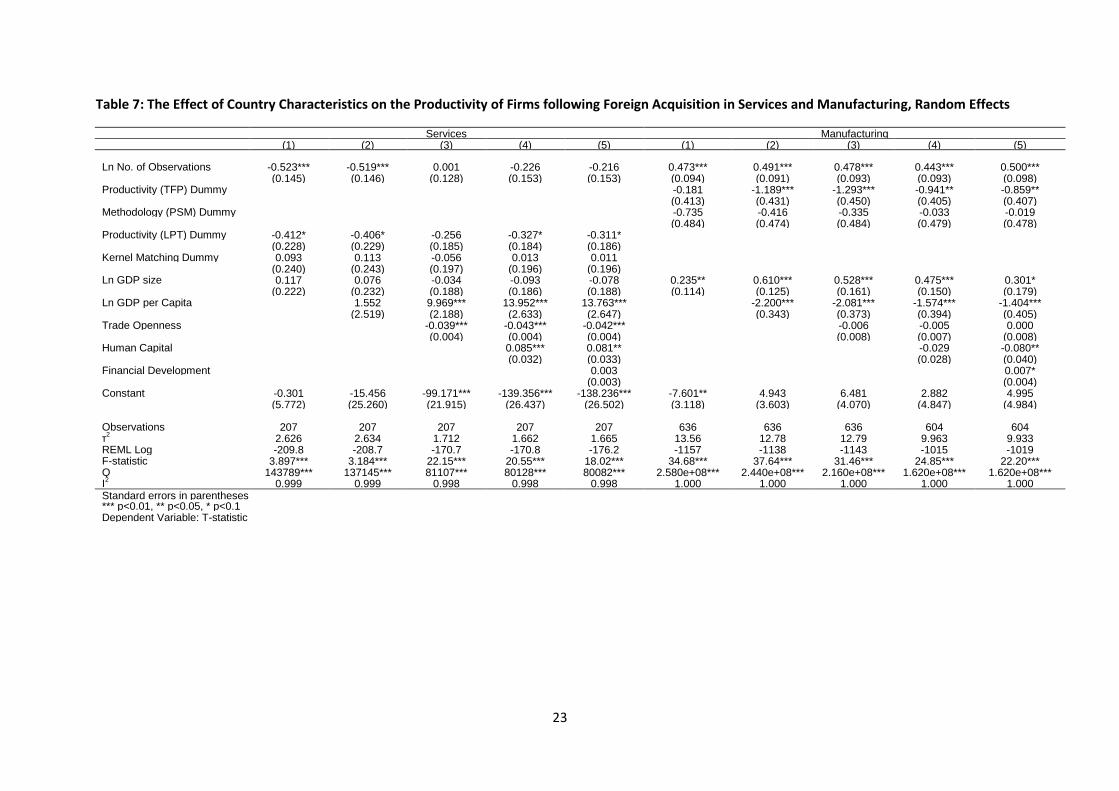
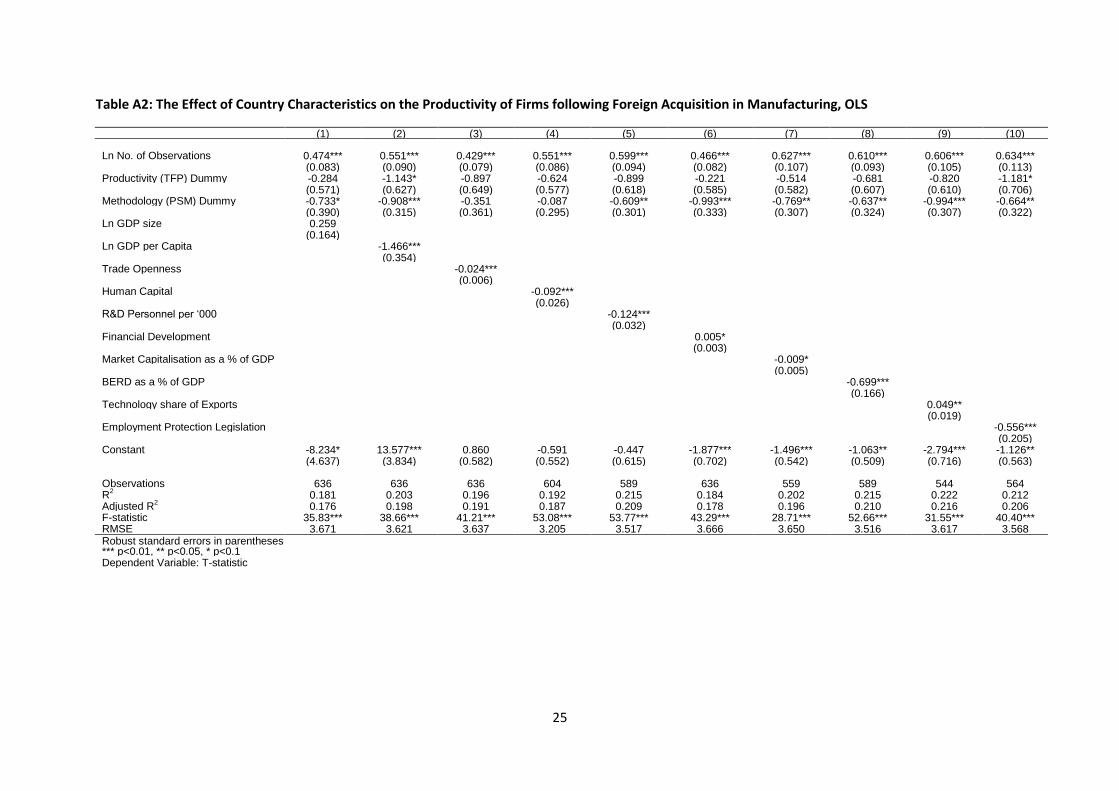
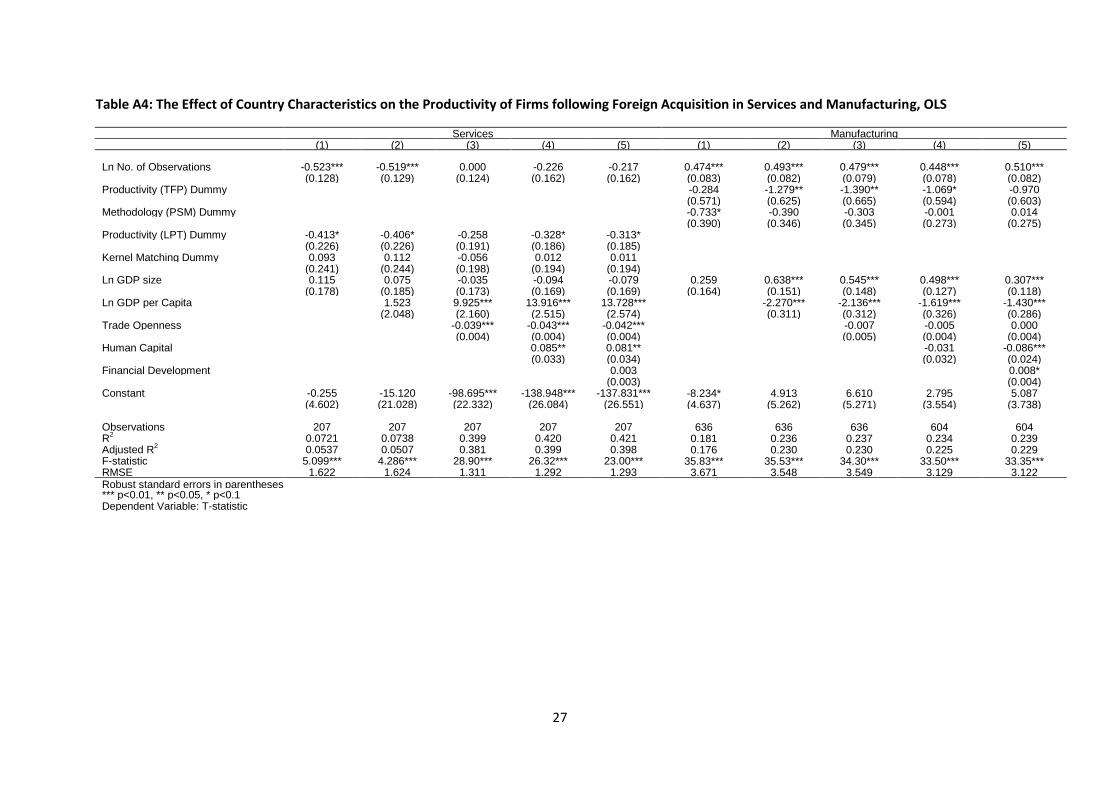