foreign exchange risk management practices by … · foreign exchange risk management practices by...
TRANSCRIPT

Foreign exchange risk management practices byJordanian nonfinancial firms
Riad Al-Momani*, and Mohammad R. Gharaibeh*Department of Economics, Yarmouk University, Jordan-Irbed.
Fax: 09626 5063042, E-mail: [email protected]
Received (in revised form): 21st June, 2008
Riad Al-Momani is Professor of Economics at the Yarmouk University, Jordan. He graduated from the Utah State
University, USA, in 1985. He has published many papers in national and regional journals. His research interests
include economic development and finance issues, and portfolio management.
Mohammad R. Gharaibeh is a graduate student in Yarmouk University.
Abstract
Foreign exchange risk becomes more and more
important in light of the globalisation and
internationalisation of world markets, and is one of the
most difficult and persistent problems with which the
financial executives must cope. This study concentrates
on the foreign exchange risk management practices of
Jordanian firms, and examines the relationship
between various factors that are presumed to affect the
adopting of foreign exchange risk management
techniques, namely firm size, sector, international
business involvement, and legal structure. The study
focuses on transaction and economic exposures as the
dimensions of foreign exchange risk management
techniques. The results are taken from an empirical
field study of 73 nonfinancial firms listed by Jordan’s
Income and Sales Tax Department as major
taxpayers. The study uses the Kruskal–Wallis one-
way analysis of variances to analyse the data. The
results indicate that the use of foreign exchange risk
management techniques such as financial derivatives is
not a common practice by Jordanian firms. The most
common methods used by firms to counter foreign
exchange risks such as matching, netting, using local
currency, and price policy are internal (natural)
resources. In addition, this study concludes that there
are no relationships between firm size and legal
structure and the management practices toward
transaction exposure. A relationship between a firm’s
sector and international involvement with the
management practices was found in the transaction
exposure dimension. Concerning the economic
exposure dimension, a relationship between all the
characteristics and the managerial techniques is found.
This study recommends proper training programmes for
financial managers in order to enhance their knowledge
about the importance of foreign currency risk and the
different techniques used to manage that risk.
Journal of Derivatives & Hedge Funds (2008) 14,
198–221. doi:10.1057/jdhf.2008.16
Keywords: foreign exchange risk; exchange
rate risk; currency risk; transaction
PREFACE
In an era of globalisation and
internationalisation, the economic environment
198 Journal of Derivatives & Hedge Funds Volume 14 Numbers 3/4 2008
www.palgrave-journals.com/jdhf/
Journal of Derivatives
& Hedge Funds,
Vol. 14 Nos. 3/4, 2008,
pp. 198–221
r 2008 Palgrave
Macmillan
1753-9641

in which most firms operate is highly volatile
and uncertain. This volatility can be reflected in
increased fluctuations in foreign exchange
and interest, and inflation rates; increased
competition, demand levels, etc. In addition, the
extensive use of financial innovations and the
advances in financial instruments to manage this
risk make this issue one of a firm’s priorities.
Foreign currency risk is a crucial factor that
affects most firms, especially those that trade
frequently in international markets. This is so
because if a firm buys a foreign asset, it is
exposed to two types of risk: the first is related to
the value of the asset, while the other is related
to the fluctuations in exchange rates. In other
words, an overseas contract, which is profitable
at the time of the deal, may become unprofitable
if the exchange rates changes. This is an example
of the direct exposure to movements in
exchange rates; however, the exposure can have
an indirect effect through pricing strategy
changes, labour costs, etc. In addition, the
growth in the size of international trade makes
foreign currency risk an important issue for a
whole range of companies.
This study explores the areas of foreign
currency risk management, with a special
emphasis on specific forms of that exposure,
namely transaction and economic exposures.
Translation risk is ignored because of the small
number of multinational firms based in Jordan
exposed to such risk. In addition, the analysis
involves only selected nonfinancial companies as
the sample of the study. Financial companies
were neglected because of the ambiguity
concerning the purpose of their use of hedging
instruments.
Currently, there is a scarcity of research papers
about foreign exchange risk management in
emerging markets. Theoretical studies are
usually supported by findings from developed
countries.1 Therefore, this study will be
distinctive, because it will contribute to the
increase in academic studies on emerging
markets. In addition, it concentrates on Jordan,
one of the Middle Eastern countries, which
makes it one of the first studies in this area.
COMMENTS ON PREVIOUS STUDIES
Previous studies have been conducted regarding
different objectives and visions of the foreign
exchange rate risk. Allayannis et al.2 dealt with
the rationality behind managing such a risk.
Many studied the impact of exchange rate
movements on a firm, such as Karasoy,3 Bradly
and Moles,4 El-Masry,5 and Fang and Miller.6
An investigation of the wide use of exchange
rate risk management techniques was conducted
by Belk and Glaum,7 Batten, et al.,8 and Jonuska
and Samenaite.1 Other studies were conducted
to examine the theory about foreign exchange
risk management and what is done in practice,
such as Brucaite and Yan,9 Dhanani and
Groves,10 and Popov and Stutzmann.11
Most of the literature has been supported.
There are a lot of studies in the developed
countries. However, very few studies were
found to support cases in developing countries.
Such a study is a distinguishing feature because it
is conducted on Jordanian firms as a study case
and Jordan is considered one of the developing
countries in the Middle East.
PROBLEM DEFINITION
As mentioned earlier, there is a scarcity of studies
and papers concerning foreign currency risk
exposure and management in developing
countries. Therefore, to achieve a good start in
this area is to study and identify factors that are
Foreign exchange risk management practices by Jordanian nonfinancial firms 199

presumed to affect the management of foreign
currency risk. This study investigates a problem
that can be defined through the following
questions:
(1) Do Jordanian corporations adopt or
implement foreign exchange risk
management techniques?
(2) What kind of foreign exchange risk
management do Jordanian corporations
mostly use?
(3) Do firm-specific characteristics affect the
level of adoption of foreign exchange risk
management techniques in the Jordanian
environment?
OBJECTIVES OF THE STUDY
The main objective of this study is to investigate
the relationship between foreign currency risk
and international business involvement, legal
structure, firm size, sector, and management
practices in the Jordanian environment.
The impact of firm-specific characteristics on
the managerial practices of Jordanian firms will
also be investigated, by examining the opinions
of financial controllers, treasury managers or
persons involved in foreign exchange
management decisions.
MAIN HYPOTHESIS
In order to conduct this study, the following
hypotheses will be tested:
1H0: There is a significant statistical relationship
between a firm’s international business
involvement level and management practices
and transaction exposure in the Jordanian
environment.
2H0: There is a significant statistical relationship
between a firm’s legal structure and management
practices and transaction exposure risk in the
Jordanian environment.
3H0: There is a significant statistical relationship
between firm size and management practices
and transaction exposure in the Jordanian
environment.
4H0: There is a significant statistical relationship
between a firm’s sector and management
practices and transaction exposure in the
Jordanian environment.
5H0: There is a significant statistical relationship
between a firm’s international business
involvement level and management practices
and economic exposure in the Jordanian
environment.
6H0: There is a significant statistical relationship
between a firm’s legal structure and management
practices and economic exposure risk in the
Jordanian environment.
7H0: There is a significant statistical relationship
between firm size and management practices
and economic exposure in the Jordanian
environment.
8H0: There is a significant statistical relationship
between a firm’s sector and management
practices and economic exposure in the
Jordanian environment.
METHODOLOGY
Because there is no common methodology or
generally accepted design that fits the topic of
this research, the research methodology has been
200 Al-Momani and Gharaibeh

developed in a way that demonstrates the model
of the study, dimensions of the study, hypotheses
and the aspects related to sampling, data and
methods of statistical analysis.
Model of the study
The following chart (Figure 1) shows the firm-
specific characteristics as the independent variables,
which are firm size, industry sector, international
business activities, ownership, and legal structure.
These independent variables will present relations
under two dimensions of dependent variables: the
financial hedging techniques and the operational
hedging techniques.
Variables of the study
The focus of the study is the question of what
determines the method that firms in Jordan use
to manage transaction and economic exposures.
Consequently, the hedging strategies that the
Jordanian firms adopted are designed as
dependent variables.
The dependent variables
(1) Financial hedging techniques. These
techniques are used to hedge transaction
exposure, and they are different from each
other in terms of their sophistication levels.
It starts with using internal hedging
techniques, and then moves to a more
complex hedge by using money market
techniques and currency derivatives.
However, the latter represent a more risky
and expensive instrument to hedge the
transaction exposure.
(2) Operational hedging techniques. These
techniques are used to hedge economic
exposure. They are also different in terms
of risk and cost levels. They start to source
inputs in the same currencies as sales which
can finally be used to conduct major
actions such as altering the currency that
production/operations occur following
movements in foreign exchange rates.
The independent variables
Company-specific characteristics are used to
establish the study of relations to the
management practices concerning foreign
currency risk.
These characteristics are as follows:
(1) Firm size. Total annual sales, equity capital
(capital raised from owners), and market
value of a firm’s assets used as proxies for a
firm size.
(2) International business involvement. This
characteristic is concerned with the degree
of involvement of a firm in the foreign
environment. Three variables are used as
proxies for measuring the degree of foreign
involvement: (1) percentage of foreign
currency sales to total sales (FS/TS),
(2) percentage of foreign currency costs
to total costs (FC/TC), (3) percentage
TransactionExposure
EconomicExposure
FinancialHedging
Techniques
OperationalHedging
Techniques
IndustryGroupings
Firm Size
InternationalInvolvement
LegalStructure
Figure 1: Model of the study
Foreign exchange risk management practices by Jordanian nonfinancial firms 201

of foreign currency debt to total debt
(FD/TD).
(3) Firm’s sector. The financial and operational
hedging techniques across different
industries are examined. The research
covers Jordanian commercial,
manufacturing, and other firms (mining
and processing, agriculture, and building
and construction).
(4) The legal form of the firms. The main legal
forms of Jordanian firms are sole trader,
partnership, closed limited corporations
and public limited corporations.
The main different characteristics of the firms
are presumed to have effects on foreign currency
exposure due to the different structures, markets
and cash flows of the firms.
POPULATION AND SAMPLE OF THE
STUDY
This study was performed by exploring the
impact of selected company-specific
characteristics on the adoption of foreign
currency risk management techniques. To
achieve this goal, a sample of the largest
nonfinancial firms, in terms of annual sales and
annual income, operating in Jordan was used as a
unit of analysis. There were 456 firms. Only 310
firms from different sectors and types met the
criteria of the study.12
The population of the study was sub-grouped
in terms of economic sectors into three strata
(sub-groups), which are manufacturing,
commercial, and other sectors. These sub-
groups are unequal in size: it is preferable to use
proportionate (unequal size) stratified random
sampling to represent the three sub-groups.
This ensures the selection of a representative
sample. Thus, 120 firms were selected: 45
manufacturing firms, 60 commercial firms, and
15 firms from other sectors.
Data collection techniques
Data needed for this study were collected from
two sources: secondary and primary.
Secondary sources
The secondary source represents the related
information that was found in books, articles,
periodicals, working papers, e-papers, and
unpublished studies such as dissertations and
theses, in addition to some related and valuable
websites.
Primary sources
One primary source was a questionnaire
written in Arabic using scales such as itemised
rating scales, which are effective for measuring
anchors as needed. In addition, category
scales were used to identify specific
characteristics of the subject. The questionnaire
consists of three parts, representing general
information on the subjects, a transaction
exposure section, and an economic exposure
section. Finally, a summary of some techniques
for foreign currency risk management is
provided in order to ensure the full
understanding of the question asked.
The questionnaire was distributed to the
respondents, completed by them at their work
locations and returned to the researcher.
They were reminded one to two days before the
due date to return the questionnaire, if they had
not already done so. The respondents targeted
were mainly financial managers and/or
treasurers.
202 Al-Momani and Gharaibeh
Data analysis techniques
To test the hypotheses, the study employed some
known statistical techniques. To measure the
central tendency and dispersion, descriptive
statistics were employed such as frequencies,
ratios, means and standard deviations. The
Kruskal–Wallis one-way analysis of variances
(ANOVA) was used to examine the significance
of statistical differences. This technique
compares the variances between groups with the
variances within groups. In case such significant
statistical differences between groups do exist,
the one-way ANOVA is used when the
dependent variable is on an ordinal scale, and the
independent variables are normally scaled.
Data analysis/major results
This section presents and analyses the data
obtained by the questionnaire. The goodness of
data was examined using the statistical
techniques mentioned above.
Responding rates
The data needed were obtained through the
distribution of 120 questionnaires to three strata
of firms in a proportionate manner to their total
size in the population.
The groups of respondents are commercial,
manufacturing, and other firms. Out of the 87
questionnaires returned, 72.5 per cent was the
retrieval rate, as only 73 copies were considered
valid for analysis, which represents a response
rate of about 61 per cent.
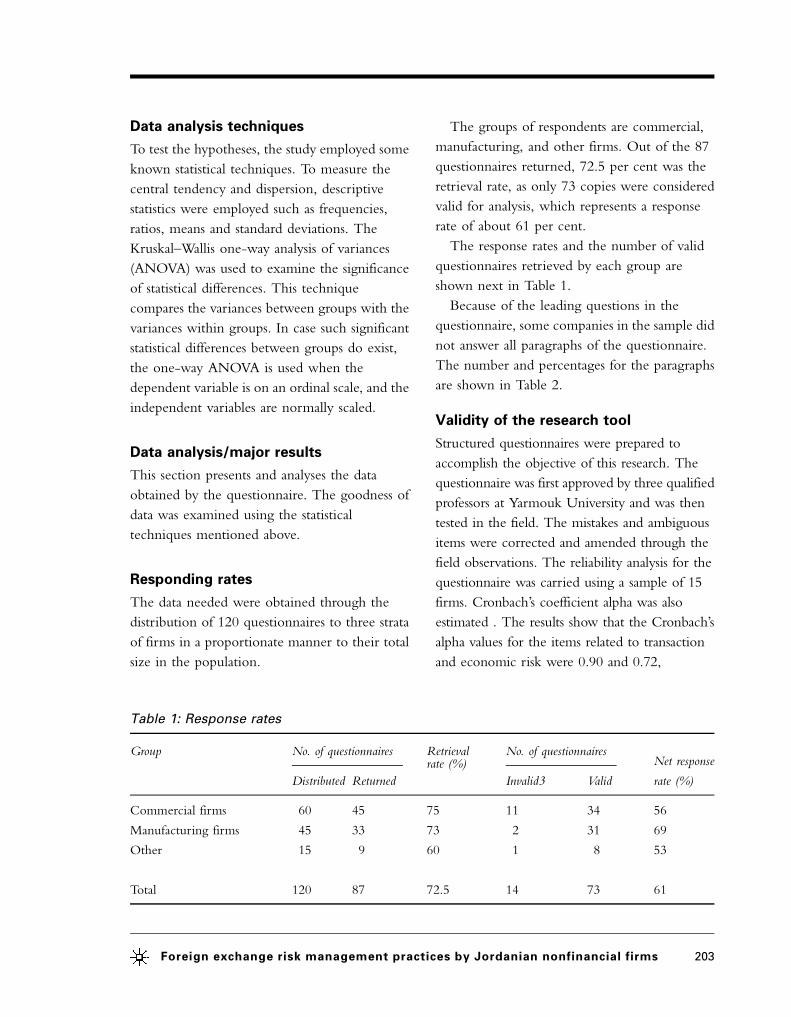
The response rates and the number of valid
questionnaires retrieved by each group are
shown next in Table 1.
Because of the leading questions in the
questionnaire, some companies in the sample did
not answer all paragraphs of the questionnaire.
The number and percentages for the paragraphs
are shown in Table 2.
Validity of the research tool
Structured questionnaires were prepared to
accomplish the objective of this research. The
questionnaire was first approved by three qualified
professors at Yarmouk University and was then
tested in the field. The mistakes and ambiguous
items were corrected and amended through the
field observations. The reliability analysis for the
questionnaire was carried using a sample of 15
firms. Cronbach’s coefficient alpha was also
estimated . The results show that the Cronbach’s
alpha values for the items related to transaction
and economic risk were 0.90 and 0.72,
Table 1: Response rates
Group No. of questionnaires Retrieval No. of questionnaires
Distributed Returned
rate (%)
Invalid3 Valid
Net response
rate (%)
Commercial firms 60 45 75 11 34 56
Manufacturing firms 45 33 73 2 31 69
Other 15 9 60 1 8 53
Total 120 87 72.5 14 73 61
Foreign exchange risk management practices by Jordanian nonfinancial firms 203

respectively, while the value for all items was 0.87.
These values of Cronbach’s alpha are acceptable
for studies such as the current one (Table 3).
Hypotheses testing
This section is devoted to testing the previously
mentioned hypotheses of the study. The
hypotheses mainly aim to find significant
relationships between presumed factors (firm-
specific characteristics) and the management
techniques of foreign currency risk.
Firm-specific characteristics are related to
management techniques under two dimensions:
transaction exposure management and economic
exposure management.
Since there are more than two independent
variables (firm-specific characteristics) and the
Table 2: Response rates for each question
Question Frequency Valid %
Sectors of the firm 73 100.0
Firms legal structure 73 100.0
Annual sales of the firms 67 91.8
Firm’s capital 70 95.9
Percentage of foreign sale’s to total sales 70 95.9
Percentage of foreign cost’s to total cost’s 70 95.9
Percentage of foreign debt to total debt 73 100.0
Existence of A/P and A/R 73 100.0
Managing foreign currency risk 42 57.5
Purpose of managing currency risk 28 38.3
Effect of exchange rate variations on the firms activities 64 87.6
Effect of capital size on managing transaction exposure risk 36 49.3
Effect of sales volume on managing transaction exposure risk 39 53.4
Effect of firm’s sector on transaction exposure risk 38 52.0
Percentage of FS/TS sales effect on transaction exposure risk management 39 53.4
Percentage of FC/TC sales effect on transaction exposure risk management 39 53.4
Percentage of FD/TD sales effect on transaction exposure risk management 39 53.4
Legal structure effect on transaction exposure risk management 38 52.0
Effect of capital size on managing economic exposure risk 55 75.3
Effect of sales volume on managing economic exposure risk 52 71.2
Effect of firms sector on managing economic exposure risk 57 78.0
Percentage of FS/TS sales effect on economic exposure risk management 54 73.9
Percentage of FC/TC sales effect on economic exposure risk management 54 73.9
Percentage of FD/TD sales effect on economic exposure risk management 58 79.4
Legal structure effect on economic exposure risk management 57 78.0
204 Al-Momani and Gharaibeh

dependent variables (management techniques for
each dimension) are measured on an interval
scale, ANOVA is appropriate for testing these
hypotheses.
The results of transaction exposure dimension
Transaction exposure is related to the risk that
arises from day-to-day transactions dealt with
foreign currencies that are subject to volatility in
value against the local currency.
In order to obtain results concerning whether
there is a relationship between the firm-specific
characteristics and foreign currency risk
management techniques adopted by Jordanian
firms, different techniques were listed. To show
how often they were used, answers were coded
in such a way that if a technique was always used
by a firm, the code was (5); if it was usually used,
the code was (4); if it was sometimes used, the
code was (3); if it was seldom used, the code was
(2); and finally if the technique was never used,
the code was (1).
(1) The effect of firm size on managing transaction
exposure risk
Firm size is expressed by two variables: capital
and sales volume of a firm. The hypothesis is as
follows:
H01: There is a significant statistical relationship
between firm size and management practices
and transaction exposure in the Jordanian
environment.
The one-way ANOVA results for each
variable are as follows:
(a) The effect of the capital size of a firm on managing
transaction exposure risk
As Table 4 shows, with a significant level of
0.074, there is no significant statistical
relationship between the capital size of a firm
and the techniques used to manage transaction
exposure. This considers 0.05 significance level
or below as the acceptable level for social science
studies.
(b) The effect of the sales volume of a firm on managing
transaction exposure risk
The result of the sales volume character and its
relation to the use of transaction exposure
management techniques (as shown in Table 5)
indicates an insignificant statistical relation. The
significance level for this test is (¼ 0.218>0.05),
which is not acceptable.
Both results assert the rejection of the
hypothesis of the significant statistical
relationship between firm size and the
management of transaction exposure.
(2) The effect of firm sector on managing transaction
exposure risk
H02: There is a significant statistical relationship
between firm sector and management practices
and transaction exposure in the Jordanian
environment.
Table 6 shows that there is a significant
statistical relationship between the sector of a
firm and the techniques used. The significant
level of 0.028 is lower than 0.05. This implies
Table 3: Cronbach’s coefficient alpha
Dimension No. of
items
Cronbach’s
coefficient alpha
Transaction risk 5 0.90
Economic risk 3 0.72
All items 8 0.87
Foreign exchange risk management practices by Jordanian nonfinancial firms 205

Table 4: The effect of capital size on managing transaction exposure risk
Capital size N Mean Standard
deviation
Standard
error
95% confidence interval for mean Minimum Maximum
Lower bound Upper bound
o1m 13 2.5618 1.25761 0.34880 1.8018 3.3217 1.00 4.33
1–o5m 9 3.3888 0.64716 0.21572 2.8914 3.8863 2.27 4.40
5–o10m 11 3.4977 0.71636 0.21599 3.0165 3.9790 2.40 5.00
10m or more 3 3.6869 1.17689 0.67948 0.7633 6.6104 2.73 5.00
Total 36 3.1483 1.03424 0.17237 2.7983 3.4982 1.00 5.00
Sum of squares d.f. Mean square F Significant
Between groups 7.206 3 2.402 2.543 0.074
Within groups 30.231 32 0.945 — —
Total 37.438 35 — — —
Table 5: The effect of sales volume on managing transaction exposure risk
Sales volume N Mean Standard
deviation
Standard
error
95% confidence interval for mean Minimum Maximum
Lower bound Upper bound
o3m 8 2.3523 1.62872 0.57584 0.9906 3.7139 1.00 5.00
3–6m 15 3.1988 0.70348 0.18164 2.8092 3.5884 2.00 4.40
6–9m 6 3.6015 0.43486 0.17753 3.1452 4.0579 3.00 4.00
9–12m 4 3.5476 0.55737 0.27868 2.6607 4.4345 2.86 4.00
13–15m 2 3.3667 1.36707 0.96667 �8.9160 15.6493 2.40 4.33
15m or more 4 3.4318 1.06374 0.53187 1.7392 5.1245 2.73 5.00
Total 39 3.1554 1.02638 0.16435 2.8227 3.4881 1.00 5.00
Sum of squares d.f. Mean square F Significant
Between groups 7.393 5 1.479 1.495 0.218
Within groups 32.639 33 0.989 — —
Total 40.031 38 — — —
206 Al-Momani and Gharaibeh
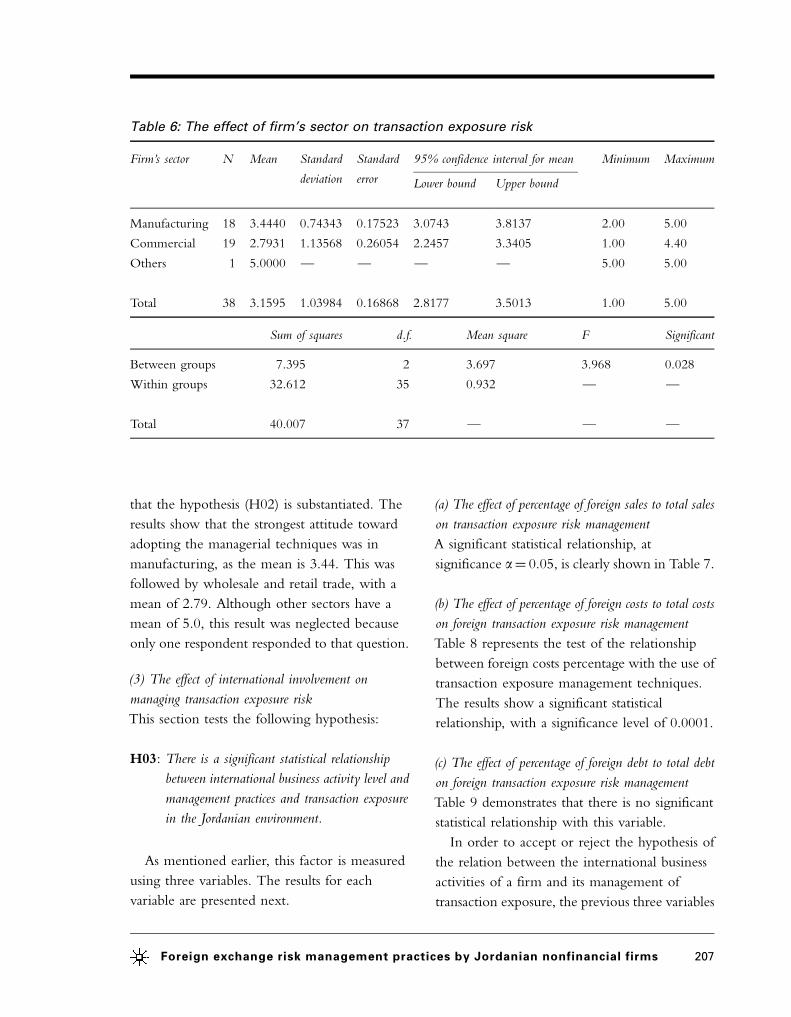
that the hypothesis (H02) is substantiated. The
results show that the strongest attitude toward
adopting the managerial techniques was in
manufacturing, as the mean is 3.44. This was
followed by wholesale and retail trade, with a
mean of 2.79. Although other sectors have a
mean of 5.0, this result was neglected because
only one respondent responded to that question.
(3) The effect of international involvement on
managing transaction exposure risk
This section tests the following hypothesis:
H03: There is a significant statistical relationship
between international business activity level and
management practices and transaction exposure
in the Jordanian environment.
As mentioned earlier, this factor is measured
using three variables. The results for each
variable are presented next.
(a) The effect of percentage of foreign sales to total sales
on transaction exposure risk management
A significant statistical relationship, at
significance a¼ 0.05, is clearly shown in Table 7.
(b) The effect of percentage of foreign costs to total costs
on foreign transaction exposure risk management
Table 8 represents the test of the relationship
between foreign costs percentage with the use of
transaction exposure management techniques.
The results show a significant statistical
relationship, with a significance level of 0.0001.
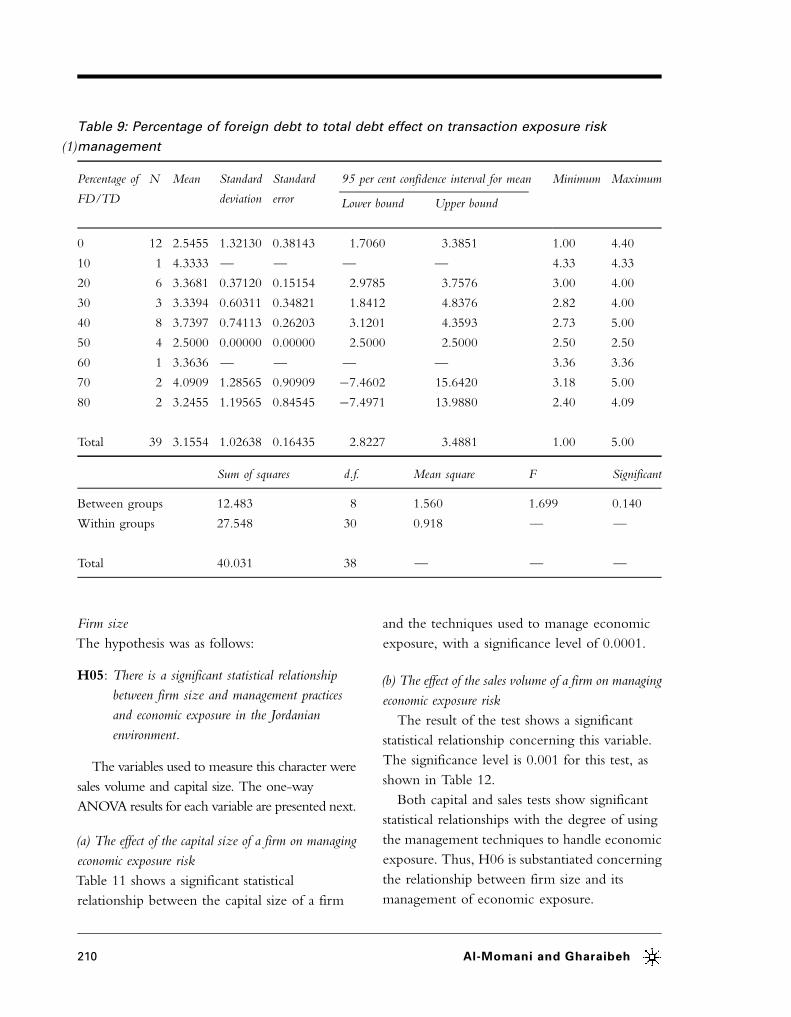
(c) The effect of percentage of foreign debt to total debt
on foreign transaction exposure risk management
Table 9 demonstrates that there is no significant
statistical relationship with this variable.
In order to accept or reject the hypothesis of
the relation between the international business
activities of a firm and its management of
transaction exposure, the previous three variables
Table 6: The effect of firm’s sector on transaction exposure risk
Firm’s sector N Mean Standard
deviation
Standard
error
95% confidence interval for mean Minimum Maximum
Lower bound Upper bound
Manufacturing 18 3.4440 0.74343 0.17523 3.0743 3.8137 2.00 5.00
Commercial 19 2.7931 1.13568 0.26054 2.2457 3.3405 1.00 4.40
Others 1 5.0000 — — — — 5.00 5.00
Total 38 3.1595 1.03984 0.16868 2.8177 3.5013 1.00 5.00
Sum of squares d.f. Mean square F Significant
Between groups 7.395 2 3.697 3.968 0.028
Within groups 32.612 35 0.932 — —
Total 40.007 37 — — —
Foreign exchange risk management practices by Jordanian nonfinancial firms 207

must be considered. The degree of international
involvement of a firm was measured by %FS
(percentage of foreign sales), %FC (percentage of
foreign costs), and %FD (percentage of foreign
debt).
Both %FS and %FC showed a significant
statistical relationship with the use of the
management techniques, but %FD showed no
relation. The sample results of that specific
variable, however, showed that 42.4 per cent of
firms had no debt in foreign currency at all. Also,
83.4 per cent of firms had a %FD of 50 per cent
or less and this weakens the reliability of this
variable. Therefore, the variables %FS and %FC
are more reliable in determining the result of the
test for that hypothesis.
Finally, considering the results of %FS and
%FC and their significance level, H03 is
substantiated.
(4) The effect of legal structure on foreign transaction
exposure risk management
The hypothesis is as follows:
H04: There is a significant statistical relationship
between legal structure and management
practices and transaction exposure risk in the
Jordanian environment.
Table 7: Percentage of foreign sales to total sales effect on transaction exposure currency risk
management
Percentage of
FS/TS
N Mean Standard
deviation
Standard
error
95% confidence interval for mean Minimum Maximum
Lower bound Upper bound
0 5 2.8667 0.81989 0.36667 1.8486 3.8847 2.50 4.33
10 5 1.4909 1.09771 0.49091 0.1279 2.8539 1.00 3.45
20 4 3.8333 0.33333 0.16667 3.3029 4.3637 3.33 4.00
30 5 3.3891 — 0.43407 2.1839 4.5943 2.40 5.00
40 7 3.4208 0.87233 0.32971 2.6140 4.2275 2.00 4.40
50 5 3.8273 0.82597 0.36939 2.8017 4.8529 2.73 5.00
60 2 3.2667 0.09428 0.06667 2.4196 4.1137 3.20 3.33
70 2 3.4167 0.11785 0.08333 2.3578 4.4755 3.33 3.50
80 2 3.4545 0.89995 0.63636 �4.6312 11.5403 2.82 4.09
100 2 2.8182 0.77139 0.54545 �4.1125 9.7488 2.27 3.36
Total 39 3.1554 1.02638 0.16435 2.8227 3.4881 1.00 5.00
Sum of squares d.f. Mean square F Significant
Between groups 19.699 9 2.189 3.122 0.009
Within groups 20.333 29 0.701 — —
Total 40.031 38 — — —
208 Al-Momani and Gharaibeh

The results show that there is no significant
statistical relationship between the legal structure
of a firm and its management of transaction
exposure. Therefore, H04 is rejected. As shown
in Table 10, the test resulted in a significant level
of 0.443.
The results of economic exposure dimension
Economic exposure is related to the risk that is
generated from dealing with foreign currencies
in the long run.
This section tests the hypotheses concerning
the relationship between a firm’s specific
characteristics and the use of risk management
techniques concerning economic exposure.
Like transaction exposure, economic exposure
management techniques were coded depending
on how often these techniques were used by
firms. If a technique was always used by the
respondent, the code was (5); if it was usually
used, the code was (4); if it was sometimes used,
the code was (3); if it was seldom used, the code
was (2); and if the technique was never used, the
code was (1). ANOVA was used to test the
hypotheses.
Results depending on each character are
presented next.
Table 8: Percentage of foreign costs to total costs effect on transaction exposure risk
management
Percentage of
FC/TC
N Mean Standard
deviation
Standard
error
95% confidence interval for mean Minimum Maximum
Lower bound Upper bound
0 1 1.0909 — — — — 1.09 1.09
10 4 1.0000 0.00000 0.00000 1.0000 1.0000 1.00 1.00
30 2 3.9091 1.54278 1.09091 �9.9522 17.7704 2.82 5.00
40 1 2.0000 — — — — 2.00 2.00
50 2 3.1000 0.14142 0.10000 1.8294 4.3706 3.00 3.20
60 3 3.2121 0.61881 0.35727 1.6749 4.7493 2.73 3.91
70 8 3.6940 0.42059 0.14870 3.3423 4.0456 3.33 4.33
80 12 3.4128 0.86226 0.24891 2.8650 3.9607 2.50 5.00
90 5 3.3073 0.61100 0.27325 2.5486 4.0659 2.40 4.09
100 1 2.2727 — — — — 2.27 2.27
Total 39 3.1554 1.02638 0.16435 2.8227 3.4881 1.00 5.00
Sum of squares d.f. Mean square F Significant
Between groups 25.955 9 2.884 5.942 0.000
Within groups 14.076 29 0.485 — —
Total 40.031 38 — — —
Foreign exchange risk management practices by Jordanian nonfinancial firms 209
(1)
Firm size
The hypothesis was as follows:
H05: There is a significant statistical relationship
between firm size and management practices
and economic exposure in the Jordanian
environment.
The variables used to measure this character were
sales volume and capital size. The one-way
ANOVA results for each variable are presented next.
(a) The effect of the capital size of a firm on managing
economic exposure risk
Table 11 shows a significant statistical
relationship between the capital size of a firm
and the techniques used to manage economic
exposure, with a significance level of 0.0001.
(b) The effect of the sales volume of a firm on managing
economic exposure risk
The result of the test shows a significant
statistical relationship concerning this variable.
The significance level is 0.001 for this test, as
shown in Table 12.
Both capital and sales tests show significant
statistical relationships with the degree of using
the management techniques to handle economic
exposure. Thus, H06 is substantiated concerning
the relationship between firm size and its
management of economic exposure.
Table 9: Percentage of foreign debt to total debt effect on transaction exposure risk
management
Percentage of
FD/TD
N Mean Standard
deviation
Standard
error
95 per cent confidence interval for mean Minimum Maximum
Lower bound Upper bound
0 12 2.5455 1.32130 0.38143 1.7060 3.3851 1.00 4.40
10 1 4.3333 — — — — 4.33 4.33
20 6 3.3681 0.37120 0.15154 2.9785 3.7576 3.00 4.00
30 3 3.3394 0.60311 0.34821 1.8412 4.8376 2.82 4.00
40 8 3.7397 0.74113 0.26203 3.1201 4.3593 2.73 5.00
50 4 2.5000 0.00000 0.00000 2.5000 2.5000 2.50 2.50
60 1 3.3636 — — — — 3.36 3.36
70 2 4.0909 1.28565 0.90909 �7.4602 15.6420 3.18 5.00
80 2 3.2455 1.19565 0.84545 �7.4971 13.9880 2.40 4.09
Total 39 3.1554 1.02638 0.16435 2.8227 3.4881 1.00 5.00
Sum of squares d.f. Mean square F Significant
Between groups 12.483 8 1.560 1.699 0.140
Within groups 27.548 30 0.918 — —
Total 40.031 38 — — —
210 Al-Momani and Gharaibeh

Table 10: Legal structure effect on transaction exposure risk management
Legal structure N Mean Standard
deviation
Standard
error
95% confidence interval for mean Minimum Maximum
Lower bound Upper bound
Public shareholding 12 3.4868 0.77937 0.22499 2.9916 3.9820 2.00 5.00
Private shareholding 3 2.7697 0.39263 0.22669 1.7943 3.7450 2.40 3.18
Partnership 3 3.6263 0.40693 0.23494 2.6154 4.6371 3.33 4.09
Limited liability 15 2.9539 1.38090 0.35655 2.1892 3.7186 1.00 5.00
Private company 5 2.7000 0.44721 0.20000 2.1447 3.2553 2.50 3.50
Total 38 3.1273 1.02487 0.16626 2.7905 3.4642 1.00 5.00
Sum of squares d.f. Mean square F Significant
Between groups 4.046 4 1.011 0.959 0.443
Within groups 34.818 33 1.055 — —
Total 38.863 37 — — —
Table 11: The effect of capital size on managing economic exposure risk
Capital size N Mean Standard
deviation
Standard
error
95% confidence interval for mean Minimum Maximum
Lower bound Upper bound
o1m 20 4.4826 0.59637 0.13335 4.2035 4.7617 3.00 5.00
1–o5m 16 3.5336 0.76772 0.19193 3.1245 3.9427 1.33 4.57
5–o10m 14 3.4653 0.53724 0.14358 3.1551 3.7755 3.00 4.71
10m or more 5 3.0333 0.46248 0.20683 2.4591 3.6076 2.50 3.67
Total 55 3.8158 0.80685 0.10880 3.5977 4.0340 1.33 5.00
Sum of squares d.f. Mean square F Significant
Between groups 14.948 3 4.983 12.576 0.000
Within groups 20.206 51 0.396 — —
Total 35.154 54 — — —
Foreign exchange risk management practices by Jordanian nonfinancial firms 211

Table 13: The effect of firm’s sector on economic exposure risk
Firm’s sector N Mean Standard
deviation
Standard
error
95% confidence interval for mean Minimum Maximum
Lower bound Upper bound
Manufacturing 26 3.3736 0.76520 0.15007 3.0646 3.6827 1.33 4.83
Wholesale and
retail trade
29 4.1319 0.76916 0.14283 3.8393 4.4244 2.50 5.00
Others 2 3.0833 0.35355 0.25000 �0.0932 6.2599 2.83 3.33
Total 57 3.7492 0.84651 0.11212 3.5246 3.9738 1.33 5.00
Sum of squares d.f. Mean square F Significant
Between groups 8.801 2 4.400 7.585 0.001
Within groups 31.328 54 0.580 — —
Total 40.129 56 — — —
Table 12: The effect of sales volume on managing economic exposure risk
Sales volume N Mean Standard
deviation
Standard
error
95% confidence interval for mean Minimum Maximum
Lower bound Upper bound
o3m 16 4.3905 0.88562 0.22141 3.9186 4.8624 1.33 4.86
3–o6m 17 3.4529 0.57337 0.13906 3.1581 3.7477 2.00 4.17
6–o9m 9 3.1296 0.41481 0.13827 2.8108 3.4485 2.50 4.00
9–o12m 4 3.3917 0.23154 0.11577 3.0232 3.7601 3.20 3.67
13–o15m 2 3.4286 0.60609 0.42857 �2.0169 8.8741 3.00 3.86
15m or more 4 3.2500 0.44096 0.22048 2.5483 3.9517 2.83 3.83
Total 52 3.6642 0.79678 0.11049 3.4424 3.8860 1.33 4.86
Sum of squares d.f. Mean square F Significant
Between groups 12.865 5 2.573 6.065 0.000
Within groups 19.513 46 0.424 — —
Total 32.378 51 — — —
212 Al-Momani and Gharaibeh

(2) The effect of firm sector on managing economic
exposure risk
H06: There is a significant statistical relationship
between industry groupings and management
practices and economic exposure in the
Jordanian environment.
Table 13 shows that there is a significant
statistical relationship between sector of a firm
and its management of economic exposure. The
significant level of 0.001 asserts this relationship
and H06 is substantiated.
The results show that the strongest attitude
toward adopting the managerial techniques was
for wholesale and retail trade, as the mean is
4.13. This is followed by manufacturing, with a
mean of 3.37.
(3) The effect of international involvement on
managing economic exposure
In this section, we tested the following
hypothesis:
H07: There is a significant statistical relationship
between international business activity level and
Table 14: Percentage of foreign sales to total sales effect on economic exposure currency risk
management
Percentage of
FS/TS
N Mean Standard
deviation
Standard
error
95% confidence interval for mean Minimum Maximum
Lower bound Upper bound
10 2 3.0000 0.00000 0.00000 3.0000 3.0000 3.00 3.00
20 3 3.0000 0.60093 0.34694 1.5072 4.4928 2.50 3.67
30 3 3.0556 1.49381 0.86245 �0.6553 6.7664 1.33 4.00
40 9 3.4630 0.51301 0.17100 3.0686 3.8573 2.83 4.33
50 8 3.4000 0.89389 0.31604 2.6527 4.1473 2.00 4.83
60 2 3.2500 0.35355 0.25000 0.0734 6.4266 3.00 3.50
70 6 3.5167 0.49610 0.20253 2.9960 4.0373 3.00 4.33
80 7 4.1327 0.91884 0.34729 3.2829 4.9824 3.00 4.86
100 6 3.7857 0.58902 0.24046 3.1676 4.4038 3.00 4.71
Total 54 3.6612 0.79521 0.10821 3.4441 3.8783 1.33 4.86
Sum of squares d.f. Mean square F Significant
Between groups 11.808 9 1.312 2.659 0.015
Within groups 21.708 44 0.493 — —
Total 33.515 53 — — —
Foreign exchange risk management practices by Jordanian nonfinancial firms 213

management practices and economic exposure in
the Jordanian environment.
As mentioned earlier, this characteristic is
measured using three variables. The results for
each variable are presented next.
(a) The effect of percentage of foreign sales to total sales
on economic exposure risk management
With significance value equalling 0.015, the
percentage of foreign sales to total sales has a
significant statistical relationship with the use of
management techniques. This is clearly shown in
Table 14.
(b) The effect of percentage of foreign costs to total costs
on economic exposure risk management
In addition, with significance value equalling
0.001, the percentage of the foreign costs to the
total costs has a significant relationship with the
use of management techniques. This is shown in
Table 15.
(c) The effect of percentage of foreign debt to total debt
on economic exposure risk management
Finally, the test of the relation between the
percentage of foreign debt to total debt and the
managerial actions toward economic exposure
reveal a significant statistical relationship. The
Table 15: Percentage of foreign costs to total costs effect on economic exposure risk
management
Percentage of
FC/TC
N Mean Standard
deviation
Standard
error
95% confidence interval for mean Minimum Maximum
Lower bound Upper bound
0 1 1.3333 — — — — 1.33 1.33
10 2 3.0833 1.53206 1.08333 �10.6817 16.8484 2.00 4.17
30 5 3.7095 0.81726 0.36549 2.6948 4.7243 2.83 4.71
40 10 3.9000 0.87206 0.27577 3.2762 4.5238 2.50 4.67
50 6 3.7119 0.78975 0.32241 2.8831 4.5407 2.50 4.57
60 3 3.3889 0.50918 0.29397 2.1240 4.6537 2.83 3.83
70 13 3.4916 0.41186 0.11423 3.2427 3.7405 3.00 4.33
80 9 3.3963 0.34859 0.11620 3.1283 3.6642 3.00 4.00
90 4 4.8571 0.00000 0.00000 4.8571 4.8571 4.86 4.86
100 1 4.8333 — — — — 4.83 4.83
Total 54 3.6612 0.79521 0.10821 3.4441 3.8783 1.33 4.86
Sum of squares d.f. Mean square F Significant
Between groups 15.007 9 1.667 3.964 0.001
Within groups 18.508 44 0.421 — —
Total 33.515 53 — — —
214 Al-Momani and Gharaibeh

significance figure is 0.008, which is
demonstrated in Table 16.
The results of the previous three tests assert
the acceptance of the relation between the
degree of international involvement of a firm
and its management of the economic exposure.
Therefore, H07 is substantiated. In addition, an
indication of a stronger attitude toward using the
managerial techniques moving to higher levels of
foreign sales, costs, and debts is seen by
reviewing the means.
(4) The effect of legal structure on foreign economic
exposure risk management
The hypothesis is as follows:
H08: There is a significant statistical relationship
between legal structure and management
practices and economic exposure risk in the
Jordanian environment.
The test was performed to ascertain whether
there is a relationship between the legal structure
of a firm (as a character) and the management
techniques used in handling economic exposure
risk. The results show a significant statistical
relationship under a significance level of 0.001.
Therefore, H08 is also accepted, as shown in
Table 17.
The results show that the strongest attitude
toward adopting the managerial techniques was
Table 16: Percentage of foreign debt to total debt effect on economic exposure risk
management
Percentage of
FD/TD
N Mean Standard
deviation
Standard
error
95% confidence interval for mean Minimum Maximum
Lower bound Upper bound
0 4 3.0000 0.00000 0.00000 3.0000 3.0000 3.00 3.00
10 2 3.0000 0.00000 0.00000 3.0000 3.0000 3.00 3.00
20 3 3.5079 0.45008 0.25985 2.3899 4.6260 3.00 3.86
30 8 3.5000 0.59040 0.20874 3.0064 3.9936 2.83 4.83
60 2 3.0833 0.35355 0.25000 �0.0932 6.2599 2.83 3.33
70 9 3.3444 0.47697 0.15899 2.9778 3.7111 2.50 4.00
80 2 4.2738 0.62293 0.44048 �1.3230 9.8706 3.83 4.71
90 5 4.6667 0.00000 0.00000 4.6667 4.6667 4.67 4.67
Total 58 3.7535 0.83970 0.11026 3.5327 3.9743 1.33 5.00
Sum of squares d.f. Mean square F Significant
Between groups 13.170 8 1.646 2.985 0.008
Within groups 27.020 49 0.551 — —
Total 40.190 57 — — —
Foreign exchange risk management practices by Jordanian nonfinancial firms 215

for partnerships, as the mean is 4.54. This is
followed by limited liabilities firms, with a mean
of 3.97 and private and public shareholdings
firms, with means of 3.60 and 3.19, respectively.
Usage levels of different managerial
techniques by Jordanian firms
Other results describe the usage levels of each
foreign currency risk management technique in
each dimension, that is, transaction and
economic exposures. Tables 18 and 19 show the
means and standard deviations for each
technique.
Techniques to deal with transaction exposure
were classified in terms of sophistication level
into three groups. The highest sophisticated level
in terms of cost and risk is that of derivatives,
which are forward, future, options, and swap
contracts. The low value of mean of the various
hedging techniques suggests a low usage level of
these techniques by firms. Forward contracts had
the highest mean relative to this group, with
3.32.
The second group, which has a relatively
moderate risk and cost hedging level, is short-
term borrowing and deposit. A stronger attitude
toward using these techniques is indicated by the
higher means in the table, with 3.40 for the
short-term deposits and 3.57 for short-term
borrowing.
Finally, the last group of techniques, in which
the management hedges the cost and risk
internally, without involving a third party, is
considered the least sophisticated. The technique
with the highest level of usage is the pricing
policy, with a mean of 4.61, followed by the
domestic currency, with 4.50. The technique
Table 17: Legal structure effect on economic exposure risk management
Legal structure N Mean Standard
deviation
Standard
error
95% confidence interval for mean Minimum Maximum
Lower bound Upper bound
Public shareholding 16 3.1979 0.53451 0.13363 2.9131 3.4827 2.00 4.17
Private shareholding 6 3.6000 0.58310 0.23805 2.9881 4.2119 2.83 4.33
Partnership 7 4.5476 0.71824 0.27147 3.8834 5.2119 3.50 5.00
Limited liability 27 3.9730 0.84504 0.16263 3.6387 4.3073 1.33 4.86
Private company 1 2.5000 — — — — 2.50 2.50
Total 57 3.7609 0.84527 0.11196 3.5366 3.9852 1.33 5.00
Sum of squares d.f. Mean square F Significant
Between groups 12.364 4 3.091 5.814 0.001
Within groups 27.647 52 0.532 — —
Total 40.011 56 — — —
216 Al-Momani and Gharaibeh

with the least usage in that group is netting, with
a mean of 3.50.
Generally, the results show that the higher the
sophistication level of the technique in terms
of risk and cost, the lower the level of usage.
Table 19 shows the usage level of techniques to
deal with economic exposure. The technique
with the highest usage level, with a mean of
4.71, is altering the currency, in which the
production cost occurs, following movements in
Table 18: Level of using the following hedging instrument to manage foreign exchange risk
(transaction exposure)
Hedging instrument Mean N Standard deviation
Forward contracts 3.32 34 1.28
Future contracts 3.25 25 1.10
Option contracts 3.17 18 1.35
Swap contracts 3.00 17 0.98
Short-term borrowing 3.57 23 1.04
Short-term deposits 3.40 23 1.40
Pricing policy 4.61 31 0.77
Using domestic currency 4.50 25 1.00
Netting 3.50 23 1.10
Leading and lagging 3.61 17 1.08
Matching 4.11 24 1.05
Other methods 4.35 4 1.22
Table 19: Level of using the following hedging instrument to manage foreign exchange risk
(economic exposure)
Hedging technique Mean Standard
deviation
Sourcing inputs in the same currencies as sales are made 3.27 1.25712
Altering the currency from which inputs are sourced, following
movement in foreign exchange rates
3.45 1.24025
Altering the currency in which production occur, following
movements in foreign exchange rates
4.71 0.75020
Foreign currency denominated debt 3.75 1.21873
Diversifying sales in many different currencies 3.72 1.11496
Long-term derivatives 3.32 1.09515
Foreign exchange risk management practices by Jordanian nonfinancial firms 217

foreign exchange rates. Foreign currency
denominated debt and diversifying sales in many
different currencies, with means of 3.75 and
3.72, respectively. Altering the currency from
which inputs are sourced following movement
in foreign exchange rates had a mean of 3.45.
Finally, the use of long-term derivatives and the
technique of sourcing inputs in the same
currencies as those in which sales are made had
the lowest means, with 3.32 and 3.27,
respectively.
Reasons behind not using the managerial
techniques by Jordanian firms
Firms were asked about the reasons behind not
using the different techniques mentioned in the
questionnaire.
The results for the transaction dimension
are presented in Table 20. It is clear that the
majority of the respondents (33.4 per cent)
consider complexity and lack of experience
to be two of the problems that stand against
adopting some of the techniques. 35.6 per cent
Table 20: The reasons behind not using one or more of the managing techniques (transaction
exposure)
Reason Frequency Valid %
Too complex and there is no trained staff to deal with this
kind of risk
15 33.4
Not allowed 5 11.1
Instruments are not available 6 13.3
Not logical to manage foreign exchange risk 3 6.6
Other reasons 16 35.6
Total 45 100.0
Table 21: The reasons behind not using one or more of the managing technique (economic
exposure)
Reason Frequency Valid %
Instruments are not available 8 14.5
Too complex and there is no trained staff to deal with this risk 4 7.3
Not allowed 7 12.7
Not logical to manage foreign exchange risk 3 5.5
The pegged JD to the US dollar gave the firm a stable position 33 60.0
Total 55 100.0
218 Al-Momani and Gharaibeh

of respondents stated other reasons for not
using the techniques: the majority answered
that their transactions have a certain stability
due to the Jordanian dinar being pegged to the
US dollar. Others added that as they gain from
the volatility of currency they accept a certain
level of loss, otherwise the firm limits that
loss through reflecting the differences to the
prices. 11.1 per cent of the respondents said
they do not use the techniques simply because
they do not have the authority to do so,
while 13.3 per cent believe that those
instruments do not exist or are not available.
In this section, the implied instruments
are the derivatives because the other instruments
are natural and do not need a second party in
order to use them. Finally, 6.6 per cent of
respondents said they do not believe in the
rationality behind managing transaction
exposure.
The same questions were asked again but they
this time were concerned with the reasons
behind not using the different techniques to
manage economic exposure. The results are as
shown in Table 21.
The pegging of the Jordanian dinar to
the US dollar gives stability to firms toward
the movement of the currencies. The majority
of respondents therefore believe there is no need
to act to this exposure.
In addition, the results show that 14.5 per cent
of respondents believe that the instruments are
not available in the Jordanian environment. 7.3
per cent believe that using these techniques is
overly complex and that staff lack the experience
to use them. On the other hand, 12.7 per cent of
respondents do not use the techniques because
they do not have the authority to do so. Finally,
5.5 per cent do not believe in the relevance of
managing foreign currency risk.
CONCLUSIONS
Motivated by the fact that foreign currency risk
becomes more and more important in the light
of the globalisation and internationalisation, this
study was conducted in order to gain insight into
the management of foreign currency risk by
Jordanian firms. In addition, it examined the
impact of firm-specific characteristics and their
relationship with the managerial techniques used
to face that risk with respect to two dimensions:
transaction and economic exposures. The
specific factors of a firm included size, sector,
legal structure, and international involvement.
The results of the questionnaire give an idea
about Jordan’s economic environment in terms
of comprehension, exposure, and management
of foreign currency risk.
Evidence from the analysis shows that 66
per cent of the firms do manage their foreign
currency risk. The majority of the firms rely,
however, on natural hedging techniques, and the
use of more sophisticated techniques such as
financial derivatives is not common practice by
Jordanian firms.
The lack of knowledge in managers and other
staff members in management is one of the
major obstacles for the use of the techniques.
Some firms do not believe in the relevance of
their exposure to foreign currency risk. Others
believe that financial derivatives are not available
in the Jordanian market. Financial derivatives do,
however, exist in some major Jordanian banks.
The great majority of firms considered the
pegged Jordanian dinar to the US dollar one of the
reasons that gave their foreign transactions a certain
level of stability, since both currencies move in the
same direction with approximately the same
proportion. Dealing with other currencies that are
subject to volatility in their exchange rates respect
Foreign exchange risk management practices by Jordanian nonfinancial firms 219

to the Jordanian dinar as the euro needs substantial
effort to manage.
Concerning the firm-specific characteristics
and their hypothesised relationship to the
management of transaction exposure dimension,
this study shows that there is no relationship
between a firm size and the management
practices toward transaction exposure. The same
result was shown for a firm’s legal structure.
The relationship between a firm’s different
sectors and the hedging techniques used was
significant, and the highest attitude was in the
manufacturing sector. The study also found that
a firm’s international involvement and
management practices positively correlated.
On the other hand, the results concerning
the firm-specific characteristics and their
relationship to the managerial techniques used
toward economic exposure were as follows:
Firm size negatively correlated to the
management practices. This result could be
attributed to the fact that larger firms have less
flexibility to act toward economic exposure. The
operational hedging techniques are expensive
and risky because they involve a large amount of
resources. Shifting the industry from one
currency to another is one example for
techniques that need to adopt major resources.
In addition, larger firms may be engaged in
long-term contracts that take into consideration
the foreign currency volatility risk.
The evidence also found a correlation
between a firm’s sector and its management
practices: commercial firms had the strongest
attitude toward managing economic exposure.
Moreover, a relationship between the legal
structure of a firm and its management to
economic exposure was found to be significant.
Partnerships seemed to have a higher adoption
rate of the managerial techniques than other
types of entities. This can be attributed to the
fact that the owners of a firm have more motive
and authority to make decisions involving
business than managers in other legal structures.
A firm’s degree of international involvement
and its management practices positively
correlated.
RECOMMENDATIONS
Based on the results of the study, some
recommendations are stated as follows:
(1) Proper training programmes should be
conducted for financial managers in order
to enhance their knowledge about the
importance of foreign currency risk and
the different techniques used to manage
that risk.
(2) Many of the Jordanian firms attributed the
absence of the hedging techniques in their
firms to the exchange rate policy of the
CBJ (Central Bank of Jordan). This policy
gives firms a stable position toward the
JD/$US exchange rate changes. Jordanian
firms must, however, be conscious of the
fact that the JD may be floated against the
US dollar in the future. In this case, the
magnitude of the foreign currency
exposure will be very high and will need
effective foreign currency risk management
practices.
(3) Banks and other financial firms should play
a vital role in handling of risk management
issues. Financial derivatives should be
offered and promoted more. In addition,
consulting services should be provided to
manage such risk.
(4) Specialised financial firms that offer a wide
range of financial instruments to hedge
220 Al-Momani and Gharaibeh

foreign currency risk and that also provide
well-experienced staff familiar with
Jordan’s economic environment should be
established. Furthermore, the experiences
of such specialised firms in developed
countries must be benefited from.
References and Notes
1 Jonuska, M. and Samenaite, I. (2003) ‘Foreign
Exchange Risk Management in Lithuanian Economy:
The Use of Currency Derivatives’, Published Master
Thesis, Stockholm School of Economics in Riga,
Available online.
2 Allayannis, G., Brown, G. and Klapper, L. (2001)
‘Exchange Rate Risk Management Evidence from East
Asia’, Policy Research Working Paper, No. 2606,
The World Bank, Available online: http://
www-wds.worldbank.org/external/default/
WDSContentServer/IW3P/IB/2001/06/15/
000094946_01060604005427/Rendered/PDF/
multi0page.pdf.
3 Karasoy, A. (1995) ‘Management of Exchange Rate
Risk in Turkish Banking Sector: A Model and Tests’,
Discussion Paper, No. 9602, Central Bank of the
Republic of Turkey, Available online: http://
www.tcmb.gov.tr/research/discus/9602eng.pdf.
4 Bradley, K. and Moles, P. (2001) ‘The Effects of
Exchange Rate Movements on Non-financial UK
Firms’, International Business Review, Vol. 10,
pp. 51–69.
5 El-Masry, A. (2003) ‘The Exchange Rate Exposure of
UK Non-financial Companies: Industry Level Analysis’,
Journal of Managerial Finance, Vol. 32, No. 2, pp. 115–136.
6 Fang, W. and Miller, S. (2004) ‘Exchange Rate
Depreciation and Exports: The Case of Singapore’,
Working Paper, No. 2004-45, University of
Connecticut, Available online: http://www.
econ.uconn.edu/working/2004-45.pdf.
7 Belk, P.A and Glaum, M. (1990) ‘The Management of
Foreign Exchange Risk in UK Multinationals: An
Empirical Investigation’, Accounting and Business
Research, Vol. 21, No. 81, pp. 3–13.
8 Batten, J., Mellor, R. and Wan, V. (1993) ‘Foreign
Exchange Risk Management Practices and Products
Used by Australian Firms’, Journal of International
Business Studies, Vol. 25, pp. 557–573.
9 Brucaite, V. and Yan, S. (2000) ‘Financial Risk
Management — Case Studies with SKF and Elof
Hansson’, Published Master Thesis, Goteborg
University, Available online: http://www.
handels.gu.se/epc/archive/00001538/01/
Brucaite_200014.pdf.
10 Dhanani, A. and Groves, R. (2001) ‘The Management
of Strategic Exchange Risk: Evidence from Corporate
Practices’, Accounting and Business Research, Vol. 31,
No. 4, pp. 275–290.
11 Popov, V. and Stutzmann, Y. (2003) ‘How is
Foreign Exchange Risk Managed? An Empirical
Study to Two Swiss Companies’, Published Master
Thesis, University of Lausanne, Available online:
http://www.hec.unil.ch/cms_mbf/master_thesis/
0314.pdf.
12 Company statistics. Main Economic Sectors, Jordan
Companies Control Department, Available online:
www.ccd.gov.jo.
Foreign exchange risk management practices by Jordanian nonfinancial firms 221