foreign exchange exposure: evidence from the u.s. … · · 2018-03-21foreign exchange exposure:...
TRANSCRIPT
Foreign exchange exposure: evidence from the U.S. insurance industry
Donghui Lia,∗, Fariborz Moshiriana , Timothy Weeb and Eliza Wua
a School of Banking and Finance, The University of New South Wales, Sydney, Australia
bEquity capital markets, Citigroup Global Markets Asia Ltd, Hong Kong
This version: 6 January 2008
Abstract We study the foreign exchange exposure of US insurers. The evidence shows that no systematic difference exists in the currency risk profiles of life and non-life segments within the insurance industry. This suggests that life and non-life insurers have similar risk exposure management strategies arising from similar risk pooling and financial intermediary functions. The empirical results reveal that a sizable proportion of U.S. insurers are exposed to foreign exchange movements against the seven largest U.S. trade partners in insurance services (U.K., Japan, Switzerland, Netherlands, France, Germany and Canada). Significant operational and size effects are also documented and we find that the frequency of foreign exchange exposure increases with time horizon. JEL Classification: G22 ; F31 Keywords: Insurance; financial services; foreign exchange exposure; currency risk management
∗Corresponding author. Tel.: +61 2 93855859; fax: + 61-2-93856347. E-mail addresses: [email protected] (D. Li), [email protected] (F. Moshirian), [email protected] (T.Wee), [email protected] (E.Wu).
2
1. Introduction
With the continued liberalization of international financial markets and the proliferation of
trade in financial services, international insurance services are becoming increasingly important.
Within the area of international financial services, the importance of detecting and measuring
foreign exchange exposure for international risk management strategies is increasingly being
recognized. Thus, we focus this study on the foreign exchange risk exposure of the US insurance
industry, a key provider of international insurance services.
The existing multinational foreign exchange exposure literature centers on the impact of
currency volatility on international trade, firm value and the use of derivatives and operational
hedging strategies. For international financial services, besides the study by Li, Moshirian and
Sim (2003) that discusses factors that contribute to the expansion of international trade in
insurance services without reference to foreign exchange volatility, the current literature is
concentrated around banks (for example, Choi and Elyasiani (1997), Chamberlain et al. (1997)
and Martin and Mauer, 2003)) and far less attention has been devoted to non-bank financial
institutions, such as insurance companies. This is alarming given that it is recognized that there
are potentially different impacts of currency exposure between financial and non-financial firms
(see Allayannis and Weston (2001)).
The few existing studies examining foreign exchange risk faced by insurers focus more on
the use of derivative instruments for hedging and risk management and its determinants (Colquitt
and Hoyt (1997), Hentschel and Smith (1997) and Cummins, Phillips and Smith (2001)) rather
than specifically looking at the area of currency risk exposure. Foreign exchange risk is one of
the many risks that U.S. insurers face. With the increased internationalization of insurance
operations, insurers have begun to undertake greater investments in foreign securities, either as a
3
means of realizing portfolio diversification benefits or to hedge foreign liabilities. Thus,
detecting foreign exchange exposure in the U.S. insurance industry provides an important
starting point in identifying the determinants of exchange rate risk exposure and for evaluating
the impact of currency risks within international insurance services. This paper contributes to the
literature by providing, for the first time, direct evidence documenting the extent of foreign
exchange exposure in the insurance industry and specifically its life and non-life insurance
segments.
Unlike previous aggregated studies on non-financial multinational firms (see Jorion
(1990), Bodnar and Gentry (1993) and Chow, Lee and Solt (1997b)) that may not account for
firm-specific trade linkages, this paper conducts individual firm level estimations to avoid the
averaging effects arising from the grouping of firms across different industries.1 Khoo (1994)
and Choi and Prasad (1995) also point out that the significance level of currency risk exposure
decreases when calculated at a portfolio level. Furthermore, aggregation of firms implicitly
assumes that there is no heterogeneity within the group. This potentially disguises firm-specific
information such as operational and managerial differences, making the identification of
significant currency exposure difficult and highly biased (Bartov and Bodnar (1994)).
Furthermore, the potential estimation errors arising from investors’ mispricing of currency
exposure in stock returns is avoided by employing a cash flow based approach that can minimize
the noise in foreign exchange exposure detection. Moreover, using a cash flow based
methodology significantly contributes to the area of foreign exchange exposure management
since a major reason firm managers seek to manage currency risk comes from their desire to
control cash flow volatility (Bodnar et al. (1998)).
1 More recently, Muller and Verschoor (2006, 2007a,b) examined foreign exchange exposure using individual firms within different industries to avoid the averaging effects across industries whilst providing a detailed comparison of the extent of foreign exchange risk exposures in different industries and regions.
4
We find that there are no systematic differences in the foreign exchange risk profiles
between life and non-life insurers. This demonstrates that both life and non-life insurers’ finance
and investment incomes are influenced by exchange rate uncertainty. This also suggests that life
and non-life insurers have similar risk management strategies arising from similar risk pooling
and financial intermediary functions. The empirical results reveal that a sizable proportion of
U.S. insurers are exposed to foreign exchange movements to the seven largest U.S. trade partners
in insurance services (these are: the U.K., Japan, the Netherlands, Switzerland, France, Germany
and Canada according to the Bureau of Economic Analysis (2003) Survey of Current Business).
We find the presence of both an operational effect and a size effect, suggesting that the
geographic diversity of multinational insurers and their firm size correlates with increased
hedging activity. This paper also finds that the frequency of foreign exchange exposure increases
with the time horizon, thus corroborating with the idea that multinational firms prefer to use
currency derivatives to hedge shorter-term transactional exposure over the longer-term economic
exposure that is harder to assess.
The rest of this paper is organized as follows. Section 2 introduces the methodology used
for detecting foreign exchange exposure across insurance firms. In Section 3, the empirical
hypotheses are discussed. Section 4 details the data and sample used and Section 5 reports the
main findings. Finally, conclusions are made in Section 6.
2. Methodology to detect foreign exchange exposure
Most of the existing US and non-US studies examine foreign exchange exposure relative to
firm value, as measured by stock price returns (see Jorion (1990), Bodnar and Gentry (1993),
5
Bartov and Bodnar (1994), Choi and Prasad (1995), He and Ng (1998), Bartram (2004), Muller
and Verschoor (2006, 2007a,b) and references therein). This induces potential estimation
difficulties in detecting foreign exchange exposure should investors not price the currency
exposure correctly. This is made even more difficult given the asymmetry in information
between corporate insiders and outsiders. The use of unanticipated operating income avoids this
potential problem; additionally, it models the unexpected component of cash flows that would be
due to foreign exchange volatility, which is the basis of foreign exchange exposure management
by multinational firms’ managers.
This study employs a two-step OLS regression approach to estimate the extent to which
U.S. insurance companies exhibit exchange rate exposure. The unanticipated operating income
for each firm and the foreign exchange variable are first estimated using a seasonal random walk
model and a log linear model respectively to remove potentially confounding effects on the
exchange rate-cash flow relationship. These variables are then used in the main estimation model
following the Almon (1965) distributed lag technique to find the frequency of detecting
significant exchange rate exposures in insurers.
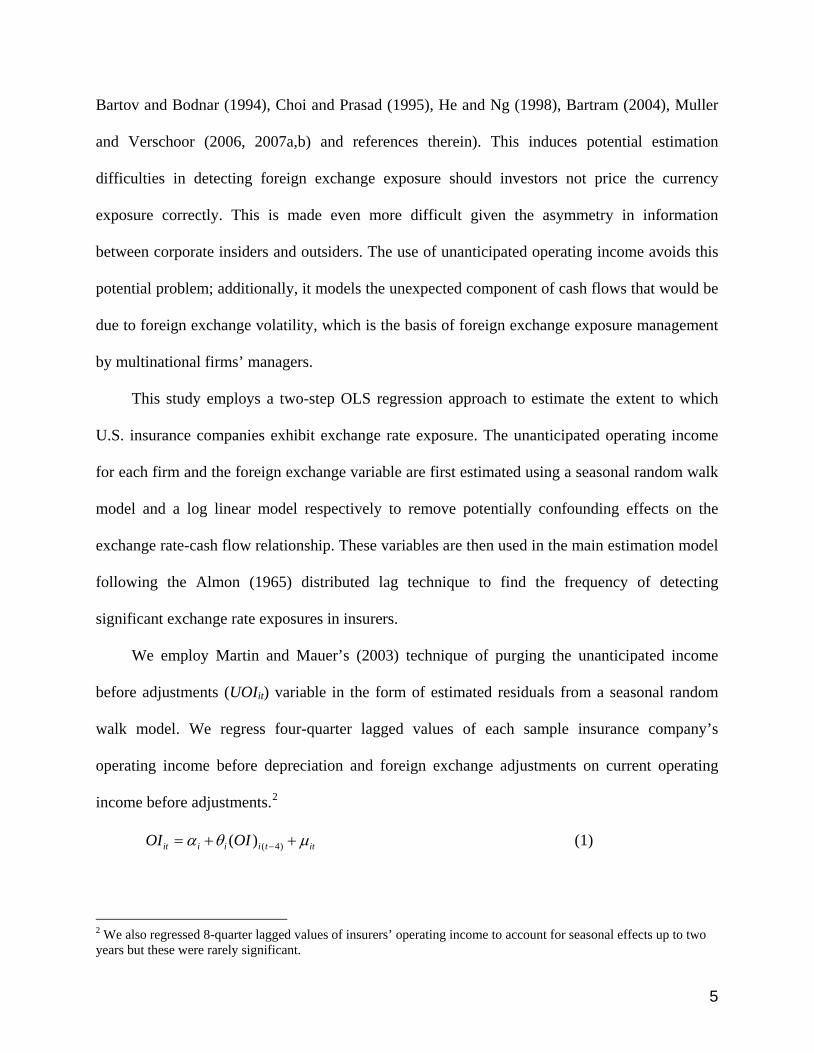
We employ Martin and Mauer’s (2003) technique of purging the unanticipated income
before adjustments (UOIit) variable in the form of estimated residuals from a seasonal random
walk model. We regress four-quarter lagged values of each sample insurance company’s
operating income before depreciation and foreign exchange adjustments on current operating
income before adjustments.2
ittiiiit OIOI µθα ++= − )4()( (1)
2 We also regressed 8-quarter lagged values of insurers’ operating income to account for seasonal effects up to two years but these were rarely significant.
6
Where αi is the mean of the seasonal difference for insurer i, which is the average annual trend
in the data and is assumed to be constant. This seasonal trend model is a special case of an
Autoregressive Integrated Moving Average (ARIMA) model where there is only one order of
seasonal differencing, a constant and no other parameters. Because of the nature of the seasonal
specification, one significant advantage of such a model is that it is relatively stable and will not
be affected by sudden changes in the data within a one year period. The residuals (μit) divided by
the standard deviation form UOIit, the standardized unanticipated operating income variable
which is used in the estimation model.
The OIit variables for all insurance companies are first tested for the presence of unit roots.
This ensures the stationarity of the residuals and consequently the UOIit variables. Doing so
protects the formalized estimation model from having spurious regression results. Where a
company exhibits non-stationary OIit, the first difference of the OIit variable in equation 1 is used
instead. Since the unanticipated component of operating income (i.e. the residuals of equation 1)
is what this stage is estimating, doing so does not change our interpretation of the residuals for
the first difference model, thus ensuring consistency across the whole sample of insurance
companies.
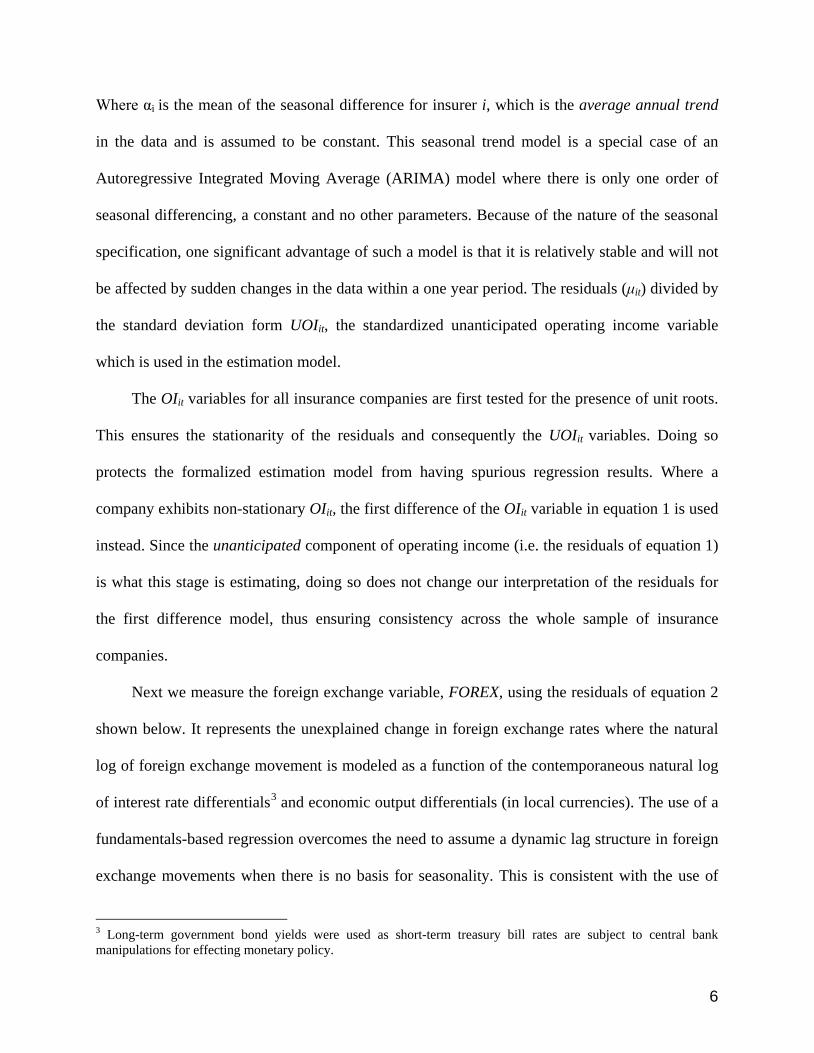
Next we measure the foreign exchange variable, FOREX, using the residuals of equation 2
shown below. It represents the unexplained change in foreign exchange rates where the natural
log of foreign exchange movement is modeled as a function of the contemporaneous natural log
of interest rate differentials3 and economic output differentials (in local currencies). The use of a
fundamentals-based regression overcomes the need to assume a dynamic lag structure in foreign
exchange movements when there is no basis for seasonality. This is consistent with the use of
3 Long-term government bond yields were used as short-term treasury bill rates are subject to central bank manipulations for effecting monetary policy.
7
unanticipated change in exchange rates in the existing literature (see Jorion (1990), Chow, Lee
and Solt (1997a and 1997b) and Martin and Mauer (2003)) and provides a suitable basis for
examining the effects on insurance firms. We estimate the following model4:
( ) ( )1 2( )jt jt jt jt jt jt jtLOG FX a LOG IR LOG OP FOREXφ φ= + + + (2)
Where,
)1(,.
,.
)1(
,.
)1(
−
−
−
=
=
=
tSU
tSU
tj
jt
jt
tSU
jtjt
tj
jtjt
GDPGDP
GDPGDP
Op
INTINT
IR
EE
FX
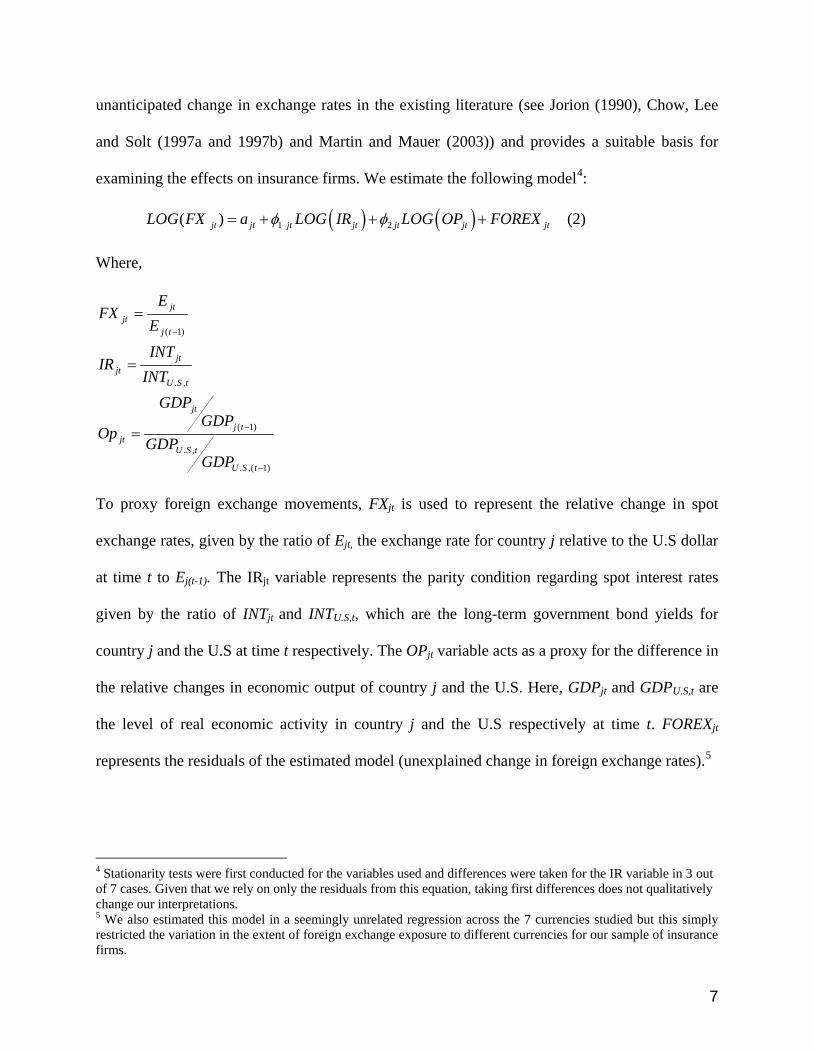
To proxy foreign exchange movements, FXjt is used to represent the relative change in spot
exchange rates, given by the ratio of Ejt, the exchange rate for country j relative to the U.S dollar
at time t to Ej(t-1). The IRjt variable represents the parity condition regarding spot interest rates
given by the ratio of INTjt and INTU.S,t, which are the long-term government bond yields for
country j and the U.S at time t respectively. The OPjt variable acts as a proxy for the difference in
the relative changes in economic output of country j and the U.S. Here, GDPjt and GDPU.S,t are
the level of real economic activity in country j and the U.S respectively at time t. FOREXjt
represents the residuals of the estimated model (unexplained change in foreign exchange rates).5
4 Stationarity tests were first conducted for the variables used and differences were taken for the IR variable in 3 out of 7 cases. Given that we rely on only the residuals from this equation, taking first differences does not qualitatively change our interpretations. 5 We also estimated this model in a seemingly unrelated regression across the 7 currencies studied but this simply restricted the variation in the extent of foreign exchange exposure to different currencies for our sample of insurance firms.
8
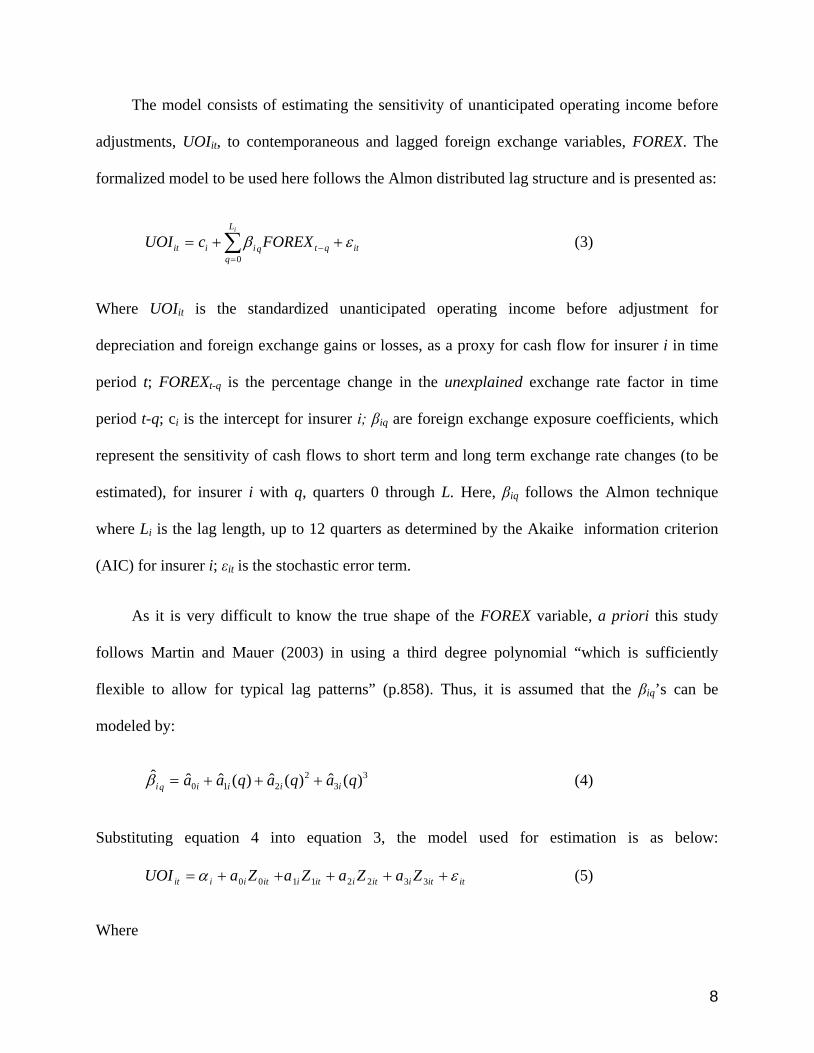
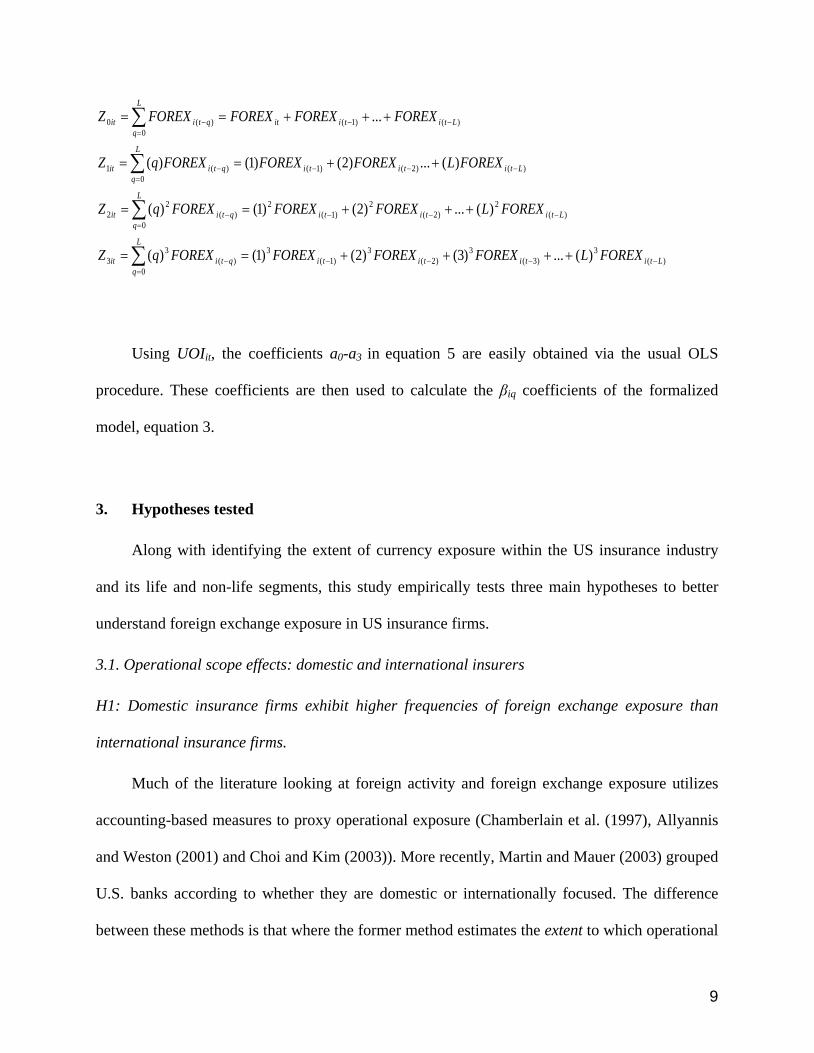
The model consists of estimating the sensitivity of unanticipated operating income before
adjustments, UOIit, to contemporaneous and lagged foreign exchange variables, FOREX. The
formalized model to be used here follows the Almon distributed lag structure and is presented as:
∑=
− ++=iL
qitqtqiiit FOREXcUOI
0εβ (3)
Where UOIit is the standardized unanticipated operating income before adjustment for
depreciation and foreign exchange gains or losses, as a proxy for cash flow for insurer i in time
period t; FOREXt-q is the percentage change in the unexplained exchange rate factor in time
period t-q; ci is the intercept for insurer i; βiq are foreign exchange exposure coefficients, which
represent the sensitivity of cash flows to short term and long term exchange rate changes (to be
estimated), for insurer i with q, quarters 0 through L. Here, βiq follows the Almon technique
where Li is the lag length, up to 12 quarters as determined by the Akaike information criterion
(AIC) for insurer i; εit is the stochastic error term.
As it is very difficult to know the true shape of the FOREX variable, a priori this study
follows Martin and Mauer (2003) in using a third degree polynomial “which is sufficiently
flexible to allow for typical lag patterns” (p.858). Thus, it is assumed that the βiq’s can be
modeled by:
33
2210 )(ˆ)(ˆ)(ˆˆˆ qaqaqaa iiiiqi +++=β (4)
Substituting equation 4 into equation 3, the model used for estimation is as below:
ititiitiitiitiiit ZaZaZaZaUOI εα +++++= 33221100 (5)
Where
9
)(3
)3(3
)2(3
)1(3
0)(
33
)(2
)2(2
)1(2
0)(
22
)()2()1(0
)(1
)()1(0
)(0
)(...)3()2()1()(
)(...)2()1()(
)(...)2()1()(
...
Ltitititi
L
qqtiit
Ltititi
L
qqtiit
Ltititi
L
qqtiit
Ltitiit
L
qqtiit
FOREXLFOREXFOREXFOREXFOREXqZ
FOREXLFOREXFOREXFOREXqZ
FOREXLFOREXFOREXFOREXqZ
FOREXFOREXFOREXFOREXZ
−−−−=
−
−−−=
−
−−−=
−
−−=
−
++++==
+++==
++==
+++==
∑
∑
∑
∑
Using UOIit, the coefficients a0-a3 in equation 5 are easily obtained via the usual OLS
procedure. These coefficients are then used to calculate the βiq coefficients of the formalized
model, equation 3.
3. Hypotheses tested
Along with identifying the extent of currency exposure within the US insurance industry
and its life and non-life segments, this study empirically tests three main hypotheses to better
understand foreign exchange exposure in US insurance firms.
3.1. Operational scope effects: domestic and international insurers
H1: Domestic insurance firms exhibit higher frequencies of foreign exchange exposure than
international insurance firms.
Much of the literature looking at foreign activity and foreign exchange exposure utilizes
accounting-based measures to proxy operational exposure (Chamberlain et al. (1997), Allyannis
and Weston (2001) and Choi and Kim (2003)). More recently, Martin and Mauer (2003) grouped
U.S. banks according to whether they are domestic or internationally focused. The difference
between these methods is that where the former method estimates the extent to which operational
10
scope impacts on foreign exchange exposure, the latter allows us to identify systematic
differences in the type (domestic versus international) of operations rather than the scope.
Chamberlain et al. (1997) look at cross-sectional determinants of U.S. banks’ foreign
exchange exposure estimates using accounting-based measures of currency risk. To proxy
operational scope and hence foreign activity, they use net foreign assets and find a negative
correlation with the estimated foreign exchange exposure coefficients. This implies that the
larger the short foreign currency position, the greater the foreign exchange exposure. Allayannis
and Weston (2001) classify firms into two samples depending on the existence of foreign sales.
They find that for the firms with foreign sales, users of foreign currency derivatives do exhibit
higher mean and median levels of Tobin’s Q, reflecting higher firm values. Allayannis et al.
(2001) further find that firms with greater geographical scope tend to use more financial rather
than operational hedges, implying lower levels of foreign exchange exposure for international
firms compared to domestic firms.
In terms of operational scope, conventional wisdom would suggest that internationally
focused firms would face foreign exchange exposure whereas domestic firms would not - this
may be true for direct exposure. When indirect exposure to foreign exchange is considered,
domestic firms may also be faced with foreign exchange exposure. These include the competitive
effects of foreign firms, and an indirect cost exposure should the supplier of a domestic firm be
exposed to direct foreign currency movements and pass on cost increases arising from a negative
movement in exchange rates. Hentschel and Smith (1997), Chamberlain et al. (1997) and Martin
and Mauer (2003) agree that insurance companies and banks are indeed exposed to such indirect
influences. This exposure arises from the nature of their assets, which are particularly sensitive to
insolvency risk and could be dependent on the level of foreign exchange exposure.
11
The existing literature suggests that foreign exchange movements do have an impact on
domestic companies (Jorion (1990) and Martin and Mauer (2003)). In particular, Martin and
Mauer (2003) find that U.S. domestic banks exhibit more foreign exchange exposure than U.S.
international banks. This supports the hypothesis of international firms hedging more in light of
the more direct transactional and economic exposure that they face. Martin and Mauer (2003)
place the foreign exchange risk of US banks in the view of both direct and indirect exposures.
Where international insurers face both forms of exposure, domestic insurers are indirectly
exposed to adverse foreign exchange movements via channels such as the solvency of its
policyholders, reinsurance, and foreign competitive effects. Hence, we test whether the
frequencies of foreign exchange exposure are higher for domestic insurers than international
insurers.
3.2. Size effects and foreign exchange exposure
H2: Large (Small) insurers will exhibit lower (higher) frequencies of foreign exchange exposure
than small (large) insurers.
The premise behind the size effect of firms stems from them reaping the benefits of
economies of scale and scope to achieve informational and cost savings in foreign exchange
exposure management.
Chow, Lee and Solt (1997b) found that larger firms are better able to manage economic
exposure to foreign exchange fluctuations by implementing operational hedges. Unlike
transaction exposure management, this constitutes managing foreign currency inflows and
outflows such that the net exposed amount is minimized. They credit this to operating, financial
12
or informational scale economies that make it easier and more beneficial for larger firms to
undertake the hedge.
Nance, Smith and Smithson (1993) find that larger firms tend to hedge more. Allayannis
and Weston (2001) suggest that large non-financial firms are more likely to use currency
derivatives than small firms given the potentially large start up fixed costs of hedging. The
authors also find a positive relationship between currency derivative usage and firm value for
internationally oriented firms. This is consistent with the findings of Chamberlain et al. (1997)
where increased derivative usage leads to lower foreign exchange exposure.
For financial firms, the literature surrounding size and foreign exchange exposure remains
unclear. Chamberlain et al. (1997) find that the largest U.S. banks generally exhibit larger
foreign exchange exposures. This potentially stems from the role of many of these large banks as
dealers in derivative contracts (this is also potentially true for insurers as some also act as market
makers in derivatives) and suggests that the banks in their sample use their position as dealers in
derivatives to undertake speculative positions. Thus, their finding contradicts the traditional view
that larger derivative usage should correlate with lower foreign exchange exposure.
Specific to the insurance sector, Colquitt and Hoyt (1997) suggest that the size of an insurer
could potentially have a positive or negative effect on the use of derivatives. However, Cummins
et al. (2001) document that larger insurers participate more actively in derivative markets and
have more derivative holdings than smaller ones. They conclude that derivatives activities are
subject to scale economies in the insurance industry. Hence, informational economies and cost
economies of scale could lead to a positive relationship with insurers’ size and use of derivatives
(and they should be less exposed to foreign currency risks). On the other hand, smaller firms are
likely to face higher financial distress costs so they may have more incentives to hedge than
13
larger firms. Given that hedging reduces the volatility of firm value and the likelihood of facing
bankruptcy, the use of financial derivatives for hedging purposes may also be inversely related to
firm size.
Based on the majority of findings on the size effects in the hedging of foreign exchange
exposure, we hypothesize that large (small) insurers will exhibit lower (higher) frequencies of
foreign exchange exposure than small (large) insurers due to more (less) hedging activities
arising from informational and cost economies of scale in foreign exchange exposure
management.
3.3. Time horizon effects: short term and long term exposure
H3: Insurers exhibit more frequent (significant) long-term rather than short-term foreign
exchange exposures.
Chow, Lee and Solt (1997b) find that the foreign exchange exposure of the firms in their
sample increases with the time horizon. This is because the total impact of currency movements
on a firm’s future cash-flows can only be correctly evaluated by investors in the long run and it is
likely that investors will systematically make errors when assessing the impact of currency
movements on firm value in the short-run (see Muller and Verschoor (2006 and 2007b) for
further discussions). They also suggest this indicates short-term foreign exchange exposure
effects are mitigated by the use of short-term transaction exposure strategies comprising the use
of forwards, futures, swaps, options and other derivatives. As longer-term exposure is based
more on economic exposure management using operational hedges and is more difficult to
undertake, such exposure would thus be more pronounced. In a survey of Finnish Industrials,
Hakkarainen et al. (1998) also find that there exists a much greater propensity to hedge
transaction exposure over long-term economic exposure.
14
Nguyen and Faff (2003) document the existence of both long and short-term exposure for
Australian companies and link the time horizon nature of these exposures with the use of foreign
currency derivatives. Their findings show that Australian firms are generally more exposed to
long-term currency movements. They further find evidence that this in part could be due to the
increased effectiveness of foreign currency derivatives in managing short-term currency
movements over the longer-term economic exposure.
Hence, we expect insurers to show significantly more frequent long-term rather than short-
term foreign exchange exposures. Consistent with Martin and Mauer (2003), this study classifies
short-term exposure as those insurers with optimal lags of 4 quarters or less (< 1 year) and long-
term exposure as insurers with optimal lags of 8 or more (≥ 2 years) based on the AIC statistic of
the polynomial distribution model, equation 3.
4. Data and sample selection
Sample quarterly data between the years 1990 to 2003 are used in this study. Operating
incomes are obtained from the Research Insight database by COMPUSTAT. One of the reasons
why we have used data from COMPUSTAT is that it grasps the homogeneity of the operating
income measures of each firm across industries. The cash flow proxy used in this paper
according to COMPUSTAT, is defined as “Sales (net) minus Cost of Goods Sold and Selling,
General, and Administrative expenses before deducting Depreciation, Depletion and
Amortization”. The study by Martin and Mauer (2003) on foreign exchange exposures of US
banks also used COMPUSTAT as their source of data.6
6 We cross-checked the data with other data sources and verified that the relevant numbers are not quantitatively different.
15
Companies are identified according to their insurance GIC industry group code, and
comprise insurance brokers, life and health, multi-line, property-casualty, and reinsurance
companies. Under this classification, 210 companies are identified. In addition to the GIC
industry group classification, the insurance companies are filtered according to availability of
data; in this case, companies with more than 30 quarterly observations are used leaving 73 non-
broker insurers in the final sample.7 Exchange rate data (end of period)8, long-term government
bond yields and Gross Domestic Product (GDP) figures are taken from the International
Financial Statistics database9. For countries that switched to using the Euro in 1999 (France,
Germany and Netherlands), the exchange rates for these years are adjusted using the fixed
exchange rate between the Euro and the domestic currency as obtained from the European
Central Bank. To identify large companies versus small companies, the median asset value of
each company is considered and asset sizes of greater than US$1 billion are classified as large.10
Companies are also classified under domestic or international according to data from the
geographic segment of COMPUSTAT. For fiscal years ending after December 15, 1977, firms
are required to report geographic segment data. These firms must report information for
segments with assets, sales or profits that exceed 10 percent of consolidated totals. Where
foreign sales data is not available, these companies are classified as being domestically focused.
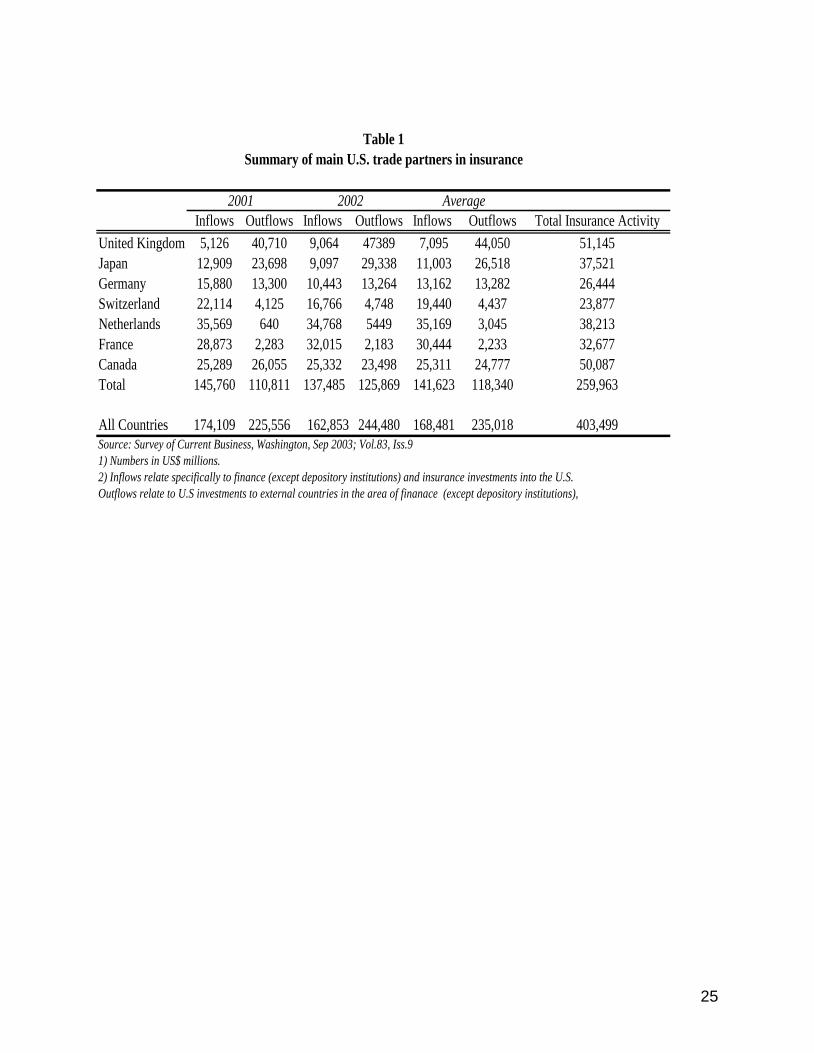
7 We excluded 11 insurance brokers with sufficient time-series data from our analysis as their business operations are substantially different from other insurance firms. 8 Following Chamberlain et al. (1997) and Martin and Mauer (2003), this study uses nominal exchange rates. According to Choi and Kim (2003), for industrialized countries, the random walk and efficient markets hypotheses make both real and nominal exchange rates acceptable. The exchange rates for the Netherlands, France and Germany are replaced with the euro from the beginning of 1999 corresponding with their adoption. 9 This is with the exception of France and Canada, where complete real GDP figures were unavailable. These figures are instead obtained from the OECD published Quarterly National Accounts available at www.sourceoecd.org. 10 This cutoff for large firms corresponds to the 47th percentile in our sample. As a robustness check, we also split the sample firms at the median and there were no qualitative differences in our results.
16
The currencies chosen for this study represent those of the main trading partners of the U.S.
in terms of FDI in insurance (see Table 1). Using a measure of insurance activity given by the
total average U.S inflows and outflows of FDI in insurance for the years 2002 and 2001, it can be
seen that the seven countries in this study make up more than 64.4 percent of total insurance
activity with the U.S. Out of this, outflows dominate inflows with these seven countries
accounting for a respectable 84.1 percent of overall outflows out of the U.S. This is in
comparison to the smaller but no less significant figure for average total inflows of 50.4 percent.
Globally, these markets represent almost 79 percent of world insurance premium, with the U.S.
market alone accounting for 38.1 percent.
<Insert Table 1>
5. Main findings
5.1. Overall results: all insurance companies
The main focus of this study is to investigate the pervasiveness of foreign exchange
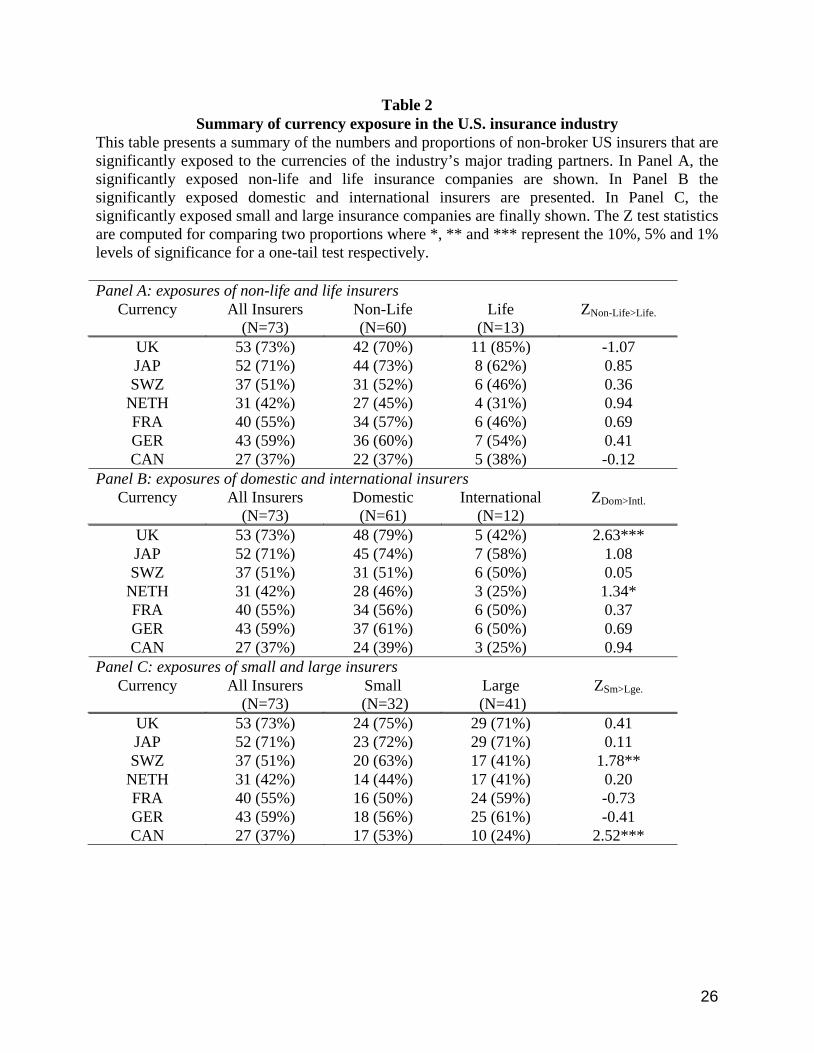
exposure among U.S. insurance companies. Table 2 reports the degree of significant foreign
exchange exposure for U.S. insurers. As can be seen, substantial proportions of US insurers are
exposed to foreign exchange exposure. Specifically, 73 percent are exposed to the British Pound,
71 percent to the Japanese Yen, 51 percent to the Swiss Franc, 42 percent to the Dutch Guilder,
55 percent to the French Franc, 59 percent to the Deutsche Mark and 37 percent to the Canadian
Dollar. Importantly, 100 percent of insurers studied are exposed to at least one of these
currencies. This is not surprising given that these currencies represent the seven most significant
trading partners with the U.S. in terms of insurance. The high frequency of foreign exchange
17
exposure further serves to highlight the importance of these currency values to the cash flows of
U.S. insurance companies. Compared to the banking literature, these frequencies are consistent
with Choi and Elyasiani (1997) but proportionately higher than Chamberlain et al. (1997), Choi
and Kim (2003) and Martin and Mauer (2003) amongst others. This suggests that among
financial institutions, operational and cash flow exposure is higher for insurance companies than
banks due to lower levels of financial and operational hedging. This result could also point to
other systematic differences in the risk management and hence, risk profiles of insurers and
banks.
<Insert Table 2>
5.1.1. Life and non-life insurers
In Table 2 Panel A, we find that the extent to which non-life and life insurers are
significantly exposed to all 7 currencies is actually quite similar. The two sample Z test of
population proportions is used to compare the exposures of life with non-life insurers. Despite
lower levels of specialization in non-life insurers, the results clearly indicate that their currency
exposure is not significantly greater than those of life insurers. This remains true in further
sample splits on the basis of operational focus - there are no statistically significant differences in
exposure proportions between domestic and international life and non-life insurers. Taken
together, the results suggest that the underlying transactional and operational exposures of life
and non-life insurers are in fact similar.
5.2. Operational scope effects
In comparing domestic with international insurers in Panel B of Table 2, we find that
domestic insurers do show statistically more frequent foreign exchange exposures than
international insurers to the British Pound and Dutch Guilder. This is consistent with the findings
18
of Allayannis and Weston (2001) and Martin and Mauer (2003), and suggests that insurers with
greater international operational exposures are more willing to hedge foreign exchange exposure
given the recognition of their direct transactional and economic exposure to adverse changes in
exchange rates. As a robustness check, we also controlled for size effects by splitting the
domestic and international insurers into small and large firms. Our findings suggest that
international insurers are more likely to hedge foreign exchange exposure in light of greater
direct operational risk to cash flows.
5.3. Size effects: currency exposure of small and large insurers
As expected, in Panel C of Table 2 we find that large (small) insurers have proportionately
lower (higher) frequencies of foreign exchange exposure. The one-tail Z test results provide
some support for the size effect as documented in existing studies (Chow, Lee and Solt (1997b),
Colquitt and Hoyt (1997) and Cummins et al. (2001)). We find that small insurers are
statistically more exposed to both Swiss and Canadian currencies than large insurers. The lower
frequencies of foreign exchange exposure for larger insurers supports the notion that large
insurers benefit from informational and cost economies which results in increased hedging
strategies to manage unexpected movements in these bilateral exchange rates.
5.4. Time horizon effects: short and long term exposure
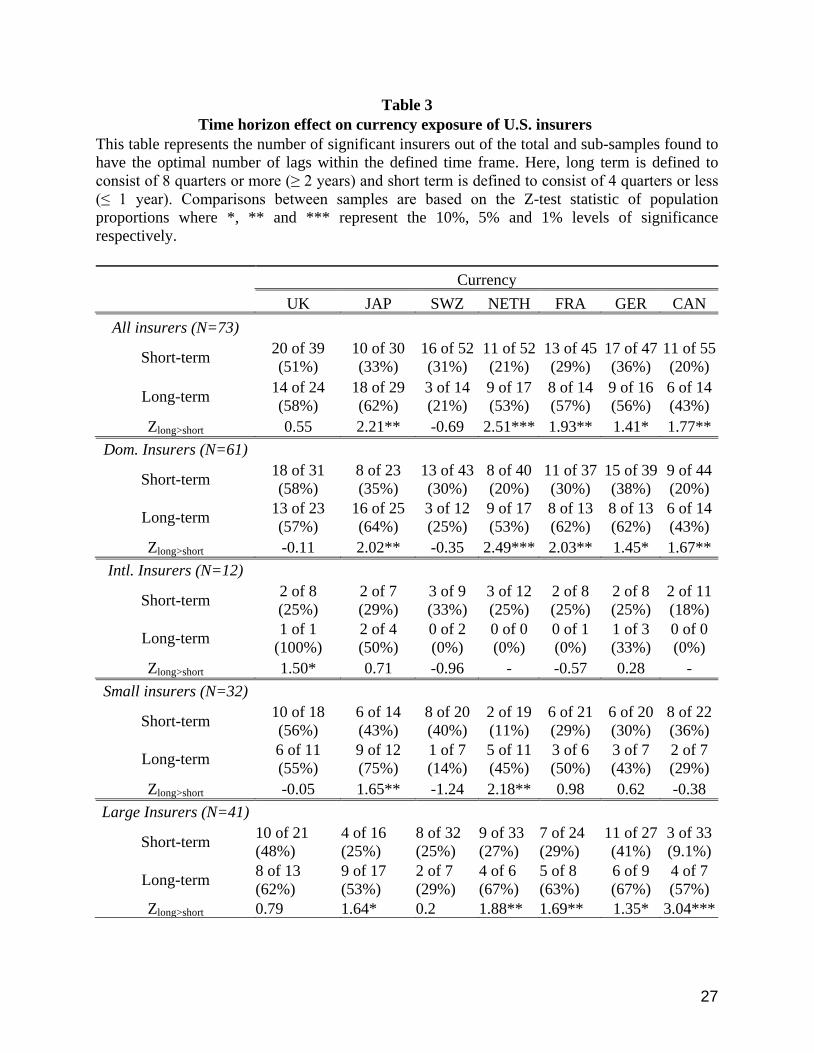
Table 3 presents the results concerning the time horizon effect on foreign exchange
exposure for all insurers, domestic and international insurers as well as the small and large
insurers.
<Insert Table 3 here>
Consistent with Chow, Lee and Solt (1997b), Nguyen and Faff (2003), Martin and Mauer
(2003), Muller and Verschoor (2006, 2007a,b) and references therein, this study finds that the
19
frequency of foreign exchange exposure increases with the length of the time horizon. This
supports the theory that firms tend to be more at risk from long-term exposure given the ease
with which short-term exposure can be hedged using currency derivatives. One-tail Z tests of
proportions indicate that for nearly all currencies studied, firms with long-term optimal lags
show significantly greater frequencies of foreign exchange exposure than those with short-term
optimal lags. In addition, these results corroborate with the bulk of the existing literature and
suggest that insurers are more prone to long term operating exposure instead of the more short-
term transaction exposure, which can be more easily assessed and hedged with derivatives.
These results are pervasive and they also hold for domestic and small and large insurance firms.
Taken together, the results show that the frequency of foreign exchange exposure
unambiguously increases with the time horizon. We find support for the theory that longer-term
foreign exchange exposure requires economic exposure management via operational or natural
hedges (Chow, Lee and Solt (1997b)). For firms with international exposure, such hedges are
much harder to undertake compared with using currency derivatives for transactional exposure
management in light of the difficulty in ascertaining the value to hedge, as well as significant
costs associated with the restructuring of foreign currency inflows, outflows and foreign
currency assets and liabilities. Domestic insurers also show significantly more frequent long-
term exposure than short-term exposure. This indicates that the same difficulty exists for
domestic insurers given the difficulty in assessing long-term exposure without the option of
undertaking operational hedging via the restructuring of foreign assets, liabilities and cash flows.
In addition, the channel of foreign exchange exposure would be more indirect than direct,
making the task of domestic risk managers even more difficult.
20
6. Conclusions
This paper extends the existing literature on foreign exchange exposure by documenting its
pervasiveness in the U.S. insurance industry. In addition, several hypotheses are tested to
determine if operational scope, firm size and the time horizon of exposure have an impact on the
patterns of foreign exchange exposure faced by U.S. insurers. The existing literature
predominantly looks at foreign exchange exposure on an aggregate level, which potentially
masks the identification of currency exposure. This firm-level study allows for the heterogeneous
nature of individual insurer’s economic linkages based on the methodology employed by Martin
and Mauer (2003) for banks with some innovations suited to studying insurance firms.
The results highlight the importance of exchange rate exposure management within the
U.S. insurance industry. A large proportion of insurers show significant foreign exchange
exposure to the each of the seven major currencies studied and to at least one of these currencies.
The potential existence of systematic differences in the foreign exchange exposure of life and
non-life insurers is also investigated for the first time. This paper finds that there does not appear
to be any difference in the exposure frequencies detected, suggesting similar risk exposure
management strategies between life and non-life insurers.
Evidence supporting several key theories from the existing literature on foreign exchange
exposure and currency risk management is provided in this paper. The operational scope of U.S.
insurers does affect their level of foreign exchange exposure. The significance of foreign
exchange exposure to domestic and international insurers is found and the presence of both direct
and indirect exposure faced by insurers as found by Martin and Mauer (2003) for banks is
verified. For insurers, this is potentially due to the marketing of innovative bank-like products by
insurers such as foreign currency endowment policies and other investment products that offer
21
investors exposure to foreign markets. In comparing between domestic and international
insurers, domestic insurers show significantly greater frequencies of foreign exchange exposure.
This supports the theory that international firms tend to hedge more given that their exposure is
more easily identified. Domestic firms on the other hand exhibit greater economic exposure since
the indirect exposure they face are even more difficult to ascertain and execute.
Regarding the size effect, the lower frequencies of foreign exchange exposure for larger
insurers support the theory that large insurers benefit from informational and cost economies
which result in superior hedging strategies (and risk management overall) to manage unexpected
movements in these bilateral exchange rates.
In studying foreign exchange exposures in the short and long-term horizons, we find that
the number of significant foreign exchange exposures faced by insurers increases with the time
horizon. In accordance with the existing literature, this result suggests that U.S. insurers tend to
focus more on hedging short-term transactional exposure with derivatives rather than longer-
term operational exposure. It corroborates with the theory that the management of short-term
foreign exchange transaction exposure is the more popular choice among financial risk
managers.
22
References Allayannis, G., Weston, J., 2001. The use of foreign currency derivatives and firm value. Review
of Financial Studies 14(1), 243-276.
Allayannis, G., Ihrig, J., Weston, J., 2001. Exchange-rate exposure: financial vs operating
strategies. American Economic Review Papers and Proceedings 91, 391-398.
Almon, S., 1965. The distributed lag between capital appropriations and expenditures.
Econometrica 33, 178-196.
Bartov, E., Bodnar, G.M., 1994. Firm valuation, earnings expectations and the exchange-rate
exposure effect. Journal of Finance 49, 1755-1785.
Bartram, S., 2004. Linear and nonlinear foreign exchange rate exposures of German non-
financial corporations. Journal of International Money and Finance 23(4), 673-699.
Bodnar, G.M., Gentry, W.M., 1993. Exchange-rate exposure and industry characteristics:
evidence from Canada, Japan and the U.S. Journal of International Money and Finance 12, 29-
45.
Bodnar, G. M., Hayt, G.S., Marston, R.C., 1998. Wharton survey of financial risk management
by U.S. non-financial firms. Financial Management 27, 70-91.
Bureau of Economic Analysis, 2003. Survey of current business 83(9), Washington DC.
Chamberlain, S., Howe, J.S., Popper, H., 1997. The exchange rate exposure of U.S. and Japanese
banking institutions. Journal of Banking and Finance 21, 871-892.
Choi, J.J., Elyasiani, E., 1997. Derivatives exposure and the interest rate and exchange rate risks
of U.S. banks. Journal of Financial Services Research 12, 267-286.
23
Choi, J.J., Kim, Y.C., 2003. The asian exposure of U.S. firms: operational and risk management
strategies. Pacific-Basin Finance Journal 11, 121-138.
Choi, J.J., Prasad, A.M., 1995. Exchange risk sensitivity and its determinants: a firm and
industry analysis of U.S. multinationals. Financial Management 24, 77-88.
Chow, E.H., Lee, W.Y., Solt, M.E., 1997a. The exchange-rate risk exposure of asset returns.
Journal of Business 70, 105-123.
Chow, E.H., Lee, W.Y., Solt, M.E., 1997b. The economic exposure of U.S. multinational firms.
Journal of Financial Research 20(2), 191-210.
Colquitt, L.L., Hoyt, R.E., 1997. Determinants of corporate hedging behavior: evidence from the
life insurance industry. Journal of Risk and Insurance 64(4), 649-671.
Cummins, J.D., Phillips, R.D., Smith, S.D., 2001. Derivatives and corporate risk management:
participation and volume decisions in the insurance industry. Journal of Risk and Insurance
68(1), 51-91.
Hakkarainen, A., Joseph, N., Kasanen, E., Puttonen, V., 1998. The foreign exchange exposure
management practices of finnish industrial firms. Journal of International Financial Management
and Accounting 9(1), 34-57.
He, J., Ng, L.K., 1998. The foreign exchange exposure of Japanese multinational corporations.
Journal of Finance 53(2), 733-753.
Hentschel, L., Smith, C.W., 1997. Risks in the derivatives markets: implications for the
insurance industry. Journal of Risk and Insurance 64, 323-345.
Li, D., Moshirian, F., Sim, A., 2003. International financial services: IIT in insurance services.
Journal of Risk and Insurance 70, 269-287.
24
Jorion, P., 1990. The exchange-rate exposure of U.S. multinationals. Journal of Business 63,
331-345.
Khoo, A., 1994. Estimation of foreign exchange exposure: an application to mining companies in
Australia. Journal of International Money and Finance 13, 342–363.
Martin, A.D., Mauer, L.J., 2003. Exchange rate exposures of U.S. banks: a cash flow-based
methodology. Journal of Banking and Finance 27, 851-865.
Muller, A., Verschoor, W.F.C., 2006. European foreign exchange risk exposure. European
Financial Management 12(2), 195-220.
Muller, A., Verschoor, W.F.C., 2007a. Asian foreign exchange risk exposure. Journal of the
Japanese and International Economies 21, 16-37.
Muller, A., Verschoor, W.F.C., 2007b. The Latin American exchange exposure of U.S.
multinationals. Journal of Multinational Financial Management, forthcoming.
Nance, D.R., Smith, C.W., Smithson, C.W., 1993. On the Determinants of Corporate Hedging.
Journal of Finance 48(1), 267-284.
Nguyen, H., Faff, R., 2003. Can the use of foreign currency derivatives explain variations in
foreign exchange exposure? Evidence from Australian companies. Journal of Multinational
Financial Management 13, 193-215.
25
Inflows Outflows Inflows Outflows Inflows Outflows Total Insurance ActivityUnited Kingdom 5,126 40,710 9,064 47389 7,095 44,050 51,145Japan 12,909 23,698 9,097 29,338 11,003 26,518 37,521Germany 15,880 13,300 10,443 13,264 13,162 13,282 26,444Switzerland 22,114 4,125 16,766 4,748 19,440 4,437 23,877Netherlands 35,569 640 34,768 5449 35,169 3,045 38,213France 28,873 2,283 32,015 2,183 30,444 2,233 32,677Canada 25,289 26,055 25,332 23,498 25,311 24,777 50,087Total 145,760 110,811 137,485 125,869 141,623 118,340 259,963
All Countries 174,109 225,556 162,853 244,480 168,481 235,018 403,499Source: Survey of Current Business, Washington, Sep 2003; Vol.83, Iss.91) Numbers in US$ millions.2) Inflows relate specifically to finance (except depository institutions) and insurance investments into the U.S.
Table 1Summary of main U.S. trade partners in insurance
2001 2002 Average
Outflows relate to U.S investments to external countries in the area of finanace (except depository institutions),
26
Table 2 Summary of currency exposure in the U.S. insurance industry
This table presents a summary of the numbers and proportions of non-broker US insurers that are significantly exposed to the currencies of the industry’s major trading partners. In Panel A, the significantly exposed non-life and life insurance companies are shown. In Panel B the significantly exposed domestic and international insurers are presented. In Panel C, the significantly exposed small and large insurance companies are finally shown. The Z test statistics are computed for comparing two proportions where *, ** and *** represent the 10%, 5% and 1% levels of significance for a one-tail test respectively. Panel A: exposures of non-life and life insurers
Currency All Insurers (N=73)
Non-Life (N=60)
Life (N=13)
ZNon-Life>Life.
UK 53 (73%) 42 (70%) 11 (85%) -1.07 JAP 52 (71%) 44 (73%) 8 (62%) 0.85 SWZ 37 (51%) 31 (52%) 6 (46%) 0.36
NETH 31 (42%) 27 (45%) 4 (31%) 0.94 FRA 40 (55%) 34 (57%) 6 (46%) 0.69 GER 43 (59%) 36 (60%) 7 (54%) 0.41 CAN 27 (37%) 22 (37%) 5 (38%) -0.12
Panel B: exposures of domestic and international insurers Currency All Insurers
(N=73) Domestic (N=61)
International (N=12)
ZDom>Intl.
UK 53 (73%) 48 (79%) 5 (42%) 2.63*** JAP 52 (71%) 45 (74%) 7 (58%) 1.08 SWZ 37 (51%) 31 (51%) 6 (50%) 0.05
NETH 31 (42%) 28 (46%) 3 (25%) 1.34* FRA 40 (55%) 34 (56%) 6 (50%) 0.37 GER 43 (59%) 37 (61%) 6 (50%) 0.69 CAN 27 (37%) 24 (39%) 3 (25%) 0.94
Panel C: exposures of small and large insurers Currency All Insurers
(N=73) Small
(N=32) Large
(N=41) ZSm>Lge.
UK 53 (73%) 24 (75%) 29 (71%) 0.41 JAP 52 (71%) 23 (72%) 29 (71%) 0.11 SWZ 37 (51%) 20 (63%) 17 (41%) 1.78**
NETH 31 (42%) 14 (44%) 17 (41%) 0.20 FRA 40 (55%) 16 (50%) 24 (59%) -0.73 GER 43 (59%) 18 (56%) 25 (61%) -0.41 CAN 27 (37%) 17 (53%) 10 (24%) 2.52***
27
Table 3 Time horizon effect on currency exposure of U.S. insurers
This table represents the number of significant insurers out of the total and sub-samples found to have the optimal number of lags within the defined time frame. Here, long term is defined to consist of 8 quarters or more (≥ 2 years) and short term is defined to consist of 4 quarters or less (≤ 1 year). Comparisons between samples are based on the Z-test statistic of population proportions where *, ** and *** represent the 10%, 5% and 1% levels of significance respectively.
Currency UK JAP SWZ NETH FRA GER CAN
All insurers (N=73)
Short-term 20 of 39 (51%)
10 of 30 (33%)
16 of 52 (31%)
11 of 52 (21%)
13 of 45 (29%)
17 of 47 (36%)
11 of 55 (20%)
Long-term 14 of 24 (58%)
18 of 29 (62%)
3 of 14 (21%)
9 of 17 (53%)
8 of 14 (57%)
9 of 16 (56%)
6 of 14 (43%)
Zlong>short 0.55 2.21** -0.69 2.51*** 1.93** 1.41* 1.77** Dom. Insurers (N=61)
Short-term 18 of 31 (58%)
8 of 23 (35%)
13 of 43 (30%)
8 of 40 (20%)
11 of 37 (30%)
15 of 39 (38%)
9 of 44 (20%)
Long-term 13 of 23 (57%)
16 of 25 (64%)
3 of 12 (25%)
9 of 17 (53%)
8 of 13 (62%)
8 of 13 (62%)
6 of 14 (43%)
Zlong>short -0.11 2.02** -0.35 2.49*** 2.03** 1.45* 1.67** Intl. Insurers (N=12)
Short-term 2 of 8 (25%)
2 of 7 (29%)
3 of 9 (33%)
3 of 12 (25%)
2 of 8 (25%)
2 of 8 (25%)
2 of 11 (18%)
Long-term 1 of 1 (100%)
2 of 4 (50%)
0 of 2 (0%)
0 of 0 (0%)
0 of 1 (0%)
1 of 3 (33%)
0 of 0 (0%)
Zlong>short 1.50* 0.71 -0.96 - -0.57 0.28 - Small insurers (N=32)
Short-term 10 of 18 (56%)
6 of 14 (43%)
8 of 20 (40%)
2 of 19 (11%)
6 of 21 (29%)
6 of 20 (30%)
8 of 22 (36%)
Long-term 6 of 11 (55%)
9 of 12 (75%)
1 of 7 (14%)
5 of 11 (45%)
3 of 6 (50%)
3 of 7 (43%)
2 of 7 (29%)
Zlong>short -0.05 1.65** -1.24 2.18** 0.98 0.62 -0.38 Large Insurers (N=41)
Short-term 10 of 21 (48%)
4 of 16 (25%)
8 of 32 (25%)
9 of 33 (27%)
7 of 24 (29%)
11 of 27 (41%)
3 of 33 (9.1%)
Long-term 8 of 13 (62%)
9 of 17 (53%)
2 of 7 (29%)
4 of 6 (67%)
5 of 8 (63%)
6 of 9 (67%)
4 of 7 (57%)
Zlong>short 0.79 1.64* 0.2 1.88** 1.69** 1.35* 3.04***