foreign employment and remittance trend with …
TRANSCRIPT

FOREIGN EMPLOYMENT AND REMITTANCE
TREND WITH REFERENCE TO SHREE
KRISHNA GANDAKI V.D.C.
SYANGJA, NEPAL
A THESIS SUBMITTED
TO
Office of the dean
Faculty of Management
Tribhuvan University
SUBMITTED BY
Krishna Prasad Bhattarai
Lumbini Banijya Campus
Roll No.: 3020059
T.U. Regd. No.: 7-2-302-145-2005
In partial fulfillment of the requirement for the degree of
Master of Business Studies (M.B.S)
Butwal, Nepal
November, 2014

2
RECOMMENDATION
This is to certify that the thesis
Submitted by:
Krishna Prasad Bhattarai
Entitled:
FOREIGN EMPLOYMENT AND REMITTANCE TREND WITH REFERENCE TO SHREE
KRISHNA GANDAKI V.D.C.
SYANGJA, NEPAL
has been prepared as approved by this department in the prescribed
format of the Faculty of Management. This thesis is forwarded for
examination.
Signature --------------------- Signature ----------------- Signature ------------
Supervisor Head of Research Department Campus Chief
Mr. Bharat Bhusal Mr. Na Krishna Bhattarai Dr. Ishwor Gautam

3
VIVA-VOCE SHEET
We have conducted the viva-voce examination of the
Thesis presented by
Krishna Prasad Bhattarai
Entitled FOREIGN EMPLOYMENT AND REMITTANCE TREND WITH REFERENCE TO SHREE
KRISHNA GANDAKI V.D.C.
SYANGJA, NEPAL
And found the thesis is the original work of the student and written according
to the prescribed format. We recommend the thesis to be accepted as partial
fulfilment of the requirements for Master’s Degree in Business Studies
(M.B.S.)
Viva-voce committee
Member (Thesis Supervisor).................................................................
Member (External Expert).....................................................................
Campus Chief ………………………………………………………..
Head of Research Department ……………………………………….
Date : ...............................

4
DECLARATION
I hereby declare that the work reported in this thesis entitled FOREIGN
EMPLOYMENT AND REMITTANCE TREND WITH REFERENCE TO SHREE KRISHNA
GANDAKI V.D.C. SYANGJA, NEPAL submitted to the Central Department of
Management, Tribhuvan University, is my original work. It is done in the
form of partial fulfillment of the requirements for the Master of Business
Studies (MBS) under the supervision and guidance of Reader Bharat Bhusal
of Lumbini Banijya Campus, Butwal
September, 2014
_______________________
Krishna Prasad Bhattarai
Lumbini Banijya Campus

5
ACKNOWLEDGEMENTS
This study entitled FOREIGN EMPLOYMENT AND REMITTANCE TREND WITH
REFERENCE TO SHREE KRISHNA GANDAKI V.D.C. SYANGJA, NEPAL is essentially
an output of partial requirement for the degree of Master in Business Studies,
Tribhuvan University prepared under the supervision of Mr. Bharat Bhusal,
lecturer of Lumbini Banijya Campus.
I have great pleasure to express my gratitude and sincerity to my thesis
supervisor Mr. Bharat Bhusal, for his excellent and helpful guidance and
supervision. I shall even remain to him for this valuable direction, useful
suggestion and comments during the course of preparing this thesis. Without
his help, this work would not be come in this form.
I would like to extend my gratefulness to Dr. Ishwor Gautam, Campus chief of
Lumbini Banijya Campus, Mr. Na Krishna Bhattarai Head of Research
Department, staff of Library and administration of Lumbini Banijya Campus
and all my colleagues who have extend their helping hands towards the
accomplishment of this thesis.
I would to like to thank all respected respondents who helped me to answers
the various questions and providing necessary information and suggestions
and responding my questionnaire.
Lastly, I would like to dedicate this dissertation to my beloved parents and my
family whose continuous and emotional as well as material support made me
capable of this task.
Krishna Prasad Bhattarai
Lumbini Banijya Campus.

6
TABLE OF CONTENTS
Page No
Recommendation letter i
Viva-Voce Sheet ii
Approval letter ii
Acknowledgement iv
Table of contents v
List of tables vii
List of acronyms ix
CHAPTER I: INTRODUCTION 1-8
1.1 General Background 1
1.2 Statement of the Problem 4
1.3 Objectives of the Study 6
1.4 Importance of the Study 6
1.5 Limitations of the Study 8
1.6 Organization of the Study 8
CHAPTER II: REVIEW OF LITERATURE 9-27
2.1 Meaning of Remittance 9
2.2 Summary statistics of Remittance 17
2.3 Some studies on Remittance 22
2.4 Research Gap 27
CHAPTER III: RESEARCH METHODOLOGY 28-30
3.1 Research Design 28
3.2 Nature and Sources of Data 28
3.3 Population and Sample 28

7
3.4 Data Collection procedure 30
3.4.1 Primary Data Collection 30
3.4.2 Secondary Data Collection 30
3.5 Data Analysis 30
CHAPTER IV: DATA PRESENTATION AND ANALYSIS 31-72
4.1 Geographical Background 31
4.2 Demographic Status 33
4.3 General Poverty Level 39
4.4 Nature and Extent of Remittance Income 49
4.5 Impact of Remittance on Poverty Reduction 60
4.6 Major Findings 69
CHAPTER V SUMMARY, CONCLUSION AND
RECOMMENDATION 73-78
5.1Summary 73
5.2 Conclusion 75
5.3 Recommendations 76
BIBLIOGRAPHY
QUESTIONNAIRE

8
LIST OF TABLES
Table No. Title Page No.
Table 2.1 Summary Statistics of Remittances 17
Table 2.2 Share of Remittances Received by Source 19
Table 2.3 Relationship of Donor and Recipient by Gender 20
Table 2.4 Distribution of Number of Remittances by Means of
Transfer and Origin and Remittance 22
Table 3.1 Sample Size of Respondents of Households 29
Table 4.1 Sex Status in Study Area 33
Table 4.2 Educational Status of Sample Households 34
Table 4.3 Distribution of Sampled Household by Family Size 35
Table 4.4 Distribution of Population by Sex and Age Groups 36
Table 4.5 Distribution of Land among the Sampled Households 37
Table 4.6 Distribution of Total Sampled Population and Household 37
Table 4.7 Percentage of Different Ethnic Groups of Sampled
Household 39
Table 4.8 Sample Households Made by Different Types 40
Table 4.9 Distribution of Land Among Sample Households 41
Table 4.10 Households Having Agri-Land, Livestock & Poultry in the Study
Area 42
Table 4.11 Sources of Income of the Sampled Households 43
Table 4.12 Frequency Distribution of Economic Condition
Of the Different Ethnic Groups of Respondents
From Shree Krishna Gandaki VDC 44
Table 4.13 Frequency Distribution of Causes of Seeking
Foreign Employment from Shree Krishna Gandaki VDC 45
Table 4.14 Average Cost Paid and Range of Costs for Foreign
Employment by Different Ethnic Group form

9
Shree Krishna Gandaki VDC 47
Table 4.15 Frequency Distribution of Source of Financing of
Cost of Foreign Employment for Different Ethnic
Groups of Shree Krishna Gandaki VDC 49
Table 4.16 Regular Money Income of the Sample Households 50
Table 4.17 Employment Status of the Sample Households 51
Table 4.18 Number of Migrant Nepalese Working in Different
Countries in 2001 52
Table 4.19 Number of Nepalese Migrant Workers Employed In
Different Part of the World in Different Fiscal Year 54
Table 4.20 Number of Nepalese Migrant Workers in Different
Countries in Selected Fiscal Years 55
Table 4.21 Types of Jobs Performed and Duration of Stay in foreign Country
of Respondents from Krishna Gandaki VDC 57
Table 4.22 Income Earned in Abroad for Different Ethnic Group of
Respondents 59
Table 4.23 Use of Remittance and the Skills Learnt in Foreign
Employment 61
Table 4.24 Frequency Distribution of Impact On Other Indicators of the
Respondents 63
Table 4.25 Overall Impact of Remittance Income Monthly 67
Table 4.26 Cause to Return for Foreign Employment for Different Ethnic
Group of Respondents 68

10
ABBREVIATIONS
ADB : Asian Development Bank
BOP : Balance of Payment
CBS : Central Bureau of Statistics
CFE : Convertible Foreign Exchange
DFID : Department for International Development
FDI : Foreign Direct Investment
FY : Fiscal Year
GDP : Gross Domestic Product
GNI : Gross National Income
GON : Government of Nepal
HDR : Human Development Report
ILO : International Labor Organization
IME : International Monetary Fund
KSA : Kingdom of Saudi Arabia
MOF : Ministry of Finance
NLSS : Nepal Living Standard Survey
NPC : National Planning Commission
NRB : Nepal Rastra Bank
SAARC : South Asian Association for Regional Cooperation
SLC : School Leaving Certificate
UNDP : United Nations Development Program
UAE : United Arab Emirates
UK : United Kingdom
USA : United State of America
US$ : United State Dollar
VDC : Village Development Committee
WB : World Bank
WDR : World Development Report

11
WTO : World Trade Organization

12
CHAPTER I
INTRODUCTION
1.1 General Background
Poverty is the major burning problem of both developing as well as
underdeveloped countries in this present world, only the difference is its
magnitude and type of poverty. It is a worldwide phenomenon and, however
it differs in its magnitude from one country to another.
In case of Nepal, which is a small landlocked and agricultural country, suffers
from the problem of mass poverty and unemployment. High population
growth rate and increasing dependency on the backward agriculture may be
attributed for its slow growth rate. Among them mass poverty is the main
characteristic. In Nepali context, poverty can be discussed in two aspects, one
is based on per capita income and another is basic needs approach. Defining
poverty with the per capita income approach, Nepal’s GNI per capita is US$
510 as FY 2010/11 (CBS-2011) among them the population receiving less than
1$ per day was estimated to be 30.8% (WDR2011). According to the NPC
survey (1978) the minimum subsistence level of income was NRS 2 per day at
1976/77, price as the absolute poverty line. This clearly shows that poverty is
in large magnitude in Nepal.
On another approach: Basic needs approach, Poverty is defined as the
unavailability of basic requirements like clothes, shelter and food. As for
example: a person needs average daily intake of 2256 calories and value of the
lowest actual daily consumption of other basic necessities. If any person can’t
get that required amount of calories, he can be rated as poor. Due to the very
high level of poverty, the Social Index of Nepal is also very low in comparison
to the world level. Although the foreign investment is the main source of

13
development of any economy, because of the lack of sufficient polices and
infrastructures the foreign investment in Nepal is not satisfactory.
Total foreign Direct Investment (FDI) during 2000/01-2011/12 marked Rs.22.6
billion. Foreign exchange earning from tourism declined from 3.6 percent in
1998/99 and 1.2 percent contribution to GDP in 2011/12. Trade deficit was s
high as Rs. 82 billion during the period 2011/12 and currently estimated to be
high as more then 100 billion dollar (more than 22% of total GDP). Fiscal
deficit is estimate to be 8.9 percent of GDP as overall budget deficit is around
5.2 percent of GDP in 2012.Although open unemployment is relatively low,
underemployment or disguised unemployment is as high as 50
percent.(Dahal,2012)
Tourism is important sector of Nepalese economy. Continuously is has helped
Nepalese economy to increase employment, to earn foreign currency and it
has also helped to improve regional imbalance. Highest snow peak mountains,
lusty evergreen forests of Terai, socio and cultural diversity of Nepal etc.
attracts tourists from the other countries every year. Because of lack of
industrial areas tourism has become a very prominent sector to provide
employment and income.
Human resource is another main resource of Nepal; Due to the high
population growth rate of Nepal the population of Nepal is increasing day by
day therefore its role in the development of all sectors is becoming very
important in recent years. But due to the lack of opportunities in our country
to get employment and earning money skilled, semi-skilled and unskilled all
types of people have shown inclined to the foreign employment which have
resulted in substantial growth of remittance economy. In the current situation
the magnitude of remittance is estimated to exceed Rs. 100 billion which is
coming through the registered sources, if all the unregistered sources (illegal
sources and with their friends also) has to be counted it is estimated to exceed

14
Rs. 125 billion (www.ekantipur.com). If this present trend continues, it is
speculated that remittance economy will substitute many other sectors of the
economy in coming new years.
Although foreign employment for Nepalese people has a long history, foreign
labor migration and remittance have emerged over the last two decades as a
prominent feature of the Nepalese economy. It was started before early
nineteenth century when the first Nepalese traveled to Lahore to join army of
Sikh Ruler Ranjit Singh. Formally it was started after Anglo-Nepal friendship
treaty of 1816 that recruited 3000 Nepalese soldiers in British Gorkha
Regiment. (Dahal, ibid)
The contribution of remittance income is increasing year by year. The total
contribution of remittance income in total is 16% of total GDP (Gross
Domestic Product) now. According to NRB, due to increasing trend in foreign
employment and the decreasing trend of export the contribution of
remittance is increasing. The contribution of remittance income is 16.8% in
the fiscal year 2062/63, which was only 11% in the past year.
According to NRB the total of Rs.100 million is entered from the formal
medium of money transfer last year. In the first seven months of year
2063/64, about 56 million rupees is entered into the country as a remittance
income which is larger than the same time limit of the previous year. Now
there are 36 companies working under the legal boundary to transfer money
from the foreign countries. Except those companies, some of the commercial
banks also working as money transfer.
Remittance is established as a major source of economic development of the
developing countries. According to the data of the last year, about 3300 billion
U.S. dollar is entering to the developing countries. The remittance income is
increased by 50% in the developing countries like India, China, and Mexico.
15
The remittance flow is double than that of Foreign Aid and Foreign Direct
Investment from developed countries to under developed countries.
Most of the migrated people are from the rural sector of Nepal but due to the
lack of the banking facilities in the rural areas, they are sending their earnings
from the informal mediums up to now. In this present condition most of the
migrated people of rural areas are migrated to India for work.
In this present situation remittance is playing very vital role to reduce poverty
level of Nepal to the downward ranges, especially in rural areas where there is
no other opportunities to earn and get employment without agricultural
sector. But due to the lack of proper government policy to encourage the
remittance income is the productive sectors; almost 80 percent of the
remittance money is used in the unproductive sectors like house building, land
buying and other luxurious goods. The people are migrated to other
countries for work and earn money, which certainly helps to reduce poverty
level of rural areas.
1.2 Statement of the Problem
In this twenty first century, the age of globalization remittance has become a
cornerstone of development for any developing country. The magnitude may
differ but the role of the remittance to the development can’t be denied. The
developing countries in this age can’t even take a foot path ahead without
external assistance like remittance and the foreign aid. In case of Nepal, in this
present situation of post war the one and only source of economic
stabilization and growth rate maintenance is remittance income. According to
CBS Nepal's per capita income is increased to US $ 311 from US $ 240, which is
only due to the increasing trend of remittance income.
If we concentrate on the poverty situation of our country, its magnitude is
very large especially in the rural areas most of the people are migrated to the
other countries for work and earn only for the existence of their family. In

16
rural areas we can find that most of the lower and middle class families are
drowned in debt. If any member of that family is migrated to other countries
its debt is comparatively less than other families. So, remittance income is
playing very vital role in the rural economic situation. (Karna, 2004)
The population census of 2011 A.D. reported that 785890 persons were out of
the country to foreign employment. According to the NRB in the year 2011/12
remittance accounting Rs. 58 billion were received in Nepal which is 40-50
percent of all foreign currency earnings. The major factor attributing to large
demand labor employment from Nepal are related to higher rate of
unemployment, limited employment opportunities, low salary structure in the
economy, insecurity in the rural areas because of insurgency and so on. Other
main reason is the willingness and enthusiasm of Nepal youth to visit and
work in the foreign country.
Since many years, foreign employment rate is increasing, but most of unskilled
labor had gone to foreign land. Nepalese labor forces seeking foreign
employment having very low level of technical education and formal training.
They are compelled to take risky, difficult and dirty work in foreign country.
Slowly, training institute are being established in Nepal to develop skills on
individuals who are seeking foreign employment so that earning capacity of
the employed can be increased and competitiveness in the labor market can
be increased. But these institutes are in infancy. Individuals seeking foreign
employment have spent large amount of money as a cost for employment.
The cost includes passport fee, medical charge, visa fee air fare and
commission to the employment agency. To finance the employment
individuals have to dependent on several sources of funds which included
internal saving, borrowing from the relatives, funds received from the sales of
fixed assets like land and animals, borrowing from money lenders etc. Formal
financial institution like banks, cooperatives and finance companies do not

17
provide loan easily. It is very difficult to arrange the funds needed to foreign
employment by people coming from lower income class. (Karki, 2006).
Other problems are mal practice and fraud activities of the Manpower
Agencies and employment agent and employer of the destination countries.
The agreement between the migrant workers and Manpower Agencies are
often violated. The government hasn’t been able to regulate them. The rights
of the migrant workers cannot be insured inside Nepal and also in the labor
importing countries. The per capita earning of the workers is very low.
While studying about the Role of Remittance in Poverty Reduction some
research question have be raised as below:
a) What is the poverty level of the study area?
b) What is the nature and extent of remittance income of the study area?
c) What is the impact of remittance on the poverty reduction of the study
area?
1.3 Objectives of the Study
The main objective of the study is to analyze the role of
remittance in rural poverty reduction of the study area. Besides this,
the specific objectives of this study are as follows.
a. To examine employment and the status of people in the study
area.
b. To analyze the nature and extent of remittance income in the study
area.
c. To analyze the impact of remittance for inhencing the level of
people in study area.

18
1.4 Importance of the Study
Since the inception of the Eighth five year plan, alleviation of poverty
has been accorded highest propriety. Likewise several short as well as long
term programs have been launched in this related field but results are not so
satisfactory. In this regard due to so many reasons like unemployment,
insurgency, weak governance and faulty education system etc, large number
of young manpower have migrated to foreign countries for work to the other
countries like USA, UK, Australia , other European countries as well as to the
Gulf countries like Saudi Arabia, Dubai, and Malaysia, Iraq etc. Due to this
emigration of stream somehow the people have been able to fulfill their basic
needs. Therefore, in this present time the remittance income is playing very
important role to reduce the poverty in the rural areas of our country Nepal.
Especially, in those areas of Nepal where there is no any job opportunities to
earn money to fulfill their basic needs except the agricultural sector. But the
productivity of the agricultural sector is very low. The people of the rural areas
work for all the year but hardly get food even for six months. (Shrestha, 2006)
In the past, the kind of job of Nepalese workers used to get abroad was only
the armed force. After the restoration of democracy, international job market
was opened in the 40 countries. Thus in the new phenomenon of entering into
the WTO, efficient and skilled labor force is required and diversification in the
skill and destination. This study will also concentrate on the role of
remittances in rural Nepal and guide to make it more helpful in eradicating
rural poverty and increasing the capacity of the labor force. The economic
indicators will help to plan rural area. (Gyawali, 2005)
If we try to analyze the present manpower of Nepal, about 70% of the
educated manpower is migrated for work, some of them are coming back to
Nepal and some of them are settling there forever, but all of them are sending
money from there for their family and relatives. So, the remittance is coming

19
for all over the world to Nepal where the Nepalese people are migrated.
Certainly that amount of remittance is helping Nepalese economy to reduce
the poverty level. When we compare the poverty level as well as the living
standard of the migrated family and non migrated family, the migrated
people's family is in high condition of living standard, or they are feeling very
comfortable to fulfill their basic needs for their existence. (Shrestha , 2006)
But most of the remittance income is used in the unproductive fields like
house building, land purchasing, purchasing of luxurious goods and
consumption etc. therefore the remittance income is not playing it's actual
role for the development of the country as well as the reduction of the
poverty level of the entire country. In other words, in these days the
remittance income is using in the advantage of the migrated people and their
families only. If the remittance income is invested in the productive sectors
like industries, development activities etc, then only the effect of that
remittance income can be felt by other citizens of Nepal. (Dahal, 2004)
1.5 Limitation of the Study
The study has following limitations:
i. The present analysis is concentrated in a particular area of
Krishna Gandaki VDC, Syangja District to determine the
magnitude of poverty as well as the amount of remittance
income in micro level.
ii. Price of all commodities is calculated on the current price.
iii. Only economic variables such as income, income and wealth
inequalities are analyzed.

20
iv. The value of self produced goods consumption, rent of the self
occupied households, working charge (labor charge) on their
own land are ignored.
1.6 Organization of the Study
The study is on the following format: the first chapter is the introductory
chapter. The study of theories of migration and the poverty with demography
has been reviewed in the second chapter; which is presented under the title
“Review of literature”. Nepalese study in the labor migration and remittance is
another matter of review in the same chapter. The third chapter includes
research methodology. The fourth chapter describes about the socio-
economic profile of the study area. The fifth chapter includes flow of labor
migration; it’s composition, diversification and its trend. This chapter also
includes review of government policies about foreign employment and
remittance. The sixth chapter deals about the poverty situation in the study
area. The seventh chapter gives the data analysis of the study. The eighth
paper, which is the last chapter of the study presents summary, conclusions
and recommendations.

21
CHAPTER II
LITERATURE REVIEW
We have received several studies pertaining to emigration, its eco-
consequences either they are in the form of books or articles. That means
study about the matter by finding the books, articles newspaper, and thesis,
report etc. that are published in the past. This chapter helps to take adequate
feedback to broader the information base and inputs to the study. Since there
are not so much adequate study materials related with this topic published in
Nepal.
This chapter tries to detail the conceptual theoretical concept regarding the
definition of remittance as well as the term poverty.
2.1 Meaning of Remittance
Remittance means the transferring money from one place to another.
Remittance is the amount transferred by workers aboard to support their
families back home. Euphemistically, present day Nepalese economy is
characterized by "Remittance Economy". Its genesis starts from right from the
beginning of world war in which Nepalese fought not for the protection of
their homeland but in course of fulfilling duty in which they are engaged. At
the time of British rule in India, Those days when "Nawabs" of Lucknow were
watching helplessly the loot of their huge wealth. The possessions thus
received went to the treasury of the rulers but the salary of the soldiers
received formed the part to support their families. Remittance business is
created by the foreign employment that has the long experience in Nepal. For
the foreign employment Nepalese people are engaged before some centuries.
The Nepalese people were earned "Brave Soldier" in the history of world
before some decades. Nepalese people are earned a name and fame for the
fighting the victory in the war so that they are called as "Bir Gorkhali".

22
Nepalese migrated people are called 'Lahure' because they employed and
earned money in Lahore which is in Pakistan now. Some of the Nepalese were
earned money in Malaysia so they were called "Malayako Lahure".
According to Nepal Living Standard Survey (NLSS, 1996) 23 percent of all
households surveyed received remittances. In the rural areas the proportion
of households receiving remittances was 24 percent. Similarly, 38 percent of
all remittances came from India. (33 percent from other rural areas within
Nepal and 25 percent from urban areas within Nepal.) Remittances from the
other countries other than India accounted for nearly 3 percent of all
remittances. In the rural areas, 40 percent came from India, 3 percent from
other countries and around 58 percent elsewhere in Nepal.
Besides traditional sources like salaries and pensions of Gurkha soldiers
servicing in the British and Indian Army, thousands of Nepalese, Some of them
engaged in three "D" jobs (that is Dangerous, Dirty and Difficult) are sending
billions of rupees back home. (Source:www.nepalnews.com.np).
Poverty is the well known major problem of all over the world. Especially for
the countries like Nepal it is the burning issue. Various economists and
institutions in the context of the world had conducted many studies and
researches but only few researches have conducted in the context of Nepal to
fulfill the required amount of information about the role of remittance income
to reduce the rural poverty in Nepal. In this sense we can address the rural
poverty as the overall poverty of the country because most of the people of
rural area are under the poverty line as already described and most of the
people of urban areas like Kathmandu, Pokhara, and other major cities and
other popular developed districts.
For this purpose first of all we have to define the word poverty. The word
poverty is defined by so many economists in their own words like:

23
The first attempt to define and quantify the level of poverty of Nepal was
made by National Planning Commission (NPC) in 1976-77 through a survey on
Employment Income distribution and consumption Patterns, the minimum
subsistence level of poverty line. An income of Rs. 2 per capita per day at
1976-77 prices was taken as the minimum subsistence level. This out off level
was based on the expenditure required to buy food, giving average daily
intake of 2256 calories and value of the lowest actual daily consumption of
other basic necessities. This criterion at that time has given a poverty estimate
of 40.3 percent (Meeting the challenge 1992). This emphasizes the existence
of severe poverty in South Asia block. It has used various social indicators to
analyze and compare the level of poverty in SAARC countries the major social
indicators used for analysis are population, population education enrollment,
income level, employment status, expenditure level etc.
The research report of NRB (2006) conducted by the Special Study Section Of
NRB entitled "Foreign Employment, Remittance Economy and Nepal" states
that the migration of Nepalese workers started after 1816's peace treaty
between Nepal and Britain. Most of the people of that time are migrated to
work in the British Regiments. This study examines about the historical
perspectives, present condition, The trend and dimension of Remittance, the
problems associated with the remittance and its measurements, the use of
the gained money as well as the skills, the investment pattern of that
remittance and also the employment condition of the people returned from
the foreign employment. It also examines about the Nepalese foreign
employment system and its objectives with other questions related with the
remittance. This study concludes that apart from India, about 86percent of
the people are migrated to Gulf Countries like Malaysia, Saudi Arab, Qatar,
Dubai etc. Rest percent are migrated to the other countries of the World. This
study examine about the role of manpower agencies in the field of foreign
employment. This study concludes that even though the role of manpower

24
agencies in obtaining Work Permit, Government acceptance letter, tickets etc
is very helpful but most of the manpower agencies of Nepal are looting the
people in the name of foreign employment.
The Three Year Interim Plan (GON, 2010) takes note of a number of
achievements and progress made in relation to labour management and
employment promotion. These include the creation of Department of Foreign
Employment, protection of workers’ rights and fixation of minimum wage,
establishment of Foreign Employment Promotion Board, rescue and relief
operations for Nepali migrant workers facing difficult circumstances,
establishment of Migration Resource Center, appointment of Labour Attaches
in countries with large concentration of Nepali migrant workers, labour
agreements with five different countries, establishment of Foreign
Employment Court (Nyayadhikaran), formulation of the National Master Plan
on Child Labour, commencement of the process of sending industrial
apprentices to Japan, rescue of 16,000 child labourers from worst forms of
child labour, prevention of additional 17,000 children from entering labour
market, operation of Informal Education and Daycare Centers and investment
made by non-government sector in alleviation of child labour.
However, major challenges remain. These include the inability of the national
economy to grow at a faster pace in creating new employment opportunities,
inadequacy of vocational and skill development training opportunities,
inability to cater the needs of national and international labour markets for
skilled human resources, severe constraints in curbing frauds and abuses
related to foreign employment, widespread prevalence of child labour both in
formal and informal sectors, and weak collaboration and coordination among
national and international agencies in promoting employment opportunities.
Despite the constraints and challenges, the demand for Nepali migrant
workers in international labour market has remained strong. For the country,

25
the remittance sent home by migrant workers is significant i.e. 23.6 percent of
the GDP is received from remittance. One of the key challenges in the area of
foreign employment would be to enhance the skill profile of human resources
and explore new and lucrative market opportunities.
According to a study conducted by Prof. Seddon, Jagannath Adhikari and
Ganesh Gurung entitled “Foreign Labor Migration and the Remittance
Economy of Nepal” for DFID in the year 2005, nearly Rs.69 billion was
remitted by the Nepalese working in foreign countries in 1997. Of this, nearly
40 billion came from an estimated one million Nepalese working in India
whereas the rest (nearly Rs.29 billion) came from people working in other
parts of the world.
According to him, the recorded value of money sent back from abroad more
than doubled, from 1974/75 (Rs.90.7 million) to 1980/81 (Rs.216.8 million).
Over the next decade, the official value of foreign remittances increased three
fold, to reach Rs. 676.8 million by 1989/90. By the middle of the 1990’s, the
value of officially recorded remittances from abroad was around Rs. 2.9
billion, of this, “Gurkha Remittances” accounted for between a quarter and a
third. (Source: www.nepalnews.com.np/ntimes/issue169/economy)
From the past 14 years up to now, about 1.4 million people are migrated to
other countries in the search of employment. Even though, the number of
people migrated directly with the permission of government is one million but
estimation of the same number of people are migrated from individual level
and from the medium of other third countries.
According to the data provided by the Labor and Employment Promotion
Department up to the date the total of 9 lakh 35 thousand three hundred and
41 people are migrated for work. According to the same data, about 2,96,032
people are migrated to Malaysia, about 2,04,486 people to Qatar, about
1,47,503 to Saudi Arabia, 80 thousand to UAE, 5 thousand and six hundred to

26
South Korea, summing up all of them 7 lakh 33 thousand people are migrated
to these countries for work. Rest of the people, are migrated to the other
countries. The above data is from 2050 B.S. up to now. Even though before
2050 B.S. also Nepalese people were migrated to the other countries but the
actual data of that period is not available to the government. Similarly, the
data of the people migrated for their further studies but getting employment
there and sending money and migrated with their own effort is not available
with the Government.
According to the vice-president of Nepal Foreign Employment Association Mr.
Madan Mahat; the total of about 1.8 million people from Nepal are migrated
to the other countries for the search of the employment by both either
through the formal or informal mediums. According to the Director General of
Labor and Employment Promotion Department Mr. Keshar Bahadur Baniya;
Nepalese people are migrated to other countries because they can get the
desired work there and also they can earn more money than in the native
country. According to the Government data, maximum of 1 lakh 65 thousand
people are migrated in the year 2062/63. The number of people going to the
foreign employment is not decreasing after the restoration of peace in Nepal
also. In the period of one month (Jestha 2064), about 65 thousand people are
migrated for the foreign employment. Generally semi-skilled people are
migrating to the Gulf countries like Qatar, Malaysia, UAE etc and the literate
and skilled labor are migrating to the countries like Korea, Israel, Cyprus,
Hong-Kong etc. The Government of Nepal opened 107 countries for the
foreign employment of Nepalese labors but the labor-contract was signed
with Qatar only.
Poverty is the well known major problem of all over the world. Especially for
the countries like Nepal it is the burning issue. Various economists and
institutions in the context of the world had conducted many studies and
researches but only few researches have conducted in the context of Nepal to

27
fulfill the required amount of information about the role of remittance income
to reduce the rural poverty in Nepal. In this sense we can address the rural
poverty as the overall poverty of the country because most of the people of
rural area are under the poverty line as already described and most of the
people of urban areas like Kathmandu, Pokhara, and other major cities and
other popular developed districts.
For this purpose first of all we have to define the word poverty. The word
poverty is defined by so many economists in their own words like:
The first attempt to define and quantify the level of poverty of Nepal was
made by NPC in 1976-77 through a survey on Employment Income distribution
and consumption Patterns, the minimum subsistence level of poverty line. An
income of Rs. 2 per capita per day at 1976-77 prices was taken as the
minimum subsistence level. This out off level was based on the expenditure
required to buy food, giving average daily intake of 2256 calories and value of
the lowest actual daily consumption of other basic necessities. This criterion at
that time has given a poverty estimate of 40.3 percent (Meeting the challenge
1992). This emphasizes the existence of severe poverty in South Asia block. It
has used various social indicators to analyze and compare the level of poverty
in SAARC countries the major social indicators used for analysis are
population, population education enrollment, income level, employment
status, expenditure level etc.
According to the analysis of the data obtained from this research the main
conclusions about the remittance income and its trend are as follows:
(a) Most of the migrated people are from the agricultural sector and
livestock sector (61.3 percent) where they can’t get the required
amount of money and food from their profession for their existence.
(b) About 26.7 percent of the people are earning more than Rs.50,000 per
year, about 28.8 percent people are getting from Rs.50,000 to

28
Rs.1,00,000, about 12.5 percent people are getting from Rs.1,00,000 to
Rs.15,00,000 and about 31.9 percent people are getting more than
Rs.15,00,000 from abroad migration.
(c) Among the migrated people most of the people are migrated to India
(24 percent), Saudi Arabia 16.3 percent, Qatar 6.88 percent, United
Arab Emirates 5.6 percent and only 1 percent to 5 percent people are
migrated to the other developed countries like Japan, Germany, and
America etc. Most of the migrated people are in the age of between
26 years to 40 years (60 percent), 20 percent people are above age 41
years and 16 percent are below 25 years. This clearly shows that, most
of the migrated people are young.
(d) About 80 percent of the migrated people are using their money for
purchasing of house and land, for household expanses, for buying
ornaments and other luxurious goods, education of their child etc.
which is used in the unproductive sectors.
(e) Most of the migrated people are getting the salary of Rs.10,000 to
Rs.75,000 and some of them are also getting more than Rs.75,000. The
study shows that about 49.9 percent people are getting up to
Rs.10,000, about 20.6 percent of the people are getting from Rs.10,000
to Rs.25,000 ,about 13.8 percent of the migrated people are getting up
to Rs.50,000, about 16.2 percent of the people are getting more than
Rs.50,000.
(f) While comparing the status of income and work of the migrated
people to India with other countries it is clearly seen that, most of the
people migrated to India are absolute poor, they are in the problem of
fulfilling their basic needs, and they are uneducated and unskilled
labor whose salary is relatively very low. Whereas the people migrated
to the other countries are very much educated and their salary is

29
relatively very high comparing to those people. In other words, the
people who can't pay expanses for the other countries are going to
India for work.
This research report also has some suggestions and recommendations for the
improvement of the foreign employment sector as well as to raise the
productivity of the remittance income. Which are like, the Government
should be clear about the agendas related to the foreign employment, the
line agencies of government, and other private sectors and Non-Government
Organizations also should be clear about the foreign employment policy of
Nepal. There should be a good cooperation between ministry of Finance,
Nepal Rastra Bank, Department of Labor, Central bureau of statistics and
department of tourism. There should be a strong policy to increase the
investment form that remittance income in Nepal. The government should
open the labor offices in the countries like Malaysia, Qatar, UAE etc, where
more than 5000 Nepalese people are migrated for work. The present system
of Brokers in the foreign employment sector should be replaced. There
should be strong observation to the foreign employment agencies about
whether they are following all the rules and regulations of the Government as
well as the "Foreign Employment act-1992" , which has fixed the minimum
wage is US$ 125. There should be foreign employment information centers in
all the regions of the country to give actual suggestions and
recommendations to the people who want to go for foreign employment.
2.2 Summary statistics of Remittance
Nepal Living Standard Survey (NLSS-2012/13) has defined remittance as a
transfer income received by a household within last 12 months. All incomes
transferred from a single source (individual/household) is counted as one
remittance. According to the survey the following table is presented as a
comparison of remittances between the years 2003/04 and the year 2012/13.

30
Table 2.1
Summary Statistics of Remittances
Description Nepal Living Standard Survey
2003/04 2012/13
Percent of all households receiving
remittances
23.4 31.9
Average amount of remittance per
recipient household (nominal NRs.)
15,160 34,698
Share of remittances received by
household from within Nepal
44.7 23.5
From India 32.9 23.2
From other countries 22.4 53.3
Share of remittances in total household
income among recipients
26.6 35.4
Per capita remittance amount for all Nepal
(nominal NRs.)
625 2,100
Total amount of remittance received
(nominal NRs.)
12,957,840,907 46,365,466,726
(Source: NLSS, 2012/13 vol.2)
According to this table, the proportion of households receiving remittance
has increased from 23 percent in 2003/04 to 32 percent in 2012/13. Average
amount of transfer earnings per recipient household has more than doubled
in nominal terms in the same period. Other significant change is in the share
of these remittances by sources: within Nepal and from other countries
including the Gulf account for more than half of the share. For those

31
households with positive remittance earnings, their share in total income has
increased from 27 to 35 percent. Overall, total amount of remittance received
has increased from about 13 billion NRs. to more than 46 billion NRs. In
nominal terms, while per capita remittance for the entire country has more
than tripled in nominal terms between two rounds of NLSS.
Rural households have higher proportion of recipients relative to their urban
counterparts. In particular, 40 percent of households in rural West
Mountains/ Hills receive transfer income. The average income transfer in the
form of remittance is Rs. 34,698 (in current prices) per recipient household in
2012/13. Among development regions, the amount is the highest in the West
(Rs.45,805) and the lowest in the Far-West (Rs.15,679). The difference
between urban and rural is more than twice (Rs. 68,981 versus Rs. 29,530).
The amount in Kathmandu valley urban is even higher (Rs. 118,998). Disparity
among consumption groups is very severe: Rs.65,514 for the richest quintile
versus Rs. 13,906 for the poorest quintile.
Per capita remittance- perhaps a better indicator for the whole population –
stands at NRs. 2100. Urban areas have double the size of rural areas but the
strongest association is seen with the level of household consumption. The
poorest consumption quintile receives one-eighth of what the richest quintile
receives in per capita terms.
Remittances flow from internal and external sources. According to the survey,
majority of remittances come from within the country, followed by India and
other countries. The Far-west and Mid-west have higher shares from India.
Perhaps a better indicator of source shares is by size of transfer incomes. The
survey summarizes number, size and share of remittances by source also.
NLSS II estimates that the total amount of remittance in the country is NRs 46
billion is nominal terms. India accounts for 23 percent, three Arab countries
for 27 percent, other countries for 17 percent and internal sources for the
32
remaining share. This is a large shift from eight years ago when internal
sources and India accounted for more than three-fourth of the total amount.
This is summarized in the following table.
Table 2.2
Share of remittances received by source
Source of remittance Share of remittance amount received (%)
Internal
Urban Nepal 12.4
Rural Nepal 11.1
External
India 23.2
Malaysia 9.6
KSA, Qatar, UAE 26.5
Other country 17.1
Other
Donor Agency 0.1
Nepal 100
(Source: NLSS, 2012/13 vol.2)
Majority of remittance-senders work as wage employees in non-agriculture
sector (72 percent), specially among those abroad where the share is as high
as 90 percent. The study also presents that the distribution of primary work
activity of senders. Most of the senders in agriculture wage employment are
from India, and the same is true for non-agriculture wage employment. The
study also summarizes the donors’ relationship with recipients by gender. 89

33
percent of donors are males while only 51 percent of recipients are males.
Among donors, 50 percent are sons/daughters of recipients, 22 percent
husbands/ wives and 11 percent fathers/mothers. This is summarized in the
following table.
Table 2.3
Relationship of Donor and Recipient by gender
(Percent)
Relationship Donor Recipient
Total Male Female Total Male Female
Husband/wife 22.5 97.1 2.9 22.5 2.5 97.5
Son/Daughter 49.8 89.6 10.5 10.7 51.8 48.2
Grandchild 0.2 57.5 42.5 0.0 0.0 0.0
Father/Mother 10.7 81.8 18.2 49.8 72.4 27.6
Brother/Sister 9.2 88.8 11.2 9.2 58.3 41.7
Nephew/Niece 0.6 80.8 19.2 0.0 0.0 0.0
Son/Daughter in law 1.7 72.2 27.8 0.8 85.2 14.8
Brother/Sister in law 2.1 65.6 34.4 2.1 48.3 51.7
Father/Mother in
law
0.8 100.0 0.0 1.7 20.1 79.9
Other relative 1.8 79.4 20.6 2.5 51.6 48.5
Tenant/Tenant’s
relative
0.0 100.0 0.0 0.0 0.0 0.0
Other person non 0.7 65.3 34.7 0.7 83.1 16.9

34
related
Total 100 89.2 10.8 100 51.5 48.5
(Source: NLSS, 2012/2013 vol. 2)
This survey also shows the contribution share of remittances in total
household income. About 35 percent of all household income comes from
remittances earnings in Nepal. Interestingly enough, there are quite small
differences among the geographical groups and consumption quintiles. This is
probably explained by the fact that these shares are for households with
positive remittances only and they would differ across groups if the analysis is
included all households.
As expected, majority of remittance senders are aged 15-44 but female
senders tend to be younger than their male counterparts. The survey displays
the number of remittances by means of transfer and origin. Of the total
remittances, 78 percent of remittances are transferred by person, 6 percent
via financial institutions and 2 percent via Hundi and 14 percent from other
means. This pattern generally follows in most cases, except from Malaysia
where majority of the remittances are send through financial institutions
which is 55 percent. This trend is summarized below.

35
Table 2.4
Distribution of number of remittances by means of transfer
And origin of remittance
(Percent)
Source of
Remittance
Means of Transfer Total
Financial
Institution
Hundi Person Other
Urban Nepal 0.3 0.5 74.3 24.9 100
Rural Nepal 1.3 0.1 80.7 17.9 100
India 0.8 0.0 92.0 7.3 100
Malaysia 54.8 13.9 31.3 0.0 100
KSA Qatar UAE 25.9 8.8 60.5 4.8 100
Other Country 29.3 13.1 49.2 8.5 100
Donor Agency 10.5 0.0 42.3 47.2 100
Nepal 6.0 1.9 78.4 13.8 100
(Source: NLSS, 2012/2013 vol.2)
2.3 Some studies on Remittance
Karki (2006), in his dissertation “Foreign Employment and Remittance
Economy of Nepal: A Case Study of Dhuseni VDC, Illam District” has attempted
to identify the impact of foreign employment and remittance in rural
community in the study area. Moreover he also tried to identify the past trend
of foreign employment and remittance of Nepal, socio-economic characters of
foreign employees, sources of financing and cost for foreign employment,
change brought by foreign employment and remittance in household
economy and uses of remittance. His study is based on both the primary as

36
well as the secondary data. Primary data were collected from the sampled
households in the study area and secondary data were collected from the
publication of CBS, NPC, and WB etc for the purpose of comparison of the
composition of foreign employment and remittance in his study. He has
analyzed the collected data by using simple statistical tools like percentage
and ratio.
E.G. Ravenstein, (1885) was the first person to attempt forming migration
theory. Revenstein’s “laws of migration” is also known as, push-pull factors of
migration; still predominates as framework of migration analysis. According to
him, push factors are land tenure system, unfavorable form of trade, wide
dispersion of poverty and income, pressure of rural poverty in income;
pressure of rural poverty in general and so on. Pull factors are employment,
education and other facilities are opportunities known as bright light of the
towns. On the one hand push factors push the migrants from their place of
birth and on the other hand pull factors pull the migration to the place of
destination.
M.P. Todaro (1976) states that migration is stimulated primarily by rational
economic consideration of relative benefit which are mostly financial.
Decision to migrate is influenced by the difference between expected income
between two places, the odds, probability of getting job in new area is
inversely related to employment rate in the new area.
E.G. Ravenstein, (1885) was the first person to attempt forming migration
theory. Revenstein’s “laws of migration” is also known as, push-pull factors of
migration; still predominates as framework of migration analysis. According to
him, push factors are land tenure system, unfavorable form of trade, wide
dispersion of poverty and income, pressure of rural poverty in income;
pressure of rural poverty in general and so on. Pull factors are employment,
education and other facilities are opportunities known as bright light of the
37
towns. On the one hand push factors push the migrants from their place of
birth and on the other hand pull factors pull the migration to the place of
destination.
M.P. Todaro (1976) states that migration is stimulated primarily by rational
economic consideration of relative benefit which are mostly financial.
Decision to migrate is influenced by the difference between expected income
between two places, the odds, probability of getting job in new area is
inversely related to employment rate in the new area.
The research report of NRB (2006) conducted by the Special Study Section Of
NRB entitled "Foreign Employment, Remittance Economy and Nepal" states
that the migration of Nepalese workers started after 1816's peace treaty
between Nepal and Britain. Most of the people of that time are migrated to
work in the British Regiments. This study examines about the historical
perspectives, present condition, The trend and dimension of Remittance, the
problems associated with the remittance and its measurements, the use of
the gained money as well as the skills, the investment pattern of that
remittance and also the employment condition of the people returned from
the foreign employment. It also examines about the Nepalese foreign
employment system and its objectives with other questions related with the
remittance. This study concludes that apart from India, about 86percent of
the people are migrated to Gulf Countries like Malaysia, Saudi Arab, Qatar,
Dubai etc. Rest percent are migrated to the other countries of the World. This
study examine about the role of manpower agencies in the field of foreign
employment. This study concludes that even though the role of manpower
agencies in obtaining Work Permit, Government acceptance letter, tickets etc
is very helpful but most of the manpower agencies of Nepal are looting the
people in the name of foreign employment.

38
This research report found in it's conclusion that the main problems of this
Foreign employment are lack of Proper technical as well as the practical
knowledge about the works which he/she had to perform in that countries,
lack of required information and the help from the manpower agencies,
problem of languages, culture and habitual activities, lack of the safe and
reliable financial institutions to send money from abroad, lack of required
social as well as economic equalities between the local workers and the
Nepalese migrated workers, the problem of Capital loans and management of
that capital which is required for the processing and the tickets for foreign
employment apart from those after reaching to the destination countries the
Nepalese workers are facing so many problems like not getting that proper
work which was promised in Nepal, retirements before the agreement time,
not getting the salary in time, unnecessary reduce in the salary, not getting
the minimum wage level also, not getting bonus and other facilities available
from the company, extended work time without extra salary or over time
salary etc.
According to Nepal Living Standard Survey (NLSS, 1996) 23 percent of all
households surveyed received remittances. In the rural areas the proportion
of households receiving remittances was 24 percent. Similarly, 38 percent of
all remittances came from India. (33 percent from other rural areas within
Nepal and 25 percent from urban areas within Nepal.) Remittances from the
other countries other than India accounted for nearly 3 percent of all
remittances. In the rural areas, 40 percent came from India, 3 percent from
other countries and around 58 percent elsewhere in Nepal.
Besides traditional sources like salaries and pensions of Gurkha soldiers
servicing in the British and Indian Army, thousands of Nepalese, Some of them
engaged in three "D" jobs (that is Dangerous, Dirty and Difficult) are sending
billions of rupees back home. This has emerged as a vibrant sector of the
country's economy (Source: www.nepalnews.com.np/ntimes/issue169/economy).

39
The study has concluded that the main destinations of Nepalese workers are
Gulf countries and Malaysia. Sixty percent of total workers are employed in
Gulf countries. The main countries are Saudi-Arabia, Qatar, UAE and Malaysia
etc. The remittance is increased in the year 2012/13 by 36 percent while base
year was 2004/05. The contribution of remittance to GDP in 2003/04 was
11.44 percent and the share of remittance in convertible foreign exchange
reverse was accounted by 46.9 percent in 2012/13. The average cost for
foreign employment was Rs.93.99 thousand. It ranges between Rs.45
thousand minimum to Rs. 150 thousand maximum. Source of financing for
foreign employment for 90.29 percent migrant worker was borrowings. The
major sectors of employment for Nepalese workers were building
construction (41.66%) and industry (26.38%). The Nepalese worker’s average
stay duration was 2.99 years. Most of the respondents of that study area want
to go again because of the unemployment (70.85%) and conflict (36.11%). Out
of the causes maximum respondents of Brahmin/Chhetri were suffering from
the conflict problem. The study summarizes that remittances have increased
their household economic and social indicators after returning from foreign
employment. Around 55 percent respondents said that remittances have
changed their economic status and standard of living and around 72 percent
said that increased their social attitude and around 90 percent respondent’s
skills. But around 36 percent respondents said that economic status has been
same, 44 percent have remained same standard of living, 27 percent said that
remained their social attitude same and 9 percent said that remained same
level of skill after returning from the foreign employment. Around 77 percent
respondents improve their condition of housing, 55 percent respondents
improve their education of children, 44 percent improve their health of family
members, 52 percent improve their clothing and 33 percent increased their
cash available. But around 15 percent respondents have worsened their
education of children, health of family members and cash available and
40
around 36 percent respondents have same level of education of children and
health of family members, around 47 to 50 percent have same level of
clothing and cash available.
The study has some recommendations for the betterment of the foreign
employment sector. These are : the policy should be made to solve the
conflict situation, create good environment and provided sufficient
technology as well as market, give more information to the respondents,
technical training institutions should be established in rural areas, the
required funds should be provided by the govt. sector for the people who
can’t afford foreign employment, the safe destinations for Nepalese people
for foreign employment should be declared by the government etc.
2.4 Research Gap
Many studies have been done in the field of Remittance. Such as,
Remittance income of Nepal, Contribution of Remittance income in national
revenue, A study of Remittance and migration, Impact of Remittance in living
standard of people, Impact and evaluation of Remittances etc. All the research
studies mentioned above are concerned with the study of Remittance income,
their impact on Economic sector, contribution of remittance in national
economy. Nation wise study regarding the role or remittance have been
studied but there is a lack of study on role of remittance in poverty reduction
with respect to people of Shree Krishna Gandaki VDC, Syangja. There are large
numbers of remittance holder in Nepal and they contribute large amount to
the national economy. It is the duty of the government to utilize the
remittance properly in financial sectors, mega project, productive sector and
agricultural sector so that it can help also to solve the unemployment
problems of Nation. It is found no more study have been done in the field of
Role of remittance in poverty reduction. Although it is related to the

41
remittance but this study is different from other studies because it focuses
mainly on the role of remittance in poverty reduction among people of Shree
Krishna Gandaki VDC, Syangja.

42
CHAPTER III
RESEARCH METHODOLOGY
3.1 Research Design
This study is a case study of Krishna Gandaki VDC. It is a micro level study. This
is analytical as well as descriptive type of research design. The main objective
is to review the role of remittance income, therefore the required data to
meet the objectives of this study, are taken from the primary as well as
secondary sources. The simple statistical tools are used to describe and
analyze the results.
3.2 Nature and Sources of Data
The study entitled “Role of remittance in rural poverty Reduction” is the case
study of Krishna Gandaki VDC of Syangja. Basically, the study is based on the
primary data; it is also from the relatives of the migrated people in absence of
the family of the migrated people. The required data is collected from the
field study of the researcher himself as well as some data’s about remittance
is taken from the secondary sources which are both published as well as
unpublished,. The required data are collected by using the questionnaire
method. The collected data are processed according to the need of the study.
3.3 Population and Sample
In Krishna Gandaki VDC, there are 797 households and total population is
4552. Among them the working age population is only 1999 (the populations
aged between 19 yrs to 60 yrs are categorized into the working age
population). Among the total no of households total of 24 households are
migrated to another places in the year 2062/63 B.S. Among the total
population about 36.6 percent of the people are migrated to another place.

43
Among them about 36.3 percent of the people are migrated for their further
studies and about 18.7 percent of the people are migrated for work. From the
797 total households in the study area, 100 households were selected using
proportional to size with random sampling method. In order to make the
study meaningful as well as advanced, within the limited time period a larger
sample size was not feasible. The sample is more than 12.5 percent of the
total households, which can be considered to be representative of the
universe of study. The strata are the nine wards of the VDC; the selection of
sample households is each ward is made proportional to the size basis. The
size is the total number of the households in each ward. This survey was
conducted from June 2, 2007 to June 14, 2007 A.D. The selection of sample
size is given in the following table.
Table 3.1
Sample size of respondents’ household of Krishna Gandaki VDC
Ward No. Total Number of Household Number of sampled household
1 85 10
2 63 8
3 145 18
4 55 7
5 78 9
6 112 14
7 73 9
8 40 6
9 146 19
Total 797 100

44
(Source: field Survey, 2013)
3.4 Data Collection Procedure
3.4.1 Primary Data Collection
All the selected 100 household of returnees’ respondents were interviewed
and relevant information was collected through the medium of
questionnaires. The questionnaires included open and close ended questions.
Personal interview was taken by researcher and the questionnaires were
filled. Cross checks, editing and indirect questions were also put sometimes
when the answers were through to be unrealistic and irrelevant. The format
of the questionnaire is given in the appendix.
3.4.2 Secondary Data Collection
Except Primary data some other data related to the study had been collected
from the secondary sources also, which can be official as well as unofficial.
The relevant data are complied from publication of the National Planning
Commission secretariat: Central Bureau of Statistics (CBS), Budget speeches of
GON, Economic Surveys published by NRB, Nepal Living Standard Survey by
CBS, Economic Reports by NRB, other quarterly and annual publications of
NRB, different records of department of labor GON and other periodical,
journals, books, magazines, seminar papers, reports of research centers data
and information from donor agencies like WB, ADB, IMF, UNDP etc.
3.5 Data Analysis
While analyzing the data, the available data from the various sources is
collected, classified and tabulated to meet the needs of the study. Data

45
processing is done with the help of a scientific calculator and the computer.
Data will be presented in percentage from when require, tables, graphs,
diagram is used to meet the requirement of this study. Data is studied
comparatively to get required results about the efficiency of that remittance
income and the effect of that remittance income in the research area.

46
CHAPTER IV
DATA PRESENTATION AND ANALYSIS
This chapter is all about the description of the social characteristics of the
respondents, status of economic condition, occupation causes to seek foreign
employment, mediums used to obtain foreign employment, destination,
duration of stay in abroad, income earned in abroad, system of transfer
remittance income, uses of remittance income and the effect of the
remittance in the poverty situation and change in the life status of the family
of the migrated worker etc. In other words, this chapter deals with all the data
related to the topic which are collected in the field survey.
4.1 Geographical Background
Syangja district lies in Gandaki Zone of western Nepal; it is one, out of six
district of this zone. Syangja district is about 45 km far from zonal headquarter
Pokhara. Its height ranges from the 366 m to 2515 m above the sea level.
Syangja is surrounded by five districts, there is Gulmi and Parbat district are in
the west, Palpa district in the south, Kaski in the north. The total area of
Syangja District is 1164 sq. km. This district covers about 0.79 percent of the
total area of the country. Krishna Gandaki VDC is located in the western part
of the Syangja District, Gandaki Zone, Nepal. The area of Syangja District is
1164 sq. km. There are sixty village development committees and two
municipalities in Syangja district. According the population census 2013, the
total population of the Syangja district is 3, 17,320, whereas the total
population of the Krishna Gandaki VDC is 4552. The sex ratio of the Syangja
District is 0.83. The population under the age of 14 years is about 40.5% and
the population over the age of 60 years is about 9.2 % therefore the
dependency ratio in this district is very high. The annual growth rate of

47
Syangja District is quite low comparing with the national level; it is 0.77%
whereas the whole national figure is about 2.4%. There are 64,746
households in Syangja District whereas; the total no of household in this VDC
is 972. The average household size in the Syangja district is about 4.90, which
is quite high in this present situation. The population density of the Syangja
district is 273. The literacy rate of the Syangja district is 66.32 which is
comparatively high than the national figure. In Krishna Gandaki VDC, among
the total population of 4552, the total population of male is 1981 and the
population of female is 2571. Comparatively, the no of female are very high
than the male population.
The Krishna Gandaki VDC is about 260 kilometer from the national
headquarter Kathmandu and it is about 98 km from the zonal headquarter
Pokhara. Krishna Gandaki VDC is about 59 kilometers from the district
headquarter Putali- Bazzar. The total area of Krishna Gandaki VDC is 20.15 sq.
km. The height of this VDC ranges from 1500 to 8000 ft. There is total of about
2025 hectare of land in which about only 859.49 hectares of land is agriculture
land. Particularly among all the available land in this VDC about 42% of the
land is only agriculture land, 30% is forest land and 28% others. The total
length of this VDC is about 5km and width is about 4.5 km. It is located in the
path-way of the Nepal’s largest hydroelectricity project “Kaligandaki
hydroelectricity Project”. The east part of the VDC is bordered by Darsing
Dahathum VDC, west by Dhapuk Simal Bhanjyang VDC, North by Arjunchupari
VDC and south by Sorek VDC. This VDC has no any highways and no any parks.
Near about 70 percent of the population of this VDC got electricity facilities
and about 30 percent people of this VDC got mobile phone services. The
ethnic groups of this VDC constitute Brahmin, Chhetri, Magar, Gurung, Kami,
Damai, Sarki and Majhi etc according to the CBS census 2001.About 75
percent of the total population of this VDC are literate.

48
Here most of the people are engaged in the farming and rest are engaged on
other occupation such as business, government jobs, foreign labor, local labor,
student etc. which are categorized in non agriculture sector of occupation.
Agriculture is the main occupation of the people of Krishna Gandaki VDC. The
main crops are paddy, millet, wheat, maize, potatoes, and vegetables etc. and
the domestic animals on this VDC are Buffalo, cow, goat, sheep and poultry
etc.
4.2 Demographic Background
4.2.1 Sex status
According to the CBS population census 2013, the total population of this VDC
is 4552 out of which 1981 males and 2571 are females. The total households
are 797. The following table no. 6 gives the ward-wise and sex-wise
distribution of population of the study area.
Table 4.1
Sex Status in Study Area
Ward No. Total
Households
Population Total
Population Male Female
1 85 188 269 457
2 63 166 216 382
3 145 340 458 798
4 55 141 181 322
5 78 225 267 492
6 112 293 323 616
7 73 187 256 443

49
8 40 94 129 223
9 146 347 472 819
Total 797 1981 2571 4552
(Source: Field Survey, 2013)
The above table 4.1 shows that among the total population of 4552, in all the
wards of the VDC, the sex ratio is higher i.e. the no of female population is
more than the no of male population according to the CBS census 2001.
Among the wards the sex ratio is highest in ward no 1, which is 1.43 and
lowest in ward no 6, which is 1.10. Taking average of the sex ratio is 1.3.
Among all the 9 wards according to the demographic status ward no 9 is the
biggest ward which has 146 households and total population of 819. Ward no
3 is also near by ward no 9, which has also 145 households. Among the wards
ward no 8 is the smallest ward with 40 households and total population of
223.
4.2.2 Education Status
It is surely will not be the subject of debate that education is the main factor
determining the foreign level employment and the earning from that foreign
employment i.e. remittance. Besides that, education also helps to reduce the
poverty because of educational employment in the home country also. Thus in
the study area realizing the above fact that education is the prime factor for
reduction of poverty, there are so many educational institutions. There are 1
public campus, 3 higher secondary schools, 4 secondary school, 1 lower
secondary school 5 primary schools and two private boarding schools. The
following table 10 gives us the information about the education status of the
study area (sample households).
Table 4.2
Educational Status of Sample Households

50
(6 years of age and over)
Educational Status Male Female Total Population
Total Percentage
No. % No. %
Illiterate 38 16.66 67 22.94 105 20.19
Literate 52 22.82 112 38.36 164 31.54
Educated up to SLC Pass 95 41.66 91 31.17 186 35.77
Well Educated (Bachelor level and above)
43 18.86 22 7.53 65 12.5
Total 228 100 292 100 520 100
(Source: Field Survey, 2013)
The above table 4.2 shows that out of 520 sample population 105 people are
illiterate, 164 people are literate, 186 people are educated up to SLC level and
65 people are well educated (Bachelor level and above). In the above table it
is clearly shown that the number of female illiterate is more than the no of
male illiterate. Most of the male population is educated above SLC level but
most of the female are only literate. In the sample area the literacy rate is
quite high in comparison to the national index. The literacy rate in the sample
area is 79.81.
4.2.3 Family Size
Table 4.3
Distribution of Sampled Household by Family Size
Family Size No of Households Cumulative
1-2 18 18
3-4 37 55
5-6 27 82
7-8 12 94
Above 8 6 100
Total 100
(Source: Field Survey, 2013)

51
The above given table 4.3 shows that, the highest no of family size is 3-4
member family household, which is 37 percent. In the same way the lowest
number of family size is above 8 member family household which is only 6
percent in the total of 100 households. Nowadays the young and educated
parents have not more than two children because of the family planning. But
more households have more than two children because of their ignorance, the
desire or emphasis on male child rather than the female child and child marriage
etc. which is another major factor of poverty in the study area.

52
4.2.4 Age of the study area:
Table 4.4 Distribution of Population by age groups
Age Group Male population
Female population
Total Percent
Below 15 years 911 867 1778 39.06
15-29 years 377 713 1090 23.94
30-44 years 238 433 671 14.74
45-59 years 226 344 570 12.52
60-75 years 190 179 369 8.12
Above 75 years 39 35 74 1.62
Total 1981 2571 4552 100.00
(Source: Field Survey, 2013)
Table 4.4 shows that out of the total population of this VDC about
39.06 percent population belongs to the age below 15 years which means that
the dependent population is very high in this VDC. The population of working
age (age between 15 to 44 years) is only 38.68 percent. The population above
60 years is 9.74. If the population between the ages of 15-60 years regarded
as economically active population than below 15 years and above 60 years are
regarded as economically inactive or dependent population. Based on that
above assumption, there is very high dependency ratio, which is 48.8 percent.
This high dependency rate is also one of the major causes of high poverty
situation in the study area.

53
4.2.5 Occupational Status
Table 4.5
Distribution of Household and Population According to Major Occupation
Main Occupation No. of
Households
Economically Active population
(Age 15-59 years)
No. Percentage
Agriculture 78 212 72.60
Non-Agriculture 22 80 27.4
Total 100 292 100.00
(Source: Field Survey, 2013)
4.2.6 Ethnic Composition
Table 4.6
Distribution of Total Sampled Population and Household by cast
S. N. Cast/Ethnic Group Total No of
Sampled
Households
Total Sampled
Population
No Percent
1. Chhetri 38 195 37.5
2. Bhramin 27 130 25.0
3. Gurung 10 51 9.80
4. Kami 7 37 7.12
5. Magar 6 33 6.35
6. Sarki 5 35 6.73
7. Others 7 39 7.50
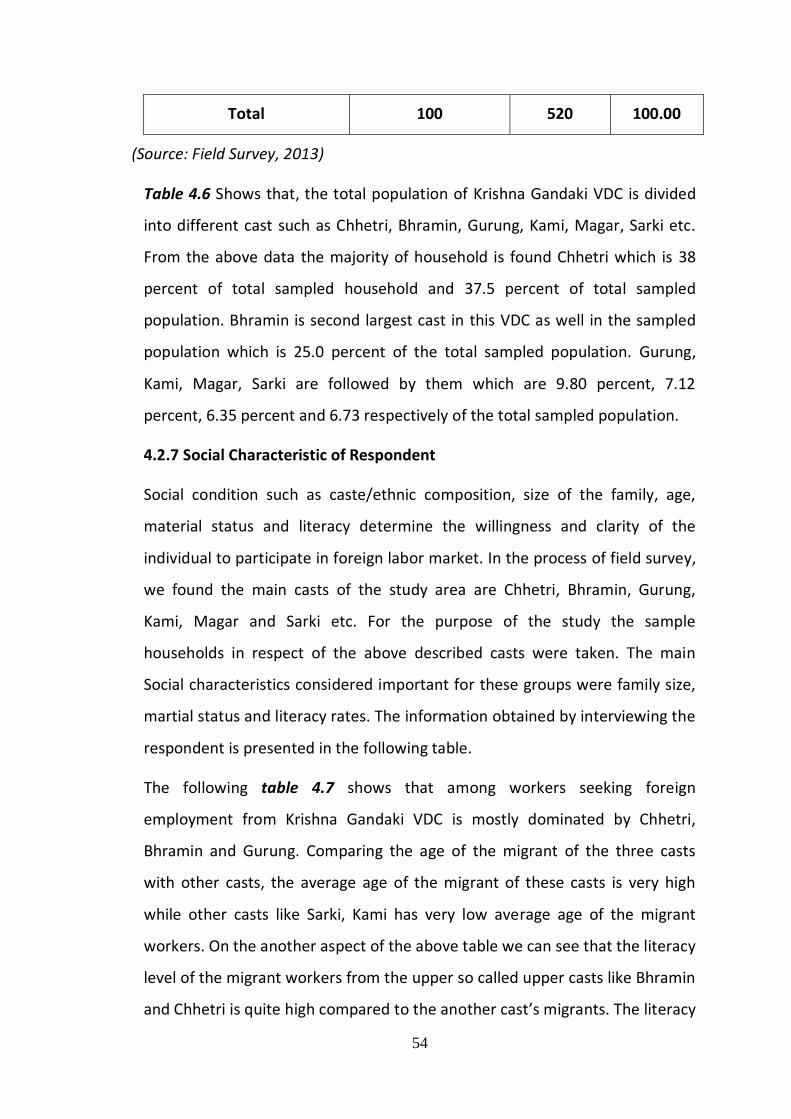
54
Total 100 520 100.00
(Source: Field Survey, 2013)
Table 4.6 Shows that, the total population of Krishna Gandaki VDC is divided
into different cast such as Chhetri, Bhramin, Gurung, Kami, Magar, Sarki etc.
From the above data the majority of household is found Chhetri which is 38
percent of total sampled household and 37.5 percent of total sampled
population. Bhramin is second largest cast in this VDC as well in the sampled
population which is 25.0 percent of the total sampled population. Gurung,
Kami, Magar, Sarki are followed by them which are 9.80 percent, 7.12
percent, 6.35 percent and 6.73 respectively of the total sampled population.
4.2.7 Social Characteristic of Respondent
Social condition such as caste/ethnic composition, size of the family, age,
material status and literacy determine the willingness and clarity of the
individual to participate in foreign labor market. In the process of field survey,
we found the main casts of the study area are Chhetri, Bhramin, Gurung,
Kami, Magar and Sarki etc. For the purpose of the study the sample
households in respect of the above described casts were taken. The main
Social characteristics considered important for these groups were family size,
martial status and literacy rates. The information obtained by interviewing the
respondent is presented in the following table.
The following table 4.7 shows that among workers seeking foreign
employment from Krishna Gandaki VDC is mostly dominated by Chhetri,
Bhramin and Gurung. Comparing the age of the migrant of the three casts
with other casts, the average age of the migrant of these casts is very high
while other casts like Sarki, Kami has very low average age of the migrant
workers. On the another aspect of the above table we can see that the literacy
level of the migrant workers from the upper so called upper casts like Bhramin
and Chhetri is quite high compared to the another cast’s migrants. The literacy

55
level of the migrants of Bhramin is 100 percent where the literacy percentage
of the Chhetri is almost 93. The above table presents the another fact that the
family size of the respondents from the low casts like Sarki, Kami, Magar and
other is high compared to Bhramin which is also playing the vital role to
foreign employment for the young and dynamic labor forces even they are
educated also. Most of the people of the lower cast marries in their childhood,
which means that the percent of the married population in the lower cast in
comparison to the other cast id very high which is also the another main
important aspect as a push factor of foreign employment.
Table 4.7
Average Family Size, Age, Martial Status and Literacy
Percentage of Different Ethnic Groups of Sampled Households
Caste/Ethnic
Group
No. of
Respondents
Average family
size (no.)
Percent of
married
Percent of
literate
Chhetri 38 5.13 61.3 92.8
Bhramin 27 4.81 58.2 100
Gurung 10 5.1 71.3 80.3
Kami 7 4.28 80.7 68.2
Magar 6 5.5 70.5 75.6
Sarki 5 7 83.2 62.5
Others 7 5.57 78.6 76.9
Total 100 5.34 71.97 80
(Source: Field Survey, 2013)
4.3 General poverty level

56
4.3.1 Household Status
This title gives us the information about the poverty situation of the sample
households form the structure and condition of their houses.

57
Table 4.8
Sample Households Made by Different Types
S. No. Types of Houses No of Sample
Households
1. Made with Rod, Concrete and Cement 18
2. Made with stone and mud tin and slate stone
roof
54
3. Made with stone and mud and thatched roof 28
Total 100
(Source: Field Survey, 2013)
The above given table 4.8 shows that most of the sample households have
made with stone and mud with tin in the roof. These type houses are 54
percent. After that type of houses there are 28 houses made up with stone
and mud and thatched roof. Remaining 18 percent (18 houses) are made with
concrete.
4.3.2 Size of Land Holding
In the study area, most of the people’s main occupation is agriculture.
However, there is extreme inequality in the distribution of land. The land is
categorized into three forms, i.e. Khet, Bari and Pakho. Most of the poor
families don’t have Khet. They have only small pieces of land (Pakho and Bari),
and few of them have Khet. The following table shows the unequal
distribution and holding of land among the sample households.

58
Table 4.9
Distribution of Land among Sample Households
Size of land Holding (Ropani) No. of Households
Landless 4
Below 2 18
2-5 21
5-10 19
10-15 21
15-20 11
Above 20 6
Total 100
(Source: Field Survey, 2013)
The above given table 4.9 shows that there is unequal distribution of land
among the total sample households. Among the 100 households 4 percent
households are landless, percentages of land holding households below 2
Ropani and 2 to 5 Ropani are 18 and 21 percent respectively. Similarly, 5-10
Ropani is 19 percent, 10-15 Ropani is 21 percent, 15-20 Ropani is 11 percent
and above 20 Ropani is 6 percent respectively. So, the unequal distribution of
land is also playing as a role of catalyst for the poor families to go to the
foreign employment, it can also be said that unequal distribution of land is
one of the causes of poverty in the study area.
It is known to all of us that the land holding is not only factor determining the
level of poverty in the study area, the holding of live stocks, holding of poultry
with the holding of land are also the determinants of the poverty situation.
The no of households having land with other livestock and poultry is shown in
the following table.

59
Table 4.10
Households Having Agri-Land, Livestock & Poultry in the Study Area.
Land
only
Livestock
only
Poultry
only
Land and
Livestock
Land
and
poultry
Livestock
and
poultry
Land
livestock and
poultry
None
of all
Total
37 4 1 260 8 2 463 22 797
(Source: Field Survey,2013)
The above table 4.10 shows that the no of households having land, livestock
and poultry is highest in the study area, which is 58 percent. The no of
households having none of all is 22, the households having land only is 37 and
the no of households having land and livestock is also the high in the number
which is 260 (32.62) percent. It clearly shows the unequal distribution of
factors of poverty measurement, which is another push factor of foreign
employment to the people of the study area.
4.3.3 Sources of Income of Sampled Households
In the study area even though the different people are engaged in the
different occupations like Agriculture, Jobs (government as well as private),
Business and Foreign Employment etc. which are the main sources of income
of the respondents family of the study area. The situation of the income
depending on their sources in the sampled households is shown in the
following table.

60
Table 4.11
Sources of Income of the Sampled Households
S.No. Sources of Income Number Of
Households*
Percentage
1. Agriculture 78 40.83
2. Business 45 23.56
3. Jobs 24 12.57
4. Foreign Employment 32 16.75
5. Others 12 6.29
6. Total 191 100
(Source: Field Survey, 2013)
(Note: Due to multiple answers the total no of sample households is more than 100)
The above table 4.11 presents the income sources of the respondents of the
sample area. From that table we can find that most of the family depend up
on the Agriculture, the second largest sources of income is Business whereas
the third largest source of income is Foreign Employment whereas about 17
percent of the household’s main source of income is Foreign Employment.
4.3.4 Status of Economic Condition
Economic condition is one of the most important factor of emigration. It is
expected that people from lower economic condition (the type of people with
problem in fulfilling their basic needs) should seek foreign employment.
Mainly the lower economic condition families went to India for foreign
employment because of the cost of funding, foreign employment is quite high
and poor people may not be able to afford it. In this VDC respondents were
classified into lower, lower middle, middle and high income group according

61
to their own assessment of their economic condition. The information
obtained is presented in the following table.
Table 4.12
Frequency Distinction of Economic Condition of Different
Ethnic Groups of Respondents from Krishna Gandaki VDC
Cast/Ethnic group No. of
Respondents
Economic Condition
Lower
Income
Group
Medium
low
Income
Group
Medium
Income
Group
Higher
Income
Group
Cheetri/Bhramin 65 16 21 17 11
Gurung 10 2 1 4 3
Kami 7 5 1 1 -
Magar 6 4 1 1 -
Sarki 5 5 0 0 -
Others 7 4 2 1 -
Total 100 36 26 24 14
(Source: field survey, 2013)
Lower Income= upto Rs. 60000 per annum
Lower Medium Income= Rs 60000 to 150000 per annum
Medium Income Group= Rs. 150000 to 300000 per annum
Higher Income Group= More than 300000 per annum
Table 4.12 presents the summary about the economic condition of the
respondents and their family. From the above table we can see that among
the sample households most of the households are Bhramin and Chhetri,

62
where they are quite strong economic background i.e. 11 household from
total of 65 households are from high income group whereas 17 households
are from medium income group, 21 households are from medium low income
group and only 16 households are in the lowest income group, in percent only
the 24.61 percent of the population from bhramin and Chhetri are in lower
income group. After Bhramin and Chhetri, Gurung are the economically strong
cast in which only the 20 percent of the total household are in lower income
group. Among the sample households Sarki cast is the poorest cast in which all
100 percent of the sample households are in the lower income group. From
the above table we can se that there is no any family in the high income group
besides bhramin/Chhetri and Gurung casts.
4.3.5 Causes Seeking to Foreign Employment
Even though the poverty being the main factor of foreign employment; there
must be several reasons of seeking foreign employment. The reason may be
economic, social or political. They may be related to the acquired skills and
various other reasons. To find out the causes of seeking employment the
respondents were asked to identify the prime causes to go for foreign
employment. They gave more than one reasons as follows;
Table 4.13
Frequency Distribution of Causes of Seeking Foreign
Employment from Krishna Gandaki VDC
Cast/Ethnic
Groups
No. of
Respondents
Causes
Unemployment Family
Debt
Conflict Earn
Money
Cheetri/Bhramin 65 63 24 11 23
Gurung 10 10 3 2 4
Kami 7 5 7 0 2
Magar 6 5 3 2 2

63
Sarki 5 5 4 0 1
Others 7 6 4 0 6
Total 100 94 42 15 38
(Source: Field Survey, 2013)
(Note: Due to the multiple answers the total will be more than 100 percent).
Above table 4.13 shows that unemployment is the main cause of foreign
employment for all the casts and ethnic groups. Among all the sample
households about 94 percent of the sample households had stated
unemployment as the main cause of foreign employment. The second main
important cause is family debt burden which is also playing as the major push
factor of the foreign employment. Comparing the other casts with Bhramin
and Chhetri, the percentage of emigrated population due to Family debt
burden quite high in the case of other casts like Sarki, Kami and other casts.
Among the total sample households about 42 percentage of the respondent
are emigrated due to the family debt burden. Which means that, among the
ethnic groups Sarki, Kami, Magar, and other Dalit showed higher percentage
of family debt burden than Cheetri/Bhramin. The third reason of foreign
employement is to earn money, the percentage of respondents stating the
major cause is earn money and family debt burden are quite similar i.e. 38
percent respondents has emigrated to the foreign countries to earn more
money then they were earning in Nepal before emigration to the foreign
countries. After that 15 percent of the respondents had stated that they are
migrated due to the conflict problem of Nepal. About 17 percent of the
migrated Cheetri/Bhramin are migrated to avoid conflict or to save their lives.
Chhetri/Bhramin group were predominately more inciting from conflict.
It was concluded from our study that employment, Family Debt, Earn money
and conflict are the main causes to seek foreign employment.
4.3.6 Cost paid for Foreign Employment

64
A sizable amount of money needs to be invested as a cost of foreign
employment. The costs start from obtaining a passport, medical checkup,
manpower agency commission, visa expenditure, air fare, cost of internal
travel time to time from home area to Kathmandu and also to the district
headquarter Syangja and hotel charge in Kathmandu at the time of processing
for the foreign employment. To find out the costs paid by the respondents,
they were asked to quote expenses in different categories. The summarized
version of the cost pain by the different income groups is given in the
following table:
Table 4.14
Average Cost Paid and Range of Costs for Foreign Employment
By Different Ethnic Group from Krishna Gandaki VDC
(In Rs. ‘000’)
Cast/Ethnic
Group
No of
Respondents
Average
cost (in Rs.
000)
Ranges of Cost
Minimum Maximum
Cheetri/Bhramin 65 90 5 1089
Gurung 10 88.5 20 150
Kami 7 8 2 60
Magar 6 49.5 10 95
Sarki 5 12 1.5 80
Others 7 52 20 120
Total 100 50 1.5 324
(Source: Field Survey, 2013)

65
Above table 4.14 shows that Average cost paid for the foreign employment is
Rs. 50 thousand. Bhramin and Cheetri had pain high average cost than the
other group because they prefer developed countries like USA, UK, JAPAN and
Korea etc. for foreign employment where as other lower income groups like
Kami, Sarki and others has very low average cost because they usually prefer
to go to India and other neighbor countries for foreign employment. The
Traveling cost to those countries is very cheaper and in the case of India, there
is no any Visa charge to enter. In the case of same countries, Dalit had paid
high average cost than other group because they have not more information
about foreign employment. The Chettri/Bhramin had pain highest average
cost for the foreign employment which is 90 thousand, secondly Gurung also
had paid high average cost for the foreign employment which is 88.5 thousand
which is quite similar to the cost paid by the Cheetri/Bhramin’s. After that
Magar and Other casts had paid average of around 50 thousand for the
foreign employment. Kami and Sarki Ethnic groups had paid very low average
cost of Rs.8 thousand and Rs.12 thousand respectively. We can see that there
is too much variation in the cost of the foreign employment in all types of
cast/ethnic groups. This is because the cost paid to immigrate to India is very
low where as the cost pad for the other developed countries are quite high
compared to India. The lowest cost paid by the respondents of the sampled
households is 15 hundred rupees which is paid by Sarki cast to immigrate to
India whereas the highest cost paid is Rs. 1,089 thousand to immigrate to USA.
It shows that the respondent of this VDC had wide range of cost and it was
high variability with the sample.
4.3.7 Source of Financing
Most of the rural people of Nepal who want to go for foreign employment use
several sources of financing the cost involved. In the study area, the mostly
used sources of financing are Loan (from banks as well as from the local
merchants), sales of property including land, internal saving as well as funds

66
mobilize through friends and relatives. To find out the extent of sources used
by the respondents they were asked to provide their source and the amount
with its promised interest amount for the foreign employment. The
information collected is presented in the following table.

67
Table 4.15
Frequency Distribution of Source of Financing of Cost of Foreign
Employment for Different Ethnic Groups of Krishna Gandaki VDC
Cast/Ethnic Group No. of
Respondents
Sources of Financing
Loan Sales of property Family Saving
Cheetri/Bhramin 65 52 - 13
Gurung 10 6 - 3
Kami 7 6 1 -
Magar 6 4 1 1
Sarki 5 5 1 -
Others 7 4 2 1
Total 100 77 5 18
(Source: Field Survey, 2013)
Above table 4.15 shows that 77 percent respondents of the total borrowed
loan to pay for the cost of foreign employment. Another 18 percent
respondents had paid from their family savings and only 5 percent
respondents had paid to the cost of foreign employment by selling their
property. Only the low income groups like Kami, Sarki, Magar and others sold
their land and other property to pay for the foreign employment. Among the
respondents who use family saving the maximum number was from
Chhetri/Bhramin categories.
It can be concluded that the cost of foreign employment is financed by
borrowing and family savings. Family saving is used by so called upper casts
like Bhramin and Chhetri.
4.4 Nature and extent of remittance income
4.4.1 Extent of Poverty and Unemployment
It is clear to all of us that Unemployment is the main cause of the poverty in
any state and the unemployment plays the major role of migration to the

68
other places from their native born place. In this study also we found that the
main cause of the migration of the youth of the study area is due to
unemployment in their own country. Most of the workers of the study area
are migrated to those countries where they don’t need any special
qualification to migrate like India, Qatar, Malaysia, UAE, KSA and other Gulf
countries and also to other south Asian countries. Their migration to the
different countries depends up on the economic condition of their family, and
also the regular money income of the members of the family. This is shown in
the following table:
Table 4.16
Regular Money Income of the Sample Households
S.N. Regular Monthly Income (in NRs.) No of Households
1. Less than 5000 24
2. 5000-10000 21
3. 10000-20000 35
4. 20000-50000 14
5. Above 50000 6
Total Households 100
(Source: Field Survey, 2013)
The above Table 4.16 presents the fact of the sample households of the study
area that about 45 percent of the total sampled households receive less than
NRs.10000 per month. Which means an average of NRs 1650 per month is
available to each person of the sample households. This is very below the
absolute poverty line. Only 6 percent of the households receive more than
50000 per month as the regular income. Among the hundred households
about 24 percent of the households receive less than NRs. 5000 per month,
which is the very low level of poverty for the existence of the family members.
The above given table is dependent on the production of agricultural products

69
also therefore if the weather and other factors behave against them, the
income condition can also be very less than the stated level. It was already
stated in the table 4.16 that the main occupation of 78 percent of the people
of the study area is agriculture. Which means about 78 percent people has
disguised unemployment and seasonal unemployment. The occupational
dependency is also another cause of the foreign employment of the study
area. The kind of unemployment and the level of unemployment are shown in
the following table:
Table 4.17
Employment Status of the Sample Households
S.N. Group of Population No of people Employment Status
(employed people)
Percent
1. Active Population 292 172 58.90%
2. Inactive Population 228 0 0%
3. Total Population 520 172 33.077%
(Source: Field Survey, 2013)
The above given table 4.17 shows that in the sample households of the study
area, only about 58% of Active population are employed but as overall
situation only about 33% of the population are employed it means that about
67% of the population of the study area are unemployed which is very higher.
Among those employed population about 15% of the population are
employed in their own agricultural works i.e. they are also in the form of
disguised unemployment and seasonal unemployment. Therefore to be very
specific only about 18% population of the study area is employed as full
employment. In that figure of 18% population about only 7% of the total
population are employed in the permanent jobs rest of the population are
employed in the temporary jobs and the foreign employment.

70
Thus, as a conclusion form the above table 4.17 we can say that on the one
hand among the total population of 520 about 43 percent of the population
are fully dependent population and on the other hand among the active
population of 292, about only 58% of the population is employed it means the
rate of employment of the study area is very low and the rate of dependency
in the study area is very high.
4.4.2 Most Favored Destinations of Nepalese Workers:
The most favored destination countries for Nepalese workers for foreign
employment is defined from the perspective of the number of workers in that
country. It might be either related to the level of skill needed to entry into the
country for any type of work or it might be related to the conditional ties and
the cost to entry to that particular country. In other part of this discussion the
wage factor might be also the main issue of the workers.
Generally the Nepalese workers are either unskilled or semi-skilled, so they
prefer those countries for the foreign employment where they can adjust with
their qualification. So, the Gulf or Arabian Countries are being the easiest
destinations for Nepalese workers to get employment and earn some money.
The countries which have maximum number of Nepalese workers in different
fiscal years is given in the following table:
Table 4.18
Number of Nepalese Migrant Workers in Different Countries
In Selected Fiscal Years:
FY S Arabia Qatar UAE Malaysia Total
2007/08 17867 8791 6360 171 33184
2008/09 17966 14086 8950 11306 52308
2009/10 21094 19895 8411 52926 102526

71
2010/11 17990 26850 12650 43812 101302
2011/12 16875 24128 12760 45760 99523
2012/13 13366 42394 12626 66291 134677
(Source: Labor and Employment Promotion Department, 2013)
The above table 4.18 indicates that up to FY 2007/08 Saudi Arabia received
the maximum number of Nepalese of workers in one country and Qatar
followed by Saudi Arabia. In 2012/13 Malaysia received the highest number
followed by Saudi Arabia. Form 2012/13 onwards Malaysia remained first and
Qatar remained second most desired country by the Nepalese workers. The
importance of Saudi Arabia has some what diminished in those years as a
principle employing country for Nepalese foreign employment seekers. It is
also the evident from the table that there is rapid growth in the demand for
Nepalese workers in Malaysia and Qatar. There is stable demand in United
Arab Emirates. There is declining trend of Nepalese workers in Saudi Arabia. In
these days, because of the inequality in the salary for the Nepalese workers
related to the workers from the other countries, the employment policy of the
government of the Malaysian Government etc, the rising trend of Nepalese
workers to Malaysia is also tend to decrease in the early 6 months of this
Fiscal Year. The data shows that in these early 6 months of this present FY, the
Nepalese workers prefer to go to Qatar and Dubai of UAE.
4.4.3 Foreign Labor Employment: Trend and Composition
Restoration of democracy in 1990’s opened the door of international labor
market. Near about 8 million nonresidential Nepalese are spread over forty
countries (Department of Labor, 2003). The supply of Nepalese youth in
foreign countries in search of work is increasing say by day at a high rate;
which is unstoppable in this present trend of migration. The distribution of

72
Nepalese about as shown by the population census of 2011 is given in the
following table.

73
Table 4.19
Number of Migrant Nepalese Working in Different Countries in 2011
S.N. Countries Number of People In Percent
1. India 589050 74.95
2. Saudi Arabia 67460 8.58
3. UAE 12544 1.60
4. Malaysia 6813 0.87
5. Qatar 24397 3.10
6. Hong Kong 12001 1.53
7. Korea 26079 3.32
8. Singapore 3363 0.43
9. Kuwait 3688 0.47
10. Bahrain 2737 0.34
11. Japan 3720 0.47
12. China 1354 0.17
13. Russia and Other 747 0.09
14. Other Asian Countries 3849 0.48
15. Australia 2497 0.32
16. United Kingdom 7271 0.93
17. Germany 1638 0.21
18. France 250 0.03
19. Other European Countries
1998 0.25
20. USA, Canada and Mexico 9557 1.22
21. Other countries 1877 0.24
Total 785890 100
(Source: Population Census 2011, National Report CBS)
Above table shows that total absentees of the country, reported by the
population census report 2011, is 785890. Out of this number 598,050 people
i.e. 74.95% of total absentees have gone to India, which implies that migration
in Nepal is still associated with India, Major destination of Nepalese emigrants

74
except India are Hong Kong, Malaysia, Saudi Arabia, Qatar, UAE, UK and USA
etc. More especially, only three Gulf countries Saudi Arabia, Qatar and UAE
have contained 60 percent of Nepalese absentees except India. This brings the
fact that Nepalese emigrants are mainly in this three countries.
4.4.4 Foreign Employment Status :
The Government of Nepal, Labor and Employment Promotion Department has
opened 107 countries where Nepalese workers can go for employment
purposes. Out of them, 91 countries have been recognized after the year
1997/87 A .D. Even though all the required data is not available with the
official agency and department of the country, the available record shows that
Nepalese people have spread all over the world from south Asia to America,
Europe and Africa. According to the report prepared by Labor and
Employment Promotion Department of the government, the number of
people in search of foreign employment can be shown in the following table:
Table 4.20 Foreign Employed Status
Part of the World in Different Fiscal Year: FY Arabian
Countries East Asia
South East Asia
Other Asian
Countries
Africa Europe America Australia
Other Total
2003/2004 2015 114 - - - - 5 2134
2004/2005 2638 522 51 - - - 48 3259
2005/2006 7166 347 89 - - - 143 7745
2006/2007 26883 696 171 46 - - - 27796
2007/08 34098 1119 180 71 14 32 28 35543
2008/09 42862 681 11313 47 12 61 89 55025
2009/10 50719 689 53078 58 16 84 89 104739
2010/11 59269 1345 44062 70 6 85 161 104998
2011/12 53805 2119 45892 462 16 115 337 102786
2012/13 71141 1085 66322 842 - 229 84 139703

75
Total 350596 7817 222196 1596 64 974 974 583728
(Source: Labor and Employment Promotion Department)
The above table 4.20 shows that from FY 2007/08 to the FY 2012/13 total of
5,83,728 Nepalese people are migrated to the other countries in the search of
employment. Out of that total number, more than half of the labors went to
the Arabian countries. The next main region of choice for Nepalese workers is
South East Asia where 2,22,196 people are migrated for work in that same
period of 10 years. The third main destination of Nepalese workers is East
Asia, where 7817 people are employed. After East Asia, the Nepalese workers
are scattered all over the world. Among other countries: Other Asian
Countries, Africa, America, Europe, Australia etc. are the main choices. These
numbers show that the major destinations of Nepalese migrant workers are
the Gulf region and South East Asia. This data does not show migrant workers
in India and migrant workers officially unregistered even in these regions. If
we look into the growth of emigrated labor force it seems fluctuating but the
trend is increasing in each and every cases. In the period of ten years, the
number of people migrated to the other countries for work has increased
from 2134 to 583728 which is 273.5 times more than the initial data. Annual
growth rate of migration is tremendous in every Fiscal Year except 2001/03,
2004/05 in which year it was slow growth. The Fiscal Year 2002/03 has even a
negative growth. It shows that more and more number of people is seeking
foreign employment which further results in the growth of remittance in the
economy.
4.4.5 Types of Jobs and Duration of Stay in Foreign Employment
Since the skill of Nepalese workers is quite low; most of them get employment
in manual job. To find out the types jobs performed the respondents were
asked to give the type of work they did while being employed in foreign

76
country which is categorized into five types, they are Construction,
Mechanical, Agricultural Farming, Industrial works and Hotel/Catering.
Duration of foreign stay of emigrants’ workers depends upon availability to
work, facilities provided by company, salary rate, health of workers, visa
permit date, home urgency and other several reasons. Sometime the
respondents return their home before the agreement date due to inferior
type of job, low salary, family affairs such as death of any family members,
sickness and their own bad health and also the employer firm expelled them
due to the unusual characters of the workers. To find out the duration of
foreign stay the respondents were asked to provide their length of stay. The
results of both the types of job performed and the duration of stay in the
foreign-
Employment are Summarized in the following table:
Table 4.21
Types of Jobs Performed and Duration of Stay in Foreign Country of
Respondents from Krishna Gandaki VDC
Cast/
Ethnic
Group
No of
Respondents
Occupation Average
Duration of
Stay
Constr-
uction
Mecha-
Nical
Agri-
farming Industrial
Hotel/
Catering
Cheetri/
Bhramin
65 14 27 7 12 5 3 Yrs
Gurung 10 4 - - 4 2 3.25 Yrs
Kami 7 6 - 1 - - 2.8 Yrs
Magar 6 3 - 1 2 - 2.7 Yrs
Sarki 5 3 - 1 - 1 2.5 Yrs
Others 7 4 2 - 1 - 2.7 Yrs

77
Total 100 34 29 10 17 8 2.8 Yrs
(Source: Field Survey, 2013)
Table 4.21 shows that most of the migrated respondents work in the
construction areas in which 34 percent work in that occupation. Most of the
people from lower cast work in the construction areas due to lack of other
technical knowledge to work in other areas. The second most employed area
is Mechanical in which 29 percent respondents are working. In this category
only the Bhramin and Chhetri cast are employed among 34 percent of
respondents 32 percent of respondents working in the mechanical areas are
from Chettri/Bhramin ethnic group only the 2 percent of the respondents are
from the other casts. The third largest area of employment for the Nepalese
workers is Industrial area where most of the Nepalese workers are working as
a labor. Other areas of employment for the Nepalese workers are Agri-
Farming and also the Hotel and catering where 17 percent and 8 percent of
the total respondents are working respectively. According to Duration of stay
from the field survey we know that the respondents from Gurung ethnic
group have longest duration of stay where they stay an average of 3.25 years
once. After Gurung, Cheetri/Bhramin spends average of 3 years in foreign
employment at a time. The Sarki cast has minimum duration of stay of 2.5
years. Other all the casts’ duration of stay is around 2.8 years. It means the
average duration of stay of the respondents from Krishna Gandaki VDC is 2.8
years.
4.4.6 Income Earned Abroad
It is often said that Nepalese workers get low paying jobs in overseas. So, they
earn less money than laborers from other countries. But income earned
abroad depends on skill of workers, salary payment by company, rules and
regulations of the working country, types of company, duration of stay etc. To
find out the income earned by Nepalese labor in abroad the respondents were

78
asked to give their monthly salary earnings. The respondent’s answers are
given in the following table:

79
Table 4.22
Income Earned in Abroad for Different Ethnic Group of Respondents
Cast/Ethnic
Group
No of
Respon-
dents
Average Monthly Income (In thousand)
Based on Destination Based on Skill Types of Jobs
Gulf Malaysia Skilled Unskilled Mecha. Hotel Ind. Agr.
Cheetri
/Bhramin
65 15.13 12.4 24 10.5 25 15.5 12.5 -
Gurung 10 12.5 12 20 8.75 21 14 10 8.5
Kami 7 9.83 8.5 17 7.5 18 - 8.5 7.8
Magar 6 9.76 8.5 21 9 14 15 9.5 8.5
Sarki 5 8.5 7.5 18 7.5 15 11 9 -
Others 7 10.3 9 20 - 18 14 9.5 9.5
Total 100 11 9.65 20 8.54 18.5 13.5
8
9.83 8.5
(Source: Field Survey, 2013)
Above table 4.22 shows that the respondents who have done the work in Gulf
Countries earned more money than the respondents worked in Malaysia.
Comparing these two countries the average monthly income of the
respondents in Malaysia is Rs.9.65 thousand where the average monthly
income in Gulf countries is Rs.11 thousand. Comparing the income of the
respondents cast wise, we can get the result that the respondents form
Cheetri/Bhramin gets more average monthly income than the others because
they understand all the rules and regulations of their work and their salary
before their departure to the destination country. The monthly average
income in Gulf Countries and Malaysia is lowest for the Sarki cast because
most of the workers from that cast are Illiterate. In another aspect of this

80
table we can understand that the average monthly income between skilled
workers and unskilled workers is very different. The skilled workers are getting
the average monthly income of around 20 thousand whereas the unskilled
workers are getting around 8.5 thousand rupees as monthly average income.
The average monthly income varies according to the types of jobs also. Among
the four types of jobs Mechanical, Hotel, Industry and Agriculture the workers
working in Mechanical firms get highest monthly salary which is 25 thousand
rupees per month is the Gulf countries also. Cast wise variation is that most of
the Cheetri/Bhramin are working in the mechanical firms so their average
monthly income is highest than the others. According to the types of jobs, the
workers working in Hotel, Industries and Agriculture get Average monthly
income of 13.58 Rupees, 9.83 Rupees and 8.5 Rupees respectively. It means
that the workers working in Agricultural sector are getting very little money of
Rs. 8.5 per month.
4.5 Impact of remittance on poverty reduction
4.5.1 Utilization of Remittance and Skills learned in Foreign Employment
The use of remittances depends on the priority placed by the individuals of
different uses, the size of remittance, the time of availability, opportunity for
investment and several other factors. Majority of migrant workers go abroad
because of unemployment at home and poverty in the households. Generally,
the earnings made by them are not big. The cost of foreign employment is
borne by borrowing therefore the income earned has to be spent on the
payment of the principal and the interest amount. There may be family rituals
in waiting. Keeping all these conditions in mind the respondents were asked to
identify the uses they made for the money earned abroad. Each Individual
spent the earnings in more than one uses. To find out the use of remittance by
the respondents they were asked to list the use of the money in different
heads.

81
Most of the migrant Nepalese workers are unskilled, so the Nepalese
migrants’ workers have learnt different kinds of skill aborad. When they
return back they are expected to utilize those skills back home but they are
observed into utilize their skills in home country. It might depends on different
conditions. These conditions may be place availability of work, availability of
industry, quality of skills learnt, lack of technology, financial availability etc. To
find out the perceived reasons, the respondents were asked to provide
reasons. The answers given by the respondents are presented in the following
table:
Table 4.23
Use of Remittance and the Skills learnt in Foreign Employment
Cast/
Ethnic
group
No of
Respondents
Utilization of Remittance Use of
Skills
Household
Expenses
Loan
Payment
Investment
(Land, Shares)
Social
Activities
Yes No
Cheetri/
Bhramin
65 65 47 19 16 12 48
Gurung 10 9 2 2 6 2 8
Kami 7 7 6 - - - 7
Magar 6 6 5 2 - 2 4
Sarki 5 5 5 - - - 5
Others 7 5 4 3 1 - 7
Total 100 97 69 26 23 16 84
(Source: Field Survey, 2013)

82
(Note: Due to the multiple answers the total numbers of the households are
more than the total number of sample size.)
The above table 4.23 presents the fact about the utilization of Remittance
income as well as the utilization of skills learnt in foreign employment. From
it, we can conclude that among all the respondents and their household, 97
percent of the respondents uses their income in the household expenses i.e.
in food, cloths, health and the education of their family. 69 percent of the
households use their income in loan payment of their family which can be
taken for the same purpose or which can be the family debt before his foreign
employment. Only about 26 households are using their income from abroad in
investment purpose i.e. for buying land, Home and Shares or establishing
industries. Among all the respondents only the 23 percent of the respondents
are expending some amount of their income in Social activities i.e. in Schools,
roads, water taps etc. Only the respondents form Cheetri/Bhramin, Gurung
etc are donating some amount of their money to the social activities, apart
from those other casts like Kami, Sarki, Magar are using almost all of their
income in Regular household expenditure and in loan payment. It concludes
that, the big amount of remittance income earned by the respondents in the
study area is spending their remittance income in regular household expanses
and in payment of loans and their interest.
In another aspect of this table, this presents the utilization of skills earned in
foreign employment. Among all the respondents only the 16 percent of the
respondents replied that the skills learned in foreign employment is helping
them in their lifestyle after the foreign employment in their native country.
Among all the respondents 84 percent of the respondents replied that the
skills learnt in foreign employment is not helpful in their future life after
foreign employment in any areas.
4.5.3 Impact on Other Indicators

83
How the foreign employment and remittance impacted on certain household
indicators? Do they live in better house? Do they send their children to better
schools? How the health condition of their family changed? Are their family
members better dressed? Are they protected from rural indebtedness at the
time of need? These were very pertinent questions. Positive impact on them
dependent on size of income of respondents brought from foreign
employment, family size, earlier economic condition of the family, knowledge
and education of the respondents, culture of society etc. To find out the
impact of an employment on households indicators the respondents were
asked to respond on the changes brought by the foreign employment. The
answers provided by the respondents are given in the following table.
Table 4.24
Frequency Distribution of Impact
On Other Indicators of the Respondents
Indicators Increased% Worsened% Same % Total %
Condition of housing
Made with rod,
concarete and cement
45 55 100
Made with stone and
mud tin and slate stone
roof
60 40 100
Made with stone and
mud and thatched roof
35 65 100
Education Status
Illiterate 67 33 100
Literate 75 25 100

84
Educated upto SLC pass 52 48 100
Well educated ( Bachelor
level and above
45 55 100
Health of family
members
46 18 32 100
Communication 76 24 100
Electricity used 56 44 100
Clothing 74 - 26 100
Food 88 12 100
Income Source
Agricultural Source 35 25 40 100
Non Agricultural Source 65 35 100
Insurance 22 78 100
Fuel used
Electricity 45 55 100
LP Gas 65 35 100
Wood 22 78 100
Biogas 48 12 40 100
Capital Assets
Land 55 5 40 100
Vechicle 25 20 55 100
Furnitures 65 35 100
Entertainment 55 45 100

85
Cash available with them 37 22 41 100
(Source: Field Survey, 2013)
The above given table 4.25 shows that 78 percentage of the respondents
reported to have improved their condition of housing. It shows that anybody
who had returned from foreign employment either have made new house or
repaired old house to improve their housing condition. 22 percent of the
respondents had reported that their housing condition is same before and
after foreign employment but the static condition was not given. It might be
low income or other more pressing priorities like loan payment, household
expenditure, marriage of a member of their family etc. No any respondent’s
housing condition is worsened after returning from foreign employment.
Among the total households, 69 percent of the households reported that the
education of their children have improved due to the income earned by their
parents from foreign employment. It might be the result of improvement of
economic condition of the individuals who could afford boarding school for
their children. But no one among the respondents had reported to worsen the
education of their children due to the foreign employment. The rest 31
percent of the respondents had reported that the education status of their
children remained same before and after foreign employment. 46 percent
respondents said that the health status of their family had improved due to
their foreign employment where about 18 percent of the respondents replied
that health status of their family had worsened due to the foreign
employment either of the respondents himself or of his family members. The
rest 32 percent of the respondents said that the health condition of their
family members remained same even after returning from foreign
employment. It might be due to general health condition of the area and
health awareness.

86
More than seventy percent of the respondents said that household members
are using better clothing after returning from foreign employment it is 74
percent. It might be related to the increasing purchasing power and cloth after
returning with the respondent and also with their family members. The rest
26 percent of the respondents had replied that their clothing status is same
before and after returning from foreign employment. When the availability of
liquid cash to meet various household needs was assessed, about 37 percent
of the respondents had increased their cash holding with them, another
41percent of the respondent’s cash holding has remained same and the rest
22 percent of the respondents had worsened their cash holding after
returning from foreign employment. It might be due to the low income earned
from foreign employment or the income earned from abroad is just equal to
the sum of household expenditure and payment of loans and their interest or
it might have been the result of high expenses, low income or the high cost of
foreign employment. It indicates that foreign employment has increased the
liquidity situation of about 37 percent of the participants of foreign
employment.
It can be concluded from the above table that around 60 percent respondents
of this VDC have improved different household indicators due to foreign
employment. But around 8 percent have worsened and around 32 percent
respondents have same level of household indicators even after returning
from foreign employment. In short, people who have returned from foreign
employment have received some economic benefit and improved their
financial, social and economic condition but it cannot be said it has improved
their life tremendously.
As a summary, we can say that the remittance income earned from foreign
employment is helping the households of the study area in fulfilling their basic
needs as well as fulfillment of other social and economic aspects of their life.
In another aspect of this survey we can see that the remittance earned by the

87
foreign bound labor have benefited other members of his family than the
employee himself. Therefore it is clear that the remittance is playing very
positive role to the respondents and their family to reduce their level of
poverty of the study area.
4.5.4 Overall impact of remittance income in study area
It is often believed that if somebody receives foreign employment his
household economy will improve. The change is economic wellbeing
improvement in living standard; improvement in skill, social status might be
same of the areas where the changes take place etc. If the respondents are
able to gain more than the income which is needed to run their family and
also to pay their loans principle as well as their interest amount then only
their economic condition can improve and their poverty problem can be
reduced. To find out the change in household economic condition due to
foreign employment, the respondents were asked to give their own judgment
about their economic condition before foreign employment and after foreign
employment and comparison of these two time periods. The answer given by
them is presented in the following table.
Table no.4.25
Overall Impact of Remittance Income monthly
Expenditure Before
Remittance(in Rs)
After Remitance
(inRs)
Increased
percentage
Education 150000 300000 100
Health 200000 300000 50
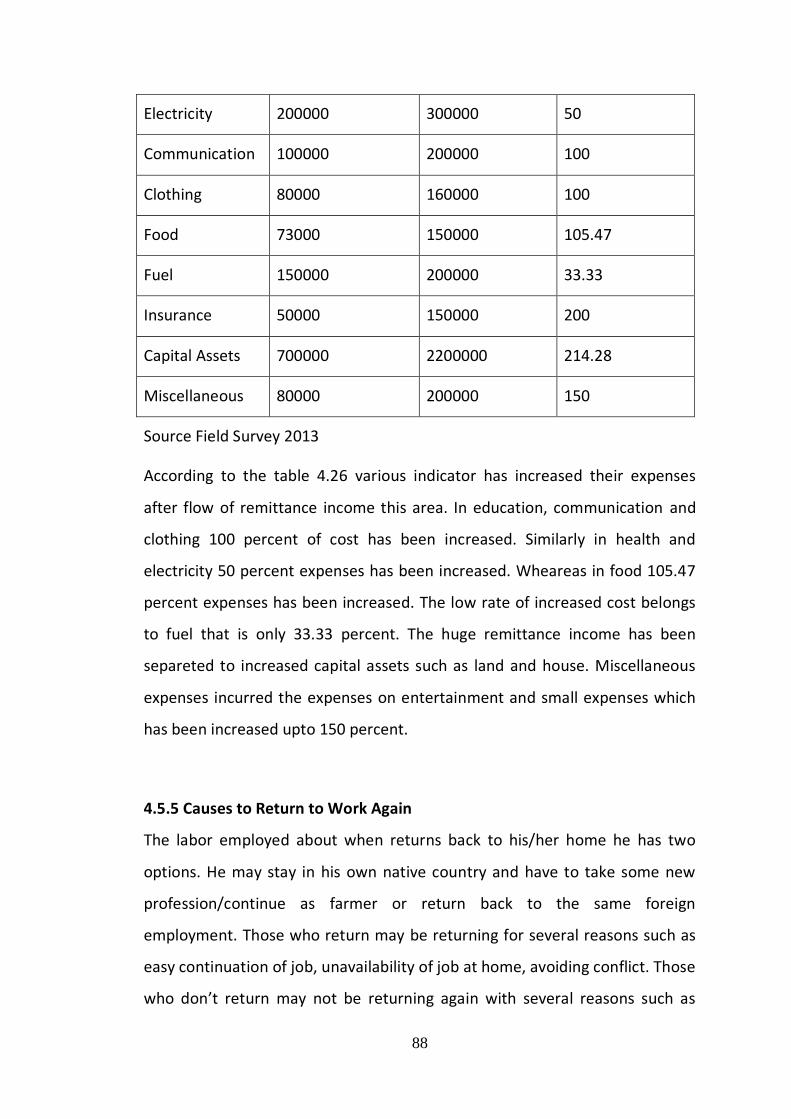
88
Electricity 200000 300000 50
Communication 100000 200000 100
Clothing 80000 160000 100
Food 73000 150000 105.47
Fuel 150000 200000 33.33
Insurance 50000 150000 200
Capital Assets 700000 2200000 214.28
Miscellaneous 80000 200000 150
Source Field Survey 2013
According to the table 4.26 various indicator has increased their expenses
after flow of remittance income this area. In education, communication and
clothing 100 percent of cost has been increased. Similarly in health and
electricity 50 percent expenses has been increased. Wheareas in food 105.47
percent expenses has been increased. The low rate of increased cost belongs
to fuel that is only 33.33 percent. The huge remittance income has been
separeted to increased capital assets such as land and house. Miscellaneous
expenses incurred the expenses on entertainment and small expenses which
has been increased upto 150 percent.
4.5.5 Causes to Return to Work Again
The labor employed about when returns back to his/her home he has two
options. He may stay in his own native country and have to take some new
profession/continue as farmer or return back to the same foreign
employment. Those who return may be returning for several reasons such as
easy continuation of job, unavailability of job at home, avoiding conflict. Those
who don’t return may not be returning again with several reasons such as

89
difficulty in job, willingness to stay with family, no urgency to make more
money because the debt has been paid, marriage or death of the older
member of the family and got another employment in their own native
country etc. How the sample households responded to the further
employment in foreign land was solicited through the questionnaires and the
responses are summarized as below:
Table 4.26
Causes to Return for Foreign Employment
For Different Ethnic Group of Respondents
Cast/Ethnic
Group
No. of
Respondents
Causes of return
Employment
Purpose
Conflict No Plan to go
Cheetri/Bhramin 65 42 15 8
Gurung 10 8 1 1
Kami 7 7 - -
Magar 6 5 - 1
Sarki 5 5 - -
Others 7 3 1 3
Total 100 70 17 13
(Source: Field Survey, 2013)
The above table 4.27 shows that among the respondents, 87 percent
respondents plan to return to foreign employment. For them the most
important push factor for sending to foreign employment again is
employment purpose i.e. they can’t get any jobs in their native country even
returning back from the foreign employment, among the total respondents 70
percent of the respondents return back due to the employment problems,
other 17 percent of the people said that they can survive in their own country

90
but the conflict problem is pushing them back to the foreign employment.
Among the total respondents only 13 percent respondents don’t plan to
return again which may be because they had done difficult, danger and dirty
work in abroad. Ethnic groups wise almost all the lower cast are planning to
return back to the foreign employment, where as some of the respondents
from Bhramin/Cheetri and other casts don’t plan to go to the foreign
employment again. It can be concluded that continuous foreign employment
is means to avoid the unemployment and the conflict in the country.
4.6 Major Finding
From the study, following conclusions are drawn.
The main destinations of Nepalese workers are Gulf countries and
Malaysia. More than sixty percent of the workers are employed in Gulf
countries. By country wise Malaysia, Saudi Arab, Qatar, UAE are the
main destinations of the Nepalese workers. Up to the FY 2062/63 the
no of workers went to Malaysia are 296032, Qatar 204486, Saudi Arab
147503 and UAE 79152.
According to NRB, total remittance received through registered sources
by Nepal in FY 2062/63 is more than 100 billion, which was very large
than the previous year.
The Contribution of remittance to GDP, Saving and Investment in
2012/13 were 16.8 percent, 93.61 percent and 47.6 percent
respectively. Share of remittance in Convertible foreign exchange
reserve was accounted by 46.9 in 2012/13.
The socio-economic characters of migrant workers was age group most
of 25-40 year, 71.97 percent of the migrant workers are married, and
80 percent of the migrants are literate, 62 percent migrants coming
from lower income group, 38 percent migrants from higher income

91
group and 78 percent of the migrants coming from agriculture
occupation.
The average income of the households in this VDC is only around NRs.
10,000 per month and only the 58.90 percent of the total active
population and only the 33.077 percent of the total population of the
study area are employed. It means that the dependency ratio is very
high in the study area.
Major reasons to seek foreign employment include unemployment,
family debt burden, conflict problems and to earn more money than
which they are earning in their own country.
The means to get foreign employment for most of the sample (85
percent) respondents were Manpower Agencies. Others went either
through unregistered agents or personal initiative.
Majority of the foreign job seekers (about 83 percent) didn’t have skills
and took unskilled labor jobs in industries.
The average cost paid for foreign employment by the respondents of
the study area was Rs. 50 thousand. It ranges between Rs. 15 hundred
minimum and to 324 thousand was maximum.
Source of financing for foreign employment for 77 percent of the
migrant workers was loan, 18 percent from family savings and 5
percent from property selling.
Major sector of employment for Nepalese workers were building
construction (34 percent) and Mechanical (29 percent).
The average stay duration of abroad of the respondents was 2.8 years.
If we classify them cast wise, it ranges between 2.5 years of minimum
(Sarki cast) and 3.25 years of maximum (Gurung cast).

92
Average family members migrated to foreign countries are two
members where Maximum numbers of respondents’ family members
are five and the minimum of one.
The respondents of this VDC want to go again to foreign employment
because of the unemployment (70 percent) and conflict (17 percent).
Out of the causes maximum respondents of Bhramin/Cheetri were
suffering from conflict. Among the total respondents 13 percent of
them have no plan to go abroad again to foreign employment.
The workers earned more income in Gulf countries than Malaysia. It
was average Rs. 11 thousand and Rs. 9.65 thousand per month. The
skilled workers earned much more money than unskilled workers which
was Rs. 20 thousand income per month of skilled workers and Rs. 8.54
thousand of unskilled workers. In types of jobs the workers working in
mechanical sector earns maximum income of Rs. 18.5 thousand per
month and the workers working in the agriculture sector earns lowest
income of Rs. 8.5 thousand per month.
Above 60 percent respondents used formal channels (banks and
registered transfer agencies) to send remittance. Informal channels like
hundi, relative and friends and bringing back by themselves were other
channels of remittance transfer.
The larger amount of remittance income has been used for household
expanses (97 percent), loan repayment (69 percent), investment only
of 26 percent and social spending (23 percent). Minimum part of
remittances has been used into productive sector like as land purchase
(20%), bank deposited (14%) and other small business and investment
(10%). In this case, the respondents from Bhramin and Cheetri are
forward.
Among the returnees from foreign employment only 16 percent of the
workers are using the gained skill in aboard employment where as the

93
rest 84 percent of the respondents have not benefited from that gained
skill in foreign employment. It is because of lack of technology, lack of
capital, lack of market and lack of positive social attitude etc.
The respondents of this VDC were not utilized their remittance caused
by conflict and non-availability of sizable investment funds for investing
in productive sector of the economy sector.
The respondents of this VDC said that remittances have increased their
household economic and social indicators after returning from foreign
employment. Around 69 percent respondents said that remittances
have increased their economic status, 57 percent of the respondents
said that remittance income have increased their standard of living,
around 73 percent of the respondent’s social attitude have increased
due to remittance income and around 82 percent of the respondents
increased their skills. But around 23 percent respondents said that
economic status has been same, 40 percent have remained same
standard of living, 27 percent said that their social status have
remained same and 18 percent said that remained same level of their
skill after returning from the foreign employment.
The respondents of this VDC said that remittance have also done
impact on their other indicators. It was said that around 78 percent
respondents improve their condition of housing, 69 percent
respondents improve their education of children, 46 percent improve
their health of their family members, 74 percent improve their clothing
situation and 37 percent of the respondents have increased cash
available with them. But around 18 percent respondents have
worsened health of their family members and 22 percent of the
respondents have worsened cash available with them. And around 22
percent of the respondents have same level of housing, 31 percent
respondents have same level of education of children, 32 percent

94
respondents have same level of health of their family members, 26
percent of the respondents have same level of clothing and 41 percent
of the respondents have constant cash available with them.

95
CHAPTER V
SUMMARY, CONCLUSIONS AND RECOMMENDATIONS
5.1 Summary
The general introduction of the study is presented in the first chapter. It is
designed to highlight the research issues regarding role of remittance in
poverty reduction with reference to Shree Krishna Gandaki VDC only.
Remittance is one of the main sources of people revenue. Remittance is a
strong component of poverty reduction. Government has not utilized properly
remittance in productive sector. Remittance has played a vital role in the
improvement of different lifestyles of the people. This is the main issue raised
in this study. This chapter also specified the research objectives, limitations
and organization of the study.
The theoretical framework and reviews of related dissertation, books and
articles of studies are presented in the second chapter. More specifically
theoretical background of remittance has been discussed regarding poverty
reduction.
Research methodology is stated in chapter three. Basically it is descriptive in
nature pursuing survey design. Survey data is used to fulfill the objectives of
the study. The primary data is collected from interaction with respondents by
face to face interviews with the help of questionnaire with in Shree Krishna
Gandaki VDC which are considered as the population of this study. Altogether
100 questionnaire were distributed. Persons included in the sample are
selected randomly on best judgments. Simple percentage, simple average,
charts are used to analyze the data.

96
Chapter four is related with the presentation and analysis of data. It has
exposed the simple percentage, simple average, to study the role of
remittance in poverty reduction with reference to Shree Krishna Gandaki VDC.
Chapter five is designed to summarize the overall role of remittance in
poverty reduction with reference to Shree Krishna Gandaki VDC at a glance.
Finally this chapter showed the results of research work in summary to various
domains of the research.
The main objective of this study is to gauge the impact of foreign employment
and remittance in poverty reduction in the study area. Moreover the study
also tries to examine the nature and extent of poverty in the study area, the
nature and extent of remittance income in the study area, Socio-Economic
characters of foreign employees, sources of financing and cost for foreign
employment, change brought by foreign employment and remittance in
household economy and uses of remittance.
To fulfill the above stated objects of the present study, Krishna Gandaki VDC
of Syangja district was selected area and a sample survey was conducted
during 2007. The sample size was 100 households were chosen by
proportional random sampling method and data were collected through
questionnaire method. Some secondary data were used to show and compare
the composition of foreign employment and remittance of the national level
as well as of the local level in the study. Data are analyzed by using simple
statistical tools like mean, percentage and ratio.
As a summary, it can be concluded that the Economic and Social condition of
all the families who have involved in foreign employment have increased. It
may be in both aspects i.e. economic as well as social but surely there is
positive change in the status of the families of the respondents due to
remittance income. Therefore we can say that remittance income is playing
very vital role in reducing the poverty level of the study area.
97
5.2 Conclusion
Despite the lack of accurate data on the real volume of funds transferred,
there is ample evidence that remittance flows are substantial, stable relative
to other forms of development finance, and well-targeted to vulnerable
families, both as support during a crisis and as an income-smoothing
mechanism. In Nepal, during the last few years, remittances have been an
important avenue of support for family members remaining at home. As the
number of workers going abroad for employment continues to rise, the
corresponding growth of remittances has become a critical flow of foreign
currency into Nepal.
Nepal has been experiencing continuous growth in remittance inflow since
last few years and as a result its disposable income has continued to rise as
well. As per the Nepal Living Standards Survey (2011) 78.9 percent of total
remittances are spent in daily consumption whereas 7.1 percent in repaying
loans, 4.5 percent in household property, 3.5 percent in education and 2.4
percent in capital formation. The Nepalese economy is gradually becoming
consumption oriented due to remittance income and other factors thereby
causing hopeless plunge in savings and investment rates. Consumption
oriented economy naturally leads to dependency resulting in the dearth of
resource for investment. Consumption oriented remittances have only
increased our reliance on imports. Even if a fraction of remittance gets
channeled towards productive sectors such as infrastructure development, it
can have multiplier effects and push economic growth to a higher level.

98
The government should develop appropriate training and education programs
to assist returning migrants or remittance receipts in making effective
investment decision. Moreover, the appropriate infrastructure should be
developed to generate favourable investment climate and be complement
investments out of remittances. The capital, skills and technology which
migrant workers bring back home are among the most valuable gains from
foreign employment that should be properly utilized by the government. The
result shows that mere increasing remittance income does not support for the
economic growth and development of the nation unless it is extensively used
into the productive sectors. Thus, it is recommended to the government
agencies for the formulation and implementation of remittance utilization
policy for the enhancement of national economy. As a matter of concluding,
we note that remittances have direct and indirect effects only on the largest
remittances-recipient countries in GDP percentage, yet these effects
disappear for the largest remittances-recipient countries in amounts.
5.3 Recommendations
From the present study about the role of remittance to reduce rural poverty in
Nepal, some recommendations are made as follow:
Since Most of the migrant Nepalese workers have gone to Gulf
countries and Malaysia so these destinations are congested area of the
Nepalese workers. Thus manpower agencies, agent and employed
company all have been cheated to maximum workers. On the other
hand, the workers of these destinations cannot earn much more
money than other destinations like Japan, Korea, Hong Kong, USA etc.
So the Ministry of Labor and Transport Management GON should make
new policy to identify new potentialities destinations and create
opportunities to go these destinations. Where the workers will earn
more money than the existing countries. Apart from these the labor

99
contract should be done between two countries to give safe
environment for the workers.
Nepalese economy has received large amount of remittance but
remittances are still being transferred through informal channels.
Formal channels should be promoted. At least one formal institution
must be established to facilitate transfer remittance in each
destination.
Most of the respondents of rural areas came from lower income groups
and based on agriculture occupation. So, they cannot easily afford
foreign employment. If they go foreign countries for employment, they
should borrow or loan at the high interest rate. So the policy should be
made to give more opportunities to poor people of rural areas as well
as facilitated to them from funds for foreign employment. In the case
of this VDC almost all the workers from the lower income group are
migrated to India to work because of lack of money with them where
they are earning very little amount of money comparing with the
migrant workers to other gulf countries and Malaysia. Thus GON should
provide loans to the poor people in the cheap interest rate ho want to
go to foreign employment.
Most of the respondents of this VDC have gone to foreign employment
in unskilled condition. So they cannot earn more income than skilled
workers. So, the technical training institution should be established in
rural areas and a person who wants to go to the foreign employment,
should be given training related to the work has to be done in abroad
and also the language of the migrating country before going to foreign
employment.
Most of the respondents have not utilized their remittance and newly
learnt skills at abroad when they came back home because of lack of
100
technology, conflict problems, non availability of sizable investment
funds and lack of market etc. So the policy should made to solve the
conflict situation, create good environment and provided sufficient
technology as well as market and the GON should play as the role of
facilitator for all the investors and the workers.
Surely remittance income is playing very positive role to reduce rural
poverty of the study area and also it is improving the social as well as
other economic indicators of this VDC but this is not satisfactory.
Maximum part of the remittance income have been used in
unproductive sectors like regular household expanses, loan payment,
house improvement and social spending etc. this don’t give any return
in the future. Thus the policy should be made to give more information
to the respondents on using their remittance income into productive
sectors like investment in Shares, Business etc. and should be given
more opportunities to them in using their newly learnt skill after
returning from the foreign employment.
The concept of economic diplomacy should be implemented from the
government of Nepal to increase the demand of Nepalese labor in the
foreign labor market.
The Bilateral agreement should be done from the ministry level with all
the labor importing countries. Agreement done with United Arab
Emirates and Korea can be the best examples of positive impact of
agreement.
The labor desk should be established in the airports of labor migrating
countries to help the Nepalese labor in various problems.
The concept of labor attaché should be implemented in every embassy.
So that, all the problems of migrated labors can be solved from the
different desk.

101
Different incentives should be provided by the government level as well
as from the private sectors for encouraging the people to remit earned
money through the formal channels.
Finally, this above case study of role of remittance to reduce rural
poverty and the status of foreign job seekers of Krishna Gandaki VDC
which is very important current issue of the Nepalese economy,
therefore this study is very significant, while the study is conducted in
small size and may not be sufficient to make general conclusions for
the whole nation about the role of remittance income and labor
migration. But by this study, I am confident that it will be certainly
beneficial to the people of Krishna Gandaki VDC and side by side for the
people of other neighboring VDC of the entire country.

102
BIBLIOGRAPHY
Agrawal, A. N. (1995). Economic development and planning. New Delhi: Vikas
Publishing House.
CBS (2003/2004). Nepal Living Standard Survey, Vol. 2, Central Bureau of
Statistics, Kathmandu, Nepal.
Conway, D and KC B, Shrestha M. (1981). Causes and Consequences of Rural
to Rural Migration in Nepal, A Report submitted to Population and
Development Policies, Indiana University.
Dahal, M.K. (2004). Nepalese Economy: Towards Building a Strong Economic
Nation-State, New Hira Books Enterprises, Kathmandu.
Gyanwali, H (2005). Rural Poverty in Nepal : a case Study of Simichaur VDC of
Gulmi District, Nepal, Unpublished MA dissertation in Economics,
CEDECON, TU Kritipur, Kathmandu.
Kanel, R.(2003). Guidelines to format Theses and Dissertations: A Quick
Reference, New Hira Books Enterprises, Kathmandu, Nepal.
Karki, B.P(2006). Foreign Employment and Remittance Economy of Nepal : A
Case Study of Dhuseni VDC, Illam , Unpublished , MA dissertation in
Economics, CEDECON TU Kritipur, Kathmandu.
Karna, S.K. (2004). Remittance Economy of Nepal: Final Report. Submitted to
CEDECON, TU.
MOF (2005). Economic Survey, 2005/06. Kathmandu : MOF/N.
MOF (2007). Annual Budget Speech of FY 2007/08. Kathmandu : Ministry of
Finance, GON.
MOL (1993). Baidesik Rojgar Ain (Foreign Employment Act) 1985. Nepal Ain
Sangraha, Kathmandu: Ministry of Laws GON Parts (Kha) (Nepali
version)
NPC (2001). Tenth Five Year Plan. Kathmandu: National Planning Commission
GON
103
NRB (2005). Foreign Employment, Remittance economy and Nepal: A
Research Report, Special study Section, NRB Kathmandu, Nepal.
NRB (2006). Quarterly Economic Bulletin. (Mid July 2006)
Ravenstein, E.G.(1985). The Law of Migration, Journal of Royal
Statistical Society, Vol. 48, No.2.
Seddon D. (2003). Migration and Remittances The Case of Nepal , for The
Economic Journal of Nepal , CEDECON, T.U., Kirtipur, Kathmandu, Vol
26, No. 2, Issue No. 113, April-June 2003.
Seddon D, Gurung GM and Adhikari J (2000). Foreign Labor Employment and
Remittance Economy of Nepal. Kathmandu, Nepal Institute of
Development Study.
Sigdel, B. D.(2005). An Overview on Remittance Economy of Nepal, Nepal
Rastra Bank Samachar (2005) NRB, Kathmandu, Nepal.
Shrestha, S.R. (2006). Foreign Remittance: A Panacea for Nepalese Economy.
NRB Annual Publication Kathmandu, NRB, pp. 27-35.
Todaro, M.P.(1976). International Migration in Developing Countries: A Review
of Theory, Evidence, Methodology and Research Priorities. Geneva: ILO.
WDR (2006). World Development Report. New York : Washington D.C.
WWW.ekantipur.com
WWW. Nepalnews.com
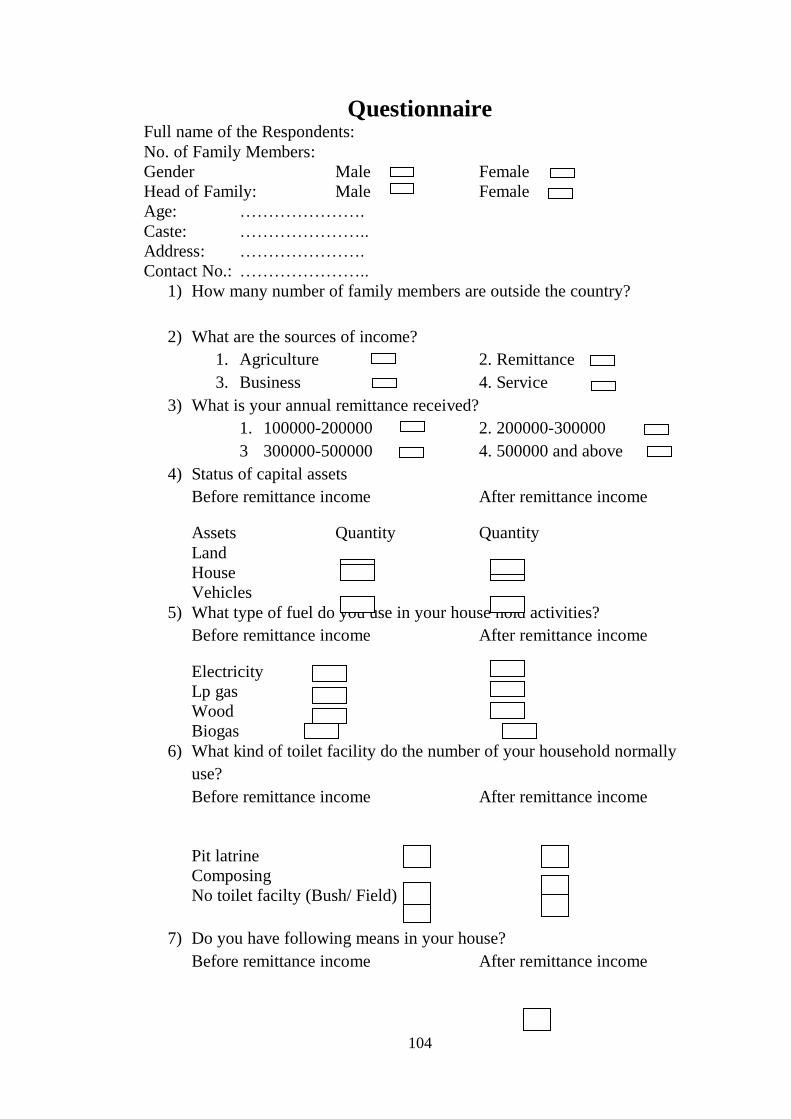
104
Questionnaire Full name of the Respondents:
No. of Family Members:
Gender Male Female
Head of Family: Male Female
Age: ………………….
Caste: …………………..
Address: ………………….
Contact No.: …………………..
1) How many number of family members are outside the country?
2) What are the sources of income?
1. Agriculture 2. Remittance
3. Business 4. Service
3) What is your annual remittance received?
1. 100000-200000 2. 200000-300000
3 300000-500000 4. 500000 and above
4) Status of capital assets
Before remittance income After remittance income
Assets Quantity Quantity
Land
House
Vehicles
5) What type of fuel do you use in your house hold activities?
Before remittance income After remittance income
Electricity
Lp gas
Wood
Biogas
6) What kind of toilet facility do the number of your household normally
use?
Before remittance income After remittance income
Pit latrine
Composing
No toilet facilty (Bush/ Field)
7) Do you have following means in your house?
Before remittance income After remittance income

105
Telephone
Mobile phone
VCD and DVD player
Telivision
8) What is the total monthly bill of your hose hold for using above
services( radio, TV, Phone etc.)
Before remittance income After remittance income
No cost at all
Below rs 1000
Rs, 1000 to rs 3000
Above 3000

106
9) How many times do you check your health annually?
Before remittance income After remittance income
1 time
3 time
6 time
12 time
10) What type of consturctive are you using in your floor?
Before remittance income After remittance income
Natural floor
Rudimentary floor
Finish floor
11) Did you purchased agricultural land last three years?
Yes
No
12) What is your purpose of purchasing land?
To constructive house
To use farming
13) Have you had any insurance
Yes
No
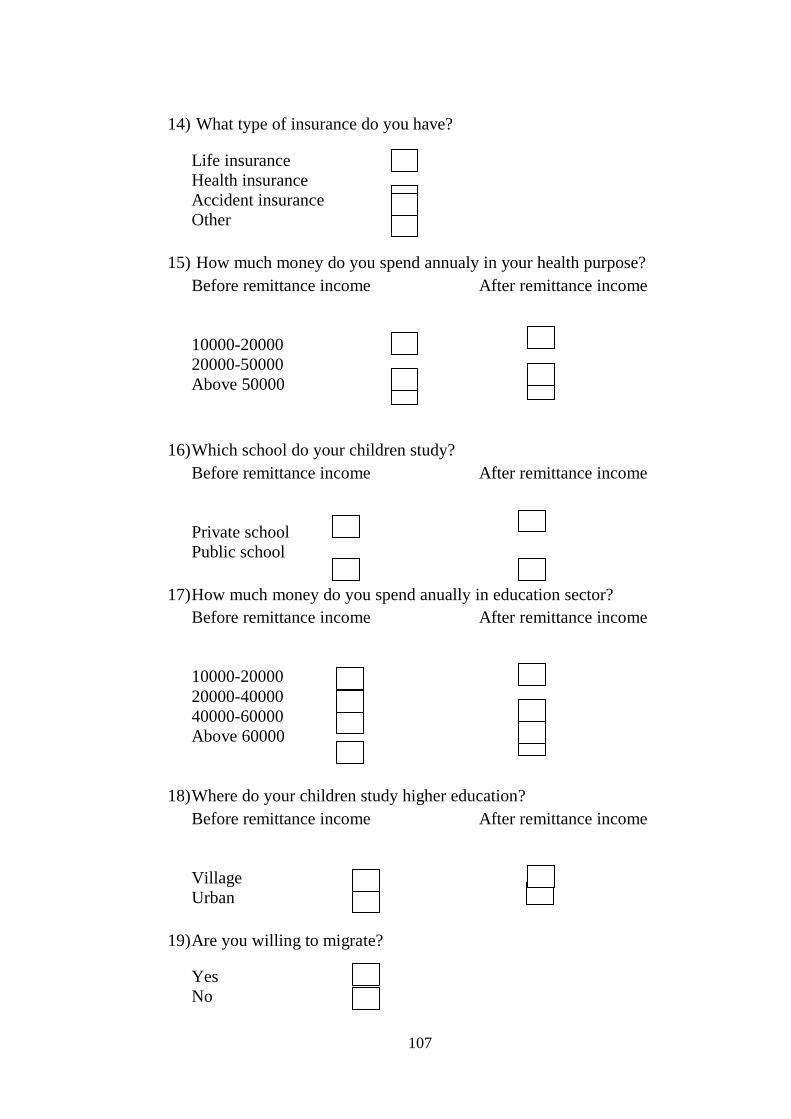
107
14) What type of insurance do you have?
Life insurance
Health insurance
Accident insurance
Other
15) How much money do you spend annualy in your health purpose?
Before remittance income After remittance income
10000-20000
20000-50000
Above 50000
16) Which school do your children study?
Before remittance income After remittance income
Private school
Public school
17) How much money do you spend anually in education sector?
Before remittance income After remittance income
10000-20000
20000-40000
40000-60000
Above 60000
18) Where do your children study higher education?
Before remittance income After remittance income
Village
Urban
19) Are you willing to migrate?
Yes
No

108
20) Is there any improvement in information technology in your house since
five years?
Yes
No
21) What type of house you have made?
a. Made with Rod, Concerete and Cement
b. Made with stone and mud tin and slate stone roof
c. Made with stone and mud thatched roof
22) How much size of land you have hold?
a. Landless
b. Below 2 ropani
c. 2 to 5 ropani
d. 5 to 10 ropani
e. 10 to 15 ropani
f. 15 to 20 ropani
g. Above 20 ropani
23) What is the causes of seeking to foreign employment?
a. Unemloyment
b. Family death
c. Conflict
d. Earn money
24) What are the sources of financing of cost of foreign emloyment?
a. Loan
b. Sales of property
c. Family saving
25) What is your emloyment status?
a. Active poulation
b. Inactive population
26) In which foreign country do they work?
a. Saudi arab
b. Quarter
c. UAE

109
d. Malaysian
e. Others
27) What are the causes return to work again for foreign?
a. Employment purpose
b. Conflict
c. No plan to go
28) What is your educational status?
a. Illiterate
b. Literate
c. Educated upto SLC pass
d. Well educated ( bachelor level and above)