foreign direct investment in latin america and the caribbean 2011
DESCRIPTION
In 2010 the Latin American and Caribbean region showed great resilience to the international financial crisis and became the world region with the fastest-growing flows of both inward and outward foreign direct investment (FDI). FDI inflows were up by 40% with respect to 2009 and stood at a total of USUS$ 113 billion. Outflows increased almost fourfold to reach an all-time high of USUS$ 43 billion, reflecting the strong growth of trans-Latin firms. The upswing in FDI in the region has occurred in a context in which developing countries in general have taken on a greater share in both inward and outward FDI flows. This briefing paper is divided into five sections.TRANSCRIPT


2011
Foreign Direct Investmentin Latin America and the Caribbean

Alicia BárcenaExecutive Secretary
Antonio PradoDeputy Executive Secretary
Mario CimoliChief
Division of Production, Productivity and Management
Ricardo PérezChief
Documents and Publications Division
Foreign Direct Investment in Latin America and the Caribbean, 2011 is the latest edition of a series issued annually by the Unit on Investment and Corporate Strategies of the Division of Production, Productivity and Management of the Economic Commission for Latin America and the Caribbean (ECLAC). It was prepared by Álvaro Calderón, Miguel Pérez Ludeña and Sebastián Vergara, with the assistance of Nelson Correa, Cristian Jara, David Matesanz, Francisco Javier Sáez and Ángeles Sánchez, under the coordination of Giovanni Stumpo. Contributions were also received from Humberto García, Michael Hendrikson, Jorge Mario Martínez Piva, Kohei Yoshida and Pavlos Dimitratos, consultant.
Comments and suggestions were provided by Hugo Altomonte, Filipa Correia, Manlio Coviello, Beno Ruchansky, Hugo Ventura, Romain Zivy and staff at the ECLAC subregional headquarters in Mexico, in particular Juan Carlos Moreno-Brid.
ECLAC wishes to express its appreciation for the contributions received from the executives of the firms consulted during the preparation of this publication.
The information used in this report was drawn from a number of international organizations, including the International Monetary Fund, the United Nations Conference on Trade and Development and the Organization for Economic Cooperation and Development, as well as from a host of national institutions, in particular central banks and investment promotion agencies in Latin America and the Caribbean, and the specialized press.
Any comments or suggestions regarding this publication may be addressed to Álvaro Calderón ([email protected]) or Miguel Pérez Ludeña ([email protected]).
Notes and explanations of symbolsThe following symbols have been employed in this edition of Foreign Direct Investment in Latin America and the Caribbean, 2010:Notes and explanations of symbolsThree dots (...) indicate that data are missing, are not available or are not separately reported.Two dashes and a full stop (-.-) indicate that the sample size is too small to be used as a basis for estimating the corresponding values with acceptable reliability and precision.A dash (-) indicates that the amount is nil or negligible.A blank space in a table indicates that the concept under consideration is not applicable or not comparable.A minus sign (-) indicates a deficit or decrease, except where otherwise specified.The use of a hyphen (-) between years (e.g., 1990-1998) indicates reference to the complete number of calendar years involved, including the beginning and end years.A slash (/) between years (e.g., 2003/2005) indicates that the information given corresponds to one of these two years.The world “dollars” refers to United States dollars, unless otherwise specified.Individual figures and percentages in tables may not always add up to the corresponding total because of rounding.
United Nations Publication ISBN: 978-92-1-221060-5 • ISSN printed version: 2076-4065E-ISBN: 978-92-1-050515-4 LC/G.2538-P • Sales No. E.12.II.G.4Copyright © United Nations, June 2012. All rights reservedPrinted in Santiago, Chile • 2012-385
Applications for the right to reproduce this work are welcomed and should be sent to the Secretary of the Publications Board, United Nations Headquarters, New York, N.Y. 10017, U.S.A. Member States and their governmental institutions may reproduce this work without prior authorization, but are requested to mention the source and inform the United Nations of such reproduction.
Foreign Direct Investment in Latin America and the Caribbean • 2011 3
Contents
Summary and conclusions ............................................................................................................................................ 9
Chapter IRegional overview of foreign direct investment .................................................................................................. 19A. Introduction............ .............................................................................................................................................................. 19B. Overview of foreign direct investment worldwide ............................................................................................................... 20C. Foreign direct investment inflows and transnational companies in Latin America and the Caribbean ............................... 22 1. Trends and characteristics of foreign direct investment flows into Latin America and the Caribbean in 2011 ............... 22 2. Patterns of origin and destination of foreign direct investment........................................................................................ 31 3. Capital income and reinvested earnings ........................................................................................................................... 33 4. Technology intensity and transnational companies’ involvement in research and development ..................................... 35D. Outward foreign direct investment and the trans-Latins ...................................................................................................... 36 1. Outward investment flows ................................................................................................................................................ 36 2. Latin American and Caribbean policies supporting foreign direct investment ................................................................ 42E. Concluding remarks ............................................................................................................................................................. 43Bibliography............... ................................................................................................................................................................. 44Annex ....................... ................................................................................................................................................................... 46
Chapter IIForeign direct investment between the European Union and Latin America and the Caribbean .............................................................................................................................................................. 57A. Introduction.......... ................................................................................................................................................................ 57B. European Union Foreign Direct Investment in Latin America and the Caribbean .............................................................. 59 1. The European Union as a source of global FDI outflows ................................................................................................ 59 2. FDI flows from the European Union to Latin America and the Caribbean ..................................................................... 61C. Business strategies followed by European transnationals .................................................................................................... 68 1. In search of natural resources: the oil companies make their way as they go, and mining investment and profits continue to expand ........................................................................................................................................................... 68 2. In search of national and regional markets for manufactures: seizing opportunities brought by economic growth and a growing middle class with greater purchasing power............................................................................................. 72 3. In search of service markets: the region goes from loss-maker to lifeline during the crisis ............................................ 74D. European transnationals and research and development ...................................................................................................... 78 1. Transnational companies and the internationalization of research and development: the region is not the prime destination for European companies ................................................................................................................................ 78 2. Innovation and research and development at subsidiaries of European companies in the region: Brazil consolidates its leadership..... ........................................................................................................................................... 81
Economic Commission for Latin America and the Caribbean (ECLAC)4
E. Trans-Latin companies in the European Union .................................................................................................................... 84 1. Latin America and the Caribbean joins the global trend .................................................................................................. 84 2. Business dynamic of trans-Latins in the European Union ............................................................................................... 85F. Concluding remarks ............................................................................................................................................................. 88Bibliography.................. .............................................................................................................................................................. 90Annex ...................... .................................................................................................................................................................... 93
Chapter IIIThe international financial crisis, banking and foreign direct investment in Latin America and the Caribbean .............................................................................................................................................................. 97A. Introduction................ ............................................................................................................................................................ 97B. The global financial system: boom and bust ........................................................................................................................ 98 1. Regulatory and institutional change in the world’s financial systems: similarities and differences with respect to the experience in Latin America................................................................................................................................... 99 2. Transforming the global financial system: too big to fail? ............................................................................................... 102C. Foreign banks in Latin America and the Caribbean ............................................................................................................. 112 1. Relative performance of Latin America’s banks: learning the lessons of the past? ......................................................... 112 2. Establishment of foreign banks in Latin America: seizing a one-off opportunity ........................................................... 116 3. The behaviour and performance of foreign banks: are they really so different from national institutions? .................... 121D. The complexity of the international financial crisis and the position of European banks in Latin America and the Caribbean ................................................................................................................................................................. 127 1. Impact of the crisis in the European banking sector ........................................................................................................ 127 2. The European banking crisis and Latin America and the Caribbean: possible vectors of contagion .............................. 130E. Conclusions............... ........................................................................................................................................................... 133Bibliography.................. .............................................................................................................................................................. 136
Chapter IVForeign direct investment in electric energy in Latin America and the Caribbean ............................. 143A. Introduction .......................................................................................................................................................................... 143B. Global overview of the electricity sector .............................................................................................................................. 144C. The electricity sector in Latin America ................................................................................................................................ 149 1. The privatization and reform process .............................................................................................................................. 149 2. Determinants of private investment in the sector ............................................................................................................. 151 3. Composition of electricity generation .............................................................................................................................. 156D. The strategies of transnationals in Latin America ................................................................................................................ 158 1. European and United States transnationals ...................................................................................................................... 159 2. The new trans-Latin electric power companies ................................................................................................................ 165 3. The arrival of new Asian firms ......................................................................................................................................... 166 4. New renewable energy firms ............................................................................................................................................ 167E. The recent development of renewable energies in Latin America and the Caribbean ......................................................... 169F. Challenges and prospects ..................................................................................................................................................... 173Bibliography ............................................................................................................................................................................... 177
ECLAC publications .......................................................................................................................................... 179
Tables, figures, boxes and diagrams
TablesTable I.1 Flow, variation and distribution of global foreign direct investment, by region, 2007-2011 ......................... 21Table I.2 Latin America and the Caribbean: foreign direct investment inflows by receiving country or territory, 2000-2011 ................................................................................................................................... 23Table I.3 Latin America and the Caribbean: 20 largest cross-border mergers or acquisitions by companies from outside the region, 2011 ................................................................................................................................. 26Table I.4 Latin America and the Caribbean: largest non-financial companies with investments and employment abroad, by sales, 2011 .................................................................................................................................... 38Table I.5 Ten largest cross-border mergers or acquisitions by trans-Latin companies, 2011 ....................................... 40Table I.6 Latin America and the Caribbean: foreign direct investment outflows by country, 2000-2011 .................... 40Table I.A-1 Classification of manufacturing industries by technology intensity .............................................................. 46Table I.A-2 Latin America and the Caribbean: net foreign direct investment inflows by country, 2000-2011 ................ 46Table I.A-3 Latin America and the Caribbean: net foreign direct investment inflows by destination sector, 2000-2011 ........................................................................................................................ 47

Foreign Direct Investment in Latin America and the Caribbean • 2011 5
Table I.A-4 Latin America and the Caribbean: net foreign direct investment inflows by country of origin, 2000-2011 ......................................................................................................................... 50Table I.A-5 Latin America and the Caribbean: net foreign direct investment by component, 2005-2011 ....................... 53Table I.A-6 Latin America and the Caribbean: net foreign direct investment outflows by country, 2000-2011 .............. 55Table II.1 European Union: foreign direct investment flows and stock by destination, 2000-2010 .............................. 61Table II.2 Latin America and the Caribbean: origin of foreign direct investment, 2000-2010 ..................................... 64Table II.3 Latin America and the Caribbean: largest European Union transnationals by sales, 2010 ........................... 69Table II.4 Latin America and the Caribbean: European transnationals ......................................................................... 77Table II.5 Transnational companies: driving factors and main impacts of the internationalization of corporate research and development activities ............................................................................................................... 79Table II.6 Brazil: European companies with recent research and development projects .............................................. 83Table II.7 Major trans-Latins in the European Union, 2010 .......................................................................................... 87Table II.A-1 European Union: stock of foreign direct investment, 2010 ........................................................................... 93Table II.A-2 European Union (selected countries): foreign direct investment flows to Latin America and the Caribbean, 2000-2010 .............................................................................................................................. 94Table II.A-3 Latin America (selected countries): foreign direct investment flows from the European Union, 2000-2010 ...................................................................................................................................................... 94Table II.A-4 South America: bilateral investment treaties with European Union countries, 2011 .................................... 94Table II.A-5 Latin America and the Caribbean (selected countries): stock of foreign direct investment in the European Union, 2006-2010 ................................................................................................................ 95Table II.A-6 Latin America: acquisition of European Union companies or assets by trans-Latins, 2006-2011 ................ 95Table II.A-7 Latin America: investment projects by trans-Latins in the European Union, 2011 ....................................... 96Table III.1 Twenty largest mergers and acquisitions in the banking sector, 1990-2011 .................................................. 104Table III.2 World’s 20 largest banks, by assets, 2000-2011 ............................................................................................ 105Table III.3 Twenty largest cross-border mergers and aquisitions in the banking sector, 1990-2011 ............................... 107Table III.4 Latin America (selected countries): foreign direct investment in the financial sector, 2000-2010 ................ 117Table III.5 Latin America: largest mergers and acquisitions undertaken by foreign banks, 1990-2011 ......................... 118Table III.6 Assets of major foreign banks operating in Latin America, by country, June 2011 ...................................... 119Table III.7 Latin America: concentration of the banking market, 1994-2010 ................................................................. 119Table IV.1 Projected investments in the electricity sector, 2011-2035 ............................................................................ 145Table IV.2 The world’s leading electricity companies by sales, 2010 ............................................................................. 146Table IV.3 Latin America (main economies): public or private participation in the electricity sector, 2011 .................. 152Table IV.4 Latin America and the Caribbean (selected countries): foreign direct investment in electricity, gas and water, 1999-2010 .............................................................................................................................. 155Table IV.5 Latin America: main transnationals and the countries in which they are present .......................................... 158Table IV.6 Latin America and the Caribbean: main acquisitions in the electricity sector 1990-2011 ............................ 161Table IV.7 Leading world manufacturers of wind power and photo-voltaic components ............................................... 168
FiguresFigure I.1 Latin America and the Caribbean: foreign direct investment flows, 1990-2011 ........................................... 20Figure I.2 Global flows of foreign direct investment by group of economies, 1990-2011 ............................................ 21Figure I.3 Value of cross-border mergers and acquisitions worldwide, 1987-2011 ....................................................... 22Figure I.4 Latin America and the Caribbean: total inflows of foreign direct investment and inflows by subregion, 1990-2011................................................................................................................................ 22Figure I.5 Latin America and the Caribbean: inward cross-border capital flows (foreign direct investment, portfolio investment and other investment), 2000-2011 ............................................................................................... 24Figure I.6 Latin America and the Caribbean: inflows of foreign direct investment as a proportion of GDP, 2011 ....... 25Figure I.7 Central America: distribution of foreign direct investment flows by country, 2011 ...................................... 28Figure I.8 Latin America and the Caribbean: origin of foreign direct investment, 2006-2011 ...................................... 31Figure I.9 Latin America and the Caribbean: sectoral distribution of foreign direct investment by subregion, 2006-2011................................................................................................................................ 32Figure I.10 Latin America and the Caribbean: sectoral distribution of cross-border mergers and acquisitions, 2011..... 32Figure I.11 Latin America and the Caribbean: foreign direct investment by component, 2000-2011 ............................. 33Figure I.12 Latin America and the Caribbean: capital income remitted abroad, 2000-2010 ........................................... 34Figure I.13 Latin America and the Caribbean: foreign direct investment (FDI) stock and repatriated FDI earnings ..... 34Figure I.14 Latin America and the Caribbean: distribution of amounts associated with new foreign direct investment projects by technology intensity, 2003-2005, 2008-2010 and 2011 .............................................................. 35Figure I.15 Latin America and the Caribbean: distribution of sums associated with new foreign direct investment projects related to research and development activities, 2008-2010 and 2011 .............................................. 36 Figure I.16 Latin America and the Caribbean: outward foreign direct investment, 1992-2011 ....................................... 37
Economic Commission for Latin America and the Caribbean (ECLAC)6
Figure I.17 Latin America and the Caribbean: capital outflows as direct investment, portfolio investment and other flows, 2000-2010 ........................................................................................................................... 37Figure I.18 Latin America and the Caribbean (selected countries): outward foreign direct investment, 2010 and 2011 ................................................................................................................................................ 37Figure I.19 Brazil: outward foreign direct investment by component, 1999-2011........................................................... 41Figure II.1 World (selected regions and countries): foreign direct investment flows, 1990-2010 ................................... 59Figure II.2 World (selected countries): foreign direct investment flows, 2010 ................................................................ 60Figure II.3 European Union: foreign direct investment by destination, 2000-2010 ........................................................ 60Figure II.4 Latin America and the Caribbean: origin of foreign direct investment, 2000-2010 ...................................... 62Figure II.5 European Union: foreign direct investment flows to Latin America and the Caribbean, by subregion, 2000-2006................................................................................................................................ 62Figure II.6 European Union: foreign direct investment flows towards Latin America and the Caribbean (selected countries), 2000-2005 and 2006-2010 ........................................................................................... 63Figure II.7 European Union: foreign direct investment flows to Latin America and the Caribbean (selected countries), 2000-2010 ..................................................................................................................... 63Figure II.8 Latin America and the Caribbean: foreign direct investment inflows from the European Union by country of origin, 1999-2010 .................................................................................................................... 65Figure II.9 Spain: distribution of outward foreign direct investment, 1996-2008 ........................................................... 65Figure II.10 Raw materials price index, 2003-2011 .......................................................................................................... 70Figure II.11 Latin America and the Caribbean: return on assets of the top 500 companies in the region, by industry 2010 ............................................................................................................................................ 71Figure II.12 Latin America and the Caribbean: sums associated with new foreign direct investment projects announced in manufacturing, by origin, 2003-2011 ...................................................................................... 73Figure II.13 Spanish transnationals: operating income before depreciation and amortization, 2010 ................................ 75Figure II.14 European Union: foreign direct investment in research and development by destination, 2003-2011.......... 80Figure II.15 Latin America and the Caribbean: sums associated with new foreign direct investment projects announced in research and development, by origin, 2003-2010 ...................................................... 81Figure II.16 European Union: sums associated with new foreign direct investment projects in research and development, by destination, 2003-2011 ................................................................................................ 82Figure II.17 Latin America and the Caribbean (selected countries): foreign direct investment flows towards the European Union, 2006-2010 .................................................................................................................... 84Figure II.18 Latin America and the Caribbean: outward foreign direct investment, 2006-2010 ....................................... 85Figure II.19 Latin America and the Caribbean: foreign direct investment projects in the European Union, by country of origin, 2003-2010 .................................................................................................................... 85Figure II.20 Latin America and the Caribbean: foreign direct investment projects in the European Union by destination, 2003-2010 .............................................................................................................................. 86Figure II.A-1 European Union and developing countries: share of global outward foreign direct investment, 1990-2010 ...................................................................................................................................................... 93Figure II.A-2 Latin America and the Caribbean (selected countries): ratio of foreign direct investment from the European Union to gross domestic product, 2010 ................................................................................... 93Figure II.A-3 Most important location factors for activities of research and development European transnationals .......... 96Figure III.1 Selected countries: income level and depth of the banking system, 2010 ..................................................... 98Figure III.2 Selected countries and regions: national financial systems, 1990-2009 ........................................................ 99Figure III.3 World’s 1,000 largest banks, 1990-2011 ........................................................................................................ 103Figure III.4 World’s 1,000 largest banks: number of entities, assets and pre-tax profits, by origin of banks, 1995-2010 ...................................................................................................................................................... 103Figure III.5 Banking sector mergers and acquisitions worldwide, 1985-2011 ................................................................. 103Figure III.6 Advanced economies (selected countries): five largest banks’ share in total assets, 2001-2010 ................... 103Figure III.7 Advanced economies (selected countries): national banking sector assets, 1990-2010 ................................ 103Figure III.8 External assets of banks with international operations, by nationality of bank, 2000-2011 ......................... 106Figure III.9 International operations (selected entities): geographical distribution of profits, 2011................................. 108Figure III.10 Organized stock markets and informal derivatives markets, 2000-2011 ....................................................... 110Figure III.11 Latin America: composite performance of the 250 largest banks, 2005-2011 .............................................. 112Figure III.12 Selected countries and regions: domestic credit extended by the banking sector, 2001-2010 ...................... 112Figure III.13 Brazil: share in the banking sector by type of entity, 1995-2010 .................................................................. 113Figure III.14 Latin America (selected countries): domestic credit extended by the banking sector, 2001-2010 ................ 113Figure III.15 Latin America (selected countries): income level and depth of the banking sector, 2010 ............................. 113Figure III.16 Selected countries and regions: capital over total assets in the banking system, 2001-2009 ........................ 114Figure III.17 Latin America (selected countries): capital over total assets in the banking system, 2001-2010 .................. 114Figure III.18 Selected countries and regions: liquid reserves over total assets in the banking system, 2001-2010 ............ 114Figure III.19 Selected countries and regions: bank branches per 100,000 inhabitants, 2004-2010 .................................... 115

Foreign Direct Investment in Latin America and the Caribbean • 2011 7
Figure III.20 Selected countries and regions: automatic cash dispensers per 100,000 inhabitants, 2004-2010 ................. 115Figure III.21 Latin America (selected countries): intermediation spreads, 2001-2009 ....................................................... 115Figure III.22 Latin America (selected countries): share of foreign banks in total assets of the banking industry, 1995-2010 ......................................................................................................................... 116Figure III.23 Latin America: projects announced in the banking sector, by country of origin and destination, 2003-2011 ............................................................................................................................ 117Figure III.24 Latin America and the Caribbean: credits as a percentage of total assets of local and foreign banks, 2001-2010 ........................................................................................................................ 123Figure III.25 Latin America and the Caribbean: deposits as a percentage of total assets of local and foreign banks, 2001-2010 ........................................................................................................................ 123Figure III.26 Latin America and the Caribbean: capital and reserves as a percentagae of total assets of local and foreign banks, 2001-2010 .......................................................................................................... 123Figure III.27 Latin America and the Caribbean: liquidity coefficients of local and foreign banks, 2001-2010 ................. 123Figure III.28 Latin America and the Caribbean: gross lending interest rates charged by local and foreign banks, 2001-2010 ........................................................................................................................ 124Figure III.29 Latin America and the Caribbean: interest rates paid on deposits by local and foreign banks, 2001-2010 ...... 124Figure III.30 Latin America and the Caribbean: average operating costs for local and foreign banks, 2001-2010............ 125Figure III.31 Latin America and the Caribbean: arrears indices for local and foreign banks, 2001-2010 .......................... 125Figure III.32 Latin America and the Caribbean: asset yields for local and foreign banks, 2001-2010 ............................... 126Figure III.33 Latin America and the Caribbean: profit/capital ratios for local and foreign banks, 2001-2010 .................. 126Figure III.34 Selected countries: sovereign debt exposure of European banks, 2010-2011 ............................................... 127Figure III.35 European bank recapitalization requirements, by home country, 2011 ......................................................... 129Figure III.36 Latin America and the Caribbean: foreign bank lending, by country of destination, 2000-2011 .................. 130Figure III.37 Latin America and the Caribbean (selected countries): foreign bank lending, 2000-2010 ........................... 130Figure III.38 Latin America and the Caribbean: foreign bank loans, by borrowing sector and fund source, 2000-2011 ....... 131Figure III.39 Latin America and the Caribbean: foreign bank loans, by lender’s home country, 2000-2011 ..................... 131Figure IV.1 World: installed capacity of new renewable energies, 2000-2010 ................................................................. 148Figure IV.2 Latin America (selected countries): investment in energy infrastructure, 1980-1985, 1996-2001 and 2002-2006 .............................................................................................................................................. 150Figure IV.3 Latin America: total values of cross-border mergers and acquisitions in the electricity sector, 1992-2011 ...... 151Figure IV.4 Mexico: private investment in electricity generation, 1994-2011 .................................................................. 154Figure IV.5 Latin America and the Caribbean: investment committments in energy projects with private participation, 1990-2009 ................................................................................................................................ 155Figure IV.6 Latin America and the Caribbean: structure of electric power generation by installed capacity, 2010 ............................................................................................................................. 156Figure IV.7 Latin America (selected countries): installed hydroelectric capacity, latest year available, around 2011 .................................................................................................................................................. 156Figure IV.8 Latin America (selected countries): average industrial electricity rates including taxes ............................... 157Figure IV.9 Latin America: income obtained by the main electricity transnationals in the region, 2010 ......................... 159
BoxesBox I.1 The challenge of mining in Central America ................................................................................................. 29Box I.2 China finances and executes the largest tourism project in the Caribbean .................................................... 31Box I.3 Colombian companies expand internationally ............................................................................................... 39Box II.1 The statistical challenge of foreign direct investment and the role of the Netherlands as a financial centre ........................................................................................................................................ 67Box II.2 Impact of FDI in Latin America and the Caribbean: the role of subsidiaries ............................................... 79Box II.3 Research and development by trans-Latins in Europe: Gerdau and Weg ..................................................... 86Box III.1 What progress in reforming the international financial system? ................................................................... 111Box III.2 Foreign banks’ swift entry into Mexico ......................................................................................................... 120Box III.3 Stress tests for major banks in the European Union ...................................................................................... 128Box IV.1 Electric power generation technologies ......................................................................................................... 147Box IV.2 Investment funds in the electricity industry ................................................................................................... 160Box IV.3 Smart grids ..................................................................................................................................................... 173
DiagramDiagram III.1 Evolution of financial systems, 1929-2012 .................................................................................................... 100
MapMap II.1 Latin America and the Caribbean: strategic hubs and direction of international expansion by Spanish companies ................................................................................................................................... 75


9Foreign Direct Investment in Latin America and the Caribbean • 2011
Summary and conclusions
As in previous years, this report provides a quantitative overview of foreign direct investment
(FDI) inflows and examines these capital flows by destination economic sector and geographical
area of origin. It describes the pattern of FDI originating in the countries of Latin America
and the Caribbean, focusing on the international expansion under way at some of the region’s
major companies, the so-called trans-Latins.
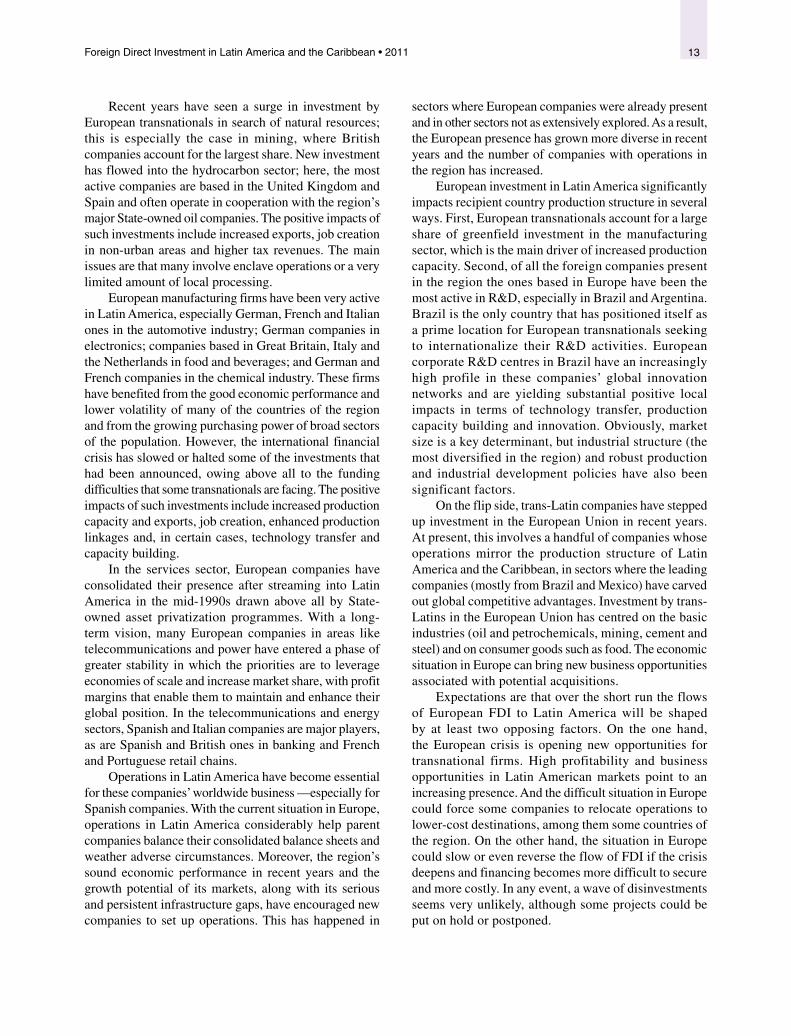
The main theme of the report is the operations of European companies in Latin America and
the Caribbean. Because the European Union economic bloc is the leading origin of inward FDI
in the region, the main characteristics of European FDI are reviewed, identifying the leading
investor countries and their preferred destination economies and sectors in Latin America
and the Caribbean. The report examines the behaviour and strategy of the major European
transnationals and, in search of a more thorough understanding, takes a detailed look at two
sectors where foreign capital, especially from Europe, plays a substantial role: commercial
banking and power.

10 Economic Commission for Latin America and the Caribbean (ECLAC)
A. Overview of foreign direct investment in Latin America and the Caribbean
In 2011, US$ 153.991 billion in foreign direct investment (FDI) flowed into Latin America and the Caribbean —28% more than in 2010. It was the second year of growth after the decline triggered by the 2009 financial crisis. Latin America was the region that recorded the highest percentage increase in FDI inflows, which brought its share of global inward FDI to 10%. In contrast to 2010, global FDI flows jumped 17% and also rose in the developed countries, which had posted the sharpest drops in the two previous years.
The region’s sustained economic growth (albeit slower than in 2010) continued to attract investments seeking to tap into dynamic domestic markets. High international prices for raw materials spurred investments in natural resource extraction and processing. And the economic crisis in the developed economies continued to prompt business restructurings, relocation of operations and offshoring of manufacturing operations and remote business services.
In Latin America and the Caribbean, all of the subregions and most of the countries received more investment than in 2010 (see figure 1). Brazil accounted for most of the increase, reaching US$ 66.66 billion —nearly half the region’s total. Generally speaking, most of the countries of South America saw rising FDI inflows, with record highs posted in countries such as Chile (US$ 17.299 billion), Colombia (US$ 13.234 billion) and Uruguay (US$ 2.528 billion).
Figure 1 LATIN AMERICA AND THE CARIBBEAN: TOTAL FOREIGN DIRECT INVESTMENT INFLOWS AND INFLOWS BY SUBREGION, 1990-2011
(Billions of dollars)
0
20
40
60
80
100
120
140
160
1990
1991
1992
1993
1994
1995
1996
1997
1998
1999
2000
2001
2002
2003
2004
2005
2006
2007
2008
2009
2010
2011
South America Mexico, Central America and the Caribbean Total
Source: Economic Commission for Latin America and the Caribbean (ECLAC), on the basis of official figures and estimates as at 16 April 2012.
In Mexico, inward FDI was 6% below the figure for 2010. Central America overall recorded a 36% increase; all of the economies of this subregion saw gains. Inward FDI to the Caribbean rose after falling for two years in a row, thanks above all to an increase in investment projects in the natural resources sector. Inward FDI increased in the Dominican Republic (US$ 2.371 billion) and Suriname (US$ 154 million). Overall, the real estate and tourism sectors continued to show the effects of the international financial crisis. In the Bahamas, though, with financial support from Chinese investors, construction has begun on the largest hotel complex in the Caribbean.
Over the past two decades of rising FDI flows, transnational companies have consolidated a robust presence in Latin America and the Caribbean, especially in the more capital-intensive sectors. As a result, the high profits garnered by foreign companies in the region are a key variable for examining the impact of inward FDI and FDI income on the balance of payments of the economies of the region. Reinvested earnings as a percentage of total FDI have been growing steadily since 2002 and hit 46% in 2011. And there has been a leap in the repatriation of profits to parent companies, from an average of some US$ 20 billion between 1998 and 2003 to a high of US$ 93 billion in 2008 (see figure 2).
Figure 2 LATIN AMERICA AND THE CARIBBEAN: PROFITS
REPATRIATION, 2000-2010(Billions of dollars)
0
10
20
30
40
50
60
70
80
90
100
2000 2001 2002 2003 2004 2005 2006 2007 2008 2009 2010
Source: Economic Commission for Latin America and the Caribbean (ECLAC), on the basis of official figures.

11Foreign Direct Investment in Latin America and the Caribbean • 2011
There are two main reasons behind the rising share of reinvested earnings and the increase in repatriation of FDI profits from 2003 on. First is the sharp rise in the region’s FDI stock as a natural outcome of the nominal increase in earnings on these investments. Second, the increase in reinvested and repatriated earnings between 2004 and 2007 was situational, boosted by favourable economic conditions in many of the countries of Latin America and the Caribbean, rising raw materials prices, new business opportunities and the growing purchasing power of the middle class. All of these factors fed the profitability of many transnationals operating in the region. Situational factors aside, the level of cumulative FDI in the region continues to fuel the outward flow of income associated with these capital flows, showing that FDI is not a one-way flow of resources. This makes it even more pressing to assess qualitative aspects of FDI, such as its ability to spur the development of strategic sectors, transform the production structure, accumulate knowledge and contribute to job creation and job quality.
The ability of FDI to transform the production structure of the economies of the region largely depends on the pattern of investment destination sectors. For most of the economies of South America, which are heavily reliant on natural resources, the bulk of FDI still flows into the natural resources sector. In 2011, Brazil was an exception in that investment in natural resources dropped because there were no major acquisitions in the hydrocarbon sector as there had been in 2010. By contrast, in Mexico, Central America and the Caribbean only 8% of total FDI went to natural-resource-related activities; services (53%) and manufactures (40%) still accounted for the bulk of inflows. For the region overall, FDI to the manufacturing sector went mostly to medium-high-tech industries, whose share of greenfield FDI projects grew while the percentage going to high-tech projects fell to just 3%.
As for the origin of FDI, the Netherlands was the leading investor in the region, basically because it is a conduit for investments from third countries. It is followed by the United States, at 18% of received FDI, Spain (14%) and Japan (8%). Japanese investment in the region surged in 2011. Despite the sharp rise in investment from Asia over the past two years, most inward FDI in Latin America and the Caribbean is from European Union countries.
The flow of outward FDI from the countries of Latin America and the Caribbean totalled US$ 22.605 billion in 2011, well below the US$ 44.924 billion posted in 2010. This decline came in a context of high volatility for these capital outflows in recent years because the number of countries and companies involved is small. Nevertheless, there is indeed a long-term expansionary trend in FDI by trans-Latin companies. Moreover, as was the case in 2009, the drop may be attributed to the pattern followed by
Brazilian companies. In 2011 Brazil recorded a negative FDI position of US$ 9.297 billion, essentially because of loans that foreign subsidiaries of Brazilian firms made to their parent companies (see figure 3). Nevertheless, this does not mean that Brazilian companies have abandoned their strategy for expanding internationally —rather, it shows that securing funding abroad was an advantageous option in recent years and that in 2011 they preferred to invest in their own market.
Figure 3 LATIN AMERICA AND THE CARIBBEAN (SELECTED COUNTRIES):
OUTWARD FOREIGN DIRECT INVESTMENT, 2010 AND 2011(Billions of dollars)
-15
-10
-5
0
5
10
15
Chile Mexico Colombia Brazil Argentina Venezuela(Bol. Rep. of)
Peru Central America a
2010 2011
Source: Economic Commission for Latin America and the Caribbean (ECLAC), on the basis of official figures as of 16 April 2012.
a Includes Costa Rica, El Salvador, Guatemala and Honduras.
Chile was the country of the region accounting for the most outward FDI in 2011, at US$ 11.822 billion, followed by Mexico (US$ 9.640 billion) and Colombia (US$ 8.289 billion) (see figure 3). Overall, the trans-Latins continued to focus on expanding in their home region and in neighbouring countries: Mexican companies tended to invest in the United States and Latin America and the Caribbean; Chilean companies focused on Argentina, Brazil, Colombia and Peru; and Colombian companies have established a solid presence in Central America. Argentina’s outward FDI rose to US$ 1.488 billion. Beyond this overall trend, in 2011 trans-Latin companies stepped up their acquisitions of assets held by European and United States companies. This is still an incipient development, but for many of these groups it could mark the beginning of a global expansion.
Despite the situational decline in 2011, the long-term uptrend in outward FDI from Latin America and the Caribbean held, in a global context where the emerging economies are increasingly relevant players. It is in this setting that the governments of the larger economies of the region, home to some of the major trans-Latins, have begun to weigh targeted policies for supporting the international expansion of their leading companies.

12 Economic Commission for Latin America and the Caribbean (ECLAC)
Projections of FDI in Latin America and the Caribbean in 2012 are based on two conflicting situations. On the one hand, it is clear that the region will continue to attract transnationals thanks to strong growth prospects amid considerable international uncertainty. On the other hand, the crisis in Europe could deepen, pushing up finance costs and limiting the availability of credit, with adverse effects on investment in the region, especially by European transnationals. In any case, if commodity prices remain
high and the region continues to show macroeconomic stability, investment in the primary sector and in domestic market products and services will likely grow. In view of long-term trends in flows and the preliminary information available, ECLAC estimates that FDI inflows to Latin America and the Caribbean will vary by between -2% and 8% compared with 2011 flows. FDI flows will therefore remain high in the region in 2012, at around US$ 150 billion.
B. Foreign direct investment between the European Union and Latin America and the Caribbean
Over the past decade, the European Union sent an average of US$ 30 billion per year in FDI to Latin America and the Caribbean. At nearly 40% of total FDI inn the region, this makes the European Union the leading origin of inward FDI to Latin America and the Caribbean (see figure 4). European transnational companies have a diversified presence in the economies of Latin America, spanning extractive, manufacturing and service sectors; they are major players in strategic industries such as banking and energy. While the European Union still ranks as the largest investor, over the past 10 years Latin America and the Caribbean has seen a decline in its share of overall investment flowing from the European Union. For example, Spain, the largest European investor in the region, is shifting its investment focus to other countries inside the European Union bloc and to other developing regions.
Figure 4 LATIN AMERICA AND THE CARIBBEAN: ORIGIN OF FOREIGN
DIRECT INVESTMENT, 2000-2010(Millions of dollars)
0
10 000
20 000
30 000
40 000
50 000
2000 2001 2002 2003 2004 2005 2006 2007 2008 2009 2010
European UnionUnited States
Asia and OceaniaLatin America and the Caribbean
Source: Economic Commission for Latin America and the Caribbean (ECLAC), on the basis of official figures from the central banks of Latin America and Caribbean countries.
In absolute terms, European FDI towards Latin America and the Caribbean surged during the second half of the 2000s but the increase was not evenly distributed among the subregions. European FDI was concentrated in South America; Brazil received the largest share, followed by Argentina, Colombia and Chile. In this subregion, rising commodity prices and growing domestic economies attracted new investment seeking to exploit natural resources and tap into brisk local markets, especially for manufactures. By contrast, European FDI towards Mexico, Central America and the Caribbean held fairly stable. This subregion was impacted by the economic slowdown in the United States and its substantial effect on investment overall, including from Europe. In this scenario, the European Union’s share of FDI flowing into the countries of South America increased.
The destination sectors of European FDI have been determined by the production structure of the countries sending and receiving these capital flows. Spanish and Italian transnationals have concentrated on service sectors and have a broad footprint in the region; companies based in Germany, Great Britain and the Netherlands have focused on manufacturing in the larger economies (Brazil, Mexico and Argentina). In the receiving economies, European investment in the countries of South America has flowed above all into the service sectors and into natural resource exploration, exploitation and processing. In Brazil, the largest share of European investment is in manufacturing industries. In Mexico, Central America and the Caribbean, European companies have a larger footprint in services and manufactures and a markedly smaller one in natural resources.
13Foreign Direct Investment in Latin America and the Caribbean • 2011
Recent years have seen a surge in investment by European transnationals in search of natural resources; this is especially the case in mining, where British companies account for the largest share. New investment has flowed into the hydrocarbon sector; here, the most active companies are based in the United Kingdom and Spain and often operate in cooperation with the region’s major State-owned oil companies. The positive impacts of such investments include increased exports, job creation in non-urban areas and higher tax revenues. The main issues are that many involve enclave operations or a very limited amount of local processing.
European manufacturing firms have been very active in Latin America, especially German, French and Italian ones in the automotive industry; German companies in electronics; companies based in Great Britain, Italy and the Netherlands in food and beverages; and German and French companies in the chemical industry. These firms have benefited from the good economic performance and lower volatility of many of the countries of the region and from the growing purchasing power of broad sectors of the population. However, the international financial crisis has slowed or halted some of the investments that had been announced, owing above all to the funding difficulties that some transnationals are facing. The positive impacts of such investments include increased production capacity and exports, job creation, enhanced production linkages and, in certain cases, technology transfer and capacity building.
In the services sector, European companies have consolidated their presence after streaming into Latin America in the mid-1990s drawn above all by State-owned asset privatization programmes. With a long-term vision, many European companies in areas like telecommunications and power have entered a phase of greater stability in which the priorities are to leverage economies of scale and increase market share, with profit margins that enable them to maintain and enhance their global position. In the telecommunications and energy sectors, Spanish and Italian companies are major players, as are Spanish and British ones in banking and French and Portuguese retail chains.
Operations in Latin America have become essential for these companies’ worldwide business —especially for Spanish companies. With the current situation in Europe, operations in Latin America considerably help parent companies balance their consolidated balance sheets and weather adverse circumstances. Moreover, the region’s sound economic performance in recent years and the growth potential of its markets, along with its serious and persistent infrastructure gaps, have encouraged new companies to set up operations. This has happened in
sectors where European companies were already present and in other sectors not as extensively explored. As a result, the European presence has grown more diverse in recent years and the number of companies with operations in the region has increased.
European investment in Latin America significantly impacts recipient country production structure in several ways. First, European transnationals account for a large share of greenfield investment in the manufacturing sector, which is the main driver of increased production capacity. Second, of all the foreign companies present in the region the ones based in Europe have been the most active in R&D, especially in Brazil and Argentina. Brazil is the only country that has positioned itself as a prime location for European transnationals seeking to internationalize their R&D activities. European corporate R&D centres in Brazil have an increasingly high profile in these companies’ global innovation networks and are yielding substantial positive local impacts in terms of technology transfer, production capacity building and innovation. Obviously, market size is a key determinant, but industrial structure (the most diversified in the region) and robust production and industrial development policies have also been significant factors.
On the flip side, trans-Latin companies have stepped up investment in the European Union in recent years. At present, this involves a handful of companies whose operations mirror the production structure of Latin America and the Caribbean, in sectors where the leading companies (mostly from Brazil and Mexico) have carved out global competitive advantages. Investment by trans-Latins in the European Union has centred on the basic industries (oil and petrochemicals, mining, cement and steel) and on consumer goods such as food. The economic situation in Europe can bring new business opportunities associated with potential acquisitions.
Expectations are that over the short run the flows of European FDI to Latin America will be shaped by at least two opposing factors. On the one hand, the European crisis is opening new opportunities for transnational firms. High profitability and business opportunities in Latin American markets point to an increasing presence. And the difficult situation in Europe could force some companies to relocate operations to lower-cost destinations, among them some countries of the region. On the other hand, the situation in Europe could slow or even reverse the flow of FDI if the crisis deepens and financing becomes more difficult to secure and more costly. In any event, a wave of disinvestments seems very unlikely, although some projects could be put on hold or postponed.

14 Economic Commission for Latin America and the Caribbean (ECLAC)
In an increasingly globalized world, the European Union has economic, social and cultural characteristics that are especially useful for the development of Latin America and the Caribbean. And the region itself can become a source of stimulus for the European economies (particularly as they face the financial crisis) and for their major transnational companies. Both regions therefore need to enhance their investment cooperation programmes in terms of production policy, technological cooperation and innovation so as to better leverage the array of complementarities between them. Latin America
should supplement its policies for promoting FDI with greater efforts in the industrial policy area to boost the permanent and dynamic benefits of these capital flows. They need to move from policies targeting FDI to policies that focus on what transnational companies do in areas such as human resource development, technology transfer and innovation and R&D.
Latin America and the Caribbean could thus draw greater benefit from the stock of knowledge, quality investments and broad potential of European companies in the region.
C. The international financial crisis, the banking sector and foreign direct investment in Latin America and the Caribbean
Over the past few decades, financial systems (a linchpin of economic development) have undergone profound transformations spurred by deregulation and technological progress, generating new credit and saving opportunities for individuals, households and businesses. In the advanced economies, the proliferation of financial innovations helped broaden business options (some of them speculative in nature) that relied on high levels of leverage and thus made it possible to diversify and transfer risk. The burgeoning industry went through an accelerated process of concentration and grew ever more integrated at the local, regional and global level.
Latin America was not on the sidelines of these changes. Ambitious reforms launched in the 1980s sought to open the capital account and liberalize local capital markets and the banking system. Among the more significant measures were easing interest rate controls, privatizing State-owned and development banks, lifting restrictions on the entry of foreign banks and allowing banks to engage in multiple activities. The goal was to encourage domestic saving, complemented by foreign saving, and foster the efficient allocation of resources. But macroeconomic instability and external vulnerability laid bare the fragility of Latin America’s financial systems. In response to serious and recurring bank crises, new legal and institutional reforms geared towards prudence were rolled out and helped strengthen the financial system.
On a global scale, financial institutions and transactions grew so large and complex that they overwhelmed weak regulatory and oversight regimes and the evaluation capacity of private risk rating agencies. So, when the conditions changed they set off a colossal financial crisis as national, regional and multilateral authorities launched substantial efforts to mitigate its impacts and contain the contagion. Nevertheless, the financial crisis that began with subprime mortgages and the collapse of Lehman Brothers and was made worse by the European sovereign debt crisis has still showed no clear signs of remission, keeping many industry actors in a precarious situation.
While the international financial crisis hit Latin America and the Caribbean hard, with some differences, it was unlike previous meltdowns in that the local economies recovered quickly and banking systems remained stable and sound. Indeed, banks are now better regulated and capitalized, and they are more efficient. This could lay the groundwork for more orderly, sustained development in the future. Despite brisk growth, though, the financial systems of Latin America still lag somewhat behind, especially when compared with the advanced economies. With few exceptions, the degree of bank access and use is lower than in other counties with similar per capita income levels, and it is skewed towards short-term credit —even more so following widespread adoption of updated consumer loan administration practices (see figure 5).

15Foreign Direct Investment in Latin America and the Caribbean • 2011
Figure 5 SELECTED COUNTRIES: RELATIONSHIP BETWEEN INCOME
LEVEL AND BANK SECTOR DEEPENING, 2010(Thousands of dollars and percentages of GDP)
0
5
10
15
20
25
30
35
40
45
50
0 50 100 150 200 250 300 350
Per
cap
ita G
DP
Japan
Spain
United Kingdom
United StatesNetherlands
Germany
France
China
Rep. of Korea
India
RussianFed.
Domestic bank lending
Chile
Argentinanainaina Mexico
Latin America Brazil
Source: Economic Commission for Latin America and the Caribbean (ECLAC), on the basis of data from World Bank, World Development Indicators (WDI) [online] http://data.worldbank.org/indicator.
Throughout this process the international dimension of the banking business has become increasingly important. As markets matured and became more competitive, some major banks in the advanced economies set out in search of new opportunities outside their home countries. They were spurred by burgeoning trade and transnational corporate operations, the growing need for financing to cover global payment imbalances and the advance of emerging economies. Cross-border loans managed from the parent company began to increase, and subsidiaries were established or local institutions purchased to offer banking services in foreign markets. Over the past few decades, many developing countries saw a growing influx of foreign banks. More recently, many financial sectors in developed countries, especially in Europe, have been the setting for cross-border mergers and acquisitions.
In the mid-1990s, the presence of foreign banks in emerging economies began to swell. Latin America became a prime destination, on the strength of economic reforms, the privatization of State-owned assets and the weakness of the local banking sector. Foreign banks now have a market share of nearly 20% in developing Asia, 35% in Latin America and 90% in Eastern Europe. This process was limited to a few financial institutions from Europe and the United States and Canada, some with a long-standing global vocation (Citigroup and HSBC) and others that in just a few years have gained a strong foothold in selected countries or regions (Santander and BBVA). The Spanish banks are at the forefront in Latin America; Italian and Austrian ones were the major players in Eastern Europe (see figure 6).
Figure 6 INTERNATIONAL TRANSACTIONS (SELECTED ENTITIES):
GEOGRAPHICAL DISTRIBUTION OF PROFITS, 2011(Percentages)
0
10
20
30
40
50
60
70
80
90
100
Banco Santander
BBVA HSBC Standard Chartered
UniCredit Citigroup Scotiabank
Spain United Kingdom ItalyUnitedStates Canada
Home country Europe United StatesLatin America
AsiaCentral and Eastern Europe Other
Source: Economic Commission for Latin America and the Caribbean (ECLAC), on the basis of data from banking institutions.
Over the past two decades, the growing presence of foreign banks has become one of the key factors shaping Latin America’s banking industry. Local authorities expected that the influx of international institutions would recapitalize local banks, encourage modernization, make the industry more competitive and limit the potential for further financial crises. The share of banking industry assets held by foreign banks went from 11% in 1995 to 31% in 2000 and neared 35% in 2010 (see figure 7). For the handful of international institutions operating in the region, this has become a central part of their global business, especially in the case of the Spanish banks.
Figure 7 LATIN AMERICA (SELECTED COUNTRIES): SHARE OF BANKING
INDUSTRY ASSETS HELD BY FOREIGN BANKS, 1995-2010(Percentages)
0
10
20
30
40
50
60
70
80
90
Argentina Brazil Chile Colombia Mexico Peru Uruguay Venezuela (Bol. Rep. of)
LatinAmerica
1995 2000 2005 2010
Source: Economic Commission for Latin America and the Caribbean (ECLAC), on the basis of data from BankScope and Stijn Claessens and others, Foreign Bank Presence in Developing Countries 1995-2006: Data and Trends, March 2008.

16 Economic Commission for Latin America and the Caribbean (ECLAC)
Overall, the entry of foreign banks in Latin America and the Caribbean galvanized the regional financial market. Foreign banks stiffened domestic competition, forcing the sector’s margins and costs down. They helped modernize the Latin American banking system by improving internal processes, perfecting risk rating systems and broadening the supply of services. They furthered social inclusion and reached new, growing segments of society that before then were mainly served by national banks. But foreign banks are still markedly biased towards higher-income segments of the population, which are usually less risky.
With the relative maturity of the market, the efficiency and productivity indicators of domestic and foreign banks have started to converge. The regional and global turmoil of the early 2000s and the international financial crises after 2007 might have influenced the pull-back and greater caution on the part of foreign banks. Domestic banks responded quickly, made substantial improvements in efficiency and productivity and took back much of the market share lost during the previous decade.
Recently, the global financial crisis has led to concern over the large share of the Latin American banking system that is in the hands of European banks. Strong
pressure associated with sovereign funding could trigger massive losses for these entities overall, and limits on recapitalization could force banks to deleverage in order to restore their capital ratios. But while these institutions were not unaffected by the credit crunch and deteriorating interbank market liquidity, they have exhibited resilience and stability and are thus less likely to become a channel for the transmission of external shocks. These outcomes may be attributed to the high degree of operating autonomy that Latin American subsidiaries have from their parent companies: much of their lending is denominated in local currency and is funded with local deposits. Foreign banks depend very little on foreign-currency funding from their parent companies or international interbank markets to fund their lending operations.
In short, foreign banks were drawn to Latin America by two principal factors. First, developed-country banks were searching for new options in the face of shrinking income in mature and very competitive domestic markets. Second, Latin America’s revamped institutional framework and improved macroeconomic context after the series of profound economic and financial crises of prior decades enabled them to enter markets with low levels of bank access and use and high growth potential.
The power sector is a strategic one for all countries because it impacts the economy directly, influences the competitiveness of the other sectors and can drag along construction companies and components manufacturers. In all of the countries, the State exerts control over the sector through regulatory agencies and, often, through State-owned companies. In Latin America and the Caribbean, FDI has streamed into the power sector over the past 20 years, giving the corporate strategies followed by transnational power companies a good deal of influence over power system development in many economies.
Foreign investment was especially sizable between 1996 and 2001, when most of the countries of the region conducted profound power sector reforms and privatized many State-owned power companies. FDI in the power sector neared US$ 5 billion in 1999 and US$ 10 billion in 2000, accounting for 6% and 13%, respectively, of total received FDI in Latin America and the Caribbean.
In the 1990s, European companies were in a better position to seize the opportunities opening in the region, thanks to their size and financial capacity and the competitive pressure sparked by the creation of the European Single Market that drove them to turn their sights abroad. That is why four of the five major transnational power companies operating in the region are European: the two Spanish companies (Iberdrola and Gas Natural Fenosa); Endesa, which was originally Spanish, and is now part of the Italian group Enel; and France’s GDF Suez, which also took advantage of privatizations and still operate in the region (along with the United States company AES). This group of companies still comprises the leading private power companies in Latin America and the Caribbean; their footprint spans many countries and a range of industry segments.
Incoming European and United States companies focused on the acquisition of existing assets. Although this involved heavy FDI inflows it did not necessarily increase
D. Foreign direct investment in the power sector in Latin America and the Caribbean

17Foreign Direct Investment in Latin America and the Caribbean • 2011
total investment in the power sector. In many cases, the reforms did not appropriately address the structure of the power industry, especially where the production chain was segmented into too small markets. The result was a sector split between public and private companies; the vast majority of the latter were transnationals. In many economies (especially the smaller ones in the Caribbean, where the power sector is of necessity small and there is not much scope for segmenting), State-owned companies completely dominate the industry. The situation is similar in Ecuador, Paraguay, and, to a large extent, the Plurinational State of Bolivia and Uruguay.
From 2001 on, the end of privatizations and overlapping energy crises, macroeconomic instability and regulatory uncertainty in a number of countries drove power sector FDI down. Many of the transnational companies mentioned above were hit hard and took heavy losses that forced them to restructure their assets in the region. Although they eased off on investment they did not divest themselves of their assets in Latin America, with the notable exception of France’s EDF.
Since 2006 there has been renewed interest in investing in Latin America, sparked by sustained market growth and stable regulatory environments that have been changed slightly to favour private investment in the power sector. In this setting, major transnational power companies have announced organic growth projects in the markets where they operate in the region, seeking a higher profile in emerging economies and a lower one in the markets of Europe, the United States and Japan where there is virtually no growth.
In recent years, European and United States transnationals established in the region since the 1990s have been joined by new actors, many based in countries of the region. Trans-Latin power companies include Colombia’s ISA and EPM and Brazil’s Eletrobras, all of them State-owned and with a long history in their home countries but that have only recently ventured into international expansion and have kept it within the region. Asian companies have entered the scene as well, among them Japan’s Mitsui, Korea’s Kepco and China’s State Grid and Sinohidro.
This dynamic has boosted private-company investment in the electric power system (see figure 8). In Brazil, private companies did not even account for one third of generation capacity in 2003 and now make up more than half. In 2010 their share of power output was 63% in Central America and 45% in Mexico. The bulk of private investment in the power sector in Latin America and the Caribbean is from transnational companies. But this investment boom does not extend to all of the economies of the region, and in some segments and countries there is an investment shortfall that does not cover the demand fuelled by economic growth.
Figure 8 LATIN AMERICA AND THE CARIBBEAN: INVESTMENTS COMMITTED TO ELECTRIC POWER PROJECTS WITH
PRIVATE PARTICIPATION, 1992-2010(Billions of dollars)
0
2
4
6
8
10
12
14
16
18
1992 1996 2000 2004 2008
Source: Economic Commission for Latin America and the Caribbean (ECLAC), on the basis of official data from the World Bank.
Companies specializing in renewable and non-conventional energies such as wind and solar power have ventured into the sector in recent years. This is the fastest-growing segment, both worldwide and in the region; while its share of power generation is still marginal (in the area of 1%), in Brazil it now accounts for 10% of all greenfield power generation investment. Wind power has soared in the past two years. By late 2011, installed capacity in Brazil had grown to 1500 megawatts, with another 6700 megawatts in the development stage. Mexico has 569 megawatts online and another 2,609 megawatts under construction. Costa Rica, Honduras, Nicaragua and Uruguay are also making great strides in installed wind power capacity. Latin America has drawn on available wind resources in these countries and improved techniques, especially in solar photovoltaic power, to build on earlier development of these energy technologies in Europe. One factor has been FDI from European companies that built up their competencies in their domestic markets. Second, declining investment in Europe freed production capacity and sent the price of components spiralling down. And last, countries in the region managed to avoid the often unsustainable direct subsidies used in Europe to promote renewable and non-conventional energies by using indirect assistance such as tax exemptions or preferential treatment in distribution. As a result, Uruguay, Brazil and Mexico have started construction of numerous wind projects which will offer electricity at prices comparable with other energy sources. In the second half of 2011, solar photovoltaic power projects also started to take off, although to a much lesser extent than wind projects.

18 Economic Commission for Latin America and the Caribbean (ECLAC)
Although they have not used direct subsidies, the governments of the region have supported renewable and non-conventional energies in order to reduce the degree to which many economies depend on foreign sources of energy and to help cut CO2 emissions from fossil-fuel-driven power plants. Latin America already produces more than 50% of its electric power from renewable sources (thanks to hydropower plants) and could increase this percentage by developing other renewable power sources. Some governments provide incentives for renewable and non-conventional energies as a way to support the incipient industry that supplies components and support services for these energy sources. Noteworthy in this regard is Brazil’s local-content policy, which has attracted 12 of the world’s
leading producers of components for the wind industry to set up production facilities in the country.
In addition to building more sustainable power systems, the challenge for the region is to ensure an appropriate level of investment that guarantees quality service at a reasonable cost that is not a drag on the competitiveness of the economies. The International Energy Agency (IEA) estimates that the region needs to invest some US$ 404 billion in generation and US$ 313 billion in transmission and distribution by 2035 (not including Mexico). The region should take advantage of its draw for international investors (which are no longer just European companies), and it should also allow the State-owned power companies that are present in all of the countries except Chile to contribute to the development of their power systems.
E. Final considerations
FDI inflows into Latin America and the Caribbean reached a record high in 2011, following significant surges in the two preceding years. Within this trend, investment flows match, and reinforce, the production structure of the countries of the region: projects in high technology sectors are few and far between and concentrated in just a handful of countries. Repatriated earnings have soared in some countries to levels similar to inflows, a reminder that FDI is not unidirectional
and that the focus must be on the quality of investment in order to promote structural change and knowledge transfer or boost local capacities. With capital flows buoyant and profitability high for transnationals, there is scope for promoting productive development policies, increasing reinvestment of profits and assessing mechanisms for generating higher fiscal revenues in support of development of the region’s economies.
19Foreign Direct Investment in Latin America and the Caribbean • 2011
Chapter I
Regional overview of foreign direct investment
A. Introduction
In 2011, US$ 153.991 billion in foreign direct investment (FDI) flowed into Latin America
and the Caribbean. At 28% more than in 2010, these capital flows grew more rapidly than
those for any other region in the world, and the region’s share of total world FDI rose to
10%. The bulk of the increase in inward FDI for the region went to Brazil, which received
US$ 66.66 billion, but all subregions and almost all the leading economies benefited from
stronger inflows. Outward FDI (direct investments made abroad by companies based in the
region) fell to US$ 22.605 billion and were impacted by the trend in Brazil, where the FDI
outflow turned negative.
Despite global financial market uncertainty, the economies of Latin America and the Caribbean continued to attract a growing volume of FDI and other capital flows in 2011. The deteriorating situation in the advanced countries (particularly in Europe) during the third quarter of the year had but a very limited impact on the region (ECLAC, 2011c): despite a slight slowdown compared with 2010, GDP in the region continued to grow at the rate of 4.3%. Commodities, which make up a significant percentage of exports for many of the region’s economies, saw prices that remained high and did not fluctuate much during the year. This encouraged inward FDI towards the primary sector. Thus, economic growth and high international
prices for natural resources boosted transnational corporate operations in the region and, therefore, inward FDI, which even topped the levels recorded in 2008 before the worst moments of the international financial crisis.
The favourable economic environment boosted returns on FDI, enabling transnationals to finance a large proportion of their investments with subsidiaries’ earnings and led to a surge in the transfer of earnings to parent companies. It is therefore quite likely that for the region as a whole FDI will not be a net capital contributor.
This should be borne in mind when looking at FDI as a potential source for knowledge and technology transfer and a way to build local capabilities (by fostering

20 Economic Commission for Latin America and the Caribbean (ECLAC)
national innovation systems, creating production linkages, developing human capital and developing local businesses, among other factors), especially in strategic sectors. Investments in technology-intensive industries and in research and development still account for a modest percentage of inward FDI in Latin America, and they are highly concentrated in the region’s two largest economies: Brazil and Mexico.
It is useful to look at the upward trend in inward FDI (measured in current dollars) to the region over the past two decades in the light of what these flows mean for the region’s economy as a whole (see figure I.1). After the flood of inflows between 1996 and 2001, when FDI surpassed 4% of GDP, the percentage has stabilized in the area of 2.5% over the past few years.
Figure I.1 LATIN AMERICA AND THE CARIBBEAN: FOREIGN DIRECT
INVESTMENT FLOWS, 1990-2011 a
(Millions of dollars and percentages of GDP)
0.0
0.5
1.0
1.5
2.0
2.5
3.0
3.5
4.0
4.5
5.0
0
20 000
40 000
60 000
80 000
100 000
120 000
140 000
160 000
180 000
1990 1992 1994 1996 1998 2000 2002 2004 2006 2008 2010
FDI flows FDI flows-to-GDP ratio
Source: Economic Commission for Latin America and the Caribbean (ECLAC), on the basis of official figures and estimates as at 16 April 2012.
a FDI figures indicate inflows of foreign direct investment, minus disinvestments (repatriation of capital) by foreign investors. The FDI figures do not include the flows received by the main financial centres of the Caribbean. These figures differ from those contained in the editions of the Economic Survey of Latin America and the Caribbean and the Preliminary Overview of the Economies of Latin America and the Caribbean published in 2011, as the latter show the net balance of foreign investment, that is, direct investment in the reporting economy (FDI) minus outward FDI.
On a global scale, the emerging economies have been gaining importance in the production of goods, the provision of services, international trade and the exchange of capital flows. Latin America is not on the sidelines of this trend. Other emerging economies are increasing in importance as a source of inward FDI for the region, and trans-Latin companies are expanding internationally at a steady pace despite the drop in aggregate outward FDI last year. The governments of the larger economies of the region, where some of the leading trans-Latin companies are based, have begun to weigh targeted policies for supporting the international expansion of these companies.
The uncertainty that has prevailed for nearly five years now has not eased, but the countries of Latin America and the Caribbean have continued to show responsible macroeconomic management and resistance to external turbulence. If sovereign debt problems and drastic fiscal adjustments do not lead to any further worsening of conditions in Europe, and if the robust pattern of growth in China does not diminish, the countries of the region should see no significant deterioration in their current position. It is thus highly likely that FDI flows will remain high in 2012.
The present chapter is divided into five sections. Following this introduction, section B gives an overview of FDI worldwide. Section C comprises three parts. The first describes FDI patterns in Latin America and the Caribbean on the basis of official balance-of-payments statistics. The second reviews the strategies pursued by transnational companies by looking at FDI destinations, sources and mechanisms. The third part outlines new FDI projects according to technology and R&D content. Section D describes the key characteristics of the region’s countries as foreign investors and the expansion of trans-Latin companies. It also takes up the incipient policies for supporting outward FDI that are being deployed in the region. The final section sets forth the main conclusions.
B. Overview of foreign direct investment worldwide
In 2011 worldwide FDI climbed 17% over the previous year, going from US$ 1.29 trillion to US$ 1.51 trillion and marking the second consecutive year of increases in these capital flows after the declines in 2008 and 2009 triggered by the international financial crisis.
But despite this recovery, worldwide FDI is still far from the record high of US$ 1.96 trillion seen in 2007.
FDI growth worldwide has been uneven, with patterns varying from one destination region to another. In 2011, FDI flows into the developed economies were
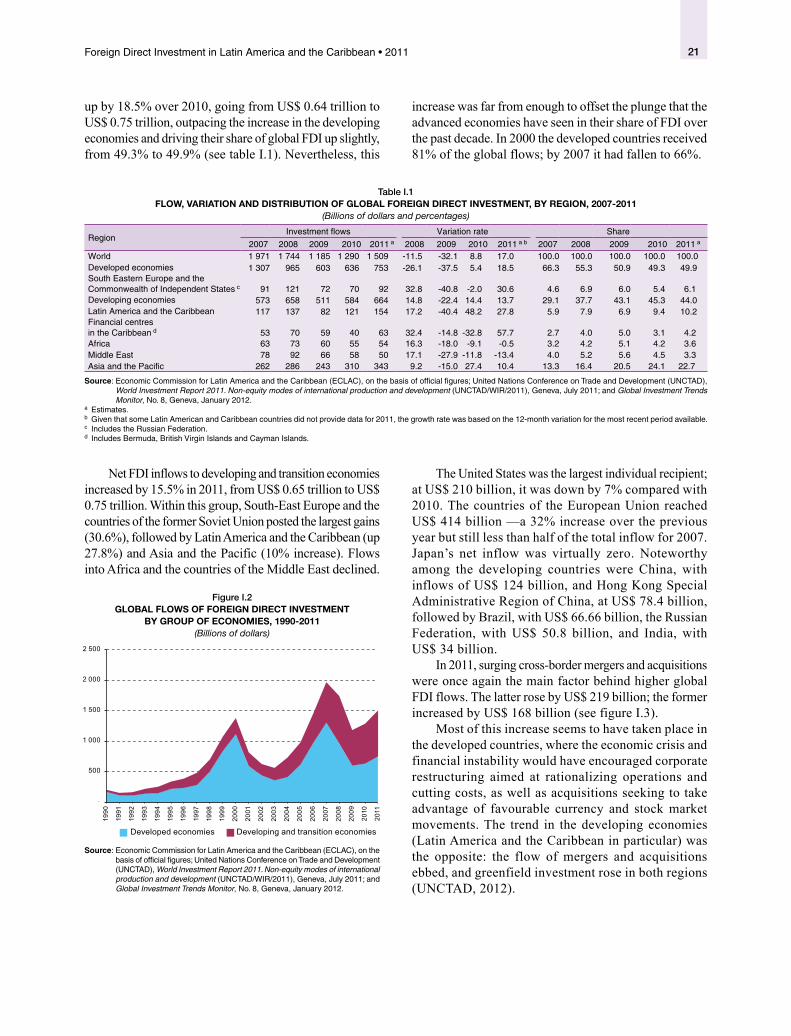
21Foreign Direct Investment in Latin America and the Caribbean • 2011
up by 18.5% over 2010, going from US$ 0.64 trillion to US$ 0.75 trillion, outpacing the increase in the developing economies and driving their share of global FDI up slightly, from 49.3% to 49.9% (see table I.1). Nevertheless, this
increase was far from enough to offset the plunge that the advanced economies have seen in their share of FDI over the past decade. In 2000 the developed countries received 81% of the global flows; by 2007 it had fallen to 66%.
Net FDI inflows to developing and transition economies increased by 15.5% in 2011, from US$ 0.65 trillion to US$ 0.75 trillion. Within this group, South-East Europe and the countries of the former Soviet Union posted the largest gains (30.6%), followed by Latin America and the Caribbean (up 27.8%) and Asia and the Pacific (10% increase). Flows into Africa and the countries of the Middle East declined.
Figure I.2 GLOBAL FLOWS OF FOREIGN DIRECT INVESTMENT
BY GROUP OF ECONOMIES, 1990-2011(Billions of dollars)
-
500
1 000
1 500
2 000
2 500
1990
1991
1992
1993
1994
1995
1996
1997
1998
1999
2000
2001
2002
2003
2004
2005
2006
2007
2008
2009
2010
2011
Developed economies Developing and transition economies
Source: Economic Commission for Latin America and the Caribbean (ECLAC), on the basis of official figures; United Nations Conference on Trade and Development (UNCTAD), World Investment Report 2011. Non-equity modes of international production and development (UNCTAD/WIR/2011), Geneva, July 2011; and Global Investment Trends Monitor, No. 8, Geneva, January 2012.
The United States was the largest individual recipient; at US$ 210 billion, it was down by 7% compared with 2010. The countries of the European Union reached US$ 414 billion —a 32% increase over the previous year but still less than half of the total inflow for 2007. Japan’s net inflow was virtually zero. Noteworthy among the developing countries were China, with inflows of US$ 124 billion, and Hong Kong Special Administrative Region of China, at US$ 78.4 billion, followed by Brazil, with US$ 66.66 billion, the Russian Federation, with US$ 50.8 billion, and India, with US$ 34 billion.
In 2011, surging cross-border mergers and acquisitions were once again the main factor behind higher global FDI flows. The latter rose by US$ 219 billion; the former increased by US$ 168 billion (see figure I.3).
Most of this increase seems to have taken place in the developed countries, where the economic crisis and financial instability would have encouraged corporate restructuring aimed at rationalizing operations and cutting costs, as well as acquisitions seeking to take advantage of favourable currency and stock market movements. The trend in the developing economies (Latin America and the Caribbean in particular) was the opposite: the flow of mergers and acquisitions ebbed, and greenfield investment rose in both regions (UNCTAD, 2012).
Table I.1 FLOW, VARIATION AND DISTRIBUTION OF GLOBAL FOREIGN DIRECT INVESTMENT, BY REGION, 2007-2011
(Billions of dollars and percentages)
RegionInvestment flows Variation rate Share
2007 2008 2009 2010 2011 a 2008 2009 2010 2011 a b 2007 2008 2009 2010 2011 a
World 1 971 1 744 1 185 1 290 1 509 -11.5 -32.1 8.8 17.0 100.0 100.0 100.0 100.0 100.0Developed economies 1 307 965 603 636 753 -26.1 -37.5 5.4 18.5 66.3 55.3 50.9 49.3 49.9South Eastern Europe and the Commonwealth of Independent States c 91 121 72 70 92 32.8 -40.8 -2.0 30.6 4.6 6.9 6.0 5.4 6.1Developing economies 573 658 511 584 664 14.8 -22.4 14.4 13.7 29.1 37.7 43.1 45.3 44.0Latin America and the Caribbean 117 137 82 121 154 17.2 -40.4 48.2 27.8 5.9 7.9 6.9 9.4 10.2Financial centres in the Caribbean d 53 70 59 40 63 32.4 -14.8 -32.8 57.7 2.7 4.0 5.0 3.1 4.2Africa 63 73 60 55 54 16.3 -18.0 -9.1 -0.5 3.2 4.2 5.1 4.2 3.6Middle East 78 92 66 58 50 17.1 -27.9 -11.8 -13.4 4.0 5.2 5.6 4.5 3.3Asia and the Pacific 262 286 243 310 343 9.2 -15.0 27.4 10.4 13.3 16.4 20.5 24.1 22.7
Source: Economic Commission for Latin America and the Caribbean (ECLAC), on the basis of official figures; United Nations Conference on Trade and Development (UNCTAD), World Investment Report 2011. Non-equity modes of international production and development (UNCTAD/WIR/2011), Geneva, July 2011; and Global Investment Trends Monitor, No. 8, Geneva, January 2012.
a Estimates.b Given that some Latin American and Caribbean countries did not provide data for 2011, the growth rate was based on the 12-month variation for the most recent period available.c Includes the Russian Federation.d Includes Bermuda, British Virgin Islands and Cayman Islands.
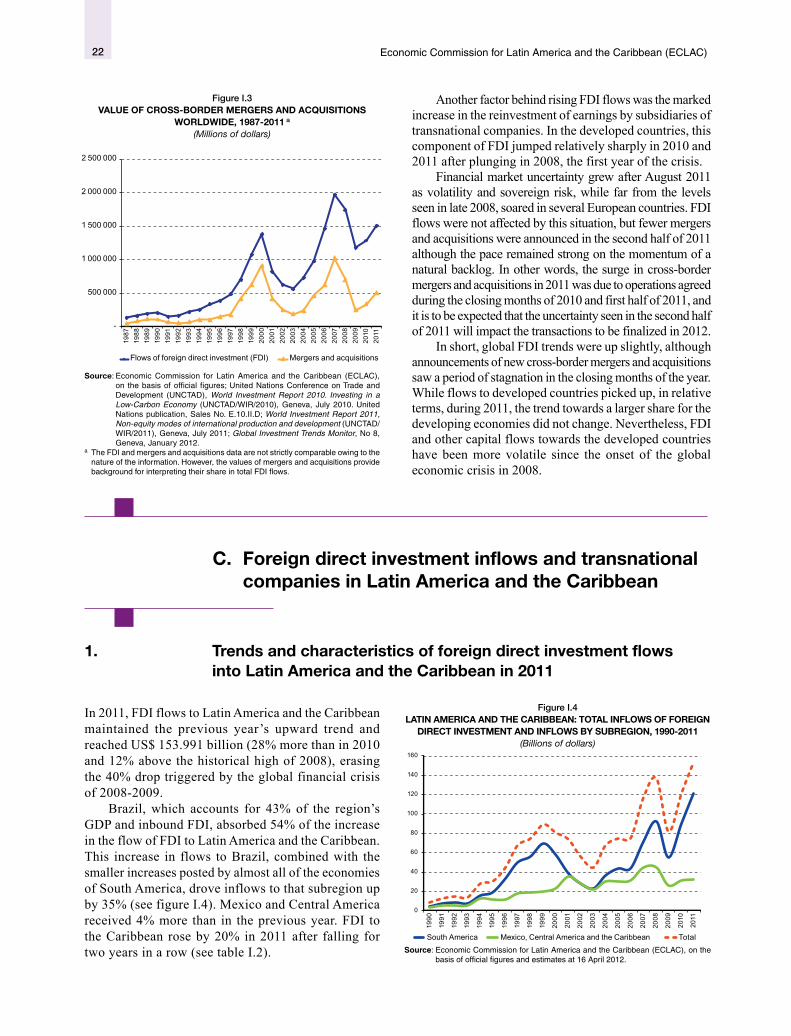
22 Economic Commission for Latin America and the Caribbean (ECLAC)
Figure I.3 VALUE OF CROSS-BORDER MERGERS AND ACQUISITIONS
WORLDWIDE, 1987-2011 a
(Millions of dollars)
-
500 000
1 000 000
1 500 000
2 000 000
2 500 000
1987
1988
1989
1990
1991
1992
1993
1994
1995
1996
1997
1998
1999
2000
2001
2002
2003
2004
2005
2006
2007
2008
2009
2010
2011
Flows of foreign direct investment (FDI) Mergers and acquisitions
Source: Economic Commission for Latin America and the Caribbean (ECLAC), on the basis of official figures; United Nations Conference on Trade and Development (UNCTAD), World Investment Report 2010. Investing in a Low-Carbon Economy (UNCTAD/WIR/2010), Geneva, July 2010. United Nations publication, Sales No. E.10.II.D; World Investment Report 2011, Non-equity modes of international production and development (UNCTAD/WIR/2011), Geneva, July 2011; Global Investment Trends Monitor, No 8, Geneva, January 2012.
a The FDI and mergers and acquisitions data are not strictly comparable owing to the nature of the information. However, the values of mergers and acquisitions provide background for interpreting their share in total FDI flows.
Another factor behind rising FDI flows was the marked increase in the reinvestment of earnings by subsidiaries of transnational companies. In the developed countries, this component of FDI jumped relatively sharply in 2010 and 2011 after plunging in 2008, the first year of the crisis.
Financial market uncertainty grew after August 2011 as volatility and sovereign risk, while far from the levels seen in late 2008, soared in several European countries. FDI flows were not affected by this situation, but fewer mergers and acquisitions were announced in the second half of 2011 although the pace remained strong on the momentum of a natural backlog. In other words, the surge in cross-border mergers and acquisitions in 2011 was due to operations agreed during the closing months of 2010 and first half of 2011, and it is to be expected that the uncertainty seen in the second half of 2011 will impact the transactions to be finalized in 2012.
In short, global FDI trends were up slightly, although announcements of new cross-border mergers and acquisitions saw a period of stagnation in the closing months of the year. While flows to developed countries picked up, in relative terms, during 2011, the trend towards a larger share for the developing economies did not change. Nevertheless, FDI and other capital flows towards the developed countries have been more volatile since the onset of the global economic crisis in 2008.
C. Foreign direct investment inflows and transnational companies in Latin America and the Caribbean
1. Trends and characteristics of foreign direct investment flows into Latin America and the Caribbean in 2011
In 2011, FDI flows to Latin America and the Caribbean maintained the previous year’s upward trend and reached US$ 153.991 billion (28% more than in 2010 and 12% above the historical high of 2008), erasing the 40% drop triggered by the global financial crisis of 2008-2009.
Brazil, which accounts for 43% of the region’s GDP and inbound FDI, absorbed 54% of the increase in the flow of FDI to Latin America and the Caribbean. This increase in flows to Brazil, combined with the smaller increases posted by almost all of the economies of South America, drove inflows to that subregion up by 35% (see figure I.4). Mexico and Central America received 4% more than in the previous year. FDI to the Caribbean rose by 20% in 2011 after falling for two years in a row (see table I.2).
Figure I.4 LATIN AMERICA AND THE CARIBBEAN: TOTAL INFLOWS OF FOREIGN
DIRECT INVESTMENT AND INFLOWS BY SUBREGION, 1990-2011(Billions of dollars)
0
20
40
60
80
100
120
140
160
1990
1991
1992
1993
1994
1995
1996
1997
1998
1999
2000
2001
2002
2003
2004
2005
2006
2007
2008
2009
2010
2011
South America Mexico, Central America and the Caribbean TotalSource: Economic Commission for Latin America and the Caribbean (ECLAC), on the
basis of official figures and estimates at 16 April 2012.
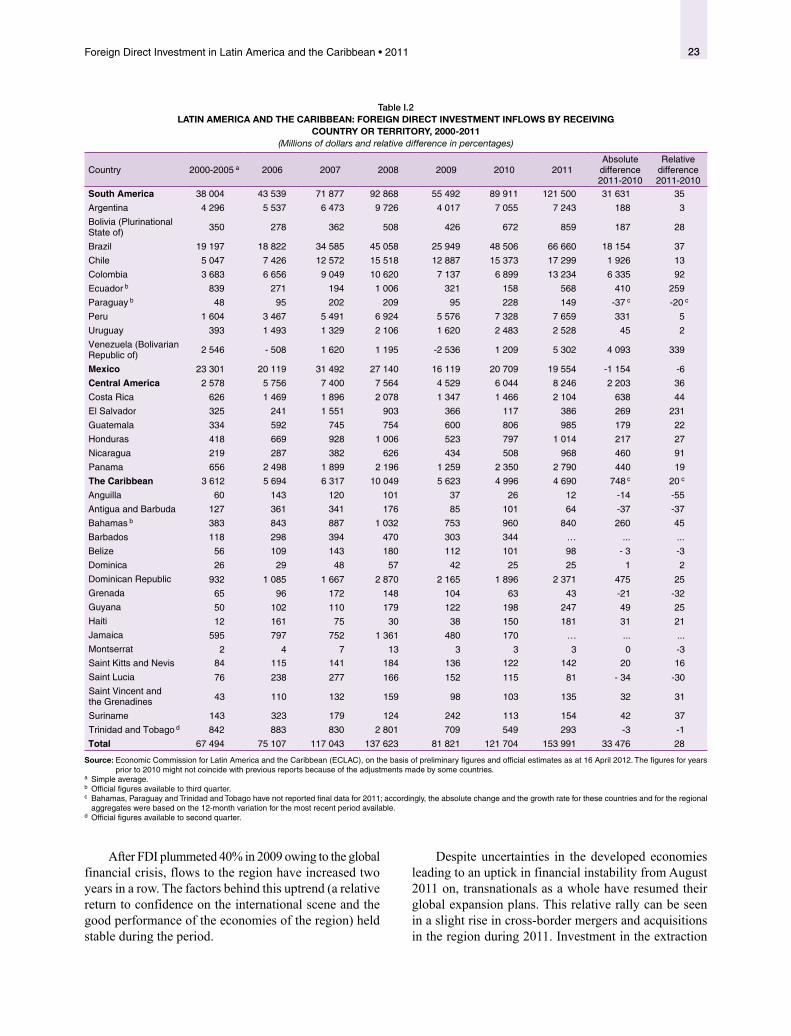
23Foreign Direct Investment in Latin America and the Caribbean • 2011
Table I.2 LATIN AMERICA AND THE CARIBBEAN: FOREIGN DIRECT INVESTMENT INFLOWS BY RECEIVING
COUNTRY OR TERRITORY, 2000-2011(Millions of dollars and relative difference in percentages)
Country 2000-2005 a 2006 2007 2008 2009 2010 2011Absolute difference 2011-2010
Relative difference 2011-2010
South America 38 004 43 539 71 877 92 868 55 492 89 911 121 500 31 631 35
Argentina 4 296 5 537 6 473 9 726 4 017 7 055 7 243 188 3
Bolivia (Plurinational State of) 350 278 362 508 426 672 859 187 28
Brazil 19 197 18 822 34 585 45 058 25 949 48 506 66 660 18 154 37
Chile 5 047 7 426 12 572 15 518 12 887 15 373 17 299 1 926 13
Colombia 3 683 6 656 9 049 10 620 7 137 6 899 13 234 6 335 92
Ecuador b 839 271 194 1 006 321 158 568 410 259
Paraguay b 48 95 202 209 95 228 149 -37 c -20 c
Peru 1 604 3 467 5 491 6 924 5 576 7 328 7 659 331 5
Uruguay 393 1 493 1 329 2 106 1 620 2 483 2 528 45 2
Venezuela (Bolivarian Republic of) 2 546 - 508 1 620 1 195 -2 536 1 209 5 302 4 093 339
Mexico 23 301 20 119 31 492 27 140 16 119 20 709 19 554 -1 154 -6
Central America 2 578 5 756 7 400 7 564 4 529 6 044 8 246 2 203 36
Costa Rica 626 1 469 1 896 2 078 1 347 1 466 2 104 638 44
El Salvador 325 241 1 551 903 366 117 386 269 231
Guatemala 334 592 745 754 600 806 985 179 22
Honduras 418 669 928 1 006 523 797 1 014 217 27
Nicaragua 219 287 382 626 434 508 968 460 91
Panama 656 2 498 1 899 2 196 1 259 2 350 2 790 440 19
The Caribbean 3 612 5 694 6 317 10 049 5 623 4 996 4 690 748 c 20 c
Anguilla 60 143 120 101 37 26 12 -14 -55
Antigua and Barbuda 127 361 341 176 85 101 64 -37 -37
Bahamas b 383 843 887 1 032 753 960 840 260 45
Barbados 118 298 394 470 303 344 … ... ...
Belize 56 109 143 180 112 101 98 - 3 -3
Dominica 26 29 48 57 42 25 25 1 2
Dominican Republic 932 1 085 1 667 2 870 2 165 1 896 2 371 475 25
Grenada 65 96 172 148 104 63 43 -21 -32
Guyana 50 102 110 179 122 198 247 49 25
Haiti 12 161 75 30 38 150 181 31 21
Jamaica 595 797 752 1 361 480 170 … ... ...
Montserrat 2 4 7 13 3 3 3 0 -3
Saint Kitts and Nevis 84 115 141 184 136 122 142 20 16
Saint Lucia 76 238 277 166 152 115 81 - 34 -30
Saint Vincent and the Grenadines 43 110 132 159 98 103 135 32 31
Suriname 143 323 179 124 242 113 154 42 37
Trinidad and Tobago d 842 883 830 2 801 709 549 293 -3 -1
Total 67 494 75 107 117 043 137 623 81 821 121 704 153 991 33 476 28
Source: Economic Commission for Latin America and the Caribbean (ECLAC), on the basis of preliminary figures and official estimates as at 16 April 2012. The figures for years prior to 2010 might not coincide with previous reports because of the adjustments made by some countries.
a Simple average. b Official figures available to third quarter.c Bahamas, Paraguay and Trinidad and Tobago have not reported final data for 2011; accordingly, the absolute change and the growth rate for these countries and for the regional
aggregates were based on the 12-month variation for the most recent period available.d Official figures available to second quarter.
After FDI plummeted 40% in 2009 owing to the global financial crisis, flows to the region have increased two years in a row. The factors behind this uptrend (a relative return to confidence on the international scene and the good performance of the economies of the region) held stable during the period.
Despite uncertainties in the developed economies leading to an uptick in financial instability from August 2011 on, transnationals as a whole have resumed their global expansion plans. This relative rally can be seen in a slight rise in cross-border mergers and acquisitions in the region during 2011. Investment in the extraction
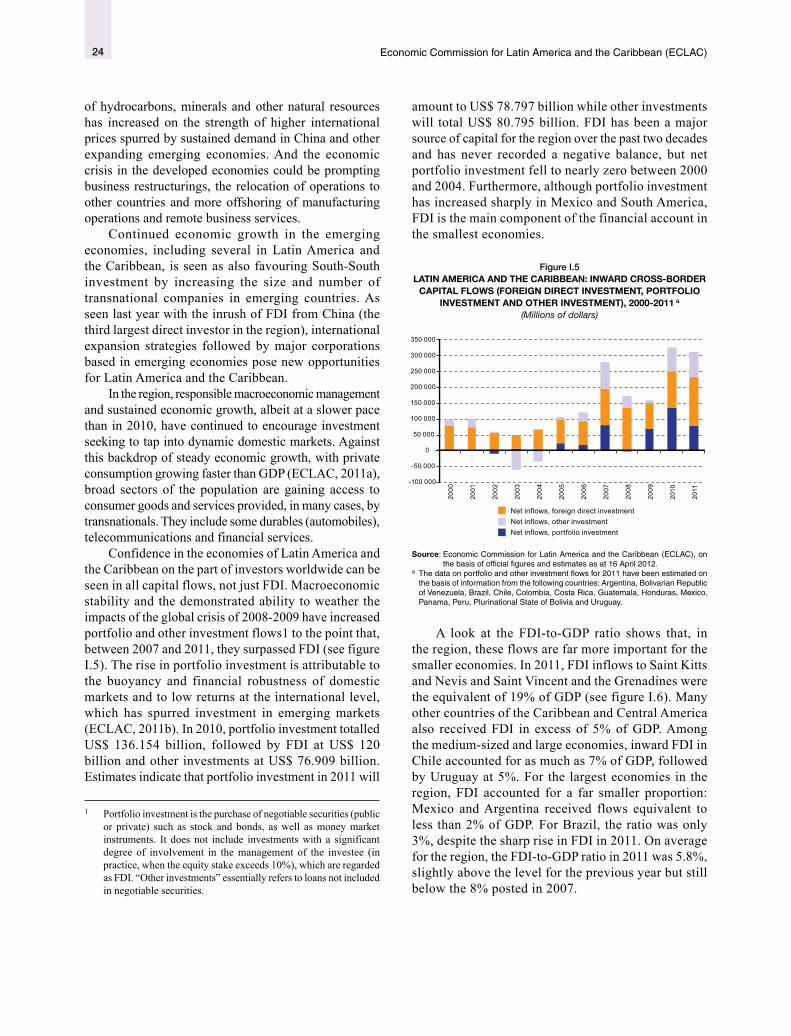
24 Economic Commission for Latin America and the Caribbean (ECLAC)
of hydrocarbons, minerals and other natural resources has increased on the strength of higher international prices spurred by sustained demand in China and other expanding emerging economies. And the economic crisis in the developed economies could be prompting business restructurings, the relocation of operations to other countries and more offshoring of manufacturing operations and remote business services.
Continued economic growth in the emerging economies, including several in Latin America and the Caribbean, is seen as also favouring South-South investment by increasing the size and number of transnational companies in emerging countries. As seen last year with the inrush of FDI from China (the third largest direct investor in the region), international expansion strategies followed by major corporations based in emerging economies pose new opportunities for Latin America and the Caribbean.
In the region, responsible macroeconomic management and sustained economic growth, albeit at a slower pace than in 2010, have continued to encourage investment seeking to tap into dynamic domestic markets. Against this backdrop of steady economic growth, with private consumption growing faster than GDP (ECLAC, 2011a), broad sectors of the population are gaining access to consumer goods and services provided, in many cases, by transnationals. They include some durables (automobiles), telecommunications and financial services.
Confidence in the economies of Latin America and the Caribbean on the part of investors worldwide can be seen in all capital flows, not just FDI. Macroeconomic stability and the demonstrated ability to weather the impacts of the global crisis of 2008-2009 have increased portfolio and other investment flows1 to the point that, between 2007 and 2011, they surpassed FDI (see figure I.5). The rise in portfolio investment is attributable to the buoyancy and financial robustness of domestic markets and to low returns at the international level, which has spurred investment in emerging markets (ECLAC, 2011b). In 2010, portfolio investment totalled US$ 136.154 billion, followed by FDI at US$ 120 billion and other investments at US$ 76.909 billion. Estimates indicate that portfolio investment in 2011 will
1 Portfolio investment is the purchase of negotiable securities (public or private) such as stock and bonds, as well as money market instruments. It does not include investments with a significant degree of involvement in the management of the investee (in practice, when the equity stake exceeds 10%), which are regarded as FDI. “Other investments” essentially refers to loans not included in negotiable securities.
amount to US$ 78.797 billion while other investments will total US$ 80.795 billion. FDI has been a major source of capital for the region over the past two decades and has never recorded a negative balance, but net portfolio investment fell to nearly zero between 2000 and 2004. Furthermore, although portfolio investment has increased sharply in Mexico and South America, FDI is the main component of the financial account in the smallest economies.
Figure I.5 LATIN AMERICA AND THE CARIBBEAN: INWARD CROSS-BORDER
CAPITAL FLOWS (FOREIGN DIRECT INVESTMENT, PORTFOLIO INVESTMENT AND OTHER INVESTMENT), 2000-2011 a
(Millions of dollars)
-100 000
-50 000
0
50 000
100 000
150 000
200 000
250 000
300 000
350 000
2000
2001
2002
2003
2004
2005
2006
2007
2008
2009
2010
2011
Net inflows, other investmentNet inflows, foreign direct investment
Net inflows, portfolio investment
Source: Economic Commission for Latin America and the Caribbean (ECLAC), on the basis of official figures and estimates as at 16 April 2012.
a The data on portfolio and other investment flows for 2011 have been estimated on the basis of information from the following countries: Argentina, Bolivarian Republic of Venezuela, Brazil, Chile, Colombia, Costa Rica, Guatemala, Honduras, Mexico, Panama, Peru, Plurinational State of Bolivia and Uruguay.
A look at the FDI-to-GDP ratio shows that, in the region, these flows are far more important for the smaller economies. In 2011, FDI inflows to Saint Kitts and Nevis and Saint Vincent and the Grenadines were the equivalent of 19% of GDP (see figure I.6). Many other countries of the Caribbean and Central America also received FDI in excess of 5% of GDP. Among the medium-sized and large economies, inward FDI in Chile accounted for as much as 7% of GDP, followed by Uruguay at 5%. For the largest economies in the region, FDI accounted for a far smaller proportion: Mexico and Argentina received flows equivalent to less than 2% of GDP. For Brazil, the ratio was only 3%, despite the sharp rise in FDI in 2011. On average for the region, the FDI-to-GDP ratio in 2011 was 5.8%, slightly above the level for the previous year but still below the 8% posted in 2007.

25Foreign Direct Investment in Latin America and the Caribbean • 2011
Figure I.6 LATIN AMERICA AND THE CARIBBEAN: INFLOWS OF FOREIGN
DIRECT INVESTMENT AS A PROPORTION OF GDP, 2011 a
(Percentages)
Sai
nt K
itts
and
Nev
isS
aint
Vin
cent
and
the
Gre
nadi
nes
Nic
arag
uaB
aham
as
Pan
ama
Chi
leB
eliz
eS
aint
Luc
iaS
urin
ame
Hon
dura
sA
ntig
ua a
nd B
arbu
daU
rugu
ayD
omin
ica
Gre
nada
Cos
ta R
ica
Per
u D
omin
ican
Rep
.C
olom
bia
Bol
ivia
(Plu
r. S
tate
of)
Bra
zil
Hai
tiG
uate
mal
aA
rgen
tina
Mex
ico
El S
alva
dor
Vene
zuel
a (B
ol. R
ep. o
f)Tr
inid
ad a
nd T
obag
o
Par
agua
yE
cuad
or
Guy
ana
0
5
10
15
20
25
Source: Economic Commission for Latin America and the Caribbean (ECLAC), on the basis of official figures and estimates as at 16 April 2012.
a The FDI-to-GDP indicator normalizes FDI figures according to the size of the economy.
(a) Brazil
FDI inflows to Brazil jumped by 37.4% in 2011 compared with 2010, to US$ 66.66 billion. Capital contributions made up 82.2% of total FDI; intra-company loans accounted for 17.8%.2
In 2011, the already-high share coming from European transnationals (in particular, from the Netherlands,3 Spain and France) rose again, to 64.4% of total FDI flows. Asian transnationals, led by companies from Japan, consolidated their position as the second largest investors in the Brazilian economy, accounting for 13.6% of these capital inflows. In the Americas, companies from the United States and Canada accounted for 10.4% of the investments; trans-Latins made up 5.1%. The remaining 6.6% was from companies based in Africa and Oceania, as well as in Israel, the Russian Federation and other countries.
By sector, the manufacturing industry consolidated its position as the main recipient of FDI in Brazil, at 46% of the total. The metallurgical sector stood out (US$ 7.802 billion), thanks to construction of a new integrated plant by Germany’s ThyssenKrupp at an estimated cost of US$ 6.75 billion (ECLAC, 2010), followed by the food
2 Brazil’s official statistics on FDI do not include reinvested earnings, so 100% of FDI in Brazil refers to capital contributions and intra-company loans. FDI in Brazil is therefore understated.
3 According to data from the Central Bank of Brazil, only 8% of inward FDI registered as being from the Netherlands is from companies based there. The rest refers to investments by companies in third countries transferred through subsidiaries in the Netherlands that were set up specifically for this purpose (see box II.2).
and beverage industries (more than US$ 5 billion each). Other sectors receiving more than US$ 1 billion in FDI were the fuel, automobile, cement, chemical, electronics and plastics industries. While the ThyssenKrupp plant is designed for exporting steel to Europe, the transnationals that invested in the other sectors were mainly seeking access to the growing domestic market in response to government policies that protect local content in many industries. Inputs for the growing oil industry are subject to substantial local-content requirements;4 other examples are the electronics,5 automobile6 and power sectors (see chapter IV). FDI flows to the service sector accounted for 44% of the total, owing above all to investments in commerce and telecommunications. Investment in the primary sector, at 9%, was down from previous years.
(b) Other South American economies
In 2011, FDI flows to the other economies of South America rose 33%, to US$ 54.658 billion. Paraguay was the only one to see a drop compared with the previous year. Some economies that had already posted record highs in 2010, such as Chile, Colombia, Peru and Uruguay, received still higher flows in 2011.
FDI flows to Chile rose by 13% in 2011 to a new record high of US$ 17.299 billion, confirming the country’s draw for transnational companies. It is one of the South American economies with the largest presence of foreign capital. By sector, direct investments have focused on services (33% of total FDI) and the primary sector (61% of the total).7 In the former, financial services and the power sector account for the largest share, as does copper mining in the latter. The manufacturing industry received just 5% of FDI. Several transnational companies, like Australia’s BHP Billiton and Freeport-McMoRan from the United States, embarked on greenfield and expansion projects in the metal mining industry. In the mining sector, Japan’s Mitsubishi Group acquired a 25% stake in Anglo
4 The consulting firm Wood Mackenzie estimates that 100 new oil platforms will be needed in Brazil over the next 10 years. In 2001 only four Brazilian shipyards had the capacity to build them. See Financial Times [online] http://www.ft.com/intl/cms/s/0/fbaba8a2-a341-11e0-8d6d-00144feabdc0.html#axzz1R9E3477S. See also Business News Americas [online] http://www.bnamericas.com/news/energiaelectrica/BNDES_respalda_contenido_local_ en_plataformas_de_Petrobras).
5 See [online] http://www.mzweb.com.br/positivo/web/conteudo_en.asp?idioma=1&conta=44&tipo=21962.
6 See MercoPress [online] http://en.mercopress.com/2011/09/16/brazil-increases-tax-on-cars-with-high-content-of-imported-components and http://www.globaltradealert.org/measure/brazil-temporary-increase-internal-taxes-applicable-imported-vehicles.
7 Information relating to foreign direct investment subject to decree-law 600.

26 Economic Commission for Latin America and the Caribbean (ECLAC)
American Sur at a cost of more than US$ 5 billion;8 the Sumitomo group acquired a 45% interest in Minera Quadra Chile for nearly US$ 700 million. These cases illustrate the role that a number of Japanese consortia are playing in financing mining operations in Chile, thus securing access to mining resources as an input for other
8 This transaction is not formally regarded as FDI because it is a transfer of assets between foreign companies. This transaction is caught up in a major legal battle between Anglo American with the world’s largest copper producer: Chile’s State-owned National Copper Corporation (CODELCO). The dispute has to do with CODELCO’s call option over 49% of Anglo American Sur, one of Anglo American’s subsidiaries in Chile. The dispute has had wide media coverage; the outcome of the legal battle and its potential repercussions are yet to be seen.
operations. In the service sector, Chilquinta Energía was purchased by Sempra Energy from the United States; Autopista Central was acquired by Canada’s Alberta Investment Management Corporation (AIMCo). These transactions were valued at more than US$ 700 million each (see table I.3).
Table I.3 LATIN AMERICA AND THE CARIBBEAN: 20 LARGEST CROSS-BORDER MERGERS
OR ACQUISITIONS BY COMPANIES FROM OUTSIDE THE REGION, 2011(Millions of dollars)
Company or asset acquiredHost country of company acquired
Country where transaction took place
Sector BuyerHome country of buyer
Value
Anglo American Sur (25%) United Kingdom Chile Mining Mitsubishi Japan 5 390
Vale’s assets in aluminium companies
Brazil Brazil Mining Norsk Norway 4 948
Shincariol Brazil Brazil Beverages Kirin Holdings Japan 3 877
Telemar (25%) Brazil Brazil Telecommunications Portugal Telecom SGPS Portugal 3 786
Peregrino Project (40%) Norway Brazil Oil and gas Sinochem China 3 070
Elektro United Kingdom Brazil Energy Iberdrola Spain 2 897
Occidental Argentina United States Argentina Oil and gas Sinopec China 2 450
SK do Brasil South Korea Brazil Oil and gas Maersk Denmark 2 400
CBMM (15%) Brazil Brazil Mining China Niobium Investment Holding
China 1 950
Petroperijá (40%), Petromangas (17%) and Boquerón (27%)
Venezuela (Bolivarian Republic of)
Venezuela (Bolivarian Republic of)
Oil and gas TNK-BP Russian Federation
1 800
Vopak Bahamas Netherlands Bahamas Infrastructure Buckeye Partners United States 1 642
Drummond Colombia (20%) United States Colombia Mining Itochu Japan 1 524
Companhia Brasileira de Distribuição (43%)
Brazil Brazil Commerce Groupe Casino France 1 174
Cerradinho Brazil Brazil Energy Noble Group Hong Kong Special Administrative Region of China
940
Chilquinta Energía (Ashmore Energy International - AEI)
United Kingdom Chile Energy Sempra Energy United States 875
Assets of GDF Suez France Trinidad and Tobago
Oil and gas China Investment Corporation (CIC)
China 850
Santander Seguros Spain Brazil Financial ZS Insurance America Switzerland 840
Autopista Central (50%) Sweden Chile Infrastructure Alberta Investment Canada 736
Puras do Brasil Brazil Brazil Hotels and restaurants
Sodexo France 735
Minera Quadra Chile Ltda. (45%)
Canada Chile Mining Sumitomo Japan 724
Source: Economic Commission for Latin America and the Caribbean (ECLAC), on the basis of information from Thomson Reuters.
8 This transaction is not formally regarded as FDI because it is a transfer of assets between foreign companies. This transaction is caught up in a major legal battle between Anglo American with the world’s largest copper producer: Chile’s State-owned National Copper Corporation
(CODELCO). The dispute has to do with CODELCO’s call option over 49% of Anglo American Sur, one of Anglo American’s subsidiaries in Chile. The dispute has had wide media coverage; the outcome of the legal battle and its potential repercussions are yet to be seen.

27Foreign Direct Investment in Latin America and the Caribbean • 2011
Inward FDI to Colombia increased by 92% to a record US$ 13.234 billion. As in recent years, the natural resources sector attracted most of the investments. Investment in the mining sector fell between 2010 and 2011, to 20% of total FDI, but inflows to the oil sector were up sharply, to 40% of the total. The largest acquisition in this sector, with Japan’s Itochu purchasing assets held by Drummond for US$ 1.524 billion, did not involve inbound FDI but rather a change of ownership between transnationals. BHP Billiton and Xstrata announced a US$ 1.3 billion investment to expand their coal mines. Other than natural resources, the sectors receiving the most FDI were commerce, transport and telecommunications, with DHL announcing a US$ 1.3 billion investment for a regional logistics centre in Bogota. Other major transactions included the acquisition of Protabaco by British American Tobacco for US$ 452 million and the acquisition of the remote business service provider Computec by Ireland’s Experian, for US$ 408 million. Spain, the United States, the United Kingdom and Chile are among the largest investors in Colombia, behind the Netherlands and Panama, which chiefly act as conduits for the flows.
FDI flows to Peru were 5% higher in 2011 than 2010 and totalled US$ 7.659 billion. In addition to confirming the upward trend over the past decade, this new high was well above the US$ 3.492 billion average for the period 2000-2010. Reinvested earnings made up 65% of total FDI; net loans with parent companies accounted for 31%; capital contributions made up 4%. While there are no official data disaggregated by sector, other sources indicate that mining is still the main destination for FDI. The Government of Peru estimates that there is a pipeline of investment projects worth some US$ 9.115 billion for the expansion of existing operations and US$ 18.016 billion (99% of which is from foreign investors) in new initiatives with environmental impact studies already approved (Ministry of Energy and Mines, 2011). Most of the large cross-border acquisitions were in this sector; examples include South Africa’s Gold Fields increasing its stake in La Cima for US$ 379 million and the acquisition of Minera Corona SA by Canada’s Dia Bras Exploration Inc. for US$ 286 million.
FDI inflows into Argentina increased slightly in 2011, to stand at US$ 7.243 billion, of which new capital contributions accounted for 55%; reinvested earnings for 31%; and intra-company loans for the remaining 14%. The largest corporate acquisition was the purchase of the Argentine subsidiary of the United States company Occidental Petroleum by China’s Sinopec, for some US$ 2.450 billion. This acquisition, and the entry of the state-owned China National Offshore Oil Corporation
(CNOOC) the previous year, has made Chinese companies key actors in Argentina’s hydrocarbons sector.9 The most noteworthy development in this sector was the exit of the Spanish firm Repsol, following expropriation of most of its assets in April 2012. Other major transactions had occurred in 2011. They included the purchase of Interbaires (an operator of duty-free shops) by Switzerland’s Dufry for US$ 285 million and the acquisition of Allus Global BPO Center (a provider of remote business services) by Brazil’s Contax for US$ 206 million.
In 2011, the Bolivarian Republic of Venezuela attracted US$ 5.302 billion in FDI flows, more than three times the figure for the previous year. Over the past 10 years, inward FDI to the Bolivarian Republic of Venezuela had been low for the size of its economy. In 2009 and 2006, it even posted negative flows owing to the nationalization of subsidiaries of transnational companies.10 In 2011, as in 2010, all FDI was in the form of reinvested earnings and intra-company loans because the balance of capital contributions remained in negative territory —disinvestments by transnational companies exceeded new contributions. The oil sector received 65% of inward FDI; 20% went to financial operations.
FDI in Uruguay continued the uptrend seen in recent years and totalled US$ 2.528 billion in 2011 up 2% over the previous year. The wood and pulp plant in which Chile’s Arauco (Copec group) invested an estimated US$ 2 billion will come on line in 2013.
The Plurinational State of Bolivia received foreign direct investment flows totalling US$ 859 million in 2011, 28% more than in 2010 and far more than the US$ 390 million average for the previous decade (2000-2010). FDI was concentrated in the primary sector, which, according to preliminary data, accounts for 40% of FDI (hydrocarbons, 35% and mining, 5%); industry received 39% while the services sector received 21% of the total.
Ecuador drew in FDI totalling US$ 386 million, more than twice the figure for 2010 but less than flows received between 2000 and 2005. The natural resources sector received 61% of the total. This relative stagnation may be attributed to new oil sector regulations giving preferential treatment to State-owned Petroecuador, thus prompting the exit of several foreign oil companies in 2010. Nevertheless, new investments in the sector in order to expand output are being announced. Besides natural resources, Germany’s tyre company Continental announced
9 This transaction is not included in net FDI because it involved the simultaneous entry and exit of foreign capital.
10 A 2011 coverage adjustment in oil sector activities prompted a substantial retrospective revision of FDI figures for the Bolivarian Republic of Venezuela. The data for 2010 went from a negative flow of US$ 1.404 billion to a positive US$ 1.209 billion.
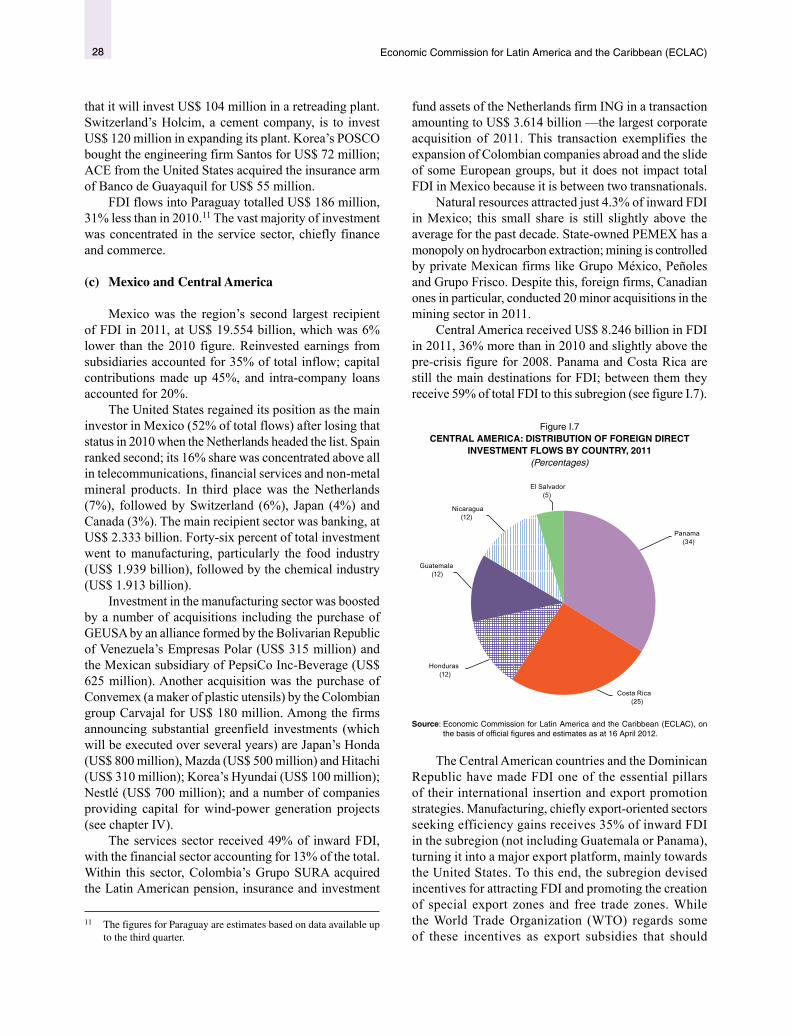
28 Economic Commission for Latin America and the Caribbean (ECLAC)
that it will invest US$ 104 million in a retreading plant. Switzerland’s Holcim, a cement company, is to invest US$ 120 million in expanding its plant. Korea’s POSCO bought the engineering firm Santos for US$ 72 million; ACE from the United States acquired the insurance arm of Banco de Guayaquil for US$ 55 million.
FDI flows into Paraguay totalled US$ 186 million, 31% less than in 2010.11 The vast majority of investment was concentrated in the service sector, chiefly finance and commerce.
(c) Mexico and Central America
Mexico was the region’s second largest recipient of FDI in 2011, at US$ 19.554 billion, which was 6% lower than the 2010 figure. Reinvested earnings from subsidiaries accounted for 35% of total inflow; capital contributions made up 45%, and intra-company loans accounted for 20%.
The United States regained its position as the main investor in Mexico (52% of total flows) after losing that status in 2010 when the Netherlands headed the list. Spain ranked second; its 16% share was concentrated above all in telecommunications, financial services and non-metal mineral products. In third place was the Netherlands (7%), followed by Switzerland (6%), Japan (4%) and Canada (3%). The main recipient sector was banking, at US$ 2.333 billion. Forty-six percent of total investment went to manufacturing, particularly the food industry (US$ 1.939 billion), followed by the chemical industry (US$ 1.913 billion).
Investment in the manufacturing sector was boosted by a number of acquisitions including the purchase of GEUSA by an alliance formed by the Bolivarian Republic of Venezuela’s Empresas Polar (US$ 315 million) and the Mexican subsidiary of PepsiCo Inc-Beverage (US$ 625 million). Another acquisition was the purchase of Convemex (a maker of plastic utensils) by the Colombian group Carvajal for US$ 180 million. Among the firms announcing substantial greenfield investments (which will be executed over several years) are Japan’s Honda (US$ 800 million), Mazda (US$ 500 million) and Hitachi (US$ 310 million); Korea’s Hyundai (US$ 100 million); Nestlé (US$ 700 million); and a number of companies providing capital for wind-power generation projects (see chapter IV).
The services sector received 49% of inward FDI, with the financial sector accounting for 13% of the total. Within this sector, Colombia’s Grupo SURA acquired the Latin American pension, insurance and investment
11 The figures for Paraguay are estimates based on data available up to the third quarter.
fund assets of the Netherlands firm ING in a transaction amounting to US$ 3.614 billion —the largest corporate acquisition of 2011. This transaction exemplifies the expansion of Colombian companies abroad and the slide of some European groups, but it does not impact total FDI in Mexico because it is between two transnationals.
Natural resources attracted just 4.3% of inward FDI in Mexico; this small share is still slightly above the average for the past decade. State-owned PEMEX has a monopoly on hydrocarbon extraction; mining is controlled by private Mexican firms like Grupo México, Peñoles and Grupo Frisco. Despite this, foreign firms, Canadian ones in particular, conducted 20 minor acquisitions in the mining sector in 2011.
Central America received US$ 8.246 billion in FDI in 2011, 36% more than in 2010 and slightly above the pre-crisis figure for 2008. Panama and Costa Rica are still the main destinations for FDI; between them they receive 59% of total FDI to this subregion (see figure I.7).
Figure I.7 CENTRAL AMERICA: DISTRIBUTION OF FOREIGN DIRECT
INVESTMENT FLOWS BY COUNTRY, 2011(Percentages)
Panama(34)
Costa Rica(25)
Honduras(12)
Guatemala(12)
Nicaragua(12)
El Salvador(5)
Source: Economic Commission for Latin America and the Caribbean (ECLAC), on the basis of official figures and estimates as at 16 April 2012.
The Central American countries and the Dominican Republic have made FDI one of the essential pillars of their international insertion and export promotion strategies. Manufacturing, chiefly export-oriented sectors seeking efficiency gains receives 35% of inward FDI in the subregion (not including Guatemala or Panama), turning it into a major export platform, mainly towards the United States. To this end, the subregion devised incentives for attracting FDI and promoting the creation of special export zones and free trade zones. While the World Trade Organization (WTO) regards some of these incentives as export subsidies that should
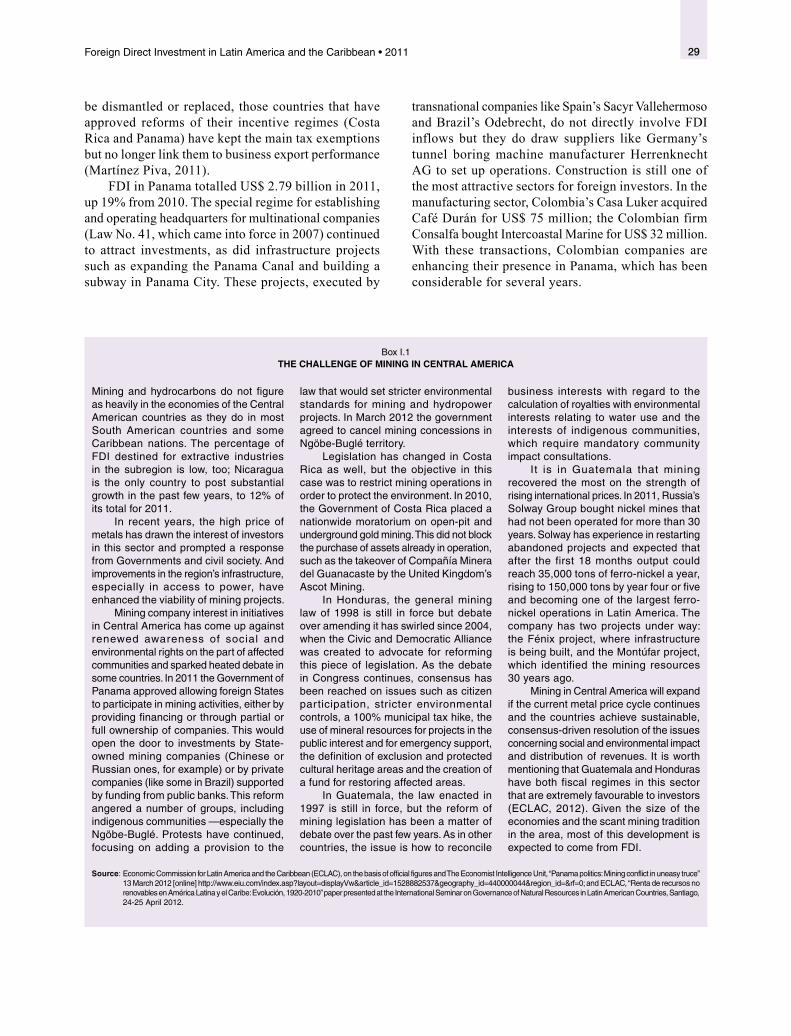
29Foreign Direct Investment in Latin America and the Caribbean • 2011
be dismantled or replaced, those countries that have approved reforms of their incentive regimes (Costa Rica and Panama) have kept the main tax exemptions but no longer link them to business export performance (Martínez Piva, 2011).
FDI in Panama totalled US$ 2.79 billion in 2011, up 19% from 2010. The special regime for establishing and operating headquarters for multinational companies (Law No. 41, which came into force in 2007) continued to attract investments, as did infrastructure projects such as expanding the Panama Canal and building a subway in Panama City. These projects, executed by
transnational companies like Spain’s Sacyr Vallehermoso and Brazil’s Odebrecht, do not directly involve FDI inflows but they do draw suppliers like Germany’s tunnel boring machine manufacturer Herrenknecht AG to set up operations. Construction is still one of the most attractive sectors for foreign investors. In the manufacturing sector, Colombia’s Casa Luker acquired Café Durán for US$ 75 million; the Colombian firm Consalfa bought Intercoastal Marine for US$ 32 million. With these transactions, Colombian companies are enhancing their presence in Panama, which has been considerable for several years.
Box I.1 THE CHALLENGE OF MINING IN CENTRAL AMERICA
Mining and hydrocarbons do not figure as heavily in the economies of the Central American countries as they do in most South American countries and some Caribbean nations. The percentage of FDI destined for extractive industries in the subregion is low, too; Nicaragua is the only country to post substantial growth in the past few years, to 12% of its total for 2011.
In recent years, the high price of metals has drawn the interest of investors in this sector and prompted a response from Governments and civil society. And improvements in the region’s infrastructure, especially in access to power, have enhanced the viability of mining projects.
Mining company interest in initiatives in Central America has come up against renewed awareness of social and environmental rights on the part of affected communities and sparked heated debate in some countries. In 2011 the Government of Panama approved allowing foreign States to participate in mining activities, either by providing financing or through partial or full ownership of companies. This would open the door to investments by State-owned mining companies (Chinese or Russian ones, for example) or by private companies (like some in Brazil) supported by funding from public banks. This reform angered a number of groups, including indigenous communities —especially the Ngöbe-Buglé. Protests have continued, focusing on adding a provision to the
law that would set stricter environmental standards for mining and hydropower projects. In March 2012 the government agreed to cancel mining concessions in Ngöbe-Buglé territory.
Legislation has changed in Costa Rica as well, but the objective in this case was to restrict mining operations in order to protect the environment. In 2010, the Government of Costa Rica placed a nationwide moratorium on open-pit and underground gold mining. This did not block the purchase of assets already in operation, such as the takeover of Compañía Minera del Guanacaste by the United Kingdom’s Ascot Mining.
In Honduras, the general mining law of 1998 is still in force but debate over amending it has swirled since 2004, when the Civic and Democratic Alliance was created to advocate for reforming this piece of legislation. As the debate in Congress continues, consensus has been reached on issues such as citizen participation, stricter environmental controls, a 100% municipal tax hike, the use of mineral resources for projects in the public interest and for emergency support, the definition of exclusion and protected cultural heritage areas and the creation of a fund for restoring affected areas.
In Guatemala, the law enacted in 1997 is still in force, but the reform of mining legislation has been a matter of debate over the past few years. As in other countries, the issue is how to reconcile
business interests with regard to the calculation of royalties with environmental interests relating to water use and the interests of indigenous communities, which require mandatory community impact consultations.
It is in Guatemala that mining recovered the most on the strength of rising international prices. In 2011, Russia’s Solway Group bought nickel mines that had not been operated for more than 30 years. Solway has experience in restarting abandoned projects and expected that after the first 18 months output could reach 35,000 tons of ferro-nickel a year, rising to 150,000 tons by year four or five and becoming one of the largest ferro-nickel operations in Latin America. The company has two projects under way: the Fénix project, where infrastructure is being built, and the Montúfar project, which identified the mining resources 30 years ago.
Mining in Central America will expand if the current metal price cycle continues and the countries achieve sustainable, consensus-driven resolution of the issues concerning social and environmental impact and distribution of revenues. It is worth mentioning that Guatemala and Honduras have both fiscal regimes in this sector that are extremely favourable to investors (ECLAC, 2012). Given the size of the economies and the scant mining tradition in the area, most of this development is expected to come from FDI.
Source: Economic Commission for Latin America and the Caribbean (ECLAC), on the basis of official figures and The Economist Intelligence Unit, “Panama politics: Mining conflict in uneasy truce” 13 March 2012 [online] http://www.eiu.com/index.asp?layout=displayVw&article_id=1528882537&geography_id=440000044®ion_id=&rf=0; and ECLAC, “Renta de recursos no renovables en América Latina y el Caribe: Evolución, 1920-2010” paper presented at the International Seminar on Governance of Natural Resources in Latin American Countries, Santiago, 24-25 April 2012.

30 Economic Commission for Latin America and the Caribbean (ECLAC)
In 2011, Costa Rica received US$ 2.104 billion in FDI, 44% more than in 2010. Investments in companies in free trade zones accounted for 30%. The largest inflows were concentrated in the service sector as the market opened in activities previously under the purview of the State (telecommunications and insurance were opened up to private investment in 2011). Noteworthy were the investments announced by the Danish logistics and transport conglomerate AP Moller-Maersk, Italy’s Enel and Spain’s Acciona. Liberalization of the telecommunications market for providing Internet and mobile telephone services (approved in 2008) has attracted companies like Spain’s Movistar, Mexico’s América Móvil and Colombia’s Metrowireless. The Japanese firm Bridgestone has announced new investments in the manufacturing sector.
FDI flows into Honduras totalled US$ 1.014 billion in 2011, 27% more than the figure for 2010. These flows break down into reinvested earnings (66%), and equity (28%) and other capital (6%). In 2011, transport, warehousing and telecommunications were once more the main FDI recipients (with 31%), owing to the expansion of telecommunications companies. Manufacturing (excluding the maquila industry) ranked second, at 24% of the total, as coffee processors stepped up the reinvestment of earnings, distribution centres expanded and beverage companies purchased transport equipment. The maquila industry, the third largest recipient of FDI flows, saw a decline of 39% as several textile companies closed when their contracts were not renewed. The largest investor in Honduras was the United States (28.6% of the total), followed by Canada (18.4%) and Mexico (15%).
FDI flows to Guatemala rose by 22% to US$ 985 million; reinvested earnings accounted for most of this figure. The largest transaction was in the power sector with the change in ownership of Deorsa and Deocsa, which Spain’s Gas Natural Fenosa sold for US$ 449 million to the investment fund Actis based in the United Kingdom. In 2011, Walmart announced plans to invest US$ 84 million in 25 new stores.
Inward FDI in Nicaragua reached US$ 968 million, almost twice the figure for 2010. Inflows rose for all sectors, but the sharpest increases were in mining (US$ 114 million) and commerce and services (US$ 118 million). Canada (26.4% of the total) and the United States (16.4%) are still the main investors, followed by Mexico and Spain at 11.9% each. The Electrobrás investment in the Tumarín hydropower plant was the largest announced this year: some US$ 1 billion over the next few years. In the services sector, Ireland’s online staff recruitment firm Saongroup started up operations.
El Salvador received US$ 386 million in FDI, thus returning to the average for the past decade after the decline
in 2010. The main recipient sectors were manufacturing (63%), commerce (19%) and communications (10%).
(d) The Caribbean
FDI flows into the Caribbean subregion totalled US$ 4.690 billion in 2011. This was 20% more than in 2010 but still less than half the figure for 2008. This increase after two years of decline was mainly driven by higher flows to the Dominican Republic (US$ 2.371 billion, 25% more than in 2010).
The economies of the Caribbean as a whole have been the hardest hit by the economic crisis since 2008. Investment in the tourism sector —which is especially important for members of the Organisation of Eastern Caribbean States (OECS)— and in financial services, in the Bahamas, has borne the brunt over the past three years.
The natural resources sector (which has tradtionally figured heavily owing to metal mining in the Dominican Republic, hydrocarbons in Trinidad and Tobago and bauxite in Jamaica) has, since 2008, been attracting more and more FDI. The biggest investment projects are in gold mining, including a US$ 800 million undertaking by Canada’s IAMGOLD and the US$ 400 million venture by United States-based Alcoa and Newmont —both in Suriname. Alcoa announced a US$ 200 million investment in bauxite mining in Suriname; oil exploration projects are under way in Guyana.
After growing by 43% between 2000 and 2007, FDI into the rest of the region fell off by 8% in the wake of the international financial crisis as inflows to the services sector sagged. Smaller investments in manufactures and services for export were concentrated in free trade zones in the Dominican Republic and Haiti and in a number of call centres.
FDI inflows to the Dominican Republic jumped by 25% in 2011, to US$ 2.371 billion, boosted above all by the mining sector, which received 40% of the total, followed by electric power and commerce. Investment in tourism and real estate rose slightly over 2010 but was still far short of the levels seen at the end of 2007. The largest investors in the Dominican Republic were the United States, Canada and Spain, in that order.
FDI in the Bahamas also increased considerably to US$ 840 million in the first nine months of 2011, equivalent to 45% more than in 2010. This was largely the result of the Baha Mar major tourism project (see box I.2). The economies that posted higher FDI flows included Suriname (US$ 154 million), which received significant investment in gold and bauxite mining; Guyana (US$ 247 million); and Haiti, which registered record high inflows of US$ 181 million in 2011. The other Caribbean economies for which data are available posted more moderate growth in FDI or even a reduction.

31Foreign Direct Investment in Latin America and the Caribbean • 2011
Box I.2 CHINA FINANCES AND EXECUTES THE LARGEST TOURISM PROJECT IN THE CARIBBEAN
The 400-hectare Baha Mar resort complex in the Bahamas will include six hotels with 2,250 rooms and apartments (among them a 700-room Grand Hyatt resort), a convention centre, the largest casino in the Caribbean, a golf course, 24 restaurants, 3 spas, a water park and other attractions. At an estimated total cost of US$ 3.5 billion, this project alone will double the hotel capacity of the Bahamas when it opens its doors in 2014.
A local consortium will own the complex; international hotel chains will manage the hotels. However, the project is only possible with financing from China Exim Bank, which
offered a US$ 2.5 billion loan in March 2010. Under the same agreement, the bulk of the construction work will be done by China State Construction Engineering Corporation (CSCEC), one of the largest construction companies in China. At a time when the fallout from the real estate and financial crisis in the United States is making it hard for tourism projects in the Caribbean to secure financing, funding from a State-owned Chinese bank was, no doubt, key for moving ahead with such an ambitious initiative. It is a good example of the foreign expansion model followed by Chinese
companies based essentially on financing from State-owned banks (see ECLAC, 2011a, chapter III).
The project will have a major impact on the local economy, above all by creating jobs; between 6,000 and 7,000 will be permanent. Another 4,000 local jobs will be created during construction, but in keeping with the tradition followed by many Chinese construction firms, CSCEC expects to hire up to 8,000 Chinese workers. Once the project is complete, the economy of the Bahamas will be even more dependent on the tourist industry.
Source: Economic Commission for Latin America and the Caribbean (ECLAC), on the basis of information provided by Baha Mar Resort.
Trinidad and Tobago attracted US$ 293 million in FDI in the first half of 2011, in line with the same period in 2010.
As a whole, the member countries of the Organization of Eastern Caribbean States (OECS) (Antigua and Barbuda, Dominica, Grenada, Montserrat, Saint Kitts and
Nevis, Saint Lucia and Saint Vincent and the Grenadines) recorded a 7% reduction in FDI in 2011, which was the fifth consecutive year that FDI inflows had fallen since 2007. FDI inflows to these countries are directed mainly at the tourism sector.
2. Patterns of origin and destination of foreign direct investment
The United States and the countries of the European Union are still the main investors in Latin America. In 2011 the Netherlands was the largest source of FDI flowing into the region, although it is estimated that most of these flows originated from companies based in other countries (see box II.2). United States transnationals accounted for 19% of FDI flows to the region (a lower share than during the previous five years). Spain’s share rose to 14% (see figure I.8).
Japanese investment jumped to 9% of the total in 2011, boosted by major acquisitions. The first and third largest of these in 2011 were by Japanese companies. Another six purchases made by Asian companies, above all from China, were on the list of the 20 largest transactions (see table I.3). Investment originating in China in 2011 did not match the US$ 15 billion posted in 2010 (ECLAC, 2011a), but there were acquisitions such as Sinochem’s in Brazil and Sinopec’s in Argentina, along with greenfield investments like the Minmetals and Chinalco mining operations in Peru and the major tourism project in the Bahamas (see box I.2). In the automobile sector, Japanese and Korean firms already installed in the region announced investment projects, as did recent arrivals such as China’s Chery. In the power sector, Korea’s KEPCO ventured into Mexico and Jamaica (see chapter IV). Other investments by Asian countries include those by India in wind energy in Brazil and by Viet Nam in the telecommunications sector in Haiti.
Figure I.8 LATIN AMERICA AND THE CARIBBEAN: ORIGIN OF FOREIGN
DIRECT INVESTMENT, 2006-2011 a
(Percentages)
0
20
40
60
80
100
2006-2010 2011
OthersChinaUnited KingdomCanadaJapanNetherlands SpainUnited States Latin America
20
1448
9
14
18
21
38
2453
9
9
23
7
Source: Economic Commission for Latin America and the Caribbean (ECLAC), on the basis of official figures and estimates as at 16 April 2012.
a FDI shown by origin in this figure accounts for 63% of total FDI in Latin America and the Caribbean.
FDI from other countries in the region, whose share of the total had been rising steadily in recent years, fell slightly to 5% in 2011. The main reason was declining outward FDI for the region overall (examined in the following section), followed in second place by the rising share of trans-Latin company expansion projects in the United States, Europe and other regions.

32 Economic Commission for Latin America and the Caribbean (ECLAC)
In terms of the region as a whole, in 2011, FDI was concentrated primarily in the services sector, which received 45% of inflows, followed by manufactures with 38%, and natural resources with 18%. The pattern of distribution by sector differs significantly from one country or one subregion to another. In 2011, the percentage of FDI received by the natural resources sector in Brazil fell sharply, with corresponding increases in the shares of services and manufactures (see figure I.9). In the other South American countries, on the other hand, 57% of the FDI received in 2011 was channelled into the primary sector. The pattern of distribution by sector in Mexico, Central America and the Caribbean was much the same as in previous years, with 53% of FDI going to services, 40% to manufactures and 8% to natural resources.
Figure I.9 LATIN AMERICA AND THE CARIBBEAN: SECTORAL DISTRIBUTION OF FOREIGN DIRECT INVESTMENT
BY SUBREGION, 2006-2011(Percentages)
0
20
40
60
80
100
0
20
40
60
80
100
2006-2010 2011
2006-2010 2011
2006-2010 2011
Natural resources Manufactures Services
9 8
36 40
56 53
42
57
20
7
38 36
26
9
41
46
3344
0
20
40
60
80
100
A. South America (excluding Brazil)
B. Mexico, Central America and the Caribbean
C. Brazil
Source: Economic Commission for Latin America and the Caribbean (ECLAC), on the basis of official figures and estimates as at 16 April 2012.
Beyond official figures for FDI, data on mergers and acquisitions provide a more detailed picture of which countries are investing in the region and in what sectors. Overall, cross-border mergers and acquisitions with Latin America and the Caribbean as a destination totalled | US$ 82.786 billion, similar to last year’s figure.12 By sector (see figure I.10), in 2011 the larger share went to services, with 53% of the total. Acquisitions of primary-sector companies accounted for 37%, down slightly from 2010. Just 12% of the mergers took place in the manufacturing sector. This is a lower percentage than the one yielded by official data on FDI, indicating that greenfield investments play a larger role in this sector.
Figure I.10 LATIN AMERICA AND THE CARIBBEAN: SECTORAL
DISTRIBUTION OF CROSS-BORDER MERGERS AND ACQUISITIONS, 2011
(Percentage shares)
Naturalresources
(35)
Manufactures (12)
Services (53)
Source: Economic Commission for Latin America and the Caribbean (ECLAC), on the basis of information from Thomson Reuters.
In 2011 there was no repeat of the unusually large transactions seen in 2010, when three topped US$ 5 billion. The only one in excess of that figure in 2011 was Mitsubishi’s purchase of a 24.5% interest in Anglo American Sur in Chile, for US$ 5.39 billion (see table I.3). As mentioned above, the region is still a strong draw because of its natural resources and the degree of domestic market growth. That is why mergers and acquisitions centre on the mining, oil and gas sectors and on non-tradable sectors like telecommunications and infrastructure. At the country level, 7 of the 10 largest transactions were in Brazil, in the form of acquisitions in mining and hydrocarbons (where Brazil has substantial resources), in non-tradable industrial sectors such as beverages and in services like telecommunications,
12 Data on cross-border mergers and acquisitions are not strictly comparable with official FDI figures because the methodologies for obtaining them are different.
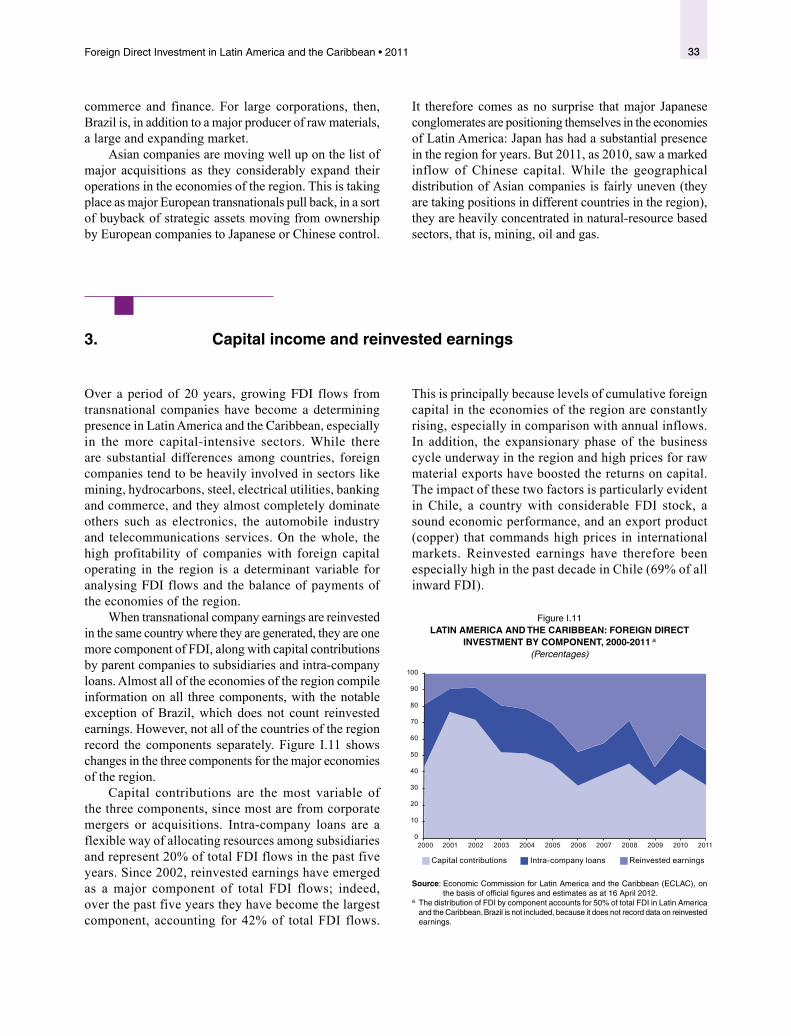
33Foreign Direct Investment in Latin America and the Caribbean • 2011
commerce and finance. For large corporations, then, Brazil is, in addition to a major producer of raw materials, a large and expanding market.
Asian companies are moving well up on the list of major acquisitions as they considerably expand their operations in the economies of the region. This is taking place as major European transnationals pull back, in a sort of buyback of strategic assets moving from ownership by European companies to Japanese or Chinese control.
It therefore comes as no surprise that major Japanese conglomerates are positioning themselves in the economies of Latin America: Japan has had a substantial presence in the region for years. But 2011, as 2010, saw a marked inflow of Chinese capital. While the geographical distribution of Asian companies is fairly uneven (they are taking positions in different countries in the region), they are heavily concentrated in natural-resource based sectors, that is, mining, oil and gas.
3. Capital income and reinvested earnings
Over a period of 20 years, growing FDI flows from transnational companies have become a determining presence in Latin America and the Caribbean, especially in the more capital-intensive sectors. While there are substantial differences among countries, foreign companies tend to be heavily involved in sectors like mining, hydrocarbons, steel, electrical utilities, banking and commerce, and they almost completely dominate others such as electronics, the automobile industry and telecommunications services. On the whole, the high profitability of companies with foreign capital operating in the region is a determinant variable for analysing FDI flows and the balance of payments of the economies of the region.
When transnational company earnings are reinvested in the same country where they are generated, they are one more component of FDI, along with capital contributions by parent companies to subsidiaries and intra-company loans. Almost all of the economies of the region compile information on all three components, with the notable exception of Brazil, which does not count reinvested earnings. However, not all of the countries of the region record the components separately. Figure I.11 shows changes in the three components for the major economies of the region.
Capital contributions are the most variable of the three components, since most are from corporate mergers or acquisitions. Intra-company loans are a flexible way of allocating resources among subsidiaries and represent 20% of total FDI flows in the past five years. Since 2002, reinvested earnings have emerged as a major component of total FDI flows; indeed, over the past five years they have become the largest component, accounting for 42% of total FDI flows.
This is principally because levels of cumulative foreign capital in the economies of the region are constantly rising, especially in comparison with annual inflows. In addition, the expansionary phase of the business cycle underway in the region and high prices for raw material exports have boosted the returns on capital. The impact of these two factors is particularly evident in Chile, a country with considerable FDI stock, a sound economic performance, and an export product (copper) that commands high prices in international markets. Reinvested earnings have therefore been especially high in the past decade in Chile (69% of all inward FDI).
Figure I.11 LATIN AMERICA AND THE CARIBBEAN: FOREIGN DIRECT
INVESTMENT BY COMPONENT, 2000-2011 a
(Percentages)
0
10
20
30
40
50
60
70
80
90
100
2000 2001 2002 2003 2004 2005 2006 2007 2008 2009 2010 2011
Capital contributions Intra-company loans Reinvested earnings
Source: Economic Commission for Latin America and the Caribbean (ECLAC), on the basis of official figures and estimates as at 16 April 2012.
a The distribution of FDI by component accounts for 50% of total FDI in Latin America and the Caribbean. Brazil is not included, because it does not record data on reinvested earnings.
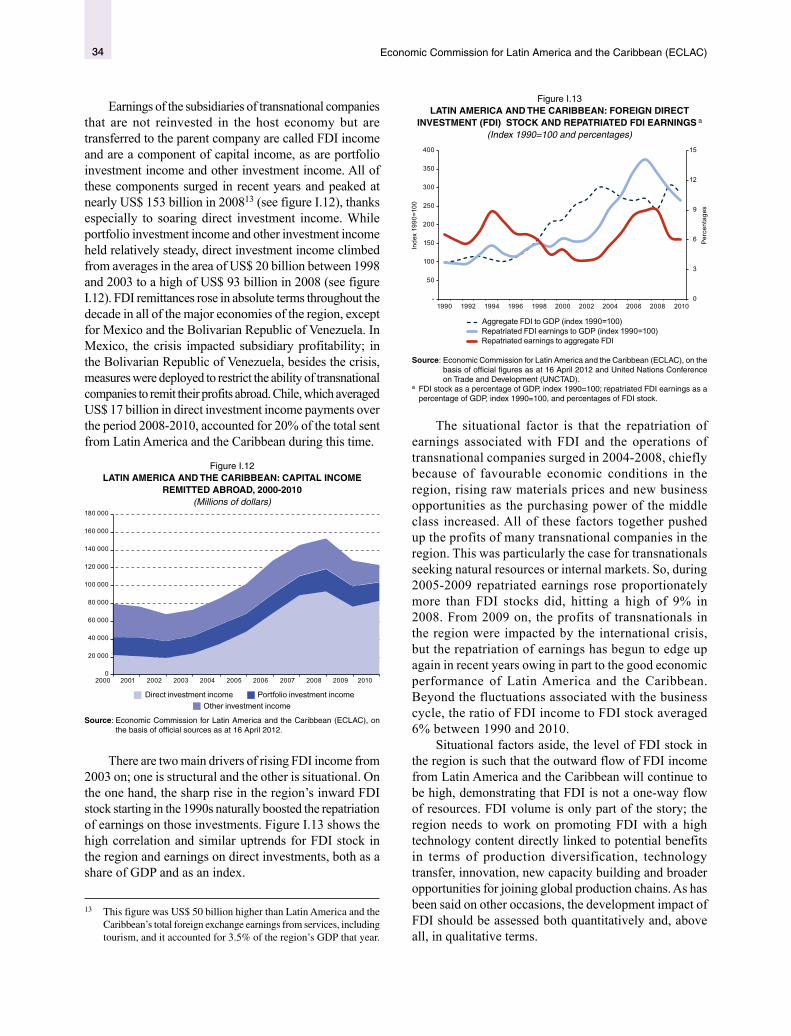
34 Economic Commission for Latin America and the Caribbean (ECLAC)
Earnings of the subsidiaries of transnational companies that are not reinvested in the host economy but are transferred to the parent company are called FDI income and are a component of capital income, as are portfolio investment income and other investment income. All of these components surged in recent years and peaked at nearly US$ 153 billion in 200813 (see figure I.12), thanks especially to soaring direct investment income. While portfolio investment income and other investment income held relatively steady, direct investment income climbed from averages in the area of US$ 20 billion between 1998 and 2003 to a high of US$ 93 billion in 2008 (see figure I.12). FDI remittances rose in absolute terms throughout the decade in all of the major economies of the region, except for Mexico and the Bolivarian Republic of Venezuela. In Mexico, the crisis impacted subsidiary profitability; in the Bolivarian Republic of Venezuela, besides the crisis, measures were deployed to restrict the ability of transnational companies to remit their profits abroad. Chile, which averaged US$ 17 billion in direct investment income payments over the period 2008-2010, accounted for 20% of the total sent from Latin America and the Caribbean during this time.
Figure I.12 LATIN AMERICA AND THE CARIBBEAN: CAPITAL INCOME
REMITTED ABROAD, 2000-2010(Millions of dollars)
0
20 000
40 000
60 000
80 000
100 000
120 000
140 000
160 000
180 000
2000 2001 2002 2003 2004 2005 2006 2007 2008 2009 2010
Other investment incomePortfolio investment incomeDirect investment income
Source: Economic Commission for Latin America and the Caribbean (ECLAC), on the basis of official sources as at 16 April 2012.
There are two main drivers of rising FDI income from 2003 on; one is structural and the other is situational. On the one hand, the sharp rise in the region’s inward FDI stock starting in the 1990s naturally boosted the repatriation of earnings on those investments. Figure I.13 shows the high correlation and similar uptrends for FDI stock in the region and earnings on direct investments, both as a share of GDP and as an index.
13 This figure was US$ 50 billion higher than Latin America and the Caribbean’s total foreign exchange earnings from services, including tourism, and it accounted for 3.5% of the region’s GDP that year.
Figure I.13 LATIN AMERICA AND THE CARIBBEAN: FOREIGN DIRECT
INVESTMENT (FDI) STOCK AND REPATRIATED FDI EARNINGS a
(Index 1990=100 and percentages)
0
3
6
9
12
15
-
50
100
150
200
250
300
350
400
1990 1992 1994 1996 1998 2000 2002 2004 2006 2008 2010
Aggregate FDI to GDP (index 1990=100) Repatriated FDI earnings to GDP (index 1990=100) Repatriated earnings to aggregate FDI
Inde
x 19
90=1
00
Per
cent
ages
Source: Economic Commission for Latin America and the Caribbean (ECLAC), on the basis of official figures as at 16 April 2012 and United Nations Conference on Trade and Development (UNCTAD).
a FDI stock as a percentage of GDP, index 1990=100; repatriated FDI earnings as a percentage of GDP, index 1990=100, and percentages of FDI stock.
The situational factor is that the repatriation of earnings associated with FDI and the operations of transnational companies surged in 2004-2008, chiefly because of favourable economic conditions in the region, rising raw materials prices and new business opportunities as the purchasing power of the middle class increased. All of these factors together pushed up the profits of many transnational companies in the region. This was particularly the case for transnationals seeking natural resources or internal markets. So, during 2005-2009 repatriated earnings rose proportionately more than FDI stocks did, hitting a high of 9% in 2008. From 2009 on, the profits of transnationals in the region were impacted by the international crisis, but the repatriation of earnings has begun to edge up again in recent years owing in part to the good economic performance of Latin America and the Caribbean. Beyond the fluctuations associated with the business cycle, the ratio of FDI income to FDI stock averaged 6% between 1990 and 2010.
Situational factors aside, the level of FDI stock in the region is such that the outward flow of FDI income from Latin America and the Caribbean will continue to be high, demonstrating that FDI is not a one-way flow of resources. FDI volume is only part of the story; the region needs to work on promoting FDI with a high technology content directly linked to potential benefits in terms of production diversification, technology transfer, innovation, new capacity building and broader opportunities for joining global production chains. As has been said on other occasions, the development impact of FDI should be assessed both quantitatively and, above all, in qualitative terms.

35Foreign Direct Investment in Latin America and the Caribbean • 2011
4. Technology intensity and transnational companies’ involvement in research and development
Beyond the volume of investment flowing into the region, FDI projects can differ qualitatively in terms of their capacity to make a sustainable contribution to the development of the host economy. Investments in the highest technology content sectors of the manufacturing industry and in research and development have the greatest impact in this regard.14 Such investments contribute the most to knowledge creation, absorption and dissemination and so generate dynamic impacts that contribute to structural change (ECLAC, 2007). This section uses information as of 2011 to update the analysis contained in the two most recent reports (ECLAC, 2010 and ECLAC, 2011a).15
In 2011, 61% of investment projects in Latin America and the Caribbean were in low- and medium-low-technology sectors, with medium-low-tech sectors receiving 43% and low-tech sectors receiving 18% (see figure I.13). Most of these projects were in the metal, oil refining, food, textile and pulp and paper sectors. The high percentage of projects in low- and medium-low-tech sectors in the region stands in contrast to other developing regions, such as Asia (in particular, China), where 80% of the projects are in high- or medium-high technology content sectors (ECLAC, 2011a).
In 2011 the proportion of FDI projects in medium-high-tech sectors continued to trend up, going from 15% in 2003-2005 to 26% in 2008-2010 and 36% in 2011. Many of these medium-high-tech projects are in the chemical, automobile and machinery and equipment sectors. In the automobile industry, European companies such as Renault, PSA and Volkswagen have expansion initiatives in the pipeline, particularly in Brazil but also in Mexico and Argentina (see chapter II). PSA Peugeot-Citroën announced that it will invest US$ 960 million in Brazil between 2012 and 2015. Renault’s expansion plans call for investing US$ 285 million between 2012 and 2016. Volkswagen announced projects in Mexico for some US$ 400 million and plans to invest more than
14 The classification of manufacturing sectors into high-, medium-high, low- and medium-low technology intensity is explained in annex I.A-1.
15 The information used refers to announcements of new FDI projects. Some might not have been actually implemented, or implementation might span several years. Nevertheless, an examination of what happened in previous years shows that information on projects announced is a good indicator of projects effectively executed.
US$ 4 billion in its four production plants in Brazil, and it has announced a new production line in Argentina that will manufacture gearboxes. However, the proportion of cross-border projects in high-technology-content sectors (pharmaceuticals, office machinery, medical instruments) in the region slipped in 2011, to just 3% (see figure I.14).
Figure I.14 LATIN AMERICA AND THE CARIBBEAN: DISTRIBUTION OF
AMOUNTS ASSOCIATED WITH NEW FOREIGN DIRECT INVESTMENT PROJECTS BY TECHNOLOGY INTENSITY, 2003-2005, 2008-2010 AND 2011
(Percentages)
0
20
40
60
80
100
2003-2005 2008-2010 2011
Low Medium-low Medium-high High
Source: Economic Commission for Latin America and the Caribbean (ECLAC), on the basis of investments announced in “fDi Markets”, Financial Times.
While R&D-associated projects flowing into the region rose from 3% of the worldwide total to 6% (see figure I.15); only Brazil (at 5% of the worldwide figure) can be regarded as a major destination for such projects. A number of United States electronics companies (IBM and Motorola, for example) are working on new R&D operations in Brazil, as are European companies in the automobile industry (including Fiat and Volkswagen) and in its steel (Foseco) and chemical (Rhodia) sectors (see chapter II). Several R&D projects in Brazil are directly associated with the primary sector. BG Group has plans for a new R&D centre; Siemens is to install an oil and gas R&D facility to be operated in partnership with the Federal University of Rio de Janeiro. Other countries involved in such projects were Mexico, Panama and Uruguay. In Uruguay, Finland’s pulp and paper company UPM-Kymmene is expanding its R&D operations at its Fray Bentos

36 Economic Commission for Latin America and the Caribbean (ECLAC)
pulp mill, to focus on wood fibre and its impact on end product properties.
An examination of information on the technology content of manufacturing operations and R&D thus shows that the region is still receiving greenfield investments heavily skewed towards low- and medium-low-tech sectors. This is despite the relative increase
in the volume of medium-high-tech projects, which are concentrated in Brazil and Mexico. Moreover, Brazil is the region’s only major destination for the internationalization of transnational company R&D. The other Latin American and Caribbean countries have not managed to position themselves as a preferred destination in this area.
Figure I.15 LATIN AMERICA AND THE CARIBBEAN: DISTRIBUTION OF SUMS ASSOCIATED WITH NEW FOREIGN DIRECT INVESTMENT
PROJECTS RELATED TO RESEARCH AND DEVELOPMENT ACTIVITIES, 2008-2010 AND 2011(Percentages)
A. 2008-2010 B. 2011
Western Europe(24) Rest of
Europe(5)
United Statesand Canada
(16)
Middle East(2)
Asia and the Pacific(49) Africa
(1)
Brazil (2.2)
Mexico (0.4)
Others (0.6)
LatinAmerica
(3.2)
Western Europe(21.9) Rest of
Europe(3.6)
United Statesand Canada
(18.8)
Middle East(5.6)
Asia and the Pacific(43.5)
Africa(0
Brazil (5)
Panama (1)Uruguay (0.3)Mexico (0.3)
LatinAmerica
(6.6)
Source: Economic Commission for Latin America and the Caribbean (ECLAC), on the basis of investments announced in “fDi Markets”, Financial Times.
D. Outward foreign direct investment and the trans-latins
1. Outward investment flows
In 2011 outward FDI flows from Latin America and the Caribbean fell by 51% compared with 2010, to US$ 21.911 billion as flows from Brazil dropped into negative territory (see figure I.16). As explained below, this decline does not signal a reversal of the internationalization of Brazilian companies. In addition to Brazil, outflows from Mexico (another major investor abroad) were down
34%. By contrast, Chile, whose outflows climbed 28%, became the region’s largest investor country abroad; Colombia posted a 26% gain. Other economies of the region, such as Argentina, Bolivarian Republic of Venezuela and Peru, have very low levels of investment abroad, although outbound investment from Argentina increased to US$ 1.488 billion in 2011 (see figure I.18).

37Foreign Direct Investment in Latin America and the Caribbean • 2011
While outward FDI from the region has been trending up and averaged more than US$ 30 billion over the past six years,16 FDI still represents a smaller proportion of the capital account of the countries of the region than loans and deposits, which are grouped in “other investment” (see figure I.17). Although they are more volatile, “other investment” flows have topped outward FDI almost every year since 2000 and stood at US$ 103 billion in 2010 —more than twice outward FDI. This trend holds for most of the countries of the region with the notable exception of Colombia, where outward FDI has been higher than “other investment” over the past decade. Portfolio investment as a cross-border capital flow is relatively small in the region, averaging US$ 10.155 billion between 2008 and 2010; this is one third the amount of outward FDI. Chile accounted for the bulk of outward portfolio investment, owing to the portfolio diversification of its pension system and the accumulation of resources in its sovereign fund. This country accounted for 82% of the net outflows from Latin America between 2000 and 2010.
Figure I.16 LATIN AMERICA AND THE CARIBBEAN: OUTWARD FOREIGN
DIRECT INVESTMENT, 1992-2011(Millions of dollars)
0
5 000
10 000
15 000
20 000
25 000
30 000
35 000
40 000
45 000
50 000
1992
1993
1994
1995
1996
1997
1998
1999
2000
2001
2002
2003
2004
2005
2006
2007
2008
2009
2010
2011
Phase II Phase IIIPhase I
Source: Economic Commission for Latin America and the Caribbean (ECLAC), on the basis of official figures as at 16 April 2012.
16 The uptrend in outward FDI flows from the region mirrors the global trend, where developing economies have made strides as the origin of FDI flows —even more so since the most recent global financial crisis. In 2007 the developing and transition economies accounted for 16% of global outbound FDI; by 2010 (the latest year for which complete data are available) they had climbed to 29% (UNCTAD, 2011).
Figure I.17 LATIN AMERICA AND THE CARIBBEAN: CAPITAL OUTFLOWS AS
DIRECT INVESTMENT, PORTFOLIO INVESTMENT AND OTHER FLOWS, 2000-2010
(Millions of dollars)
-40 000
-20 000
0
20 000
40 000
60 000
80 000
100 000
120 000
140 000
2000 2001 2002 2003 2004 2005 2006 2007 2008 2009 2010
Direct investment Portfolio investment Other investment
Source: Economic Commission for Latin America and the Caribbean (ECLAC), on the basis of official figures as at 16 April 2012.
Figure I.18 LATIN AMERICA AND THE CARIBBEAN (SELECTED COUNTRIES):
OUTWARD FOREIGN DIRECT INVESTMENT, 2010 AND 2011(Millions of dollars)
-15 000
-10 000
-5 000
0
5 000
10 000
15 000
Chile Mexico Colombia Brazil Argentina Venezuela(Bol. Rep. of)
Peru CentralAmerica a
2010 2011
Source: Economic Commission for Latin America and the Caribbean (ECLAC), on the basis of official figures as at 16 April 2012.
a Includes Costa Rica, El Salvador, Guatemala and Honduras.
Despite the drop in outflows in 2011 (owing above all to the pattern in Brazil and, to a lesser extent, Mexico), there is no reason to expect a reversal of the recent trend towards greater international expansion of the major trans-Latins. Because there are relatively few large trans-Latin companies, their individual expansion projects trigger variations in aggregate flows and contribute to the high volatility of outward FDI. Business internationalization in
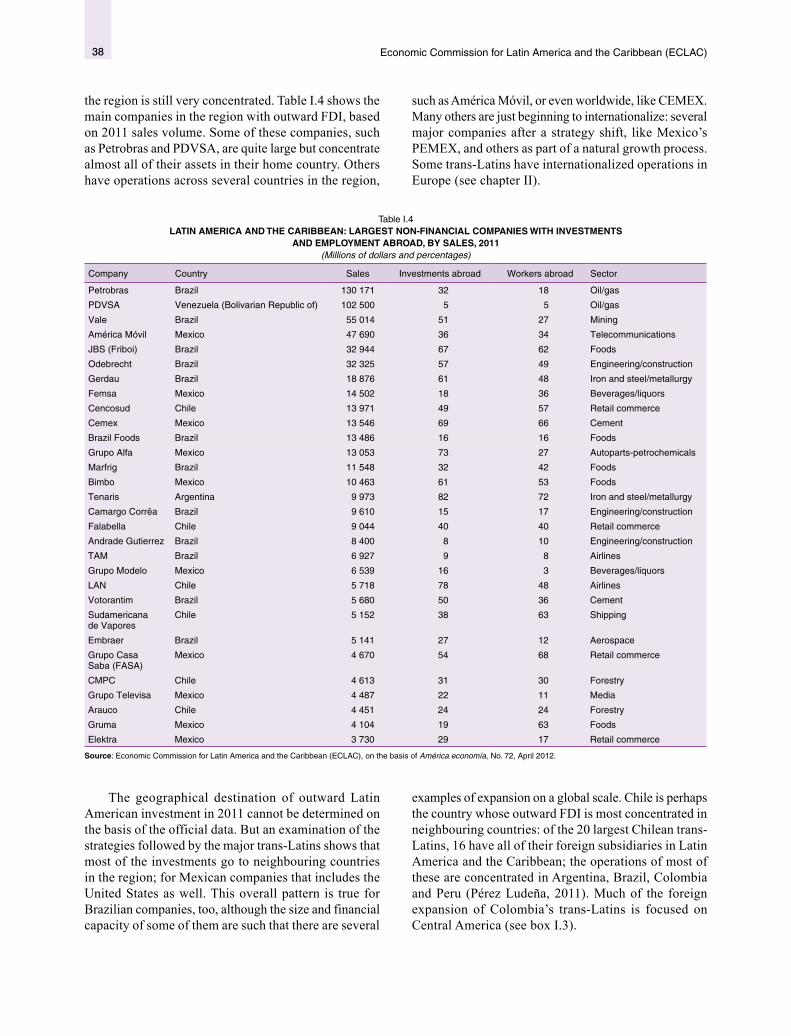
38 Economic Commission for Latin America and the Caribbean (ECLAC)
the region is still very concentrated. Table I.4 shows the main companies in the region with outward FDI, based on 2011 sales volume. Some of these companies, such as Petrobras and PDVSA, are quite large but concentrate almost all of their assets in their home country. Others have operations across several countries in the region,
such as América Móvil, or even worldwide, like CEMEX. Many others are just beginning to internationalize: several major companies after a strategy shift, like Mexico’s PEMEX, and others as part of a natural growth process. Some trans-Latins have internationalized operations in Europe (see chapter II).
Table I.4 LATIN AMERICA AND THE CARIBBEAN: LARGEST NON-FINANCIAL COMPANIES WITH INVESTMENTS
AND EMPLOYMENT ABROAD, BY SALES, 2011(Millions of dollars and percentages)
Company Country Sales Investments abroad Workers abroad Sector
Petrobras Brazil 130 171 32 18 Oil/gas
PDVSA Venezuela (Bolivarian Republic of) 102 500 5 5 Oil/gas
Vale Brazil 55 014 51 27 Mining
América Móvil Mexico 47 690 36 34 Telecommunications
JBS (Friboi) Brazil 32 944 67 62 Foods
Odebrecht Brazil 32 325 57 49 Engineering/construction
Gerdau Brazil 18 876 61 48 Iron and steel/metallurgy
Femsa Mexico 14 502 18 36 Beverages/liquors
Cencosud Chile 13 971 49 57 Retail commerce
Cemex Mexico 13 546 69 66 Cement
Brazil Foods Brazil 13 486 16 16 Foods
Grupo Alfa Mexico 13 053 73 27 Autoparts-petrochemicals
Marfrig Brazil 11 548 32 42 Foods
Bimbo Mexico 10 463 61 53 Foods
Tenaris Argentina 9 973 82 72 Iron and steel/metallurgy
Camargo Corrêa Brazil 9 610 15 17 Engineering/construction
Falabella Chile 9 044 40 40 Retail commerce
Andrade Gutierrez Brazil 8 400 8 10 Engineering/construction
TAM Brazil 6 927 9 8 Airlines
Grupo Modelo Mexico 6 539 16 3 Beverages/liquors
LAN Chile 5 718 78 48 Airlines
Votorantim Brazil 5 680 50 36 Cement
Sudamericana de Vapores
Chile 5 152 38 63 Shipping
Embraer Brazil 5 141 27 12 Aerospace
Grupo Casa Saba (FASA)
Mexico 4 670 54 68 Retail commerce
CMPC Chile 4 613 31 30 Forestry
Grupo Televisa Mexico 4 487 22 11 Media
Arauco Chile 4 451 24 24 Forestry
Gruma Mexico 4 104 19 63 Foods
Elektra Mexico 3 730 29 17 Retail commerce
Source: Economic Commission for Latin America and the Caribbean (ECLAC), on the basis of América economía, No. 72, April 2012.
The geographical destination of outward Latin American investment in 2011 cannot be determined on the basis of the official data. But an examination of the strategies followed by the major trans-Latins shows that most of the investments go to neighbouring countries in the region; for Mexican companies that includes the United States as well. This overall pattern is true for Brazilian companies, too, although the size and financial capacity of some of them are such that there are several
examples of expansion on a global scale. Chile is perhaps the country whose outward FDI is most concentrated in neighbouring countries: of the 20 largest Chilean trans-Latins, 16 have all of their foreign subsidiaries in Latin America and the Caribbean; the operations of most of these are concentrated in Argentina, Brazil, Colombia and Peru (Pérez Ludeña, 2011). Much of the foreign expansion of Colombia’s trans-Latins is focused on Central America (see box I.3).

39Foreign Direct Investment in Latin America and the Caribbean • 2011
Box I.3 COLOMBIAN COMPANIES EXPAND INTERNATIONALLY
Over the past few years Colombia has become one of the largest sources of outward foreign investment from Latin America and the Caribbean: 38% of the region’s outward FDI between 2009 and 2011 was from Colombia, compared with a mere 8% between 2000 and 2005. Like most trans-Latins, Colombian companies have concentrated their international expansion efforts in other countries in the region. However, while the Bolivarian Republic of Venezuela and Panama received 47% of Colombia’s outward investment during the 1990s, flows to both countries (especially the Bolivarian Republic of Venezuela) fell sharply from 2001 on. Deteriorating economic relations with the latter were one of the reasons that Colombian companies began to expand towards other countries in the region. A particular focus has been on Central America, where they now have a strong presence in a number of economic sectors.
FDI by Colombian companies is driven mainly by a search for markets. In recent years, Colombia’s good economic performance has helped boost profits at major companies, and appreciation of its national currency with respect to the currencies of Central American countries has helped spur investment in the latter. The main target sectors have been natural resources, financial services, power and the food and cement industries.
In the financial sector, Colombian companies have gained a significant foothold in Central America over the past few years. Grupo Aval operates in all of the countries of the subregion, principally through its 2010 acquisition of BAC-Credomatic GECF in Panama for US$ 1.92 billion. In 2011 Grupo SURA bought Costa Rica’s Compuredes for US$ 18.7
million; ProSeguros in the Dominican Republic for US$ 23.5 million; and, in El Salvador, Fondo de Pensiones Crecer for US$ 103 million and Seguros Asesuisa for US$ 98 million. Grupo SURA also played a leading role in the largest ever acquisition by a Latin American company, when, in 2011, it bought the pension, insurance and investment fund assets of the multinational firm ING in Chile, Colombia, Mexico, Peru and Uruguay for US$ 3.614 billion. In early 2012 Sociedades Bolívar announced its intention to acquire HSBC’s Central American banking operations for US$ 801 million in a transaction that has yet to be settled and would include 29 offices in Costa Rica, 57 in El Salvador and 50 in Honduras.
At the forefront of the power companies have been Empresas Públicas de Medellín (EPM), which has focused on expanding in Central America; Interconexión Eléctrica Sociedad Anónima (ISA), with its investments in Brazil, Chile, Peru and other countries; and, to a lesser extent, Empresa de Energía de Bogotá, with assets in Guatemala and Peru (see chapter IV). The extractive industries accounted for 68% of outward FDI between 2008 and 2010, mainly through the State-owned Ecopetrol. Other firms in this sector with investments abroad were Promigas, Pacific Rubiales, Petrominerales, Tepma and Tethys Petroleum.
A major player in the industrial sector is Cementos Argos, which has a significant footprint in the United States that will be further enhanced upon completion of its announced US$ 760 million acquisition of the United States-based assets of France’s Lafarge. Argos has clinker plants and concrete businesses in the Dominican Republic, Haiti, Panama and
Suriname. The food company Nutresa produces meat in Panama since it bought Panama’s Ernesto Berard in 2008, as well as chocolates following its purchase of Nutresa México (2009) and ice cream after buying Helados Bon in the Dominican Republic (2011).
Construction service companies have focused their international operations on Panama. In 2010, Conconcreto and Odinsa participated in the US$ 77 million expansion of Tocumen International Airport near Panama City. Since 2006 Conalvías has carried out several urban infrastructure projects awarded by Panama’s Ministry of Public Works; early 2012 brought the announcement that Conconcreto has been awarded a US$ 30 million contract for phase three of the Multiplaza Pacific Mall in Panama City.
Other sectors where Colombian company operations in Central America are concentrated are aviation, with the Avianca-Taca merger (ECLAC, 2011a, box I.3); the textile industry, with production and distribution firms like Totto, Cristal, Leonisa and Olímpica; and metal parts for the automobile industry, with Fanalca’s recent investment in Panama.
These companies have posted rapid international expansion over a short period of time that has propelled many of them to leadership positions in their new markets, as is the case with EPM in power distribution in Central America. This shows how important outward FDI from Colombia is for the countries of Central America. It is also contributing to the development of Colombia itself, where in 2010 promoting these investments was included for the first time in the country’s National Development Plan (see part 2 of section D).
Source: Economic Commission for Latin America and the Caribbean (ECLAC).
As for the sectors that attract Latin American investment, there have been major acquisitions in the service industry (specifically, in financial services, as well as in telecommunications and energy) and, in the primary sector, in oil and gas (see table I.5). Despite lower outward FDI flows from the region in 2011, several trans-Latin companies took advantage of the
opportunities that arose when a number of European companies were forced to sell assets in the region in order to recapitalize and face the difficult economic situation in Europe (see chapter II). This can be seen in the list of major mergers and acquisitions by trans-Latins abroad: 5 of the 10 largest transactions involved European company assets.

40 Economic Commission for Latin America and the Caribbean (ECLAC)
Table I.5 TEN LARGEST CROSS-BORDER MERGERS OR ACQUISITIONS BY TRANS-LATIN COMPANIES, 2011
(Millions of dollars)
Company or asset acquired Country Sector Acquiring company Country Announced value
ING Pensiones y Seguros América Latina a
Mexico Financial Grupo Sura Colombia 3 614
NET Serviços de Comunicação Brazil Telecommunications Telmex Mexico 2 544Jantus Spain Energy CPFL Energia Brazil 987Portugal Telecom SGPS Portugal Telecommunications TNLP Brazil 961Magotteaux Belgium Engineering Sigdo Koppers Chile 794UNX Energy Corp. Canada Oil and gas HRT Brazil 711Repsol (9.8%) Spain Oil and gas PEMEX Mexico 500 b
Banco Patagonia Argentina Financial Banco do Brasil Brazil 480BRT Escrow Corp. United States Financial Inversiones Alsacia Chile 464CEMEX Southeast United States Cement CEMEX Mexico 360
Source: Economic Commission for Latin America and the Caribbean (ECLAC), on the basis of information from Thomson Reuters.a ING Pensiones y Seguros América Latina is a Mexican subsidiary of the Netherlands firm ING.b Estimates indicate that acquiring this share will cost US$ 1.6 billion, although only US$ 500 million was paid in 2011.
Brazil, because of its size, is the country that most influences the trend in outward FDI from the region. In 2011 Brazil posted a negative FDI outflow of US$ 9.297 billion after recording a positive outflow of US$ 11.588 billion in 2010 (see table I.6). The reasons for this trend reversal can be seen in the two components of Brazil’s outward FDI: intra-company loans and capital contributions (see figure I.19).17 The flow of loans to
17 Brazil does not report data on reinvested earnings, which is the third component of FDI.
subsidiaries was negative for the third consecutive year (this time, by US$ 21.163 billion), owing in part to the 39% jump in loans from foreign subsidiaries to parent companies in Brazil facing high interest rates on the local financial market. And capital contributions in 2011 totalled US$ 11.866 billion; this is 58% less than in 2010 but still above the US$ 8.227 billion average for 2000-2010.
17 Brazil does not report data on reinvested earnings, which is the third component of FDI.
Table I.6 LATIN AMERICA AND THE CARIBBEAN: FOREIGN DIRECT INVESTMENT OUTFLOWS BY COUNTRY, 2000-2011
(Millions of dollars and relative difference in percentages)
Country 2000-2005 a 2006 2007 2008 2009 2010 2011Absolute difference
2011-2010 b
Relative difference
2011-2010 b
South America 7 040 35 481 14 536 35 141 3 197 31 134 12 579 -18 555 -60Argentina 532 2 439 1 504 1 391 712 965 1 488 523 54Bolivia (Plurinational State of) 1 3 4 5 - 4 - 53 - 8 46 86Brazil 2 513 28 202 7 067 20 457 -10 084 11 588 -9 297 -20 885 -180Chile 1 988 2 212 4 852 9 151 7 233 9 231 11 822 2 591 28Colombia 1 156 1 098 913 2 254 3 088 6 562 8 289 1 727 26Paraguay 5 4 8 8 ... ... ... ... ...Peru 22 0 66 736 398 215 111 - 104 -48Uruguay 15 - 1 89 - 11 16 - 44 1 45 102Venezuela (Bolivarian Republic of) 809 1 524 33 1 150 1 838 2 671 173 -2 498 -94
Mexico c 3 491 c 5 758 8 256 1 157 7 019 13 570 8 946 -4 624 -34Central America 66 113 389 37 58 129 158 29 22
Costa Rica 16 98 262 6 7 24 56 32 131El Salvador 15 - 26 100 16 23 80 78 - 2 -3Guatemala 31 40 25 16 26 24 17 - 6 -27Honduras 4 1 1 - 1 1 1 7 5 379
The Caribbean 233 644 345 1 021 195 91 238 206 659Bahamas d - 136 141 172 89 88 227 198 689Barbados 3 44 82 63 41 ... ... ... ...Belize 0 8 7 10 4 3 5 2 84Jamaica 84 85 115 76 61 ... ... ... ...Trinidad and Tobago e 146 370 0 700 0 0 6 6 ...
Total 10 830 41 996 23 526 37 356 10 470 44 924 21 911 -22 954 -51
Source: Economic Commission for Latin America and the Caribbean (ECLAC), on the basis of official figures as at 16 April 2012.a Simple average. b Bahamas and Trinidad and Tobago have not reported complete data for 2011; accordingly, the absolute change and the growth rate for these countries and for the regional
aggregates were based on the 12-month variation for the most recent period available.c For 2000-2005, corresponds to the average for 2001-2005.d Official figures available to third quarter.e Official figures available to second quarter.

41Foreign Direct Investment in Latin America and the Caribbean • 2011
Although Brazilian companies have not stopped expanding abroad and have not made major disinvestments, they are placing greater emphasis on their investments in the domestic market because investment prospects in Brazil are good. For example, the main reason for the two largest cross-border acquisitions made by Brazilian companies (see table I.6) was not to expand their business in other countries but rather to gain control of the assets that the foreign firms had in Brazil. CPFL bought Spain’s Jantus, whose only assets were wind farms in Brazil, for US$ 987 million. TLNP acquired a 10% stake in Portugal Telecom in a US$ 961 million transaction arising from the reorganization of Brazil’s telecom market, where Portugal Telecom is a major actor.
Chile was once again the country of the region with the most outward FDI: US$ 11.822 billion. Chile’s major trans-Latins tended to focus on the retail, forestry products and transport sectors (Pérez Ludeña, 2011); their subsidiaries remained concentrated in Argentina, Brazil, Colombia and Peru. The largest investment in 2011 was for some US$ 950 million to build the Montes del Plata pulp mill in Uruguay in a joint venture between Chile’s Arauco and the Swedish company Stora Enso. Chilean companies are slowly beginning to internationalize outside the region: Sigdo Koppers acquired the Belgian engineering firm Magotteaux for US$ 794 million; the wine producer Concha y Toro bought Fetzer Vineyards in the United States for US$ 239 million.
Figure I.19 BRAZIL: OUTWARD FOREIGN DIRECT INVESTMENT BY
COMPONENT, 1999-2011(Millions of dollars)
-30 000
-20 000
-10 000
1999 2000 2001 2002 2003 2004 2005 2006 2007 2008 2009 2010 2011
0
10 000
20 000
30 000
40 000
Capital contributions Loans to subsidiariesBrazilian direct investment
Source: Economic Commission for Latin America and the Caribbean (ECLAC), on the basis of official figures as at 16 April 2012.
Mexico also saw a decline in its outward FDI. The 2011 figure of US$ 8.946 billion was one third less than the sum posted in 2010 and marked a reversal of the upward trend in Mexican FDI that began in 2000 and was broken only once (in 2008). There are no official data on destination countries or sectors, but announcements
of acquisitions and greenfield investments suggest that Mexican companies continued to pursue a strategy of expanding towards the United States and other countries in the region. Among the former are Alfa, which acquired Eastman Chemical’s plastic (PET) and purified terephthalic acid (PTA) manufacturing businesses for US$ 600 million; CEMEX, which increased its interest in its subsidiary CEMEX Southeast (US$ 360 million); and Bimbo, which increased its stake in its subsidiary Sara Lee Corp. (US$ 157 million). Among the latter are investment initiatives announced by Grupo México (US$ 934 million in its mines in Peru); Industrias CH in Brazil (US$ 500 million); and, especially, América Móvil in Argentina, Brazil, Chile, the Dominican Republic and Peru (US$ 5.837 billion) to be executed over a period of several years to bring its infrastructure into line with the requirements of fourth-generation (4G) mobile telephone networks and digital and high-definition television (ECLAC, 2011a, chapter IV).
In addition to investments in Latin American countries, some major Mexican companies have announced new plans outside the region. Alfa, through its high-tech aluminium auto parts subsidiary, Nemak, has opened a plant in India in order to capitalize on the latter’s domestic market potential. It has also enhanced its presence in Slovakia. PEMEX has opened a representation office in Singapore for centralizing its exports of crude oil to emerging markets, especially China and India. And CEMEX has announced a number of investments in European Union countries, where it has had subsidiaries for years. One involves opening a new premixed concrete plant in southern France (see chapter II).
Outward FDI from Colombia jumped 26% in 2011, to US$ 8.289 billion. These flows have surged in recent years; a number of the country’s trans-Latins positioned themselves in other countries, especially in Central America (see box I.3). In 2011, Colombia’s Grupo SURA acquired ING Pensiones y Seguros América Latina, the Mexican subsidiary of the Netherlands firm ING. The purchase, valued at US$ 3.6 billion, was one of the largest in history to be carried out by a Latin American company. Grupo SURA will handle financial operations associated with pension and insurance fund asset administration in Chile, Colombia, Mexico, Peru and Uruguay.
Argentina saw its outward FDI grow by 54%, to US$ 1.488 billion. Argentine firms have not made major corporate acquisitions abroad, but they have participated in greenfield investment projects and in non-traditional sectors like software and digital services. The technological solutions companies Baufest and Grupo ASSA are opening new centres in the United States and Mexico, respectively, to meet the needs of the North American market. Outward FDI from the Bolivarian Republic of Venezuela totalled just US$ 173 million. This sharp

42 Economic Commission for Latin America and the Caribbean (ECLAC)
drop from the US$ 2.671 billion posted in 2010 is due to the strategy adopted by the country’s largest company, PDVSA, to repatriate earnings from subsidiaries. One of the largest transactions is the pre-merger agreement in Mexico entered into by Grupo Embotelladoras Unidas (Geupec) and PepsiCo (United States) with Empresas Polar, the leading food and beverage company in the Bolivarian Republic of Venezuela, for creating a nationwide bottler and distributor. The agreement is that Empresas Polar is to be a major shareholder in the new company.
Income from investments abroad by trans-Latin companies has soared in recent years, with capital income on direct investment going from an average US$ 4.6 billion between 2000 and 2007 to more than US$ 8 billion in 2008-2010. This is a natural outcome of the international expansion of trans-Latins. Income from FDI totalled US$ 10 billion 2007 and 2008 and fell back to US$ 7 billion in 2010,18 so it seems that the international crisis did have some impact on the remittance of earnings from trans-Latins abroad to their parent companies.
18 Portfolio and direct investment income has grown the most, while interest on other investments has been more volatile even though volume was up sharply throughout the period. The share of the region’s financial income from investment abroad coming from loans and deposits (other income) has increased substantially. Diversification towards portfolio and direct income has been a recent develpoment as capital flows from the region increase.
2. Latin American and Caribbean policies supporting foreign direct investment
Virtually all of the countries of the region have policies for promoting exports and attracting foreign investment, but measures supporting the internationalization of domestic companies (outward direct foreign investment) are still but embryonic. Only in the past few years have some countries of the region responded to the outward FDI boom that began in 2004 by weighing specific measures such as providing information and technical assistance, incentives and subsidies and financing for companies. This attitude stands in contrast with the solid support that companies from other countries receive for expanding internationally. China’s “go global” strategy adopted in 2000 is seen as the main factor behind the rapid international expansion of Chinese companies, thanks above all to the financing for foreign investment that they receive from State-owned banks (ECLAC, 2011a).
There is much room for discussion as to whether it is appropriate to use public funds to boost FDI (Tavarez and Young, 2005). Among the arguments in favour are higher yield and productivity, acquisition of knowledge, enhanced technology capacity at the company level and an improved production structure at the country level thanks to externalities. It can also be argued that business internationalization can stimulate the capital markets and, by increasing competition, encourage R&D. On the other hand, arguments against hold that these companies, which are leaders in their home countries, should not receive special support because they are not at a disadvantage for competing in global markets and have no problems in accessing financing, especially when compared with SMEs. And it is hard to guarantee that the benefits of business internationalization will spill over into the economy.
It is in this setting that the countries of Latin America and the Caribbean are starting to deploy instruments to
support business internationalization. Brazil has made the greatest strides in the past few years. The main lines of support are provided by Brazil’s National Development Bank (BNDES) and have been enhanced by the new production development policy put in place in 2008 (BNDES, 2008). This policy aims specifically at positioning Brazilian companies among global leaders in their sectors, targeting the aviation, oil, gas, petrochemical, bioethanol, mining, pulp and paper, steel and meat industries. BNDES has opened a number of support windows; providing financing is the most important one. BNDES can take an ownership stake in Brazilian trans-Latins making new acquisitions, provide financing with performance requirements that seek for BNDES to share in future profits and grant special lines of credit to certain companies (Sennes and Camargo Mendes, 2009). Over the past five years, BNDES has offered financing in the amount of 40.8 billion reais to six companies: JBS, Marfrig, Oi, BRF, Fibria and Ambev.19
BNDES purchased 100% of the US$ 1.26 billion in notes issued by Marfrig to acquire Keystone Foods, as well as a large part of the bonds issued by JBS Friboi in compliance with the guarantees for the purchase of Pilgrim’s Pride for US$ 800 million.
19 See Gazetaonline [online] http://gazetaonline.globo.com/_conteudo/2011/12/noticias/a_gazeta/economia/1063122-apesar-do-financiamento-do-bndes-multinacionais-nao-se-livram-das- dividas.html.

43Foreign Direct Investment in Latin America and the Caribbean • 2011
BNDES currently has a 14% interest in Marfrig and a stake of nearly 17% in JBS Friboi (ECLAC, 2011a). BNDES granted a special loan to Itautec for buying Tallard (United States) and has opened special lines of credit for leading software and pharmaceutical firms like Prosoft and Profarma, respectively (Sennes and Camargo Mendes, 2009).20 Other instruments for promoting business internationalization in Brazil are technical assistance and information, especially as channelled through the Ministry of Foreign Affairs Department of Trade Promotion and the Brazilian Trade and Investment Promotion Agency (Apex-Brazil). There are other efforts that, while neither systematic nor institutionalized, promote internationalization.
So far, the forceful foreign expansion of Mexican companies has taken place without robust and targeted policy support for internationalization. However, initiatives in this regard are beginning to take shape. In 2010, the government export promotion agency ProMéxico opened a support window for internationalizing Mexican companies. According to ProMéxico, this policy is warranted because it helps promote exports, encourages the transfer of technology, can have a positive effect on the balance of payments by means of repatriated earnings, boosts the development of human capital and investment in innovation and R&D and enhances Mexico’s image abroad. The instruments are essentially the same as for promoting exports, but they are also available to companies seeking to locate their production operations outside Mexico. Support includes specialized advisory services, assistance for business trips, staff training and internships abroad. Unlike Brazil, there is no financial support, nor are there target sectors or countries. Support is aimed at medium-sized companies that want to start investing abroad, not major Mexican trans-Latins. This policy is in the experimental phase, with several pilot projects under way; the instruments are yet to be assessed.
20 BNDES is considering granting a broad credit facility for the internationalization of Grupo Pão de Açúcar (http://www.valor.com.br/arquivo/195809/bndes-estuda-credito-de-2-bi-de-euros-para-pao-de-acucar).
Like Mexico, Colombia (whose economy ranks fourth in the region in terms of outward FDI) has only just recently considered providing support for foreign investment. The new National Development Plan specifically provides for actions promoting Colombian investment abroad. It includes providing trade information to Colombian investors through Proexport, the government agency charged with promoting exports, tourism and FDI. In addition (and unlike Mexico), the Government of Colombia does encourage outward FDI through three of the major Colombian trans-Latins (Ecopetrol, ISA and Empresas Públicas de Medellín), which are State-owned. But policies for supporting internationalization are still in early stages, and there is no experience on which to assess their potential scope. In Chile, through technical bureaus at the Ministry of Finance and the Ministry of Economy, Development and Tourism, discussion has begun on implementing new instruments for supporting business internationalization.
So, business internationalization policy efforts are emerging in the region; Brazil has made the most progress in this regard. But government measures for internationalization are still in the development stage. Among the specific goals already defined are the creation of world-class companies, focusing on financing new acquisitions and targeting priority sectors. Mexico and Colombia are at even earlier stages of policy development and are beginning to tackle issues that will over time be important for policy maintenance and for deepening and expanding policy impacts. It is important to assess these policies and develop mechanisms for feedback and the requisite institutional framework. It should also be borne in mind that public policy for promoting internationalization can have information failures or create perverse incentives. The complex decisions involved and the growing importance of business internationalization open a research agenda with major challenges for the region.
20 BNDES is considering granting a broad credit facility for the internationalization of Grupo Pão de Açúcar (http://www.valor.com.br/arquivo/195809/bndes-estuda-credito-de-2-bi-de-euros-para-pao-de-acucar).
E. Concluding remarks
In 2011, FDI in Latin America and the Caribbean rose for the second straight year; at US$ 153.991 billion it is 12% above the historical high recorded in 2008. This increase mirrors the recovering global flows after the drop in 2008 and 2009 that impacted developed countries
and developing economies alike. In recent years, flows to Latin America and the Caribbean have grown more than in any other region of the world as its share of global FDI flows rose from 6% in 2007 to 10% in 2011.
The economies of the region have leveraged renewed confidence at transnational companies to attract capital to the region in a larger proportion than elsewhere in the world. They have done so on the strength of the area’s sustained economic growth and commodity prices in global markets. Brazil is out in front on both factors: its inward

44 Economic Commission for Latin America and the Caribbean (ECLAC)
flows have soared over the past two years. Moreover, the crisis and uncertainty in the developed economies are feeding the secular trend towards production process efficiency-seeking, which involves relocating certain operations to lower-cost economies.
The region’s good economic prospects stand in contrast to stagnation in the developed economies, especially in Europe, which is the origin of the largest share of the inward FDI towards Latin America and the Caribbean (see chapter II). This has driven an increase in capital flows to the region that are not limited to FDI. Indeed, during the past five years FDI has accounted for less than 50% of the region’s balance of capital; it has been surpassed by the combined total for portfolio investments and loans.
The growing flows of FDI to Latin America and the Caribbean over the past 20 years have positioned transnational companies as key players in many sectors, especially capital-intensive ones like mining, hydrocarbons, automobiles, steel, electronics, power, banking and commerce. This stock of foreign investments, which is present to a greater or lesser degree in almost all of the economies of the region, in turn yields income that is also proportionally high. Over the past few years the region’s sound economic performance and high commodity prices have positively impacted the bottom lines of the transnational companies operating in the region and thus boosted FDI dividends for the countries
of origin to an average of US$ 85.567 billion between 2007 and 2010. And in many economies, more than half of the FDI flows is in the form of reinvested earnings from subsidiaries, so FDI does not yield a net inflow of capital to Latin America and the Caribbean. This being the case, the developmental impact of FDI for the region will come in the form of potential knowledge transfers, the capacity to develop new industries and integration in global value chains.
Despite the drop in total outward flows from the region, trans-Latin companies have continued to expand. The purchase of European assets by trans-Latins surged in 2011. Europe is still the main origin of FDI for the region (see chapter II); for most European transnationals their assets in Latin America have more strategic value than ever before. However, if the current economic climate continues there is reason to expect that the relationship between Latin American and European countries will grow more balanced in the coming years, with asset acquisition and strategic alliances in both directions.
Against this backdrop of abundant capital and good economic performance, the priority should be to make strides towards production transformation that extends the high productivity of certain sectors out to the rest of the economy. The countries of the region need to view FDI as support for developing those sectors that they regard as strategic.
Bibliography
BNDES (Brazilian Development Bank) (2008), “Política de desenvolvimento produtivo: inovar e investir para sustentar o crescimento”, Rio de Janeiro, May.
ECLAC (Economic Commission for Latin America and the Caribbean) (2011a), Foreign Direct Investment in Latin America and the Caribbean, 2010 (LC/G.2494-P), Santiago, Chile. United Nations publication, Sales No. E.11.II.G.4.
(2011b), Economic Survey of Latin America and the Caribbean, 2010-2011 (LC/G.2506-P), Santiago, Chile. United Nations publication, Sales No E.11.II.G.3.
(2011c), Preliminary Overview of the Economies of Latin America and the Caribbean, 2011 (LC/G.2512-P), Santiago, Chile. United Nations publication, Sales No E.12.II.G.2.
(2010), Foreign Direct Investment in Latin America and the Caribbean, 2009 (LC/G.2447-P), Santiago, Chile. United Nations publication, Sales No. E.10.II.G.4.
(2007), “Progreso técnico y cambio estructural en América Latina”, Project document, No. 136 (LC/W.136), Santiago, Chile, Economic Commission for Latin America and the Caribbean (ECLAC)/International Development Research Centre (IDRC).
Martinez Piva, Jorge Mario (2011), “Incentivos públicos de nueva generación para la atracción de inversión extranjera directa (IED) en Centroamérica”, Estudios y perspectivas series, No. 134 (LC/MEX/L.1044), Mexico City, ECLAC Subregional Headquarters in Mexico.

45Foreign Direct Investment in Latin America and the Caribbean • 2011
Ministry of Energy and Mines (2011), “Cartera estimada de proyectos mineros” [online] http://www.minem.gob.pe/descripcion.php?idSector=1&idTitular=159&idMenu=sub149&idCateg=159# [date of reference: December 2011].
Perez Ludeña, Miguel (2011), “The top 20 multinationals in Chile in 2010: retail, forestry and transport lead the international expansion”, Desarrollo productivo series, No. 192 (LC/L.3399), Santiago, Chile, Economic Commission for Latin America and the Caribbean (ECLAC).
ProMéxico (2011) [online] http://www.promexico.gob.mx. Ramsey, J. and A. Almeida (eds.) (2009), The Rise of
Brazilian Multinationals: Making the Leap from Regional Heavyweights to True Multinationals, Rio de Janeiro, Elsevier.
Sennes, R. and R. Camargo Mendes (2009), “Public policies and Brazilian multinationals”, The Rise of Brazilian Multinationals: Making the Leap from Regional Heavyweights to True Multinationals, Rio de Janeiro, Elsevier.
Tavares, A.T. and S. Young (2005), “FDI and multinationals: patterns, impacts and policies”, International Journal of the Economics of Business, vol. 12, No. 1, February.
UNCTAD (United Nations Conference on Trade and Development) (2012), Global Investment Trends Monitor, No. 8, Geneva, January.
(2006), World Investment Report 2006. FDI from Developing and Transition Economies: Implications for Development (UNCTAD/WIR/2006), Geneva. United Nations publication, Sales No. E.06.II.D.11.

46 Economic Commission for Latin America and the Caribbean (ECLAC)
Annex
Table I.A-1 CLASSIFICATION OF MANUFACTURING INDUSTRIES BY TECHNOLOGY INTENSITY
Technology intensity Industry ISIC Rev.3
High Pharmaceuticals 2 423Manufacture of office, accounting and computing machinery 30Manufacture of radio, television and communication equipment and apparatus 32
Manufacture of medical, optical and precision instruments and watches 33
Medium-high Manufacture of chemicals and chemical products (except pharmaceuticals) 24 menos 2 423
Manufacture of machinery and equipment n.e.c. 29Manufacture of electrical machinery and apparatus n.e.c. 31Manufacture of motor vehicles, trailers and semi-trailers 34Manufacture of railway and tramway locomotives and rolling stock, and other transport equipment n.e.c. 352 más 359
Medium-low Manufacture of coke, refined petroleum products and nuclear fuel 23Manufacture of rubber and plastics products 25Manufacture of other non-metallic mineral products 26Manufacture of basic metals and fabricated metal products, except machinery and equipment 27 y 28Building and repairing of ships and boats 351
Low Manufacture of food products, beverages and tobacco products 15-16
Manufacture of textiles, wearing apparel; dressing and dyeing of fur, tanning and dressing of leather; manufacture of luggage, handbags, saddlery, harness and footwear
17-19
Manufacture of wood and of products of wood and cork, except furniture; manufacture of articles of straw and plaiting materials 20
Manufacture of paper and paper products, and publishing, printing and reproduction of recorded media 21-22
Manufacture of furniture; manufacturing n.e.c. and recycling 36-37
Source: Economic Commission for Latin America and the Caribbean (ECLAC), on the basis of data from the Organization for Economic Cooperation and Development, 2009.Note: n.e.c., not elsewhere classified.
Table I.A-2 LATIN AMERICA AND THE CARIBBEAN: NET FOREIGN DIRECT INVESTMENT
INFLOWS BY COUNTRY, 2000-2011(Millions of dollars)
Country 2000 2001 2002 2003 2004 2005 2006 2007 2008 2009 2010 2011
Anguilla a 43.0 34.7 38.2 34.4 91.8 117.3 143.2 120.1 100.8 37.5 25.7 11.5
Antigua and Barbuda a 66.6 111.9 79.7 179.4 95.2 221.0 361.0 340.5 176.2 84.6 101.3 63.9
Argentina 10 418.3 2 166.1 2 148.9 1 652.0 4 124.7 5 265.2 5 537.0 6 473.0 9 725.6 4 017.1 7 055.0 7 243.1
Bahamas b 469.1 492.6 312.4 641.7 632.4 911.5 842.8 886.8 1 031.6 753.1 960.2 840.0
Barbados 19.4 18.6 64.6 121.7 24.0 127.6 297.8 394.2 470.3 303.5 344.0 …
Belize 23.3 61.2 25.4 - 10.9 111.5 126.9 108.8 143.1 179.9 112.5 101.0 98.4
Bolivia (Plurinational State of) 733.9 703.3 674.1 194.9 82.6 - 290.8 277.8 362.3 507.6 425.7 671.8 858.9
Brazil 32 779.2 22 457.4 16 590.2 10 143.5 18 145.9 15 066.3 18 822.2 34 584.9 45 058.2 25 948.6 48 506.0 66 660.0
Chile 4 860.0 4 199.8 2 550.0 4 333.7 7 246.0 7 096.4 7 426.3 12 571.6 15 518.2 12 887.5 15 373.0 17 299.0
Colombia 2 436.5 2 541.9 2 133.7 1 720.5 3 015.6 10 252.0 6 656.0 9 048.7 10 619.6 7 137.1 6 899.3 13 234.2
Costa Rica 408.6 460.4 659.4 575.1 617.3 861.0 1 469.1 1 896.1 2 078.2 1 346.5 1 465.6 2 104.1
Dominica a 20.3 20.6 20.7 31.9 27.5 19.2 28.9 47.9 56.8 41.9 24.9 25.5
Dominican Republic 952,9 1 079,1 916,8 613,0 909,0 1 122,7 1 084,6 1 667,4 2 870,0 2 165,4 1 896,3 2 371,1
Ecuador b 720.0 1 329.8 783.3 871.5 836.9 493.4 271.4 194.2 1 006.3 321.5 158.1 567.8
El Salvador 173.4 279.0 470.2 141.7 376.3 511.2 241.1 1 550.6 903.1 365.8 116.6 385.5
Grenada a 39.4 60.8 57.4 90.5 66.3 70.2 95.6 172.4 148.1 104.0 63.4 42.9
Guatemala 229.6 498.5 205.3 263.3 296.0 508.2 591.6 745.1 753.8 600.0 805.8 984.6
Guyana 67.1 56.0 43.6 26.1 30.0 76.8 102.4 110.0 179.0 222.0 198.1 246.8
Haiti 13.3 4.4 5.7 13.8 5.9 26.0 160.6 74.5 29.8 38.0 150.0 181.0
Honduras 381.7 304.2 275.2 402.8 546.7 599.8 669.1 927.5 1 006.4 523.2 797.4 1 014.4
Jamaica 468.3 524.9 404.9 604.4 541.6 581.5 796.8 751.5 1 360.7 479.8 169.5 …

47Foreign Direct Investment in Latin America and the Caribbean • 2011
Country 2000 2001 2002 2003 2004 2005 2006 2007 2008 2009 2010 2011
Mexico 18 110.0 29 926.3 23 882.7 18 654.7 24 826.7 24 407.2 20 119.2 31 492.3 27 140.5 16 119.3 20 708.6 19 554.4
Montserrat a 2.3 0.6 0.6 2.1 2.8 0.8 4.0 6.9 12.7 2.6 3.4 3.3
Nicaragua 266.5 150.1 203.8 201.2 249.8 241.1 286.8 381.7 626.1 434.2 508.0 967.9
Panama 623.9 467.1 98.6 770.8 1 012.3 962.1 2 497.9 1 898.6 2 196.2 1 259.3 2 350.1 2 789.8
Paraguay b 104.1 84.2 10.0 25.0 27.7 35.5 95.0 201.8 208.5 94.6 227.8 148.7
Peru 809.7 1 144.3 2 155.8 1 335.0 1 599.0 2 578.7 3 466.5 5 491.0 6 923.7 5 575.9 7 328.0 7 658.8
Saint Kitts and Nevis a 99.0 90.3 81.1 77.9 53.1 93.0 114.6 140.8 183.9 136.0 122.4 142.0
Saint Lucia a 58.2 63.0 57.1 111.8 81.0 78.2 237.7 277.5 166.2 151.9 115.3 81.1
Saint Vincent and the Grenadines a 37.8 21.0 34.0 55.2 66.1 40.1 109.8 132.0 159.3 97.8 103.1 135.3
Suriname - 148.0 - 26.8 145.5 200.7 286.2 398.5 322.7 178.6 123.7 241.6 112.8 154.4
Trinidad and Tobago c 679.5 834.9 790.7 808.3 1 001.0 940.0 883.0 830.0 2 800.8 709.1 549.0 293.0
Uruguay 273.5 296.8 193.7 416.4 332.4 847.4 1 493.5 1 329.5 2 105.7 1 619.9 2 483.1 2 527.7
Venezuela (Bolivarian Republic of) 4 701.0 3 683.0 782.0 2 040.0 1 483.0 2 589.0 - 508.0 1 620.0 1 195.0 -2 536.0 1 209.0 5 302.0
Source: Economic Commission for Latin America and the Caribbean (ECLAC), on the basis of official figures and estimates as at 16 April 2012.a The amount shown for FDI in 2011 is an official estimate.b The data shown for 2011 correspond to the cumulative amount at the third quarter. c The data shown for 2011 correspond to the cumulative amount at the second quarter.
Table I.A-3 LATIN AMERICA AND THE CARIBBEAN: NET FOREIGN DIRECT INVESTMENT
INFLOWS BY DESTINATION SECTOR, 2000-2011(Millions of dollars)
2005 2006 2007 2008 2009 2010 2011
Anguilla a
Natural resources 0 0 0 0 0 0 …Manufactures 0 0 0 0 0 0 …Services 60 72 78 39 27 21 …Other 31 0 0 0 0 0 …
Antigua and Barbuda a
Natural resources 0 0 0 0 0 0 …Manufactures 0 0 0 0 1 1 …Services 75 259 238 78 33 25 …Other 108 31 16 29 5 5 …
Argentina b
Natural resources 2 043 2 756 2 586 1 550 1 103 3 143 1 541Manufactures 2 680 3 049 3 408 5 760 156 4 945 784Services 1 803 1 590 1 889 3 549 2 216 2 303 1 283
BelizeNatural resources 8 12 9 37 7 13 29Manufactures 0 0 0 0 0 0 0Services 114 83 101 127 97 83 64Other 5 14 34 16 9 5 5
BrazilNatural resources 1 722 1 835 4 806 15 085 7 503 18 358 6 296Manufactures 5 411 7 851 16 074 15 791 12 810 20 416 31 664Services 7 521 8 950 13 163 13 785 6 162 12 332 30 243
Chile c
Natural resources 595 3 384 6 607 4 625 7 013 6 203 2 545Manufactures 199 1 149 - 431 1 616 460 341 218Services 1 003 2 766 6 358 8 939 5 229 8 040 1 377Other … 244 215 256 525 511 0
ColombiaNatural resources 3 288 3 786 4 474 5 267 5 481 4 603 7 836Manufactures 5 513 803 1 867 1 748 621 656 533Services 1 451 2 067 2 709 3 605 1 035 1 641 4 865
Table I.A-2 (concluded)

48 Economic Commission for Latin America and the Caribbean (ECLAC)
2005 2006 2007 2008 2009 2010 2011Costa Rica
Natural resources 37 62 1 448 68 - 6 53Manufactures 375 436 722 574 412 1 003 680Services 449 971 1 174 1 056 867 469 1 372Other - 1 10 4 26 22 23 1
Dominica d
Natural resources 0 0 9 8 6 4 …Manufactures 0 0 0 0 0 0 …Services 4 0 15 20 14 9 …Other 12 24 12 17 12 7 …
Dominican RepublicNatural resources 31 107 30 357 758 298 965Industria e 199 - 168 184 574 280 466 305Services 893 1 146 1 453 1 938 1 128 1 132 1 102
Ecuador f
Natural resources 222 - 69 - 77 265 45 168 343Manufactures 75 90 99 206 128 123 101Services 196 250 173 535 148 - 134 124
El SalvadorNatural resources 0 29 10 5 1 1 - 1Manufactures 317 17 21 28 56 - 58 243Services 191 182 1 315 480 165 147 143Other (maquila) 4 0 101 26 72 - 1 0
Grenada d
Natural resources 0 0 0 0 0 0 …Manufactures 1 0 4 3 2 1 …Services 37 48 94 101 56 21 …Other 9 19 36 8 22 18 …
GuatemalaNatural resources 150 69 70 174 139 120 …Manufactures 131 175 210 175 51 299 …Services 219 328 437 369 401 363 …Other 9 20 28 36 9 23 …
HaitiNatural resources 3 1 9 4 6 13 …Manufactures 5 7 7 3 4 5 …Services 2 151 56 20 26 129 …Other 1 2 4 2 2 3 …
Honduras d
Natural resources 53 44 11 5 12 3 46Manufactures 270 227 384 215 103 368 392Services 263 359 515 681 408 426 577Other 14 38 18 0 0 0 0
Mexico d
Natural resources 229 454 1 832 4 801 875 1 286 844Manufactures 11 067 10 102 13 608 7 851 5 674 11 590 9 080Services 13 111 9 563 16 053 14 489 9 570 7 833 9 631
NicaraguaNatural resources 0 15 11 49 15 39 114Manufactures 87 63 121 122 70 108 226Services 155 109 250 447 313 322 522Other g 0 101 0 8 36 38 105
PanamaNatural resources 0 - 108 1 - 59 - 28 … …Manufactures - 62 105 129 161 48 … …Services 1 693 2 531 1 765 2 106 1 755 … …Other - 696 19 2 - 11 - 3 … …
Paraguay e
Natural resources - 2 - 36 - 2 3 8 - 5 - 1Manufactures - 16 60 8 149 - 109 53 1Services 53 70 196 56 195 179 148
Table I.A-3 (continued)

49Foreign Direct Investment in Latin America and the Caribbean • 2011
2005 2006 2007 2008 2009 2010 2011Peru h
Natural resources 283 735 3 923 3 783 3 965 … …Manufactures - 78 433 1 361 1 026 570 … …Services - 272 345 4 695 5 527 1 969 … …
Saint Kitts and Nevis a
Natural resources 0 0 0 0 0 0 …Manufactures 0 0 0 0 0 0 …Services 1 0 37 69 43 34 …Other 40 24 7 12 8 6 …
Saint Lucia a
Natural resources 0 0 0 0 0 0 …Manufactures 0 0 0 0 0 0 …Services 27 174 167 106 73 58 …Other 28 1 21 13 9 7 …
Saint Vincent and the Grenadines a
Natural resources 2 0 0 0 0 0 …Manufactures 0 0 0 0 0 0 …Services 11 48 52 56 39 55 …Other 1 4 23 18 14 6 …
Trinidad and TobagoNatural resources 857 795 763 589 647 501 …Manufactures 15 16 21 16 13 11 …Services 67 72 46 2 196 49 38 …
UruguayNatural resources 264 328 338 604 253 … …Manufactures 26 96 263 261 254 … …Services 248 594 592 1 003 1 014 … …Other i 310 476 136 238 71 … …
Venezuela (Bolivarian Republic of)Natural resources 1 021 -1 958 -1 728 -1 163 371 2 785 3 424Services 492 358 123 96 52 102 361Other j 1 076 1 092 3 225 2 262 -2 959 -1 678 1 517
Source: Economic Commission for Latin America and the Caribbean (ECLAC), on the basis of official figures and estimates as at 16 April 2012.Note: Data may not correspond to those reported in the balance of payments.a Does not include the sale of land or reinvested earnings.b Data from the Central Bank of Argentina.c FDI in 2005 and in 2011 corresponds to investments made under Legislative Decree 600.d Manufacturing data include the maquila sector.e Includes trade.f Data for 2011 correspond to the cumulative total at the third quarter.g Includes the construction, financial, fishing, forestry, agricultural and transport sectors.h Data from 2007 onwards correspond to the sectoral breakdown of long-term foreign capital, taking into account foreign direct investment, disbursements of long-term loans and
bonds (according to data from the Central Bank of Peru).i Includes companies that were alone in their division according to the International Standard Industrial Classification of All Economic Activities (ISIC), with a view to maintaining
statistical confidentialityj Includes manufactures.
Table I.A-3 (concluded)
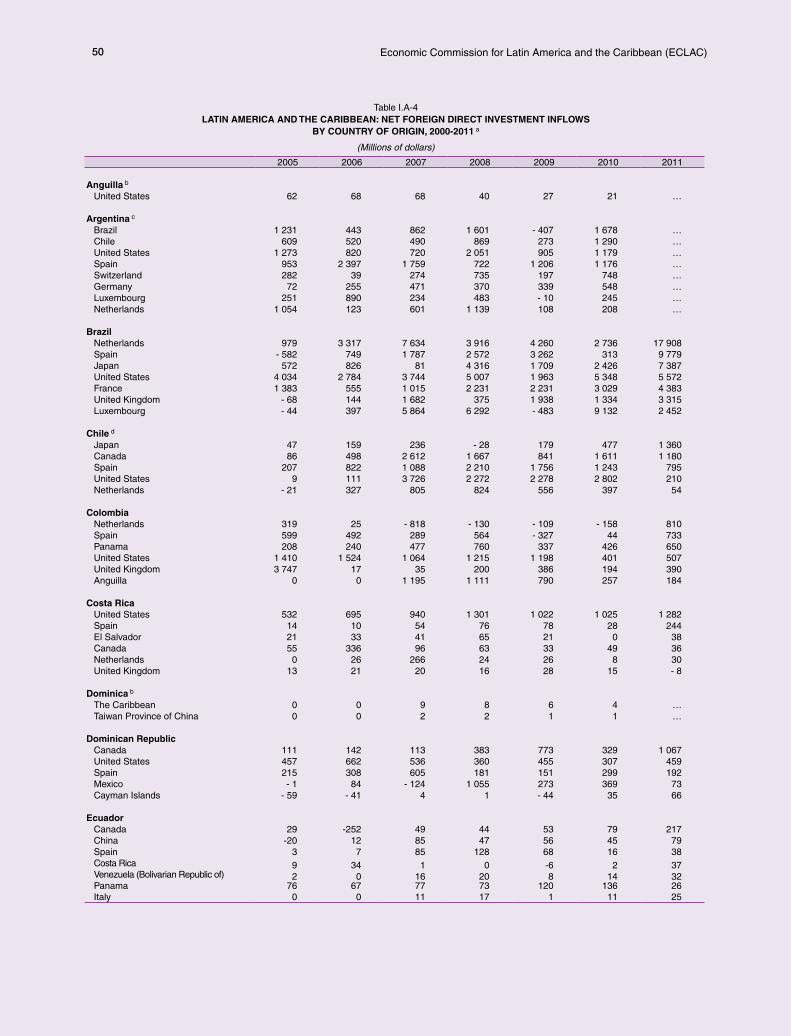
50 Economic Commission for Latin America and the Caribbean (ECLAC)
Table I.A-4 LATIN AMERICA AND THE CARIBBEAN: NET FOREIGN DIRECT INVESTMENT INFLOWS
BY COUNTRY OF ORIGIN, 2000-2011 a
(Millions of dollars)
2005 2006 2007 2008 2009 2010 2011
Anguilla b
United States 62 68 68 40 27 21 …
Argentina c
Brazil 1 231 443 862 1 601 - 407 1 678 …Chile 609 520 490 869 273 1 290 …United States 1 273 820 720 2 051 905 1 179 …Spain 953 2 397 1 759 722 1 206 1 176 …Switzerland 282 39 274 735 197 748 …Germany 72 255 471 370 339 548 …Luxembourg 251 890 234 483 - 10 245 …Netherlands 1 054 123 601 1 139 108 208 …
BrazilNetherlands 979 3 317 7 634 3 916 4 260 2 736 17 908Spain - 582 749 1 787 2 572 3 262 313 9 779Japan 572 826 81 4 316 1 709 2 426 7 387United States 4 034 2 784 3 744 5 007 1 963 5 348 5 572France 1 383 555 1 015 2 231 2 231 3 029 4 383United Kingdom - 68 144 1 682 375 1 938 1 334 3 315Luxembourg - 44 397 5 864 6 292 - 483 9 132 2 452
Chile d
Japan 47 159 236 - 28 179 477 1 360Canada 86 498 2 612 1 667 841 1 611 1 180Spain 207 822 1 088 2 210 1 756 1 243 795United States 9 111 3 726 2 272 2 278 2 802 210Netherlands - 21 327 805 824 556 397 54
ColombiaNetherlands 319 25 - 818 - 130 - 109 - 158 810Spain 599 492 289 564 - 327 44 733Panama 208 240 477 760 337 426 650United States 1 410 1 524 1 064 1 215 1 198 401 507United Kingdom 3 747 17 35 200 386 194 390Anguilla 0 0 1 195 1 111 790 257 184
Costa RicaUnited States 532 695 940 1 301 1 022 1 025 1 282Spain 14 10 54 76 78 28 244El Salvador 21 33 41 65 21 0 38Canada 55 336 96 63 33 49 36Netherlands 0 26 266 24 26 8 30United Kingdom 13 21 20 16 28 15 - 8
Dominica b
The Caribbean 0 0 9 8 6 4 …Taiwan Province of China 0 0 2 2 1 1 …
Dominican RepublicCanada 111 142 113 383 773 329 1 067United States 457 662 536 360 455 307 459Spain 215 308 605 181 151 299 192Mexico - 1 84 - 124 1 055 273 369 73Cayman Islands - 59 - 41 4 1 - 44 35 66
EcuadorCanada 29 -252 49 44 53 79 217China -20 12 85 47 56 45 79Spain 3 7 85 128 68 16 38Costa Rica 9 34 1 0 -6 2 37Venezuela (Bolivarian Republic of) 2 0 16 20 8 14 32Panama 76 67 77 73 120 136 26Italy 0 0 11 17 1 11 25

51Foreign Direct Investment in Latin America and the Caribbean • 2011
2005 2006 2007 2008 2009 2010 2011
El SalvadorUnited States 332 13 499 129 74 112 111Costa Rica … … … … … 7 69Panama 42 68 841 321 80 81 54
GuatemalaUnited States 192 198 326 229 151 343 …Canada 3 4 25 54 74 114 …Mexico 26 83 76 76 50 97 …Republic of Korea 43 45 13 4 23 63 …Spain 56 56 42 66 64 50 …United Kingdom 9 13 63 66 58 - 25 …
Honduras e United States 303 339 460 339 347 325 291Canada 17 107 139 37 24 117 187United Kingdom 48 49 103 71 - 89 58 84Costa Rica - 2 2 8 2 6 37 45Guatemala 25 17 15 40 13 39 43Ireland 0 0 0 214 19 33 22
MexicoUnited States 11 770 12 938 12 885 11 368 7 338 5 632 10 073Spain 1 693 1 436 5 402 4 941 2 686 1 445 3 074Netherlands 4 013 2 807 6 630 1 855 2 074 8 924 1 409Switzerland 324 578 606 224 87 246 1 158Canada 166 -1 422 395 143 218 225 686Japan 480 628 482 3 070 1 631 1 513 664Brazil 46 50 25 93 128 379 324
NicaraguaCanada 43 14 32 69 51 167 256United States 51 53 84 126 88 88 159Spain 17 10 45 59 25 33 116Mexico 36 53 128 164 48 90 115Venezuela (Bolivarian Republic of) 0 0 47 132 147 29 45
PanamaSpain 172 271 188 371 … …United States 121 230 492 343 … …Mexico - 28 79 68 69 199 … …Colombia - 283 102 407 49 170 … …Nicaragua 101 151 205 137 … …Switzerland 282 190 - 122 128 … …Argentina 19 - 152 66 58 94 … …United Kingdom 1 594 - 13 460 31 … …
ParaguayUnited States 20 84 107 190 111 264 92United Kingdom - 7 - 1 1 - 2 3 2 17Luxembourg - 22 - 66 69 23 13 - 46 17Argentina 14 22 - 17 6 23 8 12Italy 2 4 6 11 0 5 9Mexico 0 0 0 0 - 8 - 18 6
Peru f
Chile - 82 62 32 591 181 … …France 0 0 - 30 148 4 … …Italy - 504 65 - 22 414 0 … …South Africa 268 467 0 405 0 … …Norway 5 15 0 276 0 … …
Saint Kitts and Nevis b
United States 15 0 10 16 10 8 …United Kingdom 0 0 4 8 5 4 …The Caribbean 2 0 0 0 0 0 …
Table I.A-4 (continued)

52 Economic Commission for Latin America and the Caribbean (ECLAC)
2005 2006 2007 2008 2009 2010 2011Saint Vincent and the Grenadines b
United Kingdom 14 50 74 73 53 61 …
Trinidad and TobagoUnited States 694 627 574 403 469 363 …United Kingdom 165 150 159 146 152 118 …Germany 41 38 43 30 32 25 …India 16 27 21 16 17 13 …Canada 1 3 3 2 194 4 3 …
UruguayArgentina 106 282 373 534 464 … …Bermuda 0 0 0 7 223 … …United States 35 67 43 144 167 … …Brazil 20 56 86 183 112 … …Netherlands 29 - 18 10 14 110 … …Spain 203 81 153 232 55 … …
Venezuela (Bolivarian Republic of)
Spain 40 274 295 237 … … …Netherlands 53 - 74 203 84 … … …Panama 38 29 53 29 … … …Colombia 2 9 22 3 … … …
Source: Economic Commission for Latin America and the Caribbean (ECLAC), on the basis of official figures as at 16 April 2012.a The data may not correspond to those reported in the balance of payments. No data are available by country of origin for Antigua and Barbuda, Bahamas, Barbados, Belize,
Grenada, Guyana, Haiti, Jamaica, Montserrat, Plurinational State of Bolivia or Saint Lucia. Information is available only on the main investor countries. For data prior to 2005 please see the reports on foreign direct investment prepared by ECLAC for previous years.
b Does not include the sale of land or reinvested earnings.c Data from the Central Bank of Argentina.d FDI in 2005 and in 2011 corresponds to investments made under Legislative Decree 600.e Includes maquila.f From 2007 onwards, corresponds to the break-down by country of long-term foreign capital considered foreign direct investment, disbursements of long-term loans and bonds
(according to data from the Central Bank of Peru).
Table I.A-4 (concluded)
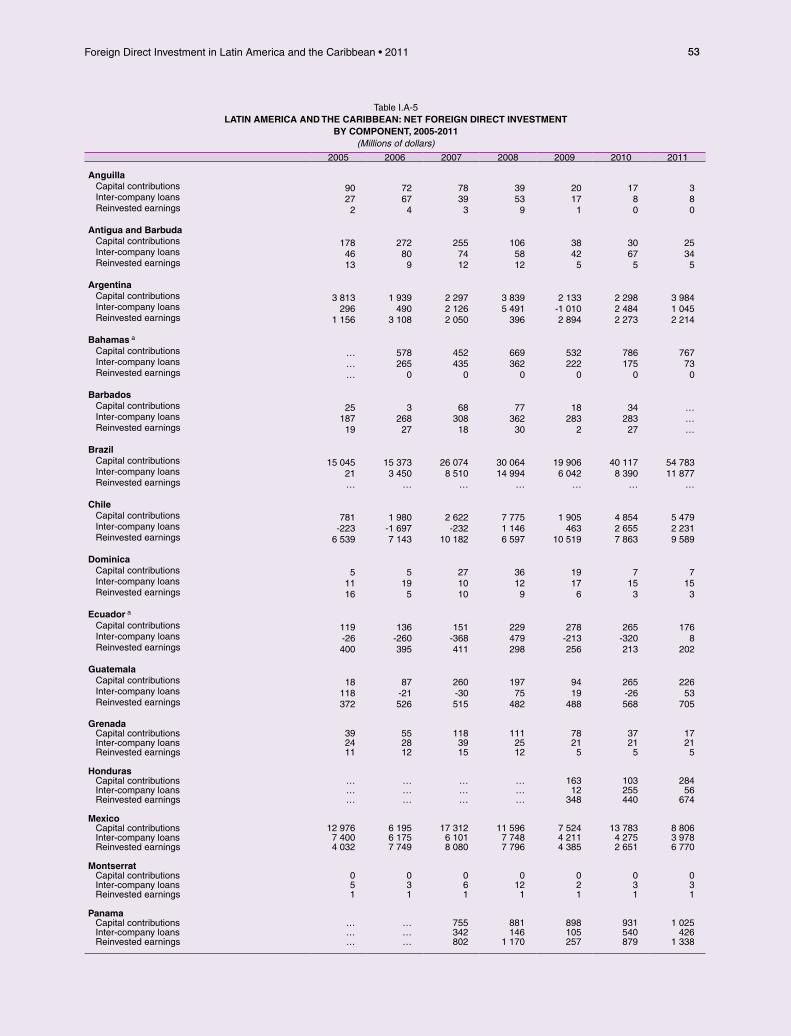
53Foreign Direct Investment in Latin America and the Caribbean • 2011
Table I.A-5 LATIN AMERICA AND THE CARIBBEAN: NET FOREIGN DIRECT INVESTMENT
BY COMPONENT, 2005-2011 (Millions of dollars)
2005 2006 2007 2008 2009 2010 2011
AnguillaCapital contributions 90 72 78 39 20 17 3Inter-company loans 27 67 39 53 17 8 8Reinvested earnings 2 4 3 9 1 0 0
Antigua and BarbudaCapital contributions 178 272 255 106 38 30 25Inter-company loans 46 80 74 58 42 67 34Reinvested earnings 13 9 12 12 5 5 5
ArgentinaCapital contributions 3 813 1 939 2 297 3 839 2 133 2 298 3 984Inter-company loans 296 490 2 126 5 491 -1 010 2 484 1 045Reinvested earnings 1 156 3 108 2 050 396 2 894 2 273 2 214
Bahamas a
Capital contributions … 578 452 669 532 786 767Inter-company loans … 265 435 362 222 175 73Reinvested earnings … 0 0 0 0 0 0
BarbadosCapital contributions 25 3 68 77 18 34 …Inter-company loans 187 268 308 362 283 283 …Reinvested earnings 19 27 18 30 2 27 …
BrazilCapital contributions 15 045 15 373 26 074 30 064 19 906 40 117 54 783Inter-company loans 21 3 450 8 510 14 994 6 042 8 390 11 877Reinvested earnings … … … … … … …
ChileCapital contributions 781 1 980 2 622 7 775 1 905 4 854 5 479Inter-company loans -223 -1 697 -232 1 146 463 2 655 2 231Reinvested earnings 6 539 7 143 10 182 6 597 10 519 7 863 9 589
DominicaCapital contributions 5 5 27 36 19 7 7Inter-company loans 11 19 10 12 17 15 15Reinvested earnings 16 5 10 9 6 3 3
Ecuador a
Capital contributions 119 136 151 229 278 265 176Inter-company loans -26 -260 -368 479 -213 -320 8Reinvested earnings 400 395 411 298 256 213 202
GuatemalaCapital contributions 18 87 260 197 94 265 226Inter-company loans 118 -21 -30 75 19 -26 53Reinvested earnings 372 526 515 482 488 568 705
GrenadaCapital contributions 39 55 118 111 78 37 17Inter-company loans 24 28 39 25 21 21 21Reinvested earnings 11 12 15 12 5 5 5
HondurasCapital contributions … … … … 163 103 284Inter-company loans … … … … 12 255 56Reinvested earnings … … … … 348 440 674
MexicoCapital contributions 12 976 6 195 17 312 11 596 7 524 13 783 8 806Inter-company loans 7 400 6 175 6 101 7 748 4 211 4 275 3 978Reinvested earnings 4 032 7 749 8 080 7 796 4 385 2 651 6 770
Montserrat Capital contributions 0 0 0 0 0 0 0Inter-company loans 5 3 6 12 2 3 3Reinvested earnings 1 1 1 1 1 1 1
PanamaCapital contributions … … 755 881 898 931 1 025Inter-company loans … … 342 146 105 540 426Reinvested earnings … … 802 1 170 257 879 1 338

54 Economic Commission for Latin America and the Caribbean (ECLAC)
2005 2006 2007 2008 2009 2010 2011Paraguay a
Capital contributions 47 60 43 20 173 -10 135Inter-company loans 3 -11 129 132 -102 128 171Reinvested earnings -15 46 30 57 23 110 -158
Peru b
Capital contributions -145 874 733 2 981 1 531 1 533 270Inter-company loans - 240 924 656 -906 64 2 403Reinvested earnings 2 724 2 353 3 835 3 287 4 951 5 731 4 986
Saint Kitts and NevisCapital contributions 38 19 41 78 49 39 47Inter-company loans 63 93 98 103 85 76 88Reinvested earnings 3 2 2 2 2 7 7
Saint LuciaCapital contributions 50 168 179 98 69 52 27Inter-company loans 7 58 83 58 79 59 50Reinvested earnings 25 11 15 11 3 4 5
Saint Vincent and the GrenadinesCapital contributions 12 49 67 66 50 59 83Inter-company loans 17 48 54 84 45 34 42Reinvested earnings 12 13 11 9 2 10 10
SurinameCapital contributions … … … 0 99 0 0Inter-company loans … … … 121 140 110 151Reinvested earnings … … … 3 2 3 4
Trinidad and TobagoCapital contributions 664 497 554 2 322 426 309 …Inter-company loans -16 -20 -21 -16 -12 -11 …Reinvested earnings 292 406 297 495 296 251 …
UruguayCapital contributions 231 576 550 1 012 1 059 1 429 1 563Inter-company loans 484 699 448 540 104 276 102Reinvested earnings 133 219 331 554 457 778 862
Venezuela (Bolivarian Republic of)Capital contributions 502 -134 -1 004 490 -3 239 -1 182 -673Inter-company loans 2 086 1 949 1 694 1 116 1 118 1 828 3 345Reinvested earnings 1 -2 323 930 -411 -415 563 2 630
Source: Economic Commission for Latin America and the Caribbean (ECLAC), on the basis of official figures and estimates as at 16 April 2012.a Data for 2011 correspond to the cumulative total at the third quarter.b Data from the Central Reserve Bank of Peru. Information on capital contributions for 2005 includes net loans from parent companies.
Table I.A-5 (concluded)

55Foreign Direct Investment in Latin America and the Caribbean • 2011
Table I.A-6 LATIN AMERICA AND THE CARIBBEAN: NET FOREIGN DIRECT INVESTMENT
OUTFLOWS BY COUNTRY, 2000-2011 (Millions of dollars)
Country 2000 2001 2002 2003 2004 2005 2006 2007 2008 2009 2010 2011
Argentina 901.0 160.9 -627.1 773.8 676.0 1 311.0 2 438.7 1 504.2 1 390.7 712.0 965.0 1 488.0
Bahamas a ... ... ... ... ... ... 136.4 140.6 171.5 89.1 88.3 227.1
Barbados 1.1 1.1 0.5 0.5 3.9 9.1 44.0 82.0 63.0 41.0 ... ...
Belize 0.0 0.0 0.0 0.4 0.1 1.0 7.7 7.2 10.4 4.3 2.5 4.6
Bolivia (Plurinational State of) 2.8 0.0 0.0 0.0 0.0 0.0 3.0 4.0 5.0 -4.0 -53.4 -7.7
Brazil 2 281.6 -2 257.6 2 482.1 249.3 9 807.0 2 516.7 28 202.0 7 067.0 20 457.0 -10 084.2 11 588.0 -9 297.0
Chile 3 986.6 1 609.7 343.2 1 606.3 1 563.1 2 182.7 2 211.9 4 851.6 9 151.3 7 233.1 9 230.9 11 822.1
Colombia 325.3 16.1 856.8 937.7 142.4 4 661.9 1 098.3 912.8 2 254.0 3 088.1 6 561.7 8 289.0
Costa Rica 8.5 9.5 34.1 26.9 60.6 -43.0 98.1 262.4 5.9 7.5 24.4 56.4
El Salvador -5.0 -9.7 -25.7 18.6 -2.7 112.9 -26.0 100.0 16.0 23.0 79.8 77.6
Guatemala … 10.3 22.1 45.7 41.2 38.2 40.0 25.4 16.4 26.3 23.5 17.2
Honduras 6.5 2.8 6.5 12.2 -6.2 1.0 1.0 1.0 -1.0 1.0 1.4 6.7
Jamaica 74.3 89.0 73.9 116.3 52.2 101.0 85.4 115.0 75.8 61.1 ... ...
Mexico … 4 404.0 890.8 1 253.5 4 431.9 6 474.0 5 758.5 8 256.3 1 157.1 7 018.9 13 570.0 8 946.0
Paraguay 5.7 5.8 -2.0 5.5 6.0 6.4 4.0 8.0 8.0 ... ... ...
Peru 0.0 74.0 0.0 60.0 0.0 0.0 0.0 66.0 736.0 398.0 215.0 111.0
Trinidad and Tobago b 25.2 150.0 106.4 225.2 29.0 341.0 370.0 0.0 700.0 0.0 0.0 6.0
Uruguay -0.6 6.2 13.7 15.1 17.7 36.3 -1.0 89.4 -10.9 16.4 -43.9 0.9
Venezuela (Bolivarian Republic of) 521.0 204.0 1 026.0 1 318.0 619.0 1 167.0 1 524.0 33.0 1 150.0 1 838.0 2 671.0 173.0
Source: Economic Commission for Latin America and the Caribbean (ECLAC), on the basis of official figures as at 16 April 2012.a Data for 2011 correspond to the cumulative total at the third quarter.b Data for 2011 correspond to the cumulative total at the second quarter.


57Foreign Direct Investment in Latin America and the Caribbean • 2011
Chapter II
Foreign direct investment between the European Union and Latin America and the Caribbean
A. Introduction
Over the past decade the European Union was the origin of an average US$ 30 billion per year
in foreign direct investment to Latin America and the Caribbean, accounting for nearly 40%
of all FDI flowing to the region and making it the main investor there. This chapter looks at
the principal patterns and characteristics of FDI flows between the European Union and Latin
America and the Caribbean, as well as the strategies followed by the transnational companies
that are behind these investment flows. It also refers to some of the specific microeconomics of
European FDI, its importance for greenfield investment in manufacturing and its contribution
to innovation and research and development (R&D) in the region.
Investment flows and transnational companies from the countries of the European Union have a long history in the region.1 During the early stages of export development, transnationals were major players in the primary sectors
1 The European Union currently has 27 member states: Austria (1995), Belgium (1952), Bulgaria (2007), Cyprus (2004), Czech Republic (2004), Denmark (1973), Estonia (2004), Finland (1995), France (1952), Germany (1952), Greece (1981), Hungary (2004), Ireland (1973), Italy (1952), Latvia (2004), Lithuania (2004), Luxembourg (1952), Malta (2004), Netherlands (1952), Poland (2004), Portugal (1986), Romanía (2007), Slovakia (2004), Slovenia (2004), Spain (1986), Sweden (1995) and United Kingdom (1973).
and some infrastructure areas, such as railways. Later on, during the import substitution model decades, European direct investment had to negotiate high trade barriers; companies focused on investing in manufacturing (the automotive, food and beverage and chemical industries) and above all on the larger economies (Brazil, Mexico and Argentina). Indeed, before the economic opening of the 1990s, nearly 75% of the total stock of European FDI in the region was in these three countries; the leading investors were the United Kingdom, Germany and France and, to a lesser extent, Italy and the Netherlands (ECLAC, 2002).
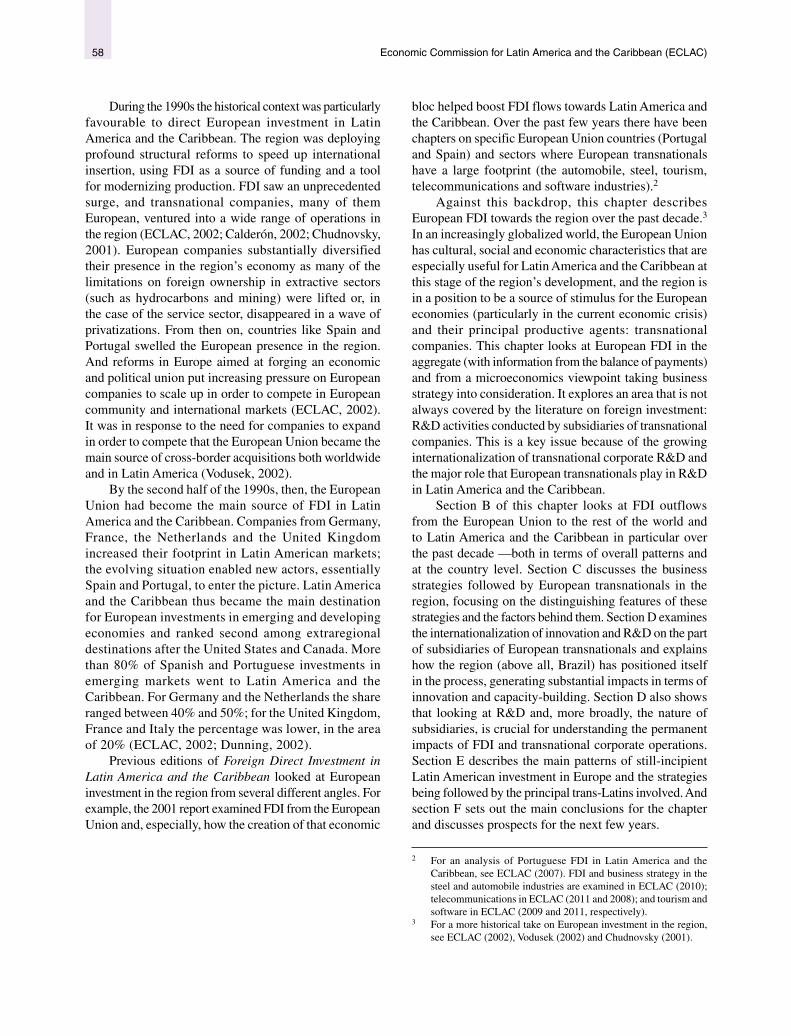
Economic Commission for Latin America and the Caribbean (ECLAC)58
During the 1990s the historical context was particularly favourable to direct European investment in Latin America and the Caribbean. The region was deploying profound structural reforms to speed up international insertion, using FDI as a source of funding and a tool for modernizing production. FDI saw an unprecedented surge, and transnational companies, many of them European, ventured into a wide range of operations in the region (ECLAC, 2002; Calderón, 2002; Chudnovsky, 2001). European companies substantially diversified their presence in the region’s economy as many of the limitations on foreign ownership in extractive sectors (such as hydrocarbons and mining) were lifted or, in the case of the service sector, disappeared in a wave of privatizations. From then on, countries like Spain and Portugal swelled the European presence in the region. And reforms in Europe aimed at forging an economic and political union put increasing pressure on European companies to scale up in order to compete in European community and international markets (ECLAC, 2002). It was in response to the need for companies to expand in order to compete that the European Union became the main source of cross-border acquisitions both worldwide and in Latin America (Vodusek, 2002).
By the second half of the 1990s, then, the European Union had become the main source of FDI in Latin America and the Caribbean. Companies from Germany, France, the Netherlands and the United Kingdom increased their footprint in Latin American markets; the evolving situation enabled new actors, essentially Spain and Portugal, to enter the picture. Latin America and the Caribbean thus became the main destination for European investments in emerging and developing economies and ranked second among extraregional destinations after the United States and Canada. More than 80% of Spanish and Portuguese investments in emerging markets went to Latin America and the Caribbean. For Germany and the Netherlands the share ranged between 40% and 50%; for the United Kingdom, France and Italy the percentage was lower, in the area of 20% (ECLAC, 2002; Dunning, 2002).
Previous editions of Foreign Direct Investment in Latin America and the Caribbean looked at European investment in the region from several different angles. For example, the 2001 report examined FDI from the European Union and, especially, how the creation of that economic
bloc helped boost FDI flows towards Latin America and the Caribbean. Over the past few years there have been chapters on specific European Union countries (Portugal and Spain) and sectors where European transnationals have a large footprint (the automobile, steel, tourism, telecommunications and software industries).2
Against this backdrop, this chapter describes European FDI towards the region over the past decade.3 In an increasingly globalized world, the European Union has cultural, social and economic characteristics that are especially useful for Latin America and the Caribbean at this stage of the region’s development, and the region is in a position to be a source of stimulus for the European economies (particularly in the current economic crisis) and their principal productive agents: transnational companies. This chapter looks at European FDI in the aggregate (with information from the balance of payments) and from a microeconomics viewpoint taking business strategy into consideration. It explores an area that is not always covered by the literature on foreign investment: R&D activities conducted by subsidiaries of transnational companies. This is a key issue because of the growing internationalization of transnational corporate R&D and the major role that European transnationals play in R&D in Latin America and the Caribbean.
Section B of this chapter looks at FDI outflows from the European Union to the rest of the world and to Latin America and the Caribbean in particular over the past decade —both in terms of overall patterns and at the country level. Section C discusses the business strategies followed by European transnationals in the region, focusing on the distinguishing features of these strategies and the factors behind them. Section D examines the internationalization of innovation and R&D on the part of subsidiaries of European transnationals and explains how the region (above all, Brazil) has positioned itself in the process, generating substantial impacts in terms of innovation and capacity-building. Section D also shows that looking at R&D and, more broadly, the nature of subsidiaries, is crucial for understanding the permanent impacts of FDI and transnational corporate operations. Section E describes the main patterns of still-incipient Latin American investment in Europe and the strategies being followed by the principal trans-Latins involved. And section F sets out the main conclusions for the chapter and discusses prospects for the next few years.
2 For an analysis of Portuguese FDI in Latin America and the Caribbean, see ECLAC (2007). FDI and business strategy in the steel and automobile industries are examined in ECLAC (2010); telecommunications in ECLAC (2011 and 2008); and tourism and software in ECLAC (2009 and 2011, respectively).
3 For a more historical take on European investment in the region, see ECLAC (2002), Vodusek (2002) and Chudnovsky (2001).

59Foreign Direct Investment in Latin America and the Caribbean • 2011
B. European Union Foreign Direct Investment in Latin America and the Caribbean
1. The European Union as a source of global FDI outflows
Global flows of FDI have, traditionally, been concentrated in developed economies as the chief senders and receivers of global movements of capital. The larger economies of the European Union have thus been major sources and destinations of these capital flows. Indeed, nearly half of the global stock of FDI originated in European Union countries (see figure II.1). Their share of inward FDI is
somewhat lower, at about 40%. Obviously, a large portion of these capital flows is between countries in this economic bloc, particularly between the larger economies; several European Union economies are among the largest FDI sending and receiving countries worldwide. Among them are the United Kingdom, France, Germany, Belgium, Spain and the Netherlands (see figure II.2).
Figure II.1 WORLD (SELECTED REGIONS AND COUNTRIES): FOREIGN DIRECT INVESTMENT FLOWS, 1990-2010
(Billions of dollars)
2 000
0 0
4 000
6 000
8 000
10 000
12 000
14 000
16 000
18 000
20 000
1990 1992 1994 1996 1998 2000 2002 2004 2006 2008 2010
European Union
A. Inward B. Outward
United States
JapanOther developed countries
Developing and transition countries
2 000
4 000
6 000
8 000
10 000
12 000
14 000
16 000
18 000
20 000
1990 1992 1994 1996 1998 2000 2002 2004 2006 2008 2010
Source: Economic Commission for Latin America and the Caribbean (ECLAC), on the basis of data from the United Nations Conference on Trade and Development (UNCTAD).
The main actors behind these investment flows are large transnational companies. The major European transnationals (and small and middle-sized ones, as well) are among the most internationalized in the world and surpass their peers in the United States and Japan in several indicators of economic activity (Dunning, 2002; European Commission, 2011). And just in terms of extraregional investment, European transnationals are highly internationalized; many are global industry and sector leaders. As a result, the investment behaviour of European companies largely shapes the pattern of global FDI flows.
Until the 1980s the United States and Western Europe dominated the global FDI pattern. The subsequent entrance of Japan completed a trio that accounted for most of the worldwide flow of FDI. But the developing countries have been gaining ground, especially over the past 10 years, both as receivers and as senders of foreign investment (ECLAC, 2011). Even more recently, they have positioned themselves as the main receivers of FDI, with more than 50% of the worldwide total (ECLAC, 2011). Noteworthy among them are the so-called BRIC countries (Brazil, Russian Federation, India and China). FDI outflows from
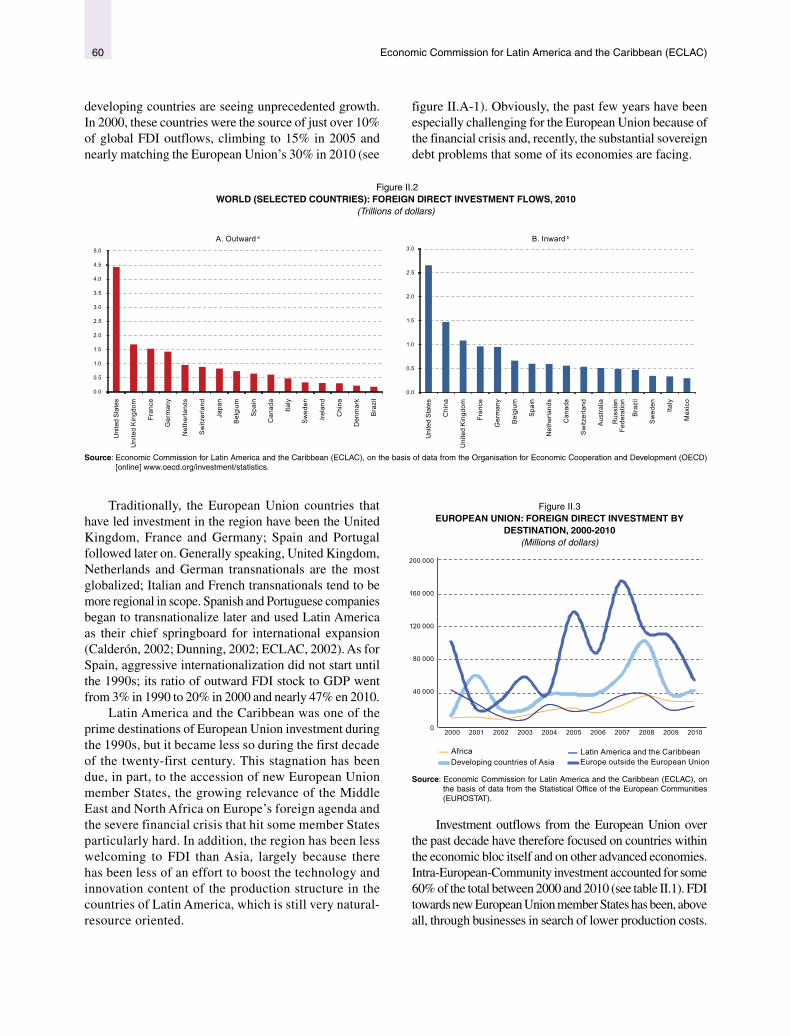
Economic Commission for Latin America and the Caribbean (ECLAC)60
developing countries are seeing unprecedented growth. In 2000, these countries were the source of just over 10% of global FDI outflows, climbing to 15% in 2005 and nearly matching the European Union’s 30% in 2010 (see
figure II.A-1). Obviously, the past few years have been especially challenging for the European Union because of the financial crisis and, recently, the substantial sovereign debt problems that some of its economies are facing.
Figure II.2 WORLD (SELECTED COUNTRIES): FOREIGN DIRECT INVESTMENT FLOWS, 2010
(Trillions of dollars)
A. Outward a B. Inward b
0.0
0.5
1.0
1.5
2.0
2.5
3.0
Uni
ted
Sta
tes
Chi
na
Uni
ted
Kin
gdom
Fran
ce
Ger
man
y
Bel
gium
Spa
in
Net
herla
nds
Can
ada
Sw
itzer
land
Aus
tralia
Rus
sian
Fede
ratio
n
Bra
zil
Sw
eden
Italy
Mex
ico
0.0
0.5
1.0
1.5
2.0
2.5
3.0
3.5
4.0
4.5
5.0
Uni
ted
Sta
tes
Uni
ted
Kin
gdom
Fran
ce
Ger
man
y
Net
herla
nds
Sw
itzer
land
Japa
n
Bel
gium
Spa
in
Can
ada
Italy
Sw
eden
Irela
nd
Chi
na
Den
mar
k
Bra
zil
Source: Economic Commission for Latin America and the Caribbean (ECLAC), on the basis of data from the Organisation for Economic Cooperation and Development (OECD) [online] www.oecd.org/investment/statistics.
Traditionally, the European Union countries that have led investment in the region have been the United Kingdom, France and Germany; Spain and Portugal followed later on. Generally speaking, United Kingdom, Netherlands and German transnationals are the most globalized; Italian and French transnationals tend to be more regional in scope. Spanish and Portuguese companies began to transnationalize later and used Latin America as their chief springboard for international expansion (Calderón, 2002; Dunning, 2002; ECLAC, 2002). As for Spain, aggressive internationalization did not start until the 1990s; its ratio of outward FDI stock to GDP went from 3% in 1990 to 20% in 2000 and nearly 47% en 2010.
Latin America and the Caribbean was one of the prime destinations of European Union investment during the 1990s, but it became less so during the first decade of the twenty-first century. This stagnation has been due, in part, to the accession of new European Union member States, the growing relevance of the Middle East and North Africa on Europe’s foreign agenda and the severe financial crisis that hit some member States particularly hard. In addition, the region has been less welcoming to FDI than Asia, largely because there has been less of an effort to boost the technology and innovation content of the production structure in the countries of Latin America, which is still very natural-resource oriented.
Figure II.3 EUROPEAN UNION: FOREIGN DIRECT INVESTMENT BY
DESTINATION, 2000-2010 (Millions of dollars)
0
40 000
80 000
120 000
160 000
200 000
2000 2001 2002 2003 2004 2005 2006 2007 2008 2009 2010
AfricaDeveloping countries of Asia Europe outside the European Union
Latin America and the Caribbean
Source: Economic Commission for Latin America and the Caribbean (ECLAC), on the basis of data from the Statistical Office of the European Communities (EUROSTAT).
Investment outflows from the European Union over the past decade have therefore focused on countries within the economic bloc itself and on other advanced economies. Intra-European-Community investment accounted for some 60% of the total between 2000 and 2010 (see table II.1). FDI towards new European Union member States has been, above all, through businesses in search of lower production costs.

61Foreign Direct Investment in Latin America and the Caribbean • 2011
European Union investments flowing to the United States accounted for some 12%. Latin America and the Caribbean was the prime destination of extra-European Community investments during the 1990s (ECLAC, 2002) but has slipped over the past decade, with its share falling to just 3%. The situation during the 1990s was indeed an unusual one marked by a flood of privatizations in the region that sent Spanish companies heading for the exit. During the 1990s, an average of 12% of European Union FDI outflows went to Latin America and the Caribbean; it fell to 9% between 2000 and 2005 and 6% between 2006 and 2010.
In this context, other developing regions gained as a draw for European investment. Such is the case with the developing countries of Asia, especially China, as well as Africa (see table II.1). Over the past five years, FDI flows to Latin America and the Caribbean from the European Union have been comparable to those going to the countries of Africa, at some 3% of total European Union FDI outflows. The stock of European Union FDI in Latin America and the Caribbean currently stands at nearly US$ 500 billion, which is 9% of the total stock of outward European Union FDI (see table II.A-1).
Table II.1 EUROPEAN UNION: FOREIGN DIRECT INVESTMENT FLOWS AND STOCK BY DESTINATION, 2000-2010
(Percentages)
DestinationFDI flows
FDI flows outside the European Union FDI stock 2009 a
2000-2005 2006-2010 2000-2005 2006-2010
European Union 61.9 57.2 - - -
United States 11.5 13.3 30.3 31.1 35.2
Europe outside the European Union 10.1 10.5 26.6 24.6 24.1
Africa 1.9 2.5 5.0 5.9 5.7
Developing countries of Asia 4.8 5.4 12.6 12.6 15.1
Latin America and the Caribbean 3.3 2.6 8.7 6.1 17.1
Others 6.4 8.4 16.8 19.7 2.8
Total 100.0 100.0 100.0 100.0 100.0
Source: Economic Commission for Latin America and the Caribbean (ECLAC), on the basis of data from the Statistical Office of the European Communities (EUROSTAT).a Unlike the information on FDI flows, the breakdown of the stock of outward FDI is for the European Union as a whole without considering the stock of FDI that the member States
have in other European Union countries.
2. FDI flows from the European Union to Latin America and the Caribbean
(a) Overview
Historically, European investment has centred on the larger economies in the region, with European transnationals operating in a wide range of manufacturing and service sectors.4 The pattern of investment flowing towards Latin America and the Caribbean has been procyclical, especially over the past decade, as can be seen in information from EUROSTAT and from the central banks of the countries of the region.5
FDI flows towards the region dropped off sharply early in the 2000s and hit a low in 2003 (see figure II.4). Several
4 Table II.A-1 shows the FDI stock of the principal countries of the European Union in the economies of the region. Brazil has the largest stock of European outward FDI, followed by Mexico, Argentina and Chile.
5 When analyzing FDI it is important to bear in mind that the statistics are imprecise, with inconsistencies among countries and among the agencies that compile and publish them (see box II.1).
global and regional factors were behind the fall in European investment. The global international environment turned less favourable when stock markets began to slide in 2000 amidst liquidity crunches and funding constraints faced by transnational companies, sending major acquisitions down from the levels seen in prior years (ECLAC, 2003). The accession of new European Union member States opened opportunities for investment within that economic bloc, drawing the attention of European businesses away from Latin America and the Caribbean. Latin America saw an easing of the sweeping privatizations that had attracted substantial FDI flows, and economic growth slowed in the face of the adverse international scenario. European companies —Spanish ones in particular— were hit hard by the crisis in Argentina. In 2003, then, European investments stood at just US$ 12 billion, the lowest in a decade.
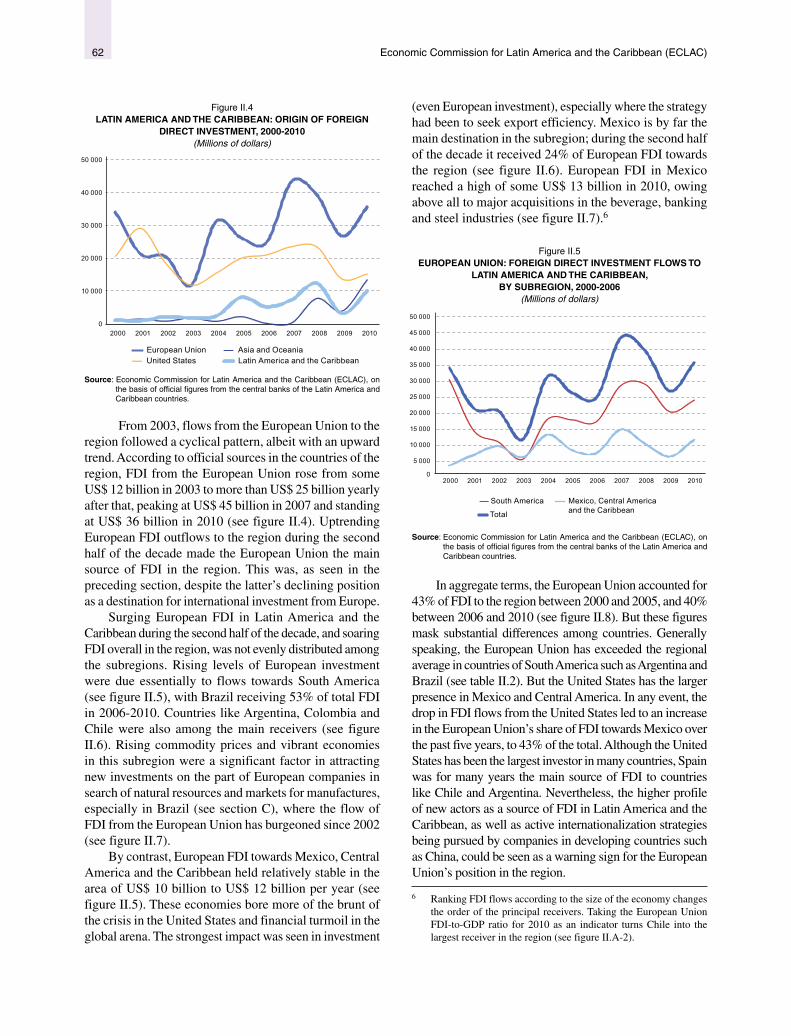
Economic Commission for Latin America and the Caribbean (ECLAC)62
Figure II.4 LATIN AMERICA AND THE CARIBBEAN: ORIGIN OF FOREIGN
DIRECT INVESTMENT, 2000-2010 (Millions of dollars)
0
10 000
20 000
30 000
40 000
50 000
2000 2001 2002 2003 2004 2005 2006 2007 2008 2009 2010
European UnionUnited States
Asia and OceaniaLatin America and the Caribbean
Source: Economic Commission for Latin America and the Caribbean (ECLAC), on the basis of official figures from the central banks of the Latin America and Caribbean countries.
From 2003, flows from the European Union to the region followed a cyclical pattern, albeit with an upward trend. According to official sources in the countries of the region, FDI from the European Union rose from some US$ 12 billion in 2003 to more than US$ 25 billion yearly after that, peaking at US$ 45 billion in 2007 and standing at US$ 36 billion in 2010 (see figure II.4). Uptrending European FDI outflows to the region during the second half of the decade made the European Union the main source of FDI in the region. This was, as seen in the preceding section, despite the latter’s declining position as a destination for international investment from Europe.
Surging European FDI in Latin America and the Caribbean during the second half of the decade, and soaring FDI overall in the region, was not evenly distributed among the subregions. Rising levels of European investment were due essentially to flows towards South America (see figure II.5), with Brazil receiving 53% of total FDI in 2006-2010. Countries like Argentina, Colombia and Chile were also among the main receivers (see figure II.6). Rising commodity prices and vibrant economies in this subregion were a significant factor in attracting new investments on the part of European companies in search of natural resources and markets for manufactures, especially in Brazil (see section C), where the flow of FDI from the European Union has burgeoned since 2002 (see figure II.7).
By contrast, European FDI towards Mexico, Central America and the Caribbean held relatively stable in the area of US$ 10 billion to US$ 12 billion per year (see figure II.5). These economies bore more of the brunt of the crisis in the United States and financial turmoil in the global arena. The strongest impact was seen in investment
(even European investment), especially where the strategy had been to seek export efficiency. Mexico is by far the main destination in the subregion; during the second half of the decade it received 24% of European FDI towards the region (see figure II.6). European FDI in Mexico reached a high of some US$ 13 billion in 2010, owing above all to major acquisitions in the beverage, banking and steel industries (see figure II.7).6
Figure II.5 EUROPEAN UNION: FOREIGN DIRECT INVESTMENT FLOWS TO
LATIN AMERICA AND THE CARIBBEAN, BY SUBREGION, 2000-2006
(Millions of dollars)
0
5 000
10 000
15 000
20 000
25 000
30 000
35 000
40 000
45 000
50 000
2000 2001 2002 2003 2004 2005 2006 2007 2008 2009 2010
Total
South America Mexico, Central America and the Caribbean
Source: Economic Commission for Latin America and the Caribbean (ECLAC), on the basis of official figures from the central banks of the Latin America and Caribbean countries.
In aggregate terms, the European Union accounted for 43% of FDI to the region between 2000 and 2005, and 40% between 2006 and 2010 (see figure II.8). But these figures mask substantial differences among countries. Generally speaking, the European Union has exceeded the regional average in countries of South America such as Argentina and Brazil (see table II.2). But the United States has the larger presence in Mexico and Central America. In any event, the drop in FDI flows from the United States led to an increase in the European Union’s share of FDI towards Mexico over the past five years, to 43% of the total. Although the United States has been the largest investor in many countries, Spain was for many years the main source of FDI to countries like Chile and Argentina. Nevertheless, the higher profile of new actors as a source of FDI in Latin America and the Caribbean, as well as active internationalization strategies being pursued by companies in developing countries such as China, could be seen as a warning sign for the European Union’s position in the region.
6 Ranking FDI flows according to the size of the economy changes the order of the principal receivers. Taking the European Union FDI-to-GDP ratio for 2010 as an indicator turns Chile into the largest receiver in the region (see figure II.A-2).

63Foreign Direct Investment in Latin America and the Caribbean • 2011
Figure II.6 EUROPEAN UNION: FOREIGN DIRECT INVESTMENT FLOWS TOWARDS LATIN AMERICA AND THE CARIBBEAN
(SELECTED COUNTRIES), 2000-2005 AND 2006-2010 (Percentages)
Brazil(42)
Argentina(9)
Mexico(30)
Chile(10)
Colombia(0)
Others(9)
A. 2000-2005 B. 2006-2010
Brazil(53)
Argentina(12)
Mexico(24)
Chile(3)
Colombia(5)
Others(2)
Source: Economic Commission for Latin America and the Caribbean (ECLAC), on the basis of data from the Statistical Office of the European Communities (EUROSTAT).
Figure II.7 EUROPEAN UNION: FOREIGN DIRECT INVESTMENT FLOWS TO
LATIN AMERICA AND THE CARIBBEAN (SELECTED COUNTRIES), 2000-2010
(Millions of dollars)
-5 000
0
5 000
10 000
15 000
20 000
25 000
30 000
35 000
2000 2001 2002 2003 2004 2005 2006 2007 2008 2009 2010
Argentina Brazil Chile Colombia Mexico
Source: Economic Commission for Latin America and the Caribbean (ECLAC), on the basis of data from the Statistical Office of the European Communities (EUROSTAT).
The countries of the European Union and of Latin America and the Caribbean have expanded the legal guarantees for cross-border investments. International investment agreements have improved the provisions of domestic legislation in the countries and created a stable, transparent climate. Such agreements (especially, bilateral investment treaties) have begun to multiply worldwide.7 The member States of the European Union, led by the United Kingdom, Germany, France and the Netherlands, have been very active in signing international investment agreements —especially bilateral investment treaties— with third countries. During the 1990s the European countries signed many such agreements with most of the countries of Latin America and the Caribbean. Argentina, Chile, Peru and Uruguay have bilateral investment treaties in force with most of the principal European economies (see table II.A-4). European Union-Mercosur Free Trade Agreement negotiations are expected to conclude in 2012.
7 The world’s network of international investment agreements is growing more atomized and complex. Current agreements are not coordinated at the international level and often overlap, address related issues (trade, intellectual property and industrial policy) and have changing substantive provisions and dispute settlement mechanisms. Efforts aimed at establishing multilateral investment agreements have been limited in scope. A noteworthy example is the Energy Charter Treaty signed by some 50 countries, including those of the European Union, to promote investment in the energy sector. Other, larger-scale initiatives, such as the Multilateral Agreement on Investment, were unsuccessful.

Economic Commission for Latin America and the Caribbean (ECLAC)64
Table II.2 LATIN AMERICA AND THE CARIBBEAN: ORIGIN OF FOREIGN DIRECT INVESTMENT, 2000-2010
(Percentages)
2000-2005 2006-2010
CountriesUnited
States and Canada
European Union
Latin America and the
Caribbean
Asia and Oceania
Others TotalUnited States and Canada
European Union
Latin America and the
Caribbean
Asia and Oceania
Others Total
Latin America 37.8 43.2 5.3 2.6 11.1 100 28.2 40.0 8.5 6.2 17.1 100
Argentina 13.5 47.6 21.5 0.0 17.4100
16.3 41.4 24.9 1.5 12.7 100
Brazil 22.2 53.9 3.9 4.7 15.4100
14.4 44.6 5.3 13.6 22.2 100
Chile 31.9 51.9 5.0 2.1 9.1100
29.3 35.7 6.2 0.1 28.7 100
Colombia 25.5 41.8 12.9 0.6 19.2100
38.2 6.5 43.9 0.6 10.8 100
Costa Rica 64.3 13.6 17.3 0.0 4.8100
60.4 13.6 8.7 0.5 16.8 100
Ecuador 24.0 10.5 34.8 1.4 29.3100
-9.4 33.3 71.5 14.6 -10.0 100
Mexico 58.9 33.7 1.2 2.0 4.2100
49.4 43.3 1.4 0.9 5.0 100
Paraguay 53.7 56.7 -22.6 16.7 -4.5100
87.4 10.9 17.3 -17.9 2.4 100
Dominican Republic
47.1 34.7 4.0 -3.1 17.2100
43.1 30.7 23.3 3.1 -0.2 100
Uruguay 6.0 28.5 17.3 0.0 48.2100
6.5 16.3 34.2 0.9 42.1 100
Source: Economic Commission for Latin America and the Caribbean (ECLAC), on the basis of official figures and estimates from the central banks of Latin America and the Caribbean.
But international investment agreements and bilateral investment treaties do not have a substantial impact on FDI flows; these streams of capital are driven more by other factors such as economic growth and market size. Indeed, Brazil, which has virtually no investment agreements in force with European Union member States, is the one with the largest inflow of FDI.
The European Union is currently discussing the future of the international investment agreements signed by its member States with a view to establishing a common investment policy. When the Treaty of Lisbon entered into force in December 2009, the European Union took on sole responsibility for FDI under the common trade policy umbrella. While there is political will, implementing it in practice is a challenge because there are so many agreements in force and the countries continue to negotiate on an individual basis. Consolidating European policy concerning investment agreements has been the subject of debate, and the outcomes are likely to have significant consequences for the architecture of the global international investment agreement regime.
(b) The pattern in European countries
Over the past 10 years Spain consolidated its position as the main European investor in Latin America and the Caribbean, accounting for 52% of total FDI during the first half of the decade and 45% in the second half (see
figure II.8).8 During that period, Spanish investment was heavily tilted towards energy, telecommunications, infrastructure, banking and other services, as well as oil and gas extraction industries. Between 2000 and 2010, 86% of Spain’s FDI in the region went to services; the manufacturing sector (chiefly in Brazil) and the primary sector received 12% and 2%, respectively (Arahuetes, 2011). This process was spearheaded by a small number of companies.9 Large Spanish companies in the services sector were involved in some of the largest acquisitions that the region has seen, propelling them to the top of the markets where they operated. The preferred destination countries were Brazil, Mexico, Chile and Argentina. For Spain, unlike other European countries, operations in the region are a key part of the drive for internationalization: 65% of Spanish assets abroad are located in Latin America and the Caribbean (see table II.A-1).
8 Spanish companies began to position themselves in the 1990s as sweeping privatizations gave them an opportunity to meet the needs created by shifting patterns of competition after Spain joined the European Union (ECLAC, 2002). Spanish companies acquired many of the highest-value assets in the region, displacing some of the largest global operators in services and infrastructure. Spain rapidly became the second largest source of FDI in the region, behind the United States.
9 One of the characteristics of Spanish investment in the region is that it is concentrated. According to estimates, Telefónica, Endesa, Repsol, Iberdrola and the banks Santander and BBVA account for 95% of total Spanish investment in the region (The Economist, 2009).

65Foreign Direct Investment in Latin America and the Caribbean • 2011
Figure II.8 LATIN AMERICA AND THE CARIBBEAN: FOREIGN DIRECT INVESTMENT INFLOWS FROM THE EUROPEAN UNION
BY COUNTRY OF ORIGIN, 1999-2010 (Percentages)
A. 1999-2005 B. 2006-2010
United Kingdom(11)
Germany(4)
France(9)
Italy(3)
Spain(52)
Netherlands (6)
Others(14) United Kingdom
(12)
Germany(7)
France(16)
Italy(16)
Spain(45)
Netherlands (4)
Otros (0)
Source: Economic Commission for Latin America and the Caribbean (ECLAC), on the basis of data from the Statistical Office of the European Communities (EUROSTAT).
Until the early 2000s, most Spanish investment went to Latin America and the Caribbean. But the turn of the century brought troubled times for Spanish companies. The political and economic crisis in Argentina that put an end to the convertibility regime dealt a strong blow to companies operating in service subsectors. This, coupled with factors having to do with the shaping of the European Union itself, helped shift the focus of Spanish investment to other countries in the bloc (see figure II.9), and Spanish investment in the region fell off sharply in the last few years (see table II-A.2). This did not mean the end of operations in the region, though, and there are companies that have retained their leadership in services and extraction sectors. The companies that inserted themselves in the 1990s maintained their positioning through concessions. Throughout that decade the door to the region was through joint or consortium acquisitions; stand-alone acquisitions were more predominant in the 2000s.
While 2001-2003 may have marked the end of the Spanish investment boom in the region, subsequent investments began to take shape in new sectors as new, smaller companies ventured into the region (García-Canal and others, 2008) in new sectors (including construction, tourism, financial activities such as insurance, and even manufacturing). The amounts invested by Spanish companies during the second half of the decade were far smaller, but their business footprint became more diverse and trended more towards services. Most Spanish FDI went to Brazil, and greenfield investments became more common (García-Canal and others, 2008).10
10 At present, 20% of Spanish assets abroad are in Brazil.
Figure II.9 SPAIN: DISTRIBUTION OF OUTWARD FOREIGN DIRECT
INVESTMENT, 1996-2008 a
(Percentages)
0
10
20
30
40
50
60
70
80
90
100
1996-
-
19981997-
-
19991998-
-
20001999-
-
20012000-
-
20022001-
-
20032002-2004
2003-
-
20052004-
-
20062005-
-2007
2006-
-
2008
OthersEuropean Union United States
Rest of developed countries Latin America and the Caribbean Africa, Middle East and Oceania
-
Source: Economic Commission for Latin America and the Caribbean (ECLAC), on the basis of figures provided by the General Directorate of Foreign Trade of the Ministry of Industry, Energy and Tourism of Spain, and Observatory of Spanish Multinational Companies (OEME), “La multinacional española ante un nuevo escenario internacional”, second annual report, June 2010.
a Three-year averages.
Spanish investments have dropped off in the past few years, for both structural and situational reasons. Among the structural factors are the end of privatizations and Spain’s renewed interest in other European Union member States and other developing regions. As for the situational factors, the adverse impacts of the crisis for Spain’s economy affected its investments in the region as well. Nevertheless, their operations in the region have helped some Spanish companies weather the financial
Economic Commission for Latin America and the Caribbean (ECLAC)66
crisis. Many are seeing high profits in the region that are offsetting their performance in Europe and helping them balance their consolidated balance sheets (see section C).
Germany is one of the traditional European investors in the region, but during the 1990s German companies were not quick to seize the new opportunities afforded by economic opening. Over the past decade, German investments accounted for 4% to 7% of flows from Europe (see figure II.8) and were quite volatile (see table II.A-2). Nevertheless, the figures do show that German investments in the region are growing, from US$ 6 billion in 1999-2004 to US$ 10 billion in the second half of the decade. German investments are concentrated in terms of destination sectors and countries. In keeping with their traditional positioning, the focus has been, above all, on Brazil, Mexico and Argentina, in capital-intensive sectors where Germany has significant competitive advantages and German companies are global leaders (such as the automobile, chemical and machinery and equipment industries). Their strategy combining a search for markets for manufactured goods with horizontal FDI enabled them to take advantage of the region’s favourable economic climate over the past few years (see section C). While the amount of German FDI is not significant and the share going to the region is low (only 7% of German assets abroad are in Latin America), innovation and R&D on the part of German companies are very important for the region (see section D).
French investment also has a long history and is linked to the manufacturing sector in the larger economies of Latin America and the Caribbean. Unlike Germany, though, French companies were actively involved in the privatization processes and gained a foothold in a number of services sectors. Some of the companies that participated in privatizations subsequently withdrew; such was the case with the telecommunications sector. French investment surged starting in 2004 and has been upwards of US$ 5 billion a year since 2008. France’s share of European FDI in the region thus rose from 9% in 1999-2005 to 16% in 2006-2010 (see figure II.8). Over the past few years, French transnationals have made major acquisitions in the telecommunications and energy sectors (see chapter IV) and in some manufacturing sectors, such as the chemical industry, chiefly in Brazil: 75% of French assets in Latin America and the Caribbean are in Brazil (see table II.A-1).
The United Kingdom’s investment exposure in the region is lower; only 3% of its assets abroad are located in Latin America and the Caribbean. Its share of the flow of European investment to the region has held steady at about 12% and is concentrated in mining, some manufactures (such as food and beverages) and financial services. British companies were only marginally involved in privatizations. Italy has had a historical presence, as well, especially in traditional manufactures such as food and automobiles. Italian investment has seen substantial growth over the past
decade, going from US$ 4 billion during the first half of the decade to more than US$ 22 billion in the second half (see table II.A-1) and venturing beyond traditional manufactures to enter some service sectors. Italian transnationals with market-seeking strategies made major acquisitions in telecommunications and infrastructure. The recent surge in Italian investment in the region has driven its share of total European flows from 3% in 1999-2005 to 16% in 2006-2010 (see figure II.8).
The Netherlands is a special case, with provisions of law that have led many transnationals to locate their tax domicile there and channel substantial investment resources to third markets. Statistics published by the countries of Latin America and the Caribbean should therefore be contrasted with data from the central bank of the Netherlands. There are substantial differences in the statistical information (see box II.1). In recent years, Netherlands investment in the region has centred on Brazil and Mexico, in the form of major acquisitions in manufacturing sectors such as beverages and steel.
Balance of payments statistics do not yield a sectoral breakdown of European Union FDI in the region, making it necessary to turn to information on corporate mergers and acquisitions in search of an indicator in this regard. In Latin America and the Caribbean, funds for corporate acquisitions by European transnationals during 2000-2011 went chiefly to the services sector, at 66% of the total. Manufacturing and natural resources accounted for 24% and 10%, respectively. But there are differences between South America and Mexico, Central America and the Caribbean: while the share going to services in the two subregions was quite similar (in the area of 66%), the percentages for natural resources and manufacturing were not. In South America, natural resources and manufacturing accounted for 12% and 22%, respectively; the breakdown in Mexico, Central America and the Caribbean is 3% and 31%, respectively. Beyond these figures, which are indicative, refer only to acquisitions and do not include greenfield investments, it is clear that European investment destination sectors have been determined by production structure and international insertion of the countries sending and receiving investment flows. As a result, the focus tends to be more on natural resources in South America and on manufactures in Mexico, Central America and the Caribbean. The largest sums of European FDI in manufacturing in the Southern Cone are going to Brazil (the country in this subregion with the most diversified and complex industrial structure).
The European Union, then, has been the leading investor in Latin America and the Caribbean over the past decade, especially in the countries of South America. Despite these substantial investment streams, European

67Foreign Direct Investment in Latin America and the Caribbean • 2011
Union (above all, Spanish) interest in the region has waned over the decade as the investment focus shifted to other counties in the European Union bloc and to other developing regions. Nevertheless, the widespread privatization of State-owned assets in the region in the late 1990s was a one-time event in a particular historical
context. Even so, it is also clear that aggregate FDI data at the balance of payments level are imperfect and, while indicative of general trends, are not conclusive and should be supplemented by looking at the strategies followed by the transnational companies that are the main drivers of these investment streams.
Box II.1 THE STATISTICAL CHALLENGE OF FOREIGN DIRECT INVESTMENT AND THE ROLE
OF THE NETHERLANDS AS A FINANCIAL CENTRE
There are several problems and inconsistencies regarding statistical information on FDI flows, making comparison at the international level difficult. This challenge is compounded by factors such as the increasingly complex financial operations of transnational companies, measurement methodologies and degrees of coverage that vary from one country to the next, the existence of tax havens and the impossibility of breaking FDI down into greenfield investments and mergers and acquisitions.
First, only 12 countries of the region (the largest ones, which are also the ones that attract most of the total flows to the region) report data on the origin of FDI. There is therefore no way to conduct specific analyses of certain countries. In addition, some countries, like Brazil, do not report data on reinvested earnings. Second, the existence
of tax havens makes it difficult to determine the origin and destination of FDI, both for European investment in the region and for Latin American investment in Europe. It is estimated that the developing countries lose hundreds of billions of dollars in tax revenue as a result of tax shelter strategies followed by transnational companies in tax havens throughout the world (Oxfam, 2000 and 2011; Cobham, 2005). Third, aggregate data from EUROSTAT are sometimes inconsistent and cannot be disaggregated by country. Fourth, FDI data are adjusted over time, due to the way information is compiled and to timing adjustments to the balance of payments capital and financial account.
All the same, aggregate data from various sources on FDI between the European Union and Latin America are relatively consistent and show similar patterns (see figure 1). However, an
especially sensitive aspect of FDI between the European Union and the region has to do with the Netherlands, which has rules that make it especially attractive to transnationals as a platform for investing in third countries. Some examples are (i) the so-called ‘participation exemption’ that exempts dividends and capital gains from subsidiary companies from corporate income tax ; (ii) the large double taxation treaty network; (iii) guarantees that provide certainty as to how income from subsidiaries will be taxed; and (iv) the special tax regime for intra-company loans. These rules lead transnational companies to channel FDI, interest, dividend and royalty flows between the parent company in one country and its subsidiaries in other countries through entities located in the Netherlands (Van Dijk, Weyzig and Murphy, 2006).
Figure 1 EUROPEAN UNION: FOREIGN DIRECT INVESTMENT FLOWS IN LATIN AMERICA
AND THE CARIBBEAN, 2000-2010(Millions of dollars)
0
5 000
10 000
15 000
20 000
25 000
30 000
35 000
40 000
45 000
50 000
2000 2001 2002 2003 2004 2005 2006 2007 2008 2009 2010
Data from the central banks of Latin America and the Caribbean
Data from EUROSTAT
Source: Economic Commission for Latin America and the Caribbean (ECLAC), on the basis of data from the Statistical Office of the European Communities (EUROSTAT) and the central banks of the countries of Latin America and the Caribbean.
These peculiarities call for caution when assessing FDI flows from the Netherlands. Figure 2 shows FDI flows from the Netherlands to Brazil according to information from the central bank of Brazil and the central bank of the Netherlands.
The two series are completely different. The data compiled by the central bank of Brazil includes FDI through special financial institutions, completely distorting FDI from the Netherlands to Brazil. Contrary to the conclusion that could be drawn from the
central bank of Brazil data, the flow of investment from the Netherlands to Brazil between 2005 and 2010 has been fairly stable, at about US$ 1 billion per year.
FDI statistics are complex. And flows between the European Union and

Economic Commission for Latin America and the Caribbean (ECLAC)68
Box II.1 (concluded)
Latin America and the Caribbean exhibit significant particularities, as the case of the Netherlands shows. This highlights
the importance of supplementing FDI balance of payments statistics with other kinds of information —mergers
and acquisitions, investment projects and business strategies— to better understand the issue.
Figure 2 THE NETHERLANDS: FOREIGN DIRECT INVESTMENT FLOWS IN BRAZIL, 2000-2010
(Millions of dollars)
- 2 000
- 1 000
0
1 000
2 000
3 000
4 000
5 000
6 000
7 000
8 000
9 000
2000 2001 2002 2003 2004 2005 2006 2007 2008 2009 2010
Central bank of Brazil Central bank of the Netherlands
Source: Economic Commission for Latin America and the Caribbean (ECLAC), on the basis of official figures from the central bank of Brazil and the central bank of the Netherlands (Der Nederlandsche Bank (DNB) [online] www.dnb.nl/en/home/index.jsp).
Source: Economic Commission for Latin America and the Caribbean (ECLAC).
C. Business strategies followed by european transnationals
European Union transnational companies operate in an array of production and service sectors in Latin America and the Caribbean. Over the past decade, European companies have implemented different corporate strategies in the region (natural-resource-seeking and market-seeking) through a variety of mechanisms
(greenfield investments, mergers and acquisitions and alliances with local companies). This section describes the main strategies followed by European companies, the investment mechanisms they use and the international and regional factors that have shaped their behaviour in Latin America and the Caribbean.
1. In search of natural resources: the oil companies make their way as they go, and mining investment and profits continue to expand
Over the past few years European companies have continued to roll out active natural-resource-seeking strategies. The long tradition of European investment in such operations in the region has recently gotten an extra boost from favourable raw materials prices (see figure II.10) and high demand from emerging economies. The European companies that have most actively followed this strategy
have been British hydrocarbon and mining companies and Spanish hydrocarbon firms. Oil and mining companies are among the largest European companies operating in the region: Anglo American PLC (United Kingdom/South Africa), Royal Dutch-Shell (United Kingdom-Netherlands), Repsol (Spain) and British Petroleum (United Kingdom) (see table II.3).

69Foreign Direct Investment in Latin America and the Caribbean • 2011
Table II.3 LATIN AMERICA AND THE CARIBBEAN: LARGEST EUROPEAN UNION TRANSNATIONALS BY SALES, 2010
(Millions of dollars)
Ranking Company Country Sector Principal operations in the region Sales a
1 Telefónica de España Spain Telecommunications Argentina, Bolivarian Republic of Venezuela, Brazil, Chile, Colombia, Costa Rica, Dominican Republic, Ecuador, Guatemala, Panama, Peru
34 530
2 Carrefour France Commerce Argentina, Brazil, Colombia 18 517
3 Volkswagen Germany Automotive/auto parts Argentina, Brazil, Mexico 17 858
4 Repsol Spain Oil/gas Argentina, Bolivarian Republic of Venezuela, Brazil, Chile, Colombia, Costa Rica, Dominican Republic, Ecuador, Guatemala, Honduras, Mexico, Nicaragua, Panama, Plurinational State of Bolivia, Trinidad and Tobago, Uruguay
16 865
5 Enel Italy Energy Argentina, Brazil, Colombia, Costa Rica, Chile, Guatemala, Mexico, Panama, Peru
13 241
6 Fiat Italy Automotive/auto parts Argentina, Brazil, Mexico 12 405
7 Arcelor-Mittal Luxembourg Steel Argentina, Bolivarian Republic of Venezuela, Brazil, Costa Rica, Mexico, Trinidad and Tobago, Uruguay
11 065
8 Portugal Telecom Portugal Telecommunications Brazil 10 866
9 Telecom Italia Italy Telecommunications Argentina, Brazil 9 278
10 Unilever Netherlands/United Kingdom
Agribusiness Argentina, Bolivarian Republic of Venezuela, Brazil, Colombia, Costa Rica, Chile, Dominican Republic, Ecuador, El Salvador, Guatemala, Honduras, Mexico, Nicaragua, Panama, Paraguay, Peru, Plurinational State of Bolivia, Trinidad and Tobago, Uruguay
7 837
11 Anglo American Plc United Kingdom
Mining Bolivarian Republic of Venezuela, Brazil, Colombia, Chile, Mexico, Peru
4 131
12 British American Tobacco
United Kingdom
Tobacco Argentina, Bolivarian Republic of Venezuela, Brazil, Chile, Colombia, Dominican Republic, El Salvador, Mexico
5 407
13 Renault France Automotive/auto parts Bolivarian Republic of Venezuela, Brazil, Mexico 5 016
14 Royal Dutch‐Shell Group
Netherlands/United Kingdom
Oil/gas Argentina, Barbados, Bolivarian Republic of Venezuela, Brazil, Colombia, Chile, Dominican Republic, Mexico, Peru, Trinidad and Tobago
4 486
15 Volvo Sweden Automotive/auto parts Bolivarian Republic of Venezuela, Brazil, Mexico 4 299
16 Iberdrola Spain Energy Bolivarian Republic of Venezuela, Brazil, Honduras, Plurinational State of Bolivia
4 293
17 Bayer Germany Chemical Argentina, Bolivarian Republic of Venezuela, Brazil, Chile, Colombia, Costa Rica, Ecuador, El Salvador, Guatemala, Honduras, Jamaica, Mexico, Nicaragua, Panama, Paraguay, Peru, Plurinational State of Bolivia, Trinidad and Tobago, Uruguay
3 337
18 BASF Germany Chemical/Pharmaceutical
Argentina, Bolivarian Republic of Venezuela, Brazil, Chile, Colombia, Costa Rica, Dominican Republic, Ecuador, El Salvador, Guatemala, Haiti, Jamaica, Mexico, Nicaragua, Panama, Paraguay, Peru, Plurinational State of Bolivia, Trinidad and Tobago, Uruguay
3 317
19 Siemens Germany Electronics Argentina, Bolivarian Republic of Venezuela, Brazil, Chile, Colombia, Costa Rica, Dominican Republic, Ecuador, El Salvador, Guatemala, Mexico, Nicaragua, Panama, Paraguay, Peru, Plurinational State of Bolivia, Uruguay
3 111
20 Bosch Germany Automotive/auto parts Argentina, Brazil, Mexico, Peru 2 542
21 Peugeot Citroën France Automotive/auto parts Argentina, Brazil, Mexico 2 320
22 BHP Billiton Australia/United Kingdom
Mining Brazil, Chile, Colombia, Peru, Suriname, Trinidad and Tobago 2 013
23 Nokia Finland Electronics Brazil, Mexico 1 986
24 Philips Netherlands Electronics Brazil, Mexico 1 447
25 Danone France Food Argentina, Brazil, Chile, Colombia, Guatemala, Mexico, Uruguay
1 154
Source: Economic Commission for Latin America and the Caribbean (ECLAC), on the basis of América economía magazine and annual reports of the respective companies. a The figure for sales refers to consolidated sales for operations in Latin America and the Caribbean.

Economic Commission for Latin America and the Caribbean (ECLAC)70
Figure II.10 RAW MATERIALS PRICE INDEX, 2003-2011
(January 2003 index value=1)
0
50
100
150
200
250
300
350
400
450
500
Oil, natural gas and coal Metals
Jan
May
Sep Ja
nM
ayS
ep Jan
May
Sep Ja
nM
ayS
ep Jan
May
SepJa
nM
ay
Sep Fe
bJu
n
Oct
Jan
May Jan
May
Sep
2003 2004 2005 2006 2007 2008 2009 2010 2011
Source: Economic Commission for Latin America and the Caribbean (ECLAC), on the basis of figures provided by the International Monetary Fund.
Natural-resource-seeking strategy has been especially forceful in the Southern Cone countries, although there have also been projects in Mexico, Central America and the Caribbean. FDI destination sectors in the Southern Cone countries have tilted more towards natural resources in a process known as “reprimarization” —a shift back towards primary production (ECLAC, 2011). Over the past few years, these countries, which traditionally have been recipients of substantial amounts of FDI in natural resources, have seen this pattern take further hold, above all in the mining sector. But the hydrocarbon sector and the mining sector have followed different paths. While the hydrocarbon transnationals were the most active in major acquisitions in the late 1990s and early 2000s, it is the mining companies that have implemented the more aggressive strategies over the past few years via large acquisitions and ambitious expansion plans in the region.
There is a wide range of business strategies in the hydrocarbon sector, and they change in keeping with developments at the country level, regulatory changes (including nationalizations) and political developments because the sector is so important strategically and politically. The European companies need to position themselves in a sector dominated by large State-owned enterprises like Petrobras, PDVSA, Pemex and ECOPETROL. They have had to implement flexible strategies, adapt to regulatory changes and, in many cases, conduct important negotiations with the States. Marked price fluctuations have forced companies to constantly change their budgets and relocate assets in line with operating costs specific to each oil-producing area. European transnationals have taken an active stance and stepped up investment both for their own account and in partnership with other companies, thus helping to fuel surging investment in natural resources
in the region. Investment in the hydrocarbon sector has grown the most in Colombia and Brazil; Colombia is one of the countries most open to FDI in the sector.11 On the other hand, nationalizations and changes in the regulatory framework and in contracts between the State and companies have hampered investment in Argentina, the Bolivarian Republic of Venezuela, Ecuador and the Plurinational State of Bolivia (ECLAC, 2009).
Spain’s Repsol is one of the largest European hydrocarbon companies; it operates in 14 countries in the region, and its drive for internationalization has centred on Latin America and the Caribbean (46% of its 2010 profits came from operations in the region). Although its investments in recent years are smaller than in the 1990s (chiefly, the acquisition of YPF in Argentina), it has continued to position itself and consolidate operations in several countries via an active asset sale and purchase strategy.12 In 2005 Repsol started operating in Trinidad and Tobago by purchasing three oilfields and one gas field from British Petroleum, thereby consolidating its leadership position in the Caribbean. Over the past few years it has been part of a consortium for operating fields in the Carabobo block in the Bolivarian Republic of Venezuela, and it sold a 25% stake in YPF to Argentina’s Petersen Group and a 40% holding in Repsol Brasil to Sinopec (ECLAC, 2011).13 In Peru, Repsol started up the first liquefied gas plant in South America; the plant is yielding substantial profits. And Repsol has embarked on new exploration and drilling operations, particularly in Brazil, that are expected to boost its oil reserves significantly. In April 2012 the Government of Argentina nationalized most of Repsol’s assets in the country.
Other European companies that are actively positioning themselves in this sector in the region are Great Britain’s British Petroleum and Shell, Italy’s Eni SpA, the French company Total and Spain’s Gas Natural and CEPSA. Greenfield projects and corporate acquisitions have been announced recently. CEPSA acquired 70% of the Caracara block in Colombia from Houston American Energy, of the United States. British Petroleum began extracting natural gas in Trinidad and Tobago, as did Shell in Peru through a consortium with a United States company. PDVSA is working on agreements with European companies (such as Italy’s Eni SpA and the French company Total)
11 Between 2005 and 2010, 30% of FDI in Colombia went to the oil sector.
12 In the mid-1990s Repsol, like other Spanish firms, began to expand internationally, mainly in Latin America and the Caribbean. Its strategy was based on the acquisition of firms with a dominant position, given its own experience in managing monopoly structures (ECLAC, 2000).
13 Repsol-Sinopec is now the leading holder of exploration rights in the Espíritu Santo basin. There is widespread interest in oil exploration in Brazil.
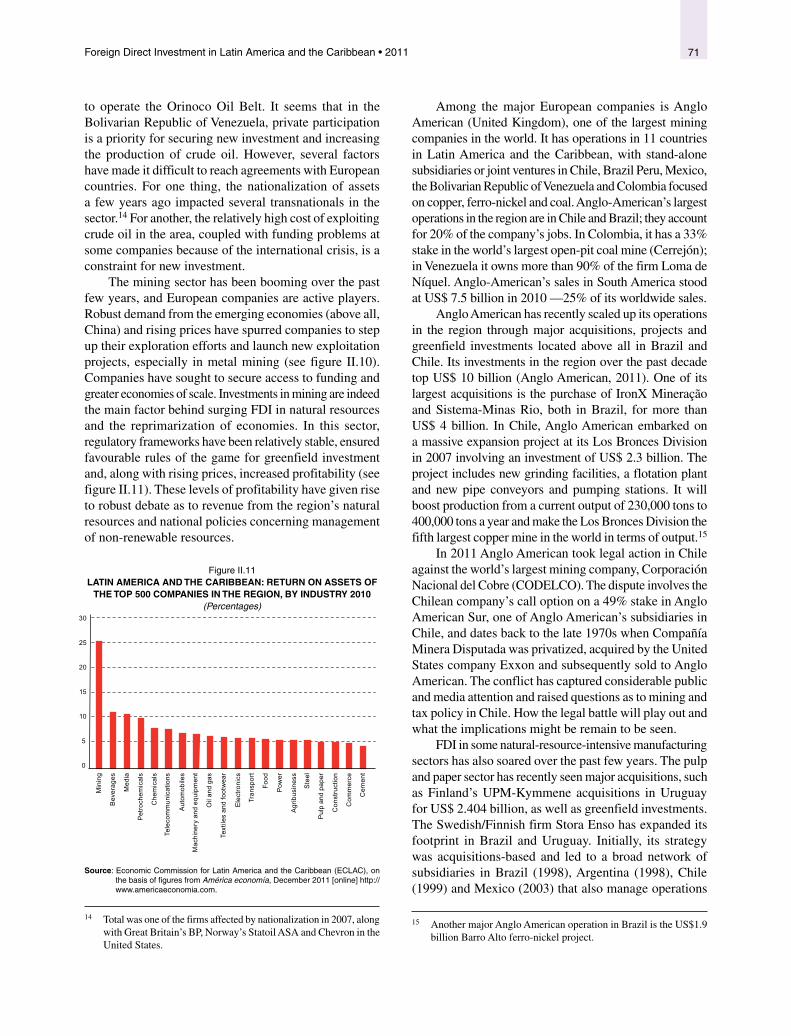
71Foreign Direct Investment in Latin America and the Caribbean • 2011
to operate the Orinoco Oil Belt. It seems that in the Bolivarian Republic of Venezuela, private participation is a priority for securing new investment and increasing the production of crude oil. However, several factors have made it difficult to reach agreements with European countries. For one thing, the nationalization of assets a few years ago impacted several transnationals in the sector.14 For another, the relatively high cost of exploiting crude oil in the area, coupled with funding problems at some companies because of the international crisis, is a constraint for new investment.
The mining sector has been booming over the past few years, and European companies are active players. Robust demand from the emerging economies (above all, China) and rising prices have spurred companies to step up their exploration efforts and launch new exploitation projects, especially in metal mining (see figure II.10). Companies have sought to secure access to funding and greater economies of scale. Investments in mining are indeed the main factor behind surging FDI in natural resources and the reprimarization of economies. In this sector, regulatory frameworks have been relatively stable, ensured favourable rules of the game for greenfield investment and, along with rising prices, increased profitability (see figure II.11). These levels of profitability have given rise to robust debate as to revenue from the region’s natural resources and national policies concerning management of non-renewable resources.
Figure II.11 LATIN AMERICA AND THE CARIBBEAN: RETURN ON ASSETS OF
THE TOP 500 COMPANIES IN THE REGION, BY INDUSTRY 2010 (Percentages)
0
5
10
15
20
25
30
Min
ing
Bev
erag
es
Med
ia
Pet
roch
emic
als
Che
mic
als
Tele
com
mun
icat
ions
Aut
omob
iles
Mac
hine
ry a
nd e
quip
men
t
Oil
and
gas
Text
iles
and
foot
wea
r
Ele
ctro
nics
Tran
spor
t
Food
Pow
er
Agr
ibus
ines
s
Ste
el
Pul
p an
d pa
per
Con
stru
ctio
n
Com
mer
ce
Cem
ent
Source: Economic Commission for Latin America and the Caribbean (ECLAC), on the basis of figures from América economía, December 2011 [online] http://www.americaeconomia.com.
14 Total was one of the firms affected by nationalization in 2007, along with Great Britain’s BP, Norway’s Statoil ASA and Chevron in the United States.
Among the major European companies is Anglo American (United Kingdom), one of the largest mining companies in the world. It has operations in 11 countries in Latin America and the Caribbean, with stand-alone subsidiaries or joint ventures in Chile, Brazil Peru, Mexico, the Bolivarian Republic of Venezuela and Colombia focused on copper, ferro-nickel and coal. Anglo-American’s largest operations in the region are in Chile and Brazil; they account for 20% of the company’s jobs. In Colombia, it has a 33% stake in the world’s largest open-pit coal mine (Cerrejón); in Venezuela it owns more than 90% of the firm Loma de Níquel. Anglo-American’s sales in South America stood at US$ 7.5 billion in 2010 —25% of its worldwide sales.
Anglo American has recently scaled up its operations in the region through major acquisitions, projects and greenfield investments located above all in Brazil and Chile. Its investments in the region over the past decade top US$ 10 billion (Anglo American, 2011). One of its largest acquisitions is the purchase of IronX Mineração and Sistema-Minas Rio, both in Brazil, for more than US$ 4 billion. In Chile, Anglo American embarked on a massive expansion project at its Los Bronces Division in 2007 involving an investment of US$ 2.3 billion. The project includes new grinding facilities, a flotation plant and new pipe conveyors and pumping stations. It will boost production from a current output of 230,000 tons to 400,000 tons a year and make the Los Bronces Division the fifth largest copper mine in the world in terms of output.15
In 2011 Anglo American took legal action in Chile against the world’s largest mining company, Corporación Nacional del Cobre (CODELCO). The dispute involves the Chilean company’s call option on a 49% stake in Anglo American Sur, one of Anglo American’s subsidiaries in Chile, and dates back to the late 1970s when Compañía Minera Disputada was privatized, acquired by the United States company Exxon and subsequently sold to Anglo American. The conflict has captured considerable public and media attention and raised questions as to mining and tax policy in Chile. How the legal battle will play out and what the implications might be remain to be seen.
FDI in some natural-resource-intensive manufacturing sectors has also soared over the past few years. The pulp and paper sector has recently seen major acquisitions, such as Finland’s UPM-Kymmene acquisitions in Uruguay for US$ 2.404 billion, as well as greenfield investments. The Swedish/Finnish firm Stora Enso has expanded its footprint in Brazil and Uruguay. Initially, its strategy was acquisitions-based and led to a broad network of subsidiaries in Brazil (1998), Argentina (1998), Chile (1999) and Mexico (2003) that also manage operations
15 Another major Anglo American operation in Brazil is the US$1.9 billion Barro Alto ferro-nickel project.
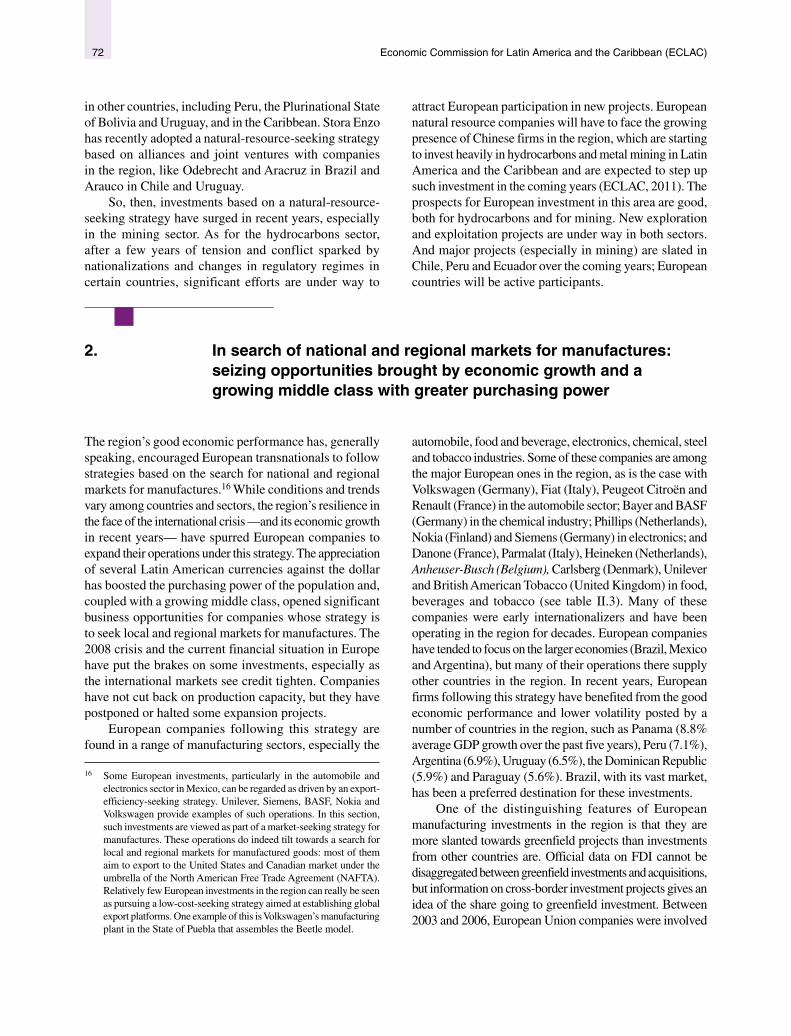
Economic Commission for Latin America and the Caribbean (ECLAC)72
in other countries, including Peru, the Plurinational State of Bolivia and Uruguay, and in the Caribbean. Stora Enzo has recently adopted a natural-resource-seeking strategy based on alliances and joint ventures with companies in the region, like Odebrecht and Aracruz in Brazil and Arauco in Chile and Uruguay.
So, then, investments based on a natural-resource-seeking strategy have surged in recent years, especially in the mining sector. As for the hydrocarbons sector, after a few years of tension and conflict sparked by nationalizations and changes in regulatory regimes in certain countries, significant efforts are under way to
attract European participation in new projects. European natural resource companies will have to face the growing presence of Chinese firms in the region, which are starting to invest heavily in hydrocarbons and metal mining in Latin America and the Caribbean and are expected to step up such investment in the coming years (ECLAC, 2011). The prospects for European investment in this area are good, both for hydrocarbons and for mining. New exploration and exploitation projects are under way in both sectors. And major projects (especially in mining) are slated in Chile, Peru and Ecuador over the coming years; European countries will be active participants.
2. In search of national and regional markets for manufactures: seizing opportunities brought by economic growth and a growing middle class with greater purchasing power
The region’s good economic performance has, generally speaking, encouraged European transnationals to follow strategies based on the search for national and regional markets for manufactures.16 While conditions and trends vary among countries and sectors, the region’s resilience in the face of the international crisis —and its economic growth in recent years— have spurred European companies to expand their operations under this strategy. The appreciation of several Latin American currencies against the dollar has boosted the purchasing power of the population and, coupled with a growing middle class, opened significant business opportunities for companies whose strategy is to seek local and regional markets for manufactures. The 2008 crisis and the current financial situation in Europe have put the brakes on some investments, especially as the international markets see credit tighten. Companies have not cut back on production capacity, but they have postponed or halted some expansion projects.
European companies following this strategy are found in a range of manufacturing sectors, especially the
16 Some European investments, particularly in the automobile and electronics sector in Mexico, can be regarded as driven by an export-efficiency-seeking strategy. Unilever, Siemens, BASF, Nokia and Volkswagen provide examples of such operations. In this section, such investments are viewed as part of a market-seeking strategy for manufactures. These operations do indeed tilt towards a search for local and regional markets for manufactured goods: most of them aim to export to the United States and Canadian market under the umbrella of the North American Free Trade Agreement (NAFTA). Relatively few European investments in the region can really be seen as pursuing a low-cost-seeking strategy aimed at establishing global export platforms. One example of this is Volkswagen’s manufacturing plant in the State of Puebla that assembles the Beetle model.
automobile, food and beverage, electronics, chemical, steel and tobacco industries. Some of these companies are among the major European ones in the region, as is the case with Volkswagen (Germany), Fiat (Italy), Peugeot Citroën and Renault (France) in the automobile sector; Bayer and BASF (Germany) in the chemical industry; Phillips (Netherlands), Nokia (Finland) and Siemens (Germany) in electronics; and Danone (France), Parmalat (Italy), Heineken (Netherlands), Anheuser-Busch (Belgium), Carlsberg (Denmark), Unilever and British American Tobacco (United Kingdom) in food, beverages and tobacco (see table II.3). Many of these companies were early internationalizers and have been operating in the region for decades. European companies have tended to focus on the larger economies (Brazil, Mexico and Argentina), but many of their operations there supply other countries in the region. In recent years, European firms following this strategy have benefited from the good economic performance and lower volatility posted by a number of countries in the region, such as Panama (8.8% average GDP growth over the past five years), Peru (7.1%), Argentina (6.9%), Uruguay (6.5%), the Dominican Republic (5.9%) and Paraguay (5.6%). Brazil, with its vast market, has been a preferred destination for these investments.
One of the distinguishing features of European manufacturing investments in the region is that they are more slanted towards greenfield projects than investments from other countries are. Official data on FDI cannot be disaggregated between greenfield investments and acquisitions, but information on cross-border investment projects gives an idea of the share going to greenfield investment. Between 2003 and 2006, European Union companies were involved
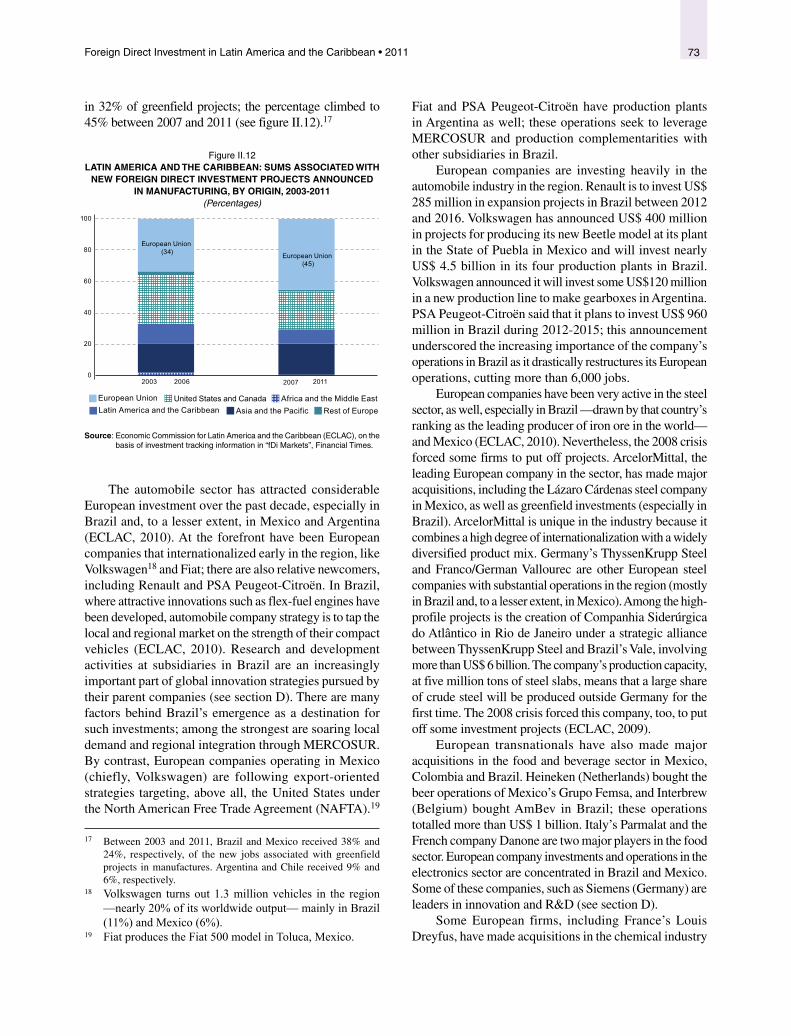
73Foreign Direct Investment in Latin America and the Caribbean • 2011
in 32% of greenfield projects; the percentage climbed to 45% between 2007 and 2011 (see figure II.12).17
Figure II.12 LATIN AMERICA AND THE CARIBBEAN: SUMS ASSOCIATED WITH
NEW FOREIGN DIRECT INVESTMENT PROJECTS ANNOUNCED IN MANUFACTURING, BY ORIGIN, 2003-2011
(Percentages)
European Union (34) European Union
(45)
0
20
40
60
80
100
2003 2006 2007 2011
European UnionRest of Europe
United States and CanadaLatin America and the Caribbean Asia and the Pacific
Africa and the Middle East
Source: Economic Commission for Latin America and the Caribbean (ECLAC), on the basis of investment tracking information in “fDi Markets”, Financial Times.
The automobile sector has attracted considerable European investment over the past decade, especially in Brazil and, to a lesser extent, in Mexico and Argentina (ECLAC, 2010). At the forefront have been European companies that internationalized early in the region, like Volkswagen18 and Fiat; there are also relative newcomers, including Renault and PSA Peugeot-Citroën. In Brazil, where attractive innovations such as flex-fuel engines have been developed, automobile company strategy is to tap the local and regional market on the strength of their compact vehicles (ECLAC, 2010). Research and development activities at subsidiaries in Brazil are an increasingly important part of global innovation strategies pursued by their parent companies (see section D). There are many factors behind Brazil’s emergence as a destination for such investments; among the strongest are soaring local demand and regional integration through MERCOSUR. By contrast, European companies operating in Mexico (chiefly, Volkswagen) are following export-oriented strategies targeting, above all, the United States under the North American Free Trade Agreement (NAFTA).19
17 Between 2003 and 2011, Brazil and Mexico received 38% and 24%, respectively, of the new jobs associated with greenfield projects in manufactures. Argentina and Chile received 9% and 6%, respectively.
18 Volkswagen turns out 1.3 million vehicles in the region —nearly 20% of its worldwide output— mainly in Brazil (11%) and Mexico (6%).
19 Fiat produces the Fiat 500 model in Toluca, Mexico.
Fiat and PSA Peugeot-Citroën have production plants in Argentina as well; these operations seek to leverage MERCOSUR and production complementarities with other subsidiaries in Brazil.
European companies are investing heavily in the automobile industry in the region. Renault is to invest US$ 285 million in expansion projects in Brazil between 2012 and 2016. Volkswagen has announced US$ 400 million in projects for producing its new Beetle model at its plant in the State of Puebla in Mexico and will invest nearly US$ 4.5 billion in its four production plants in Brazil. Volkswagen announced it will invest some US$120 million in a new production line to make gearboxes in Argentina. PSA Peugeot-Citroën said that it plans to invest US$ 960 million in Brazil during 2012-2015; this announcement underscored the increasing importance of the company’s operations in Brazil as it drastically restructures its European operations, cutting more than 6,000 jobs.
European companies have been very active in the steel sector, as well, especially in Brazil —drawn by that country’s ranking as the leading producer of iron ore in the world— and Mexico (ECLAC, 2010). Nevertheless, the 2008 crisis forced some firms to put off projects. ArcelorMittal, the leading European company in the sector, has made major acquisitions, including the Lázaro Cárdenas steel company in Mexico, as well as greenfield investments (especially in Brazil). ArcelorMittal is unique in the industry because it combines a high degree of internationalization with a widely diversified product mix. Germany’s ThyssenKrupp Steel and Franco/German Vallourec are other European steel companies with substantial operations in the region (mostly in Brazil and, to a lesser extent, in Mexico). Among the high-profile projects is the creation of Companhia Siderúrgica do Atlântico in Rio de Janeiro under a strategic alliance between ThyssenKrupp Steel and Brazil’s Vale, involving more than US$ 6 billion. The company’s production capacity, at five million tons of steel slabs, means that a large share of crude steel will be produced outside Germany for the first time. The 2008 crisis forced this company, too, to put off some investment projects (ECLAC, 2009).
European transnationals have also made major acquisitions in the food and beverage sector in Mexico, Colombia and Brazil. Heineken (Netherlands) bought the beer operations of Mexico’s Grupo Femsa, and Interbrew (Belgium) bought AmBev in Brazil; these operations totalled more than US$ 1 billion. Italy’s Parmalat and the French company Danone are two major players in the food sector. European company investments and operations in the electronics sector are concentrated in Brazil and Mexico. Some of these companies, such as Siemens (Germany) are leaders in innovation and R&D (see section D).
Some European firms, including France’s Louis Dreyfus, have made acquisitions in the chemical industry

Economic Commission for Latin America and the Caribbean (ECLAC)74
in Brazil. The cosmetics and cleaning product sector is a traditional target for European corporate investment in the region, both through acquisitions and through greenfield projects. Germany’s Henkel has two regional facilities (in Mexico and Brazil); it is following an acquisition-based strategy focused on Mexico. Over the past decade Henkel bought Salgado, Desc, Mas and Alba Adhesivos (Henkel, 2011). France’s L’Oréal has followed a strategy combining acquisitions and greenfield investments. Over the past decade it has acquired several companies in the region (Colorama in Brazil and Miss Ylang in Argentina)
and has implemented significant greenfield projects as well. In 2001, L’Oréal announced a new manufacturing plant in Mexico that will supply the United States and Canadian market (L’Oréal, 2011).
European companies whose strategy is to seek local and regional markets for manufactures have, then, been very active in recent years. These firms have benefited from the region’s good economic performance, lower volatility and growing purchasing power. It bears noting that behind this generalization lie many national situations, as well as specificities at the sector and individual company level.
3. In search of service markets: the region goes from loss-maker to lifeline during the crisis
Starting in the 1990s, structural reforms and, above all, the wide-ranging privatization of State assets ushered in a new era for FDI and for European companies operating in service subsectors in the region. Investment in telecommunications, energy, banking and infrastructure jumped, usually linked to the purchase of State assets or subsequent intra-company purchases of previously public assets. This was particularly relevant for Spanish firms,20 but some Portuguese, French and Italian companies were involved as well. European companies were involved in some of the largest acquisitions in the region, making them leaders in their markets. Spanish firms in particular saw in the region an opportunity for needed growth as Spain faced new patterns of competition following its entry into the European Union (ECLAC, 2002). At the head of this process was a handful of major companies: Telefónica in telecommunications, Endesa in energy and the banks Santander and BBVA in the financial sector. Other European firms with a high profile in the region are Vivendi and Telecom Italia in telecommunications and Enel, Électricité de France (EDF) and Unión Fenosa in energy.
But the early 2000s were rough for European companies —especially for Spanish firms. The Argentine crisis of 2001 dealt a severe blow to companies that were operating in a regulated environment. Many were forced to consolidate
20 Between 2000 and 2010, 86% of Spanish FDI in the region went to the service sector. This process started in the 1990s, when large Spanish companies (medium-sized in European and global terms) were forced into an active international expansion strategy in order to become more competitive and avoid hostile takeover by their European competitors. To this end they drew on massive surpluses generated in the local market thanks to their natural monopoly status in some sectors and the booming stock market, enabling them to raise capital for funding ambitious expansion plans.
the heavy outlays they had made, by restructuring principal subsidiaries in the region. The decade also brought problems in the wake of regulatory changes that shifted patterns of competition in some sectors, especially in the Bolivarian Republic of Venezuela and the Plurinational State of Bolivia; this impacted the operations and investments of some European companies. The situation has changed substantially in recent years, however. Companies have begun to benefit from the region’s good economic performance and growing political and regulatory stability, and from rising demand for services on the part of a population whose purchasing power is growing. Privatizations have come to an end; the acquisitions that are taking place are linked to corporate positioning strategies. The main problems in investing in service sectors have to do with the regulatory environment and patterns of competition in individual countries. This is increasingly challenging the capacity and objectives of the region’s regulatory agencies overseeing services such as telecommunications and energy.21
The operations of major European companies in the service sector are now in a phase marked by greater stability and consolidation; most of them are following strategies for the long run. Instead of major acquisitions and subsequent sale of assets, the priority is to consolidate through long-term strategies, develop economies of scale and gain market share with high profit margins in order to ensure a solid global position. For some companies (especially Spanish
21 See chapter IV for a more detailed discussion of the energy sector and new ventures on the part of European companies in the field of renewable and non-conventional energies. For an assessment of FDI and business strategies in the telecommunications sector, see ECLAC (2011 and 2008). For the tourism and software sectors, see ECLAC (2009 and 2011), respectively.
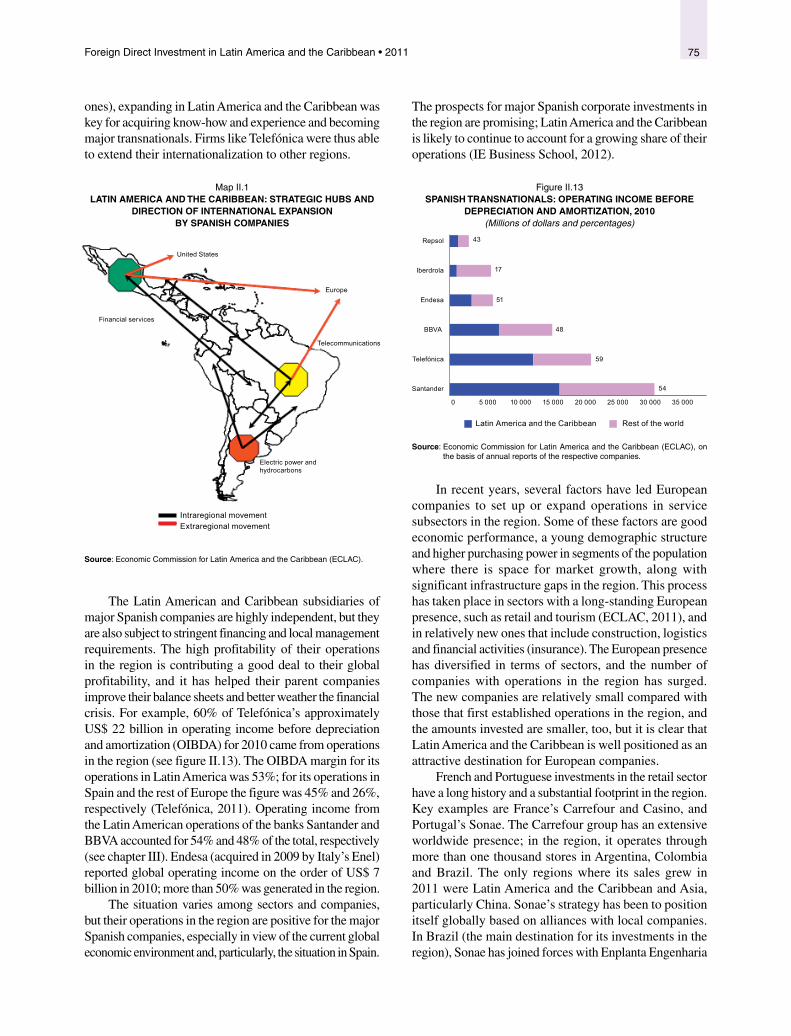
75Foreign Direct Investment in Latin America and the Caribbean • 2011
ones), expanding in Latin America and the Caribbean was key for acquiring know-how and experience and becoming major transnationals. Firms like Telefónica were thus able to extend their internationalization to other regions.
Map II.1 LATIN AMERICA AND THE CARIBBEAN: STRATEGIC HUBS AND
DIRECTION OF INTERNATIONAL EXPANSION BY SPANISH COMPANIES
United States
Europe
Financial services
Telecommunications
Electric power and hydrocarbons
Intraregional movementExtraregional movement
Source: Economic Commission for Latin America and the Caribbean (ECLAC).
The Latin American and Caribbean subsidiaries of major Spanish companies are highly independent, but they are also subject to stringent financing and local management requirements. The high profitability of their operations in the region is contributing a good deal to their global profitability, and it has helped their parent companies improve their balance sheets and better weather the financial crisis. For example, 60% of Telefónica’s approximately US$ 22 billion in operating income before depreciation and amortization (OIBDA) for 2010 came from operations in the region (see figure II.13). The OIBDA margin for its operations in Latin America was 53%; for its operations in Spain and the rest of Europe the figure was 45% and 26%, respectively (Telefónica, 2011). Operating income from the Latin American operations of the banks Santander and BBVA accounted for 54% and 48% of the total, respectively (see chapter III). Endesa (acquired in 2009 by Italy’s Enel) reported global operating income on the order of US$ 7 billion in 2010; more than 50% was generated in the region.
The situation varies among sectors and companies, but their operations in the region are positive for the major Spanish companies, especially in view of the current global economic environment and, particularly, the situation in Spain.
The prospects for major Spanish corporate investments in the region are promising; Latin America and the Caribbean is likely to continue to account for a growing share of their operations (IE Business School, 2012).
Figure II.13
SPANISH TRANSNATIONALS: OPERATING INCOME BEFORE DEPRECIATION AND AMORTIZATION, 2010
(Millions of dollars and percentages)
0 5 000 10 000 15 000 20 000 25 000 30 000 35 000
Santander
Telefónica
BBVA
Endesa
Iberdrola
Repsol
Latin America and the Caribbean Rest of the world
54
59
48
51
17
43
Source: Economic Commission for Latin America and the Caribbean (ECLAC), on the basis of annual reports of the respective companies.
In recent years, several factors have led European companies to set up or expand operations in service subsectors in the region. Some of these factors are good economic performance, a young demographic structure and higher purchasing power in segments of the population where there is space for market growth, along with significant infrastructure gaps in the region. This process has taken place in sectors with a long-standing European presence, such as retail and tourism (ECLAC, 2011), and in relatively new ones that include construction, logistics and financial activities (insurance). The European presence has diversified in terms of sectors, and the number of companies with operations in the region has surged. The new companies are relatively small compared with those that first established operations in the region, and the amounts invested are smaller, too, but it is clear that Latin America and the Caribbean is well positioned as an attractive destination for European companies.
French and Portuguese investments in the retail sector have a long history and a substantial footprint in the region. Key examples are France’s Carrefour and Casino, and Portugal’s Sonae. The Carrefour group has an extensive worldwide presence; in the region, it operates through more than one thousand stores in Argentina, Colombia and Brazil. The only regions where its sales grew in 2011 were Latin America and the Caribbean and Asia, particularly China. Sonae’s strategy has been to position itself globally based on alliances with local companies. In Brazil (the main destination for its investments in the region), Sonae has joined forces with Enplanta Engenharia

Economic Commission for Latin America and the Caribbean (ECLAC)76
in managing shopping centres in several cities (ECLAC, 2007). Studies show that this sector has good potential for investment growth in the coming years, especially in Uruguay, Chile and Brazil (ATKearney, 2011).
In the construction sector, several European companies (mostly Spanish, such as Sacyr Vallehermoso, Acciona, ACS and Ferrovial, but some German ones, too) have been setting up operations in the region. Significant business opportunities and wide-ranging concession programmes in the region have drawn these Spanish firms to set up operations and thus offset the construction industry’s situation in their home market. In 2006, Sacyr acquired a 50% stake in Europistas, a highway concession operator with operations in Chile, Brazil and Costa Rica.
Other service sectors that have been a significant draw for European companies are logistics, media, financial services (see chapter III) and casinos. The German global logistics firm DHL has a large footprint in the region. In recent years, facing substantial increases in the price of fuel, an essential input for its operations, DHL has restructured drastically and consolidated its operations worldwide. In Europe, it dramatically cut back its investment plans. By contrast, in Latin America and the Caribbean DHL has stepped up its investments in the light of good prospects for market growth in the next few years. It has a pipeline of several greenfield projects in the region; in 2008 it opened two new operating hubs (one in Panama and one in Mexico), four sales centres in Brazil and a customer service centre in Argentina. In 2009, DHL opened, in Mexico, its most advanced dispatch port and call center in the region. And the media subsector is seeing investments from companies that are not global heavyweights but do, like Spain’s PRISA group, have a dominant position in the region.
On the other hand, investments in certain financial sectors reveal the difficulties that some European companies have encountered in the region and that have, in a few cases, even forced them out of their market position. For example, the commercial banking, investment management and insurance group ING (Netherlands) had operations in Brazil, Argentina, Peru, Mexico and Chile and a positioning strategy including acquisitions, expansion projects and alliances with domestic firms (like Peru’s AFP Integra pension fund manager). In Argentina, ING acquired Orígenes AFJP and Orígenes Seguros de Retiro in 2007. But ING was hit hard by the crisis and decided to divest all of its investments in the Latin American insurance sector by 2013. The goal is to scale down and focus on the European market. ING assets in the region, including those in Colombia, Mexico, Chile, Peru and Uruguay, were purchased by Colombia’s Grupo Suramericana for US$ 3.6 billion. ING’s decision is linked to the terms of a sizeable loan from the Government of the Netherlands during the 2008 financial crisis. The crisis, then, has forced the company to virtually withdraw from the Latin
American market, although it will maintain its commercial banking operations in Mexico.
In the gambling casino sector, the Spanish group Codere is pursuing an active expansion strategy in the region, issuing bonds to fund new acquisitions and, potentially, listing its operations in the region on the stock market. Noteworthy among its acquisitions is the takeover of CIE Las Américas in Mexico in 2012.
European transnationals have a large and, in some cases, long-standing presence in Latin America and the Caribbean. This makes it hard to list all of the economic and social impacts of their operations in the region, although some can be highlighted (see table II.4). Investments associated with natural-resource-seeking strategies have had a substantial impact on exports, especially in the countries of South America. Such operations promote job creation in non-urban areas and in related infrastructure, thus improving social inclusion in isolated communities. Among the issues that have surfaced are their minimal production integration with the local economy, problems with local communities and environmental pollution.
European investments under a strategy to seek markets for manufactures also have socioeconomic impacts. They include rising exports (automobile industry), the creation of jobs and production linkages (food and beverages, chemicals, automobile industry), innovation, R&D and technology transfer (automobiles and electronics) (see section D), as well as enhanced production and export capacity thanks to European corporate investments in greenfield manufacturing projects. Many of these investments are associated with creating and building capacity and generating highly skilled jobs in the region, especially in Brazil. Challenges and issues have to do with insufficient linkages, dependence on imported inputs and low value added in some areas (assembly operations in Mexico, for example), low labour intensity (due in part to the nature of individual sectors, such as the steel industry) and environmental pollution (chemicals) (see table II.4).
Investments under service-market-seeking strategies are increasing the population’s access to telecommunications (ECLAC, 2011) and electric power (see chapter IV). This has clearly boosted social inclusion (by, for example, widespread electrification and greater access to and use of information and communication technologies), but there are still marked divides because services such as telecommunications and banking are concentrated in medium and high socioeconomic segments. The main issues and difficulties here have to do with regulatory frameworks in individual countries and sectors (see chapter IV for the power and renewable and non-conventional energy sector) and negative impacts on the environment and on indigenous communities. In the banking sector, private investment is having a crowding-out effect on local and development banks (see chapter III).

77Foreign Direct Investment in Latin America and the Caribbean • 2011
\Tab
le II
.4
LA
TIN
AM
ER
ICA
AN
D T
HE
CA
RIB
BE
AN
: EU
RO
PE
AN
TR
AN
SN
AT
ION
AL
S
Sec
tors
Ups
ides
Cha
lleng
es a
nd is
sues
Cou
ntrie
sS
trat
egie
sE
xpor
tsLi
nkag
esG
reen
field
FD
IIn
nova
tion
and
R&
DS
yste
m
com
petit
iven
ess
Nat
ura
l res
ou
rces
Nat
ural
-res
ourc
e-se
ekin
gO
il an
d ga
sH
igh
Hig
hE
nviro
nmen
tal p
ollu
tion,
was
te
man
agem
ent.
Bra
zil,
Ecu
ador
, Bol
ivar
ian
Rep
ublic
of
Ven
ezue
la, A
rgen
tina,
C
olom
bia
Min
ing
Hig
hH
igh
Enc
lave
ope
ratio
ns w
ith lo
w p
roce
ssin
g co
nten
t. E
nviro
nmen
tal p
ollu
tion
and
was
te m
anag
emen
t. Is
sues
with
loca
l co
mm
uniti
es.
Bra
zil,
Chi
le, C
olom
bia,
Per
u
Man
ufa
ctu
rin
gM
arke
t-se
ekin
g
Foo
dH
igh
Mod
erat
eA
rgen
tina,
Bra
zil,
Chi
le, M
exic
o,
Col
ombi
a
Aut
omob
ile (
1)H
igh
Hig
h H
igh
Trad
e de
ficit.
Bra
zil,
Arg
entin
a
Ele
ctro
nics
(1)
Mod
erat
eM
oder
ate
Doe
s no
t cre
ate
a so
lid te
chno
logy
and
sc
ienc
e ba
se.
Bra
zil,
Arg
entin
a
Ste
elM
oder
ate
Mod
erat
eM
inim
al c
reat
ion
of li
nkag
es a
nd
non-
labo
ur-in
tens
ive
oper
atio
ns.
Env
ironm
enta
l pol
lutio
n.
Bra
zil,
Mex
ico
Che
mic
als
Mod
erat
eM
oder
ate
Mod
erat
eE
nviro
nmen
tal p
ollu
tion.
Bra
zil,
Mex
ico
Aut
omob
ile (
2)H
igh
Hig
h M
oder
ate
Mod
erat
eD
omes
tic m
arke
t has
not
sup
plem
ente
d ex
port
s. D
epen
denc
e on
impo
rted
co
mpo
nent
s.
Mex
ico
Exp
ort-
effic
ienc
y-se
ekin
g
Ele
ctro
nics
(2)
Hig
hM
oder
ate
Low
val
ue a
dded
, foc
us o
n st
atic
ad
vant
ages
, dep
ende
nce
on im
port
ed
com
pone
nts.
Mex
ico
Ser
vice
s
Mar
ket-
seek
ing
Ban
king
Mod
erat
eM
oder
ate
Mod
erat
eP
rivat
e in
vest
men
t cro
wdi
ng o
ut lo
cal
and
deve
lopm
ent b
anks
M
exic
o, A
rgen
tina,
Chi
le, C
olom
bia
Ele
ctric
al p
ower
Mod
erat
eH
igh
Wea
k re
gula
tory
env
ironm
ents
, en
viro
nmen
tal i
mpa
cts.
Chi
le, A
rgen
tina,
Per
u
Ren
ewab
le a
nd n
on-
conv
entio
nal e
nerg
yH
igh
Hig
hW
eak
regu
lato
ry e
nviro
nmen
tsB
razi
l, M
exic
o, U
rugu
ay, P
anam
a
Tele
com
mun
icat
ions
Hig
hM
oder
ate
Hig
hM
arke
ts w
ith p
robl
ems
of s
cale
for
tran
sfer
ring
tech
nolo
gica
l adv
ance
s an
d re
duci
ng r
ates
Latin
Am
eric
a an
d th
e C
arib
bean
Tour
ism
Mod
erat
eH
igh
Str
ong
envi
ronm
enta
l im
pact
Mex
ico,
Bra
zil,
Cen
tral
Am
eric
a an
d th
e C
arib
bean
Com
mer
ceH
igh
Hig
hP
robl
ems
with
sup
plie
rs, c
ompl
aint
s ab
out w
orki
ng c
ondi
tions
Mex
ico,
Bra
zil,
Arg
entin
a, C
olom
bia
So
urc
e: E
cono
mic
Com
mis
sion
for
Latin
Am
eric
a an
d th
e C
arib
bean
(E
CLA
C).
Economic Commission for Latin America and the Caribbean (ECLAC)78
Some of these traits show the nature of European FDI and the spheres in which it promotes social inclusion in the region. In those sectors where difficulties and issues arise, the countries need to improve their regulatory frameworks and the fit between European
investments and reality in Latin America, promote the benefits and potential of FDI and the corporate stock of knowledge while ensuring environmentally friendly investment and compliance with environmental protection standards.
D. European transnationals and research and development
Transnational companies from the European Union have such a wide footprint in Latin America and the Caribbean that it is hard to catalogue them all. However, as seen below, their research and development activities are very important for the region. This section first discusses
the internationalization of R&D, the role that European transnationals are playing in the process and how Latin America and the Caribbean is positioned. It then looks at European corporate R&D in the region as a key to assessing the most powerful and permanent impacts of FDI.
1. Transnational companies and the internationalization of research and development: the region is not the prime destination for European companies
Over the past few decades, globalization has woven a tighter fabric of global interdependence; transnational companies and technological change are at the centre of the process. These companies are a driving force behind the internationalization of innovation and R&D (UNCTAD, 2005).22 They are seeking to improve the use of existing assets so as to leverage their competitive advantages in response to international market scenarios. And they have a strategic rationale: boost their own capacities and thereby create, absorb or internalize new technological assets (Narula and Zanfei, 2008; Griffith, Redding and Van Reenen, 2004). In this setting, the factors that transnationals weigh when deciding where to locate their R&D centres, especially when developing countries are involved, include market potential and the quality of human resources, cooperation with other agents in the national innovation system and intellectual property regimes.
In the past decade, transnational companies have stepped up investments in R&D outside their home country (Hall,
22 Corporate R&D may be defined as work undertaken on a systematic basis in order to increase the stock of knowledge, and the use of this stock of knowledge to devise new applications. It includes basic research, applied research and experimental development (OECD, 2002). It has been estimated that the 700 major transnationals account for 70% of private spending on R&D.
2010), for a variety of reasons. Among them are stiffer global competition and the need for companies to acquire, generate and tailor their matrix of capacities as conditions change; the nature of and advances in information and communication technologies in various stages of development (which has helped scale back the minimum size of R&D laboratories), growing opportunities for companies to partner with other agents (such as universities) as they seek to tap into complementarities; and the increasing availability of skilled human capital in emerging countries (Moncada-Paternò-Castello, Vivarelli and Voigt, 2011).
The share of spending that European transnationals allocated to R&D jumped from 26% in 1995 to 44% in 2004. Japanese transnationals went from 5% to 11% and United States transnationals from 23% to 32% (OECD, 2005). Many greenfield projects associated with R&D centres are being located outside these companies’ home countries —increasingly in the emerging countries of Asia, especially China and India. R&D spending in Asian countries has surpassed European Union levels and is expected to top United States levels in the next few years thanks primarily to marked increases in China (Goldman Sachs, 2010).
There are several ways to class R&D centres at subsidiaries of transnational companies in emerging countries. Borini, Oliveira and Guevara (2005) group them

79Foreign Direct Investment in Latin America and the Caribbean • 2011
as follows: (i) traditional subsidiaries, where decision-making and innovation are more centralized at the parent company; (ii) subsidiaries with limited relevance, where innovation is implemented from the parent company but the subsidiary is more integrated in global business networks and has more potential for playing a strategic role; and (iii) strategically relevant subsidiaries with strategic competencies and more decision-making autonomy, where patterns of innovation can be parent-to-subsidiary or vice versa (global-local or local-global, respectively).
Obviously, the flow of knowledge between parent company and subsidiaries (and thus the flow of benefits to FDI recipient countries) depends on the nature of the subsidiaries and on the rationale for internationalizing R&D. The more the rationale has to do with better using and exploiting technology assets and existing capacities at the firm, the greater the flow of knowledge from parent company to subsidiaries. Conversely, where R&D is being
internationalized to create and absorb new knowledge, the greater the flow of knowledge from subsidiaries to parent company will be (Narula and Zanfei, 2008).
The benefits of internationalizing R&D for the home country and the recipient country encompass several dimensions (see table II.5). Potential benefits for the recipient country include local technical capacity building, highly skilled jobs, human resource development and productivity spillovers (through demonstration and competition effects). Potential benefits for home economies involve access to new sources of knowledge and expertise, greater and better access to external markets, new knowledge to be harnessed in home markets and longer product life cycles. On a more general level, R&D at transnational companies is shaped by the nature of the subsidiaries —something that the empirical and theoretical literature on the impacts of FDI and transnational companies on developing countries has been examining more closely in the past decade (see box II.2).
Table II.5 TRANSNATIONAL COMPANIES: DRIVING FACTORS AND MAIN IMPACTS OF THE INTERNATIONALIZATION
OF CORPORATE RESEARCH AND DEVELOPMENT ACTIVITIES
Potential impacts On host country On home country
Potentialities
- More linkages and increased local technical capability
- Productivity increase
- Highly skilled jobs and job training
- Increased R&D by domestic companies
- Sales growth
- Knowledge and economic spillovers (demonstration and competition effects)
- Access to other sources of knowledge and expertise
- Enhanced access to foreign markets (sales growth)
- Results of R&D done abroad may be exploited at home
- Longer product life cycle
Risks
- Foreign control over domestic R&D resources
- Delocalization of activities
- Decrease in R&D impact when/if their links with production get weaker
- Loss of technical capability
- Loss of jobs in the short-term
- Negative impact on industrial diversification
Source: Economic Commission for Latin America and the Caribbean (ECLAC), on the basis of P. Moncada-Paternò-Castello, M. Vivarelli and P. Voigt, “Drivers and impacts in the globalization of corporate R&D: an introduction based on the European experience”, Industrial and Corporate Change, vol. 20, No. 2, 2011.
Box II.2 IMPACT OF FDI IN LATIN AMERICA AND THE CARIBBEAN: THE ROLE OF SUBSIDIARIES
The impact of FDI in developing countries has always been a controversial issue involving the capacities and characteristics of transnational companies, the absorption capacity of recipient economies and their national innovation systems and complementarities with local investment, among other factors (Cohen, 2007).a This
being the case, empirical and theoretical studies are focusing more and more on the characteristics of subsidiaries because they can determine how FDI impacts the generation of linkages and the enhancement of productivity in the local economy. These characteristics refer to key factors, such as corporate
strategy and sector of activity, and to others that include technological capacity, interconnection with the global value chain and integration in knowledge networks. These characteristics of subsidiaries also apply to potential R&D activities, albeit in a broader sense and referring to company operations as a whole.
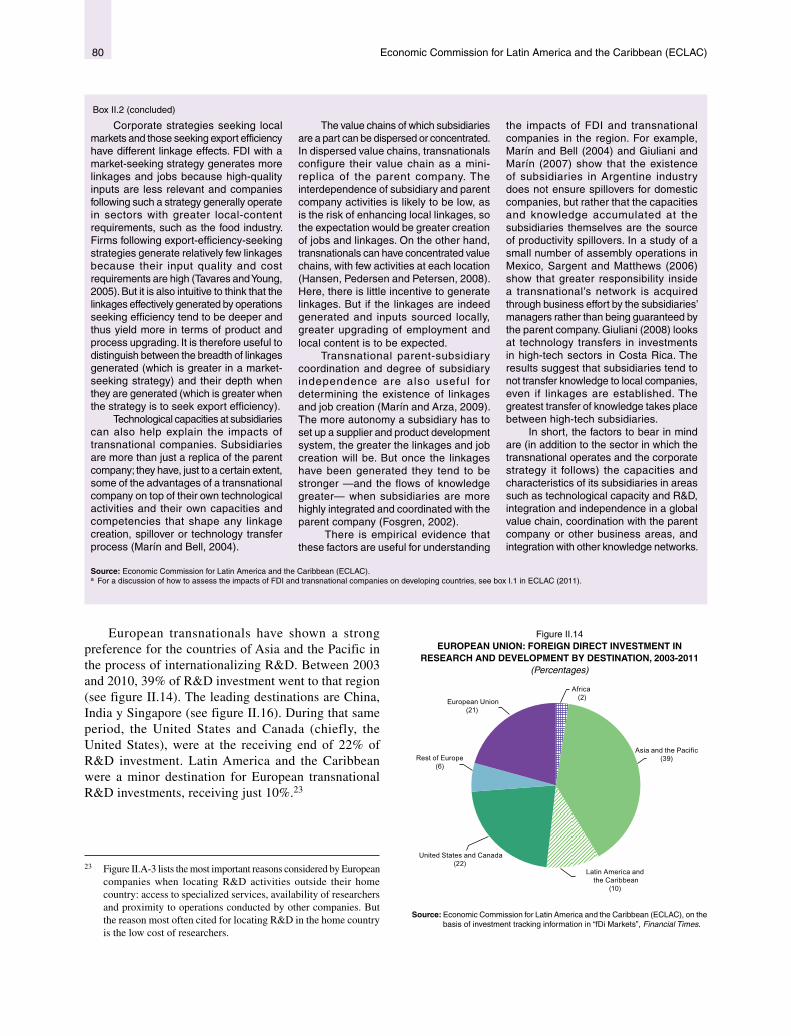
Economic Commission for Latin America and the Caribbean (ECLAC)80
European transnationals have shown a strong preference for the countries of Asia and the Pacific in the process of internationalizing R&D. Between 2003 and 2010, 39% of R&D investment went to that region (see figure II.14). The leading destinations are China, India y Singapore (see figure II.16). During that same period, the United States and Canada (chiefly, the United States), were at the receiving end of 22% of R&D investment. Latin America and the Caribbean were a minor destination for European transnational R&D investments, receiving just 10%.23
23 Figure II.A-3 lists the most important reasons considered by European companies when locating R&D activities outside their home country: access to specialized services, availability of researchers and proximity to operations conducted by other companies. But the reason most often cited for locating R&D in the home country is the low cost of researchers.
Figure II.14 EUROPEAN UNION: FOREIGN DIRECT INVESTMENT IN
RESEARCH AND DEVELOPMENT BY DESTINATION, 2003-2011 (Percentages)
Africa (2)
Asia and the Pacific(39)
Latin America and the Caribbean
(10)
United States and Canada(22)
Rest of Europe(6)
European Union(21)
Source: Economic Commission for Latin America and the Caribbean (ECLAC), on the basis of investment tracking information in “fDi Markets”, Financial Times.
Source: Economic Commission for Latin America and the Caribbean (ECLAC). a For a discussion of how to assess the impacts of FDI and transnational companies on developing countries, see box I.1 in ECLAC (2011).
Corporate strategies seeking local markets and those seeking export efficiency have different linkage effects. FDI with a market-seeking strategy generates more linkages and jobs because high-quality inputs are less relevant and companies following such a strategy generally operate in sectors with greater local-content requirements, such as the food industry. Firms following export-efficiency-seeking strategies generate relatively few linkages because their input quality and cost requirements are high (Tavares and Young, 2005). But it is also intuitive to think that the linkages effectively generated by operations seeking efficiency tend to be deeper and thus yield more in terms of product and process upgrading. It is therefore useful to distinguish between the breadth of linkages generated (which is greater in a market-seeking strategy) and their depth when they are generated (which is greater when the strategy is to seek export efficiency).
Technological capacities at subsidiaries can also help explain the impacts of transnational companies. Subsidiaries are more than just a replica of the parent company; they have, just to a certain extent, some of the advantages of a transnational company on top of their own technological activities and their own capacities and competencies that shape any linkage creation, spillover or technology transfer process (Marín and Bell, 2004).
The value chains of which subsidiaries are a part can be dispersed or concentrated. In dispersed value chains, transnationals configure their value chain as a mini-replica of the parent company. The interdependence of subsidiary and parent company activities is likely to be low, as is the risk of enhancing local linkages, so the expectation would be greater creation of jobs and linkages. On the other hand, transnationals can have concentrated value chains, with few activities at each location (Hansen, Pedersen and Petersen, 2008). Here, there is little incentive to generate linkages. But if the linkages are indeed generated and inputs sourced locally, greater upgrading of employment and local content is to be expected.
Transnational parent-subsidiary coordination and degree of subsidiary independence are also useful for determining the existence of linkages and job creation (Marín and Arza, 2009). The more autonomy a subsidiary has to set up a supplier and product development system, the greater the linkages and job creation will be. But once the linkages have been generated they tend to be stronger —and the flows of knowledge greater— when subsidiaries are more highly integrated and coordinated with the parent company (Fosgren, 2002).
There is empirical evidence that these factors are useful for understanding
the impacts of FDI and transnational companies in the region. For example, Marín and Bell (2004) and Giuliani and Marín (2007) show that the existence of subsidiaries in Argentine industry does not ensure spillovers for domestic companies, but rather that the capacities and knowledge accumulated at the subsidiaries themselves are the source of productivity spillovers. In a study of a small number of assembly operations in Mexico, Sargent and Matthews (2006) show that greater responsibility inside a transnational’s network is acquired through business effort by the subsidiaries’ managers rather than being guaranteed by the parent company. Giuliani (2008) looks at technology transfers in investments in high-tech sectors in Costa Rica. The results suggest that subsidiaries tend to not transfer knowledge to local companies, even if linkages are established. The greatest transfer of knowledge takes place between high-tech subsidiaries.
In short, the factors to bear in mind are (in addition to the sector in which the transnational operates and the corporate strategy it follows) the capacities and characteristics of its subsidiaries in areas such as technological capacity and R&D, integration and independence in a global value chain, coordination with the parent company or other business areas, and integration with other knowledge networks.
Box II.2 (concluded)

81Foreign Direct Investment in Latin America and the Caribbean • 2011
2. Innovation and research and development at subsidiaries of European companies in the region: Brazil consolidates its leadership
Innovation and R&D at transnational companies, whether they are based in Europe or elsewhere, have varying degrees of relevance among the countries of Latin America and the Caribbean. Although statistical evidence at the microdata level is not strictly comparable from one country to another, covers different periods and sectors and has its own limitations, it does cast some light on the issue when larger economies are involved. Subsidiaries of transnational companies in Brazil and Argentina figure relatively heavily in manufacturing innovation and R&D. In Brazil, subsidiaries of transnationals account for 35% of sales and some 47% of spending on R&D. In Argentina, they make up nearly 50% of R&D spending (De Negri and Laplane, 2009). In Brazil and Argentina, transnationals account for nearly 42% of overall spending on innovation.24 By contrast, in Mexico and Chile transnational companies play a smaller role in innovation and R&D. In the case of Chile, statistical information for 2005 suggests that transnational companies are spending more on R&D but still account for a relatively low share, in the area of 12% (Vergara, 2012). In Mexico, subsidiaries of transnationals account for some 25% of R&D spending (De Negri and Laplane, 2009).
Information from microdata on these countries does not show how much can be attributed to European transnationals, but information on cross-border R&D projects in the region yields some data in this regard: 64% of cross-border investment linked to R&D projects comes from the European Union (see figure II.15). These activities are important as a mechanism for generating technology and knowledge transfer to the production structure, enhanced local technical capacity, productivity spillovers and highly-skilled jobs, among other things. R&D is highly concentrated in Brazil (ECLAC, 2011), the only country in the region that European companies see as a prime location for such activities (see figure II.16). The chief destinations for European cross-border investments in R&D are the United States (18%), China (16%) and India (10%).
Traditionally, R&D at Brazilian subsidiaries of transnational companies has focused on developing and tailoring products and technology for the local market and, in some cases, for the regional market. After the deregulations that took place in the 1990s, subsidiaries cut back sharply on local technology and innovation activities (Cassiolato,
24 Corporate spending on innovation breaks down into R&D, acquisition of machinery and equipment, purchase of knowledge from external agents (licenses are one example) and workforce training.
Lastres and Szapiro, 2001). But over the past decade Brazil has been taking on an increasingly more prominent role in the global R&D strategies pursued by European transnationals. Compared with local companies, subsidiaries of transnationals in Brazil are more innovation-oriented and invest more in R&D (Franco and Quadros, 2004). New R&D projects are flowing into subsidiaries in the giant of Latin America, enhancing the technology content of their operations and yielding R&D that is more sophisticated and integrated with global innovation patterns at their parent companies, especially in the automobile and electronics sectors (Reddy, 2011).25 According to the classification devised by Borini, Oliveira and Guevara (2005), there are examples of traditional subsidiaries, subsidiaries with limited relevance and strategically relevant subsidiaries.
Figure II.15 LATIN AMERICA AND THE CARIBBEAN: SUMS ASSOCIATED WITH NEW FOREIGN DIRECT INVESTMENT PROJECTS ANNOUNCED IN
RESEARCH AND DEVELOPMENT, BY ORIGIN, 2003-2010 (Percentages)
Asia and the Pacific(4)
United States and Canada
(32)
European Union(64)
Source: Economic Commission for Latin America and the Caribbean (ECLAC), on the basis of investment tracking information in “fDi Markets”, Financial Times.
The automobile industry is one of the sectors that have seen the largest increase in R&D in Brazil and where subsidiaries have made the biggest efforts in terms of capacity building for product innovation (Reddy, 2011). Assembly operations and auto parts manufacturers alike have enhanced local engineering, stepped up hiring, opened laboratories, formalized product development processes and ratcheted up workforce training (Costa, 2005). Subsidiaries of European companies
25 The pharmaceutical industry has followed a different path; only a handful of transnationals are doing R&D in Brazil.
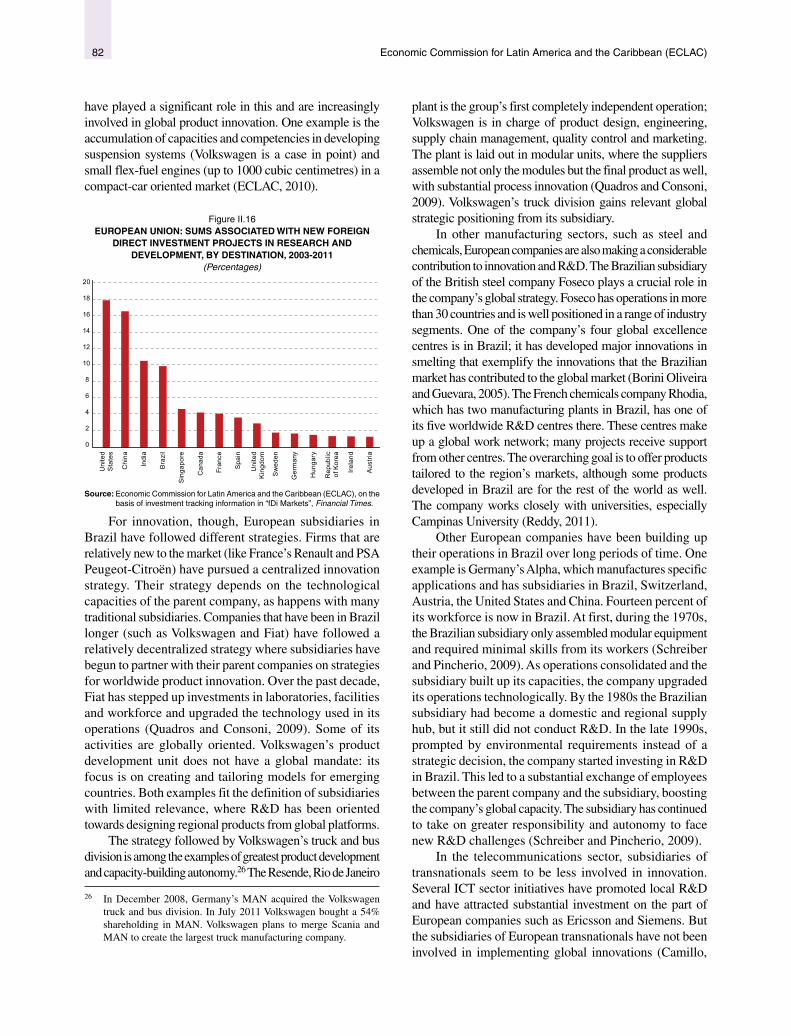
Economic Commission for Latin America and the Caribbean (ECLAC)82
have played a significant role in this and are increasingly involved in global product innovation. One example is the accumulation of capacities and competencies in developing suspension systems (Volkswagen is a case in point) and small flex-fuel engines (up to 1000 cubic centimetres) in a compact-car oriented market (ECLAC, 2010).
Figure II.16 EUROPEAN UNION: SUMS ASSOCIATED WITH NEW FOREIGN
DIRECT INVESTMENT PROJECTS IN RESEARCH AND DEVELOPMENT, BY DESTINATION, 2003-2011
(Percentages)
0
2
4
6
8
10
12
14
16
18
20
Uni
ted
Sta
tes
Chi
na
Indi
a
Bra
zil
Sin
gapo
re
Can
ada
Fran
ce
Spa
in
Uni
ted
Kin
gdom
Sw
eden
Ger
man
y
Hun
gary
Rep
ublic
of K
orea
Irela
nd
Aus
tria
Source: Economic Commission for Latin America and the Caribbean (ECLAC), on the basis of investment tracking information in “fDi Markets”, Financial Times.
For innovation, though, European subsidiaries in Brazil have followed different strategies. Firms that are relatively new to the market (like France’s Renault and PSA Peugeot-Citroën) have pursued a centralized innovation strategy. Their strategy depends on the technological capacities of the parent company, as happens with many traditional subsidiaries. Companies that have been in Brazil longer (such as Volkswagen and Fiat) have followed a relatively decentralized strategy where subsidiaries have begun to partner with their parent companies on strategies for worldwide product innovation. Over the past decade, Fiat has stepped up investments in laboratories, facilities and workforce and upgraded the technology used in its operations (Quadros and Consoni, 2009). Some of its activities are globally oriented. Volkswagen’s product development unit does not have a global mandate: its focus is on creating and tailoring models for emerging countries. Both examples fit the definition of subsidiaries with limited relevance, where R&D has been oriented towards designing regional products from global platforms.
The strategy followed by Volkswagen’s truck and bus division is among the examples of greatest product development and capacity-building autonomy.26 The Resende, Rio de Janeiro
26 In December 2008, Germany’s MAN acquired the Volkswagen truck and bus division. In July 2011 Volkswagen bought a 54% shareholding in MAN. Volkswagen plans to merge Scania and MAN to create the largest truck manufacturing company.
plant is the group’s first completely independent operation; Volkswagen is in charge of product design, engineering, supply chain management, quality control and marketing. The plant is laid out in modular units, where the suppliers assemble not only the modules but the final product as well, with substantial process innovation (Quadros and Consoni, 2009). Volkswagen’s truck division gains relevant global strategic positioning from its subsidiary.
In other manufacturing sectors, such as steel and chemicals, European companies are also making a considerable contribution to innovation and R&D. The Brazilian subsidiary of the British steel company Foseco plays a crucial role in the company’s global strategy. Foseco has operations in more than 30 countries and is well positioned in a range of industry segments. One of the company’s four global excellence centres is in Brazil; it has developed major innovations in smelting that exemplify the innovations that the Brazilian market has contributed to the global market (Borini Oliveira and Guevara, 2005). The French chemicals company Rhodia, which has two manufacturing plants in Brazil, has one of its five worldwide R&D centres there. These centres make up a global work network; many projects receive support from other centres. The overarching goal is to offer products tailored to the region’s markets, although some products developed in Brazil are for the rest of the world as well. The company works closely with universities, especially Campinas University (Reddy, 2011).
Other European companies have been building up their operations in Brazil over long periods of time. One example is Germany’s Alpha, which manufactures specific applications and has subsidiaries in Brazil, Switzerland, Austria, the United States and China. Fourteen percent of its workforce is now in Brazil. At first, during the 1970s, the Brazilian subsidiary only assembled modular equipment and required minimal skills from its workers (Schreiber and Pincherio, 2009). As operations consolidated and the subsidiary built up its capacities, the company upgraded its operations technologically. By the 1980s the Brazilian subsidiary had become a domestic and regional supply hub, but it still did not conduct R&D. In the late 1990s, prompted by environmental requirements instead of a strategic decision, the company started investing in R&D in Brazil. This led to a substantial exchange of employees between the parent company and the subsidiary, boosting the company’s global capacity. The subsidiary has continued to take on greater responsibility and autonomy to face new R&D challenges (Schreiber and Pincherio, 2009).
In the telecommunications sector, subsidiaries of transnationals seem to be less involved in innovation. Several ICT sector initiatives have promoted local R&D and have attracted substantial investment on the part of European companies such as Ericsson and Siemens. But the subsidiaries of European transnationals have not been involved in implementing global innovations (Camillo,

83Foreign Direct Investment in Latin America and the Caribbean • 2011
Galina and Consoni, 2008, 2004).27 Siemens could be an exception in the industry: in 2005, Siemens Brazil had more than a thousand employees (direct and indirect) working on R&D and engineering; it is partnering with a number of universities and research centres. The prime objective is to develop and tailor products for the local market. However, these operations do not seem to be heavily integrated with the company’s global R&D efforts (Reddy, 2011).
A number of R&D projects are currently under way; they are in high technology- and knowledge-content sectors such as chemicals, automobiles, biotechnology, and oil (see table II.6). Brazil has built up substantial apacities in these sectors; much of the R&D conducted by foreign firms is done jointly with local companies and universities. There is evidence that R&D at subsidiaries of transnationals encourages innovation and spending on
27 The information technologies act of 1991, updated in 2001 and 2003, provides incentives for R&D for companies that meet requirements such as investing at least 5% of sales revenue in R&D and partnering with universities and research centres. It is estimated that between 1998 and 2008 this law led to US$ 3.8 billion in R&D investment by some 280 companies. But it does not seem to have enhanced the value added of local supply chains or built up technological and scientific capacity.
R&D by local companies, thanks to demonstration and competition effects (Araujo, 2004).
So, then, transnational companies —European transnationals in particular— account for much of the innovation and R&D activities and spending in Brazil.28 They promote capacity building, technology transfer, human capital development and innovation among local companies. Transnational company operations thus have dynamic effects on the production structure. It is not by chance that out of all the countries of the region Brazil has the most proactive industrial policy for promoting capacity building and encouraging innovation and change in the production structure. Focusing on the link between industrial policy and innovation involving transnational corporate FDI should be a priority in order to promote the permanent benefits of these capital flows.
28 Among the problems that are holding back R&D at transnationals in Brazil are logistics and infrastructure issues and some shortages of skilled labour.
Table II.6 BRAZIL: EUROPEAN COMPANIES WITH RECENT RESEARCH AND DEVELOPMENT PROJECTS
(Millions of dollars)
Rank-ing Year Company Home country Sector Description Investment
1 2011 BG Group United Kingdom
Oil and gas BG Group has plans to invest in a new R&D centre in São Paulo as part of a plan for investing US$ 10 billion in Brazil by 2020.
1 900
2 2011 Siemens Germany Oil and gas A research centre to be set up in Rio de Janeiro will be operated jointly with the Federal University of Rio de Janeiro. The project is part of a plan to invest a total of US$ 600 million in Brazil. Centre start-up date: late 2012.
50
3 2010 Merck Germany Biotechnology Merck, which supplies products, services and technology to pharmaceutical and biotech firms, opened a technology centre in Alphaville (São Paulo) to meet the research and training needs of laboratories in Latin America.
45
4 2008 Mahle Germany Automobile The Mahle Group opened a new technology centre in Jundiaí (São Paulo). It will be the base for the firm’s R&D and engineering operations in Latin America; most of the staff will be engineers, researchers and highly skilled technicians.
42
5 2011 Ericsson Sweden Communications A new innovation centre is to be set up to supplement R&D operations in the region. The centre will partner with Brazilian universities on general solutions, prototype design, personalization and mobile and fixed communications.
30
6 2010 CGGVeritas France Software CGGVeritas opened a technology centre in Rio de Janeiro after signing a technology cooperation agreement with Petrobras. The centre will also seek alliances and joint projects with local universities specializing in geophysical studies.
21
7 2009 Kemira Group
Finland Chemicals Kemira set up a new R&D centre in São Paulo. It will focus on water chemistry, bioethanol and mining and oil applications. The centre is similar to others that the company has in Finland, China, Germany and the United States.
17
8 2010 Saab AB Sweden Aerospace The new centre will concentrate on aerospace, defence and urban innovation and will operate in cooperation with local companies, the Federal University of ABC and the FEI University Centre.
14
9 2009 Bayer Germany Pharmaceutical Bayer opened a new monitoring centre to supervise and assess the side effects of medicines following approval for marketing.
1
Source: Economic Commission for Latin America and the Caribbean (ECLAC), on the basis of investment tracking information in “fDi Markets”, Financial Times.
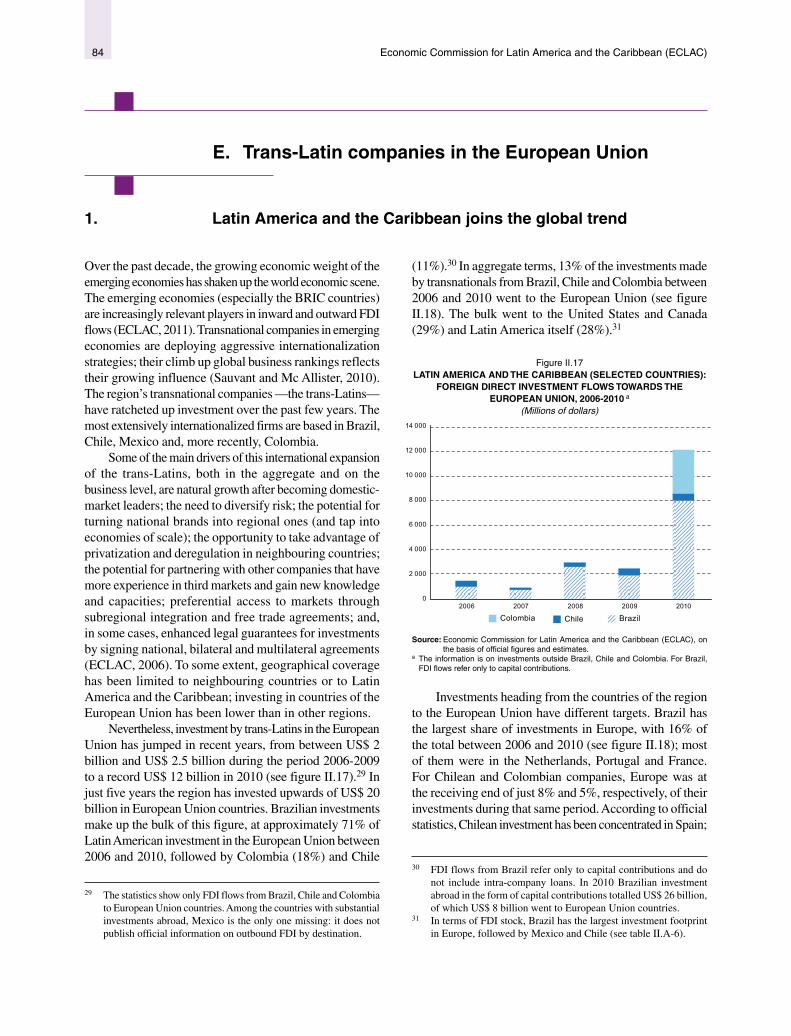
Economic Commission for Latin America and the Caribbean (ECLAC)84
E. Trans-Latin companies in the European Union
1. Latin America and the Caribbean joins the global trend
Over the past decade, the growing economic weight of the emerging economies has shaken up the world economic scene. The emerging economies (especially the BRIC countries) are increasingly relevant players in inward and outward FDI flows (ECLAC, 2011). Transnational companies in emerging economies are deploying aggressive internationalization strategies; their climb up global business rankings reflects their growing influence (Sauvant and Mc Allister, 2010). The region’s transnational companies —the trans-Latins— have ratcheted up investment over the past few years. The most extensively internationalized firms are based in Brazil, Chile, Mexico and, more recently, Colombia.
Some of the main drivers of this international expansion of the trans-Latins, both in the aggregate and on the business level, are natural growth after becoming domestic-market leaders; the need to diversify risk; the potential for turning national brands into regional ones (and tap into economies of scale); the opportunity to take advantage of privatization and deregulation in neighbouring countries; the potential for partnering with other companies that have more experience in third markets and gain new knowledge and capacities; preferential access to markets through subregional integration and free trade agreements; and, in some cases, enhanced legal guarantees for investments by signing national, bilateral and multilateral agreements (ECLAC, 2006). To some extent, geographical coverage has been limited to neighbouring countries or to Latin America and the Caribbean; investing in countries of the European Union has been lower than in other regions.
Nevertheless, investment by trans-Latins in the European Union has jumped in recent years, from between US$ 2 billion and US$ 2.5 billion during the period 2006-2009 to a record US$ 12 billion in 2010 (see figure II.17).29 In just five years the region has invested upwards of US$ 20 billion in European Union countries. Brazilian investments make up the bulk of this figure, at approximately 71% of Latin American investment in the European Union between 2006 and 2010, followed by Colombia (18%) and Chile
29 The statistics show only FDI flows from Brazil, Chile and Colombia to European Union countries. Among the countries with substantial investments abroad, Mexico is the only one missing: it does not publish official information on outbound FDI by destination.
(11%).30 In aggregate terms, 13% of the investments made by transnationals from Brazil, Chile and Colombia between 2006 and 2010 went to the European Union (see figure II.18). The bulk went to the United States and Canada (29%) and Latin America itself (28%).31
Figure II.17 LATIN AMERICA AND THE CARIBBEAN (SELECTED COUNTRIES):
FOREIGN DIRECT INVESTMENT FLOWS TOWARDS THE EUROPEAN UNION, 2006-2010 a
(Millions of dollars)
0
2 000
4 000
6 000
8 000
10 000
12 000
14 000
2006 2007 2008 2009 2010
Colombia Chile Brazil
Source: Economic Commission for Latin America and the Caribbean (ECLAC), on the basis of official figures and estimates.
a The information is on investments outside Brazil, Chile and Colombia. For Brazil, FDI flows refer only to capital contributions.
Investments heading from the countries of the region to the European Union have different targets. Brazil has the largest share of investments in Europe, with 16% of the total between 2006 and 2010 (see figure II.18); most of them were in the Netherlands, Portugal and France. For Chilean and Colombian companies, Europe was at the receiving end of just 8% and 5%, respectively, of their investments during that same period. According to official statistics, Chilean investment has been concentrated in Spain;
30 FDI flows from Brazil refer only to capital contributions and do not include intra-company loans. In 2010 Brazilian investment abroad in the form of capital contributions totalled US$ 26 billion, of which US$ 8 billion went to European Union countries.
31 In terms of FDI stock, Brazil has the largest investment footprint in Europe, followed by Mexico and Chile (see table II.A-6).

85Foreign Direct Investment in Latin America and the Caribbean • 2011
Colombia has invested heavily in the United Kingdom.32 Mexican investments in the European Union account for a large part of outbound investment from Latin America, but the figures cannot be determined from official statistics.
32 From 1990 to date, more than 50% of Chilean investment in Europe has been in Spain (Openshaw, 2012).
According to other information on new investment projects in the European Union announced by trans-Latins, Mexican companies account for more than 30% (see figure II.19).
Figure II.18 LATIN AMERICA AND THE CARIBBEAN: OUTWARD FOREIGN
DIRECT INVESTMENT, 2006-2010 a
(Percentages)
0
10
20
30
40
50
60
70
80
90
100
Latin America(3 countries)
Brazil Chile Colombia
OthersAsia and Oceania
Caribbean financial centres European Union
United States and Canada Latin America and the Caribbean
Source: Economic Commission for Latin America and the Caribbean (ECLAC), on the basis of official figures and estimates.
a The information is on investments outside Brazil, Chile and Colombia. For Brazil, FDI flows refer only to capital contributions.
Figure II.19 LATIN AMERICA AND THE CARIBBEAN: FOREIGN DIRECT INVESTMENT PROJECTS IN THE EUROPEAN UNION, BY
COUNTRY OF ORIGIN, 2003-2010 (Percentages)
Argentina (3)
Brazil (55)
Chile (1)
Mexico (33)
Colombia (1)
Peru (0)
Venezuela(Bol. Rep. of)
(0) Others(7)
Source: Economic Commission for Latin America and the Caribbean (ECLAC), on the basis of investment tracking information in “fDi Markets”, Financial Times.
2. Business dynamic of trans-Latins in the European Union
The handful of trans-Latins operating in the European Union mirror the production structure of the region and the sectors in which the leading companies have carved out competitive advantages worldwide.33 There is no way to disaggregate official statistics on investment target sectors in Europe, but other information at the company level (on mergers and acquisitions and investment projects) shows the overall patterns. Most Latin American FDI in Europe is in the basic industries (oil and petrochemicals, mining, cement and steel), in consumer goods sectors (the food industry).
33 The major Brazilian trans-Latins have internationalized on their own, without cooperation from financial institutions or government aid. It should, however, be borne in mind that many of them were originally State-owned, showing how important the State and industrial policy were in inception and in the accumulation of capacities. One of the distinctive features of their internationalization has been the combination of organizational capacities and management styles (Fleury and ohers, 2010).
The trans-Latin companies operating in Europe have used entry mechanisms that include acquisitions, greenfield investments and corporate alliances, and they have followed different strategies or combinations of strategies (see table II.7). The first companies to internationalize in Europe pursued market-seeking strategies and, later, strategies in search of export efficiency and strategic assets. The sectors most targeted by market-seeking are cement, steel, food, and engineering and construction. Cemex, Grupo JBS, Andrade Gutiérrez, Cía. Siderúrgica Nacional, Odebrecht, Tenaris and Gerdau are representative examples. Natural-resource-intensive firms like Brazil’s Vale and Petrobras, Chile’s SQM and Colombia’s Petrominerales also have operations in Europe seeking to win new markets. Strategies in search of export efficiency are seen above all in the automobile and aeronautics industries, where representative examples include Sabó, Nemak (Alfa Group) and Embraer. Strategic-asset-seeking strategies are emerging in acquisitions of companies that have specific knowledge and capacities. To cite an example, in 2008 Gerdau acquired Spain’s Sidenor, which stood out for its R&D operations and its knowledge of the European market. That market was a vital one for the company’s positioning strategy (see box II.3).

Economic Commission for Latin America and the Caribbean (ECLAC)86
The largest acquisitions by trans-Latins in Europe reflect the importance of the mining, food, cement and steel sectors, among others. Acquisitions in service subsectors have focused on banking and telecommunications, chiefly in Portugal and by Brazilian companies. Most acquisitions in the steel and cement sectors have taken place in Spain or Portugal. Some trans-Latins are using Spain as a gateway to the European market. The largest acquisitions include Votorantim’s stake in Cimentos de Portugal, Gerdau’s acquisition of Sidenor and the acquisition of Hormigones Ciudad Real by Cemex (see table II.A-7). The companies for which acquisitions have been the main
Box II.3 RESEARCH AND DEVELOPMENT BY TRANS-LATINS IN EUROPE: GERDAU AND WEG
The trans-Latins Gerdau and WEG are examples of two different reasons for conducting R&D abroad. Brazil’s Gerdau is a leading steel producer. For 2011-2015 it has announced plans to invest US$ 6 billion, 25% of which will go to its production plants abroad. Gerdau’s diversified international presence encompasses 14 countries around the world, but its main production operations are in the United States and in other countries of the region, such as the Bolivarian Republic of Venezuela, Chile, Colombia and Mexico. Its European operations are concentrated in Spain, where it acquired Sidenor in 2008 for US$ 286 million. The fact that Sidenor had an R&D centre was a
major consideration for the acquisition. The centre had developed production capacities and had business partners elsewhere in Europe, including assemblers and suppliers for the automobile industry (Vasconcelos, 2010). The acquisition enabled Gerdau to launch its quest for internationalization in Europe from a more competitive position and rapidly procure Sidernor’s knowledge, technical and production capacities and position in the European market.
Product adaptation is another rationale for subsidiaries of trans-Latin companies to invest in operations abroad. For example, Brazil’s WEG, which makes electric motors, has a major subsidiary in Portugal dedicated
to special lines of high value-added motors. This subsidiary plays an essential role in tailoring products to the local market and to European standards (Vasconcelos, 2010). To this end it has an R&D unit that facilitates compliance with European product standards and certification requirements.
These two examples illustrate the rationale that can lead trans-Latins to do R&D in Europe. Such operations can bring benefits for the home country, too, such as tapping into new sources of expertise, putting that expertise to work in the domestic market, lengthening the product life cycle and gaining a better foothold in external markets.
Source: Economic Commission for Latin America and the Caribbean (ECLAC), on the basis of information from the websites of the companies [online] www.gerdau.com and www.weg.net/br.
path to internationalization in Europe include Friboi (Grupo JBS), Gerdau, Nemak and Brazilian engineering and construction firms (Andrade Gutiérrez, Camargo Corrêa).34
According to information on greenfield investments announced between 2003 and 2010, the most active sectors in this regard have been construction materials, at 28% of the total, followed by chemicals (16%), metals (9%), oil and gas (8%), food (4%) and the automobile sector (4%) (see figure II.20). The main destinations for such investments are Portugal (34%), Spain (21%) and Poland (14%). Petrobras, Sabó and Cemex are among the companies with major greenfield investments in the European Union.
34 Colombian companies have made acquisitions in the oil and mining sector and in some services, such as packaging.
Figure II.20 LATIN AMERICA AND THE CARIBBEAN: FOREIGN DIRECT INVESTMENT PROJECTS
IN THE EUROPEAN UNION BY DESTINATION, 2003-2010 (Percentages)
Sectors Countries
Construction and materials
(28)
Chemicals(16)
Metals(9)
Oil and gas(8)
Food and beverages(7)
Automobile(4)
Aerospace(4)
Textile(3)
Business services
(5)
Others(16)
Spain(21)
France(4)
United Kingdom(10)
Germany(1)
Italy(1)Portugal
(34)
Poland(14)
Others(14)
Source: Economic Commission for Latin America and the Caribbean (ECLAC), on the basis of investment tracking information in “fDi Markets”, Financial Times.
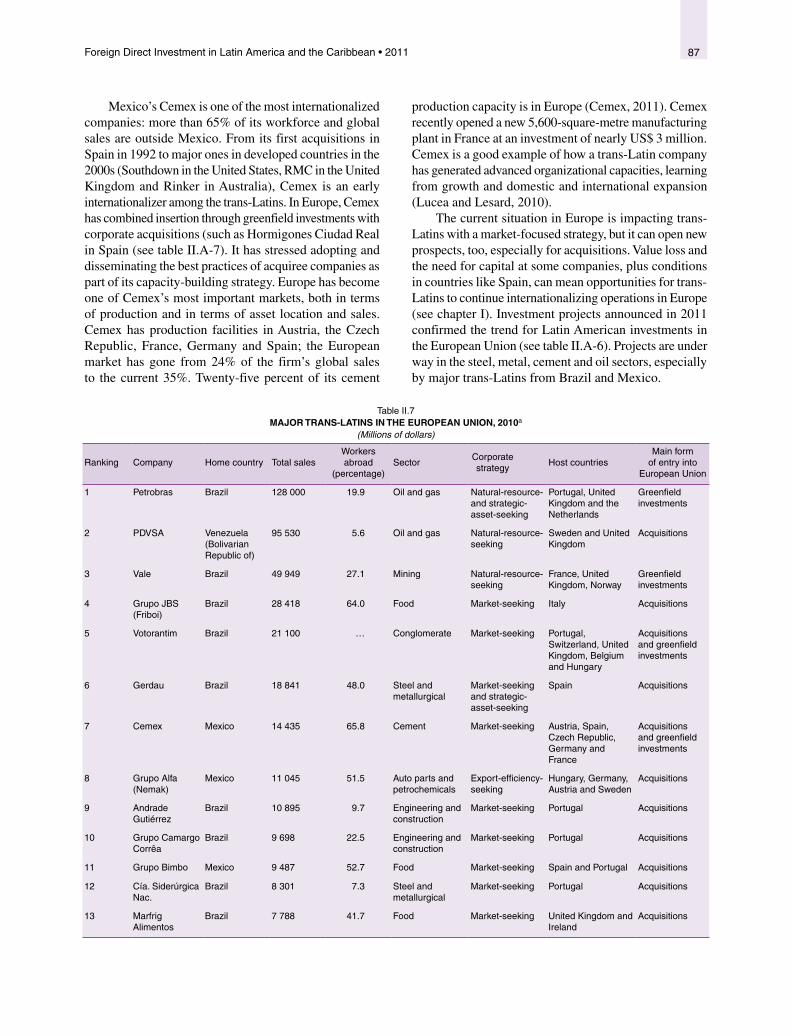
87Foreign Direct Investment in Latin America and the Caribbean • 2011
Mexico’s Cemex is one of the most internationalized companies: more than 65% of its workforce and global sales are outside Mexico. From its first acquisitions in Spain in 1992 to major ones in developed countries in the 2000s (Southdown in the United States, RMC in the United Kingdom and Rinker in Australia), Cemex is an early internationalizer among the trans-Latins. In Europe, Cemex has combined insertion through greenfield investments with corporate acquisitions (such as Hormigones Ciudad Real in Spain (see table II.A-7). It has stressed adopting and disseminating the best practices of acquiree companies as part of its capacity-building strategy. Europe has become one of Cemex’s most important markets, both in terms of production and in terms of asset location and sales. Cemex has production facilities in Austria, the Czech Republic, France, Germany and Spain; the European market has gone from 24% of the firm’s global sales to the current 35%. Twenty-five percent of its cement
production capacity is in Europe (Cemex, 2011). Cemex recently opened a new 5,600-square-metre manufacturing plant in France at an investment of nearly US$ 3 million. Cemex is a good example of how a trans-Latin company has generated advanced organizational capacities, learning from growth and domestic and international expansion (Lucea and Lesard, 2010).
The current situation in Europe is impacting trans-Latins with a market-focused strategy, but it can open new prospects, too, especially for acquisitions. Value loss and the need for capital at some companies, plus conditions in countries like Spain, can mean opportunities for trans-Latins to continue internationalizing operations in Europe (see chapter I). Investment projects announced in 2011 confirmed the trend for Latin American investments in the European Union (see table II.A-6). Projects are under way in the steel, metal, cement and oil sectors, especially by major trans-Latins from Brazil and Mexico.
Table II.7 MAJOR TRANS-LATINS IN THE EUROPEAN UNION, 2010a
(Millions of dollars)
Ranking Company Home country Total salesWorkers abroad
(percentage)Sector
Corporate strategy
Host countriesMain form
of entry into European Union
1 Petrobras Brazil 128 000 19.9 Oil and gas Natural-resource- and strategic-asset-seeking
Portugal, United Kingdom and the Netherlands
Greenfield investments
2 PDVSA Venezuela (Bolivarian Republic of)
95 530 5.6 Oil and gas Natural-resource-seeking
Sweden and United Kingdom
Acquisitions
3 Vale Brazil 49 949 27.1 Mining Natural-resource-seeking
France, United Kingdom, Norway
Greenfield investments
4 Grupo JBS (Friboi)
Brazil 28 418 64.0 Food Market-seeking Italy Acquisitions
5 Votorantim Brazil 21 100 … Conglomerate Market-seeking Portugal, Switzerland, United Kingdom, Belgium and Hungary
Acquisitions and greenfield investments
6 Gerdau Brazil 18 841 48.0 Steel and metallurgical
Market-seeking and strategic-asset-seeking
Spain Acquisitions
7 Cemex Mexico 14 435 65.8 Cement Market-seeking Austria, Spain, Czech Republic, Germany and France
Acquisitions and greenfield investments
8 Grupo Alfa (Nemak)
Mexico 11 045 51.5 Auto parts and petrochemicals
Export-efficiency- seeking
Hungary, Germany, Austria and Sweden
Acquisitions
9 Andrade Gutiérrez
Brazil 10 895 9.7 Engineering and construction
Market-seeking Portugal Acquisitions
10 Grupo Camargo Corrêa
Brazil 9 698 22.5 Engineering and construction
Market-seeking Portugal Acquisitions
11 Grupo Bimbo Mexico 9 487 52.7 Food Market-seeking Spain and Portugal Acquisitions
12 Cía. Siderúrgica Nac.
Brazil 8 301 7.3 Steel and metallurgical
Market-seeking Portugal Acquisitions
13 Marfrig Alimentos
Brazil 7 788 41.7 Food Market-seeking United Kingdom and Ireland
Acquisitions
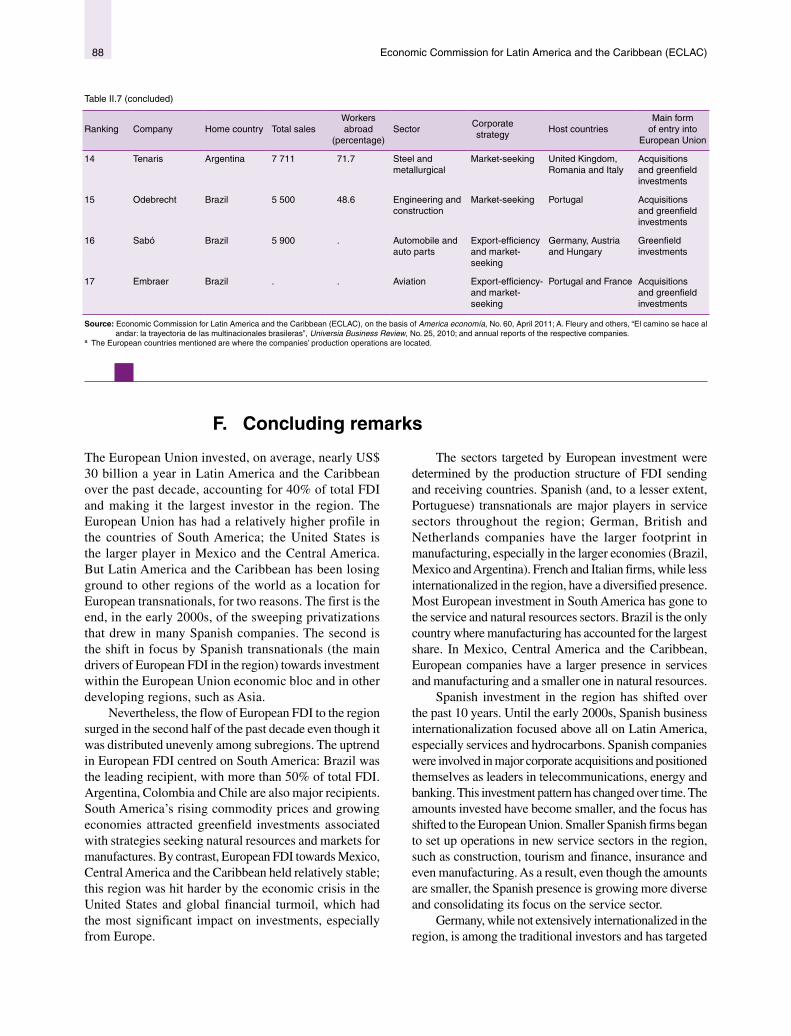
Economic Commission for Latin America and the Caribbean (ECLAC)88
Ranking Company Home country Total salesWorkers abroad
(percentage)Sector
Corporate strategy
Host countriesMain form
of entry into European Union
14 Tenaris Argentina 7 711 71.7 Steel and metallurgical
Market-seeking United Kingdom, Romania and Italy
Acquisitions and greenfield investments
15 Odebrecht Brazil 5 500 48.6 Engineering and construction
Market-seeking Portugal Acquisitions and greenfield investments
16 Sabó Brazil 5 900 . Automobile and auto parts
Export-efficiency and market-seeking
Germany, Austria and Hungary
Greenfield investments
17 Embraer Brazil . . Aviation Export-efficiency- and market-seeking
Portugal and France Acquisitions and greenfield investments
Source: Economic Commission for Latin America and the Caribbean (ECLAC), on the basis of America economía, No. 60, April 2011; A. Fleury and others, “El camino se hace al andar: la trayectoria de las multinacionales brasileras”, Universia Business Review, No. 25, 2010; and annual reports of the respective companies.
a The European countries mentioned are where the companies’ production operations are located.
Table II.7 (concluded)
F. Concluding remarks
The European Union invested, on average, nearly US$ 30 billion a year in Latin America and the Caribbean over the past decade, accounting for 40% of total FDI and making it the largest investor in the region. The European Union has had a relatively higher profile in the countries of South America; the United States is the larger player in Mexico and the Central America. But Latin America and the Caribbean has been losing ground to other regions of the world as a location for European transnationals, for two reasons. The first is the end, in the early 2000s, of the sweeping privatizations that drew in many Spanish companies. The second is the shift in focus by Spanish transnationals (the main drivers of European FDI in the region) towards investment within the European Union economic bloc and in other developing regions, such as Asia.
Nevertheless, the flow of European FDI to the region surged in the second half of the past decade even though it was distributed unevenly among subregions. The uptrend in European FDI centred on South America: Brazil was the leading recipient, with more than 50% of total FDI. Argentina, Colombia and Chile are also major recipients. South America’s rising commodity prices and growing economies attracted greenfield investments associated with strategies seeking natural resources and markets for manufactures. By contrast, European FDI towards Mexico, Central America and the Caribbean held relatively stable; this region was hit harder by the economic crisis in the United States and global financial turmoil, which had the most significant impact on investments, especially from Europe.
The sectors targeted by European investment were determined by the production structure of FDI sending and receiving countries. Spanish (and, to a lesser extent, Portuguese) transnationals are major players in service sectors throughout the region; German, British and Netherlands companies have the larger footprint in manufacturing, especially in the larger economies (Brazil, Mexico and Argentina). French and Italian firms, while less internationalized in the region, have a diversified presence. Most European investment in South America has gone to the service and natural resources sectors. Brazil is the only country where manufacturing has accounted for the largest share. In Mexico, Central America and the Caribbean, European companies have a larger presence in services and manufacturing and a smaller one in natural resources.
Spanish investment in the region has shifted over the past 10 years. Until the early 2000s, Spanish business internationalization focused above all on Latin America, especially services and hydrocarbons. Spanish companies were involved in major corporate acquisitions and positioned themselves as leaders in telecommunications, energy and banking. This investment pattern has changed over time. The amounts invested have become smaller, and the focus has shifted to the European Union. Smaller Spanish firms began to set up operations in new service sectors in the region, such as construction, tourism and finance, insurance and even manufacturing. As a result, even though the amounts are smaller, the Spanish presence is growing more diverse and consolidating its focus on the service sector.
Germany, while not extensively internationalized in the region, is among the traditional investors and has targeted

89Foreign Direct Investment in Latin America and the Caribbean • 2011
specific sectors and countries. This historical focus has not changed over the past decade and is still on investing in Brazil, followed by Mexico and Argentina, in capital-intensive sectors where German firms have competitive advantages and are world leaders (automobiles, chemicals, and machinery and equipment, for example). French investing is concentrated in Brazil and is associated with manufacturing and services. French investment is on the rise and has been topping US$ 5 billion since 2008. In recent years, French companies have made major acquisitions in telecommunications, energy and some manufacturing sectors, such as chemicals. Great Britain is the European Union country that has invested the least in the region; operations have focused on mining, hydrocarbons and manufactures like food and beverages. Italy has had a historical presence, too, especially in traditional manufactures like food and the automobile industry. Over the past decade, Italian investment has seen substantial growth, branching out from traditional manufacturing investments to services such as telecommunications, as well as energy and infrastructure. And investment from the Netherlands has centred above all on Brazil and Mexico in the form of acquisitions in manufacturing sectors such as food and beverages.
Investments associated with a natural-resource-seeking strategy have surged in recent years, especially in mining. There is investing in the hydrocarbons sector as well, in many cases in cooperation with State-owned companies. Investments following this strategy have had a range of impacts, including higher exports, job creation in non-urban areas and growing fiscal revenue as tax receipts climb. The main issues are that these operations are in enclaves and have a low processing content. European companies whose strategy is to seek markets for manufactures have been very active, too, and have benefited from the region’s economic performance, lower volatility and growing purchasing power. But the international crisis has chilled some investing, especially because some transnationals are hard-pressed to secure financing. Some of the impacts of these investments are increased production capacity and exports, the creation of production linkages and employment and, in certain cases, technology transfer and capacity-building.
Operations based on a service-market-seeking strategy are more consolidated than a decade ago; most have a long-term vision. European investments in telecommunications and energy, for example, have entered a phase marked by greater stability where the priorities are to take advantage of economies of scale and grow market share, with profit margins that ensure a sound global position. For many firms (especially the Spanish ones), their operations in the region have contributed a good deal to improving parent-company balance sheets and helped them cope with the current situation in Europe. The potential for
market growth and substantial gaps in infrastructure and other areas, on top of good economic performance, have encouraged new companies to set up operations, both in sectors with a traditional European presence (commerce and tourism) and in new ones (construction, logistics and finance). The European presence has thus grown more diverse in recent years, and the number of companies with operations in the region has grown.
European investment has a number of distinctive traits; two of them stand out. First, European transnationals account for a large share of greenfield investing in the manufacturing sector; this is where FDI does the most to increase production capacity and create production linkages. Second, these companies play leading roles in R&D, especially in Brazil and Argentina. For transnational companies, though, Brazil is the only country that has positioned itself as a prime location for internationalizing R&D; the R&D centres of subsidiaries operating in Brazil are increasingly involved in corporate global innovation strategies. This is having substantial impacts in terms of technology transfer, production capacity building and innovation. It is no accident that Brazil has a more diversified industrial structure and a more proactive industrial policy than other countries in the region. These two traits, then, attract transnational company R&D; this, in turn, deepens the process of structural change.
This chapter also brings an important analytical message: there are two increasingly meaningful factors for assessing the impact of transnational corporate operations. They are the capacity of subsidiaries and the nature of innovation and R&D. These characteristics are crucial for understanding the impacts in terms of linkages, innovation, technology transfer and capacity-building. It is not enough to identify corporate strategies and target sectors; the characteristics of subsidiaries and of innovation and R&D operations are also part of the picture for gauging the sustainability of the dynamic benefits and more permanent nature that set FDI apart from local investment.
Trans-Latin companies (above all, from Brazil and Mexico) have stepped up their investment in Europe over the past few years. This process involves a small number of companies whose operations reflect the region’s production structure and centre on sectors where leading Latin American firms have carved out global competitive advantages. This has been especially true in the basic industries (oil, petrochemicals, mining, cement and steel), mass consumption sectors (food) and some services (banking). While the situation in Europe is impacting trans-Latins with a market-seeking strategy, it can bring new opportunities for acquisitions.
There are two factors behind the prospects for European investment. On the one hand, the European

Economic Commission for Latin America and the Caribbean (ECLAC)90
crisis is opening new opportunities for transnationals. High profitability (especially for Spanish firms) in the region, along with Latin American market potential, points to broader positioning. The crisis could drive certain companies to move operations to lower-cost locations, which would mean ramping up their activities in the region. On the other hand, the current situation in Europe could reverse the flow of investments if the euro crisis balloons and the lack of financing grows more critical. This is not likely to trigger a wave of corporate disinvestment because their operations in the region are very profitable, but it could halt or delay some investment projects. Even so, the European companies that are likely to step up investing in coming years are those following natural-resource and market-seeking strategies. There are opportunities for greenfield investments in natural resources sectors in Colombia, Peru, Chile, Ecuador, Brazil and the Bolivarian Republic of Venezuela; in
agribusiness in Chile and Brazil; in infrastructure and construction in Brazil, Peru and Chile; in commerce in Uruguay, Chile and Brazil; and in renewable energy in Mexico, Uruguay and Brazil.
Latin America and the Caribbean and the European Union should promote cooperation that increases and enhances investment as a sustainable source of growth and development. The region should redouble its industrial policy efforts to promote the permanent, dynamic benefits of FDI. Beyond the need for an FDI promotion policy, strides should be made towards production development policies that take account of the operations of transnational companies, moving from FDI policy to policy geared towards what transnationals do in areas like human resource training, technology transfer, innovation and R&D. Latin America and the Caribbean could thus reap greater benefit from the stock of knowledge of European companies and their broad potential in the region.
Bibliography
Anglo American (2011), Annual Report, various years [online] www.angloamerican.com.
ATKearney (2011), “The 2011 Global Retail Development Index” [online] http://www.atkearney.com.
Arahuetes, A. (2011), “Las inversiones directas españolas en América Latina en el período 2001-2010”, Anuario iberoamericano, 2011.
Araujo, R. D. (2004), “Desempenho inovador e comportamento tecnológico das firmas domésticas e transnacionais no final da década de 90”, Master’s dissertation, Universiad de Campinas (UNICAMP).
Borini, F. M., M.M. Oliveira Jr. and A. J. H. Guevara (2005), “Determinant Factors of the Subsidiaries Roles in Emerging Economies”, paper presented at the meeting of the Academy of Management, Honolulu, August.
Calderón, A. (2002), “La inversión extranjera directa en América Latina y el Caribe”, Inversión extranjera directa en América Latina. El papel de los inversores europeos, Z. Vodusek (ed.), Washington, D.C., Inter-American Development Bank (IDB).
Camillo, E., S. Galina and F. Consoni (2008), “FDI in R&D: What the MNC’s subsidiaries are doing in Brazil?”, paper presented at the VI Globelics Conference, Mexico City, 22 - 24 September.
Cassiolato, J.E., H. Lastres and M. Szapiro (2001), “Local systems of innovation in Brazil, development and transnational corporations: a preliminary assessment based on empirical results of a research project”, unpublished.
Cemex (2011), [online] www.cemex.com. Chudnovsky, D. (2001), El boom de la inversión directa
en el Mercosur, Buenos Aires, Siglo XXI de Argentina Editores.
Cobham, A. (2005), “Tax evasión, tax avoidance and development finance”, QEH Working Paper, No. 129, Oxford University.
Cohen, S. D. (2007), Multinational Corporations and Foreign Direct Investment. Avoiding Simplicty, Embracing Complexity, New York, Oxford University Press.
Costa, I. (2005), “Notes on R&D and TNCs Affiliates in Brazi”, paper presented at the Expert meeting on the World Investment Report (WIR 2005), Geneva, 24 - 26 January.
De Negri, F. and M. Laplane (2009), “Fatores Locacionais e o Investimento Estrangeiro em Pesquisa e desenvolvimento: Evidências para o Brasil, Argentina e México”, Discussion Papers, No. 1454, Institute of Applied Economic Research (IPEA).

91Foreign Direct Investment in Latin America and the Caribbean • 2011
Dunning, J. (2002), La inversión extranjera directa europea en América Latina”, Inversión extranjera directa en América Latina. El papel de los inversores europeos, Z. Vodusek, (ed.), Washington, D.C., Inter-American Development Bank (IDB).
ECLAC (Economic Commission for Latin America and the Caribbean) (2011), Foreign Direct Investment in Latin America and the Caribbean, 2010 (LC/G.2494-P), Santiago, Chile. United Nations publication, Sales No. E.11.II.G.4.
(2010), Foreign Direct Investment in Latin America and the Caribbean, 2009 (LC/G.2447-P), Santiago, Chile. United Nations publication, Sales No. E.10.II.G.4.(2009), Foreign Direct Investment in Latin America and the Caribbean, 2009 (LC/G.2360–P), Santiago, Chile. United Nations publication, Sales No. E.08.II.G.11.(2008), Foreign Direct Investment in Latin America and the Caribbean, 2009 (LC/G.2447-P), Santiago, Chile. United Nations publication, Sales No. E.10.II.G.4.(2007), Foreign Investment in Latin America and the Caribbean, 2006 (LC/G.2336-P), Santiago, Chile, mayo. United Nations publication, Sales No. E.07.II.G.32.(2006), Foreign Investment in Latin America and the Caribbean, 2005 (LC/G.2309-P), Santiago, Chile. United Nations publication, Sales No. E.06.II.G.44.(2003), Foreign Investment in Latin America and the Caribbean, 2002 (LC/G.2198-P), Santiago, Chile. United Nations publication, Sales No. E.03.II.G.11.(2002), Foreign Investment in Latin America and the Caribbean, 2001 (LC/G.2178-P/E), Santiago, Chile. United Nations publication, Sales No. E.02.II.G.47.
European Commission (2011), Internationalisation of European SMEs, Brussels, Directorate-General for Enterprise and Industry .(2010), The 2009 EU Survey on R&D Investment Business Trends, Brussels
Fleury, A., M. Leme Fleury and G. Glufke Reis (2010), “El camino se hace al andar: la trayectoria de las multinacionales brasileras”, Universia Business Review, No. 25.
Forsgren, M. (2002), “Are multinational firms good or bad?”, Critical Perspectives on Internationalization, V. Havila, M. Forsgren and H. Håkansson (eds.), Elsevier Science Publication.
Franco, E. and R. Quadros (2004), “Technological strategies of transnationa corporations affiliates in Brazil”, Brazilian Administration Review, July-December.
García-Canal, E. and others (2008), “La expansión de las empresas españolas hacia América Latina: Un balance”, Revista globalización, competitividad y gobernabilidad, vol. 2, No. 2, Georgetown University.
Giuliani, E. (2008), “Multinational corporations and patterns of local knowledge transfer in Costa Rican high-tech industries”, Development and Change, vol. 39.
Giuliani, E. and A. Marín (2007), “Relating global and local knowledge linkages: the case of MNC subsidiaries in Argentina”, L. Piscitello and G. Sarcagello (eds.), Do Multinationals Feed Local Development and Growth?, Amsterdam, Elsevier.
Goldman Sachs (2010), “The New Geography of global Innovation”, Global Markets Institute, September.
Griffith, R., S. Redding and J. Van Reenen (2004), “Mapping the two faces of R&D: productivity growth in a panel of OECD industries”, The Review of Economics and Statistics, vol. 86, No. 4.
Hall, B.H. (2010), “The Internationalization of R&D”, University ofCalifornia at Berkeley/Maastricht University.
Hansen, M. W., T. Pedersen and B. Petersen (2008), “MNC strategies and linkage effects in developing countries”, Journal of World Business, No. 44.
Henkel (2011), [online] www.henkel.com. IE Business School, (2012), “2012: Panorama de la
inversión española en Latinoamérica”, V informe. L’Oréal (2011), [online] www.loreal.com. Lucea, R. and D. Lesard (2010), “¿Cómo mantienen su
ventaja competitiva las multinacionales de economías emergentes? El caso de Cemex”, Universia Business Review, No. 25.
Marín, A. and V. Arza (2009), “The role of multinational corporations in innovation systems of developing countries. From technology diffusion to international involvement”, Handbook of Innovation Systems and Developing Countries. Building Domestic Capabilities in a Global Context, B. Lundvall and others (eds.), Cheltenham, Edward Elgar.
Marín A. and M. Bell (2004), “Technology spillovers from FDI: an exploration of the active role of MNC subsidiaries in the case of Argentina in the 1990s”, SPRU Working Paper , No. 118.
Moncada-Paternò-Castello, P., M. Vivarelli and P. Voigt (2011), “Drivers and impacts in the globalization of corporate R&D: an introduction based on the European experience”, Industrial and Corporate Change, vol. 20, No. 2.
Narula, R. and A. Zanfei, (2005), “Globalization of innovation: the role of multinational enterprises”, The Oxford Hanbook of Innovation, J. Fagerber, D. Mowery and R. Nelson (eds.), New York, Oxford University Press.
Ocampo, J.A. (2010),”El papel de Europa en la inversión extranjera directa hacia América Latina”, Documentos especiales de coyuntura económica, No. 2010/01, December, CAF.
OECD (Organization of Economic Cooperation and Development) (2009), Science, Technology and Industry Scoreborad 2009, Paris, OECD Publications.

Economic Commission for Latin America and the Caribbean (ECLAC)9292
(2005), “Background Report to the Conference on Internationalisation of R&D”, Brussels, March.(2002), Frascati Manual 2002: Proposed Standard Practice for Surveys on Research and Experimental Development, Paris, OECD Publications.
OEME (Observatorio de la Empresa Multinacional Española) (2010), “La multinacional española ante un nuevo escenario internacional”, second annual report, June.
Openshaw, L. (2012), “Chilean Investment in the UK Report”, Santiago, Chile, Embassy of the United Kingdom of Great Britain and Northern Ireland in Chile.
Oxfam (2011), [online] www.oxfam.org.(2000), “Tax havens: releasing the hidden billions for poverty eradication”, briefinh paper, Oxford.
Quadros, R. and F. Consoni (2009), “Innovation capabilities in the Brazilian automobile industry: a study of the vehicle assembles’technological strategies and policy recommendantions”, International Journal of Technological Learning, Innovation and Development, vol. 2, No. ½.
Reddy, P. (2011), Global Innovation in Emerging Economies, Routledge Studies in Innovation, New York, International Development Research Centre (IDRC).
Repsol YPF (2011), [online] www.repsol.com. Sargent, J. and L. Matthews (2006), “The drivers of
evolution/upgrading in Mexico maquiladoras: how important is subsidiary initiative?”, Journal of World Business, vol. 41, No. 3.
Sauvant, K. and G. McAllister (2010), Foreign Direct Investments from Emerging Markets: The Challenges Ahead, Palgrave Macmillan, September.
Schreiber, D. and I.A. Pincherio (2009), “Outsourcing of R&D activities to Brazilian subsidiaries”, The Flagship Research Journal of International Conference of the Production and Operations Management Society, vol. 2, No. 1, January-June.
Tavares, A. and S. Young (2005), “FDI and multinationals: patterns, impacts and policies”, International Journal of the Economics of Business, vol. 12, No. 1, February.
The Economist (2009), “Spanish companies in Latin America, A good bet? Investments in Latin America offer protection against Spain’s slowdown”, 30 April.
UNCTAD (United Nations Conference on Trade and Development) (2009), World Investment Report 2009. Transnational Corporations, Agricultural Production and Development (UNCTAD/WIR/2009), Geneva. United Nations publication, Sales No. 09.II.D.15.(2005), World Investment Report 2005. Transnational Corporations and the Internationalization of R&D (UNCTAD/WIR/2005), Geneva. United Nations publication, Sales No. E.05.II.D.10.
Van Dijk, M., F. Weyzig and R. Murphy (2006), The Netherlands: A Tax Heaven?, SOMO, November.
Vasconcelos, Y. (2010), “Brazilian multinationals centers”, Revista pesquisa FAPESP, printed edition, September.
Vergara, S. (2012), “Innovation and Profitability in Chile: Evidence from Industrial Plants”, unpublished.
Vodusek, Z. (2002), Inversión extranjera directa en América Latina. El papel de los inversores europeos, Washington, D.C., Inter-American Development Bank (IDB).
Zhan, J. (2006), “FDI Statistics. A Critical Review and Policy Implications”, unpublished.

Foreign Direct Investment in Latin America and the Caribbean • 2011 93
Annex
Figure II.A-1 EUROPEAN UNION AND DEVELOPING COUNTRIES: SHARE OF GLOBAL OUTWARD FOREIGN DIRECT INVESTMENT, 1990-2010
(Percentages)
0
10
20
30
40
50
60
70
80
1990 1992 1994 1996 1998 2000 2002 2004 2006 2008 2010
Developing countries European Union
Source: Economic Commission for Latin America and the Caribbean (ECLAC), on the basis of figures from the United Nations Conference on Trade and Development (UNCTAD).
Figure II.A-2 LATIN AMERICA AND THE CARIBBEAN (SELECTED COUNTRIES): RATIO OF FOREIGN DIRECT INVESTMENT FROM THE EUROPEAN
UNION TO GROSS DOMESTIC PRODUCT, 2010 (Percentages)
0.0
0.5
1.0
1.5
2.0
2.5
3.0
3.5
Chile Mexico Argentina Uruguay DominicanRep.
Brazil Costa Rica Paraguay Colombia Ecuador
Source: Economic Commission for Latin America and the Caribbean (ECLAC), on the basis of official figures provided by the central banks of the respective countries.
Table II.A-1 EUROPEAN UNION: STOCK OF FOREIGN DIRECT INVESTMENT, 2010
(Millions of dollars and percentages)
Regions/Countries European Union Spain United Kingdom Netherlands Italy Germany France
Outside the European Union 5 505 488 306 484 88 6176 258 587 126 841 459 710 576 014
Latin America and the Caribbean
Sum 510 343 200 194 23 805a 20 359b 13 280 27 162a 39 950
Percent 9% 65% 3% a 8%b 10% 6%a 7%
Brazil
Sum 248 942 70 079 9 766 10 802 7 166 14 810 29 785
Percent 49% 35% 43% 51% 43% 46% 75%
Mexico 107 497 45 561 5 259 12 271 1 665 7 111 3 709
Argentina 65 702 39 946 ... 1 261 1 539 2 088 2 256
Chile 32 040 17 825 818 2 206 542 1 510 878
Venezuela (Bolivarian Republic of)
-6 479 3 172 ... 672 1 029 200 1 925
Colombia 20 031 … 3 933 464 ... ... 240
Uruguay 8 042 3 810 ... 95 274 155 541
Source: Economic Commission for Latin America and the Caribbean (ECLAC), on the basis of data from the Statistical Office of the European Communities (EUROSTAT).a Data for 2008.b Data for 2005.

Economic Commission for Latin America and the Caribbean (ECLAC)94
Table II.A-2 EUROPEAN UNION (SELECTED COUNTRIES): FOREIGN DIRECT INVESTMENT FLOWS TO LATIN AMERICA
AND THE CARIBBEAN, 2000-2010 (Millions of dollars)
Country 2000 2001 2002 2003 2004 2005 2006 2007 2008 2009 2010
France 3 557 5 831 1 223 -1 267 421 2 138 2 632 2 168 5 257 5 353 5 251
Germany 2 512 -49 -396 -283 2 903 1 873 2 624 2 383 13 646 2 344
Italy 1 132 962 418 213 238 3 946 9 174 3 998 2 843 1 477 967
Netherlands 822 2 207 492 1 930 86 1 816 971 1 965 -1 630 1 830 744
Spain 21 001 9 123 4 884 2 519 11 376 6 870 9 169 18 273 19 945 5 779 2 887
United Kingdom 521 2 006 2 525 3 033 6 246 720 4 072 3 226 3 141 1 089 3 810
Total 38 577 25 143 7 399 5 052 23 690 17 582 17 932 33 484 34 592 17 955 18 147
Source: Economic Commission for Latin America and the Caribbean (ECLAC), on the basis of data from the Statistical Office of the European Communities (EUROSTAT).
Table II.A-3 LATIN AMERICA (SELECTED COUNTRIES): FOREIGN DIRECT INVESTMENT FLOWS FROM THE EUROPEAN UNION, 2000-2010
(Millions of dollars)
Country 2000 2001 2002 2003 2004 2005 2006 2007 2008 2009 2010
Argentina 8 534 1 160 -878 -202 1 418 3 029 4733 4093 2717 1 232 3 356
Brazil 19 542 10 582 9 815 4 686 12 318 9 225 8 701 2 0582 19 866 14 470 14 477.2
Chile 1 097 2 040 1645 507 3 903 683 3 115 3 856 5291 4 347 5 883
Colombia 1 317 654 156 436 193 4 727 699 -469 334 152 297
Costa Rica 39 33 223 93 60 62 111 435 230 161 175
Dominican Republic 385 505 305 27 281 437 464 866 812 341 403
Ecuador … … 127 102 89 -4 77 231 366 -45 24
Mexico 3 248 6 475 9154 6141 12 996 7 943 7 001 13 615 9374 5 968 11 181
Paraguay … … 0 -7 59 -2 -89 66 63 8 43
Uruguay … 36 116 92 84 266 116 322 356 271 …
Source: Economic Commission for Latin America and the Caribbean (ECLAC), on the basis of official figures provided by the central banks of the respective countries.
Table II.A-4 SOUTH AMERICA: BILATERAL INVESTMENT TREATIES WITH EUROPEAN UNION COUNTRIES, 2011
(Date entering force)
Arg
entin
a
Bol
ivia
(P
lurin
atio
nal
Sta
te o
f)
Bra
zil
Chi
le
Col
ombi
a
Ecu
ador
Par
agua
y
Per
u
Uru
guay
Ven
ezue
la(B
oliv
aria
n R
epub
lic o
f)
Germany 1993 1990 1995 a 1999 1999 1998 1997 1990 1998
Austria 1995 2002 2000 2000
Belgium-Luxembourg 1994 2004 1999 a 1999 2004 2008 1999 2004
Denmark 1995 1997 1995 a 1995 1993 a 1995 1996
Spain 1992 2004 1994 2007 1997 1996 1996 1994 1997
Finland 1996 1995 a 1996 2001 1996 2004
France 1993 1996 1995 a 1994 1996 1980 1996 1997 2004
Greece 1999 a 2002
Italy 1993 1992 1995 a 1995 2005 1999 a 1995 1998 2001 a
Netherlands 1994 1994 1998 a 1998 a 2001 1994 1996 1991 1993
Portugal 1996 1994 a 1998 2001 1995 1999 1995
United Kingdom 1993 1990 1994 a 1997 2010 a 1995 1992 1994 1997 1996
Sweden 1992 1992 1995 2002 1994 1999 1998
Source: Economic Commission for Latin America and the Caribbean (ECLAC), on the basis of United Nations Conference on Trade and Development (UNCTAD) and Organization of American States (OAS).
a Treaties signed but still not in force.
.

Foreign Direct Investment in Latin America and the Caribbean • 2011 95
Table II.A-5 LATIN AMERICA AND THE CARIBBEAN (SELECTED COUNTRIES): STOCK OF FOREIGN DIRECT INVESTMENT
IN THE EUROPEAN UNION, 2006-2010 (Millions of dollars)
Country 2006 2007 2008 2009 2010
Argentina 1 806 1 981 2 342 2 455 …
Brazil … 56 306 56 549 65 618 79 919
Chile 3 775 3 957 3 440 4 075 4 611
Colombia 378 2 536 2 862 …. …
Mexico 9 677 10 680 10 918 14 395 …
Uruguay 859 2 291 3 933 3 943 …
Venezuela (Bolivarian Republic of) 21 114 2 256 2 927 3 373 …
Others 8 745 11 783 12 882 18 431 …
Source: Economic Commission for Latin America and the Caribbean (ECLAC), on the basis of figures provided by the Statistical Office of the European Communities (EUROSTAT) and the central banks of the respective countries.
Table II.A-6 LATIN AMERICA: ACQUISITION OF EUROPEAN UNION COMPANIES OR ASSETS BY TRANS-LATINS, 2006-2011
(Millions of dollars)
Year Acquiring company Home country Company or asset acquired Country Sector Value
2010 Vale SA Brazil BSG Resources Guinea United Kingdom Mining 2 500
2010 Votorantim Brazil CIMPOR Cimentos de Portugal Portugal Cement 1 183
2010 Telemar Norte Leste Brazil Portugal Telecom Portugal Telecommunications 961
2008 Magnesita Brazil LWB Refractories GmbH Germany Mining 943
2007 Grupo Aldesa Costa Rica Becosa Energías Renovables Spain Renewable energies 537
2009 Banco Itaú Brazil Banco Itaú Europa Portugal Banking 498
2008 Marfrig Brazil Moy Park Ireland Food 460
2010 JBS SA Brazil Inalca SpA Italy Food 424
2008 Gerdau Brazil Corporación Sidenor Spain Steel 286
2009 Suzano Petroquímica Brazil Basell Polyolefins BV Netherlands Peterochemicals 240
2010 Camargo Correa Brazil CIMPOR Cimentos de Portugal Portugal Cement 180
2009 Banco Bradesco Brazil Banco Espíritu Santo Portugal Banking 131
2010 Navieras Ultragas Chile Eitzen Bulk Shipping Denmark Shipping 92
2010 Petrominerales Colombia Pan Andean Resources PLC Ireland Oil 25
2011 Pemexa Mexico Repsol Spain Oil …
2006 Cemex Mexico Hormigones Ciudad Real Spain Cement …
Source: Economic Commission for Latin America and the Caribbean (ECLAC) on the basis of information from Thomson Reuters. a Pemex’s purchase of a 4.6% stake in Repsol brought its holding in the latter up to 9.6%.
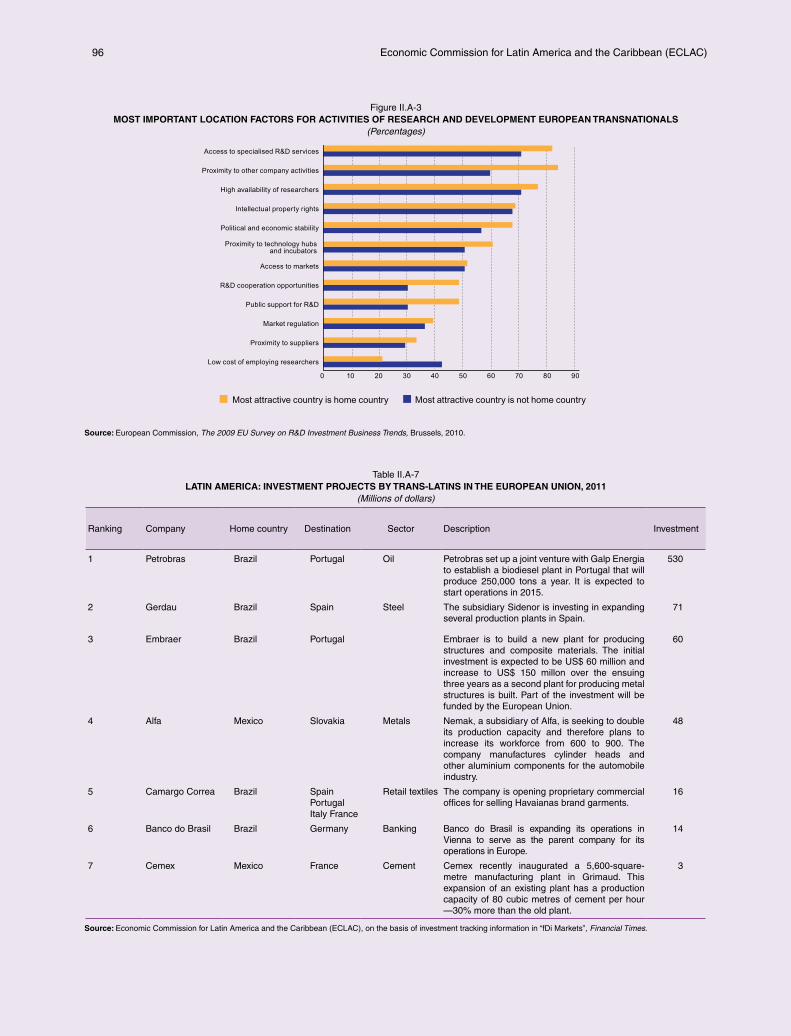
Economic Commission for Latin America and the Caribbean (ECLAC)96
Figure II.A-3 MOST IMPORTANT LOCATION FACTORS FOR ACTIVITIES OF RESEARCH AND DEVELOPMENT EUROPEAN TRANSNATIONALS
(Percentages)
0 10 20 30 40 50 60 70 80 90
Low cost of employing researchers
Proximity to suppliers
Market regulation
Public support for R&D
R&D cooperation opportunities
Access to markets
Proximity to technology hubs and incubators
Political and economic stability
Intellectual property rights
High availability of researchers
Proximity to other company activities
Access to specialised R&D services
Most attractive country is home country Most attractive country is not home country
Source: European Commission, The 2009 EU Survey on R&D Investment Business Trends, Brussels, 2010.
Table II.A-7 LATIN AMERICA: INVESTMENT PROJECTS BY TRANS-LATINS IN THE EUROPEAN UNION, 2011
(Millions of dollars)
Ranking Company Home country Destination Sector Description Investment
1 Petrobras Brazil Portugal Oil Petrobras set up a joint venture with Galp Energia to establish a biodiesel plant in Portugal that will produce 250,000 tons a year. It is expected to start operations in 2015.
530
2 Gerdau Brazil Spain Steel The subsidiary Sidenor is investing in expanding several production plants in Spain.
71
3 Embraer Brazil Portugal Embraer is to build a new plant for producing structures and composite materials. The initial investment is expected to be US$ 60 million and increase to US$ 150 millon over the ensuing three years as a second plant for producing metal structures is built. Part of the investment will be funded by the European Union.
60
4 Alfa Mexico Slovakia Metals Nemak, a subsidiary of Alfa, is seeking to double its production capacity and therefore plans to increase its workforce from 600 to 900. The company manufactures cylinder heads and other aluminium components for the automobile industry.
48
5 Camargo Correa Brazil Spain Portugal Italy France
Retail textiles The company is opening proprietary commercial offices for selling Havaianas brand garments.
16
6 Banco do Brasil Brazil Germany Banking Banco do Brasil is expanding its operations in Vienna to serve as the parent company for its operations in Europe.
14
7 Cemex Mexico France Cement Cemex recently inaugurated a 5,600-square-metre manufacturing plant in Grimaud. This expansion of an existing plant has a production capacity of 80 cubic metres of cement per hour —30% more than the old plant.
3
Source: Economic Commission for Latin America and the Caribbean (ECLAC), on the basis of investment tracking information in “fDi Markets”, Financial Times.

97Foreign Direct Investment in Latin America and the Caribbean • 2011
Chapter III
The international financial crisis, banking and foreign direct investment in Latin America and the Caribbean
A. Introduction
In the past few years deregulation and technological advances have produced sweeping changes
in the financial sector, so central to economic development. The industry has burgeoned and
become very rapidly concentrated. Financial markets have become increasingly integrated
locally, regionally and globally and this, combined with proliferating financial innovation,
has facilitated speculative behaviour.
The developed countries have the deepest and most sophisticated financial systems, whereas the developing economies have, broadly speaking, less developed financial sectors and industries. Yet this situation has changed significantly in recent times: a number of developing countries and their banking systems appear relatively stable and solvent and have begun to gain international stature, while the advanced economies have found themselves at the eye of the greatest financial crisis since the Great Depression of the 1930s.
This chapter looks at the main changes in the financial industry and the factors which have led to the difficult situation today. The largest banks have deployed strategies which have, in various ways, driven the industry’s transformation: they have increased in size, diversified
their activities, internationalized their operations and made heavy use of financial innovations to increase their profits. The Latin American and Caribbean region has been a key player in one of these aspects —the arrival of foreign banks in local financial systems. In fact, Latin America, together with Eastern Europe, is the developing region which has seen the most prolific local start-ups by foreign banks.
Accordingly, here the development of Latin America’s banking industry will be examined, along with the role of foreign banks in this process. The banking industry has grown very rapidly in the region in the past few years and, perhaps more importantly, has shown good, stable capitalization and liquidity indicators. This chapter will look at the entry strategies of the main foreign banks and

Economic Commission for Latin America and the Caribbean (ECLAC)98
their significance in local banking markets, as well as how these banks behave and perform compared to local banks in terms of management, introduction of products and services, solvency, profitability, costs and so forth. Lastly, in view of
the significance of European banks in Latin America, the chapter turns to an analysis of the destabilizing effects these banks could have as a result of the international financial crisis. The final section concludes.
B. The global financial system: boom and bust
Properly channelled, the financial system is a key piece in long-term economic development. The links between financial activity —through savings and investment decisions— and economic growth are amply documented (Levine, 1997; Woodford, 2010). Nevertheless, despite their high correlation, causality between the two is not well established. Generally speaking, inasmuch as income levels rise, so does demand for financial services and the role of borrowing systems grows within an economy (see figure III.1). When institutional conditions are right, moreover, the financial system can help to overcome capital restraints on business and sector expansion and thereby stimulate growth.
Figure III.1 SELECTED COUNTRIES: INCOME LEVEL AND DEPTH OF THE
BANKING SYSTEM, 2010 (Thousands of dollars and percentages of GDP)
0
5
10
15
20
25
30
35
40
45
50
0 50 100 150 200 250 300 350
Per
cap
ita G
DP
Japan
Spain
United Kingdom
United StatesNetherlands
Germany
France
China
Brazil
Republic of Korea
India
Mexico
Russian Federation
Domestic credit extended by the banking sector
Source: Economic Commission for Latin America and the Caribbean (ECLAC), on the basis of World Bank, World Development Indicators (WDI) [online] http://data.worldbank.org/indicator.
Financial systems perform key functions which enable and facilitate the generation, allocation and use of capital: they produce information about possible investments and allocate capital; monitor investments and exert corporate
governance after providing finance; facilitate the trading, diversification, and management of risk; mobilize and pool savings; and ease the exchange of goods and services (Levine, 2004). Financial sector development, then, broadens options for channelling savings and thereby the modalities of financing. This gives economic agents access to the resources they need for medium- and long-term enterprise, such as slow-maturing projects and housing. This in turn facilitates the emergence of new firms and the realization of investment opportunities, as well as better use of production potential.
The changes sweeping through financial systems in the past few years in the wake of deregulation and technological progress have brought new savings and credit opportunities for individuals, households and companies.1 Advanced economies, generally speaking, have the deepest and most sophisticated financial systems, of which the banking sector is a main —but not the only— component (see figure III.2). Banks have also diversified and expanded from their traditional role of taking deposits and extending loans into transactions that generate revenue from commissions, such as loan securitization2 and risk management products.3 In developing economies, the banking system is usually
1 Individuals and households have access to a broader range of borrowing options (credit cards, consumer loans and home equity loans) and can easily invest in a wide range of financial instruments, such as stocks, bonds, mutual funds, and derivatives. Firms have been able to increasingly diversify their financing away from banks through the issuance of bonds in capital markets (IMF, 2006).
2 Securitization is a financial practice consisting of pooling various types of contractual debt —residential and commercial mortgages, auto loans and credit card debts— and transforming them into transferrable securities, such as bonds or collateralized mortgage obligations (CMO), which can be sold in an organized market. This transfers financial risk and converts illiquid assets into tradable, immediately transferrable assets.
3 The best known risk management products are credit default swaps (CDS), which are risk hedging operations that protect the holder of a credit instrument against default by the issuer. These hedges are usually applied to public and private debt and mortgage securities.

99Foreign Direct Investment in Latin America and the Caribbean • 2011
the largest component of the financial sector (see figure III.2).
Financial system development was expected to make the market function more efficiently and provide fuller information, enable agents to maximize their investments (depending on their risk propensity and wealth level), and allow asset prices to reach an optimum level (Fama, 1970). But multiple problems arose in markets, making price behaviour unstable and prone to large distortions, which increased systemic risk (Segura, 2010). A large-scale crisis thus began to brew, encompassing markets for equity, bonds, currencies and other financial instruments around the world, and with them a large chunk of the real economy. Today, amid the ongoing fallout and implications of the crisis, there is mounting consensus that the financial industry has operated in an incomplete and asymmetric manner. This is leading to efforts to strengthen regulation and oversight of financial markets to make them more transparent and minimize their frequent turbulence (Cihák and Podpiera, 2006).
Figure III.2 SELECTED COUNTRIES AND REGIONS: NATIONAL FINANCIAL
SYSTEMS, 1990-2009 (Percentages of GDP)
0
50
100
150
200
250
300
350
1990-1999
2000-2009
1990-1999
2000-2009
1990-1999
2000-2009
1990-1999
2000-2009
1990-1999
2000-2009
1990-1999
2000-2009
1990-1999
2000-2009
Developing Asia
China India Eastern Europe
Latin America
Group of Seven (G7)
Other advanced economies
Banks Bonds Capital
Source: Economic Commission for Latin America and the Caribbean (ECLAC), on the basis of World Bank, Financial Development in Latin America and the Caribbean: The Road Ahead, Washington, D.C., 2012.
Note: The data show total banking assets, bonds in circulation and stock market capitalization as percentages of GDP.
1. Regulatory and institutional change in the world’s financial systems: similarities and differences with respect to the experience in Latin America
The financial sector became very heavily regulated in the wake of the economic crisis of 1929. The Glass-Steagall Act passed in the United States provided measures for rebuilding confidence and preventing financial entities from speculating with savers’ deposits.4 During the next four decades, competition between financial institutions remained limited in most of the advanced economies, and interest rates and universal bank operations were regulated. The Securities and Exchange Commission (SEC) was set up and central banks began to act as lenders of last resort.
4 The most salient features of the Glass-Steagall Act of 1933 were: (a) total separation of banking and stock market activities, and of commercial banking and investment banking; (b) the creation of a banking system consisting of national, state and local banks subject to the Sherman Antitrust Act to prevent unfair competition between them; (c) banks’ prohibition from handling pension funds; (d) bankers were forbidden to sit on the boards of firms and utilities, and (e) the creation of independent oversight institutions for stock markets and financial markets, such as the Securities and Exchange Commission (SEC).
Starting in the 1970s, however, interest rate controls began to be gradually relaxed, the restrictions preventing convergence between activities conducted by entities in different spheres were lifted, and investment bank operations were gradually deregulated (see diagram III.1). In the United Kingdom, financial deregulation (what became known as the “Big Bang”) began under Margaret Thatcher, encompassing both the stock market and the removal of controls on financial transactions. In the United States, under President Reagan, the Federal Reserve began to “reinterpret” the Glass-Steagall Act and to allow bank subsidiaries to engage in investment business. In the 1990s, the global economy was performing in a fairly stable manner; there were only a few crises of a largely regional nature and these were quickly resolved. In this scenario, liberalization and financial sector opening became surrounded by an “aura of optimism” and received explicit backing from international organizations such as the International Monetary Fund (IMF) and the World Bank and from senior figures in some of the world’s largest economies, and this helped to sweep them across the globe.
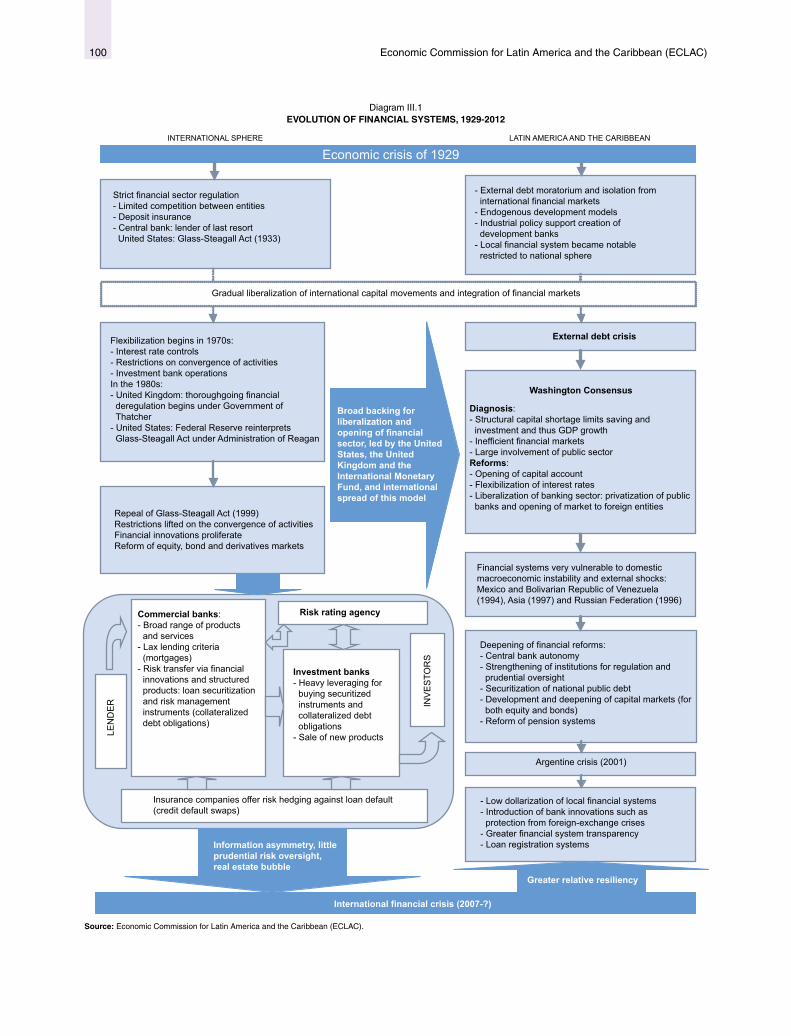
Economic Commission for Latin America and the Caribbean (ECLAC)100
Diagram III.1 EVOLUTION OF FINANCIAL SYSTEMS, 1929-2012
Economic crisis of 1929
Strict financial sector regulation- Limited competition between entities- Deposit insurance- Central bank: lender of last resort United States: Glass-Steagall Act (1933)
- External debt moratorium and isolation from international financial markets
- Endogenous development models- Industrial policy support creation of
development banks- Local financial system became notable
restricted to national sphere
Gradual liberalization of international capital movements and integration of financial markets
Flexibilization begins in 1970s:- Interest rate controls- Restrictions on convergence of activities- Investment bank operationsIn the 1980s:- United Kingdom: thoroughgoing financial
deregulation begins under Government of Thatcher
- United States: Federal Reserve reinterprets Glass-Steagall Act under Administration of Reagan
External debt crisis
Washington Consensus
Diagnosis:- Structural capital shortage limits saving and
investment and thus GDP growth- Inefficient financial markets- Large involvement of public sectorReforms:- Opening of capital account- Flexibilization of interest rates- Liberalization of banking sector: privatization of public
banks and opening of market to foreign entitiesRepeal of Glass-Steagall Act (1999)Restrictions lifted on the convergence of activitiesFinancial innovations proliferateReform of equity, bond and derivatives markets
Financial systems very vulnerable to domestic macroeconomic instability and external shocks: Mexico and Bolivarian Republic of Venezuela (1994), Asia (1997) and Russian Federation (1996)
Deepening of financial reforms:- Central bank autonomy- Strengthening of institutions for regulation and
prudential oversight- Securitization of national public debt- Development and deepening of capital markets (for
both equity and bonds)- Reform of pension systems
Argentine crisis (2001)
- Low dollarization of local financial systems- Introduction of bank innovations such as
protection from foreign-exchange crises- Greater financial system transparency- Loan registration systems
LEN
DE
R INV
ES
TOR
S
Commercial banks:- Broad range of products
and services- Lax lending criteria
(mortgages)- Risk transfer via financial
innovations and structured products: loan securitization and risk management instruments (collateralized debt obligations)
Investment banks- Heavy leveraging for
buying securitized instruments and collateralized debt obligations
- Sale of new products
Risk rating agency
Insurance companies offer risk hedging against loan default (credit default swaps)
Information asymmetry, little prudential risk oversight, real estate bubble
Greater relative resiliency
International financial crisis (2007-?)
Broad backing for liberalization and opening of financial sector, led by the United States, the United Kingdom and the International Monetary Fund, and international spread of this model
INTERNATIONAL SPHERE LATIN AMERICA AND THE CARIBBEAN
Source: Economic Commission for Latin America and the Caribbean (ECLAC).

101Foreign Direct Investment in Latin America and the Caribbean • 2011
In the case of Latin America, which had been badly hit by the external debt crisis of the 1980s, the diagnosis offered was that the region suffered from a structural shortage of capital, which constrained saving and investment and therefore long-term economic growth. National banks and financial agents were considered to be functioning inefficiently, as well. Accordingly, an ambitious reform plan was devised, inspired by Anglo-Saxon liberal thinking and supported by international agencies: the Washington Consensus (see diagram III.1). In the financial sphere, the order of the day was capital account opening, along with liberalization of local capital markets and the banking sector. This was expected to increase domestic saving, which would be complemented by external saving, and favour efficient resource allocation. Among the most significant measures, interest rate controls were eased, public banks were closed or privatized, restrictions on entry of foreign firms were lifted and banks’ operating scope was broadened to increase competition.
However, difficulties in controlling national macroeconomic instability and in mitigating external shocks —such as the Mexican crisis (1994), the Asian crisis (1997) and the Russian crisis (1998)— showed up the fragility of Latin America’s financial systems. Shortcomings in bank management and oversight encouraged burgeoning consumption and a sharp rise in borrowing by economic agents, which led to frequent and severe financial crises, in which bank capital was eroded and multiple financial entities failed (Frenkel, 2003; Demirgüç-Kunt and Detragiache, 2005). New legal and institutional reforms were gradually implemented with the aim of strengthening the financial sector. Most important among these were central bank autonomy, the strengthening of regulation and prudential oversight systems, the development and deepening of capital markets for both stocks and bonds (backed by public debt securitization), and the privatization of pension systems and their migration to individual capitalization schemes.
Towards the late 1990s, the changes occurring on the world stage gathered pace and deepened with the technological revolution. In this context, two emerging trends became highly relevant:
• Rapid and intensive integration of financial markets. At the national level, links were strengthened between various entities through the interbank markets and the payment system. At the international level, the various financial markets became highly interconnected as a result of free movement of capital in most of the world’s economies and the rapid spread of information and communications technologies (ICTs).
• The emergence and proliferation of financial innovations and highly risk-prone operators. Notable among the first are what are known as structured products, and among the second are hedge funds (also known as alternative investment vehicles or high-risk funds), which by their nature and means of operating compromised market stability.5
In the United States, these accelerating changes were to become emblematic. In 1998 a merger was authorized between Citibank, the insurance company Travelers and Salomon Smith Barney, a major investment bank. In 1999 the Glass-Steagall Act was repealed and a year later the Commodity Futures Modernization Act was passed, which limited the role of federal agencies (such as the Securities and Exchange Commission) in the regulation and oversight of derivatives markets. This, in practice, sanctioned more risky financial transactions.
Soon after 2000, the rapid changes in the international financial system began to show potentially harmful effects. In fact, the stock market crash associated with information technology firms led to a sharp slowdown in the global economy. The central banks of the world’s largest economies responded by implementing expansionary monetary policies, ushering in a long period of very low interest rates and thereby facilitating liquidity, borrowing, consumption and, indirectly, speculative investment. In the United States, for example, the interest rate fell from 6.5% in November 2000 to 1.8% in December 2001, and remained at those sorts of levels until mid-2004.
Ultimately, the consolidation of the ideological paradigms underlying market deregulation, together with technological change, began to entrench the traditional roles of the financial industry. In the United States and the United Kingdom the financial market gained greater significance, although it also left much of society, basically households and small and medium-sized enterprises (SMEs), outside financing circuits. In continental Europe the banking system continued to fulfil a very important function, although it embraced many of the financial innovations. The banking network’s high capillarity enabled it to offer a wide range of services, including risk hedging and payments, and to cover most territory and agents.
As noted earlier, as a result of Latin America’s traumatic experiences in the wake of the Washington Consensus,
5 Structured products, also known as market-linked investments, are fixed-income financial investment vehicles whose value is derived from a single equity, a basket of securities, options, raw materials, debt issues or foreign exchange. These products are based on an underlying financial swap and are traded bilaterally outside the stock market, which makes them difficult to price. Some of the best-known structured products are collateralized debt obligations (CDOs), mortgage-backed securities (MBS), special purpose vehicles (SPVs) and structured investment vehicles (SIVs).

Economic Commission for Latin America and the Caribbean (ECLAC)102
many of the region’s governments were already aware of the need to channel financial activities by means of sound public policies and adequate regulation. However, early in the new century, the bursting of the dot.com bubble, the financial crisis in Argentina and banking problems in Mexico prompted new reforms aimed at strengthening regional financial markets and making them more transparent. Since then, sound economic performance in the region, especially in South America, has underpinned rapid development in the banking sector.
So, a sophisticated financial system may be an efficient mechanism to meet the financial needs of highly developed
economies with a broad financial culture and large firms spearheading economic activity and maintaining strong links abroad. But in developing countries, with their specialization in primary sectors of production and incipient financial development, it seems necessary to have a strong banking system able to capture the savings produced by the economy, evaluate the risk associated with investment projects, generate the confidence of small savers and investors and manage the payments system efficiently. It would make little sense to seek rapid capital market development in a country which has only a narrow base of agents capable of accessing these borrowing mechanisms.
2. Transforming the global financial system: too big to fail?
Simply put, the traditional business of banks has been to capture funds from individuals or entities with a capital surplus and channel them to economic agents which need them. The basic premise of this process of financial intermediation is to obtain sufficient margin, i.e. an attractive difference, between the cost of deposits taken and the yield on funds lent. In the 1990s, banks in industrialized countries had large capital surpluses, but amid mounting competition pressure began to mount to lower costs and find ways to increase steadily shrinking profit margins. Moreover, their domestic markets, their main source of income, were reaching maturity and offering few new opportunities.
With deregulation of the banking industry, new possibilities began to emerge which transformed the very foundations of the sector. The largest banks, for example, began to forge new strategies to revert the tendency towards smaller margins and generate more profits. In most cases, this strategy rested upon three main elements:
• Increasing market share and diversifying activities towards a universal business model,
• Increasing global influence by taking advantage of the growing integration of financial markets, and
• Making use of financial innovations based on heavily leveraged investment financing.6
(a) Consolidating financial systems: the march towards universal banking aimed primarily at the domestic market
The financial sector, and particularly the banking industry, has grown hugely in the past 20 years, and never more so
6 As well as improving profits of shareholders capital, greater leverage helps to reduce financing costs, since the inclusion of debt on the balance sheet reduces capital costs (inasmuch as it generates a multiplier effect on investors’ own resources).
than in the first half of the 2000 decade. In that period, as well as increasing in size, the industry further swelled its profits (see figure III.3). The large banks in the advanced economies were the major players in this process. In fact, 600 of the world’s 1,000 largest banks, representing three quarters of the entire industry’s assets and profits, were in the United States, Japan and the European Union (see figure III.4).
At the national and international levels, the banking sector underwent rapid consolidation, driven by competition and the quest for size, efficiency and synergies. In the search for economies of scale, mergers and acquisitions —not organic growth— became the instrument of choice and a common event in many countries. In fact, the banking sector has been one of the most active in such transactions at the global level, along with telecommunications, media and entertainment corporations, and energy companies (see figure III.5). The great majority of the largest operations have been mergers between firms in the same countries in the world’s principal markets (see table III.1).
As a result of this process, concentration in the sector increased and so did the power and importance of the largest banks. This occurred in both emerging and developed economies. In the European Union, notwithstanding differences between countries, the five largest banks had a market share of around 40% (FBE, 2011). In the United States and Japan, concentration was even higher, with that figure over 60% (see figure III.6).
In the United States, financial industry mergers and acquisitions have multiplied in the past few decades and since the late 1990s such operations have taken place increasingly across different segments. Between 2000 and 2010 the assets of the three largest banks (JP Morgan, Citigroup and Bank of America) rose from 19% to 43% as a proportion of GDP. Yet the significance of the banking sector did not change greatly within the economy (see figure III.7). This was also true of Japan, although here

103Foreign Direct Investment in Latin America and the Caribbean • 2011
the lack of overall expansion was due to a deep crisis in the banking industry in the second half of the 1990s.7
Driven by the formation of a single market, the banking industry in the European Union rapidly became more concentrated and grew into a much larger component of the economy, especially in France, Germany, the Netherlands, Spain, the United Kingdom and some Scandinavian countries (see figure III.7). This process made the largest national banks even more powerful (EBF, 2011). The banking sector’s weight in the European economies also reflects their role as international financial centres, however, especially in the cases of the Netherlands and the United Kingdom.
Figure III.3 WORLD’S 1,000 LARGEST BANKS, 1990-2011
(Assets in trillions of dollars and profits in billions of dollars)
0
100
200
300
400
500
600
700
800
900
1 000
1 100
0
1 000
2 000
3 000
4 000
5 000
6 000
7 000
8 000
9 000
10 000
11 000
1990 1993 1996 1999 2002 2005 2008 2011
Assets (left scale) Pre-tax profits (right scale)
Source: Economic Commission for Latin America and the Caribbean (ECLAC), on the basis of The Banker, “Top 1000 world banks”, several issues.
Figure III.4 WORLD’S 1,000 LARGEST BANKS: NUMBER OF ENTITIES,
ASSETS AND PRE-TAX PROFITS, BY ORIGIN OF BANKS, 1995-2010
(Percentages)
0
10
20
30
40
50
60
70
80
90
100
1995 2000 2004 2010 1995 2000 2004 2010 1995 2000 2004 2010Number of banks Assets Pre-tax profits
European Union United StatesJapan
Asia (not including Japan) Rest of Europe Middle East
Latin AmericaRest of the world
Source: Economic Commission for Latin America and the Caribbean (ECLAC), on the basis of The Banker, “Top 1000 world banks”, several issues.
7 In the mid-1980s, while the United States was becoming a net borrower, Japan was becoming the world’s largest creditor. In the 1990s, Japan’s financial system suffered a severe crisis after the bursting of the stock market and real estate bubbles, and this gave way to an intensive reorganization and concentration of the industry.
Figure III.5 BANKING SECTOR MERGERS AND ACQUISITIONS
WORLDWIDE, 1985-2011 (Number of transactions and billions of dollars)
0
100
200
300
400
500
600
700
0
500
1 000
1 500
2 000
2 500
3 000
1985 1987 1989 1991 1993 1995 1997 1999 2001 2003 2005 2007 2009 2011
Number of transactions (left scale) Amount (right scale)
Source: Economic Commission for Latin America and the Caribbean (ECLAC), on the basis of figures from Thomson Reuters.
Figure III.6 ADVANCED ECONOMIES (SELECTED COUNTRIES): FIVE LARGEST BANKS’ SHARE IN TOTAL ASSETS, 2001-2010
(Percentages)
0
10
20
30
40
50
60
70
80
90
Japan United States
Germany Spain France Italy Netherlands United Kingdom
European Union
2001 2005 2010
Source: Economic Commission for Latin America and the Caribbean (ECLAC), on the basis of The Banker, “Top 1000 world banks”, several issues.
Figure III.7 ADVANCED ECONOMIES (SELECTED COUNTRIES): NATIONAL
BANKING SECTOR ASSETS, 1990-2010 (Percentages of GDP)
0
100
200
300
400
500
600
700
Switzerland United Kingdom
Netherlands Sweden Spain France Denmark Germany United States
Japan
1990 2000 2010
Source: Economic Commission for Latin America and the Caribbean (ECLAC), on the basis of data from the European Central Bank, European Banking Federation (EBF), Independent Commission on Banking (ICB), and the World Bank.

Economic Commission for Latin America and the Caribbean (ECLAC)104
Table III.1 TWENTY LARGEST MERGERS AND ACQUISITIONS IN THE BANKING SECTOR, 1990-2011
(Billions of dollars)
Date Buyer Country Entity bought Country Amount
1998 NationsBank Corp United States BankAmerica Corp United States 61 633
2004 JPMorgan Chase & Co United States Bank One Corp United States 58 663
2004 Bank of America Corp United States FleetBoston Financial Corp United States 49 261
2009 Bank of America Corp United States Merrill Lynch & Co Inc. United States 48 766
2001 Sumitomo Bank Ltd Japan Sakura Bank Ltd Japan 45 494
2005 Mitsubishi Tokyo Fin Grp Japan UFJ Holdings Inc. Japan 41 431
2000 Fuji Bank Ltd Japan Dai-Ichi Kangyo Bank Ltd Japan 40 097
2000 Royal Bank of Scotland United Kingdom National Westminster Bank PLC United Kingdom 38 413
2007 Banca Intesa SpA Italy SanPaolo IMI SpA Italy 37 624
2006 Bank of America Corp United States MBNA Corp United States 35 810
1998 Norwest Corp United States Wells Fargo United States 34 353
1996 Mitsubishi Bank Ltd Japan Bank of Tokyo Ltd Japan 33 788
2000 Chase Manhattan Corp United States JP Morgan & Co Inc. United States 33 555
2000 Citigroup Inc. United States Associates First Capital Corp United States 30 957
2000 Fuji Bank Ltd Japan Industrial Bank of Japan Ltd Japan 30 760
1998 BANC ONE Corp United States First Chicago NBD Corp United States 29 616
2007 Unicredito Italiano SpA Italy Capitalia SpA Italy 29 528
2006 Wachovia Corp United States Golden West Financial Corp United States 25 501
2009 Lloyds TSB Group PLC United Kingdom HBOS PLC United Kingdom 25 439
1990 Mitsui Bank Ltd Japan Taiyo Kobe Bank Ltd Japan 23 017
Source: Economic Commission for Latin America and the Caribbean (ECLAC), on the basis of figures from Thomson Reuters.
Note: Shading denotes a merger.
The heavy concentration of the banking sector in national economies made the world’s largest credit institutions even larger. Between 2000 and 2011, the 20 largest banks increased their share in the industry’s total assets from around 30% to 40% (see table III2). In this concentration process, a small number of banks came to dominate national, regional and global markets. This is the group of institutions which has undergone the greatest changes in this period as a result of mergers and acquisitions and developments in the financial sector of the major global markets. Early in the 2000 decade, Japanese banks held one third of the assets of the 20 largest institutions, but this share halved during the deep, drawn-out crisis in the sector in Japan. The three largest banks in the United States have maintained their preponderance, but European banks, especially in the United Kingdom and, to a lesser extent, in France, have secured much larger shares in total assets. However, in the course of the recent financial crisis, some of the traditional banks in advanced economies have been displaced by new institutions from developing countries, especially China (see table III.2).
Some banks in the developing world are now very substantial and are enjoying rapid growth (The Economist, 2010). Chinese banks in the top 1,000 went from 15 in 2001 to 111 in 2010, Indian banks from 20 to 35 and Russian Federation banks from 13 to 31. Brazilian banks in the top 1,000 fell in number from 22 to 15, following heavy consolidation in the industry. However, some of Brazil’s largest banks jumped up in the ranking: Itaú rose from number 87 to 34, Banco do Brasil from 98 to 38 and Banco Brasileiro de Desconto S.A. (Bradesco) from 88 to 41 (The Banker, 2002 and 2011).
Local, regional and global consolidation in the financial sector has occurred both in specific segments and across the entire spectrum of the industry, resulting in the formation of large financial conglomerates offering commercial and investment banking, insurance and pension funds. This tendency, which has generally been justified on the grounds of efficiency and economies of scale, has led to mounting concern over the stability of the international financial system.

105Foreign Direct Investment in Latin America and the Caribbean • 2011
Table III.2 WORLD’S 20 LARGEST BANKS, BY ASSETS, 2000-2011
(Billions of dollars and percentages)
2000 2005 2011
Bank Country Assets Bank Country Assets Bank Country Assets
Deutsche Bank Germany 844 USB Switzerland 1 533 BNP Paribas France 2 671
Citigroup United States 717 Citigroup United States 1 484 Deutsche Bank Germany 2 548
BNP Paribas France 702 Mizuho Financial Group
Japan 1 296 Mitsubishi UFJ Financial Group
Japan 2 481
Mitsubishi Tokyo Financial Group
Japan 678 HSBC Holdings
United Kingdom
1 277 HSBC Holdings United Kingdom
2 455
Bank of America United States 633 Crédit Agricole
France 1 243 Barclays Bank United Kingdom
2 331
USB Switzerland 614 BNP Paribas France 1 234 Crédit Agricole France 2 314
HSBC Holdings United Kingdom
569 JP Morgan Chase & Co.
United States 1 157 Royal Bank of Scotland
United Kingdom
2 275
Fuji Bank Japan 531 Deutsche Bank
Germany 1 144 Bank of America United States 2 265
Sumitomo Bank Japan 508 Royal Bank of Scotland
United Kingdom
1 119 JP Morgan Chase & Co.
United States 2 118
HypoVereinsbank Germany 506 Bank of America
United States 1 110 Industrial Commercial Bank of China (ICBC)
China 2 032
Dai-Ichi Kangyo Bank
Japan 472 Barclays Bank
United Kingdom
992 Mizuho Financial Group
Japan 1 934
Norinchukin Bank Japan 470 Mitsubishi Tokyo Financial Group
Japan 980 Citigroup United States 1 914
ABN AMRO Bank Netherlands 460 Credit Suisse Group
Switzerland 963 ING Bank Netherlands 1 667
Credit Suisse Group
Switzerland 452 Sumitomo Mitsui Financial Group
Japan 897 Sumitomo Mitsui Financial Group
Japan 1 658
Sakura Bank Japan 443 ING Bank Netherlands 840 China Construction Bank Corporation
China 1 632
Crédit Agricole France 442 ABN AMRO Bank
Netherlands 829 Banco Santander Spain 1 628
Sanwa Bank Japan 429 Société Générale
France 819 Bank of China China 1 579
Industrial Commercial Bank of China (ICBC)
China 428 Banco Santander
Spain 784 Agricultural Bank of China
China 1 561
Société Générale France 408 HBOS United Kingdom
760 Lloyds Banking Group
United Kingdom
1 552
Chase Manhattan Corp a
United States 406 Groupe Caisse d’Epargne
France 741 Société Générale France 1 513
Share in total assets (percentages)
28.3 Share in total assets (percentages)
35.0 Share in total assets (percentages)
39.5
Source: Economic Commission for Latin America and the Caribbean (ECLAC), on the basis of The Banker, “Top 1000 world banks”, several issues.a In 2000, Chase Manhattan Corporation merged with JP Morgan & Co. to form what is now JP Morgan Chase & Co.
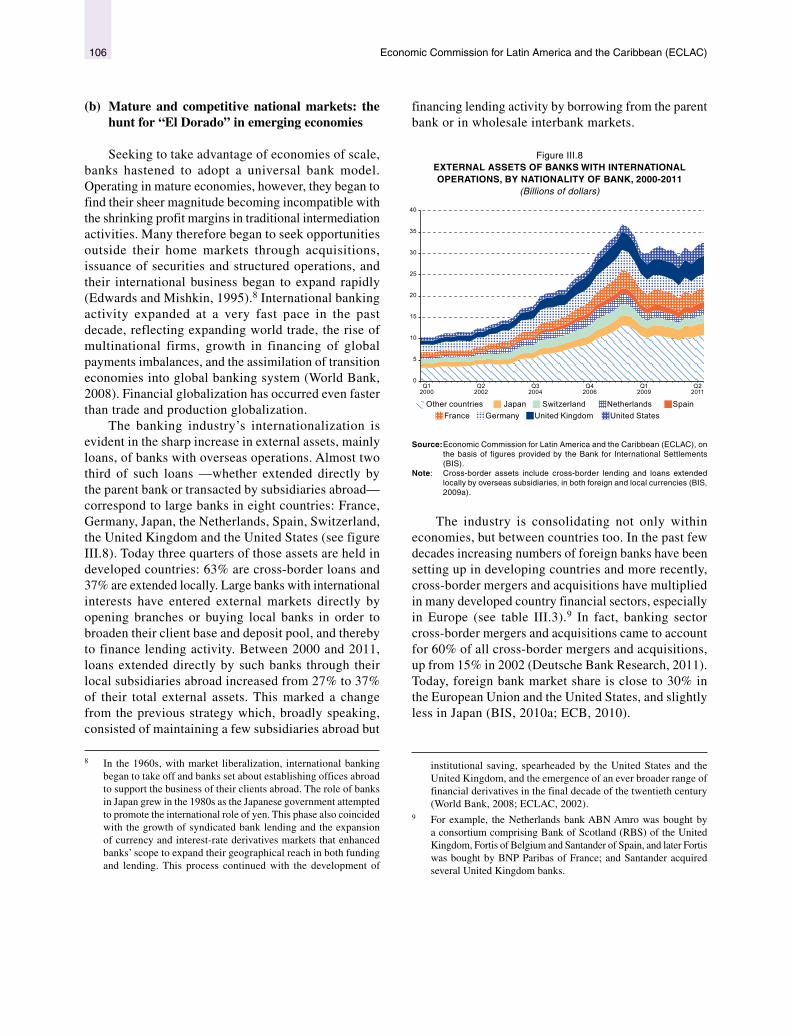
Economic Commission for Latin America and the Caribbean (ECLAC)106
(b) Mature and competitive national markets: the hunt for “El Dorado” in emerging economies
Seeking to take advantage of economies of scale, banks hastened to adopt a universal bank model. Operating in mature economies, however, they began to find their sheer magnitude becoming incompatible with the shrinking profit margins in traditional intermediation activities. Many therefore began to seek opportunities outside their home markets through acquisitions, issuance of securities and structured operations, and their international business began to expand rapidly (Edwards and Mishkin, 1995).8 International banking activity expanded at a very fast pace in the past decade, reflecting expanding world trade, the rise of multinational firms, growth in financing of global payments imbalances, and the assimilation of transition economies into global banking system (World Bank, 2008). Financial globalization has occurred even faster than trade and production globalization.
The banking industry’s internationalization is evident in the sharp increase in external assets, mainly loans, of banks with overseas operations. Almost two third of such loans —whether extended directly by the parent bank or transacted by subsidiaries abroad— correspond to large banks in eight countries: France, Germany, Japan, the Netherlands, Spain, Switzerland, the United Kingdom and the United States (see figure III.8). Today three quarters of those assets are held in developed countries: 63% are cross-border loans and 37% are extended locally. Large banks with international interests have entered external markets directly by opening branches or buying local banks in order to broaden their client base and deposit pool, and thereby to finance lending activity. Between 2000 and 2011, loans extended directly by such banks through their local subsidiaries abroad increased from 27% to 37% of their total external assets. This marked a change from the previous strategy which, broadly speaking, consisted of maintaining a few subsidiaries abroad but
8 In the 1960s, with market liberalization, international banking began to take off and banks set about establishing offices abroad to support the business of their clients abroad. The role of banks in Japan grew in the 1980s as the Japanese government attempted to promote the international role of yen. This phase also coincided with the growth of syndicated bank lending and the expansion of currency and interest-rate derivatives markets that enhanced banks’ scope to expand their geographical reach in both funding and lending. This process continued with the development of
financing lending activity by borrowing from the parent bank or in wholesale interbank markets.
Figure III.8 EXTERNAL ASSETS OF BANKS WITH INTERNATIONAL OPERATIONS, BY NATIONALITY OF BANK, 2000-2011
(Billions of dollars)
0
5
10
15
20
25
30
35
40
Q12000
Q22002
Q32004
Q42006
Q12009
Q22011
Other countries Japan Switzerland Netherlands Spain France Germany United Kingdom United States
Source: Economic Commission for Latin America and the Caribbean (ECLAC), on the basis of figures provided by the Bank for International Settlements (BIS).
Note: Cross-border assets include cross-border lending and loans extended locally by overseas subsidiaries, in both foreign and local currencies (BIS, 2009a).
The industry is consolidating not only within economies, but between countries too. In the past few decades increasing numbers of foreign banks have been setting up in developing countries and more recently, cross-border mergers and acquisitions have multiplied in many developed country financial sectors, especially in Europe (see table III.3).9 In fact, banking sector cross-border mergers and acquisitions came to account for 60% of all cross-border mergers and acquisitions, up from 15% in 2002 (Deutsche Bank Research, 2011). Today, foreign bank market share is close to 30% in the European Union and the United States, and slightly less in Japan (BIS, 2010a; ECB, 2010).
9 For example, the Netherlands bank ABN Amro was bought by a consortium comprising Bank of Scotland (RBS) of the United Kingdom, Fortis of Belgium and Santander of Spain, and later Fortis was bought by BNP Paribas of France; and Santander acquired several United Kingdom banks.
institutional saving, spearheaded by the United States and the United Kingdom, and the emergence of an ever broader range of financial derivatives in the final decade of the twentieth century (World Bank, 2008; ECLAC, 2002).

107Foreign Direct Investment in Latin America and the Caribbean • 2011
Table III.3 20 LARGEST CROSS-BORDER MERGERS AND AQUISITIONS IN THE BANKING SECTOR, 1990-2011
(Billions of dollars)
Date Buyer Country Entity bought Country Amount
2005 Unicredito Italiano SpA Italy HypoVereinsbank (HVB) Germany 18 256
2004 Banco Santander Spain Abbey National PLC United Kingdom 15 787
2003 HSBC Holdings PLC United Kingdom Household International Inc. United States 15 294
2001 Citigroup United States Banacci Mexico 12 821
2009 BNP Paribas SA France Fortis Bank Belgium 12 765
2000 UBS AG Switzerland PaineWebber Group Inc. United States 12 243
2008 Bank of America Corp United States China Construction Bank Corp (19%) China 11 428
2006 BNP Paribas SA France Banca Nazionale del Lavoro SpA Italy 11 106
2000 HSBC Holdings PLC United Kingdom Credit Commercial de France France 11 100
2004 Royal Bank of Scotland United Kingdom Charter One Financial Inc. United States 10 530
2007 BBVA Spain Compass Bancshares Inc. United States 9 871
1999 Deutsche Bank AG Germany Bankers Trust New York Corp United States 9 082
2008 Toronto-Dominion Bank Canada Commerce Bancorp United States 8 638
2007 Citigroup United States Nikko Cordial Corp Japan 7 921
2011 Mitsubishi UFJ Fin. Group Japan Morgan Stanley (22%) United States 7 800
1999 HSBC Holdings PLC United Kingdom Republic New York Corp United States 7 703
2000 Chase Manhattan Corp United States Robert Fleming Holdings Ltd United Kingdom 7 698
2001 HypoVereinsbank (HVB) Germany Bank Austria AG Austria 7 317
2008 Banque Federative du Credit Mutuel (BFCM) France Citigroup (operations
in Germany) United States 6 617
2011 Toronto-Dominion Bank Canada Chrysler Financial Corp United States 6 300
Source: Economic Commission for Latin America and the Caribbean (ECLAC), on the basis of Thomson Reuters.Note: Shading denotes a merger.
The establishment of the Single European Market, which allowed the free movement of capital and provision of banking services among the member countries of the European Union, and the subsequent entry into effect of the euro, increased the pressure on European banks. In this scenario, several entities began to seek opportunities to broaden their operations and revenues abroad, especially in developing countries (Calderón and Casilda, 2000).
As of the mid-1990s, foreign bank presence in emerging economies began to increase significantly, particularly in Latin America and Eastern Europe, where they now have market shares of close to 40%
and 90%, respectively (BIS, 2010a). Between 2000 and 2011, credit extended by subsidiaries of banks with international activities increased from 27% to 42% of their total assets. Latin America became the priority in the first phase of this process (Claessens and others, 2008). In developing Asia, international entities have a smaller market share of around 20%. European banks have been very active in this, with Spanish banks spearheading the process in the case of Latin America. In the case of Europe and Central Asia, Italian, Austrian, Swedish and Greek banks have played an important role in Albania, Bulgaria,

Economic Commission for Latin America and the Caribbean (ECLAC)108
Croatia, the Czech Republic, Hungary and Rumania. Portuguese institutions account for around a third of bank assets in Angola and Mozambique (World Bank, 2012b; El País, 2011).
This process has been limited to a few large financial institutions in Europe and the United States, which fall into two clearly defined categories (The Economist, 2010). The first consists of banks with a long history which have forged a limited presence in many countries, enabling them to service transnational corporations and local consumers. These include Citigroup, Hong Kong and Shanghai Banking Corporation (HSBC) and Standard Chartered. The second group comprises entities which have established a large presence in the host countries’ retail banking segment in just a few years. In this case, the most important players were Santander and Banco Bilbao Vizcaya Argentaria (BBVA) of Spain in Latin America and UniCredit of Italy and Erste and Raiffeisen of Austria in Eastern Europe (see figure III.9).
Figure III.9 INTERNATIONAL OPERATIONS (SELECTED ENTITIES):
GEOGRAPHICAL DISTRIBUTION OF PROFITS, 2011 (Percentages)
0
10
20
30
40
50
60
70
80
90
100
Banco Santander
BBVA HSBC Standard Chartered
UniCredit Citigroup Scotiabank
Spain United Kingdom Italy UnitedStates
Canada
Home country/region Europe United StatesLatin America
AsiaCentral and Eastern Europe Other
Source: Economic Commission for Latin America and the Caribbean (ECLAC), on the basis of information from the banks.
The outlook today for advanced-economy banks to enter or increase their presence in developing countries is rather more complicated. First of all, the institutions that now have large presences in emerging economies benefited from opportunities that were unique, such as the liberalization of the banking industry in Latin America after the debt crisis and the bank privatizations in Eastern Europe after the fall of the Berlin Wall. Second, it would be very difficult to enter the most attractive markets with the greatest potential —those with an emerging and growing middle class (Kharas, 2010)— since massive sales of banking institutions are unlikely to occur in the
foreseeable future in China, India or the Russian Federation. Third, the largest banks in developing economies have suddenly become the industry’s elite, thanks in part to the difficulties being experienced by developed country banks and to their home economies’ strong, steady growth. Lastly, as local regulations have tightened, the traditional internationalization strategies employed by the largest developed country banks have ceased to be feasible. In this light, it is unlikely that new dynamic agents will irrupt on the international stage.
(c) Reliance on financial innovation: a risky strategy
In the late 1990s, executives in some of the largest banks began to design innovative strategies to strengthen traditional banking business and increase the return on assets (RoA) in order to meet shareholders demands for higher returns on equity (RoE).
This strategy was aided by the regulatory changes that enabled banks and financial institutions to operate as universal banks, since these diversified hitherto fairly limited business options. The real estate market offered the ideal arena for this sort of strategy. Banks invested their incoming short-term resources (sight deposits) in long-term assets (mortgage loans) and, in the expectation of being able to service their liabilities, borrowed more in the interbank monetary markets.
A highly leveraged balance structure has a multiplier effect on asset returns (Eraso and Urra, 2011). In other words, if a bank can generate returns on its activities, the more leveraged it is, the greater the returns on equity. This strategy was refined using innovative financing mechanisms, by issuing securities collateralized by a pool of underlying assets (loans), which raises resources while keeping debt off the balance sheet. This sort of leveraging can be highly effective during the boom phase of the business cycle, but can become an irreversible burden if conditions take a turn for the worse.
During the long economic boom, many financial institutions —mainly investment banks and entities operating as universal banks— became over-leveraged. Essentially, two factors encouraged this behaviour:
• The possibility of recording certain balance sheet entries as capital, which strengthened banks’ solvency indicators. Structured products were central in this. Banks used these financial innovations, such as residential mortgage-backed securities (RMBS) and collateralized debt obligations (CDOs) to securitize some of their lending and turn it into instruments that could be transferred to other investors, along with the associated risk. Banks thus removed loans which could be readily securitized from their balance sheets, which allowed them to continue

109Foreign Direct Investment in Latin America and the Caribbean • 2011
lending while still meeting the capital requirements established in domestic legislation and thus raise additional revenues. In the first half of the 2000 decade, this sort of operation, especially residential mortgage-backed securities, increased rapidly in the United States and the European Union, particularly in Italy, the Netherlands, Spain and the United Kingdom (ECB, 2011).
• The procyclical nature of risk assessment.10 During boom periods, over-confidence on the part of regulators, financial entities and risk rating agencies led to excessively low risk weightings on certain investments (Gual, 2009). In the real estate sector, for example, mortgage loans were extended to clients with poor solvency. High-risk mortgage loans went from 8% of the total mortgage market in 2001 to 20% in 2007, and over 80% of these were securitized (Gorton, 2008). Risk rating agencies also operated procyclically, assessing assets and structured products as a function of the ease of trading them on (Medina Ávila, 2008).
During a downturn, a financial institution with such a highly leveraged business structure can find its solvency seriously threatened if even a relatively small proportion of its assets perform under par. Term mismatches between assets and liabilities can leave even a solvent bank in serious trouble if deposits and other short-term financing instruments are withdrawn en masse. Very often, far from evaluating and distributing risk more efficiently among financial agents, these innovations make certain assets, institutions and markets increasingly opaque, and spread the perverse effects of those inefficiencies very rapidly.
In sum, financial entities managed their borrowing procyclically as a function of expected risk: highly leveraged during the upswing of the cycle and less so during contractions. Thus, the more banks financed their assets by borrowing, the more profitable —but also the more risky— their operations became.
Financial institutions and operations became too large and complex for regulation and oversight schemes and exceeded the capacity of private risk rating agencies to assess them. For this reason large banking entities came to the attention of governments and international agencies; however, it was now apparent that they were too big to fail.
10 Risk management is fundamental for financial sector performance and profitability. Banks with diversified portfolios need to monitor the evolution of individual risks, in terms of both loans extended and other investments, especially variable returns instruments and structured products. Risk also has an indirect effect that is by no means negligible, since it affects the cost of borrowing, a key variable in such a highly leveraged industry.
(d) Bursting of the property bubble and rapid global contagion: a small fraction of the market unleashes an unstoppable chain reaction
The situation began to change in 2004 when the United States Federal Reserve started raising interest rates to curb inflation. As a result, interest rates rose from 0.98% in 2003 to 5.25% in 2006. Many borrowers thus began to find it hard to meet repayment obligations, which led to a sharp drop in real estate prices and sales. A number of financial entities began to struggle to find the liquidity to service their debts and to raise new financing. In 2006, the real estate crisis spread to the stock exchange (BIS, 2009).
In mid-2007 circumstances combined to make the precarious situation unsustainable: the bursting of the real estate bubble, high household and corporate indebtedness, a high rate of consumption, overvaluation of financial assets, heavily leveraged banks, huge growth in transactions outside the formal markets, little control of speculative transactions, serious risk assessment failings and financial systems with a high degree of international exposure. As the serious global imbalances11 worsened, the subprime mortgage problem detonated a crisis of vast proportions which compromised the very foundations of the financial systems in the world’s largest economies (Titelman, Pérez-Caldentey and Pineda, 2009). The banks’ leveraging strategy could not be sustained by indefinite expansion of credit, because this unfettered process was increasingly distorting real economy parameters. The value of derivatives was three times stock market capitalization in 2000 and 10 times stock market capitalization by 2007 (see figure III.10). This contrasted with a stock market value of 6.5 times the value of derivatives in 1990 (Morgan Stanley, 2007).
The errors made by large financial institutions in asset valuation and risk assessment, added to the lack of transparency as regards securitization and holdings of structured products —later termed “toxic assets”— generated spiralling mistrust and panic among the market’s main agents and a sharp fall in stock markets worldwide (see figure III.10). In the second half of 2007, interbank borrowing and intermediary credit operations began to grind to a halt.
11 Basically, what is understood by global imbalances is the large and persistent external deficit of the United States, on the one hand, and the huge current account surplus of certain Asian economies, especially China and, to a lesser extent, some Middle Eastern economies, on the other.

Economic Commission for Latin America and the Caribbean (ECLAC)110
Figure III.10 ORGANIZED STOCK MARKETS AND INFORMAL DERIVATIVES
MARKETS, 2000-2011 (Trillions of dollars)
0
10
20
30
40
50
60
70
80
0
100
200
300
400
500
600
700
800
2000 2001 2002 2003 2004 2005 2006 2007 2008 2009 2010 2011
Global value of derivatives traded in non-organized markets (left scale)Capitalization of stock markets worldwide (right scale)
Source: Economic Commission for Latin America and the Caribbean (ECLAC), on the basis of figures provided by the Bank for International Settlements (BIS) and the World Federation of Exchanges.
The losses generated by the sharp fall in real estate prices were not limited to the subprime mortgage segment, but spread rapidly to some of the world’s largest financial institutions (see table III.3). Between September 2007 and September 2008 serious liquidity and solvency problems became public in some of the largest banks in the United States (Citigroup, Bank of America, JP Morgan and Wachovia), the United Kingdom (HSBC, Barclays, Royal Bank of Scotland (RBS) and Northern Rock), Switzerland (UBS and Credit Suisse) and France (Crédit Agricole), as well as prominent investment banks in the United States, such as Merrill Lynch, Morgan Stanley, Bear Stearns and Lehman Brothers. In the final months of 2008, the worsening financial situation reached its darkest point with the failure of Lehman Brothers. All this unleashed massive problems in the economies of the countries concerned and gravely damaged the financial institutions involved.
For several months, the wholesale credit markets ground to a halt and only massive intervention by national governments and central banks to provide the necessary resources prevented the financial system from collapsing completely (CRS, 2009; ICB, 2011).12 Injections of liquidity by the main central banks, which have been in a state of alert ever since, have averted paralysis of the
12 Between 2008 and 2011, governments in the European Union authorized 4.5 billion euros in assistance for financial systems: the equivalent of 36.7% of combined European Union GDP (European Commission, 2011a). Between 2008 and 2010, 1.609 billion euros of this amount were used (13.1% of European Union GDP and 2.9% of the total assets of the financial system).
international financial system, but have not resolved the underlying problem: the solvency of financial entities.
The need was now obvious for a thoroughgoing reform of the rules governing the financial sector, including the regulators and oversight institutions, the markets and main agents (both the banks and the credit risk agencies), and risk capital funds. Several reforms were enacted in the United States, notably the Dodd–Frank Wall Street Reform and Consumer Protection Act.13 Once the role that investment banks had played in the gestation of the crisis had become established, under the new legislation these institutions practically disappeared or were turned into commercial banks subject to the regulation and oversight that this implies.14
In the European Union, in late 2009 the Commission proposed replacing the oversight scheme in order to restore confidence and improve financial system governance. At the end of 2010, following agreement by all the member States, the European Parliament and the Council for Economic and Financial Affairs (ECOFIN Council) adopted the new regulatory framework, which came into force on 1 January 2011.
International debates began in various forums, including the Group of Twenty (G20), the Financial Stability Board (FSB) and the Basel Committee on Banking Supervision (BCBS) (see box III.1). Nevertheless, although these deliberations have been treated as urgent, their outcomes have been fairly insubstantial.
Despite all efforts, before the recovery was well under way new factors began to drive global economic conditions back into negative territory. Doubts quickly surfaced over the ability of some advanced economy States to service their obligations, particularly in the European Union, whose expansionary fiscal policies during the preceding years had swelled public indebtedness. Within a few months Greece, Ireland and Portugal received bailouts and Spain and Italy were left in very delicate situations which have yet to resolve (Davies and Ng, 2011). As financial instability persisted, concerns mounted over the sustainability of public finances in other euro zone countries, including the largest (Vause and von Peter, 2011).
13 In July 2010 a joint proposal of the United States Congress and Senate was adopted: the Dodd–Frank Wall Street Reform and Consumer Protection Act, which is considered the greatest financial reform in the United States since the Great Depression. The legislation includes certain initiatives proposed by extra-parliamentary bodies, such as the separation of banking activities (known as the Volcker Rule), which strictly limit commercial banks’ investment in stock markets and risk assets, and limits the size of entities.
14 In March 2008, JP Morgan, with support from the federal government, bought Bear Stearns for US$ 270 million, 93% below its valuation price. In September 2008, Bank of America bought Merrill Lynch for US$ 44 billion, in advance of the Lehman Brothers collapse.

111Foreign Direct Investment in Latin America and the Caribbean • 2011
Box III.1 WHAT PROGRESS IN REFORMING THE INTERNATIONAL FINANCIAL SYSTEM?
The financial crisis has dominated the agendas of the most prominent international forums. In November 2008, the first Leaders’ Summit of the Group of Twenty (G20), held in Washington, D.C., laid down key aspects of financial system reform, with a view to making it more transparent, solid and stable (Group of Twenty, 2008). Since then, the G20 has met many times and summits of political leaders have gradually given way to more technical meetings attended by ministers of financial affairs and central banks. The discussions have revolved around the following issues:(a) Strengthening the transparency and
accountability of market agents and financial products.
(b) Enhancing sound regulation, making regulatory regimes more effective over the economic cycle, stimulating innovation and responsible trading in financial products and services.
(c) Promoting integrity in financial markets, bolstering investor and consumer protection, avoiding conflicts of interest and preventing illegal market manipulation.
(d) Reinforcing International Cooperation across all segments of financial markets, including with respect to cross-border capital flows and crisis prevention, management, and resolution.
(e) Reforming international financial institutions to more adequately reflect changes in the world economy in order to increase their legitimacy and effectiveness. The International Monetary Fund (IMF), in collaboration with the Financial Stability Forum (FSF) and other bodies, should work to better identify vulnerabilities, anticipate potential stresses, and act swiftly to play a key role in crisis response.Many specific measures have been
taken in each of these areas of reform (Group of Twenty, 2009). The most significant of these include the lifting of bank secrecy in countries committed to transparency, the regulation of high-risk operations (such as over-the-counter (OTC) transactions and short selling), the creation of new international coordination bodies (such as the Financial Stability Board, FSB) and a strengthened role for IMF and the World Bank.
In addition, the Basel Committee on Banking Supervision (BCBS) has produced agreements for strengthening international rules regarding banking systems in order to reduce the risk of contagion from the financial sector to the real economy. In December 2010, the Committee issued Basel III, a global regulatory framework for strengthening banking institutions and systems. Basel III is intended to enhance the previous versions (Basel I and Basel
II, also known as the New Basel Capital Accord) and make capital and liquidity requirements more stringent. This initiative has received firm backing from the G20 leaders and will be implemented gradually starting on 1 January 2013.
Essentially, Basel III is intended to broaden banks’ capital base, improve the quality of their resources, impose a ceiling on leverage ratios, create countercyclical and capital conservation buffers, and impose special requirements on banks of systemic importance: those whose size and interconnectedness with other intermediaries is such that they warrant special attention. In addition, the new rules establish a global liquidity standard for the first time (BIS, 2011).
Under the calendar adopted, the aggregate of the minimum capital requirement plus the conservation buffer must rise from 8% in 2013 to 10.5% by 2019 (BIS, 2011). It remains to be seen what effects these new standards may have on bank performance or the macroeconomy. According to estimates carried out by international agencies and private institutions, in principle there should be no significant implications for long-term GDP growth. Conversely, the impacts on financial institutions and the banking sector are unclear, aside from a fairly evident fall in the rate of return on equity.
Source: Economic Commission for Latin America and the Caribbean (ECLAC), on the basis of data from the Group of Twenty (G20) and the Bank for International Settlements.
In sum, the current crisis appears to be rooted in both macro- and microeconomic factors. The macro factors include problems stemming from mounting disequilibria in international balances and the difficulties caused by a long stretch of low interest rates. The micro factors fall into three areas: regulation, incentives and risk appraisal. Lack of regulation, heightened competition and the quest for ever increasing returns led financial entities to grow immoderately and leverage their balance sheets to the extent of endangering the entire system. The growing integration of financial systems and the proliferation of innovative instruments that facilitated risk trading and diversification made banks into extremely complex institutions that were hard for governments and regulators to monitor.
When conditions changed and a massive financial crisis broke out, national, regional and multilateral authorities went to tremendous lengths to cushion its effects and
contain the contagion. Given the catastrophic economic and social consequences if the financial system were to collapse, burdensome rescue plans were deployed; these have had only partial effects, however. The financial crisis which began in the subprime mortgage segment and the Lehman Brothers failure, and worsened with the European sovereign debt problem, has shown no signs of relenting. Many of the industry’s agents are therefore still trying to operate in highly uncertain conditions.
Lastly, the pressure, depth and cost of new regulatory requirements and the short time available for preparing for them could force major shifts in the strategies of the industry’s principal agents. Transborder activities could certainly be impacted, perhaps leading some banks to withdraw from certain markets. This could be particularly relevant for Latin America, where international banks play a key role in national financial systems.

Economic Commission for Latin America and the Caribbean (ECLAC)112
C. Foreign banks in Latin America and the Caribbean
1. Relative performance of Latin America’s banks: learning the lessons of the past?
Latin America’s financial markets have developed a great deal in the past decade, but they are still shallower than those in developed economies (see figure III.2). Domestic savings have been insufficient to finance investment needs, so access to external financing and its vagaries have done much to determine growth and volatility (Manuelito and Jiménez, 2010). Since a large percentage of the population still have difficulties in accessing financial services, the financial culture remains limited.
The region’s financial systems are dominated by the banking industry. Capital markets, i.e. equity, bonds and other debt instruments, are little developed and consist mainly of government securities and other types of public debt instruments. With the exception of countries which have developed pension funds, such a limited capital market has little to offer institutional investors. This largely explains the shortage of medium- and long-term financing.
As a consequence of all this, Latin American markets are underdeveloped in terms of sophisticated financial products and services such as derivatives and other structured products. Nevertheless, in light of earlier considerations with respect to developed countries, a cautious approach to financial innovation may be considered a strength of the region’s financial systems (Marshall, 2011).
Although the financial crisis struck the region, its banking systems remained solid and the economy recovered relatively quickly, contrasting with the more traumatic episodes of the past. Except for a drop in returns at the height of the crisis, assets, especially lending, continued to expand throughout the period (see figure III.11).
Given the weight of bank lending in GDP, the level of development of Latin America’s bank markets today is about a third of the average for the countries of the Organization for Economic Cooperation and Development (OECD) (Manuelito and Jiménez, 2010). In the United States, Japan and the European Union, bank credit was well in excess of 150% of GDP, compared to just over 70% of GDP in Latin America and the Caribbean (see figure III.12).
Figure III.11 LATIN AMERICA: COMPOSITE PERFORMANCE OF THE 250
LARGEST BANKS, 2005-2011 (Billions of dollars)
0.0
2.5
5.0
7.5
10.0
12.5
15.0
17.5
20.0
22.5
25.0
0
500
1 000
1 500
2 000
2 500
3 000
3 500
4 000
4 500
5 000
2005 2006 2007 2008 2009 2010 2011
Assets Loans Profits (right scale)
Source: Economic Commission for Latin America and the Caribbean (ECLAC), on the basis of América economía, “La banca latinoamericana en 2011”, Santiago, Chile, October 2011.
Figure III.12 SELECTED COUNTRIES AND REGIONS: DOMESTIC CREDIT
EXTENDED BY THE BANKING SECTOR, 2001-2010 (Percentages of GDP)
0
50
100
150
200
250
300
350
Latin America and the Caribbean
Spain United States
Euro zone Japan OECD World
2001 2005 2010
Source: Economic Commission for Latin America and the Caribbean (ECLAC), on the basis of figures from World Bank, World Development Indicators (WDI) [online] http://data.worldbank.org/indicator.
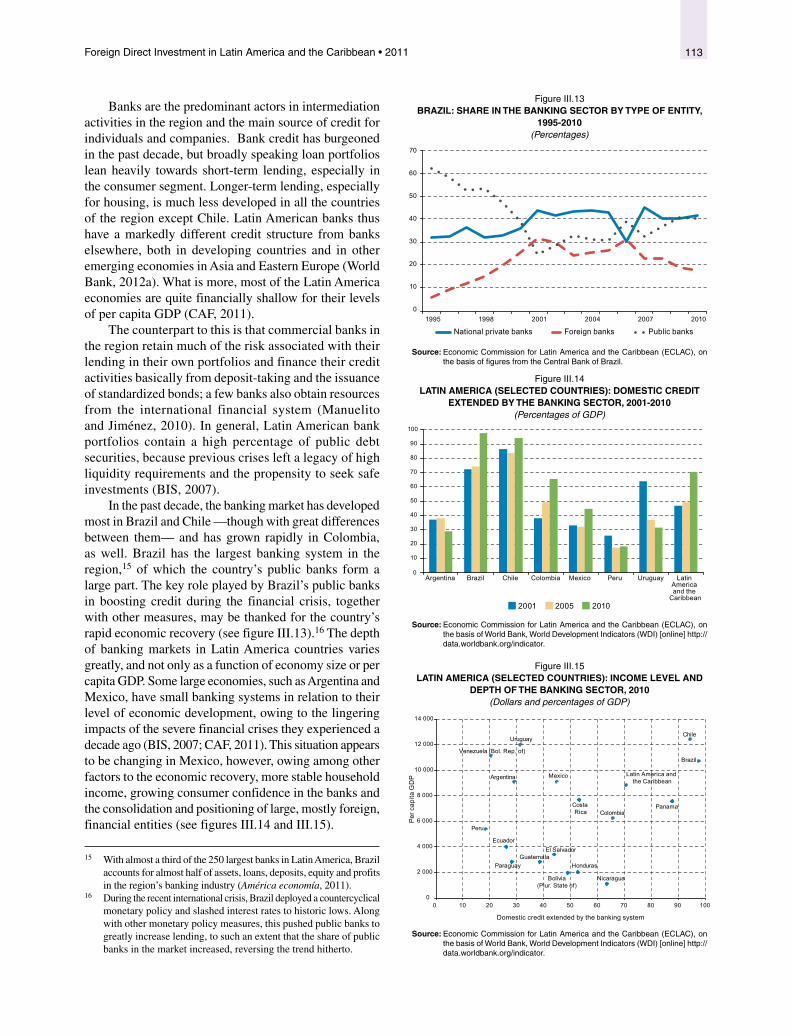
113Foreign Direct Investment in Latin America and the Caribbean • 2011
Banks are the predominant actors in intermediation activities in the region and the main source of credit for individuals and companies. Bank credit has burgeoned in the past decade, but broadly speaking loan portfolios lean heavily towards short-term lending, especially in the consumer segment. Longer-term lending, especially for housing, is much less developed in all the countries of the region except Chile. Latin American banks thus have a markedly different credit structure from banks elsewhere, both in developing countries and in other emerging economies in Asia and Eastern Europe (World Bank, 2012a). What is more, most of the Latin America economies are quite financially shallow for their levels of per capita GDP (CAF, 2011).
The counterpart to this is that commercial banks in the region retain much of the risk associated with their lending in their own portfolios and finance their credit activities basically from deposit-taking and the issuance of standardized bonds; a few banks also obtain resources from the international financial system (Manuelito and Jiménez, 2010). In general, Latin American bank portfolios contain a high percentage of public debt securities, because previous crises left a legacy of high liquidity requirements and the propensity to seek safe investments (BIS, 2007).
In the past decade, the banking market has developed most in Brazil and Chile —though with great differences between them— and has grown rapidly in Colombia, as well. Brazil has the largest banking system in the region,15 of which the country’s public banks form a large part. The key role played by Brazil’s public banks in boosting credit during the financial crisis, together with other measures, may be thanked for the country’s rapid economic recovery (see figure III.13).16 The depth of banking markets in Latin America countries varies greatly, and not only as a function of economy size or per capita GDP. Some large economies, such as Argentina and Mexico, have small banking systems in relation to their level of economic development, owing to the lingering impacts of the severe financial crises they experienced a decade ago (BIS, 2007; CAF, 2011). This situation appears to be changing in Mexico, however, owing among other factors to the economic recovery, more stable household income, growing consumer confidence in the banks and the consolidation and positioning of large, mostly foreign, financial entities (see figures III.14 and III.15).
15 With almost a third of the 250 largest banks in Latin America, Brazil accounts for almost half of assets, loans, deposits, equity and profits in the region’s banking industry (América economía, 2011).
16 During the recent international crisis, Brazil deployed a countercyclical monetary policy and slashed interest rates to historic lows. Along with other monetary policy measures, this pushed public banks to greatly increase lending, to such an extent that the share of public banks in the market increased, reversing the trend hitherto.
Figure III.13 BRAZIL: SHARE IN THE BANKING SECTOR BY TYPE OF ENTITY,
1995-2010 (Percentages)
0
10
20
30
40
50
60
70
1995 1998 2001 2004 2007 2010
National private banks Foreign banks Public banks
Source: Economic Commission for Latin America and the Caribbean (ECLAC), on the basis of figures from the Central Bank of Brazil.
Figure III.14 LATIN AMERICA (SELECTED COUNTRIES): DOMESTIC CREDIT
EXTENDED BY THE BANKING SECTOR, 2001-2010 (Percentages of GDP)
0
10
20
30
40
50
60
70
80
90
100
Argentina Brazil Chile Colombia Mexico Peru Uruguay Latin America and the
Caribbean2001 2005 2010
Source: Economic Commission for Latin America and the Caribbean (ECLAC), on the basis of World Bank, World Development Indicators (WDI) [online] http://data.worldbank.org/indicator.
Figure III.15 LATIN AMERICA (SELECTED COUNTRIES): INCOME LEVEL AND
DEPTH OF THE BANKING SECTOR, 2010 (Dollars and percentages of GDP)
0
2 000
4 000
6 000
8 000
10 000
12 000
14 000
0 10 20 30 40 50 60 70 80 90 100
Per
cap
ita G
DP
Domestic credit extended by the banking system
Argentina
Bolivia(Plur. State of)
Brazil
Chile
ColombiaCosta Rica
EcuadorEl Salvador
GuatemalaHonduras
Mexico
Nicaragua
Panama
Paraguay
Peru
Uruguay
Venezuela (Bol. Rep. of)
Latin America and the Caribbean
Source: Economic Commission for Latin America and the Caribbean (ECLAC), on the basis of World Bank, World Development Indicators (WDI) [online] http://data.worldbank.org/indicator.

Economic Commission for Latin America and the Caribbean (ECLAC)114
Generally speaking, Latin America’s banks have maintained good, stable capitalization indicators over the past decade—much higher, in fact, than those of banks in the rest of OECD, the euro zone and Japan, although lower than those in the United States. Higher capitalization rates in the United States are the result of the government’s massive injection of resources to ease the fallout from the subprime mortgage crisis (see figure III.16). In Latin America, the most highly capitalized banks are those of Colombia, Argentina, Peru and Mexico. Chilean banks have the lowest capitalization rates and Chile is also the only country in which these rates have fallen in the past decade (see figure III.17). This has to do with sharp growth in lending, funded by increased external borrowing and issues of capital and subordinated bonds, which has enabled Chile to maintain good solvency and liquidity indicators (Central Bank of Chile, 2011).
Figure III.16 SELECTED COUNTRIES AND REGIONS: CAPITAL OVER TOTAL
ASSETS IN THE BANKING SYSTEM, 2001-2009 (Percentages)
0
2
4
6
8
10
12
Latin America and the
Caribbean
Spain United States
Euro zone Japan OECD World
2001 2009
Source: Economic Commission for Latin America and the Caribbean (ECLAC), on the basis of World Bank, World Development Indicators (WDI) [online] http://data.worldbank.org/indicator.
Figure III.17 LATIN AMERICA (SELECTED COUNTRIES): CAPITAL OVER TOTAL
ASSETS IN THE BANKING SYSTEM, 2001-2010 (Percentages)
0
2
4
6
8
10
12
14
Argentina Brazil Chile Colombia Mexico Peru Uruguay
2001 2010
Source: Economic Commission for Latin America and the Caribbean (ECLAC), on the basis of World Bank, World Development Indicators (WDI) [online] http://data.worldbank.org/indicator.
Latin American banks have much higher liquidity indicators than banks in advanced economies (see figure III.18), which is the result of certain aspects of monetary policy. Because capital markets in the region are quite shallow, several countries still use legal reserve requirements as liquidity controls. This type of measure directly impairs the efficiency of banking systems by imposing an additional cost on credit provision, thus limiting the rate at which banks can turn deposits into loans (Manuelito and Jiménez, 2010). Such policies do, however, tend to force banks to preserve a cautious liquidity position.
Figure III.18 SELECTED COUNTRIES AND REGIONS: LIQUID RESERVES OVER
TOTAL ASSETS IN THE BANKING SYSTEM, 2001-2010 (Percentages)
0
2
4
6
8
10
12
14
16
18
20
Latin America and the
Caribbean
Spain United States
Euro zone Japan OECD World
2001 2010
Source: Economic Commission for Latin America and the Caribbean (ECLAC), on the basis of World Bank, World Development Indicators (WDI) [online] http://data.worldbank.org/indicator.
Conversely, in economies with more developed debt markets, the monetary authority can regulate liquidity by varying the supply of monetary instruments, essentially bonds, in order to influence interest rates and, through these, aggregate demand. In these circumstances, banks tend to adjust their liquidity positions to the lowest legal level, since liquid assets are usually less profitable than alternative investments.
The recent growth in the Latin American banking market has taken place largely through infrastructure development and technology absorption (branches, cash dispenser machines, electronic banking, mobile banking, and so forth). This has afforded the population greater access to financial services, at the same time as capturing a larger proportion of the savings generated in the economy and assigning scarce financing resources to profitable investment projects.
The number of bank branches in the region has soared in the past few years, almost doubling between 2004 and 2010, yet still remains far short of the number in more

115Foreign Direct Investment in Latin America and the Caribbean • 2011
advanced economies (see figure III.19). The gap may narrow quite rapidly, however, given technological advances that bring banking services closer to people, such as automatic cash dispensers, remote access via Internet and mobile banking. The rapid increase in cash dispensers, albeit with some lag with respect to the number of branches, could help to shorten distances between the region and the more advanced economies in this regard (see figure III.20). Technological progress is also greatly alleviating the client pressure on branches, which is helping to lower the banks’ operating costs.
Figure III.19 SELECTED COUNTRIES AND REGIONS: BANK BRANCHES PER
100,000 INHABITANTS, 2004-2010
0
5
10
15
20
25
30
35
40
Latin America Spain United States Japan
2004 2010
Source: Economic Commission for Latin America and the Caribbean (ECLAC), on the basis of International Monetary Fund (IMF), Financial Access Survey.
Figure III.20 SELECTED COUNTRIES AND REGIONS: AUTOMATIC CASH
DISPENSERS PER 100,000 INHABITANTS, 2004-2010
0
20
40
60
80
100
120
140
160
180
Latin America Spain United States Japan
2004 2010
Source: Economic Commission for Latin America and the Caribbean (ECLAC), on the basis of International Monetary Fund (IMF), Financial Access Survey.
In past few decades, the expansion of the banking sector in Latin America and the Caribbean, the establishment of foreign banks, increasing competition and rising investment in physical infrastructure and technology have helped, even
if only a little, to reduce costs and intermediation margins. Be that as it may, these margins are still much larger than in more advanced economies and the region continues to display large internal inequalities (see figure III.21).
Figure III.21 LATIN AMERICA (SELECTED COUNTRIES): INTERMEDIATION
SPREADS, 2001-2009 (Percentages of GDP)
0
10
20
30
40
50
60
2001 2002 2003 2004 2005 2006 2007 2008 2009
Argentina Brazil Chile ColombiaMexico Peru Uruguay
Source: Economic Commission for Latin America and the Caribbean (ECLAC), on the basis of World Bank, World Development Indicators (WDI) [online] http://data.worldbank.org/indicator.
Lastly, the international financial crisis affected confidence in the sector very little and the business volume and penetration rate of the banking industry have in fact increased (América economía, 2011). Rates of arrears portfolios are declining, in sharp contrast to the situation in advanced economies, where this indicator has risen by a factor of 3.5 since 2007.
In short, the institutional reforms of the 1990s seem to have borne fruit, especially as regards financial system stability and soundness. Yet, despite the notable growth, financial systems are still lagging behind those of industrialized countries. With few exceptions, bank coverage in the region’s economies is smaller than in other countries with similar levels of per capita income and leans towards short-term lending —increasingly so as modern practices of consumer lending management have spread. As a result, banking services are not meeting real needs and have yet to reach a large portion of households and firms in the region, especially SMEs.
Yet, notwithstanding the lags in financial intermediation, it is encouraging that banks in the region have come through the first blow of the international financial crisis relatively unscathed, since this suggests that they have learned the lessons of the past. Today Latin America’s banks are better regulated, better capitalized and more efficient, which should form a basis for more orderly and sustainable development of the sector in the future.
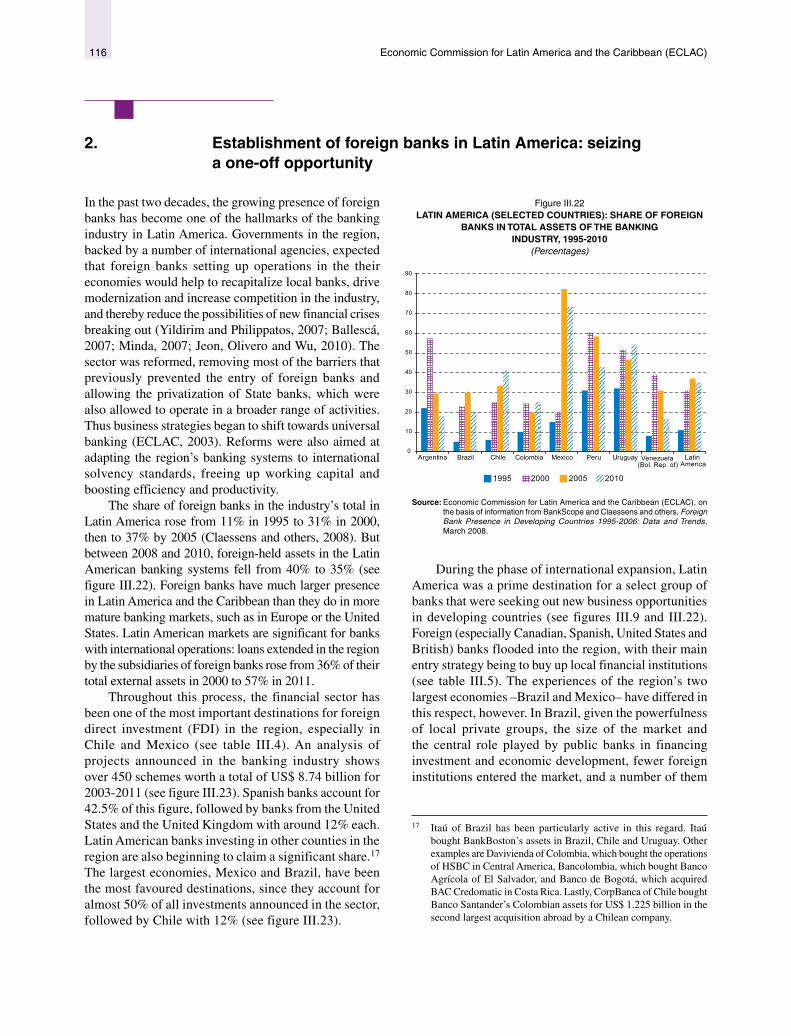
Economic Commission for Latin America and the Caribbean (ECLAC)116
2. Establishment of foreign banks in Latin America: seizing a one-off opportunity
In the past two decades, the growing presence of foreign banks has become one of the hallmarks of the banking industry in Latin America. Governments in the region, backed by a number of international agencies, expected that foreign banks setting up operations in the their economies would help to recapitalize local banks, drive modernization and increase competition in the industry, and thereby reduce the possibilities of new financial crises breaking out (Yildirim and Philippatos, 2007; Ballescá, 2007; Minda, 2007; Jeon, Olivero and Wu, 2010). The sector was reformed, removing most of the barriers that previously prevented the entry of foreign banks and allowing the privatization of State banks, which were also allowed to operate in a broader range of activities. Thus business strategies began to shift towards universal banking (ECLAC, 2003). Reforms were also aimed at adapting the region’s banking systems to international solvency standards, freeing up working capital and boosting efficiency and productivity.
The share of foreign banks in the industry’s total in Latin America rose from 11% in 1995 to 31% in 2000, then to 37% by 2005 (Claessens and others, 2008). But between 2008 and 2010, foreign-held assets in the Latin American banking systems fell from 40% to 35% (see figure III.22). Foreign banks have much larger presence in Latin America and the Caribbean than they do in more mature banking markets, such as in Europe or the United States. Latin American markets are significant for banks with international operations: loans extended in the region by the subsidiaries of foreign banks rose from 36% of their total external assets in 2000 to 57% in 2011.
Throughout this process, the financial sector has been one of the most important destinations for foreign direct investment (FDI) in the region, especially in Chile and Mexico (see table III.4). An analysis of projects announced in the banking industry shows over 450 schemes worth a total of US$ 8.74 billion for 2003-2011 (see figure III.23). Spanish banks account for 42.5% of this figure, followed by banks from the United States and the United Kingdom with around 12% each. Latin American banks investing in other counties in the region are also beginning to claim a significant share.17 The largest economies, Mexico and Brazil, have been the most favoured destinations, since they account for almost 50% of all investments announced in the sector, followed by Chile with 12% (see figure III.23).
17 Itaú of Brazil has been particularly active in this regard. Itaú bought BankBoston’s assets in Brazil, Chile and Uruguay. Other examples are Davivienda of Colombia, which bought the operations of HSBC in Central America, Bancolombia, which bought Banco Agrícola of El Salvador, and Banco de Bogotá, which acquired BAC Credomatic in Costa Rica. Lastly, CorpBanca of Chile bought Banco Santander’s Colombian assets for US$ 1.225 billion in the second largest acquisition abroad by a Chilean company.
Figure III.22 LATIN AMERICA (SELECTED COUNTRIES): SHARE OF FOREIGN
BANKS IN TOTAL ASSETS OF THE BANKING INDUSTRY, 1995-2010
(Percentages)
0
10
20
30
40
50
60
70
80
90
Argentina Brazil Chile Colombia Mexico Peru Uruguay Venezuela (Bol. Rep. of)
Latin America
1995 2000 2005 2010
Source: Economic Commission for Latin America and the Caribbean (ECLAC), on the basis of information from BankScope and Claessens and others, Foreign Bank Presence in Developing Countries 1995-2006: Data and Trends, March 2008.
During the phase of international expansion, Latin America was a prime destination for a select group of banks that were seeking out new business opportunities in developing countries (see figures III.9 and III.22). Foreign (especially Canadian, Spanish, United States and British) banks flooded into the region, with their main entry strategy being to buy up local financial institutions (see table III.5). The experiences of the region’s two largest economies –Brazil and Mexico– have differed in this respect, however. In Brazil, given the powerfulness of local private groups, the size of the market and the central role played by public banks in financing investment and economic development, fewer foreign institutions entered the market, and a number of them
17 Itaú of Brazil has been particularly active in this regard. Itaú bought BankBoston’s assets in Brazil, Chile and Uruguay. Other examples are Davivienda of Colombia, which bought the operations of HSBC in Central America, Bancolombia, which bought Banco Agrícola of El Salvador, and Banco de Bogotá, which acquired BAC Credomatic in Costa Rica. Lastly, CorpBanca of Chile bought Banco Santander’s Colombian assets for US$ 1.225 billion in the second largest acquisition abroad by a Chilean company.
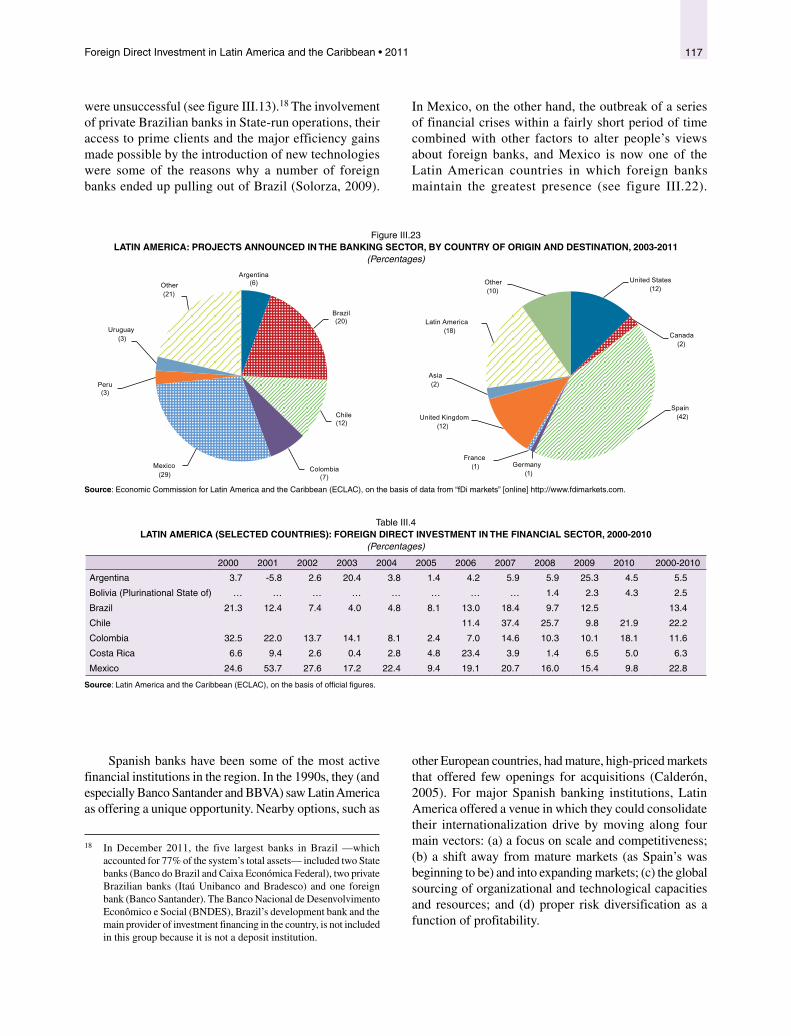
117Foreign Direct Investment in Latin America and the Caribbean • 2011
were unsuccessful (see figure III.13).18 The involvement of private Brazilian banks in State-run operations, their access to prime clients and the major efficiency gains made possible by the introduction of new technologies were some of the reasons why a number of foreign banks ended up pulling out of Brazil (Solorza, 2009).
18 In December 2011, the five largest banks in Brazil —which accounted for 77% of the system’s total assets— included two State banks (Banco do Brazil and Caixa Económica Federal), two private Brazilian banks (Itaú Unibanco and Bradesco) and one foreign bank (Banco Santander). The Banco Nacional de Desenvolvimento Econômico e Social (BNDES), Brazil’s development bank and the main provider of investment financing in the country, is not included in this group because it is not a deposit institution.
In Mexico, on the other hand, the outbreak of a series of financial crises within a fairly short period of time combined with other factors to alter people’s views about foreign banks, and Mexico is now one of the Latin American countries in which foreign banks maintain the greatest presence (see figure III.22).
Figure III.23 LATIN AMERICA: PROJECTS ANNOUNCED IN THE BANKING SECTOR, BY COUNTRY OF ORIGIN AND DESTINATION, 2003-2011
(Percentages)
Argentina(6)
Brazil(20)
Chile (12)
Colombia(7)
Mexico(29)
Peru(3)
Uruguay(3)
Other(21)
United States(12)
Canada(2)
Spain(42)
Germany (1)
France(1)
United Kingdom(12)
Asia(2)
Latin America(18)
Other(10)
Source: Economic Commission for Latin America and the Caribbean (ECLAC), on the basis of data from “fDi markets” [online] http://www.fdimarkets.com.
Table III.4 LATIN AMERICA (SELECTED COUNTRIES): FOREIGN DIRECT INVESTMENT IN THE FINANCIAL SECTOR, 2000-2010
(Percentages)
2000 2001 2002 2003 2004 2005 2006 2007 2008 2009 2010 2000-2010
Argentina 3.7 -5.8 2.6 20.4 3.8 1.4 4.2 5.9 5.9 25.3 4.5 5.5
Bolivia (Plurinational State of) … … … … … … … … 1.4 2.3 4.3 2.5
Brazil 21.3 12.4 7.4 4.0 4.8 8.1 13.0 18.4 9.7 12.5 13.4
Chile 11.4 37.4 25.7 9.8 21.9 22.2
Colombia 32.5 22.0 13.7 14.1 8.1 2.4 7.0 14.6 10.3 10.1 18.1 11.6
Costa Rica 6.6 9.4 2.6 0.4 2.8 4.8 23.4 3.9 1.4 6.5 5.0 6.3
Mexico 24.6 53.7 27.6 17.2 22.4 9.4 19.1 20.7 16.0 15.4 9.8 22.8
Source: Latin America and the Caribbean (ECLAC), on the basis of official figures.
Spanish banks have been some of the most active financial institutions in the region. In the 1990s, they (and especially Banco Santander and BBVA) saw Latin America as offering a unique opportunity. Nearby options, such as
other European countries, had mature, high-priced markets that offered few openings for acquisitions (Calderón, 2005). For major Spanish banking institutions, Latin America offered a venue in which they could consolidate their internationalization drive by moving along four main vectors: (a) a focus on scale and competitiveness; (b) a shift away from mature markets (as Spain’s was beginning to be) and into expanding markets; (c) the global sourcing of organizational and technological capacities and resources; and (d) proper risk diversification as a function of profitability.

Economic Commission for Latin America and the Caribbean (ECLAC)118
Table III.5 LATIN AMERICA: LARGEST MERGERS AND ACQUISITIONS UNDERTAKEN BY FOREIGN BANKS, 1990-2011
(Millions of dollars)
Date Buyer Country Institution acquired Country Amount
2001 Citigroup United States Banamex Mexico 12 821
2004 BBVA Spain Bancomer (38.4%) Mexico 3 888
2000 Banco Santander Spain Banco do Estado de Sao Paulo (30%) Brazil 3 581
2006 Banco Itaú Brazil BankBoston (operations in Argentina, Brazil, Chile and Uruguay)
United States 2 829
2008 Royal Bank of Canada Canada RBTT Financial Holdings Ltd Trinidad and Tobago 2 235
1998 ABN-AMRO Holding NV Netherlands Banco Real SA (40%) Brazil 2 100
2006 HSBC United Kingdom Grupo Banistmo SA Panama 1 781
2002 Banco Santiago Chile Banco Santander Chile SA Chile 1 678
2000 Banco Santander Spain Grupo Financiero Serfin SA de Mexico 1 543
2007 Citigroup United States Grupo Cuscatlan El Salvador 1 510
2000 BBVA Spain Bancomer (20.5%) Mexico 1 400
2004 HSBC United Kingdom Bank of Bermuda Ltd Bermuda 1 199
2001 Banco Santander Spain Banco do Estado de Sao Paulo (63.7%)
Brazil 1 162
2002 HSBC United Kingdom Grupo Financiero Bital SA Mexico 1 135
2012 Scotiabank Canada Banco Colpatria Red Multibanca Colombia 1 008
2000 Banco Santander Spain Banco Bozano Simonsen SA Brazil 1 000
1997 HSBC United Kingdom Banco Bamerindus do Brazil Brazil 1 000
2006 Canadian Imperial Bk Commerce
Canada First Caribbean Intl Bank Ltd Barbados 999
1996 Banco Santander Spain Banco Osorno and la Unión Chile 881
1998 BBVA Spain Banco Excel Economico SA Brazil 878
2000 Banco Santander Spain Banco Meridional do Brazil SA Brazil 835
2007 Scotiabank Canada Banco del Desarrollo Chile 829
2007 Bancolombia SA Colombia Banagricola El Salvador 790
1997 HSBC United Kingdom Roberts SA de Inversiones Argentina 688
2000 Banco Santander Spain Banco Rio de la Plata (26.5%) Argentina 675
1998 Credit Suisse First Boston United States Banco de Investimentos Garanti Brazil 675
2002 Banco Santander Spain Banco Santiago (35.5%) Chile 657
2007 Banco Itaú Brazil BankBoston Uruguay Uruguay 650
1997 Lloyds TSB Group PLC United Kingdom Banco Multiplic-Consumer (50%) Brazil 600
1999 Banco Santander Spain O’Higgins Central Hispano (50%) Chile 600
1997 Banco Santander Spain Banco Río de la Plata S.A. Argentina 594
2001 BBVA Spain Bancomer (9%) Mexico 555
Source: Economic Commission for Latin America and the Caribbean (ECLAC), on the basis of information from Thomson Reuters.
Generally speaking, Latin American banking markets were fairly undeveloped and had wide spreads and high potential levels of profitability, and this, together with the improvements that were being made in banking supervisory and regulatory systems, was opening up attractive business opportunities. At the same time, there was clearly a shortage of capital and a lack of new products to meet a growing demand for financial services. And all of this was found in the context of a shared language, culture and history; while this was a limiting factor in other situations, here it was conducive to the transfer not only of
capital but also of technology and management expertise (Calderón and Casilda, 2000). These banks launched an ambitious strategy focusing on the acquisition of big national financial institutions that had large amounts of local deposits, thereby positioning themselves as leading players in most of the region’s economies (Pozzolo, 2008) (see table III.6). This approach led to such an increase in the concentration of Latin America’s banking market that, today, the three largest institutions account for over 50% of the system’s total assets, and the 10 largest account for 85% (see table III.7).

119Foreign Direct Investment in Latin America and the Caribbean • 2011
Table III.6 ASSETS OF MAJOR FOREIGN BANKS OPERATING IN LATIN AMERICA, BY COUNTRY, JUNE 2011
(Hundreds of millions of dollars and percentages)
Santander BBVA HSBC Citigroup Scotiabank Deutsche Bank Itaú Other Total (Percentages)
Brazil 2 706 ... 907 322 ... 150 ... 953 5 038 43.9Mexico 677 959 423 970 180 144 ... 262 3 614 31.5Chile 525 161 26 ... 117 30 77 14 949 8.3Argentina 100 78 59 44 ... ... 15 58 353 3.1Colombia 39 130 13 41 ... ... ... 111 333 2.9Venezuela (Bolivarian Republic of) 154 129 ... 10 ... ... ... 31 324 2.8Panama ... 21 108 10 16 ... ... 145 301 2.6Peru ... 144 12 15 103 ... ... 0 275 2.4Uruguay 45 25 9 13 ... ... 22 26 141 1.2El Salvador ... ... 19 21 18 ... ... 0 58 0.5Costa Rica ... ... 14 ... 20 ... ... 23 58 0.5Honduras ... ... 12 ... ... ... ... 0 12 0.1Dominican Republic ... ... ... ... 12 ... ... 0 12 0.1Guatemala ... ... ... 10 ... ... ... 0 10 0.1Other ... ... ... ... ... ... ... 0 11 0.0
Total 4 246 1647 1 602 1 456 466 324 1141
623 11
478 100Percentages 37.0 14.3 14.0 12.7 4.1 2.8 1.0 14.1 100 ...
Source: Economic Commission for Latin America and the Caribbean (ECLAC), on the basis of América Economía, “La banca latinoamericana en 2011”, Santiago, Chile, October 2011.
Table III.7 LATIN AMERICA: CONCENTRATION OF THE BANKING MARKET, 1994-2010
(Percentages)
1994 2000 20103 largest 10 largest 3 largest 10 largest 3 largest 10 largest
Argentina 39.1 73.1 39.8 80.7 44.8 79.6Brazil 49.9 78.8 55.2 85.6 60.4 88.3Chile 39.5 79.1 39.5 82.0 58.8 94.5Mexico 48.3 80.8 56.3 94.5 54.8 87.9Venezuela (Bolivarian Republic of) 43.9 78.6 46.7 75.7 47.3 93.7
Source: Economic Commission for Latin America and the Caribbean (ECLAC), on the basis of Barbara Stallings and Rogerio Studart, “Financial regulation and supervision in emerging markets: The experience of Latin America since the tequila crisis”, Macroeconomía del desarrollo series, No. 9 (LC/L.1670-P), Santiago, Chile, Economic Commission for Latin America and the Caribbean (ECLAC), December 2001. United Nations publication, Sales No. E.01.II.G.205 [online] http://www.eclac.cl/publicaciones/xml/4/9084/lcl1670i.pdf; and BankScope.
Initially, apart from Brazil and Mexico, foreign banks focused on medium-sized countries (see box III.2). Once they had consolidated their position in local markets, however, the major Spanish institutions embarked on new diversification plans. An important factor in this respect was the possibility of gaining access to pension fund administrators and insurance companies. In the early 2000s, Banco Santander and BBVA made a forceful entry into the region’s largest markets (Brazil and Mexico) and established what was to be their new global strategic approach (see table III.6). At the same time, they were making new acquisitions in Mediterranean Europe and the United Kingdom (see table III.3). The Brazilian market proved to be an especially difficult one for Spanish banks; in fact, fierce competition with local institutions forced BBVA to pull out of that market very quickly, while Banco Santander has been working extremely hard to hold on to and expand its market share.
Mexico thus became one of the main focuses for Spanish banks’ operations in Latin America after restrictions on foreign capital in the banking system were lifted in 1998 (Suárez, 2010) (see box III.2). Once they had gained control of some of Mexico’s largest financial institutions, Spanish banks turned their attention to the United States market. They used a number of different entry strategies for this
purpose. Seeking to take advantage of the opportunities offered by the large population of Mexican immigrants living in the United States and the large volume of remittances that they send back home, BBVA acquired a number of banks in the southern part of the country and consolidated them into BBVA Compass (Calderón and Machinea, 2008). Banco Santander bought Sovereign Bancorp as a means of entering the competitive market in the north-eastern United States. It was helped in this attempt not only by its presence in the Mexican market but also by its prior experience in the United Kingdom, where it had bought up Abbey Bank and part of Royal Bank of Scotland and NatWest in Scotland (Santander, 2011).19 This initial stake in Latin America on the part of the larger Spanish banking institutions enabled them to gain access to more competitive markets in Europe and North America and, in a few years’ time, they have been able to position themselves among the leading banks not only in Europe but also globally (see table III.2).
19 In continental Europe, Banco Santander has operations in Germany, Poland and Portugal. In late 2010, it purchased Zachodni WBK Bank in Poland and the commercial banking operations of the Swedish Skandinaviska Enskilda Banken (SEB Group) in Germany (Santander, 2011).

Economic Commission for Latin America and the Caribbean (ECLAC)120
Box III.2 FOREIGN BANKS’ SWIFT ENTRY INTO MEXICO
The Mexican banking system has undergone sweeping changes in a relatively short amount of time, and the part played in this by foreign institutions has been assessed differently at different times. The fact of the matter is, however, that the State-run industry was ultimately handed over to the private sector in Mexico and wound up being largely dominated by foreign banks.
Throughout almost all of the twentieth century, banking was the sole province of local institutions. The only foreign bank operating in Mexico was Citibank, which had set up its operations in 1929 —long before the passage of legislation restricting foreign banks’ involvement in 1966 (Beck and Martínez, 2010). In 1982, in the aftermath of the debt crisis, the sector passed from private (mainly Mexican) hands to the State, which paid out some US$ 500 million in compensation to prior owners. In the early 1990s, as part of the country’s structural reform effort, the financial sector underwent a fast-paced liberalization process and the banking sector’s reprivatisation was announced. Even while negotiations were being pursued in connection with the Free Trade Agreement of the Americas (FTAA), which entailed a more flexible approach to foreign investment in the industry, it was determined, as part of the reprivatisation process, that a controlling interest in these institutions should remain in Mexican hands. In all, 18 banks (a number of which fetched very high prices even though their finances were not in very good shape) were auctioned off, with the Government of Mexico taking in approximately US$ 12 billion from the sales. After the new owners had taken possession of these institutions, authorization was given for the establishment of new banks as well, thereby spurring competition, particularly for market share.
This triggered a credit boom at a time when trade liberalization was sparking a dramatic shift in the country’s production structure against a backdrop of weak financial supervision and regulation and major shortcomings in the banking system in terms of capitalization and loan-risk assessment. Between 1988 and 1994, bank credit rose from the equivalent of 38% to 49% of GDP. By 1994, the steady increase in the deficit on current account, the loss of reserves and the overvaluation
of the exchange rate had made the macroeconomic situation untenable. A severe adjustment plan was then launched, with a 50% devaluation, which sparked a deep banking crisis that drove up the volume of non-performing loans to the equivalent of 15% of GDP. Those loans were then absorbed by the State-run Bank Fund for Savings Protection (FOBAPROA). The State stepped into the banking sector once again and put a drastic bail-out plan into place at a cost of nearly 19% of GDP. In addition, many of the recently privatized institutions folded (Avalos and Hernández-Trillo, 2006; Suárez, 2010).
In 1995, although the decision to keep the largest banks —Banco Nacional de Mexico (Banamex), Bancomer and Serfín— in Mexican hands remained in place, the regulations on FDI in the banking sector were loosened and the pace at which the sector was being opened picked up, with foreign banks’ share of the national market expanding from 6% to 25%. Banco Santander bought Somex, and Citibank bought Confia. The banks remained in a weakened position in the wake of the crisis, however, and the government came under pressure because of the cost of the bail-out. This, together with the pressure being exerted by some international organizations and foreign governments for a greater liberalization of the sector, pushed the government into moving ahead more rapidly with the elimination of all remaining legal restrictions on the acquisition of Mexican institutions by foreign banks (Haber and Musacchio, 2005).
Between 2000 and 2001, the Spanish banks BBVA and Banco Santander acquired a controlling interest in Bancomer and Serfin, respectively, and Citicorp bought Banamex. In addition, HSBC acquired Bital, and the Canadian Scotiabank bought Inverlat. With these transactions, foreign banks came to control more than 80% of the banking system’s assets (Claessens and others, 2008). Mexico thus went from being one of the countries whose banking sector was the least accessible to foreign investment to one in which foreign institutions had one of the largest market shares in the system. However, owing to the difficulties that it has faced in overcoming the impact of two major banking crises in little more than a decade, Mexico’s banking sector is quite small relative to the country’s level of development. Between
2000 and 2005, while the country’s per capita income climbed from US$ 5,800 to almost US$ 8,000, the volume of credit granted by the banking system slipped from 34.1% to 32.1% of GDP (see figures III.1 and III.14).
Starting in 2000, banks embarked upon an intensive effort to reorganize and clean up their accounts. Their strategies focused on boosting efficiency, making staff cuts (especially senior positions), targeting middle- and upper-income sectors, and attracting funds at the lowest possible cost in the country’s depressed credit market so that they could widen their spreads and increase their commissions and administer the payments system. This strategy proved to be very effective, and banks began to turn a large profit. During the Administration of President Calderón, various reforms were introduced that made the system more transparent, which led to a slight reduction in commissions, and credit activity, especially in the case of consumer credit, began to surge.
Mexico was hard-hit by the 2008 crisis because of the impact that it had on its production of exports for the United States market. The portfolio of non-performing loans swelled, and business and household credit shrank. The federal government implemented an expansionary monetary policy which, in combination with price stability, staved off a greater decline in household income and a spike in borrowing costs. As the economy began to make a comeback in 2010, and given the sturdy financial position of banks operating in Mexico, consumer lending also began to rebound, but this was not the case for investment loans. In fact, the banks were well-capitalized before the crisis erupted, obtained funding from local deposits, and did not engage in high-risk investments or issue high-risk paper (BBVA Research, 2011). The banks continue to concentrate on consumer loans, however, while non-bank agents are accounting for most of the volume of mortgages and business loans (Mundo ejecutivo, 2011; Fenton and Padilla, 2012). According to the authorities, Mexican financial institutions are very well positioned for the adoption of Basel III, but the industry remains somewhat underdeveloped, and bank loans amount to the equivalent of 45% of GDP, which is still a far cry from the levels seen in the largest Latin American economies (see figure III.14).
Source: Economic Commission for Latin America and the Caribbean (ECLAC).

121Foreign Direct Investment in Latin America and the Caribbean • 2011
BBVA has recently begun to explore opportunities in the Orient for entering into strategic alliances with some of the biggest banks in China and India: China CITIC Bank (CNCB) and Bank of Baroda, respectively (Casilda, 2011). It has also acquired a controlling interest in the Turkish Garanti Bank (Cinco días, 2011).
Two of the banks that have had the most ambitious plans for global expansion for the last few decades, Citigroup and HSBC, then began to strengthen their presence in the region in response to regulatory changes in their home countries. These institutions gradually moved into more and more different segments of the industry, operating at one and the same time as both investment and commercial banks, until they reached the point of becoming universal banks that receive deposits, extend credit and market securitized products. As noted earlier, this has shown itself to be a successful survival strategy in a market where the investment banking segment is growing exponentially, and it has led to a high degree of consolidation between commercial and investment banking (ECLAC, 2003).
These large, increasingly well-regarded universal banks expanded their international operations and began to offer a wide array of services. After a century of catering to businesses and private high-end clients, in 2001 Citigroup made the leap to consumer banking by buying Banamex in Mexico for US$ 12.821 billion. This was the largest acquisition in the entire history of the banking industry in Latin America (see table III.5). Although this transaction placed Citigroup among the elite of the Latin American financial system, Citigroup continued to use a selective strategy, waiting for opportunities to take over new institutions with a more suitable structure for retail banking. This strategy led it to undertake major acquisitions in El Salvador that strengthened its position in Central America and to enter into an alliance with the Luksic conglomerate in Chile for the marketing of
banking services and products via three different brand names: Banco de Chile, Banco Edwards and Citibank.
HSBC is one of the world’s largest financial institutions, with operations in over 80 countries. In the mid-1990s, it decided to strengthen its position in Latin America, which until that time had been very limited. First it acquired minority holdings in banks in Brazil, Mexico and Peru to complement some small holdings that it already had in Argentina and Chile. It then began to expand more aggressively, buying up new assets in Argentina, Bermuda, Brazil, Mexico, Panama and Central America. These acquisitions turned it into the third-largest international financial institution in Latin America, after Spain’s Banco Santander and BBVA (see table III.6).
Canada’s Scotiabank has been operating in the region, especially in the Caribbean, for a long time (ECLAC, 2008; IMF, 2009a). Its internationalization strategy has focused on rapidly growing markets and economies with favourable demographics in which bank penetration is still low. In the early 2000s, its regional operations were mainly in Argentina and Chile, but when the financial crisis erupted in Argentina, it withdrew its capital from that country and began to build up its operations in Mexico, where it bought Inverlat, and in Central America, the Dominican Republic and Panama. In South America, it continues to be quite active in Chile, Colombia and Peru.
In sum, the presence of foreign banks in Latin America has been spurred by two main factors: (a) the quest by banks in developed countries for new options as they see their revenues begin to shrink in their mature, highly competitive home markets; and (b) the changed institutional and macroeconomic situation in Latin America as the region emerged from the succession of deep economic and financial crises of the preceding decades, which opened the door to entry into markets with a high growth potential in which the level of bank penetration was still low.
3. The behaviour and performance of foreign banks: are they really so different from national institutions?
The empirical evidence concerning the impacts of the entry of foreign banks is not entirely conclusive. There does seem to be a consensus that their presence has stoked competition in Latin American markets, but, apart from this point of agreement, the effects of foreign institutions’ participation in the banking system in the region has been a heatedly debated subject about which there are sharply differing views.
• Those who advocate the entry of foreign institutions contend that their presence makes local banking markets more competitive; boosts the operating efficiency of national institutions by promoting the incorporation of technology, new management techniques and new products and services; and narrows local banks’ profit margins and prompts
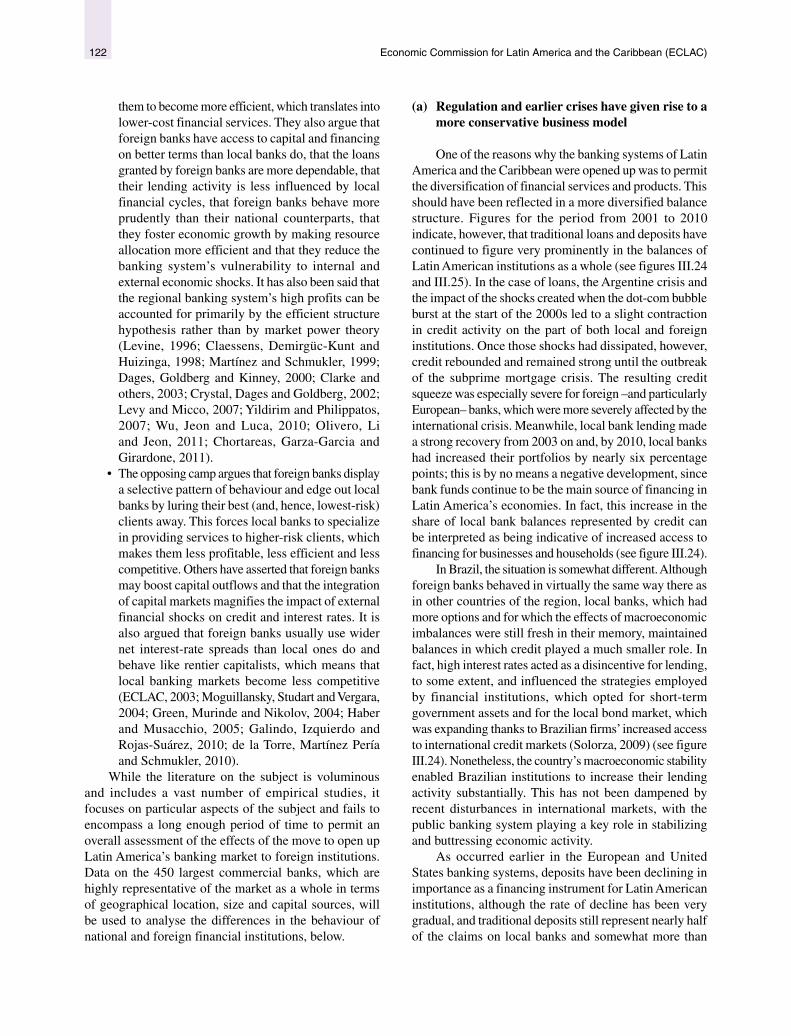
Economic Commission for Latin America and the Caribbean (ECLAC)122
them to become more efficient, which translates into lower-cost financial services. They also argue that foreign banks have access to capital and financing on better terms than local banks do, that the loans granted by foreign banks are more dependable, that their lending activity is less influenced by local financial cycles, that foreign banks behave more prudently than their national counterparts, that they foster economic growth by making resource allocation more efficient and that they reduce the banking system’s vulnerability to internal and external economic shocks. It has also been said that the regional banking system’s high profits can be accounted for primarily by the efficient structure hypothesis rather than by market power theory (Levine, 1996; Claessens, Demirgüc-Kunt and Huizinga, 1998; Martínez and Schmukler, 1999; Dages, Goldberg and Kinney, 2000; Clarke and others, 2003; Crystal, Dages and Goldberg, 2002; Levy and Micco, 2007; Yildirim and Philippatos, 2007; Wu, Jeon and Luca, 2010; Olivero, Li and Jeon, 2011; Chortareas, Garza-Garcia and Girardone, 2011).
• The opposing camp argues that foreign banks display a selective pattern of behaviour and edge out local banks by luring their best (and, hence, lowest-risk) clients away. This forces local banks to specialize in providing services to higher-risk clients, which makes them less profitable, less efficient and less competitive. Others have asserted that foreign banks may boost capital outflows and that the integration of capital markets magnifies the impact of external financial shocks on credit and interest rates. It is also argued that foreign banks usually use wider net interest-rate spreads than local ones do and behave like rentier capitalists, which means that local banking markets become less competitive (ECLAC, 2003; Moguillansky, Studart and Vergara, 2004; Green, Murinde and Nikolov, 2004; Haber and Musacchio, 2005; Galindo, Izquierdo and Rojas-Suárez, 2010; de la Torre, Martínez Pería and Schmukler, 2010).
While the literature on the subject is voluminous and includes a vast number of empirical studies, it focuses on particular aspects of the subject and fails to encompass a long enough period of time to permit an overall assessment of the effects of the move to open up Latin America’s banking market to foreign institutions. Data on the 450 largest commercial banks, which are highly representative of the market as a whole in terms of geographical location, size and capital sources, will be used to analyse the differences in the behaviour of national and foreign financial institutions, below.
(a) Regulation and earlier crises have given rise to a more conservative business model
One of the reasons why the banking systems of Latin America and the Caribbean were opened up was to permit the diversification of financial services and products. This should have been reflected in a more diversified balance structure. Figures for the period from 2001 to 2010 indicate, however, that traditional loans and deposits have continued to figure very prominently in the balances of Latin American institutions as a whole (see figures III.24 and III.25). In the case of loans, the Argentine crisis and the impact of the shocks created when the dot-com bubble burst at the start of the 2000s led to a slight contraction in credit activity on the part of both local and foreign institutions. Once those shocks had dissipated, however, credit rebounded and remained strong until the outbreak of the subprime mortgage crisis. The resulting credit squeeze was especially severe for foreign –and particularly European– banks, which were more severely affected by the international crisis. Meanwhile, local bank lending made a strong recovery from 2003 on and, by 2010, local banks had increased their portfolios by nearly six percentage points; this is by no means a negative development, since bank funds continue to be the main source of financing in Latin America’s economies. In fact, this increase in the share of local bank balances represented by credit can be interpreted as being indicative of increased access to financing for businesses and households (see figure III.24).
In Brazil, the situation is somewhat different. Although foreign banks behaved in virtually the same way there as in other countries of the region, local banks, which had more options and for which the effects of macroeconomic imbalances were still fresh in their memory, maintained balances in which credit played a much smaller role. In fact, high interest rates acted as a disincentive for lending, to some extent, and influenced the strategies employed by financial institutions, which opted for short-term government assets and for the local bond market, which was expanding thanks to Brazilian firms’ increased access to international credit markets (Solorza, 2009) (see figure III.24). Nonetheless, the country’s macroeconomic stability enabled Brazilian institutions to increase their lending activity substantially. This has not been dampened by recent disturbances in international markets, with the public banking system playing a key role in stabilizing and buttressing economic activity.
As occurred earlier in the European and United States banking systems, deposits have been declining in importance as a financing instrument for Latin American institutions, although the rate of decline has been very gradual, and traditional deposits still represent nearly half of the claims on local banks and somewhat more than
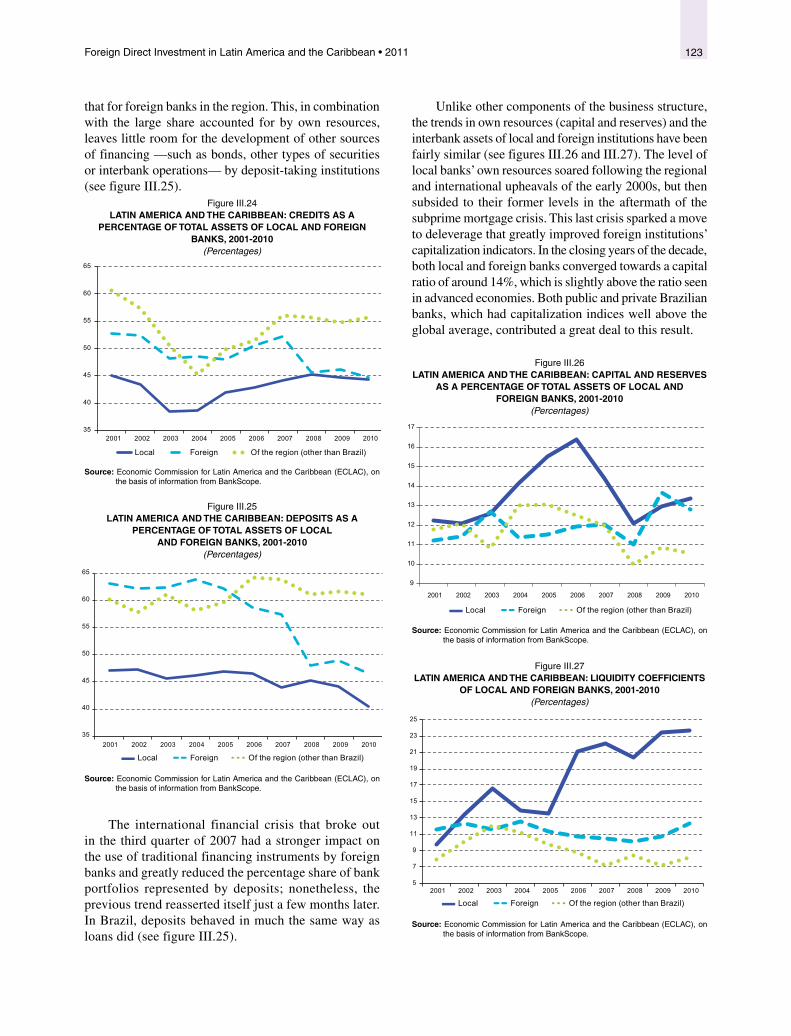
123Foreign Direct Investment in Latin America and the Caribbean • 2011
that for foreign banks in the region. This, in combination with the large share accounted for by own resources, leaves little room for the development of other sources of financing —such as bonds, other types of securities or interbank operations— by deposit-taking institutions (see figure III.25).
Figure III.24 LATIN AMERICA AND THE CARIBBEAN: CREDITS AS A
PERCENTAGE OF TOTAL ASSETS OF LOCAL AND FOREIGN BANKS, 2001-2010
(Percentages)
Local Foreign Of the region (other than Brazil)
35
40
45
50
55
60
65
2001 2002 2003 2004 2005 2006 2007 2008 2009 2010
Source: Economic Commission for Latin America and the Caribbean (ECLAC), on the basis of information from BankScope.
Figure III.25 LATIN AMERICA AND THE CARIBBEAN: DEPOSITS AS A
PERCENTAGE OF TOTAL ASSETS OF LOCAL AND FOREIGN BANKS, 2001-2010
(Percentages)
35
40
45
50
55
60
65
2001 2002 2003 2004 2005 2006 2007 2008 2009 2010
Local Foreign Of the region (other than Brazil)
Source: Economic Commission for Latin America and the Caribbean (ECLAC), on the basis of information from BankScope.
The international financial crisis that broke out in the third quarter of 2007 had a stronger impact on the use of traditional financing instruments by foreign banks and greatly reduced the percentage share of bank portfolios represented by deposits; nonetheless, the previous trend reasserted itself just a few months later. In Brazil, deposits behaved in much the same way as loans did (see figure III.25).
Unlike other components of the business structure, the trends in own resources (capital and reserves) and the interbank assets of local and foreign institutions have been fairly similar (see figures III.26 and III.27). The level of local banks’ own resources soared following the regional and international upheavals of the early 2000s, but then subsided to their former levels in the aftermath of the subprime mortgage crisis. This last crisis sparked a move to deleverage that greatly improved foreign institutions’ capitalization indicators. In the closing years of the decade, both local and foreign banks converged towards a capital ratio of around 14%, which is slightly above the ratio seen in advanced economies. Both public and private Brazilian banks, which had capitalization indices well above the global average, contributed a great deal to this result.
Figure III.26 LATIN AMERICA AND THE CARIBBEAN: CAPITAL AND RESERVES
AS A PERCENTAGE OF TOTAL ASSETS OF LOCAL AND FOREIGN BANKS, 2001-2010
(Percentages)
9
10
11
12
13
14
15
16
17
2001 2002 2003 2004 2005 2006 2007 2008 2009 2010
Local Foreign Of the region (other than Brazil)
Source: Economic Commission for Latin America and the Caribbean (ECLAC), on the basis of information from BankScope.
Figure III.27 LATIN AMERICA AND THE CARIBBEAN: LIQUIDITY COEFFICIENTS
OF LOCAL AND FOREIGN BANKS, 2001-2010 (Percentages)
5
7
9
11
13
15
17
19
21
23
25
2001 2002 2003 2004 2005 2006 2007 2008 2009 2010
Local Foreign Of the region (other than Brazil)
Source: Economic Commission for Latin America and the Caribbean (ECLAC), on the basis of information from BankScope.
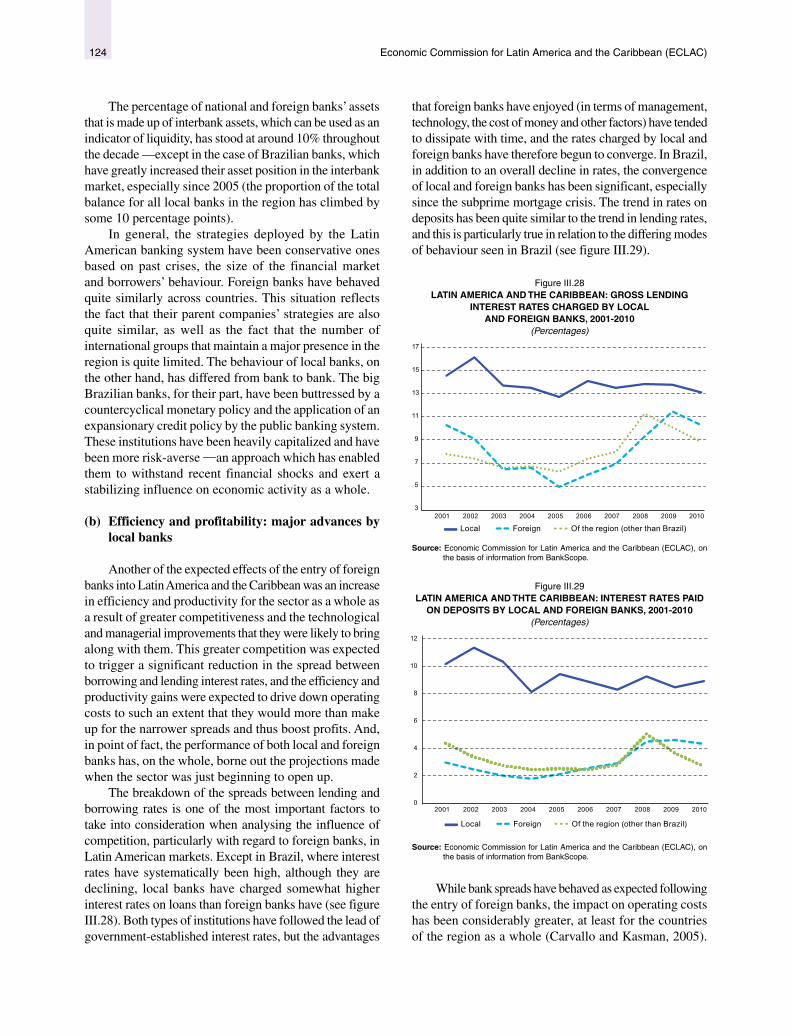
Economic Commission for Latin America and the Caribbean (ECLAC)124
The percentage of national and foreign banks’ assets that is made up of interbank assets, which can be used as an indicator of liquidity, has stood at around 10% throughout the decade —except in the case of Brazilian banks, which have greatly increased their asset position in the interbank market, especially since 2005 (the proportion of the total balance for all local banks in the region has climbed by some 10 percentage points).
In general, the strategies deployed by the Latin American banking system have been conservative ones based on past crises, the size of the financial market and borrowers’ behaviour. Foreign banks have behaved quite similarly across countries. This situation reflects the fact that their parent companies’ strategies are also quite similar, as well as the fact that the number of international groups that maintain a major presence in the region is quite limited. The behaviour of local banks, on the other hand, has differed from bank to bank. The big Brazilian banks, for their part, have been buttressed by a countercyclical monetary policy and the application of an expansionary credit policy by the public banking system. These institutions have been heavily capitalized and have been more risk-averse —an approach which has enabled them to withstand recent financial shocks and exert a stabilizing influence on economic activity as a whole.
(b) Efficiency and profitability: major advances by local banks
Another of the expected effects of the entry of foreign banks into Latin America and the Caribbean was an increase in efficiency and productivity for the sector as a whole as a result of greater competitiveness and the technological and managerial improvements that they were likely to bring along with them. This greater competition was expected to trigger a significant reduction in the spread between borrowing and lending interest rates, and the efficiency and productivity gains were expected to drive down operating costs to such an extent that they would more than make up for the narrower spreads and thus boost profits. And, in point of fact, the performance of both local and foreign banks has, on the whole, borne out the projections made when the sector was just beginning to open up.
The breakdown of the spreads between lending and borrowing rates is one of the most important factors to take into consideration when analysing the influence of competition, particularly with regard to foreign banks, in Latin American markets. Except in Brazil, where interest rates have systematically been high, although they are declining, local banks have charged somewhat higher interest rates on loans than foreign banks have (see figure III.28). Both types of institutions have followed the lead of government-established interest rates, but the advantages
that foreign banks have enjoyed (in terms of management, technology, the cost of money and other factors) have tended to dissipate with time, and the rates charged by local and foreign banks have therefore begun to converge. In Brazil, in addition to an overall decline in rates, the convergence of local and foreign banks has been significant, especially since the subprime mortgage crisis. The trend in rates on deposits has been quite similar to the trend in lending rates, and this is particularly true in relation to the differing modes of behaviour seen in Brazil (see figure III.29).
Figure III.28 LATIN AMERICA AND THE CARIBBEAN: GROSS LENDING
INTEREST RATES CHARGED BY LOCAL AND FOREIGN BANKS, 2001-2010
(Percentages)
3
5
7
9
11
13
15
17
2001 2002 2003 2004 2005 2006 2007 2008 2009 2010
Local Foreign Of the region (other than Brazil)
Source: Economic Commission for Latin America and the Caribbean (ECLAC), on the basis of information from BankScope.
Figure III.29 LATIN AMERICA AND THTE CARIBBEAN: INTEREST RATES PAID
ON DEPOSITS BY LOCAL AND FOREIGN BANKS, 2001-2010 (Percentages)
0
2
4
6
8
10
12
2001 2002 2003 2004 2005 2006 2007 2008 2009 2010
Local Foreign Of the region (other than Brazil)
Source: Economic Commission for Latin America and the Caribbean (ECLAC), on the basis of information from BankScope.
While bank spreads have behaved as expected following the entry of foreign banks, the impact on operating costs has been considerably greater, at least for the countries of the region as a whole (Carvallo and Kasman, 2005).
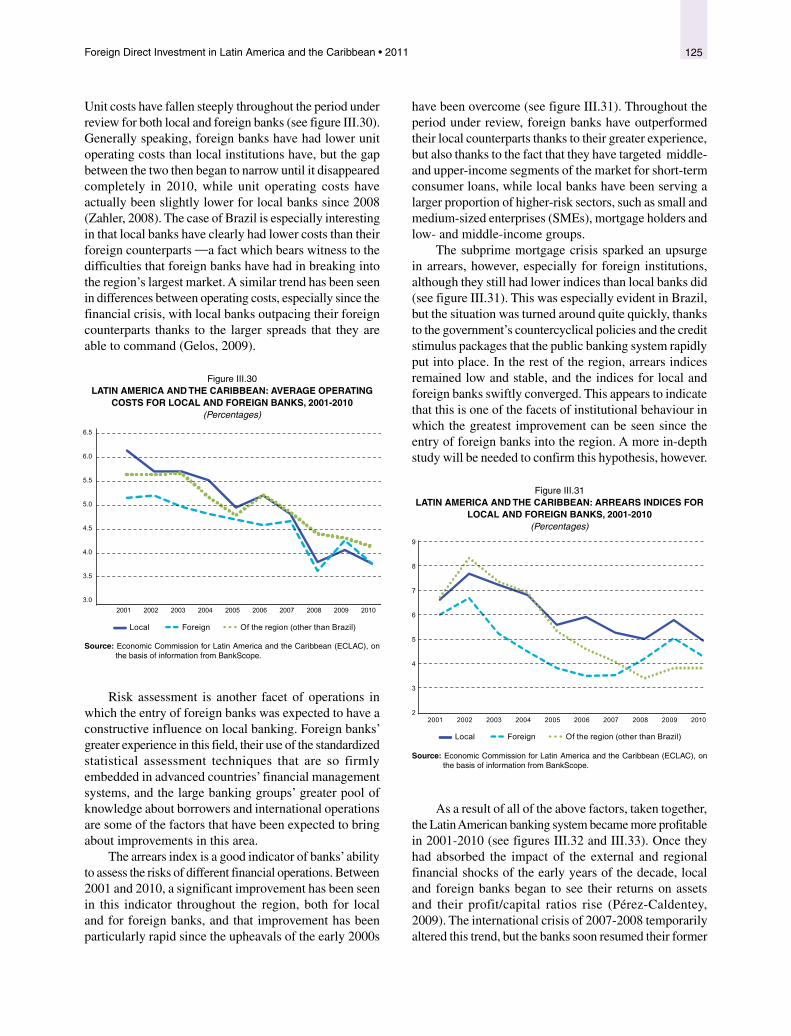
125Foreign Direct Investment in Latin America and the Caribbean • 2011
Unit costs have fallen steeply throughout the period under review for both local and foreign banks (see figure III.30). Generally speaking, foreign banks have had lower unit operating costs than local institutions have, but the gap between the two then began to narrow until it disappeared completely in 2010, while unit operating costs have actually been slightly lower for local banks since 2008 (Zahler, 2008). The case of Brazil is especially interesting in that local banks have clearly had lower costs than their foreign counterparts —a fact which bears witness to the difficulties that foreign banks have had in breaking into the region’s largest market. A similar trend has been seen in differences between operating costs, especially since the financial crisis, with local banks outpacing their foreign counterparts thanks to the larger spreads that they are able to command (Gelos, 2009).
Figure III.30 LATIN AMERICA AND THE CARIBBEAN: AVERAGE OPERATING
COSTS FOR LOCAL AND FOREIGN BANKS, 2001-2010 (Percentages)
3.0
3.5
4.0
4.5
5.0
5.5
6.0
6.5
2001 2002 2003 2004 2005 2006 2007 2008 2009 2010
Local Foreign Of the region (other than Brazil)
Source: Economic Commission for Latin America and the Caribbean (ECLAC), on the basis of information from BankScope.
Risk assessment is another facet of operations in which the entry of foreign banks was expected to have a constructive influence on local banking. Foreign banks’ greater experience in this field, their use of the standardized statistical assessment techniques that are so firmly embedded in advanced countries’ financial management systems, and the large banking groups’ greater pool of knowledge about borrowers and international operations are some of the factors that have been expected to bring about improvements in this area.
The arrears index is a good indicator of banks’ ability to assess the risks of different financial operations. Between 2001 and 2010, a significant improvement has been seen in this indicator throughout the region, both for local and for foreign banks, and that improvement has been particularly rapid since the upheavals of the early 2000s
have been overcome (see figure III.31). Throughout the period under review, foreign banks have outperformed their local counterparts thanks to their greater experience, but also thanks to the fact that they have targeted middle- and upper-income segments of the market for short-term consumer loans, while local banks have been serving a larger proportion of higher-risk sectors, such as small and medium-sized enterprises (SMEs), mortgage holders and low- and middle-income groups.
The subprime mortgage crisis sparked an upsurge in arrears, however, especially for foreign institutions, although they still had lower indices than local banks did (see figure III.31). This was especially evident in Brazil, but the situation was turned around quite quickly, thanks to the government’s countercyclical policies and the credit stimulus packages that the public banking system rapidly put into place. In the rest of the region, arrears indices remained low and stable, and the indices for local and foreign banks swiftly converged. This appears to indicate that this is one of the facets of institutional behaviour in which the greatest improvement can be seen since the entry of foreign banks into the region. A more in-depth study will be needed to confirm this hypothesis, however.
Figure III.31 LATIN AMERICA AND THE CARIBBEAN: ARREARS INDICES FOR
LOCAL AND FOREIGN BANKS, 2001-2010 (Percentages)
2
3
4
5
6
7
8
9
2001 2002 2003 2004 2005 2006 2007 2008 2009 2010
Local Foreign Of the region (other than Brazil)
Source: Economic Commission for Latin America and the Caribbean (ECLAC), on the basis of information from BankScope.
As a result of all of the above factors, taken together, the Latin American banking system became more profitable in 2001-2010 (see figures III.32 and III.33). Once they had absorbed the impact of the external and regional financial shocks of the early years of the decade, local and foreign banks began to see their returns on assets and their profit/capital ratios rise (Pérez-Caldentey, 2009). The international crisis of 2007-2008 temporarily altered this trend, but the banks soon resumed their former

Economic Commission for Latin America and the Caribbean (ECLAC)126
growth path. In recent years, asset yields for both types of banks have been quite symmetrical throughout the region, although this indicator does show slightly more favourable results for foreign banks (with the exception of the period immediately after the subprime mortgage crisis). In Brazil, however, the situation is just the opposite, since local institutions have systematically outperformed foreign banks (except during the early years of the decade, owing, in all probability, to the Argentine crisis and the recent entry of foreign banks), all of which goes to show how strong their position has been all along. In the rest of the region, local banks used to have a lower asset yield than foreign banks, but they soon converged towards more or less the same level (see figure III.32).
Figure III.32 LATIN AMERICA AND THE CARIBBEAN: ASSET YIELDS FOR
LOCAL AND FOREIGN BANKS, 2001-2010 (Percentages)
-1.0
-0.5
0.0
0.5
1.0
1.5
2.0
2.5
3.0
2001 2002 2003 2004 2005 2006 2007 2008 2009 2010
Local Foreign Of the region (other than Brazil)
Source: Economic Commission for Latin America and the Caribbean (ECLAC), on the basis of information from BankScope.
As in the case of asset yields, profit/capital ratios have been better for foreign banks, except in the wake of the recent international financial disturbances (see figures III.32 and III.33). As mentioned earlier, as a result of strong competition among the major local banks, foreign institutions’ capital/profit ratios in Brazil have been somewhat lower than the average for the region as a whole; they have, however, followed a very similar trend, except during the early years of the 2000s (see figure III.33).
In sum, the entry of foreign banks into Latin America and the Caribbean, which took place primarily during the second half of the 1990s, has galvanized the regional financial market. Foreign banks spurred competition within the market, which led to narrower spreads and lower costs. They also helped to modernize the Latin American banking
system by improving in-house procedures, refining risk assessment (credit rating) systems and expanding the range of services offered, and they fostered financial inclusion by making the financial system and their expanded portfolio of products and services accessible to more and more formerly unserved sectors of society (although local banks are actually the ones that deal with the great majority of the persons in these sectors).
Figure III.33 LATIN AMERICA AND THE CARIBBEAN: PROFIT/CAPITAL RATIOS
FOR LOCAL AND FOREIGN BANKS, 2001-2010 (Percentages)
-10
-5
0
5
10
15
20
25
2001 2002 2003 2004 2005 2006 2007 2008 2009 2010
Local Foreign Of the region (other than Brazil)
Source: Economic Commission for Latin America and the Caribbean (ECLAC), on the basis of information from BankScope.
In the first decade of the twenty-first century, however, foreign banks appear to be growing less rapidly and becoming significantly less influential, which may be attributable to the fact that the market has matured, efficiency and productivity indicators for the banking industry as a whole have levelled off, and foreign institutions’ market share has been shrinking (see figure III.22). The regional and global shocks of the early 2000s and the international financial crises that have broken out since 2007 are also likely to have been factors in this loss of ground, along with the more cautious attitude adopted by foreign banks. Local banks have responded to these circumstances with alacrity by boosting their efficiency and productivity levels and have regained much of the market share they had lost during the preceding decade. In addition, the strength and size of local banks in Brazil and other countries of the region enable them to maintain slightly wider spreads. These advantages, together with their efficiency gains, have allowed local banks to begin to outperform foreign institutions in terms of profit ratios, especially since the most recent international financial crisis.
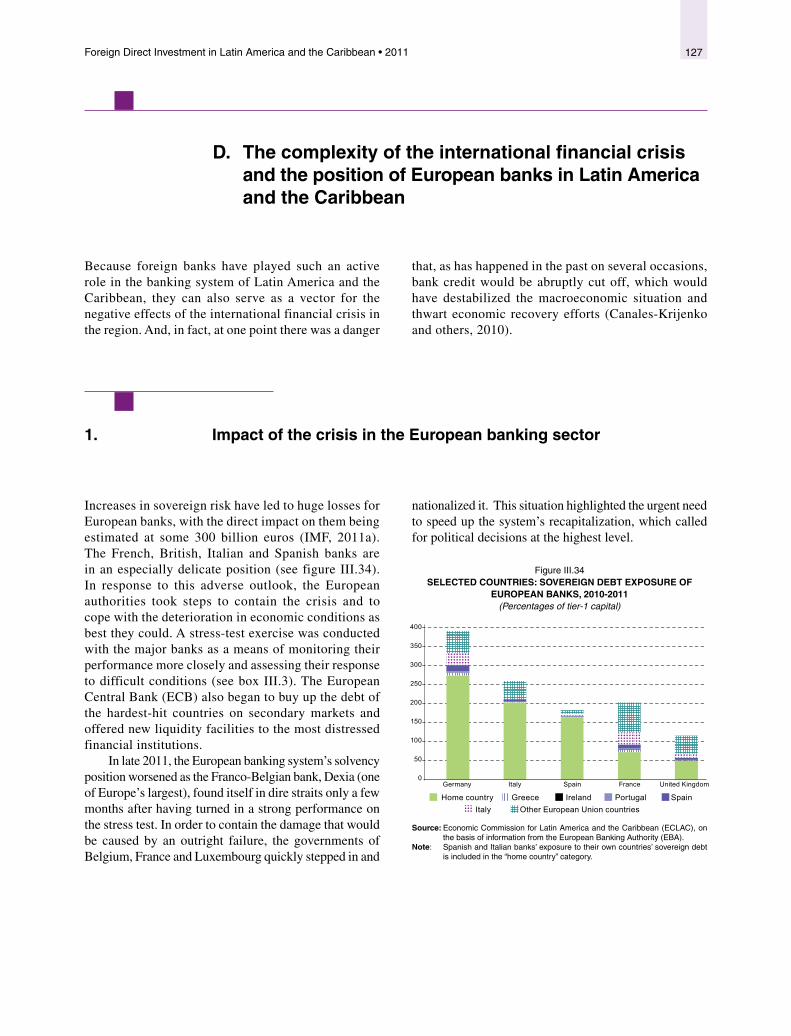
127Foreign Direct Investment in Latin America and the Caribbean • 2011
D. The complexity of the international financial crisis and the position of European banks in Latin America and the Caribbean
Because foreign banks have played such an active role in the banking system of Latin America and the Caribbean, they can also serve as a vector for the negative effects of the international financial crisis in the region. And, in fact, at one point there was a danger
that, as has happened in the past on several occasions, bank credit would be abruptly cut off, which would have destabilized the macroeconomic situation and thwart economic recovery efforts (Canales-Krijenko and others, 2010).
1. Impact of the crisis in the European banking sector
Increases in sovereign risk have led to huge losses for European banks, with the direct impact on them being estimated at some 300 billion euros (IMF, 2011a). The French, British, Italian and Spanish banks are in an especially delicate position (see figure III.34). In response to this adverse outlook, the European authorities took steps to contain the crisis and to cope with the deterioration in economic conditions as best they could. A stress-test exercise was conducted with the major banks as a means of monitoring their performance more closely and assessing their response to difficult conditions (see box III.3). The European Central Bank (ECB) also began to buy up the debt of the hardest-hit countries on secondary markets and offered new liquidity facilities to the most distressed financial institutions.
In late 2011, the European banking system’s solvency position worsened as the Franco-Belgian bank, Dexia (one of Europe’s largest), found itself in dire straits only a few months after having turned in a strong performance on the stress test. In order to contain the damage that would be caused by an outright failure, the governments of Belgium, France and Luxembourg quickly stepped in and
nationalized it. This situation highlighted the urgent need to speed up the system’s recapitalization, which called for political decisions at the highest level.
Figure III.34 SELECTED COUNTRIES: SOVEREIGN DEBT EXPOSURE OF
EUROPEAN BANKS, 2010-2011 (Percentages of tier-1 capital)
0
50
100
150
200
250
300
350
400
Germany Italy Spain France United Kingdom
Home country Greece Ireland Portugal SpainItaly Other European Union countries
Source: Economic Commission for Latin America and the Caribbean (ECLAC), on the basis of information from the European Banking Authority (EBA).
Note: Spanish and Italian banks’ exposure to their own countries’ sovereign debt is included in the “home country” category.

Economic Commission for Latin America and the Caribbean (ECLAC)128
Box III.3 STRESS TESTS FOR MAJOR BANKS IN THE EUROPEAN UNION
“Stress tests” are simulations that are run in order to assess banks’ capacity to cope with deteriorating economic conditions and some of their after-effects, such as rising unemployment, loan defaults and a decline in the value of investments. In general, in a scenario of this kind, banks see a reduction in business volume and start to sustain losses, especially in their loan portfolios, but also because of the devaluation of assets such as real estate holdings. In order to be able to weather these adverse conditions, banks must exhibit a certain level of solvency, which is measured on the basis of their tier-1 capital. This indicator reflects banks’ holdings of capital plus reserves, undistributed earnings and perpetual preference shares that will enable them to cover their risk assets (loans, stock and other investments). In other words, it is a measurement of the guaranteed own funds which they can use to cover their investments in risk assets.
The European Banking Authority (EBA) is in charge of monitoring implementation of the Basel III framework in the European Union. It does so by applying a stress and solvency test to nearly a hundred European banks and by supervising compliance with capital adequacy rules under an adverse scenario. In July 2010, it published the results of the first of these tests. Those results showed that 7 out of the 91 banks that were tested (which constitute two thirds of the European banking sector and account for at least 50% of each country’s local market) failed the test and that the European banking system as a whole needed a fresh cash injection of 3.5 billion euros so that the more vulnerable institutions could reach the minimum standard of
5% of tier-1 capital (EBA, 2011a). The European Central Bank (ECB), the European Commission and the Basel Committee on Banking Supervision all emphasized that the results confirmed how strong a position the European banking system was in to withstand adverse macroeconomic effects and financial shocks, but the market reacted with scepticism.
In July 2011, the results of the second stress test (which was carried out after the downturn in expectations regarding an economic recovery had become consolidated and European banks had begun to recapitalize) shed light on just how difficult the situation facing many banks was. In order to gauge their capacity to meet capital adequacy requirements in 2012 and how that had changed since 2010, two scenarios were used: a baseline stress scenario and an adverse stress scenario (EBA, 2011a). Of the 90 banks that took these tests, EBA found capital shortfalls in only eight: five in Spain, two in Greece and one in Austria (which would need 2.5 billion euros in fresh funds). It also recommended the recapitalization of 16 banks that had passed the test but had exceeded the 5% 1-tier capital cut-off by just one percentage point (EBA, 2011a). Under the parameters used for the test in the adverse stress scenario, none of the major European banks would have serious solvency issues, with their scores coming in at: BBVA (9.2%), BNP Paribas (7.9%), Deutsche Bank (6.5%), Barclays Banks (7.3%), RBS (6.3%), Santander (8.4%), Lloyds TSB Bank (7.7%), Société Générale (6.6%), HSBC (8.5%), ING Bank (8.7%), UniCredit (6.7%), Commerzbank (6.4%) and Crédit Agricole (8.5%).
Although Spain was one of the countries which had the largest number of troubled banks, it should be noted that it was the only member country of the European Union in which 95% of the country’s financial institutions were tested. The average coverage was 65%, and the threshold figure set by
EBA was 50% of each country’s financial system. If only four financial institutions in Spain had been examined (Santander, BBVA, La Caixa and Bankia), there would have been no major difficulty. The problematic institutions in Spain are its savings and loan associations, which are undergoing sweeping reforms.
Even so, in most cases, when faced with adversity, banks can fall back on access to loan-loss provisions made available by their governments. In fact, without the aid of public capital inputs, nearly one third of the banks that took the stress test would have failed and would be faced with the prospect of sustaining heavy losses if the economic situation were to deteriorate. In this type of case, those that would be the hardest-hit under an adverse scenario would include British banks, led by Royal Bank of Scotland (RBS), Allied Irish Banks and Lloyds Banking Group, all of which passed the solvency test with the help of hefty inputs of government capital. At the other extreme, Santander and BBVA, which did not receive government help, were the leading profit-makers. As in the first test, the supposedly good health of the banking system prompted many analysts to view the results with scepticism and thus to abstain from making any effort to refute negative expectations and the prevailing lack of confidence.
Source: Economic Commission for Latin America and the Caribbean (ECLAC), on the basis of information from the European Banking Authority (EBA) and the United States Federal Reserve.
In another bid to restore confidence in the markets and come up with an across-the-board response to the crisis, the Heads of State and Government of the European Union countries met in Brussels in late October 2011 and agreed to provide Greece with debt relief, ensure that sovereign debt could be financed by leveraging the European Financial Stability Facility and recapitalize the banks.20
20 In March 2012, following intensive negotiations on the restructuring of Greece’s debt and avoidance of a disorderly default another bailout plan amounting to 130 billion euros was approved. In order to make these funds available, the Greek authorities convinced a majority of the debt holders to participate in a “private-sector involvement”
These elements are closely related, since the availability of the resources needed to recapitalize European banking institutions depends, in large measure on the financing of sovereign debt and the discounting of the securities issued by the countries in the greatest distress.
plan. Under this voluntary restructuring arrangement, the country’s 206 billion euros of debt would receive a 53.5% “haircut” in nominal terms (Financial Times, 15 March 2012). However, uncertainty began to mount again in Europe as Greece faced difficulties in forming a government and called fresh elections, and as concern grew that Greece could leave the euro zone.

129Foreign Direct Investment in Latin America and the Caribbean • 2011
Under the plan devised for the banking system’s capitalization, banks were required to meet the 9% tier-1 capital ratio by June 2012. In December 2011, the European Banking Authority estimated the capital required by Europe’s 70 largest banks to meet the new standards at 114.685 billion euros (EBA, 2011a); some private analysts put the number at double that. The deficit was mainly accounted for by banks in Greece, Portugal, Italy and Spain (see figure III.35). At the level of these new standards, nearly 60% of the banks would not have passed the stress test, which had used the pre-existing standard of 5% (see box III.3). If a bank does not reach the target figure, it must submit a recapitalization plan and is not allowed to pay dividends or bonuses to its shareholders. It will also be offered public guarantees on other financing options.
Figure III.35 EUROPEAN BANK RECAPITALIZATION REQUIREMENTS, BY
HOME COUNTRY, 2011 (Percentages of capital)
0 20 40 60 80 100 120 140
Germany
France
Belgium
Spain
Italy
Portugal
Greece
Source: Economic Commission for Latin America and the Caribbean (ECLAC), on the basis of information from the European Bank Authority (EBA), 2011 EU Capital Exercise, London, 8 December 2011 [online] http://www.eba.europa.eu/ capitalexercise/2011/2011-EU-Capital-Exercise.aspx.
Realistically, however, European banks have very few ways of quickly generating own funds. Under the current circumstances, it is difficult to convince the market that the banks can pull out of the crisis by selling off assets, cleaning up their loan portfolios or paying out shareholders’ dividends in the form of securities rather than cash. In fact, in early 2012, the financial sector was in worse shape than any other sector in European markets, with the Italian bank UniCredit, Societé Général of France and the Spanish banks Bankia, Bankinter, Banesto and Caixabank faring particularly badly.
To deal with this situation, ECB has used its long-term refinancing programme to auction off fresh funds to banks at 1% interest and a three-year maturity. The
European banks flooded into the first auction, and 523 banks applied for a total of 489.2 billion euros; in the second, nearly 800 banks received a total of 529.5 billion euros (The Wall Street Journal Americas, 2012a). The banks have used these funds to cover maturities and to invest in new bonds issued by distressed countries (mainly Spain and Italy) at higher interest rates, with this margin helping them to improve their balances. This money also helps them to cover their debts and, in some cases, to make deposits in central banks around the globe (but especially in ECB), although their yield is lower. This injection of almost 1.2 billion euros has helped to stabilize the European banking system, lessen the risk of bank failures and save the banks from having to divest themselves of large sums of loans or other assets in order to cover their financing requirements. This measure has been less effective, however, in spurring a reactivation of bank lending to businesses and households in troubled economies.
The overall thrust of these reforms has been to shore up liquidity and bank solvency in order to reduce the likelihood of further systemic crises. It is also very possible that, as a result of the reduction in bank leveraging, banks will play a less central role as intermediaries. There is, however, no broad consensus concerning the potential effects of these measures.
• The implementation of Basel III could influence global economic growth. Some analysts, financial institutions and national authorities believe that increased own-capital requirements and the proportional increase in more liquid, but less profitable, investments will drive up the cost of credit, lead to credit rationing and make corporate and household saving less profitable. This, in turn, would hurt the real economy (BIS, 2010a and 2010b).
• The austerity plans unveiled by banking institutions are far from enough to cover their capital requirements. There seems to be a vicious circle whereby, since private investors are not willing to provide the funds needed for recapitalization, governments have to obtain the necessary funds, which further exacerbates the public debt problem. This chain of events heightens the complexity of the situation and jeopardizes the stability and growth of the global economy.
• The steps taken to inject liquidity into the banking system do not resolve the underlying problem, but instead merely provide temporary respite to the countries and institutions that have been hardest-hit by the sovereign debt crisis. What is more, they have temporarily blunted the incentives for banks to reduce their sovereign bond holdings generated by the steep reduction in the profitability of these

Economic Commission for Latin America and the Caribbean (ECLAC)130
instruments on the market. However, they have not managed to spur bank lending, and this has deepened the recession. As long as the crisis remains unresolved, credit demand will remain depressed, and this will, in turn, hurt the banks’ main business operations.
For the authorities who are moving this process forward, however, the expected benefits in terms of macroeconomic stability outweigh the problems associated with higher intermediation costs (see box III.1). Nonetheless, there is still a great deal of uncertainty about the outcome, and more definitive results are expected in the next few months.
2. The European banking crisis and Latin America and the Caribbean: possible vectors of contagion
Banks that operate internationally extend loans in external markets through two very different channels: directly, from the bank’s headquarters to a borrower abroad, and indirectly, via one of its subsidiaries or associates in a foreign country. In Latin America, foreign banks tend to use the second option more often, and the volume of this type of lending is quite large, given the major role played by these institutions in local banking systems (see figure III.22). The effects may be very different depending on what strategies these institutions adopt in relation to their subsidiaries abroad. If banks manage their foreign operations on a centralized basis from their headquarters, any capital or liquidity squeeze in their home market could have the effect of making their foreign subsidiaries cut back on lending activity in the local market in order to shore up the business group’s asset position or to transfer liquidity to the main office. On the other hand, while some decisions may be centralized, local subsidiaries may use a business model of their own, and their lending activity may therefore vary independently of the problems troubling their parent company or headquarters. This last option is the one that has been chosen by many of the subsidiaries of foreign banking institutions in Latin America, notably in the case of Spain’s Banco Santander and BBVA.
Lending by foreign banks in Latin America has risen sharply in the 2000s (see figure III.36). The only breaks in this trend have been seen in the wake of the bursting dot.com bubble and the Argentine crisis of 2001, the subprime crisis of 2008 and the deterioration in Europe’s position in the third quarter of 2011. And in fact, subsidiaries of foreign banks have cut back on credit more swiftly and more deeply than local private banks (IMF, 2010b). The recovery during the first two crises was robust, however.
In absolute terms, the Brazilian, Mexican and Chilean markets have been the major attractions for foreign banks (see figure III.36). In the third quarter of 2011, these three countries accounted for nearly 80% of all existing foreign-bank loans in the region. When measured in terms of GDP, this type of credit has been especially significant in Chile and somewhat less so in Mexico. These two countries have the heaviest exposure to European banks after Estonia,
Romania, Bulgaria, Lithuania, Albania and Mozambique (World Bank, 2012b). By contrast, thanks to the strength and size of the major local banks, Brazil’s exposure is much lower (see figure III.37).
Figure III.36 LATIN AMERICA AND THE CARIBBEAN: FOREIGN BANK
LENDING, BY COUNTRY OF DESTINATION, 2000-2011 (Millions of dollars)
0
200
400
600
800
1 000
1 200
1 400
Q12000
Q22001
Q32002
Q42003
Q12005
Q22006
Q32007
Q42008
Q12010
Q22011
Argentina Brazil Chile Colombia MexicoPeru Uruguay Venezuela (Bol. Rep. of) Other
Source: Economic Commission for Latin America and the Caribbean (ECLAC), on the basis of information from the Bank for International Settlements.
Figure III.37 LATIN AMERICA AND THE CARIBBEAN (SELECTED COUNTRIES):
FOREIGN BANK LENDING, 2000-2010 (Percentages of GDP)
0
10
20
30
40
50
60
70
Argentina Brazil Chile Colombia Mexico Peru Uruguay Venezuela(Bol. Rep.of)
Latin America
2000 2005 2008 2010Source: Economic Commission for Latin America and the Caribbean (ECLAC), on
the basis of information from the Bank for International Settlements.

131Foreign Direct Investment in Latin America and the Caribbean • 2011
Between 2000 and 2005, the percentage of local-currency loans extended to residents via local subsidiaries jumped from 36% to nearly 60% of total loans, and this percentage has held steady up to the present day (see figure III.38). Given the strong deposit base that these subsidiaries have had ever since the start-up of their operations in Latin America (thanks to their strategy of buying up large local institutions), most foreign banks do not have to rely to any great extent on other types of financing. In fact, the loans granted by subsidiaries of foreign banks are primarily funded with local deposits, and this gives them a great deal of autonomy vis-à-vis their parent companies. This strong base in local markets may also explain why the percentage of credit extended by foreign banks in Latin America is so low (with most of the lending that does take place being accounted for by interbank operations) and is much less than it is in other developing regions (IMF, 2009a). Finally, almost half of all transborder foreign-currency credits have a term of less than one year, although the percentage of longer-term loans is on the rise. While these types of credits are still just a fraction of the total credits granted by foreign banks, the fact that they are increasing may be a reflection of the lower risk rating that is being assigned to the region.
Figure III.38 LATIN AMERICA AND THE CARIBBEAN: FOREIGN BANK LOANS,
BY BORROWING SECTOR AND FUND SOURCE, 2000-2011 (Millions of dollars)
0
200
400
600
800
1 000
1 200
1 400
Local-currency loans to residents Transborder bank creditsTransborder public-sector credits Transborder credits to
the non-financial private sector
Q12000
Q22001
Q32002
Q42003
Q12005
Q22006
Q32007
Q42008
Q12010
Q22011
Source: Economic Commission for Latin America and the Caribbean (ECLAC), on the basis of information from the Bank for International Settlements.
A few of the world’s largest banking institutions dominate the foreign banking industry’s operations in Latin America (see tables III.2 and III.6, and figure III.22). As mentioned earlier, five institutions (Banco Santander, BBVA, HSBC, Citigroup and Scotiabank) hold 80% of the assets of foreign banks in the region (see table III.6).
In addition, Canadian, Spanish, United States and British banks account for nearly 75% of the credit granted by foreign lending institutions (see figure III.39).
Figure III.39 LATIN AMERICA AND THE CARIBBEAN: FOREIGN BANK LOANS,
BY LENDER’S HOME COUNTRY, 2000-2011 (Millions of dollars)
50
54
58
62
66
70
74
78
0
200
400
600
800
1 000
1 200
1 400
Spain United Kingdom Netherlands FranceGermany Italy Other European countries United StatesCanada Japan Brazil Rest of world
Percentage of European banks
Q12000
Q22001
Q32002
Q42003
Q12005
Q22006
Q32007
Q42008
Q12010
Q22011
Source: Economic Commission for Latin America and the Caribbean (ECLAC), on the basis of information from the Bank for International Settlements.
Thanks to the growth, structure and behaviour of foreign banks, together with their credit strategy in Latin America, the credit squeeze triggered by the international financial crisis was less severe than it would otherwise have been. In fact, although they have not been immune to that contraction or to the deterioration of liquidity in interbank markets, these institutions have exhibited resilience and stability, and these traits have made it less likely that they might act as vectors for the transmission of external shocks. Some of the main reasons for this are as follows:
• Most of the credits granted by foreign banks are in the local currency and are channelled through their local subsidiaries.
• A large part of foreign banks’ financing comes from local sources, with the largest one being a stable deposit base. This situation has been leveraged by macroeconomic stability and growth, combined with the institutional strength displayed by Latin America.
• The subsidiaries of foreign banks do not rely heavily on their parent companies for foreign-currency finance or on international interbank markets for clearing their credit operations. In addition, although there are differences across countries, foreign-currency bank financing is less significant for the region as a whole, which makes the region less vulnerable to fluctuations in the international financial sector.
• There has been a relative increase in long-term loans, which reduces the region’s exposure to any
Economic Commission for Latin America and the Caribbean (ECLAC)132
sharp reversal in short-term bank financing.• The transborder operations of the banks with the
greatest exposure in Latin America, particularly in the case of the Spanish ones, are highly decentralized, with their subsidiaries being managed quite independently of their parent companies.
• The institutions with the greatest presence in Latin America have two traits that have made them more resilient in the face of recent financial disturbances. On the one hand, Spanish and Canadian banks’ operations in the region are highly specialized and are coupled with their operations in mature markets, such as the United States and the United Kingdom. On the other hand, the more globalized banks, such as Citigroup and HSBC, have a highly diversified international presence which helps them to weather regional crises more easily. In addition, none of the banks operating in Latin America maintains a presence in the emerging markets that have been hardest-hit by the current financial crisis, such as those of Eastern Europe (IFI, 2012a). Lastly, the Spanish banks Santander and BBVA have been able to meet the requirements set forth by the Government of Spain thanks to the sound performance of their foreign operations, particularly in Latin America.
The strength shown by foreign banks in Latin America has also been underscored by the swift recovery of their lending activity after the failure of Lehman Brothers in 2008. These procyclical outcomes are largely attributable to the region’s (and Brazil’s, in particular) robust economic performance (see figure III.36). The deterioration in Europe’s situation has set off alarm bells, however, given the possibility that the subsidiaries of European banks might act as a vector of contagion. And in fact, the strong pressures associated with sovereign borrowing could trigger deep losses and, owing to the constraints affecting recapitalization efforts, could force banks to deleverage in order to boost their capital ratios (IMF, 2011b). Given this prospect, concerns about the possible effects of asset sales or liquidity transfers have been on the rise (IMF, 2010a).
In Latin America, however, it was thought that if European banks were suddenly to retreat, the adverse impact would be mitigated by the presence of well-capitalized local banks and, to a lesser degree, by the arrival of institutions from other countries that would rapidly take up where the Europeans had left off (IFI, 2012b). And this appears to be what is actually happening in the region, especially in Brazil (World Bank, 2012b). In late 2011, in line with this scenario, the Chilean CorpBanca acquired the assets of Banco Santander in Colombia for US$ 1.225 billion. On the other hand, tight bank regulation has helped to avert large capital transfers to foreign banks’ headquarters. In
Brazil and Mexico, for example, regulations are in place that limit the size of the loans that can be made between a parent company and its local subsidiary and that restrict parent companies’ ability to draw down the capital reserves of local subsidiaries below prudential levels. In Chile, banks established in the country, whether Chilean- or foreign-owned, are treated as Chilean, have their own capital and are subject to the oversight of the banking regulator. Accordingly, the capital backing their loans and deposits is Chilean and the only means by which capital could be repatriated would be through the sale of the shares that carry the right to administer the business and receive its profits. Yet, even in that case, the whole structure of deposits, capital and loans would remain unaltered in Chile under new ownership.
This is especially significant for Latin America, given the extremely important role played by Spanish institutions in the region’s banking markets. These institutions’ solvency indicators have, however, been good (strong capitalization and high levels of loan-loss provisions) thanks to the fact that Spanish regulators take the phase of the business cycle into consideration and view it as a crucial factor in determining the proper level of provisions. This was borne out by the stress test carried out by the European Banking Authority in mid-2011 under an adverse scenario, in which both BBVA and Banco Santander achieved good solvency indicators, without government help, that were very close to the new European requirement of a 9% tier-1 capital ratio (BBVA had a ratio of 9.2% and Banco Santander one of 8.4%) (see box III.3). Nonetheless, since they are ranked as systemically important financial institutions, and given their estimated capital requirements as of December 2011, both banks had to increase their levels of own resources (EBA, 2011b). These Spanish banks have used varying means of complying with the demands of the European authorities:
• In late 2011, six months before the deadline, Banco Santander had reached a 9% tier-1 capital ratio (Santander, 2012). The 15.302 billion euros that it needed to be ranked as a systemically important financial institution were cut to less than half that sum by counting the convertible bonds that were to be swapped in October 2012. It also exchanged preferential stock for new shares and decided to pay part of its dividend in shares as well. It also carried out some divestitures in Chile and Colombia and moved forward the sale of 4.41% of its Brazilian subsidiary (El País, 2012a).
• BBVA needed 6.329 billion euros for the same purpose. It shored up its capital ratio by exchanging preferred stock for mandatory convertible subordinate bonds, thus saving itself from having to sell off

133Foreign Direct Investment in Latin America and the Caribbean • 2011
any strategic assets (BBVA, 2012). The European Banking Authority actually does not consider preferred stock as tier-1 capital, whereas it does place bonds that are convertible into shares in that category. In December 2011, this operation brought the tier-1 capital ratio for BBVA up to 8.7%; the ratio would then rise somewhat more thanks to accounting adjustments on its operations in the United States (BBVA, 2012). BBVA also took advantage of the cheap loans available under the long-term refinancing programme of the European Central Bank, taking out 11 billion euros in credits in December 2011 and a similar amount in February 2012 (The Wall Street Journal Americas, 2012a). In late May 2012, BBVA announced that it was considering selling its pension funds in Chile, Colombia, Mexico and Peru, with combined assets of US$ 69 billion and a client base of 11 million.
BBVA stated that this decision was unrelated to the turbulence in the Spanish banking system and was, instead, a response to the interest shown by various agents in the pension fund market (El País, 25 May 2012). In any case, the decision could take some time and would not be made before 2013. According to analysts, the value of BBVA pension fund activities in the region could be as much as US$ 5 billion (El Mercurio, 25 May 2012).
Thus, at least in the short run, the major foreign players in Latin American banking markets will comfortably meet the Basel III capital requirements, thereby consolidating their solvency, and the new minimum leverage ratios will not pose a problem (Terrier and others, 2011). What is more, thanks to the degree of independence that these banks’ subsidiaries enjoy, the higher cost of credit to be borne by the parent companies because of the new, stricter requirements are not likely to be transmitted to operations in Latin America.
E. Conclusions
The financial industry has changed a great deal in recent decades in response to stronger competition, deregulation, the technological revolution and demands for higher profits. All of this has induced major financial institutions in advanced countries to adopt ambitious growth and diversification strategies. These changes have also been spurred by the rapid and deep deregulation of the industry, which was itself prompted in large part by a long period of low interest rates and ample liquidity. The swift consolidation of the financial sector at the national and international levels has been evident both in specific segments and across the entire industry, as enormous financial conglomerates have taken shape that offer commercial and investment banking services, insurance, pension fund schemes and other services. This approach, which has usually been justified on the grounds of efficiency and economies of scale, has led to heightened concern about the stability of the global financial system, however.
Banks intensified their traditional leveraging strategy, but on the basis of a dangerously procyclical management model, in response to expected risk levels. As the proportion of assets that were financed with debt rose, the banks became more profitable, but their operations also became much more risky. In addition, the growing integration of financial systems and the proliferation of
new types of instruments, which facilitated transactions and risk diversification, turned banks into extremely complex institutions that are difficult for regulators and governments to control.
When the upswing in the business cycle came to an end, this trend was reversed, and the resulting chain reaction was difficult to control, despite all the efforts of national, regional and multilateral authorities to contain the contagion. The financial crisis that was triggered by the subprime mortgage crisis and the collapse of Lehman Brothers in the United States has now been exacerbated by Europe’s sovereign debt troubles, and the outlook shows no convincing signs of brightening. As a result, many stakeholders in the industry are in a precarious position. Reforms are being adopted in an attempt to bolster the industry’s solvency and liquidity that will surely have major implications for the performance of the main banking institutions, especially in terms of increasing difficulties in offering readily available, low-cost financing. And all of this will no doubt have repercussions on the world economy’s growth and stability.
The higher intermediation costs generated by the new regulations and standards will increase the cost of borrowing and reduce the returns on saving. This is particularly daunting for economic agents for which
Economic Commission for Latin America and the Caribbean (ECLAC)134
the banking sector is the only source of financing and the only repository for surpluses. This means that small and medium-sized enterprises (SMEs) and middle- and lower-income households will be the hardest-hit. Geographical asymmetries could be equally stark. The impact of reduced banking activity will be the greatest in countries and regions of the world, such as continental Europe and Latin America, in which funds channelled through the banking system play a greater role in total financing for the economy. Under these circumstances, governments and their institutions, particularly public and development banks, will no doubt have a more active role to play in generating and allocating the financing needed for development. In normal times, public banks should promote credit activity, facilitate access to information and make up for marketing failings but should not enter into open competition with private banks. In difficult times, development banks are called upon to play an important countercyclical role and to help to deal with information asymmetries.
These changes could also have an effect on transborder activities, which, in some cases, could cause some institutions operating internationally in certain markets to pull back or redeploy. This could especially be the case for Latin America, where international banks play a key role in local financial systems. One encouraging factor in this respect is the great resilience shown by the Latin American banking system during the recent international crisis and, above all, the strength displayed by foreign banks’ subsidiaries, which, despite being sensitive to liquidity problems in international interbank markets, did not reduce their credit activity to any significant degree in markets within the region. This outcome is attributable to the great degree of autonomy enjoyed by the subsidiaries of the main foreign banks and to the fact that most of their loans are denominated in the local currency and financed locally, primarily from deposits.
In the past decade, the Latin American and Caribbean countries’ financial system has grown rapidly and performed well. It is still far behind the financial systems of the advanced economies, however, and it continues to display considerable limitations, both in terms of the banking system and in relation to its stock, bond and insurance markets.
However, although the international financial crisis did have a strong impact on the region’s financial systems, these negative effects were soon overcome and, in just over a year, the region’s stock and banking markets had regained their pre-2007 levels of activity. This performance was made possible by the measures taken following the crises of the 1990s and early 2000s to put the countries’ banking systems on a sturdier footing, the opening of the market (particularly with respect
to the entry of foreign enterprises), the incorporation of prudential measures into national regulations, the alignment of solvency requirements with international standards and the prolonged time span during which the region has had a strong macroeconomic showing.
Be this as it may, banking markets in Latin America and the Caribbean are less developed than would be expected, given their levels of per capita income. The reforms that have been introduced have yielded good results in terms of the stability of the system, but they have not been so successful in extending banking services to a large group of businesses and individuals. In the past decade, the system’s assets have increased significantly in all of the countries, although the various indicators (credits and deposits over GDP, offices and ATMs over total population, etc.) still lag considerably behind those of advanced countries. Latin American financial systems also lag behind in offering sophisticated financial services and products, such as derivatives and other structured instruments —although, in view of the experiences of developed countries, their cautious approach to adopting financial innovations could be regarded as a strength rather than as a weakness.
In theory, financial innovations should make it possible for markets to operate more efficiently (by, for example, lowering transaction costs) and should make them more complete by paving the way for better risk distribution. While it is true that financial innovations have helped to drive the growth of international markets in recent decades, many questions have been raised since the recent international crisis as to the role that such innovations played in bringing about and propagating that crisis. In that sense, especially for a region such as Latin America and the Caribbean, where the banking industry has shown itself to be very resilient and has made major advances in terms of capitalization and liquidity, the wisest course of action seems to be to continue taking a prudent approach to the use of these types of products. It is important for the region to continue to build an effective institutional structure for risk management, regulation and supervision in line with best international practices (Basel III).
Foreign banks’ entry into Latin America and the Caribbean has galvanized the regional financial market, spurring competition within that market and pushing the sector to narrow its spreads and lower its costs. They have also helped to modernize the banking sector by improving in-house procedures, refining risk-rating systems and expanding the range of products and services on offer. Finally, although this effect has been less marked than the other two just mentioned, they have also contributed to efforts to reach new and growing segments of Latin American society, especially the emerging middle classes. They continue, however, to exhibit a strong preference
135Foreign Direct Investment in Latin America and the Caribbean • 2011
for higher-income (and, generally, lowest-risk) sectors of the population.
While it has made progress, over the past decade the banking industry in Latin America and the Caribbean has had a relatively less diversified business structure. While loans and deposits account for a very large percentage of business volume, especially in local institutions, which signals some reticence to introduce additional products and services. But loan institutions in the region are better capitalized and have higher levels of liquid investments than such institutions do in advanced economies, and this is especially true in the case of foreign banks.
The region’s banking industry, which has very probably been buttressed by its macroeconomic stability, has sharply reduced its lending and deposit interest rates, and its operating costs have also decreased, especially in the case of foreign banks. Furthermore, the latter have steadily been making efficiency gains, whereas their local counterparts have been making steady progress in boosting their profit ratios. In both cases, substantial reductions in default indices have also been seen.
More recently, as the industry has continued to mature, the driving force which foreign banks have injected into the market appears to be beginning to wane, to judge from the stagnation of efficiency and productivity indicators for the banking industry as a whole and the foreign banks’ progressive loss of market share. The crises that broke out in Argentina and Mexico in the early 2000s, the external shocks of 2001 and 2007, and the increasing
strength and power of private local banks, especially in Brazil, have all contributed to this relative decline in the role of foreign banks.
The local banking system has responded flexibly and rapidly to the international financial crisis by significantly raising its levels of efficiency and productivity and regaining part of the market share that it had lost with the arrival of foreign banking institutions. The powerful position of Brazilian, as well as Chilean and Colombian, banks has allowed them to maintain slightly wider spreads and this, together with their efficiency gains, has enabled local banks to surpass foreign institutions in terms of own-funds profitability, most notably since 2007. A more in-depth analysis would be worthwhile, however, especially one that focused on the impact of different national regulatory systems on efficiency and productivity. In some cases, public banks also maintain a major presence, and further study in this respect would also be warranted.
The countries of Latin America and the Caribbean generally are at a midway point in terms of their development and have a limited financial culture, with SMEs accounting for a large part of their production activity. Under these circumstances, the approach being taken by the region’s governments, which focuses on helping to strengthen their banking systems by introducing regulatory systems that will ensure that they are in a more solid position, in combination with a public banking system that provides financing for more underprivileged segments of society, can be expected to lead to increased economic growth in the medium term.

Economic Commission for Latin America and the Caribbean (ECLAC)136
Bibliography
ABE (Autoridad Bancaria Europea) (2011a), 2011 EU-Wide Stress Test Aggregate Report, Londres, 15 de julio [en línea] http://stress-test.eba.europa.eu/pdf/EBA_ST_2011_Summary_Report_v6.pdf.
(2011b), 2011 EU Capital Exercise, Londres, 8 de diciembre [en línea] http://www.eba.europa.eu/ capitalexercise/2011/2011-EU-Capital-Exercise.aspx.
Aguirre, Onidia (2011), “El proceso de globalización y la actual crisis financiera capitalista”, Documento de trabajo, Nº 67, Buenos Aires, Centro de Estudios Internacionales para el Desarrollo (CEID), noviembre [en línea] http://www.ceid.edu.ar/serie/2011/CEID_DT_67_ONIDIA_AGUILAR_ B E N I T E Z _ E L _ P R O C E S O _ D E _GLOBALIZACION_Y_LA_ACTUAL_CRISIS_FINANCIERA_CAPITALISTA.pdf.
Akerlof, George (1970), “The market for lemons: quality uncertainty and the market mechanism”, The Quarterly Journal of Economics, vol. 84, Nº 3, mayo [en línea] http://www.jstor.org/stable/ 1879431.
América economía (2011), “La banca latinoamericana en 2011”, Santiago de Chile, octubre.
Avalos, Marcos y Fausto Hernández Trillo (2006), “Competencia bancaria en México”, serie Estudios y perspectivas, Nº 62 (LC/L.2630-P), México, D.F., sede Subregional de la CEPAL en México, noviembre. Publicación de las Naciones Unidas, Nº de venta: S.06.II.G.155 [en línea] http://www.eclac.cl/publicaciones/xml/5/27295/L722.pdf.
Banca D’Italia (2009), “An assessment of financial sector rescue programmes”, Questioni di economia e finanza (Occasional Papers), Nº 47, Roma, julio [en línea] http://www.bancaditalia.it/ pubblicazioni/econo/quest_ecofin_2/qf_47/QEF_47.pdf.
Banco Central de Chile (2011), Presentación de los informes de política monetaria y de estabilidad financiera ante la Comisión de Hacienda del Honorable Senado de la República, Santiago de Chile, 20 de junio [en línea] http://www.bcentral.cl/politicas/presentaciones/consejeros/pdf/ 2011/jdg20062011.pdf.
Banco Mundial (2012a), Financial Development in Latin America and the Caribbean: The Road Ahead, Washington, D.C. [en línea] http://siteresources.worldbank.org/EXTLACOFFICEOFCE/Resources/ 870892-1307980018254/FDLAC_Consolidated_Webv1.pdf.
(2012b), Global Economic Prospects: Uncertainties and Vulnerabilities, Washington, D.C., enero [en línea] http://siteresources.worldbank.org/INTPROSPECTS/rces/334934-1322593305595/8287139-1326374900917/GEP_January_2012a_FullReport_FINAL.pdf.
(2008), Global Development Finance: The Role of International Banking, Washington, D.C., mayo [en línea] http://siteresources.worldbank.org/INTGDF2008/Resources/gdf_complete_web-appended-6-12.pdf.
Barajas, Adolfo, Roberto Steiner y Natalia Salazar (1999), “Foreign investment in Colombia’s financial sector”, IMF Working Paper, Nº 150, Washington, D.C., Fondo Monetario Internacional [en línea] http://www.imf.org/external/pubs/ft/wp/1999/wp99150.pdf.
BBVA (Banco Bilbao Vizcaya Argentaria) (2012), Resultados 2011, Madrid, febrero [en línea] http://accionistaseinversores.bbva.com/TLBB/fbinir/mult/4T11_informe_esp_tcm784-277698.pdf.
BBVA Research (2011), Situación banca: México, México, D.F., Servicio de Estudios Económicos del Grupo BBVA, noviembre [en línea] http://serviciodeestudios.bbva.com/KETD/fbin/mult/1111_ SituacionBancaMexico_Nov11_tcm346-278210.pdf?ts=832012.
BCE (Banco Central Europeo) (2011), Recent Development in Securitization, Basilea, febrero [en línea] http://www.ecb.int/pub/pdf/other/recentdevelopmentinsecuritisation201102en.pdf.
(2010), EU Banking Structures, Frankfurt, septiembre [en línea] http://www.ecb.int/pub/ pdf/other/eubankingstructures201009en.pdf.
Beck, Thorsten y María Soledad Martínez Peria (2010), “Foreign bank participation and outreach: evidence from Mexico”, Journal of Financial Intermediation, vol. 19, Nº 1, enero [en línea] http://siteresources.worldbank.org/DEC/Resources/Foreign_bank_participation_and_outreach-Mexico.pdf.
Bellescá, Mónica (2007), “La banca extranjera en América Latina: resultado de su desempeño”, Espiral, vol. 14, Nº 40, Universidad de Guadalajara, septiembre-diciembre [en línea] http://redalyc. uaemex.mx/pdf/138/13804005.pdf.
BPI (Banco de Pagos Internacionales) (2011), Basel III: A Global Regulatory Framework for More Resilient Banks and Banking Systems, Basilea, Comité de Basilea de Supervisión Bancaria, junio [en línea] http://www.bis.org/publ/bcbs189.pdf.

137Foreign Direct Investment in Latin America and the Caribbean • 2011
(2010a), “Long-term issues in international banking”, CGFS Papers, Nº 41, Basilea, Comité del Sistema Financiero Mundial, julio [en línea] http://www.bis.org/publ/cgfs41.pdf.
(2010b), An Assessment of the Long-Term Economic Impact of Stronger Capital and Liquidity Requirements, Basilea, Comité de Basilea de Supervisión Bancaria, agosto [en línea] http://www.bis.org/publ/ bcbs173.pdf.
(2010c), Assessing the Macroeconomic Impact of the Transition to Stronger Capital and Liquidity Requirements, Basilea, agosto [en línea] http://www.bis.org/publ/othp10.pdf.
(2009a), Guide to the International Financial Statistics, Basilea, julio [en línea] http://www.bis.org/statistics/intfinstatsguide.pdf.
(2009b), 79th Annual Report (1 April 2008 – 31 March), Basilea, 29 de junio [en línea] http://www.bis.org/publ/arpdf/ar2009e.pdf.
(2007), “Evolución de los sistemas bancarios en América Latina y el Caribe: Retos e implicaciones para la política monetaria y la estabilidad financiera”, BIS Papers, Nº 33, Basilea, Departamento Monetario y Económico, febrero [en línea] http://www.bis.org/publ/bppdf/bispap33_es.pdf.
CAF (Corporación Andina de Fomento) (2011), Servicios financieros para el desarrollo: Promoviendo el acceso en América Latina, Bogotá, abril [en línea] http://publicaciones.caf.com/media/10609/ red2011.pdf.
Calderón, Álvaro (2005), “Spanish banks in Latin America: do they need each other?”, Latin America’s Quest for Globalization: The Role of Spanish Firms, Félix Martín y Pablo Toral (eds.), Londres, Ashgate Publishing.
Calderón, Álvaro y Ramón Casilda (2000), “La estrategia de los bancos españoles en América Latina”, Revista de la CEPAL, Nº 70 (LC/G.2095-P), Santiago de Chile, Comisión Económica para América Latina y el Caribe (CEPAL), abril [en línea] http://www.eclac.org/publicaciones/xml/0/ 19250/calderon.pdf.
Calderón, Álvaro y José Luis Machinea (2008), “América Latina: ¿una plataforma para la globalización de las mayores empresas españolas?”, La gran apuesta: Globalización y multinacionales españolas en América Latina. Análisis de los protagonistas, Ramón Casilda (ed.), Barcelona, Granica, abril.
Canales-Kriljenko, Jorge, Brahima Coulibaly y Hernan Kamil (2010), “Una historia de dos regiones”, Finanzas y desarrollo, Washington, D.C., Fondo Monetario Internacional, marzo [en línea] http://www.imf.org/external/pubs/ft/fandd/spa/2010/03/pdf/canales.pdf.
Carvallo, Oscar y Adnan Kasman (2005), “Cost efficiency in the Latin American and Caribbean banking systems”, Journal of International Financial Markets, Institutions and Money, vol. 15, Nº 1, enero.
Casilda, Ramón (2011), La internacionalización en América Latina como paso para la expansión global: Caso BBVA, Madrid, PriceWaterHouseCoopers [en línea] http://kc3.pwc.es/local/es/kc3/ publicaciones.nsf/V1/B13C0978087A62B2C125799D005EA5B7/$FILE/Informe%20Internacionalizacion%20America%20Latina_BBVA_final.pdf.
CEPAL (Comisión Económica para América Latina y el Caribe) (2011), Balance preliminar de las economías de América Latina y el Caribe (LC/G.2512-P), Santiago de Chile, diciembre. Publicación de las Naciones Unidas, Nº de venta: S.12.II.G.2.
(2008), La inversión extranjera en América Latina y el Caribe 2007 (LC/G.2360-P), Santiago de Chile. Publicación de las Naciones Unidas, Nº de venta: S.08.II.G.11 [en línea] http://www.cepal.org/publicaciones/xml/0/32930/lcg2360e_f2.pdf.
(2003), La inversión extranjera en América Latina y el Caribe 2002 (LC/G.2198-P), Santiago de Chile. Publicación de las Naciones Unidas, Nº de venta: S.03.II.G.11 [en línea] http://www.eclac.org/publicaciones/xml/8/12148/InverEx2002.pdf.
(2002), Globalización y desarrollo (LC/G.2157(SES.29/3)), Santiago de Chile, abril [en línea] http://www.eclac.org/cgi-bin/getProd.asp?xml=/publicaciones/xml/6/10026/P10026.xml&xsl=/ tpl/p9f.xsl&base=/tpl/top-bottom.xsl.
Chortareas, Georgios, Jesús Garza-Garcia y Claudia Girardone (2011), “Banking sector performance in Latin America: market power versus efficiency”, Review of Development Economics, vol. 15, Nº 2, mayo.
Cihák, Martin y Richard Podpiera (2006), “Is one w better than three? International experience with integrated financial sector supervision”, IMF Working Paper, Nº WP/06/57, Washington, D.C., mayo [en línea] http://www.imf.org/external/pubs/ft/wp/2006/wp0657.pdf.
Cinco días (2011), “BBVA cierra la compra del 24,9% del banco turco Garanti por 4.200 millones”, Madrid, 22 de marzo [en línea] http://www.cincodias.com/articulo/mercados/bbva-cierra-compra-249-banco-turco-garanti-4200-millones/20110322cdscdsmer_19/.
Claessens, Stijn y Luc Laeven (2004), “What drives bank competition? Some international evidence”, Journal of Money, Credit and Banking, vol. 36, Nº 3, Ohio, Ohio State University Press, junio.
Claessens, Stijin, Asli Demirgüc-Kunt y Harry Huizinga (1998), “How does foreign entry affect domestic banking markets?”, Policy Research

Economic Commission for Latin America and the Caribbean (ECLAC)138
Working Paper, Nº 1918, Washington, D.C., junio [en línea] http://www-wds.worldbank.org/servlet/WDSContentServer/WDSP/IB/2000/02/24/ 000009265_3980625102840/Rendered/PDF/multi_page.pdf.
Claessens, Stijn y otros (2008), Foreign Bank Presence in Developing Countries 1995-2006: Data and Trends, marzo.
Clarke, George y otros (2003), “Foreign bank entry: experience, implications for developing countries and agenda for further research”, The World Bank Research Observer, vol. 18, Nº 1, Washington, D.C., Banco Mundial, marzo [en línea] http://wbro.oxfordjournals.org/content/18/1/25. full.pdf+html.
Comisión Europea (2011a), Commission Staff Working Paper. Autumn 2011 Update (SEC(2011)1487), Bruselas, 1 de diciembre [en línea] http://ec.europa.eu/competition/state_aid/studies_reports/ 2011_autumn_working_paper_en.pdf.
(2011b), “The effects of temporary state aid rules adopted in the context of the financial and economic crisis”, Commission Staff Working Paper, SEC(2011) 1126 final, Bruselas, octubre [en línea] http://ec.europa.eu/competition/publications/reports/working_paper_en.pdf.
CRS (Congressional Research Service) (2009), The Global Financial Crisis: Analysis and Policy Implications, Washington, D.C., octubre [en línea] http://www.fas.org/sgp/crs/misc/RL34742.pdf.
Crystal, Jennifer, Gerard Dages y Linda Goldberg (2002), “Has foreign bank entry led to sounder banks in Latin America?”, Current Issues in Economics and Finance, vol. 8, Nº 1, Nueva York, Banco de la Reserva Federal de Nueva York, enero [en línea] http://www.newyorkfed.org/research/ current_issues/ci8-1.pdf.
D’Arista, Jane (2009), “Financial concentration”, Wall Street Watch Working Paper, Nº 3, Washington, D.C., Consumer Education Foundation, agosto [en línea] http://www.wallstreetwatch.org/ working_papers/Financial_Concentration.pdf.].
Dages, Gerard, Linda Goldberg y Daniel Kinney (2000), “Foreign and domestic bank participation in emerging markets: lessons from Mexico and Argentina”, Economic Policy Review, vol.6, N º 3, Nueva York, Banco de la Reserva Federal de Nueva York, septiembre [en línea] http://www.newyorkfed.org/research/epr/00v06n3/0009dage.pdf.
Davies, Michael y Tim Ng (2011), “The rise of sovereign credit risk: implications for financial stability”, BIS Quarterly Review, Basilea, Banco de Pagos Internacionales, septiembre [en línea] http://www.bis.org/publ/qtrpdf/r_qt1109g.pdf.
De la Torre, Augusto, María Soledad Martínez Pería y Sergio Schmukler (2010), “Bank involvement with SMEs: beyond relationship lending, Journal of Banking and Finance, vol. 34, Nº 9, septiembre [en línea] http://siteresources.worldbank.org/DEC/Resources/Bank_Involvement_with_SMEs.pdf.
Demirgüç-Kunt, Asli y Enrica Detragiache (2005), “Cross-country empirical studies of banking distress: a survey”, World Bank Policy Research Working Paper, Nº 3719, Washington, D.C., Banco Mundial, septiembre [en línea] http://www-wds.worldbank.org/servlet/WDSContentServer/ WDSP/IB/2005/09/16/000016406_20050916102735/Rendered/PDF/wps3719.pdf.
Deutsche Bank Research (2011), “Home, sweet home? International banking after the crisis, EU Monitor, Nº 80, Frankfurt, Financial Market Special, 9 de junio [en línea] http://www.dbresearch.com/ P R O D / D B R _ I N T E R N E T _ E N - P R O D /PROD0000000000274061.PDF.
(2010), “Monitoring cross-border exposure”, International Topics, Frankfurt, 26 de noviembre [en línea] http://www.dbresearch.de/PROD/DBR_INTERNET_DE-PROD/PROD0000000000 266643.pdf.
Edwards, Franklin y Federic Mishkin (1995), “The decline of traditional banking: implications for financial stability and regulatory policy”, Economic Policy Review, vol. 1, Nº 2, Nueva York, Banco de la Reserva Federal de Nueva York, julio [en línea] http://www.newyorkfed.org/ research/epr/95v01n2/9507edwa.pdf.
El Mercurio (2012), “BBVA evalúa la venta de Provida y de otras tres AFP en Latinoamérica”, Santiago, 25 de mayo [en línea] http://www.economiaynegocios.cl/noticias.asp?id=96792.
El País (2012a), “Las entidades españolas evitan acudir al mercado para recapitalizarse”, Madrid, 11 de enero [en línea] http://elpais.com/diario/2012/01/11/economia/1326236404_850215.html.
(2012b), “Bufé libre de un billón de euros”, Madrid, 26 de febrero [en l ínea] http: / /economia.elpais.com/economia/2012/02/25/actualidad/1330203150_155071.html.
(2012c), “El BBVA planea desprenderse de varios negocios en Latinoamérica”, Madrid, 25 de mayo [en línea] http://economia.elpais.com/economia/2012/05/24/actualidad/1337843037_ 949508.html.
(2011), “El crédito se cierra para el Este europeo”, Madrid, 18 de diciembre [en línea] http://elpais.com/diario/2011/12/18/negocio/1324216343_ 850215.html.

139Foreign Direct Investment in Latin America and the Caribbean • 2011
Eraso, Unai e Ibai Urra (2011), “Situación actual y tendencias de la industria bancaria mundial: Apalancamiento y rentabilidad”, Bolsa. Revista de bolsas y mercados españoles, Nº 190, cuarto trimestre, Madrid [en línea] http://www.bolsasymercados.es/esp/publicacion/revistaOnLine/ index.htm.
ESMA (Autoridad Europea de Valores y Mercados) (2011), ESMA’s Technical Advice to the European Commission on Possible Implementing Measures of the Alternative Investment Fund Managers Directive, París, 16 de noviembre [en línea] http://www.esma.europa.eu/system/files/2011_379.pdf.
Fama, Eugene (1970), “Efficient capital markets: a review of theory and empirical work”, The Journal of Finance, vol. 25, Nº 2, American Finance Association, mayo [en línea] http://www.jstor.org/stable/2325486.
FBE (Federación Bancaria de la Unión Europea) (2011), EU Banking Sector: The World’s Largest Banking System in the World’s Largest Economic Space. Facts and Figures 2011, Bruselas, diciembre [en línea] http://www.ebf-fbe.eu/uploads/Facts%20&%20Figures%202011.pdf.
Fenton, Rodrigo y Ramón Padilla (2012), “Financiamiento de la banca comercial a micro, pequeñas y medianas empresas en México”, serie Estudios y perspectivas, Nº 135 (LC/MEX/L.1052), México, D.F., sede subregional de la CEPAL en México, febrero.
Financial Times (2012), 15 de marzo.FMI (Fondo Monetario Internacional) (2011a), Global
Financial Stability Report: Grappling with Crisis Legacies, Washington, D.C., septiembre [en línea] http://www.imf.org/external/pubs/ft/gfsr/ 2011/02/pdf/text.pdf.
(2011b), Regional Economic Outlook: Western Hemisphere. Shift ing Winds, New Policy Challenges, Washington, D.C., octubre [en línea] http://www.imf.org/external/pubs/ft/reo/2011/ whd/eng/pdf/wreo1011.pdf.
(2010a), Regional Economic Outlook: Western Hemisphere. Taking Advantage of Tailwinds, Washington, D.C., mayo [en línea] http://www.imf.org/external/pubs/ft/reo/2010/whd/eng/pdf/ wreo0510.pdf.
(2010b), Regional Economic Outlook: Western Hemisphere. Heating Up in the South, Cooler in the North, Washington, D.C., octubre [en línea] http://www.imf.org/external/pubs/ft/reo/2010/ whd/eng/pdf/wreo1010.pdf.
(2009a), Regional Economic Outlook: Western Hemisphere. Stronger Fundamentals Pay Off, Washington, D.C., mayo [en línea] http://www.imf.org/external/pubs/ft/reo/2009/WHD/eng/ wreo0509.pdf.
(2009b), Global Financial Stability Report: Navigating the Financial Challenges Ahead, Washington, D.C., octubre [en línea] http://www.imf.org/external/pubs/ft/gfsr/2009/02/pdf/text.pdf.
(2006), Perspectivas de la economía mundial: Sistemas financieros y ciclos económicos, Washington, D.C., septiembre [en línea] http://www.imf.org/external/pubs/ft/weo/2006/02/esl/ weo0906s.pdf.
Frenkel, Roberto (2003), “Globalización y crisis financieras en América Latina”, Revista de la CEPAL, Nº 80 (LC/G.2204-P), Santiago de Chile, Comisión Económica para América Latina y el Caribe (CEPAL), agosto [en línea] http://www.eclac.cl/publicaciones/xml/2/15562/lcg2204e-Frenkel.pdf.
Galindo, Arturo, Alejandro Izquierdo y Liliana Rojas-Suárez (2010), “Financial integration and foreign banks in Latin America. How do they impact the transmission of external financial shocks?”, IDB Working Paper Series, Nº IDB-WP-116, Washington, D.C., Banco Interamericano de Desarrollo, enero [en línea] http://www.iadb.org/res/publications/pubfiles/pubIDB-WP-116.pdf.
García, Alicia y Maria Soledad Martinez (2007), “The mix of international banks’ foreign claims: determinants and implications”, Basilea, Banco de Pagos Internacionales/Banco Mundial, junio [en línea] http://www.bis.org/repofficepubl/apresearch0701ag1.pdf.
Gelos, Gastón (2009), “Banking spreads in Latin America”, Economic Inquiry, vol. 47, Nº 4, octubre.
Gorton, Gary (2008), “The panic of 2007”, NBER Working Paper, Nº 14358, Cambridge, Massachusetts, National Bureau of Economic Research (NBER), septiembre [en línea] http://www.nber.org/papers/w14358.pdf.
Green, Christopher, Victor Murinde e Ivaylo Nikolov (2004), “The efficiency of foreign and domestic banks in Central and Eastern Europe: evidence on economies of scale and scope”, Journal of Emerging Markets Finance, vol. 3, Nº 2, agosto.
Grupo de los Veinte (G-20) (2009), Progress Report on the Economic and Financial Actions of the London, Washington and Pittsburgh G-20 Summits, St. Andrews, 7 de noviembre [en línea] http://www.g20.utoronto.ca/2009/2009progressreport1107.pdf.
(2008), Declaration Summit on Financial Markets and the World Economy, Washington, D.C., 15 de noviembre, [en línea] http://g20mexico.org/images/stories/docs/eng/washington.pdf.
Gual, Jordi (2009), “El carácter procíclico del sistema financiero”, Estabilidad financiera, Nº 16, Madrid, Banco de España, mayo [en línea] http://www.bde.es/webbde/es/secciones/informes/be/estfin/ numero16/ief0216.pdf.

Economic Commission for Latin America and the Caribbean (ECLAC)140
Haber, Stephen y Aldo Musacchio (2005), “Foreign Banks and the Mexican Economy, 1997–2004”, agosto, inédito [en línea] http://www.innovation.hoover.org/media/File/HaberandMusacchio-ForeignBanks_andtheMexicanEconomy,1997-2004.pdf.
HSBC (2012), Annual Report and Accounts 2011, Londres, febrero [en línea] http://www.hsbc.com/1/PA_esf-ca-app-content/content/assets/investor_relations/hsbc2011ara0.pdf.
(2011), La historia del HSBC: de Hong Kong a España, Madrid [en línea] http://www.hsbc.es/1/PA_1_1_S5/content/spain/corporate/about_us/popup/flipbook/esp/pdf/history.pdf.
ICB (Independent Commission on Banking) (2011), Final Report: Recommendations, Londres, septiembre [en línea] http://bankingcommission.s3.amazonaws.com/wp-content/uploads/2010/ 07/ICB-Final-Report.pdf.
IFI (Instituto de Finanzas Internacionales) (2012a), Emerging Markets Bank Lending Conditions Survey, Washington, D.C., 24 de enero [en línea] http://www.iif.com/emr/resources+1671.php.
(2012b), Capital Flows to Emerging Market Economies, Washington, D.C., 24 de enero [en línea] http://www.iif.com/emr/resources+1670.php.
Jensen, Michael y William Meckling (1976), “Theory of the firm: managerial behavior, agency costs and ownership structure”, Journal of Financial Economics, vol. 3, Nº 4, octubre [en línea] http://www.sfu.ca/~wainwrig/Econ400/jensen-meckling.pdf.
Jeon Bang Nam, María Pía Olivero y Ji Wu (2010), “Do foreign banks increase competition? Evidence from emerging Asian and Latin American banking markets”, Journal of Banking & Finance, Nº 35, noviembre [en línea] http://faculty.lebow.drexel.edu/OliveroM/research/JBF%202010% 20Do%20Foreign%20Banks%20Increase%20Competition%20Jeon%20Olivero%20Wu.pdf.
Junta de Gobernadores de la Reserva Federal (2009a), The Supervisory Capital Assessment Program: Design and Implementation, Washington, D.C., 24 de abril [en línea] http://www.federalreserve.gov/bankinforeg/bcreg20090424a1.pdf.
(2009b), The Supervisory Capital Assessment Program: Overview of Results, Washington, D.C., 7 de mayo [en línea] http://www.federalreserve.gov/newsevents/press/bcreg/bcreg20090507 a1.pdf.a mi.
Kharas, Homi (2010), “The emerging middle class in developing countries”, OECD Development Centre Working Paper, Nº 285, París, Centro de Desarrollo de la OCDE, enero [en línea] http://www.oecd.org/dataoecd/12/52/44457738.pdf.
Levine, Ross (2004), “Finance and growth: theory and evidence”, NBER Working Paper, Nº 10766, Cambridge, Massachusetts, National Bureau of Economic Research, septiembre [en línea] http://www.nber.org/papers/w10766.pdf].
(1997), “Financial development and economic growth: views and agenda”, Journal of Economic Literature, vol. 35, Nº 2, American Economic Association, junio [en línea] http://www.cedeplar. ufmg.br/economia/disciplinas/ecn933a/crocco/Teorias_neoclassicas_financiamento_desenvolvimento/LEVINE,%20R.%20Financial%20development%20and%20economic%20growth%20views%20and%20agenda.pdf].
(1996), “Foreign banks, financial development and economic growth”, International Financial Markets, Claude Barfield, Washington, D.C., enero [en línea] http://www.econ.brown.edu/ fac/Ross_Levine/finance/rlevine/Publication/1996_Book_Barfield_ForeignBank%20%26%20Growth.pdf.
Levy, Eduardo y Alejandro Micco (2007), “Concentration and foreign penetration in Latin American banking sectors: impact on competition and risk”, Journal of Banking and Finance, vol. 31, Nº 6, junio [en línea] http://www.econ.uchile.cl/uploads/publicacion/174e35df2b3976801f1f6e 904587e5bfa09bfcad.pdf.
Manuelito, Sandra y Luis Felipe Jiménez (2010), “Los mercados financieros en América Latina y el financiamiento de la inversión: Hechos estilizados y propuestas para una estrategia de desarrollo”, serie Macroeconomía del desarrollo, Nº 107 (LC/L.3270-P), Santiago de Chile, Comisión Económica para América Latina y el Caribe (CEPAL). Publicación de las Naciones Unidas, Nº de venta: S.10.II.G.76 [en línea] http://www.eclac.org/publicaciones/xml/8/ 41788/SERIE_107-ManuelitoyJimenez2.pdf.
Maroto, Juan Antonio y Mónica Melle (2001), “Sistemas financieros y economía real: Modelos de relación y gobierno de las empresas”, Ekonomiaz: Revista vasca de economía, Nº 48, [en línea] http://www1.euskadi.net/ekonomiaz/taula1_c.apl?IDPUBL=43.
Marshall, Enrique (2011), Desarrollo financiero en América Latina: Avances y desafíos, Santiago de Chile, Banco Central de Chile, noviembre [en línea] http://www.bcentral.cl/politicas/ presentaciones/consejeros/pdf/2011/emr22112011.pdf.
Martínez, María Soledad y Sergio Schmukler (1999), “Do depositors punish banks for
“bad” behavior? Examining market discipline in Argentina, Chile, and Mexico”, Documentos de trabajo, Nº 48, Santiago de Chile, Banco Central de Chile, noviembre [en línea] http://www.bcentral.cl/ eng/studies/working-papers/pdf/dtbc48.pdf.

141Foreign Direct Investment in Latin America and the Caribbean • 2011
Medina Ávila, Luis (2008), “El encadenamiento financiero-especulativo”, Revista OIKOS, año 12, Nº 25, Santiago de Chile, julio.
Micco, Alejandro, Ugo Panizza y Mónica Yañez (2004), “Bank ownership and performance”, Working Paper, Nº 518, Washington, D.C., Departamento de Investigación, Banco Interamericano de Desarrollo (BID), noviembre [en línea] http://www.iadb.org/res/publications/pubfiles/pubWP-518.pdf.
Minda, Alexandre (2007), “The entry of foreign banks into Latin America: a source of stability or financial fragility?”, Problemas del desarrollo. Revista latinoamericana de economía, vol. 38, Nº 150, México, D.F., Universidad Nacional Autónoma de México [en línea] http://www.revistas.unam.mx/index.php/pde/article/view/7681.
Moguillansky, Graciela, Rogerio Studart y Sebastián Vergara (2004), “Comportamiento paradójico de la banca extranjera en América Latina”, Revista de la CEPAL, Nº 82 (LC/G.2220-P), Santiago de Chile, Comisión Económica para América Latina y el Caribe (CEPAL), abril [en línea] http://www.eclac.cl/publicaciones/xml/5/19405/lcg2220e-Moguillansky.pdf.
Morgan Stanley (2007), Deriving Liquidity, Londres, 4 de junio.
Mundo ejecutivo (2011), 1000 empresas más importantes de México, México, D.F., noviembre.
Olivero, María Pía, Yuan Li y Bang Nam Jeon (2011), “Consolidation in banking and the lending channel of monetary transmission: evidence from Asia and Latin America”, Journal of International Money and Finance, vol. 30, Nº 6, octubre.
Pérez-Caldentey, Esteban (2009), El sistema financiero en América Latina y el Caribe pre y post crisis, Santiago de Chile, Comisión Económica para América Latina y el Caribe (CEPAL), inédito.
Pozzolo, Alberto Franco (2008), “Bank cross-border merger and acquisitions (causes, consequences and recent trends)”, Economic & Statistics Discussion Papers, Nº 08/48, Campobasso, Università degli Studi del Molise, octubre [en línea] http://road.unimol.it/bitstream/2192/120/1/ESDP08048.pdf.
Rothschild, Michael y Joseph Stiglitz (1976), “Equilibrium in competitive insurance markets: an essay on the economics of imperfect information”, The Quarterly Journal of Economics, vol. 90, Nº 4, noviembre [en línea] http://www.jstor.org/stable/1885326.
Santander (2012), Informe anual 2011, Madrid, febrero [en línea] http://www.santander.com/ csgs/StaticBS?ssbinary=true&blobtable=MungoBlobs&blobkey=id&SSURIsscontext=Satellite+Server&blobcol=urldata&SSURIcontainer=Default&SSURIse
ssion=false&blobwhere=1278681372282&blobheader=application%2Fpdf&SSURIapptype=BlobServer.
(2011), Informe anual 2010, Madrid, marzo [ e n l í n e a ] h t t p : / / w w w. s a n t a n d e r. c o m / csgs/StaticBS?ssbinary=true&blobtable=MungoBlobs&blobkey=id&SSURIsscontext=Satellite+Server&blobcol=urldata&SSURIcontainer=Default&SSURIsession=false&blobwhere=1278680671012&blobheader=application%2Fpdf&SSURIapptype=BlobServer#satellitefragment.
Schumpeter, Joseph (1912), The Theory of Economic Development, Leipzig, Duncker and Humblot.
Segura, Julio (2010), ¿Qué ha fallado del análisis económico en la crisis financiera actual?, ponencia presentada en el Pleno de los Martes, Real Academia de Ciencias Morales y Políticas, Madrid, 2 de febrero [en línea] http://www.racmyp.es/docs2/ponencias/2010-02-02%20Julio%20Segura% 20Sanchez.pdf.
Solorza, Marcia (2009), “El sistema bancario brasileño y su participación en el financiamiento al desarrollo”, Economía informa, Nº 356, México, D.F., enero-febrero [en línea] http://www.economia.unam.mx/publicaciones/econinforma/pdfs/356/03Solorza.pdf.
Stallings, Barbara y Rogerio Studart (2001), “Financial regulation and supervision in emerging markets: the experience of Latin America since the tequila crisis”, serie Macroeconomía del desarrollo, Nº 9 (LC/L.1670-P), Santiago de Chile, Comisión Económica para América Latina y el Caribe (CEPAL), diciembre. Publicación de las Naciones Unidas, Nº de venta: E.01.II.G.205 [en línea] http://www.eclac.cl/publicaciones/xml/4/9084/lcl1670i.pdf.
Stigler, George (1971), “The theory of economic regulation”, Bell Journal of Economics and Management Science, vol. 2, Nº 1 [en línea] http://www.rasmusen.org/zg604/readings/Stigler.1971.pdf.
Suárez Dávila, Francisco (2010), La reprivatización bancaria fracasada: Tragedia nacional en 3 actos, México, D.F., Centro de Estudios Espinosa Yglesias, marzo.
Terrier, Gilbert y otros (2011), “Policy Instruments to lean against the wind in Latin America”, IMF Working Paper, Nº 11/159, Washington, D.C., Fondo Monetario Internacional, julio [en línea] http://www.imf.org/external/pubs/ft/wp/2011/wp11159.pdf.
The Banker (2011), “Top 1000 World Banks”, Londres, julio.
(2002), “Top 1000 World Banks”, Londres, julio.The Economist (2011), “American banks: contagion?
What contagion?, Londres, 3 de diciembre [en línea] http://www.economist.com/node/21541020.

Economic Commission for Latin America and the Caribbean (ECLAC)142
(2010), “They might be giants. Special report on banking in emerging markets”, Londres, 15 de mayo.
The Wall Street Journal Americas (2012a), “El Banco Central Europeo inyecta otra gigantesca dosis de liquidez”, 1 de marzo.
(2012b), “El acuerdo griego no desencadenará los pagos de CDS”, 2 de marzo.
(2011a), “HSBC, detalles de su reestructuración”, 12 de mayo.
(2011b), “HSBC retrocede en el plan de ser el ‘banco local del mundo’”, 27 de mayo.
Titelman, Daniel, Esteban Pérez-Caldentey y Ramón Pineda (2009), “¿Cómo algo tan pequeño terminó siendo algo tan grande? Crisis financiera, mecanismos de contagio y efectos en América Latina”, Revista de la CEPAL, Nº 98 (LC/G.2404-P), Santiago de Chile, Comisión Económica para América Latina y el Caribe (CEPAL), agosto [en línea] http://www.cepal.cl/publicaciones/xml/ 5/36805/RVE98Titelmanotros.pdf.
Vause, Nicholas y Goetz von Peter (2011), “Global growth and sovereign debt concerns drive markets”,
BIS Quarterly Review, Basilea, Banco de Pagos Internacionales, septiembre [en línea] http://www.bis.org/publ/qtrpdf/r_qt1109a.pdf.
Woodford, Michael (2010), “Financial intermediation and macroeconomic analysis”, Journal of Economic Perspectives, vol. 24, Nº 4 [en línea] http://pubs.aeaweb.org/doi/pdf/10.1257/jep.24.4.21.
Wu, Ji, Bang Nam Jeon y Alina Luca (2010), “Foreign bank penetration, resource allocation and economic growth: evidence from emerging economies”, Journal of Economic Integration, vol. 25, Nº 1, febrero.
Yildirim, Semih y George Philippatos (2007), “Restructuring, consolidation and competition in Latin American banking markets”, Journal of Banking and Finance, vol. 31, Nº 3, marzo.
Zahler, Roberto (2008), “Bancarización privada en Chile”, serie Financiamiento del desarrollo, Nº 200 (LC/L.2896-P), Santiago de Chile, Comisión Económica para América Latina y el Caribe (CEPAL), mayo. Publicación de las Naciones Unidas, Nº de venta: S.08.II.G.32 [en línea] http://www.gtz-cepal.cl/files/bancarizacion_privada_en_chile.pdf.

143Foreign Direct Investment in Latin America and the Caribbean • 2011
Chapter IV
Foreign direct investment in electric energy in Latin America and the Caribbean
A. Introduction
The electricity sector is of strategic importance in all modern economies, because the ability
to supply electric energy reliably and at reasonable cost is crucial to any productive activity
and a basic element in family well-being. Its economic, social and environmental importance
can be divided into five parts:
(i) The sector itself contributes between 1% and 2% of global GDP, and is present in all countries without exception.1 As it is highly capital intensive, its share of investment is even larger.
(ii) Given the scale of the investments required, the electricity sector has major spillovers in other sectors, ranging from construction and associated industries to high-tech component manufacture. As a result, energy policy can have a significant influence on a country’s industrial development.
1 Total worldwide energy expenditure is estimated at 8% of GDP, of which electricity represents 17% (the remainder corresponds mainly to the combustion of hydrocarbons and biomass (IEA, 2011a). The Datamonitor consultancy estimates in 2008 the global electricity sector had total sales of $1.7 billion (see “‘Electricity: Global Industry Guide [online] http://www.bizjournals.com/prnewswire/press_ releases/2012/01/25/SP41578).
(iii) The availability, quality and cost of electricity has a direct impact on the economy’s systemic competitiveness. Although the price of electricity mainly affects energy-intensive sectors, a continuous and uninterrupted supply of electricity is fundamental for nearly all sectors, and particularly for small firms that are unable to invest in their own generating systems.
(iv) From the social standpoint, access to electricity is considered a basic service, and extending coverage to excluded population sectors is a key element of poverty-reduction and territorial-integration strategies.
(v) Thermal-based electric power generation is a highly polluting activity (in particular CO2 emissions), so there is a special responsibility to move towards more environmentally sustainable production methods.

Economic Commission for Latin America and the Caribbean (ECLAC)144
The strategic importance of the sector and its natural monopoly characteristics (particularly in the transmission and distribution segments) has meant that it has traditionally been dominated by State-owned enterprises, generally national or local monopolies. Following the 1990s reforms in most Latin American countries, the sector was opened up to competition, particularly in the generating segment, and also to foreign direct investment (FDI). Today it is shared between State-owned firms, which in some countries continue to have a monopoly over the activity; large transnational enterprises from Europe, the United States or other countries of the region; and, to a lesser extent, domestically owned private enterprises.
The electricity sector has been one of the largest FDI recipients in the region over the last few years, and in nearly all countries its configuration has been determined by the degree of openness and facilities given (or not given) to transnationals. As in other regulated sectors (telecommunications, water and sanitation, transport), the regulatory framework is the main determinant of private investment —including FDI— in the transmission and distribution segments; whereas in the generating segment, the key factors are risk sharing mechanisms and price setting. In addition, there are expectations of growth in
electricity consumption in each market, normally linked to GDP growth, but also affected by the economy’s sector composition, and the international situation, which influences the global strategies pursued by transnational corporations.
This chapter analyses investment flows in the sector, the strategies of transnational enterprises and the degree to which economic conditions, the different regulatory frameworks and the global economic context determine investments in this sector. Section B presents an overview of the sector, focusing particularly on the business dynamic. Section C analyses the electricity market in the region’s countries and the influence that the sector reforms implemented in the 1990s have had on its current configuration. The following section provides an overview of the transnational enterprises in the sector, their investment strategies in the region and the effect of the European and global situations. Section E analyses electric power generation from renewable sources, and particularly the exponential growth of wind power in Brazil, Mexico and other countries of the region. The final section sets forth a number of conclusions and analyses the policies implemented by the countries of the region to develop the sector in accordance with the multiple objectives mentioned above.
B. Global overview of the electricity sector
The electricity sector is highly capital-intensive, has natural monopoly characteristics (particularly in the transmission and distribution segments) and is poorly internationalized —although there are increasing international connections in the transmission network, the exportation and importation of electricity remains very marginal in most countries and is only important in very specific cases. It is also a strategic sector with a large weight in the economy, whose correct functioning is crucial for all other sectors and the population’s well-being. For all of these reasons, the sector is highly regulated in all countries, and in many cases controlled directly by the State.
World electricity demand (and production) grew by an average of 3.4% per year from 1973 to 2009, when, in the wake of the economic crisis, demand dropped by
0.7% —the first fall since records began. In 2010, demand rebounded vigorously by 6%, and growth is expected to continue in 2011. The International Energy Agency (IEA) is forecasting demand growth of 2.4% per year between 2009 and 2035.
The behaviour of demand has differed between developed and emerging economies. In countries of the Organization for Economic Cooperation and Development (OECD) electricity consumption fell by 3.8% in 2009, while growing by 3.2% in the rest of the world. In 2010, OECD countries increased their production by 3.6%, without regaining the 2008 level, while growth in developing countries continued. To meet the demand growth (and replace obsolete assets) estimated annual investments of US$ 675 billion will be needed, 60% of which will take place in emerging economies (see table IV.1).
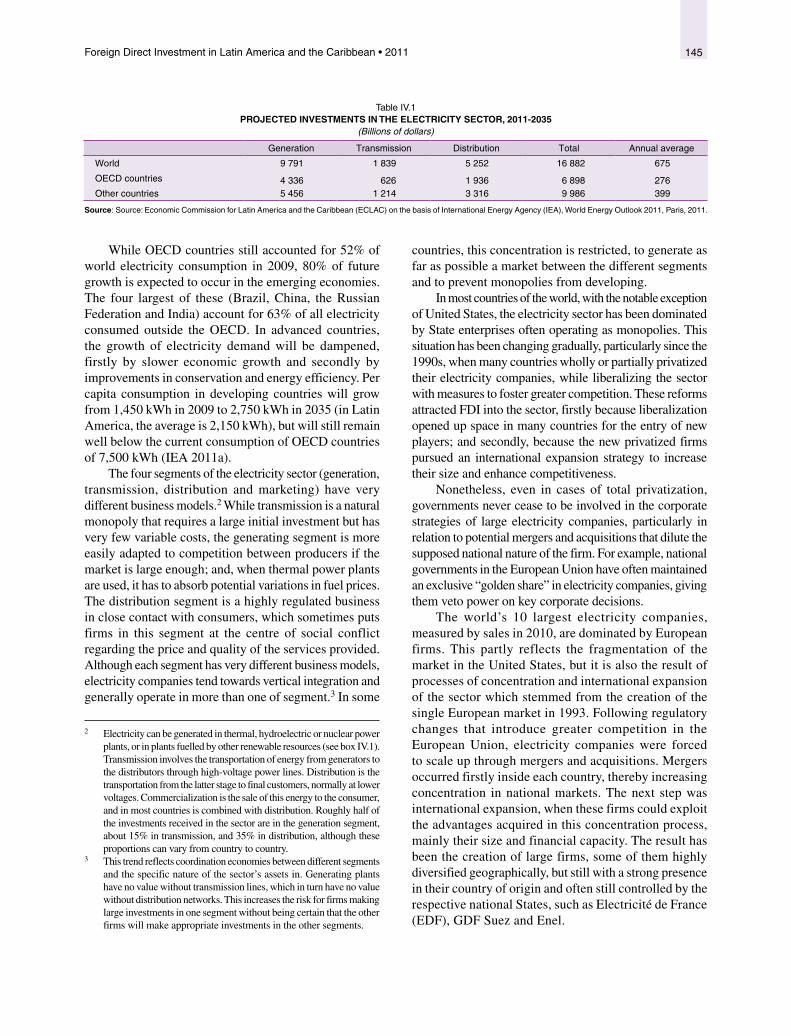
145Foreign Direct Investment in Latin America and the Caribbean • 2011
Table IV.1 PROJECTED INVESTMENTS IN THE ELECTRICITY SECTOR, 2011-2035
(Billions of dollars)
Generation Transmission Distribution Total Annual average
World 9 791 1 839 5 252 16 882 675
OECD countries 4 336 626 1 936 6 898 276 Other countries 5 456 1 214 3 316 9 986 399
Source: Source: Economic Commission for Latin America and the Caribbean (ECLAC) on the basis of International Energy Agency (IEA), World Energy Outlook 2011, Paris, 2011.
While OECD countries still accounted for 52% of world electricity consumption in 2009, 80% of future growth is expected to occur in the emerging economies. The four largest of these (Brazil, China, the Russian Federation and India) account for 63% of all electricity consumed outside the OECD. In advanced countries, the growth of electricity demand will be dampened, firstly by slower economic growth and secondly by improvements in conservation and energy efficiency. Per capita consumption in developing countries will grow from 1,450 kWh in 2009 to 2,750 kWh in 2035 (in Latin America, the average is 2,150 kWh), but will still remain well below the current consumption of OECD countries of 7,500 kWh (IEA 2011a).
The four segments of the electricity sector (generation, transmission, distribution and marketing) have very different business models.2 While transmission is a natural monopoly that requires a large initial investment but has very few variable costs, the generating segment is more easily adapted to competition between producers if the market is large enough; and, when thermal power plants are used, it has to absorb potential variations in fuel prices. The distribution segment is a highly regulated business in close contact with consumers, which sometimes puts firms in this segment at the centre of social conflict regarding the price and quality of the services provided. Although each segment has very different business models, electricity companies tend towards vertical integration and generally operate in more than one of segment.3 In some
2 Electricity can be generated in thermal, hydroelectric or nuclear power plants, or in plants fuelled by other renewable resources (see box IV.1). Transmission involves the transportation of energy from generators to the distributors through high-voltage power lines. Distribution is the transportation from the latter stage to final customers, normally at lower voltages. Commercialization is the sale of this energy to the consumer, and in most countries is combined with distribution. Roughly half of the investments received in the sector are in the generation segment, about 15% in transmission, and 35% in distribution, although these proportions can vary from country to country.
3 This trend reflects coordination economies between different segments and the specific nature of the sector’s assets in. Generating plants have no value without transmission lines, which in turn have no value without distribution networks. This increases the risk for firms making large investments in one segment without being certain that the other firms will make appropriate investments in the other segments.
countries, this concentration is restricted, to generate as far as possible a market between the different segments and to prevent monopolies from developing.
In most countries of the world, with the notable exception of United States, the electricity sector has been dominated by State enterprises often operating as monopolies. This situation has been changing gradually, particularly since the 1990s, when many countries wholly or partially privatized their electricity companies, while liberalizing the sector with measures to foster greater competition. These reforms attracted FDI into the sector, firstly because liberalization opened up space in many countries for the entry of new players; and secondly, because the new privatized firms pursued an international expansion strategy to increase their size and enhance competitiveness.
Nonetheless, even in cases of total privatization, governments never cease to be involved in the corporate strategies of large electricity companies, particularly in relation to potential mergers and acquisitions that dilute the supposed national nature of the firm. For example, national governments in the European Union have often maintained an exclusive “golden share” in electricity companies, giving them veto power on key corporate decisions.
The world’s 10 largest electricity companies, measured by sales in 2010, are dominated by European firms. This partly reflects the fragmentation of the market in the United States, but it is also the result of processes of concentration and international expansion of the sector which stemmed from the creation of the single European market in 1993. Following regulatory changes that introduce greater competition in the European Union, electricity companies were forced to scale up through mergers and acquisitions. Mergers occurred firstly inside each country, thereby increasing concentration in national markets. The next step was international expansion, when these firms could exploit the advantages acquired in this concentration process, mainly their size and financial capacity. The result has been the creation of large firms, some of them highly diversified geographically, but still with a strong presence in their country of origin and often still controlled by the respective national States, such as Electricité de France (EDF), GDF Suez and Enel.

Economic Commission for Latin America and the Caribbean (ECLAC)146
Table IV.2 THE WORLD’S LEADING ELECTRICITY COMPANIES BY SALES, 2010
(Billions of dollars)
Firm Country Sales a
1 State Grid China 226
2 E.ON Germany 125
3 GDF Suez France 112
4 Enel Italy 97
5 EDF France 86
6 RWE Germany 67
7 Tokyo Electric Power Japan 63
8 China Southern Power Grid China 54
9 Scottish and Southern Energy United Kingdom 44
10 Iberdrola Spain 40
Source: Fortune Global 500.a The figures shown correspond to the total sales of the group are not exclusively to sales in the electricity business. In the case of GDF-Suez, electricity represents just 50% of
group sales.
From the technology standpoint, electricity companies usually purchase the technology they use rather than create it internally. A study of the world’s 2,000 most innovative firms ranked electricity 39th out of 46 sectors, with research and development (R&D) expenditure accounting for 0.67% of the budget, close to the figures of sectors such as forestry products or the drinks industry (ECLAC, 2010a). Although electricity generation and distribution are technologically complex and continuously developing processes, progress is the result of research by engineering firms and equipment manufacturers, which sell their products and build infrastructures for electricity companies. The latter restrict their R&D to the maintenance of the equipment they possess, improving processes, and marketing energy.
Another key characteristic of electricity firms is their relative specialization. Despite being large firms that are usually present in all segments of electricity sector, very few of them diversify into other branches of infrastructure or services. In fact, a number of experiments in this regard, undertaken by firms such as Endesa and Iberdrola of Spain in the 1990s, were subsequently reversed, when the firms in question refocused on the electricity sector.
The most common possibilities for business diversification are engineering and construction, and the extraction and distribution of hydrocarbons. The Colombian firm Interconexión Eléctrica S.A. (ISA), Spain’s Iberdrola and the French enterprise GDF are among the few electricity companies with dedicated engineering and construction branches; but even in these cases, vertical integration with the rest of the group is limited. This underscores the general strategy of electricity firms not developing their own technology. The combination of the electricity business with hydrocarbons is more an
exception than the rule, despite clear connections between the two sectors, and the fact that, less than a decade ago, there were business trends towards convergence between the two sectors in southern cone countries (ECLAC, 2005). The most significant case currently in Latin America involves the Brazilian State-owned oil company Petrobras, which has 15 generating plants with over 5GW capacity, which it supplies directly with natural gas (of which is the country’s sole provider). Another important example is the merger between Gas Natural and Unión Fenosa (Spanish companies with numerous branches in the region) with the aim of exploiting synergies in the distribution and marketing of gas and electricity (see point 1 in section D).
There are several firms in the non-conventional renewable energies segment which are simultaneously electric power generators, equipment manufacturers, and technology developers. This segment (see the definition in box IV.1) still represents just 3% of the world total (IEA, 2011a), but over the last 20 years it has grown faster than the rest of the industry (see figure IV.1). In 2010, the last year for which global data have been compiled, investments in renewable energies worldwide increased by 32% to US$ 211 billion.4 Growth in that year was concentrated particularly in wind power in China and small-scale (rooftop) solar power in Europe.
Over the last 20 years, there has been an FDI trend in the sector, which is the only growth path for many firms, since the exportation of electricity is a very limited alternative, and in most cases large electricity firms have reached the maximum size in their countries of origin permitted by the regulators. This is also true of most firms in the services sector.
4 Including biofuels (Bloomberg, 2011).
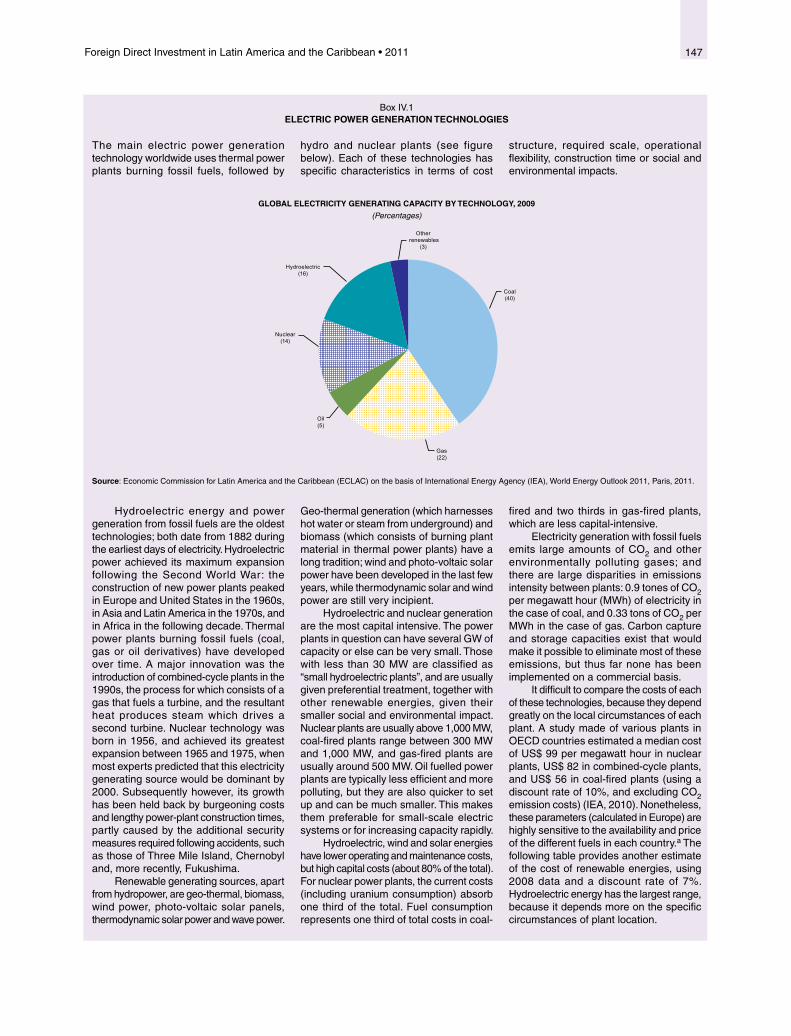
147Foreign Direct Investment in Latin America and the Caribbean • 2011
Box IV.1 ELECTRIC POWER GENERATION TECHNOLOGIES
The main electric power generation technology worldwide uses thermal power plants burning fossil fuels, followed by
hydro and nuclear plants (see figure below). Each of these technologies has specific characteristics in terms of cost
structure, required scale, operational flexibility, construction time or social and environmental impacts.
GLOBAL ELECTRICITY GENERATING CAPACITY BY TECHNOLOGY, 2009
(Percentages)
Coal(40)
Gas(22)
Oil(5)
Nuclear(14)
Hydroelectric(16)
Other renewables
(3)
Source: Economic Commission for Latin America and the Caribbean (ECLAC) on the basis of International Energy Agency (IEA), World Energy Outlook 2011, Paris, 2011.
Hydroelectric energy and power generation from fossil fuels are the oldest technologies; both date from 1882 during the earliest days of electricity. Hydroelectric power achieved its maximum expansion following the Second World War: the construction of new power plants peaked in Europe and United States in the 1960s, in Asia and Latin America in the 1970s, and in Africa in the following decade. Thermal power plants burning fossil fuels (coal, gas or oil derivatives) have developed over time. A major innovation was the introduction of combined-cycle plants in the 1990s, the process for which consists of a gas that fuels a turbine, and the resultant heat produces steam which drives a second turbine. Nuclear technology was born in 1956, and achieved its greatest expansion between 1965 and 1975, when most experts predicted that this electricity generating source would be dominant by 2000. Subsequently however, its growth has been held back by burgeoning costs and lengthy power-plant construction times, partly caused by the additional security measures required following accidents, such as those of Three Mile Island, Chernobyl and, more recently, Fukushima.
Renewable generating sources, apart from hydropower, are geo-thermal, biomass, wind power, photo-voltaic solar panels, thermodynamic solar power and wave power.
Geo-thermal generation (which harnesses hot water or steam from underground) and biomass (which consists of burning plant material in thermal power plants) have a long tradition; wind and photo-voltaic solar power have been developed in the last few years, while thermodynamic solar and wind power are still very incipient.
Hydroelectric and nuclear generation are the most capital intensive. The power plants in question can have several GW of capacity or else can be very small. Those with less than 30 MW are classified as “small hydroelectric plants”, and are usually given preferential treatment, together with other renewable energies, given their smaller social and environmental impact. Nuclear plants are usually above 1,000 MW, coal-fired plants range between 300 MW and 1,000 MW, and gas-fired plants are usually around 500 MW. Oil fuelled power plants are typically less efficient and more polluting, but they are also quicker to set up and can be much smaller. This makes them preferable for small-scale electric systems or for increasing capacity rapidly.
Hydroelectric, wind and solar energies have lower operating and maintenance costs, but high capital costs (about 80% of the total). For nuclear power plants, the current costs (including uranium consumption) absorb one third of the total. Fuel consumption represents one third of total costs in coal-
fired and two thirds in gas-fired plants, which are less capital-intensive.
Electricity generation with fossil fuels emits large amounts of CO2 and other environmentally polluting gases; and there are large disparities in emissions intensity between plants: 0.9 tones of CO2 per megawatt hour (MWh) of electricity in the case of coal, and 0.33 tons of CO2 per MWh in the case of gas. Carbon capture and storage capacities exist that would make it possible to eliminate most of these emissions, but thus far none has been implemented on a commercial basis.
It difficult to compare the costs of each of these technologies, because they depend greatly on the local circumstances of each plant. A study made of various plants in OECD countries estimated a median cost of US$ 99 per megawatt hour in nuclear plants, US$ 82 in combined-cycle plants, and US$ 56 in coal-fired plants (using a discount rate of 10%, and excluding CO2 emission costs) (IEA, 2010). Nonetheless, these parameters (calculated in Europe) are highly sensitive to the availability and price of the different fuels in each country.a The following table provides another estimate of the cost of renewable energies, using 2008 data and a discount rate of 7%. Hydroelectric energy has the largest range, because it depends more on the specific circumstances of plant location.
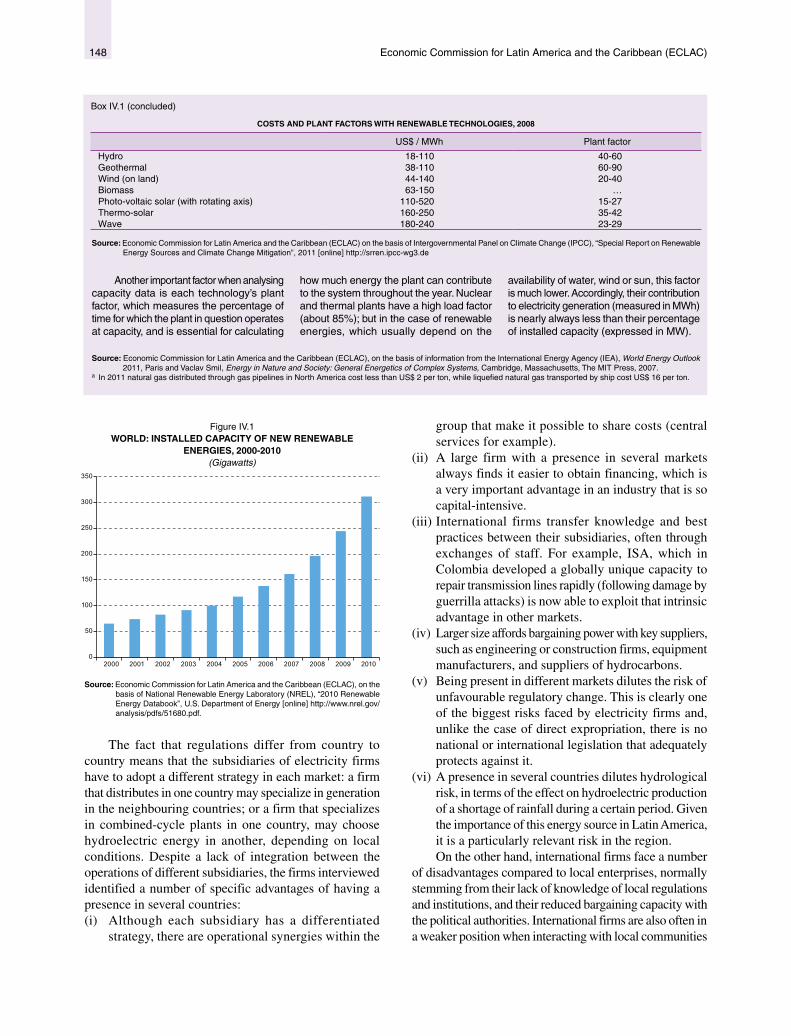
Economic Commission for Latin America and the Caribbean (ECLAC)148
COSTS AND PLANT FACTORS WITH RENEWABLE TECHNOLOGIES, 2008
US$ / MWh Plant factor
Hydro 18-110 40-60Geothermal 38-110 60-90Wind (on land) 44-140 20-40Biomass 63-150 …Photo-voltaic solar (with rotating axis) 110-520 15-27Thermo-solar 160-250 35-42Wave 180-240 23-29
Source: Economic Commission for Latin America and the Caribbean (ECLAC) on the basis of Intergovernmental Panel on Climate Change (IPCC), “Special Report on Renewable Energy Sources and Climate Change Mitigation”, 2011 [online] http://srren.ipcc-wg3.de
Another important factor when analysing capacity data is each technology’s plant factor, which measures the percentage of time for which the plant in question operates at capacity, and is essential for calculating
how much energy the plant can contribute to the system throughout the year. Nuclear and thermal plants have a high load factor (about 85%); but in the case of renewable energies, which usually depend on the
availability of water, wind or sun, this factor is much lower. Accordingly, their contribution to electricity generation (measured in MWh) is nearly always less than their percentage of installed capacity (expressed in MW).
Source: Economic Commission for Latin America and the Caribbean (ECLAC), on the basis of information from the International Energy Agency (IEA), World Energy Outlook 2011, Paris and Vaclav Smil, Energy in Nature and Society: General Energetics of Complex Systems, Cambridge, Massachusetts, The MIT Press, 2007.
a In 2011 natural gas distributed through gas pipelines in North America cost less than US$ 2 per ton, while liquefied natural gas transported by ship cost US$ 16 per ton.
Figure IV.1 WORLD: INSTALLED CAPACITY OF NEW RENEWABLE
ENERGIES, 2000-2010 (Gigawatts)
0
50
100
150
200
250
300
350
2000 2001 2002 2003 2004 2005 2006 2007 2008 2009 2010
Source: Economic Commission for Latin America and the Caribbean (ECLAC), on the basis of National Renewable Energy Laboratory (NREL), “2010 Renewable Energy Databook”, U.S. Department of Energy [online] http://www.nrel.gov/analysis/pdfs/51680.pdf.
The fact that regulations differ from country to country means that the subsidiaries of electricity firms have to adopt a different strategy in each market: a firm that distributes in one country may specialize in generation in the neighbouring countries; or a firm that specializes in combined-cycle plants in one country, may choose hydroelectric energy in another, depending on local conditions. Despite a lack of integration between the operations of different subsidiaries, the firms interviewed identified a number of specific advantages of having a presence in several countries:(i) Although each subsidiary has a differentiated
strategy, there are operational synergies within the
Box IV.1 (concluded)
group that make it possible to share costs (central services for example).
(ii) A large firm with a presence in several markets always finds it easier to obtain financing, which is a very important advantage in an industry that is so capital-intensive.
(iii) International firms transfer knowledge and best practices between their subsidiaries, often through exchanges of staff. For example, ISA, which in Colombia developed a globally unique capacity to repair transmission lines rapidly (following damage by guerrilla attacks) is now able to exploit that intrinsic advantage in other markets.
(iv) Larger size affords bargaining power with key suppliers, such as engineering or construction firms, equipment manufacturers, and suppliers of hydrocarbons.
(v) Being present in different markets dilutes the risk of unfavourable regulatory change. This is clearly one of the biggest risks faced by electricity firms and, unlike the case of direct expropriation, there is no national or international legislation that adequately protects against it.
(vi) A presence in several countries dilutes hydrological risk, in terms of the effect on hydroelectric production of a shortage of rainfall during a certain period. Given the importance of this energy source in Latin America, it is a particularly relevant risk in the region. On the other hand, international firms face a number
of disadvantages compared to local enterprises, normally stemming from their lack of knowledge of local regulations and institutions, and their reduced bargaining capacity with the political authorities. International firms are also often in a weaker position when interacting with local communities

149Foreign Direct Investment in Latin America and the Caribbean • 2011
for building new infrastructures. For this reason, many firms do not build new assets outside their country of origin, although they do purchase already existing firms.
As is true of most services, there is no global electricity market, but a number of national markets with their own technical and regulatory specifics. The transnational enterprises in the sector tend to have assets in several markets as part of an expansion
and risk-diversification strategy. Globally, the sector remains poorly internationalized and, in many countries, particularly developing ones, it is still totally shielded from international competition. Among emerging economies, however, Latin American countries are the most open to FDI in this industry, which goes a long way towards explaining why firms from mature markets such as Europe are keen to invest in the region.
C. The electricity sector in Latin America
As occurred in Europe, Latin America implemented reforms to the electricity sector in 1990, which created regulatory frameworks that are generally friendly towards private investment. Moreover, in the last few years there has been a sustained in demand, driven by burgeoning economic
growth, along with favourable international context for attracting capital into the region. This minor investment boom in the sector has not affected all economies equally, so there are still countries with supply problems owing to low investment in capacity.
1. The privatization and reform process
As is true of other public utilities, such as telecommunications, gas and water distribution, or transport, the electricity sector in Latin America was traditionally the exclusive preserve of State-owned monopolies (and municipal monopolies in the case of many distributors). This model changed rapidly in the 1990s, when most countries in the region introduced far-reaching changes in the sector, combining privatization of State assets with regulatory reform, the main features of which were as follows (Maldonado and Palma, 2004):(i) separation of the different segments of the production
chain (generation, transmission and distribution);(ii) competition in the generating segment, subject to
centralized dispatch;(iii) regulated transmission and distribution, operated by
private enterprise under concession contracts;(iv) free, non-discriminatory, access to electricity
transmission lines;(v) the obligation for distributors to supply their concession
area, and(vi) a marginal-cost-based pricing system for generation
and transmission.
All of these reforms aimed to introduce principles of competition in the electricity sector, particularly in the generating segment; but while all shared the same principles, they were applied differently. While privatization was complete in Chile, other countries stopped halfway (Brazil and Colombia); others opened the sector to private capital under a single-buyer model (Costa Rica and Mexico); while some, such as Uruguay, maintained the vertically integrated monopoly (Altomonte, 2002).
The first privatization process in the region was undertaken by Chile in the early 1980s, a decade before other countries. This helped the development of privately owned Chilean firms which, as from 1992, took advantage of the reforms in other countries in the region to invest in them. ENERSIS S.A. was particularly active in this regard, acquiring assets in Argentina, Brazil, Colombia and Peru. This regional network made ENERSIS highly attractive to transnational corporations which were looking to expand in the subcontinent in the late 1990s. In 1999, the Spanish firm Endesa made a full takeover of ENERSIS S.A., and in the following year, the United States firm AES purchased Gener, another Chilean firm in the sector (see point 1 of section D).
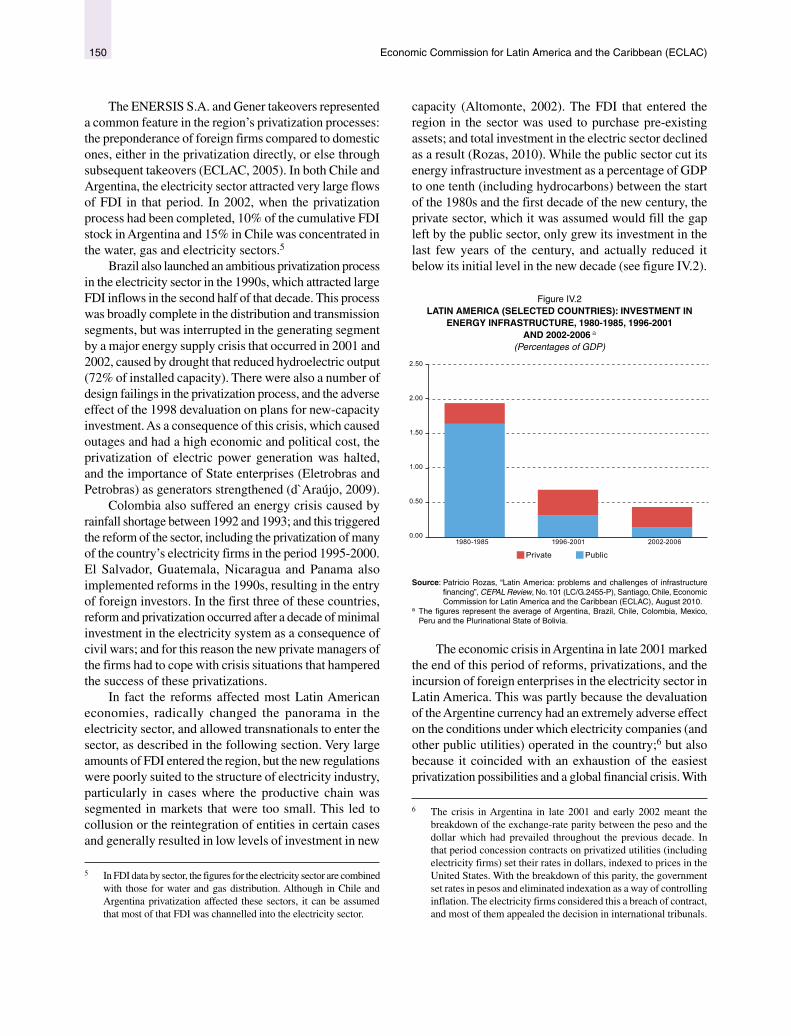
Economic Commission for Latin America and the Caribbean (ECLAC)150
The ENERSIS S.A. and Gener takeovers represented a common feature in the region’s privatization processes: the preponderance of foreign firms compared to domestic ones, either in the privatization directly, or else through subsequent takeovers (ECLAC, 2005). In both Chile and Argentina, the electricity sector attracted very large flows of FDI in that period. In 2002, when the privatization process had been completed, 10% of the cumulative FDI stock in Argentina and 15% in Chile was concentrated in the water, gas and electricity sectors.5
Brazil also launched an ambitious privatization process in the electricity sector in the 1990s, which attracted large FDI inflows in the second half of that decade. This process was broadly complete in the distribution and transmission segments, but was interrupted in the generating segment by a major energy supply crisis that occurred in 2001 and 2002, caused by drought that reduced hydroelectric output (72% of installed capacity). There were also a number of design failings in the privatization process, and the adverse effect of the 1998 devaluation on plans for new-capacity investment. As a consequence of this crisis, which caused outages and had a high economic and political cost, the privatization of electric power generation was halted, and the importance of State enterprises (Eletrobras and Petrobras) as generators strengthened (d`Araújo, 2009).
Colombia also suffered an energy crisis caused by rainfall shortage between 1992 and 1993; and this triggered the reform of the sector, including the privatization of many of the country’s electricity firms in the period 1995-2000. El Salvador, Guatemala, Nicaragua and Panama also implemented reforms in the 1990s, resulting in the entry of foreign investors. In the first three of these countries, reform and privatization occurred after a decade of minimal investment in the electricity system as a consequence of civil wars; and for this reason the new private managers of the firms had to cope with crisis situations that hampered the success of these privatizations.
In fact the reforms affected most Latin American economies, radically changed the panorama in the electricity sector, and allowed transnationals to enter the sector, as described in the following section. Very large amounts of FDI entered the region, but the new regulations were poorly suited to the structure of electricity industry, particularly in cases where the productive chain was segmented in markets that were too small. This led to collusion or the reintegration of entities in certain cases and generally resulted in low levels of investment in new
5 In FDI data by sector, the figures for the electricity sector are combined with those for water and gas distribution. Although in Chile and Argentina privatization affected these sectors, it can be assumed that most of that FDI was channelled into the electricity sector.
capacity (Altomonte, 2002). The FDI that entered the region in the sector was used to purchase pre-existing assets; and total investment in the electric sector declined as a result (Rozas, 2010). While the public sector cut its energy infrastructure investment as a percentage of GDP to one tenth (including hydrocarbons) between the start of the 1980s and the first decade of the new century, the private sector, which it was assumed would fill the gap left by the public sector, only grew its investment in the last few years of the century, and actually reduced it below its initial level in the new decade (see figure IV.2).
Figure IV.2 LATIN AMERICA (SELECTED COUNTRIES): INVESTMENT IN
ENERGY INFRASTRUCTURE, 1980-1985, 1996-2001 AND 2002-2006 a
(Percentages of GDP)
0.00
0.50
1.00
1.50
2.00
2.50
1980-1985 1996-2001 2002-2006
Private Public
Source: Patricio Rozas, “Latin America: problems and challenges of infrastructure financing”, CEPAL Review, No. 101 (LC/G.2455-P), Santiago, Chile, Economic Commission for Latin America and the Caribbean (ECLAC), August 2010.
a The figures represent the average of Argentina, Brazil, Chile, Colombia, Mexico, Peru and the Plurinational State of Bolivia.
The economic crisis in Argentina in late 2001 marked the end of this period of reforms, privatizations, and the incursion of foreign enterprises in the electricity sector in Latin America. This was partly because the devaluation of the Argentine currency had an extremely adverse effect on the conditions under which electricity companies (and other public utilities) operated in the country;6 but also because it coincided with an exhaustion of the easiest privatization possibilities and a global financial crisis. With
6 The crisis in Argentina in late 2001 and early 2002 meant the breakdown of the exchange-rate parity between the peso and the dollar which had prevailed throughout the previous decade. In that period concession contracts on privatized utilities (including electricity firms) set their rates in dollars, indexed to prices in the United States. With the breakdown of this parity, the government set rates in pesos and eliminated indexation as a way of controlling inflation. The electricity firms considered this a breach of contract, and most of them appealed the decision in international tribunals.

151Foreign Direct Investment in Latin America and the Caribbean • 2011
a backdrop of relative disenchantment with the results of privatization, compounded by macroeconomic instability in Argentina and Brazil, and a reduced appetite for risk among European and United States transnationals, the arrival of foreign firms dried up, not to be resumed until 2006, and then at a much lower level (see figure IV.3).
From 2001 onwards, the privatization process stalled almost entirely, and since then the spaces for public and private enterprises have remained defined with few changes, except in the cases of the Bolivarian Republic of Venezuela and the Plurinational State of Bolivia. In both of these countries, the decision to nationalize was not based on reasons exclusively pertaining to the electricity sector, but formed part of a policy to increase the State’s role in strategic sectors of the economy, and was matched by similar processes in other sectors.
Figure IV.3 LATIN AMERICA: TOTAL VALUES OF CROSS-BORDER MERGERS
AND ACQUISITIONS IN THE ELECTRICITY SECTOR, 1992-2011 (Millions of dollars)
-
1 000
2 000
3 000
4 000
5 000
6 000
7 000
8 000
9 000
10 000
1992
1993
1994
1995
1996
1997
1998
1999
2000
2001
2002
2003
2004
2005
2006
2007
2008
2009
2010
2011
Source: Economic Commission for Latin America and the Caribbean (ECLAC) on the basis of data provided by Thomson One.
2. Determinants of private investment in the sector
The outcome of the privatization process in Latin America was an electricity sector that divided between State firms and private enterprise — the latter mostly transnational corporations, as a result of the acquisitions that occurred between 1996 and 2001. Nowadays, the few nationally owned private electricity companies operating in the region are generally subsidiaries of large groups that also operate in other sectors, such as Colbún in Chile (part of the Matte group) and CPFL in Brazil (controlled by Votorantim, Bradesco and Camargo Corrêa). These private firms do not currently have expansion plans outside their country of origin; and the trans-Latin enterprises in the sector (Empresas Públicas de Medellín (EPM), ISA, Eletrobras) are State-owned (see point 2 of section. D).
With the exception of Chile, all countries have State-owned firms in some segment of the electricity sector, often coexisting with private firms (see table IV.3). In addition, in a large group of countries, electricity is in State hands. Apart from the Bolivarian Republic of Venezuela (which re-nationalized the private firms), the public sector tends to dominate in the smaller economies, where monopoly situations are also more likely to exist, owing to the difficulty of introducing competition between participating agents. In Ecuador and Paraguay, State domination is complete, whereas in the case of Uruguay, the public enterprise Administración Nacional de Usinas y Trasmisiones Eléctricas (UTE) controls transmission, distribution and all generation, except that using biomass and wind power. Nonetheless,
some small countries in the region have a large number of private electricity firms, such as the Central American republics of El Salvador, Guatemala, Nicaragua and Panama.
The distribution of electricity markets between public and private enterprises has not varied much over the last few years, and there are no prospects for change in the short and medium terms. Although no new privatizations or nationalizations of electricity firms are foreseen, in many economies of the region private investment has increased in the markets that were open to receive this, encouraged by promising sector growth prospects and stable regulatory frameworks that are attractive for investors. Moreover, the emergence of new renewable energy sources has also opened up new opportunities for private participation (see section E).
As is the case in other developing regions, electricity demand in Latin America has grown on a sustained basis over the last few years, outpacing the expansion in developed countries. This largely reflects the region’s strong economic performance and, in some countries, a shift in the sector composition of GDP towards more electricity-intensive activities.7 Current per capita electricity consumption in the region (2,150 kW), while still far below the level in developed countries, suggests sustained growth of consumption in the next few decades, as has happened in other developing regions such as Asia or Africa (IEA, 2011a).
7 On the other hand, greater energy efficiency in processes could offset this effect and reduce demand in the future.

Economic Commission for Latin America and the Caribbean (ECLAC)152152
Table IV.3 LATIN AMERICA (MAIN ECONOMIES): PUBLIC OR PRIVATE PARTICIPATION IN THE ELECTRICITY SECTOR, 2011
Country Generation Transmission Distribution and marketingArgentina Bolivia (Plurinational State of) Brazil Chile Colombia Costa Rica Cuba Ecuador El Salvador Guatemala Honduras Mexico Nicaragua Panama Paraguay Peru Dominican Republic Uruguay Venezuela (Bolivarian Republic of )
Source: Economic Commission for Latin America and the Caribbean (ECLAC) on the basis of official data.
Wholly State-owned. Public and private firms coexist. Wholly private.
Apart from expectations for demand growth, it is regulatory frameworks that determine the pace of private investment in the sector. These differ widely between countries, and it is impossible to analyse each one in this chapter; but certain key measures are highlighted which have contributed to investment in new capacity, particularly in the generating segment, in the region’s largest economies.
In Brazil, the most important change involved the introduction of auctions to build new generating capacity as from 2004. Under this system, the firms that bid the lowest electricity prices are awarded a contract to sell energy to the distributors.8 With the resulting 20-year income guarantee, the firms constructed generating plants with good financing conditions, which, together with the availability of good hydro and wind resources in Brazil, enabled them to make auction bids to supply energy at 67 reais (US$ 59) per MWh for large hydroelectric plants in 2010, and 102 reais (US$ 59) per MWh for wind and hydro and gas energy in 2011. Most projects in the system were submitted by private operators, although the large hydroelectric projects were bid in association with Eletrobras, to ensure implicit government backing. Nonetheless, Eletrobras has cut its share of generating capacity from 71% in 2003 to 36% in 2001. Thermal generation (13% of capacity) is not developing at the same pace owing
8 This contract is known in the industry as a power purchase agreement (PPA).
to a shortage of natural gas on the market, except in the plants owned by the public-sector gas distributor Petrobras, which is Brazil’s second largest generator with 5GW installed capacity.
Favourable regulatory conditions for private investors in electricity generation are supported by good prospects in the transmission segment (through tenders) and in distribution (in which nearly all the market is now private), given the size of the Brazilian electricity market and its growth prospects. Alongside economic growth generally, the most energy-intensive sectors in Brazil (not only electricity) are growing particularly vigorously (Altomonte and others, 2011). As a result, the world’s leading electricity companies are very interested in the Brazilian market; and those already in the country have plans to expand.
In Chile, where the entire electricity sector had been in private hands since the 1990s, investment incentives have come from demand growth, which has benefited greatly from the boom in the mining sector (which already accounts for 39% of total electricity consumption).9 Between 2007 and 2011, electricity projects that have obtained an environmental permit total US$ 32.7 billion — a very large amount compared to the US$ 3.9 billion of
9 In 2010, mining consumed 16% of all of the country’s energy and 39% of its electricity, whereas in 1980 the figures were 6% and 2% respectively (IEA, 2011b). This means, firstly, a large increase in the country’s mining activity; and secondly, that its energy needs were mainly covered with electricity

153Foreign Direct Investment in Latin America and the Caribbean • 2011
the previous five years. In Peru, average annual investment in the sector grew from US$ 310 million between 2001 and 2005 to US$ 903 million between 2006 and 2010, the vast majority of which was private investment.10
Argentina is a different case, where electricity consumption grew at an annual rate of 4.4% between 2006 and 2010, but without matching growth in generating capacity, which remained at 3.2% in that period.11 This mismatch is a cause for concern owing to the risk of energy outages, which are already occurring in certain industries during the winter. The problem stems from the 2002 devaluation, when the government converted rates into pesos but did not allow them to be indexed to inflation. The electricity companies considered that decision equivalent to a unilateral change in the conditions of their concession contracts and nearly all of them filed complaints against Argentina at the International Center for the Settlement of Investment Disputes (ICSID).12 Over the last few years, electricity rates have been held too low to encourage investment in new capacity; although in the first few months of 2012 the government has started to correct the distortions by reducing subsidies to consumers. Thus far, firms in Argentina have not announced expansion plans, leaving capacity expansion in government hands, either directly or else through programmes that provide incentives for firms to expand capacity through direct subsidies.
In the Bolivarian Republic of Venezuela, electricity constraints have been more serious and affected industry in particular in the last few months of 2009 and first half of 2010; the problems stemmed from the drought which reduced hydroelectric production (ECLAC, 2010b). Having privatized most of its electricity sector in the 1990s, the country then dismantled the process by nationalizing all private firms in 2007 — including Electricidad de Caracas, owned by AES, which produced 10% of the country’s electricity (EIU, 2004).13 These nationalizations should be seen in the context of an economic strategy to increase State ownership of assets in many sectors that are considered strategic, ranging from banking to iron and steel, and including oil. In the Plurinational State of Bolivia the possibility of supply outages also arose in 2011. Over the last few years, the sector has underinvested
10 Ministry of Energy and Mines of Peru.11 Latin American Energy Organization (OLADE).12 The following electricity companies have filed complaints against
the Argentine State with the ICSID: CGE (Chile), Endesa (Spain), EDF (France), AES, Enron and El Paso (United States). Most of these cases were still unresolved in late 2011.
13 The other private electricity firms that were nationalized were: Electricidad de Valencia (ELEVAL), Compañía Anónima Luz Eléctrica del Yaracuy (CALEY), Compañía Anónima Luz y Fuerza Eléctricas de Puerto Cabello (CALIFE), Electricidad de Ciudad Bolívar (ELEBOL), Sistema Eléctrico del Estado Nueva Esparta (SENECA) and Turboven.
in new capacity owing to the uncertainty surrounding its status, and generating firms were finally nationalized in 2010. Current plans to increase capacity will not bear fruit until 2012 at the earliest. In the case of Ecuador, capacity problems have largely been resolved in 2011, and the country will probably have an energy surplus when the 1,500 MW Coca Codo Sinclair hydroelectric plant comes on stream, representing one third of the country’s total capacity.14
In contrast to the situation in South American countries, Mexico has excess electricity generating capacity resulting from overly optimistic estimation of demand growth in the first few years of the new century, which attracted a large inflow of private capital to that segment (see figure IV.4). Mexico opened the electricity sector to private investment in the generating segment in 1994 (while keeping the Federal Electricity Commission (CFE) as sole buyer,15 through various modalities. The most important have been contracts with independent energy producers, whereby the CFE awards the building and operation of a generating plant to the firm that bids the lowest electricity price in auction. All plants set up in this way have been combined-cycle thermal plants, in which the risk of an increase in the gas price is borne by the CFE, since the private generator can pass this cost increase on in the price of the electricity it sells. This situation, compounded by the fact that the CFE signs power purchase agreements (PPAs) lasting 20 years, means that the investments are particularly safe and easy to finance for private investors and, consequently, the auctions arouse great interest. A total of US$ 14.991 billion of investment was attracted under this modality, although the vast majority of this was for contracts announced between 1999 and 2004 for power plants that came on stream between 2005 and 2010.
More recently, the self-supply modality has gained ground in Mexico, in which one or several large consumers enter into partnership with an electricity generator to build and operate a plant to supply them with electricity. This does not require CFE participation, which would only receive payment for transmission and distribution. The investments made in these plants total US$ 10.172 billion and are concentrated essentially in wind power (see section E). Less important have been co-generation alternatives (projects that exploit energy left over from other processes to generate electricity) totalling US$ 3.484 illion, and
14 This plant is being constructed by the Chinese firm Synohidro, although it will be owned and operated by the Ecuadorian State.
15 The CFE was created in 1937 as a monopoly, with a mission to extend electrification throughout the country. It is the only firm in Mexico operating in the transmission and distribution segments, following its takeover in 2009 by Luz y Fuerza, another public enterprise that distributed electricity in the centre of the country. Its articles of association explicitly prohibit any investment abroad.

Economic Commission for Latin America and the Caribbean (ECLAC)154
also export projects (US$ 3.115 billion), which enable firms to build plants to sell electricity to the United States. Under these modalities, the private sector share has gradually expanded to account for 45% of all electricity produced in 2010.
Owing to the slowdown in the Mexican economy over the last decade, electricity consumption did not attain the growth expected of it; and in 2010 there was idle capacity of 47%. In 2011, this slack was reduced to 33%, as a result of delays in the entry of new plants, a revival of consumption and the withdrawal of the oldest and most inefficient plants of the CFE. Although all transnational firms in Mexico have plans to expand their investment, these will depend on the government’s decision to open more contracts for independent energy producers and continue with the self-supply model, which in turn depends on retiring CFE capacity. In the short and medium terms, there are no prospects for opening up the electricity transmission and distribution segments to private investment.
Figure IV.4 MEXICO: PRIVATE INVESTMENT IN ELECTRICITY
GENERATION, 1994-2011 (Millions of dollars)
-
500
1 000
1 500
2 000
2 500
3 000
3 500
4 000
1994
1995
1996
1997
1998
1999
2000
2001
2002
2003
2004
2005
2006
2007
2008
2009
2010
2011
Source: Economic Commission for Latin America and the Caribbean (ECLAC), on the basis of information provided by the Energy Regulatory Commission.
In Central America, private firms have also grown their market share in generating segment in the last decade and now account for 62% of total electricity production in the subregion. In the distribution segment,
transnational enterprises such as EPM and AES play a key role, along with Gas Natural Fenosa (which recently sold its holdings in Guatemala). The largest distributors also include the State enterprises ICE-CNFL and ENEE of Costa Rica and Honduras, respectively. Since 2004, generating capacity has grown slightly faster than maximum demand, reversing the contrary trend that had prevailed since 1990. In most Caribbean countries, the sector is dominated by a single State-owned firm, except for the three largest economies: the Dominican Republic, where the generating segment is in private hands, and Trinidad and Tobago and Jamaica, where the Japanese firm Marubeni is a major player.
In Latin America, the space left for private investment in the electricity sector has mostly been exploited by foreign investors; but, for various reasons, the trends of this industry are hard to discern in each country’s FDI data. Firstly, Mexico is the only country that publishes data on FDI in the electricity sector specifically, while information for the other countries is aggregated with gas and water distribution. Secondly, although information on the acquisitions made by trans-boundary firms is generally well reflected in the FDI data, investments in new plant are recorded incompletely, since often a large proportion of such investment is financed by loans obtained in the country that receives the investment.16 Despite these limitations, a number of trends can be discerned in the per country FDI data (see table IV.4).
In the first place, nearly all countries have large FDI inflows in this sector, except those where the electricity sector has remained entirely in State hands. Small economies that receive a relatively large amount of FDI in the sector include the Dominican Republic, Guatemala and Nicaragua. In general, FDI flows were greatest between 1999 and 2001, when the privatization process is were still under way and the concomitant wave of mergers and acquisitions. In the later years, FDI declined, before reviving somewhat between 2008 and 2010, but this general trend is greatly affected by the volatility of flows from year to year, reflecting mergers and acquisitions in this industry. In many cases, particularly Colombia, where there are strong local firms, the balance of FDI is negative, since these firms have purchased assets from transnational enterprises.
16 Although this problem is common to all industries, it is a particularly sensitive issue in electricity and other infrastructures, since projects are very often financed with debt. In markets where long-term power purchase agreements are established, many firms prefer to undertake generation using the project finance modality, in other words through a subsidiary devoted exclusively to the project; and they use the agreement as a loan guarantee. Under this modality, up to 80% of project financing can be debt, with as little as 20% obtained from equity.

155Foreign Direct Investment in Latin America and the Caribbean • 2011
Table IV.4 LATIN AMERICA AND THE CARIBBEAN (SELECTED COUNTRIES): FOREIGN DIRECT INVESTMENT IN ELECTRICITY, GAS AND WATER, 1999-2010
(Millions of dollars and percentages of the total)
1999 2000 2001 2002 2003 2004 2005 2006 2007 2008 2009 2010
Percentage of total foreign investment 1999-2010
Argentina 951 446 197 -57 n.a. n.a. 95 -54 -312 -10 19 n.a. 1.5
Brazil 2 970 7 116 1 442 1 534 649 1 180 1 571 2 332 826 238 -1 234 1 705 6.4
Chile 445 1 067 216 230 97 177 236 1 057 90 1 380 2 031 993 7.9Colombia -306 13 -71 135 68 88 -251 -141 -79 156 -977 35 -2.1Bolivia (Plurinational State of ) 72 42 41 42 36 74 10 14 7 52 n.a. n.a. 7.3Ecuador n.a. n.a. n.a. 2 1 6 7 7 12 -7 1 -6 0.3Paraguay 0 0 0 0 0 0 0 0 0 0 0 0 0.0Mexico 149 122 305 445 338 235 197 -76 183 458 55 6 1.0Dominican Republic 631 282 402 140 1 -58 117 -52 59 113 121 123 11.5Panama n.a. n.a. n.a. n.a. n.a. n.a. n.a. n.a. -3 -46 280 211 2.8Nicaragua n.a. 115 5 8 1 5 24 20 73 215 222 n.a. 17.9Honduras n.a. n.a. n.a. n.a. n.a. n.a. n.a. n.a. ‐0,4 2 17 0.3Guatemala n.a. n.a. n.a. n.a. n.a. n.a. 89 160 91 106 59 n.a. 9.2Belize 22 0 25 0 5 16 24 4 5 3 5 2 10.7Total 4 934 9 203 2 562 2 478 1 197 1 722 2 118 3 271 950 2 657 585 3 086 4.0
Source: Economic Commission for Latin America and the Caribbean (ECLAC), on the basis of official figures.Note: n.a. = Data not available.
The rising trend of the last few years can be seen more clearly in information compiled by the World Bank on electricity infrastructure projects with private participation.17 Figure IV.5 shows that the increase in the value of investment projects in the second half of the 1990s was dominated by State contributions (through privatizations), and was followed by a period of lower investment levels. Since 2006, however, investment projects in the region have increased again, in 2009 reaching a level of nearly 5 times the average for the period 2001-2005. The difference in magnitude compared to FDI data is explained by the fact that the information represents investments that were announced (but not necessarily executed), and includes all private investment (domestic and foreign) but does not deduct the dis-investments made by transnational firms.
Irrespective of the type of firm that undertakes them, investments in new capacity in the electricity sector are subject to the legal, political and social difficulties faced by all large infrastructure projects. In addition to the social and environmental requirements they have to fulfil, and which are usually specified in advance in regulations, there are reactions from the affected communities and civil society at large. These are increasingly active, and often succeed in overturning administrative decisions and achieving modifications or even the cancellation of already-approved projects. There are many examples of major projects that have been cancelled (such as the Barrancones thermal power plant in Chile, or the Porce IV
17 The figures represent the investment commitments expressed by firms interested in electricity generation, transmission and distribution projects, in which private enterprises (both domestic and foreign) participate. For further information, see [online] http://ppi.worldbank.org/resources/ppi_methodology.aspx.
hydroelectric plant in Colombia), or which have suffered delays and major design changes and are still awaiting resolution (such as Hydroaysen in Chile or Belo Monte in Brazil). Although this trend affects all investments in generation and transmission one way or another, large-scale hydroelectric plants come under the greatest pressure because of their impact on the life of local communities and the fact that they have little room for manoeuvre.18
Figure IV.5 LATIN AMERICA AND THE CARIBBEAN: INVESTMENT
COMMITTMENTS IN ENERGY PROJECTS WITH PRIVATE PARTICIPATION, 1990-2009
(Millions of dollars)
0
5 000
10 000
15 000
20 000
25 000
30 000
1990
1993
1995
1997
1999
2001
2003
2005
2007
2009
Total investments Payments to the government
Source: Economic Commission for Latin America and the Caribbean (ECLAC) on the basis of data provided by the World Bank.
Note: An estimated 85% of these projects pertain to the electricity sector.
18 One of the results of this social protest has been a reduction in the size of reservoirs in many of the major hydroelectric projects of recent years. While this considerably reduces the land directly affected, it makes hydroelectric energy far more dependent on the rainfall regime.

Economic Commission for Latin America and the Caribbean (ECLAC)156
3. Composition of electricity generation
The composition of a country’s electric power generation depends firstly on the natural conditions prevailing in it and the size of its electricity market. Apart from these circumstances, there are regulatory and investment decisions made by governments which push electric power generation towards one technology or another. No electricity firm has a defined strategy that favours or excludes generation with a given technology; and each decides to invest in the technology that market signals suggest.19
Despite losing ground in recent years, hydroelectric power continues to dominate electricity generation in the region, with 50% of installed capacity (see figure IV.6). This is an exceptional case in the world (the global percentage of hydroelectric energy is 16%), which means that electricity production in the region has a small carbon footprint (measured by CO2 emissions per kilowatt hour (KWh) produced), and reduces reliance on fossil fuel imports in many countries. Nonetheless, this supply structure means that the region’s electricity systems are highly dependent on rainfall regimes.
Rain-dependency varies from the extreme case of Paraguay —which not only produces all of its energy consumption from hydroelectric plants, but also exports much of it to Brazil— to countries such as Chile or Mexico, which have small hydro percentages; but in general most countries in South America and Central America generate over half of their electricity with hydropower (see figure IV.7).
Unlike the situation in South American countries, in Mexico combined-cycle thermal power plants are the priority alternative (representing 52% of installed capacity and 100% of private investments until wind power emerged), mainly owing to the low cost of gas in the United States, to which Mexico is connected by a gas pipeline. The country has an open and competitive gas market which guarantees fuel supply to generators. Hydroenergy, which in Mexico has less potential than elsewhere the region, is in the hands of the CFE, as also is geothermal and nuclear energy. The other expansion path involves non-conventional renewable energy sources, particularly wind (see section E). The leading economies of the region with a larger proportion of thermal power plants include Chile (60% of total). This country depends very heavily on hydroelectric energy (at least in the central zone where most consumption takes place), and in 1988
19 As an exception, AES does not include nuclear energy among its alternatives.
there was a crisis in the sector owing to a lack of rain. At that time, the authorities decided to diversify generation towards natural gas power plants and provided incentives to build gas pipelines from Argentina. This model also entered into crisis in 2004, when Argentina cut off gas exports to Chile, which made it necessary to consume diesel in combined-cycle power plants, more generation with coal, and the construction of liquefied gas terminals.
Figure IV.6 LATIN AMERICA AND THE CARIBBEAN: STRUCTURE OF
ELECTRIC POWER GENERATION BY INSTALLED CAPACITY, 2010
Hydro(50)
Thermal(47)
Nuclear(1)
Other(2)
Source: Latin American Energy Organization (OLADE).
Figure IV.7 LATIN AMERICA (SELECTED COUNTRIES): INSTALLED
HYDROELECTRIC CAPACITY, LATEST YEAR AVAILABLE, AROUND 2011
(Percentages)
0
10
20
30
40
50
60
70
80
90
100
Par
agua
y
Bra
zil
Col
ombi
a
Vene
zuel
a(B
ol. R
ep. o
f)
Uru
guay
Per
u
Cen
tral A
mer
ica
Ecu
ador
Bol
ivia
(Plu
r. S
tate
of)
Arg
entin
a
Chi
le
Mex
ico
Source: Economic Commission for Latin America and the Caribbean (ECLAC), on the basis of official figures.

157Foreign Direct Investment in Latin America and the Caribbean • 2011
The smaller countries mainly use liquid-fuel thermal power plants, which are more flexible but much more costly to operate, particularly with the current level of oil prices. In Central America, these plants were built following privatizations, to deal with emergency situations (they can be built much more quickly than any other alternative) in the context of much lower oil prices than currently prevail. The result is an electric power generating structure that is excessively biased towards liquid fuels, with high electricity prices and total energy dependence. At the present time, the possibility of installing combined-cycle power plants is being studied,20 together with a return to building
20 In September 2011, AES announced the investment of US$ 970 million in a natural gas plant in El Salvador. See [online] www.centralamericadata.com/es/article/home/AES_anuncia_inversin_de_970_ millones_en_El_Salvador.
hydroelectric plants (such as Tumarín in Nicaragua) and the incipient entry of wind power (see section E). Electricity prices are generally higher in Central American countries than in South America; and, although heavily influenced by taxes and subsidies, the structure of electric power generation and the size of the market are decisive factors (see figure IV.8). This also occurs, in more extreme form, in the Caribbean countries, particularly the smaller economies. Average prices for industrial consumption in these economies are consistently above those prevailing in the rest of the region, with levels of US$ 0.4 per kilowatt hour in Haiti, US$ 0.36 in Barbados, and US$ 0.25 in Jamaica.
Figure IV.8 LATIN AMERICA (SELECTED COUNTRIES): AVERAGE INDUSTRIAL ELECTRICITY RATES INCLUDING TAXES
(Dollars /KWh)
0
0.02
0.04
0.06
0.08
0.1
0.12
0.14
0.16
0.18
0.2
Bra
zil
Arg
entin
a
Vene
zuel
a(B
ol. R
ep. o
f)
Col
ombi
a
Chi
le
Peru
Ecua
dor
Uru
guay
Para
guay
Boliv
ia(P
lur.
Stat
e of
) 0
0.05
0.1
0.15
0.2
0.25
0.3
Cos
ta R
ica
Hon
dura
s
El S
alva
dor
Nic
arag
ua
Gua
tem
ala
Pana
ma
A. Latin America B. Central America
Source: Economic Commission for Latin America and the Caribbean (ECLAC), on the basis of data provided by the Latin American Energy Organization (OLADE).
Apart from large-scale hydroelectric plants, renewable sources remain marginal in the region. Small-scale hydroelectric, biomass, and geothermal energy plants have traditionally been important in certain countries in the region, and remain so within this segment. Nonetheless, the burgeoning growth of wind power over the last two years is driving the renewable energy segment in the region. Brazil now has 1,500 MW capacity installed and another 6,700 MW
in project, whereas in Mexico there is 569 MW operating today and another 2,609 MW under construction or about to be built. As a proportion of new capacity being planned, wind energy represents 3.7% in Brazil and 10% in Mexico (SENER, 2010). This phenomenon is not exclusive to large countries, however: Costa Rica, Honduras, Nicaragua and Uruguay also developed considerable wind energy capacity in 2010 and 2011.
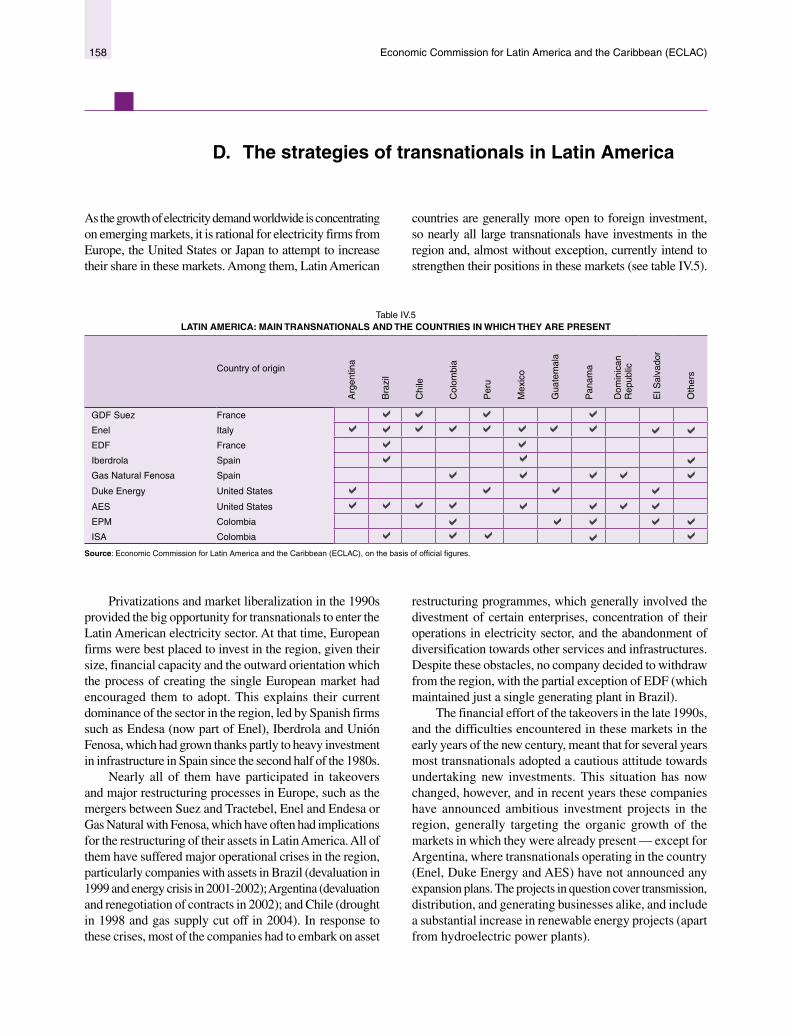
Economic Commission for Latin America and the Caribbean (ECLAC)158
D. The strategies of transnationals in Latin America
As the growth of electricity demand worldwide is concentrating on emerging markets, it is rational for electricity firms from Europe, the United States or Japan to attempt to increase their share in these markets. Among them, Latin American
countries are generally more open to foreign investment, so nearly all large transnationals have investments in the region and, almost without exception, currently intend to strengthen their positions in these markets (see table IV.5).
Table IV.5 LATIN AMERICA: MAIN TRANSNATIONALS AND THE COUNTRIES IN WHICH THEY ARE PRESENT
Country of origin
Arg
entin
a
Bra
zil
Chi
le
Col
ombi
a
Per
u
Mex
ico
Gua
tem
ala
Pan
ama
Dom
inic
an
Rep
ublic
El S
alva
dor
Oth
ers
GDF Suez France ‐ ‐ ‐ ‐
Enel Italy ‐ ‐ ‐ ‐ ‐ ‐ ‐ ‐ ‐ ‐ ‐
EDF France ‐ ‐
Iberdrola Spain ‐ ‐ ‐
Gas Natural Fenosa Spain ‐ ‐ ‐ ‐ ‐
Duke Energy United States ‐ ‐ ‐ ‐ ‐
AES United States ‐ ‐ ‐ ‐ ‐ ‐ ‐ ‐
EPM Colombia ‐ ‐ ‐ ‐ ‐
ISA Colombia ‐ ‐ ‐ ‐ ‐
Source: Economic Commission for Latin America and the Caribbean (ECLAC), on the basis of official figures.
Privatizations and market liberalization in the 1990s provided the big opportunity for transnationals to enter the Latin American electricity sector. At that time, European firms were best placed to invest in the region, given their size, financial capacity and the outward orientation which the process of creating the single European market had encouraged them to adopt. This explains their current dominance of the sector in the region, led by Spanish firms such as Endesa (now part of Enel), Iberdrola and Unión Fenosa, which had grown thanks partly to heavy investment in infrastructure in Spain since the second half of the 1980s.
Nearly all of them have participated in takeovers and major restructuring processes in Europe, such as the mergers between Suez and Tractebel, Enel and Endesa or Gas Natural with Fenosa, which have often had implications for the restructuring of their assets in Latin America. All of them have suffered major operational crises in the region, particularly companies with assets in Brazil (devaluation in 1999 and energy crisis in 2001-2002); Argentina (devaluation and renegotiation of contracts in 2002); and Chile (drought in 1998 and gas supply cut off in 2004). In response to these crises, most of the companies had to embark on asset
restructuring programmes, which generally involved the divestment of certain enterprises, concentration of their operations in electricity sector, and the abandonment of diversification towards other services and infrastructures. Despite these obstacles, no company decided to withdraw from the region, with the partial exception of EDF (which maintained just a single generating plant in Brazil).
The financial effort of the takeovers in the late 1990s, and the difficulties encountered in these markets in the early years of the new century, meant that for several years most transnationals adopted a cautious attitude towards undertaking new investments. This situation has now changed, however, and in recent years these companies have announced ambitious investment projects in the region, generally targeting the organic growth of the markets in which they were already present — except for Argentina, where transnationals operating in the country (Enel, Duke Energy and AES) have not announced any expansion plans. The projects in question cover transmission, distribution, and generating businesses alike, and include a substantial increase in renewable energy projects (apart from hydroelectric power plants).
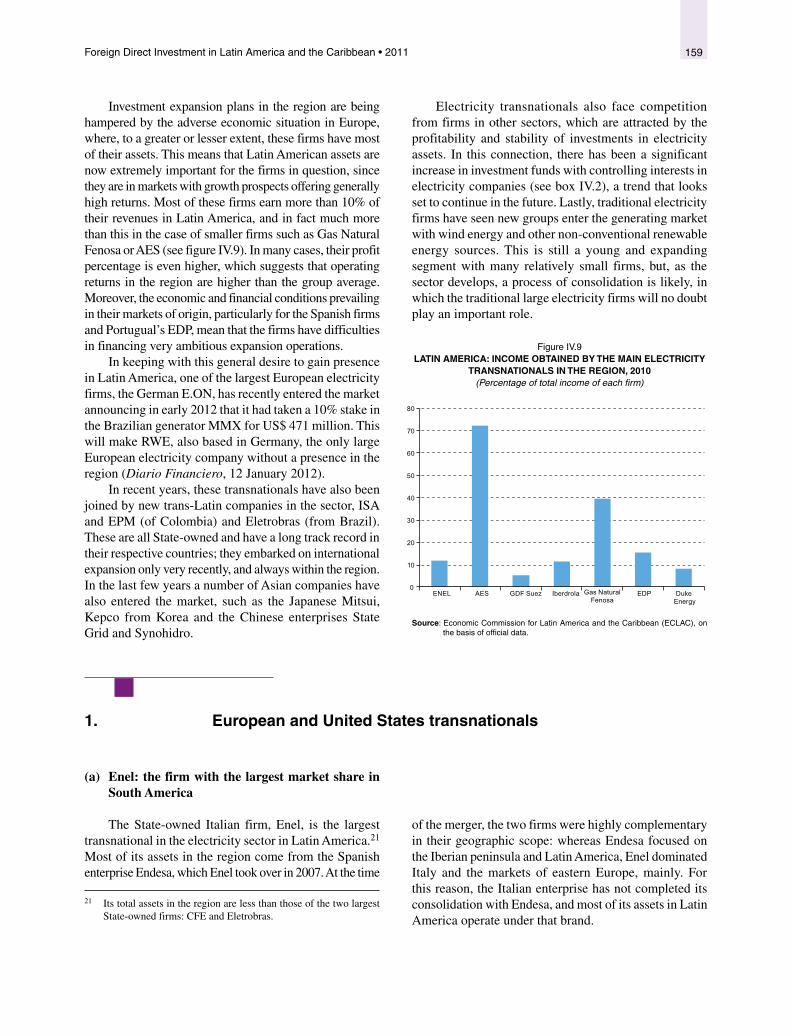
159Foreign Direct Investment in Latin America and the Caribbean • 2011
Investment expansion plans in the region are being hampered by the adverse economic situation in Europe, where, to a greater or lesser extent, these firms have most of their assets. This means that Latin American assets are now extremely important for the firms in question, since they are in markets with growth prospects offering generally high returns. Most of these firms earn more than 10% of their revenues in Latin America, and in fact much more than this in the case of smaller firms such as Gas Natural Fenosa or AES (see figure IV.9). In many cases, their profit percentage is even higher, which suggests that operating returns in the region are higher than the group average. Moreover, the economic and financial conditions prevailing in their markets of origin, particularly for the Spanish firms and Portugual’s EDP, mean that the firms have difficulties in financing very ambitious expansion operations.
In keeping with this general desire to gain presence in Latin America, one of the largest European electricity firms, the German E.ON, has recently entered the market announcing in early 2012 that it had taken a 10% stake in the Brazilian generator MMX for US$ 471 million. This will make RWE, also based in Germany, the only large European electricity company without a presence in the region (Diario Financiero, 12 January 2012).
In recent years, these transnationals have also been joined by new trans-Latin companies in the sector, ISA and EPM (of Colombia) and Eletrobras (from Brazil). These are all State-owned and have a long track record in their respective countries; they embarked on international expansion only very recently, and always within the region. In the last few years a number of Asian companies have also entered the market, such as the Japanese Mitsui, Kepco from Korea and the Chinese enterprises State Grid and Synohidro.
Electricity transnationals also face competition from firms in other sectors, which are attracted by the profitability and stability of investments in electricity assets. In this connection, there has been a significant increase in investment funds with controlling interests in electricity companies (see box IV.2), a trend that looks set to continue in the future. Lastly, traditional electricity firms have seen new groups enter the generating market with wind energy and other non-conventional renewable energy sources. This is still a young and expanding segment with many relatively small firms, but, as the sector develops, a process of consolidation is likely, in which the traditional large electricity firms will no doubt play an important role.
Figure IV.9 LATIN AMERICA: INCOME OBTAINED BY THE MAIN ELECTRICITY
TRANSNATIONALS IN THE REGION, 2010 (Percentage of total income of each firm)
0
10
20
30
40
50
60
70
80
ENEL AES GDF Suez Iberdrola Gas NaturalFenosa
EDP Duke Energy
Source: Economic Commission for Latin America and the Caribbean (ECLAC), on the basis of official data.
1. European and United States transnationals
(a) Enel: the firm with the largest market share in South America
The State-owned Italian firm, Enel, is the largest transnational in the electricity sector in Latin America.21 Most of its assets in the region come from the Spanish enterprise Endesa, which Enel took over in 2007. At the time
21 Its total assets in the region are less than those of the two largest State-owned firms: CFE and Eletrobras.
of the merger, the two firms were highly complementary in their geographic scope: whereas Endesa focused on the Iberian peninsula and Latin America, Enel dominated Italy and the markets of eastern Europe, mainly. For this reason, the Italian enterprise has not completed its consolidation with Endesa, and most of its assets in Latin America operate under that brand.
Economic Commission for Latin America and the Caribbean (ECLAC)160
Box IV.2 INVESTMENT FUNDS IN THE ELECTRICITY INDUSTRY
Investment funds special izing in infrastructure represent category of financial market agent that has grown substantially in recent years; and several funds of this type have acquired electricity firms in Latin America and the Caribbean.
Their strategy involves purchasing infrastructure assets (generally already built) that generate a predictable and stable income flow. In the last few years, they have benefited from a low interest-rate environment and rising expectations of inflation, which makes them an attractive investment alternative for savers seeking less volatile assets than variable income instruments but with a higher return than can be earned on public debt. Within the electricity sector, they mainly invest in assets that yield regulated returns, such as transmission lines. Non-conventional renewable energies, involving high fixed capital investments and relatively low and predictable operating costs, are also suitable as investment fund assets when power purchase agreements (PPAs) can be signed that offer a stable long-term income.
Some funds with active investment strategies purchase firms in distress with the aim of strengthening their financial position and then selling them on. Most have a more conservative attitude and purchase pre-existing assets with relatively stable operating expectations. In these cases, the fund usually keeps the existing management team in place.
The largest operation undertaken by an investment fund in the region thus far has been the takeover of Transelec, which dominates the transmission segment in Chile. This firm was purchased for over US$ 2 billion in 2006 by a consortium of Canadian investment funds led by Brookfield Asset Management (BAM). BAM has US$ 121,558 million in assets, distributed between hydroelectric generation in North America and Brazil (where it has 451 MW capacity), real estate in the commercial offices segment, and regulated infrastructure assets, arising from its stake in Transelec. In addition, 20% of its capital is applied in more cyclical activities, such as residential real estate or privately owned firms.
More recently, in 2011, two electricity distribution and generating firms in Guatemala were purchased for US$ 345 million by Actis, of the United Kingdom. Actis is a private capital enterprise that invests in emerging- market infrastructure projects or in those that capture the growing purchasing power of the new middle classes. It has US$ 4.6 billion in its portfolio, invested in 65 firms. Only 9% of its assets are in energy, and 5% in Latin America. The monies it manages mainly come from pension funds, investment funds, and sovereign wealth funds. Actis is also the sole owner of Globeleq, which has electricity generating assets in Costa Rica, Honduras and Peru.
Contour Global and Southern Cross are examples of investment funds with more active strategies, that purchase ailing firms with the aim of regenerating them and selling them on at a higher price, and also participating in development and construction. The first of these has generating assets in Brazil and Colombia, while the second owns a 780 MW gas plant in the north of Chile, and the Campanario power plant, also in Chile, which declared a suspension of payments in 2011.
Electricity sector assets controlled by investment funds are still isolated cases, although their presence has grown significantly in recent years. Their comparative advantage is their ability to obtain funding, which is important in such a capital-intensive industry. In contrast, when electricity firms are controlled by investment funds, rather than forming part of transnational companies, there is less opportunity for operational synergies and knowledge transfers within the enterprise. If the presence of investment funds in the sector were to expand, it could produce a business model in which ownership of the assets (by the investment funds) is separated from their management ( in the hands of the electricity firms), in a system similar to that operated by some hotel groups.
Source: Economic Commission for Latin America and the Caribbean (ECLAC), on the basis of information provided by the firms in question.
Endesa’s expansion in Latin America began in 1992, when it was still owned by the Spanish State. In that year, it purchased 38% of EDENOR, one of the leading energy distributors in Argentina. Later it increased its interests in this country with other transmission and generating companies. In Peru, it participated in the privatization of the energy distributor EDELNOR in 1994, as a minority shareholder in conjunction with Chilean firms; and in the two following years it purchased the generators Empresa de Generación Termoeléctrica Ventanilla S.A. (Etevensa) and Empresa Eléctrica de Piura S.A. (Eepsa). In Brazil, where it faced competition in the privatization process from local and Chilean groups, Endesa was a minority partner in the consortia that acquired two major distributors in 1996 and 1998. In 1997 and 1998, also in consortium with other firms, it purchased Cachoeira Dourada, the country’s first privatized generating company (658 MW). Later, it increased its stakes in all of these companies. In Brazil, it also constructed the interconnection line with Argentina (Compañía de Interconexión Energética (CIEN)), which began commercial operations between 2000 and 2002, with an investment cost of US$ 700 million. In 1997 it entered Colombia in a consortium with Enersis
purchasing the Bogota energy distributor (CODENSA) and the country’s largest generator, Empresa Generadora de Energía S.A. (EMGESA).
In 1997 Endesa took a stake in Enersis, the Chilean firm that had been privatized in the 1980s, and which since 1992 had built a network of subsidiaries in other countries of the region. Lastly, in 1999, it took over 100% of Enersis (including Endesa Chile), thus not only consolidating its position as the leading firm in Chile, but also considerably expanding its market shares in Argentina, Brazil, Colombia and Peru.
Following these acquisitions, Endesa launched a group rationalization plan, with selective dis-investments to focus its strategy.22 Devaluation processes and energy crises, particularly the Argentine crisis in 2001 and 2002, undermined the firm’s results in the region and led to a new round of asset sales to reduce the debt. As part of this process, Endesa sold most of its assets in other sectors, such as the Autopista del Sol highway in Chile, to focus on the electricity sector. Its strategy of diversification into
22 The largest dis-investment was the Chilean transmission company Chilectra, sold to Hydro-Quebec in October 2000 for US$ 1.076 billion.
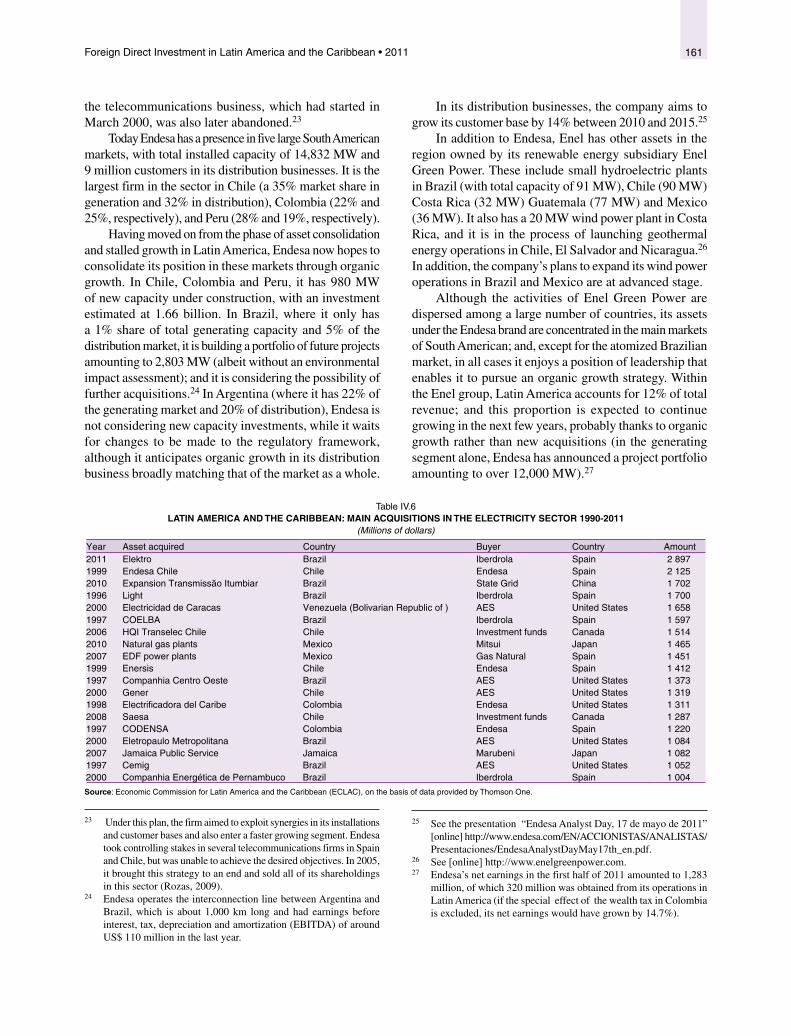
161Foreign Direct Investment in Latin America and the Caribbean • 2011
the telecommunications business, which had started in March 2000, was also later abandoned.23
Today Endesa has a presence in five large South American markets, with total installed capacity of 14,832 MW and 9 million customers in its distribution businesses. It is the largest firm in the sector in Chile (a 35% market share in generation and 32% in distribution), Colombia (22% and 25%, respectively), and Peru (28% and 19%, respectively).
Having moved on from the phase of asset consolidation and stalled growth in Latin America, Endesa now hopes to consolidate its position in these markets through organic growth. In Chile, Colombia and Peru, it has 980 MW of new capacity under construction, with an investment estimated at 1.66 billion. In Brazil, where it only has a 1% share of total generating capacity and 5% of the distribution market, it is building a portfolio of future projects amounting to 2,803 MW (albeit without an environmental impact assessment); and it is considering the possibility of further acquisitions.24 In Argentina (where it has 22% of the generating market and 20% of distribution), Endesa is not considering new capacity investments, while it waits for changes to be made to the regulatory framework, although it anticipates organic growth in its distribution business broadly matching that of the market as a whole.
23 Under this plan, the firm aimed to exploit synergies in its installations and customer bases and also enter a faster growing segment. Endesa took controlling stakes in several telecommunications firms in Spain and Chile, but was unable to achieve the desired objectives. In 2005, it brought this strategy to an end and sold all of its shareholdings in this sector (Rozas, 2009).
24 Endesa operates the interconnection line between Argentina and Brazil, which is about 1,000 km long and had earnings before interest, tax, depreciation and amortization (EBITDA) of around US$ 110 million in the last year.
In its distribution businesses, the company aims to grow its customer base by 14% between 2010 and 2015.25
In addition to Endesa, Enel has other assets in the region owned by its renewable energy subsidiary Enel Green Power. These include small hydroelectric plants in Brazil (with total capacity of 91 MW), Chile (90 MW) Costa Rica (32 MW) Guatemala (77 MW) and Mexico (36 MW). It also has a 20 MW wind power plant in Costa Rica, and it is in the process of launching geothermal energy operations in Chile, El Salvador and Nicaragua.26
In addition, the company’s plans to expand its wind power operations in Brazil and Mexico are at advanced stage.
Although the activities of Enel Green Power are dispersed among a large number of countries, its assets under the Endesa brand are concentrated in the main markets of South American; and, except for the atomized Brazilian market, in all cases it enjoys a position of leadership that enables it to pursue an organic growth strategy. Within the Enel group, Latin America accounts for 12% of total revenue; and this proportion is expected to continue growing in the next few years, probably thanks to organic growth rather than new acquisitions (in the generating segment alone, Endesa has announced a project portfolio amounting to over 12,000 MW).27
25 See the presentation “Endesa Analyst Day, 17 de mayo de 2011” [online] http://www.endesa.com/EN/ACCIONISTAS/ANALISTAS/Presentaciones/EndesaAnalystDayMay17th_en.pdf.
26 See [online] http://www.enelgreenpower.com.27 Endesa’s net earnings in the first half of 2011 amounted to 1,283
million, of which 320 million was obtained from its operations in Latin America (if the special effect of the wealth tax in Colombia is excluded, its net earnings would have grown by 14.7%).
Table IV.6 LATIN AMERICA AND THE CARIBBEAN: MAIN ACQUISITIONS IN THE ELECTRICITY SECTOR 1990-2011
(Millions of dollars)
Year Asset acquired Country Buyer Country Amount2011 Elektro Brazil Iberdrola Spain 2 8971999 Endesa Chile Chile Endesa Spain 2 1252010 Expansion Transmissão Itumbiar Brazil State Grid China 1 7021996 Light Brazil Iberdrola Spain 1 7002000 Electricidad de Caracas Venezuela (Bolivarian Republic of ) AES United States 1 6581997 COELBA Brazil Iberdrola Spain 1 5972006 HQI Transelec Chile Chile Investment funds Canada 1 5142010 Natural gas plants Mexico Mitsui Japan 1 4652007 EDF power plants Mexico Gas Natural Spain 1 4511999 Enersis Chile Endesa Spain 1 4121997 Companhia Centro Oeste Brazil AES United States 1 3732000 Gener Chile AES United States 1 3191998 Electrificadora del Caribe Colombia Endesa United States 1 3112008 Saesa Chile Investment funds Canada 1 2871997 CODENSA Colombia Endesa Spain 1 2202000 Eletropaulo Metropolitana Brazil AES United States 1 0842007 Jamaica Public Service Jamaica Marubeni Japan 1 0821997 Cemig Brazil AES United States 1 0522000 Companhia Energética de Pernambuco Brazil Iberdrola Spain 1 004
Source: Economic Commission for Latin America and the Caribbean (ECLAC), on the basis of data provided by Thomson One.
Economic Commission for Latin America and the Caribbean (ECLAC)162
(b) AES: heavy commitment to Latin America
The United States enterprise AES, founded in 1981, undertook a rapid international expansion between 1994 and 2000, when its stockmarket capitalization increased twentyfold, and it grew from just nine plants in three countries to over 110 generating plants and 17 distribution systems in 27 countries.
It first entered the Latin American market in 1993, purchasing a power plant in Argentina. In 1996 it formed part of the consortium involving the Brazilian distributor Light, EDF and other firms; and the following year it acquired an equity stake in Companhia Energética de Minas Gerais and it gained control of the Rio Grande do Sul distributor. In the same year, it was selected to build the Uruguaiana power plant, Brazil’s first gas-fired plant. In 1998, it participated in privatization of the São Paulo distributor (Eletropaulo), and in 1999 it acquired the Tiete hydroelectric plant. In 2000, it purchased the distributor Electricidad de Caracas for US$ 1658 million, the Chivor hydroelectric plant in Colombia, and the Chilean firm Gener, which had various assets in Argentina, for US$ 1,319 million. These acquisitions gave AES control over a large capacity generator in Chile and Argentina, and afforded it a strong presence in energy distribution in the large urban centres of Brazil. In addition, in 1998, it bought an 80% stake in a distributor in El Salvador for US$ 109 million; and in 1999 it paid US$ 110 million for 50% of a generator in the Dominican Republic.
In 2001, the energy crisis and devaluation that occurred in Brazil coincided with an international loss of confidence in energy companies triggered by the electricity crisis in California and the Enron bankruptcy. All of this caused major difficulties for AES (its share price plummeted from US$ 68.51 in 2000 to US$ 2.51 in 2002), and the firm was forced to restructure to be able to service its debts. In addition to selling many of its non-strategic assets,28 it had to renegotiate the debt acquired by its subsidiaries in Argentina, Brazil and Chile, in agreements that meant a reduction in its shareholding. These operations did not reduce the importance of the Latin American market for the firm, but actually slightly increased it to 57.5% (ECLAC, 2005).
As a result of the crisis and restructuring, the pace of AES investment slackened during the last decade, although it built two coal-fired thermal plants in Mexico (460 MW) which came on stream in 2007. Today, Latin America accounts for 72% of the firm’s income (the rest is obtained mainly from the United States and Europe), with Brazil and Chile its most
28 AES divested assets in Australia, Bangladesh, Brazil, Colombia, the Dominican Republic, Oman, Pakistan, the Plurinational State of Bolivia, South Africa, Tanzania, Uganda, the United Kingdom and the United States.
important markets (see figure IV.9).29 In countries such as the Dominican Republic, El Salvador and Panama, the firm is a dominant player; it is the leading generator in Panama (369 MW) and the second largest in Chile (1,621 MW), with major assets also in Argentina (3,222 MW capacity), Brazil (637 MW), Colombia (1,000 W), the Dominican Republic (800 MW) and Mexico (710 MW).30 In the distribution segment, it is the leading player in El Salvador (81% of the market) and has a large share in Brazil, where it is the owner of Sul (1.3 million customers) and holds 16% of the capital of Eletropaulo (6.1 million customers). Its assets in the Bolivarian Republic of Venezuela were nationalized in 2007.
Following a phase of downsizing and debt reduction, the firm is once again seeking organic growth alternatives in the region. It is currently building two coal-fired power plants in Chile (788 MW) and a hydroelectric plant in Panama (223 MW).
(c) Iberdrola: focused on Brazil and Mexico
Like Endesa, the Spanish firm Iberdrola began its international expansion by participating in Latin American privatizations. In 1992 it bought a generating plant in Argentina; in 1995 it acquired the main distributors in Plurinational State of Bolivia; and in 1996 it entered the Chilean market by purchasing the Tocopilla power plant from Chile’s National Copper Corporation (CODELCO) and the Colbún enterprise which was still State-owned. Between 1996 and 2000, in Brazil it took over the distributors Companhia de Eletricidade do Estado de Bahia (COELBA) and Companhia Energética do Rio Grande do Norte (COSERN), along with the Itapebí hydroelectric plant. In 1999, it was awarded the US$ 270 million contract for a 489 MW combined-cycle plant in Mexico. In this period, Ibderdrola’s expansion in the region was not limited to electric energy, since it also purchased assets in the sanitation sector in Chile, telecommunications in Brazil, and gas distribution in Argentina, Brazil and Colombia, as part of a diversification strategy that aims to turn the firm into a multiple-service provider
The strategic plan launched in 2001 changed this vision and retargeted the firm’s expansion on electricity generation in Spain (combined-cycle plants and renewable energies) and in Mexico, and to a lesser extent in Brazil.31 To focus on these segments, Iberdrola sold assets it owned
29 Although 72% of its sales are in Latin America, only 50% of the firm’s total assets are in the region. In 2010, it earned US$ 4.3 billion in Latin America from energy generation and US$ 7.2 billion in the distribution segment.
30 In Brazil, the firm also owns 46% of the Uruguaiana thermal power plant (639 MW) which has been idle since Argentina cut off gas supplies.
31 In contrast to the dis-investments made by Endesa, the plan pursued by Iberdrola was not motivated by the economic and energy crisis in the region, but responded to the firm’s internal needs.

163Foreign Direct Investment in Latin America and the Caribbean • 2011
in Spain in the electricity transmission, telecommunications, gas distribution, real estate and water sectors. Outside the electricity business, Iberdrola would henceforth only invest in the gas sector to supply its own combined-cycle power plants. Nonetheless, it is currently one of the few electricity firms with an engineering subsidiary. In addition to dis-investments in other sectors, in 1999 the firm sold its assets in Argentina, and in 2000 it divested its electricity generating firms in Chile.32
Since then, Iberdrola has targeted its international expansion outside the region, buying ScottishPower in United Kingdom between 2006 and 2007, and Energy East in the United States in 2008. In conjunction with its operations in Latin America, these acquisitions make it a very geographically diversified enterprise. It is the world’s largest wind energy producer, with an installed capacity of 62,613 MW in 20 countries, including Brazil and Mexico (Iberdrola, 2010).
In 2011, 13% of Iberdrola’s sales and 16% of its EBITDA came from Latin America (not including its renewable energy operations), where it has 5,893 MW capacity and 11.65 million customers (the same as in Spain).33 Although it maintains its distribution subsidiaries in Plurinational State of Bolivia (37% of the market), its Latin American business is targeted on Mexico, where it is the leading private generator with 5,000 MW capacity, and, in particular, on Brazil. In January 2011, it purchased 100% of the Brazilian distributor Elektro (2.17 million customers) for US$ 2.4 billion. In addition, it plans to continue developing hydroelectric projects and is participating in the construction of Belo Monte (over 11,200 MW capacity). To reinforce this specialization in the larger markets, in 2010 it sold its assets in Guatemala to the Colombian enterprise EPM.34
(d) Gas Natural Fenosa: the search for synergies between gas and electricity distribution
This enterprise was formed in 2009 when the Spanish gas distributor Gas Natural took over the Spanish electricity company Unión Fenosa. The outcome, Gas Natural Fenosa, is the only enterprise analysed in this section which explicitly seeks synergies between the electricity business (particularly distribution) and gas distribution. The firm’s assets in the electricity sector come almost entirely from Unión Fenosa.
32 Total disinvestments amounted to US$ 2,155 million in 2002 alone.33 See 2011 results.34 In 2010 it sold the following assets to EPM: its stake in Distribución
Eléctrica Centroamericana II for US$ 300 million; its holding in Generadores Hidroeléctricos SA de CV for US$ 19 million; and its share in Gestión de Empresas Eléctricas SA for US$ 12 million.
The electricity firm started to participate in the region’s privatization processes several years later than Endesa and Iberdrola. In 1997 it purchased the transmission company Transportadora de Electricidad (TDE) in Plurinational State of Bolivia; in 1998 it took over Empresa de Distribución Eléctrica de Metro-Oeste and Empresa de Distribución Eléctrica Chiquirí in Panama, which between them supplied 70% of the market; and in 1999 it gained control of the distributors DEOCSA and DEORSA in Guatemala, and EDENORTE and EDESUR in the Dominican Republic, along with a gas distribution concession in Uruguay and a concession on a power plant in Mexico (250 MW).
En 2000, Unión Fenosa acquired the two distribution companies operating in the Caribbean zone of Colombia (1.3 million customers) and Empresa de Energía del Pacífico S.A. (EPSA), which operates in energy generation, transmission, and marketing; in Costa Rica it was awarded the concession to build and operate Central Hidroeléctrica La Joya; in Nicaragua it took over the country’s two largest distributors (DISNORTE and DISSUR), which together serve 90% of the population; in Mexico it consolidated its operations by taking over two other combined-cycle power plants; and in the Dominican Republic it built two diesel-fired generator plants.
In later years, the firm divested assets that did not fit into its strategy. In 2002, it sold Red Eléctrica de España (REE) the electricity distributor in the Plurinational State of Bolivia; and it sold its holdings in the Dominican Republic’s energy distributors to that country’s government. The purchase of Unión Fenosa by Gas Natural, decided on shortly before the recent financial crisis, required it to sell assets in the region to comply with competition regulations; and it also had to reduce the level of its debt. As a result, a new round of sales was launched, including EPSA in Colombia, for US$ 1.1 billion (2009); the combined-cycle power plants belonging to Gas Natural in Mexico, for US$ 1,465 million (2010), and the distribution companies in Guatemala for US$ 345 million (2011).
The firm’s total installed capacity today amounts to 2,182 MW and it has nearly 3.5 million customers in Latin America, from which it earns 39% of its profits. In Mexico, it is the second largest private generator with 1,900 MW capacity in combined-cycle plants; in the Dominican Republic it has 198 MW; in Costa Rica 51 MW; and in Panama 33 MW. In the distribution segment, it has 2 million customers in Colombia, 800,000 in Nicaragua and 500,000 in Panama.
As of late 2011, the debt reduction process had been completed and Gas Natural Fenosa again started to consider expansion possibilities in Latin America, with a declared growth plan of reaching 2,600 MW capacity in 2012. Its most important project in the region is currently the construction of a wind farm in Mexico, with 230 MW capacity, and a 50 MW hydroelectric plant in Costa Rica.

Economic Commission for Latin America and the Caribbean (ECLAC)164
(e) GDF Suez: vigorous expansion of generating capacity
GDF Suez is the result of a merger between Gaz de France (GDF) and Suez in 2008, and is controlled by the French State which holds 36% of the shares. Half of its business consists of electricity generation, while the rest is divided between sale and distribution of gas, infrastructures, and environmental services.
Its presence in Latin America stems from the Belgian firm Tractebel, which later merged with the French enterprise Suez. Tractebel stated to invest in Argentina in early 1990s, in Chile in 1996, and in Brazil in 1998 by purchasing Gerasul. In 2002, it strengthened its presence in Chile by taking over EDELNOR, and it entered the Peruvian market by buying ENERSUR. Its expansion strategy in the region, combining electricity and gas assets, made it one of the firms worst hit by the Argentine government’s decision to cut off natural gas supplies to Chile (ECLAC, 2005).
GDF Suez is currently the largest private-sector generator in Brazil, with 6,900 MW installed capacity. In Peru, it is the second-largest private generator with 1,043 MW (14% of the country’s total generating capacity) and an investment programme of US$ 2 billion (GDF Suez, 2011). In Chile it is the leading power generator in the north of the country, with 1,739 MW capacity. In 2010 the firm inaugurated the Mejillones liquefied natural gas (LNG) terminal, with an investment of US$ 500 million, making it possible to import liquefied gas for the thermal power plants in the north of Chile. In the same year, it inaugurated the Monte Redondo wind farm, with 48 MW capacity; and it currently has 330 MW of thermal generating capacity under construction.
The GDF Suez strategy consists of integrating its businesses in Europe and North America, and expanding into emerging markets, where it expanded its generating capacity by 2.6 times between 2007 and 2011. In Latin America, it is currently building 5,900 MW of new capacity — more than what it is building in any other part of the world, and more than any other transnational is building in the region. Of this new capacity, 4,400 MW consists of hydroelectric projects in Brazil, including the 3,750 MW Jirau plant, in which it has a 50% stake in partnership with Eletrobras and Camargo Correa. This provides an example of the importance of entering into partnerships with local firms, particularly State-owned, to reduce political and regulatory risks. GDF Suez is
also one of a few electricity firms with major capacity in the engineering and construction area as a comparative advantage (through its Tractebel Engineering subsidiary).
In total, the firm currently has 10,282 MW installed capacity in the region (115,000 MW worldwide) representing 5% of its global sales. Its current strategy of aggressively expanding its generating capacity in Brazil, Chile and Peru will certainly increase this sales percentage in the coming years. In 2011, a total of 323 MW came on stream in Brazil, Chile and Panama, and its income in the region grew by 15%.
(f) Électricité de France (EDF): disinvestment and tentative return
Électricité de France, which is 85% owned by the French State, is one of the largest European electricity companies. In 1992 it joined the consortium that was awarded the tender for the EDENOR distributor in Buenos Aires, in conjunction with Endesa. In 2001, EDF bought out Endesa’s stake, which the latter was forced to sell as a result of its merger with Enersis. In 1996, it entered the Brazilian market purchasing the distributor Light, in partnership with AES and other firms, and UTE Norte Fluminense; in Mexico it participated in tenders to construct a combined-cycle plants. 35
Like all firms operating in Argentina and Brazil, the energy and exchange-rate crisis impaired the performance of its subsidiaries, but EDF was the only large electric power company that decided to withdraw from these countries: in 2002, it sold it distribution assets in Brazil (its stake in Light) to AES, and then divested its holding in EDENOR in Argentina. Lastly, in 2007, it sold all of its generating plants in Mexico to Gas Natural de España for US$ 1.450 billion.
Currently, EDF still owns 90% of the Brazilian thermal plant UTE Norte-Fluminense (869 MW capacity), which represents less than 1% of its global activity. Among transnationals with a presence in the region, EDF is probably the one that has concentrated its business most in Europe, with few prospects for aggressive international expansion. In Latin America, it is developing the renewable energies segment (it has wind farms in Mexico with 67 MW installed capacity, to which a further 324 MW will be added in 2013); 36 and it has signed a co-operation agreement with Eletrobras to evaluate opportunities in Hydro and nuclear energy.
35 Central Anáhuac (Río Bravo II) (495 MW), Central Lomas del Real (Río Bravo III) (495 MW), Central Valle Hermoso (Río Bravo IV) (500 MW), Central Electricidad Águila de Altamira (495 MW) and Central Saltillo (248 MW).
36 See Bloomberg [online] http://www.bloomberg.com/news/2011-04-19/edf-acquires-two-mexico-wind-projects-amounting-to-324-megawatts.html.

165Foreign Direct Investment in Latin America and the Caribbean • 2011
2. The new trans-Latin electric power companies
The first trans-Latin enterprises in the electric power sector were the Chilean firms Enersis and Gener, which took advantage of the reforms and privatizations in other countries of the region to start their international expansion in the 1990s, before being absorbed by Endesa and AES in 1999 and 2000, respectively (ECLAC, 2005). No private enterprise from the region has attempted international expansion since then, but in the last few years a group of State-owned electricals have invested in several other markets in the region, such as the Colombian enterprises EPM and ISA, or are preparing plans to do so, such as the Brazilian Eletrobras.
(a) Empresas Públicas de Medellín (EPM) and Interconexión Eléctrica S.A (ISA): the new Colombian trans-Latin enterprises
Following the reform of electric power sector in Colombia, which began in 1985, some of the firms in the sector were privatized, and a very competitive market was created, with one dominant transmission firm (ISA), but many others in the generating in distribution segments. Today Colombia has three large transnationals: AES, in the generating segment; Gas Natural Fenosa, in distribution, and Endesa in both segments. The other large firms in the sector are State- or municipal-owned, including EPM and ISA, which have embarked upon an international expansion process in the last few years 37.
EPM is wholly owned by the municipality of Medellín, and, apart from its electricity businesses (62% of group sales) it also provides water and gas services in that city, and has telecommunications businesses in Colombia and abroad. In the electricity sector, it owns 23% of Colombian generating capacity, 25% of the distribution market and 6% of transmission. Its first investment abroad involved the construction of the Bonyic hydroelectric plant in Panama, a project that encountered major difficulties and is still under construction. Following this experience, EPM decided to purchase already constructed assets in its international expansion, a process that has gathered pace over the last two years.
In 2010 EPM bought DECA II, GESA and Genhidro in Guatemala from Spain’s Iberdrola, to become the country’s leading energy distributor serving nearly one
37 Another Colombian electricity company with investments abroad is Empresa de Energía de Bogotá, which belongs to the municipality of Bogotá and owns the energy distributors TRECSA in Guatemala and CTM (with a 40% stake) in Peru.
million customers. In 2011 it acquired the distributors DELSUR in El Salvador and ENSA in Panama from AEI of the United States, making it the second-largest distributor in both countries. These subsidiaries increased EPM’s customer base by 1.6 million, and produced US$ 1,597 million in revenue in 2011. EPM has thus become the second-largest player in the Central American electricity market, accounting for 21% of subregional demand by country; and it supplies a large portion of the electricity demand in the three countries mentioned: 51% in Guatemala, 39% in Panama and 22% in El Salvador (ECLAC, 2011b).
For its part, ISA is an enterprise listed on the stock market in which the Colombian State holds 54% of the shares (the remainder are owned by EPM and pension funds). At the present time, in addition to dominating the transmission markets in Colombia (81%) and Peru (82%), it has a large stake in Plurinational State of Bolivia (34%) and in Brazil (16%). In total, it operates a 38,989 km-long high-tension transmission network, together with international connections between the Bolivarian Republic of Venezuela and Colombia, Colombia and Ecuador, and Ecuador and Peru. It also has a construction and engineering subsidiary which sometimes implements its own projects or else acts as a contractor for other firms.
ISA is a special case among electricity firms, firstly because it focuses exclusively on the transmission segment and has not acquired generating or distribution assets;38 secondly, because it has targeted its expansion outside the electricity sector in telecommunications and highways. In telecommunications, ISA began its international expansion in 2009 through the INTERNEXA enterprise, which has consolidated an 18,500 km fibre-optic network throughout Brazil, the Bolivarian Republic of Venezuela, Chile, Colombia, Ecuador and Peru. In 2010, ISA purchase 60% of the highway concession is owned by Spanish firm Ferrovial in Chile (900 km) for US$ 290 million. These investments, and its plans to enter the gas pipeline market, make ISA a specialist provider of linear infrastructures, which, despite a presence in different sectors, operate under a similar business model, involving major initial investments, expropriation of many land plots and regulated income that is constant in the long-term.
38 The law prevents this expansion in Colombia, since firms cannot operate in several segments of the electricity sector, unless they were already operating in them prior to the 1995 electricity reform (such as EPM).

Economic Commission for Latin America and the Caribbean (ECLAC)166
Both EPM and ISA have invested abroad with the main objective of gaining size to increase their profitability, since it was impossible for them to expand further in Colombia for regulatory reasons. They have grown rapidly, often taking advantage of the departure of European or United States firms that abandoned their assets in the region. While ISA has focused its expansion in the transmission segment and other linear infrastructures, EPM has targeted the more open markets of Central America, where it has consolidated a robust position in the distribution segment.
(b) Eletrobras: in pursuit of electricity integration
Eletrobras was created in 1961 as the leading enterprise in Brazil’s electricity sector in all segments. During the deregulation and privatization processes of the 1990s, the firm had several of its functions taken away from it, but the State remains the majority shareholder. It has a total of 12 subsidiaries in generation, transmission and distribution, with 42,302 MW installed capacity, including Brazil’s half of the Itaipú binational power plant. In all, it is responsible for half of Brazil’s electric power generation and 56% of transmission lines (its distribution business is relatively minor).
Eletrobras does not yet have assets operating outside Brazil, but since 2008 it has pursued an internationalization strategy targeting new hydroelectric projects, mainly those that can sell part of their output to Brazil. In South America, there are six projects in portfolio: in Peru (Inambari, 2,200 MW), in the Plurinational State of Bolivia (binational, 2,000 MW, and Cachoeira Esperança, 900 MW), in Guyana (the Potaro River project) and in Argentina (the
Garabí-Panambí 2,200 MW binational power plant). All of these are currently still at the feasibility study phase. Given the complexity of hydroelectric projects on this scale (the announced investment in the Peruvian project is US$ 4.8 billion) and the political problems that can arise along the way, this is a very long-term investment programme, in which it is unlikely that all projects will ultimately be implemented.
The most advanced project is the Tumarín power plant in Nicaragua (253 MW), on which construction work began in late 2011; it is expected to come on stream four years later, with a total investment of around US$ 1 billion. Moreover, the firm does not rule out expansion into other markets outside the region, and in fact in 2011 it attempted to achieve this by bidding for the Portuguese State’s share in EDP, which in the end was sold to a Chinese firm.
Apart from seeking to improve the firm’s financial sustainability, Eletrobras’ international expansion plans fulfil a policy function as the executive arm of international agreements on electric energy, specifically the Brazilian government’s plans to promote hydroelectric capacity in neighbouring countries, part of whose production would be consumed in Brazil. In Central America, its investments have gone hand-in-hand with political cooperation agreements. In addition to this diplomatic function, the firm has other roles in its own country, including responsibility for implementing the parts of energy plans that private firms do not find profitable (expansion of electricity coverage to remote areas) or excessively risky (nuclear generation). It is also the preferred partner of private generators in the larger and more complex hydroelectric projects, such as Belo Monte.
3. The arrival of new Asian firms
The recent expansion of Asian FDI into Latin America (see chapter I) has also been reflected in the electricity sector. Electricity firms from Japan, the Republic of Korea and China have entered the region since 2006; and although their market share in Latin America is still small and confined almost exclusively to Brazil and Mexico, they have major growth potential. In general, they have adopted a strategy of acquiring assets that other European and United States firms have sold.
The Japanese enterprise Mitsui entered the Mexican generation market by purchasing the Valladolid III power plant in 2006 (563 MW). In 2010 it acquired Gas Natural’s plant in that country for US$ 1,465 million, which the
latter was forced to sell when it merged with Fenosa in the previous year. Its share of these assets represents total capacity of 1,646 MW, making it the country’s third-largest private generator. Similar generating capacity is held by the partnership between Mitsubishi and Kyushu, two other Japanese firms with three generating plants that came on stream between 2001 and 2006.
Mitsui and Mitsubishi are large highly diversified conglomerates with a presence in many countries across the world, whereas Kyushu is exclusively an electricity firm with its business centred in Japan, but with generating assets in China, the Philippines, Taiwan Province of China, Singapore and Viet Nam, in addition to Mexico.

167Foreign Direct Investment in Latin America and the Caribbean • 2011
The three are private enterprises, unlike the other Asian firms with a presence in the region. The first of these is Korea Electric Power Corp (KEPCO), a firm with few investments abroad, basically in other Asian countries. In Latin America, they are building a 433 MW capacity combined-cycle plant with a total investment estimated at US$ 430 million, in partnership with Samsung, another Korean company, and the Argentine enterprise Techint. In 2011 KEPCO acquired 40% of the distributor Jamaica Public Service Company for US$ 288 million.
In the case of Chinese firms, the only asset owner in Latin America is State Grid, the largest electricity transmission and distribution enterprise in China (in fact the largest electricity company in the world by sales), which in 2010 spent US$ 1.7 billion to obtain various electricity distribution concessions in Brazil (ECLAC, 2011a). This has been State Grid’s largest acquisition
outside China to date; and the firm has confined itself to acquiring ownership, while leaving the previous managers in their posts. The other firm with activity in the region is Synohydro, which thus far has been limited to building power plants for third parties (always with financing from the Chinese State bank), although it has also announced its intention to purchase assets.
Lastly, the Chinese State enterprise Three Gorges Corporation in late 2011 paid US$ 3,516 million for the 21% stake in EDP that was still owned by the Portuguese State. Although most of EDP’s assets are in Europe, this transaction, motivated by the financial difficulties faced by the Portuguese Government, made the firm a major player in the Brazilian market, where it has 2.6 million customers in the distribution segment and 1,746 MW generating capacity. In fact two Brazilian firms in the sector Eletrobras and Cemig, also bid for that share.
4. New renewable energy firms
All of the large electricity firms discussed thus far have developed some generating capacity using new renewable energy sources. Nonetheless, the special characteristics of this segment (strong growth, rapid technical progress, and highly changeable regulatory frameworks) mean that the business model still differs from the rest of the sector, and it is largely controlled by specialized firms. Many of the large electricity firms that invest in this segment do so through specialist subsidiaries, such as Enel Green Power, CPFL Renováveis or Iberdrola Renovables, which recently has been reabsorbed by the parent company for financial reasons.
The first characteristic that distinguishes the new renewable energies from the rest of the sector — specifically wind power, which is the most developed — is the smaller scale of the projects (see box IV.1), which lowers entry barriers. These barriers are lowered still further if the project is mainly financed with debt, as is usually the case, thereby reducing the capital contribution necessary from the firm in question to no more than 30% of the total cost. This level of leverage is possible because most wind farms have been developed with long-term PPAs, and because nearly all of the production cost is fixed capital which is invested at the start of the project.
In addition, a very large proportion of this initial investment represents the cost of components, which makes manufacturers extremely important.39 In a young industry
39 In the case of photo-voltaic energy, the panels represent 60% of the cost of installation of a solar park. In terms of wind power, the turbines account for 70% of the cost (BNDES). The Intergovernmental Panel on Climate Change (IPCC) estimates between 71% and 76%
subject to rapid technical progress, these manufacturers have a growth strategy that enables them to lower costs and attempt to internalize the technical progress that they themselves are making. For that reason, many component manufacturers are also entering the power generation segment, such as Vestas, Alstom or ACCIONA in the wind power market. In the photovoltaic solar segment, panel manufacturers such as Sun Tech Power started to invest in generation in 2008, and the trend continues today (REN21, 2011).
Low entry barriers, combined with a trend among component manufacturers to also invest in generation, have produced a highly atomized sector. In terms of wind power investments in Latin America, the leading firms are SN Power (Norway), ACCIONA, Abengoa and Gamesa (Spain) and IMPSA (Argentina), alongside Brazilian enterprises such as Renova Energia or CPFL Energia, in addition to most of the traditional electricity firms mentioned in the foregoing subsections.
This pursuit of scale among equipment manufacturers is generating excess capacity in the industry, which favours project developers and makes it possible to reduce the final cost of the energy produced. In contrast, it imposes difficulties on the manufacturers as shown by the weak performance of the shares of these firms in stock markets. In 2010 the WilderHill index, which tracks the return on shares in firms specializing in this segment, performed
for the turbine, between 10% and 12% for connection, and between 7% and 9% for civil works (IPCC, 2011).
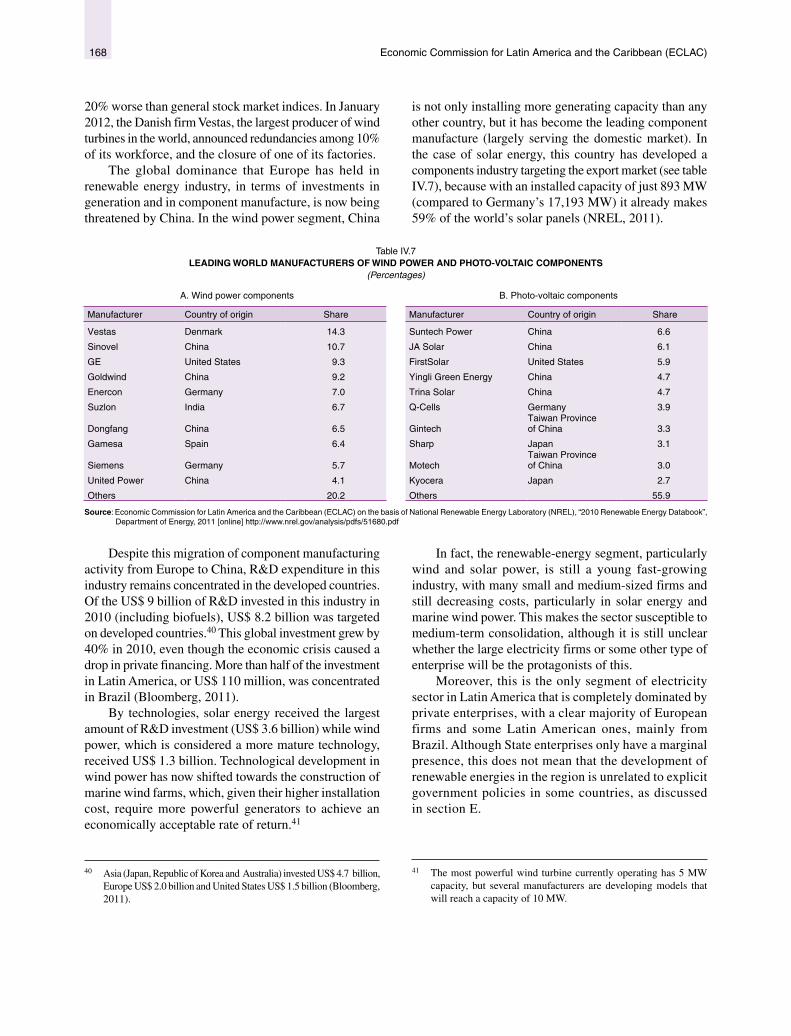
Economic Commission for Latin America and the Caribbean (ECLAC)168
20% worse than general stock market indices. In January 2012, the Danish firm Vestas, the largest producer of wind turbines in the world, announced redundancies among 10% of its workforce, and the closure of one of its factories.
The global dominance that Europe has held in renewable energy industry, in terms of investments in generation and in component manufacture, is now being threatened by China. In the wind power segment, China
is not only installing more generating capacity than any other country, but it has become the leading component manufacture (largely serving the domestic market). In the case of solar energy, this country has developed a components industry targeting the export market (see table IV.7), because with an installed capacity of just 893 MW (compared to Germany’s 17,193 MW) it already makes 59% of the world’s solar panels (NREL, 2011).
Table IV.7 LEADING WORLD MANUFACTURERS OF WIND POWER AND PHOTO-VOLTAIC COMPONENTS
(Percentages)
A. Wind power components B. Photo-voltaic components
Manufacturer Country of origin Share Manufacturer Country of origin Share
Vestas Denmark 14.3 Suntech Power China 6.6
Sinovel China 10.7 JA Solar China 6.1
GE United States 9.3 FirstSolar United States 5.9
Goldwind China 9.2 Yingli Green Energy China 4.7
Enercon Germany 7.0 Trina Solar China 4.7
Suzlon India 6.7 Q-Cells Germany 3.9
Dongfang China 6.5 GintechTaiwan Province of China 3.3
Gamesa Spain 6.4 Sharp Japan 3.1
Siemens Germany 5.7 MotechTaiwan Province of China 3.0
United Power China 4.1 Kyocera Japan 2.7
Others 20.2 Others 55.9
Source: Economic Commission for Latin America and the Caribbean (ECLAC) on the basis of National Renewable Energy Laboratory (NREL), “2010 Renewable Energy Databook”, Department of Energy, 2011 [online] http://www.nrel.gov/analysis/pdfs/51680.pdf
Despite this migration of component manufacturing activity from Europe to China, R&D expenditure in this industry remains concentrated in the developed countries. Of the US$ 9 billion of R&D invested in this industry in 2010 (including biofuels), US$ 8.2 billion was targeted on developed countries.40 This global investment grew by 40% in 2010, even though the economic crisis caused a drop in private financing. More than half of the investment in Latin America, or US$ 110 million, was concentrated in Brazil (Bloomberg, 2011).
By technologies, solar energy received the largest amount of R&D investment (US$ 3.6 billion) while wind power, which is considered a more mature technology, received US$ 1.3 billion. Technological development in wind power has now shifted towards the construction of marine wind farms, which, given their higher installation cost, require more powerful generators to achieve an economically acceptable rate of return.41
40 Asia (Japan, Republic of Korea and Australia) invested US$ 4.7 billion, Europe US$ 2.0 billion and United States US$ 1.5 billion (Bloomberg, 2011).
41 The most powerful wind turbine currently operating has 5 MW capacity, but several manufacturers are developing models that will reach a capacity of 10 MW.
In fact, the renewable-energy segment, particularly wind and solar power, is still a young fast-growing industry, with many small and medium-sized firms and still decreasing costs, particularly in solar energy and marine wind power. This makes the sector susceptible to medium-term consolidation, although it is still unclear whether the large electricity firms or some other type of enterprise will be the protagonists of this.
Moreover, this is the only segment of electricity sector in Latin America that is completely dominated by private enterprises, with a clear majority of European firms and some Latin American ones, mainly from Brazil. Although State enterprises only have a marginal presence, this does not mean that the development of renewable energies in the region is unrelated to explicit government policies in some countries, as discussed in section E.
41 The most powerful wind turbine currently operating has 5 MW capacity, but several manufacturers are developing models that will reach a capacity of 10 MW.
169Foreign Direct Investment in Latin America and the Caribbean • 2011
E. The recent development of renewable energies in Latin America and the Caribbean
Renewable energies, particularly wind power, have taken off in Latin America in the last two years, somewhat later than in the European countries that are the pacemakers in this industry. The vigorous growth of generating capacity has been concentrated in Brazil and Mexico, and has mostly been promoted through investments by transnationals, particularly European ones.
The previous section showed that the renewable energy business model means that electricity firms see it as different from the rest of electricity sector. For most of the region’s governments, it is also a special sector that requires incentives and support policies (Coviello, Gollán and Pérez, 2012). The reasons for this support, more or less intensive depending on the case, are as follows: (i) a desire to reduce reliance on imported fuels to produce electricity; (ii) the commitment to reduce CO2 emissions and other atmospheric pollutants; and (iii) the intention to develop local capacities in a highly dynamic industry with a high R&D content. These considerations have motivated policies to support renewable energies which in some economies of the region have facilitated investments.
Brazil promoted wind power in 2004 with the programme of Incentives for Alternative Energy Sources (PROINFA). Under this programme, capacity was auctioned to the best bidder in each of the technologies (biomass, mini-hydroelectric, and wind power) and this guaranteed the entrepreneur a long-term return to justify the investment. Although the programme initially had difficulties in attracting projects, these were overcome and the targets set for installed capacity are now close to being attained.
Although implementation of PROINFA ended in 2011, since 2009 wind power generation has been promoted mainly through energy auctions open to all technologies in which it gained an increasingly large share. In these auctions, wind power enterprises have benefited from the shortage of gas in Brazil, which makes thermal plants uncompetitive, and the fact that the auction reserves a quota for power plants that could come on stream within three years, a period that is too short for the large hydroelectric plants. With these conditions and considerable support from the Brazilian Development Bank (BNDES), which finances virtually 90% of the country’s wind farms, wind-power capacity in early 2012 amounted to 1,500 MW of installed capacity (1% of the total) with 6,700 MW under construction and development.
The leading wind power firms are Renova Energia, CPFL and Dobreve (Brazil), IMPSA (Argentina), ContourGlobal (United States), Martifer (Portugal) and Elecnor and Iberdrola (Spain). As in many other countries, this is a highly atomized sector, where small firms from other segments, and even private individuals, have built wind farms. A large portion of these new undertakings could face problems in implementation within appropriate timeframes: the Brazilian government estimates that 77% of planned wind power capacity faces some type of obstacle to its development, compared to just 8% in the case of hydroelectric energy.42 Development of this sector is expected to concentrate ownership in a smaller number of larger firms, which achieve greater efficiency in maintenance of the wind farms.
The fact that the development of wind power in Brazil does not depend on a government subsidy means it is considered sustainable in the future;43 and this, together with local content regulations in the construction of the wind farms,44 has encouraged nearly all of the world’s major component manufacturers to set up assembly plants in the country, except for the Chinese firms that are concentrated in their local market. Major investments in turbine assembly plants have been made by Alstom (France, US$ 28 million), General Electric (United States, which expanded its hydroelectric turbine plant to also run wind turbines), Gamesa (Spain, US$ 29 million), IMPSA (Argentina, US$ 78 million with expansion plans for a further US$ 169 million), and the ENERCON group of Germany. All of these companies were set up in 2011 or are in the process of expansion; Vestas, Siemens and Suzlon are considering setting up plants also in Brazil.
Mexico has not implemented an explicit programme to support the wind power sector, but, since its energy
42 National Electric Energy Agency (ANEEL) [online] http://www.aneel.gov.br/area.cfm?idArea=37.
43 Despite not providing an explicit subsidy, there are two features of the Brazilian regulatory framework that give an advantage to wind power. Firstly, the charge for reliability — an extra cost that firms pay to have greater capacity in the system — is distributed equally between all generators, ignoring the fact that wind power, given its intermittent nature, ought to contribute more than other sources. Secondly, electricity transmission costs are also distributed equally between all generators, even though most wind power plants and large-scale hydroelectric plants are in places that require greater investment in the transmission network.
44 These regulations are particularly stringent for the project to receive financing from the BNDES.
Economic Commission for Latin America and the Caribbean (ECLAC)170
sector reform in 2008 it has developed a number of mechanisms that facilitate investment in wind farms, such as the “postage stamp” rate, net energy metering or the energy bank.45
In late 2011, there was 569 MW capacity on stream and 1,333 MW under construction, with work set to begin on another 1,277 MW. The vast majority of these projects adopted the self-supply modality, which means that the generator firms promoting the project enter into partnerships with large consumers to generate the energy that the latter purchase. Although the first major wind farm in Mexico (Venta I, of 85 MW) belongs to the State enterprise CFE, subsequent ones were built mainly to supply large-scale customers such as the cement producer CEMEX (250 MW Eurus wind farm project) or Wal-Mart.
Unlike what happened in Brazil and elsewhere, in Mexico, wind farms have almost exclusively been large-scale, all of them owned by large firms. This has partly reflected regulatory factors (self-supply is used in Mexico, but capacity auctions in Brazil), but also owing to different development conditions of the wind farms on the ground and, in particular, in terms of relations with the affected communities. Unlike Brazil, where land is generally owned by large-scale proprietors which sometimes are the same as those who are promoting the construction of a wind farm, in the centre and south of Mexico, land ownership is normally communal, with very incomplete titling. For this reason, the process of obtaining land-use permits and management of the affected communities poses a potential obstacle to the development of wind farms in one of the zones of Mexico with the most wind resources.46
The potential for developing renewable energies in Mexico can also stem from electricity demand in the United States. Mexican sector regulations allow the construction of plants (under any technology) to export electricity, and currently there are several thermal plants set up for this purpose. Renewable energies also benefit from the regulations prevailing in California, which require electricity distributors to use a certain percentage of renewable energies; and, in fact, Mexico exports much
45 The energy bank is perhaps the most important of these mechanisms: it consists of a system in which wind energy that is not consumed by the user (typically at times of high wind) is absorbed by the CFE and delivered when necessary (when the wind subsides). The generator can store this virtual energy in its “‘bank”‘ for a 12- month period. As a large public enterprise, the CFE can absorb the intermittent nature of this energy through the energy bank, but this role might prove unsustainable in the event of a major expansion of wind power.
46 It is estimated that more than half of all wind power projects that participated in the latest tender (open season) will not go ahead, because they have not obtained the necessary land-use permits. The installation of large-scale wind farms entails negotiating permits with up to 400 different owners, many of whom do not have their ownership titles in order.
of the output of the Cerro Prieto geothermal plant to the United States.
The leading investors in wind power in Mexico are ACCIONA and Gas Natural Fenosa of Spain, and EDF of France, while the State enterprise CFE has a small-scale project under construction. This makes wind power the only segment of the Mexican electricity industry that is clearly dominated by transnational private investors.
Uruguay is the country in the region that has invested most enthusiastically in wind power with a view to reducing the proportion hydrocarbons in energy generation. Its objective is to have a generation structure that is 90% based on renewables by 2015, including 15% wind power and 13% biomass. Since 2009, the government has held two wind power tenders for long-term PPAs with a capacity of 150 MW each. Both were fully subscribed by a group of consortia, including many transnational firms. In the first tender, the winning bids were in a range of between US$ 80 and US$ 85 per megawatt; but in the second, the prices fell to a range of US$ 62 to US$ 65 per megawatt. Most of these projects are still in the construction phase, so wind-power capacity in late 2010 was just 40 MW.
In Central America, wind power is developing relatively strongly. Costa Rica has 119 MW installed and Nicaragua 63 MW,47 representing 5% and 6%, of each country’s generating capacity respectively. In Honduras, the Globeleq firms, owned by the Actis Investment Fund (see box IV.3), in December 2011 started to operate the Cerro de Hula wind farm (102 MW, 6% of the country’s capacity). The same firm has a majority holding in PESRL (Plantas Eólicas S.R.L.) and a 23 MW power plant in Costa Rica (see [online] http://www.globeleq.com). In addition, there are major plans for the construction of wind farms in the Dominican Republic, El Salvador and Panama.
Chile was one of the first countries in the region to operate a wind farm, and thus far 202 MW has come on stream. Despite the high price of electricity in Chile, which made wind power competitive, the development of this sector has been held back by the energy--contracting system. The first wind farm to win a tender in Chile was Monte Redondo owned by GDF Suez, which was awarded a 14-year PPA, at a price of US$ 108 per megawatt; and in early 2012 another 150 MW wind farm signed an PPA with a mining company. The fact that the zones of the country with an abundance of wind are not well connected to the transmission network considerably raises the costs of wind power projects. In any event, wind farms are expected to be built as legislation comes into force making it compulsory to generate 10% of energy using non-conventional renewable sources by 2024. The lack
47 2010 data.

171Foreign Direct Investment in Latin America and the Caribbean • 2011
of wind resources, compared to hydro resources, has also held back development in Colombia, which only has one 110 MW wind farm that was developed more as a research project than as a business prospect.
In fact, wind power in 2011 has consolidated its position as a competitive alternative in a many of the region’s countries. Unlike what happened in Europe, where this technology was developed on the back of public subsidies, Brazil, Mexico and other Latin American countries have offered the conditions needed for it to compete on price with other energy sources. The most recent wind power projects presented in Mexico, Uruguay and Brazil have undertaken to sell their electricity at US$ 67, US$ 62 and US$ 56 per MW, respectively. The reasons for this success are summarized below.(i) Natural resource: wind power has only taken off in
countries with zones of strong winds that are also well connected to the transmission grid. As Brazil has a grid that connects the entire country, it has been able to exploit its wind resources; Chile in contrast does not have such zones, and has thus far been unable to do so.
(ii) Technical progress. Wind power generators have become much more efficient over the last few years, and Latin American countries that have developed wind power in the last two years have been able to take advantage of this improvement better than their European counterparts that had started earlier.48 Also important has been progress in measuring winds in zones with potential, a key process for developing the industry, which in many Latin American countries is still incipient.
(iii) Idle capacity in the industry, owing to less investment in Europe and the expansion of capacity among component manufacturers. This has triggered a component price war which, in conjunction with the aforementioned technical progress, has substantially lowered the per-MW price of installed capacity. In Brazil, for example, it is estimated to have fallen by up to 50% in local currency terms.49
(iv) Availability of financing: Countries that have developed wind power offered project financing facilities to wind farm developers, particularly through long-term PPAs, or access to privileged official financing. The counterexample would be Chile, where, despite investor interest, the functioning of the electricity market does not make it possible to put forward projects that banks could finance.
(v) Regulatory measures. Albeit without direct subsidies, Brazil and Mexico have created a regulatory framework
48 Progress from now on is expected to be relatively more modest, or merely aimed at developing mega-generators for offshore wind power production.
49 Source: Interview with BNDES.
that encourages the development of wind power. The cornerstones are long-term contracts that guarantee an income to the generator and considerably facilitate project financing, together with mechanisms that make it possible to cushion the variability of energy production. In Mexico, this has been achieved through the energy bank, whereas in Brazil, the variability of supply is assumed by all generators through a reliability charge. Both cases conceal an indirect subsidy to producers of this type of energy, since they do not fully internalize the intermittent nature of their production.Other technologies have had much less spectacular
development, although some have gained relative importance in the region.
Biomass generation is present, to a greater or lesser extent, in nearly all countries, but has developed most in Brazil (5% of electricity generation) and Guatemala (11%), and also in other Central American countries. In the vast majority of cases, electricity is produced by burning the residues of sugarcane, for which reason its development is linked to this crop in particular, and, to a lesser extent, to the timber industry. Development plans in this segment aim to keep generating plants operating throughout the year.
Small-scale hydroelectric plants, like biomass generators, have been developed continuously in many countries the region; but in some cases, such as Brazil or Uruguay, the development of this technology has faltered in the last two years because it has been unable to compete with wind power. In countries where wind resources are scarce however, such as Chile or Colombia, this technology has continued to receive investment.
Geothermal energy is another energy source with a long track record. It has good development potential in Latin America (the resource is concentrated in zones of high seismic activity), but thus far it is only important in a few Central American countries and Mexico (2% of total generating capacity). Mexico has the world’s largest plant (owned by CFE), with an installed capacity of 645 MW. Although there are no major expansion plans on a regional scale, it could become an important energy source locally. In this regard, a key project is the construction of a biomass plant in Saint Kitts and Nevis, which in an initial stage will have a 10 MW capacity, but has the natural resources needed to expand considerably (see [online] http://www.westindiespower.com).
Photo-voltaic solar energy had hardly developed at all in Latin America by the second half of 2011, when the first parks were connected to the grid in Brazil and Argentina. This segment is being driven by a fall in the price of solar panels. Although in 2009 prices had dropped by 38%, in 2010 they fell a further 14%, and the trend in 2011 has

Economic Commission for Latin America and the Caribbean (ECLAC)172
continued in the same direction, thanks to a considerable expansion of production capacity, particularly in China (REN 21, 2011, p. 21). In Europe, solar panels have recently reached a level of 1.2 Euros per watt (US$ 1.6) — a cost reduction of 70% compared to 10 years ago (EPIA, 2011). At the end of 2011 Tsolar of Spain raised the financing to begin building a 44 MW plant in Peru, which will be connected to the grid in late 2012. By that time, it is estimated at 131 MW of photo-voltaic plants will be functioning throughout the region, and by 2016 the figure could rise to 1,600 MW (Bloomberg, 2012).
Many Latin American and Caribbean countries have official targets for electric power generation using non-conventional renewable sources that will require them to promote these energy sources over the next few years: Peru will attain 5% of its capacity in 2013, Chile 10% in 2024, Mexico 35% in 2026, and the Dominican Republic will produce 500 MWh of wind energy in 2015 (15% of its current capacity).50 With or without specific targets, many of the region’s countries have taken steps to boost the development of new renewable energies in the last few years.51 In addition to the region’s renewable energy projects, countries can benefit from emissions reduction certificates issued under the Kyoto Protocol, which enable them to receive emissions credits that can be traded on European Union markets.52
Another factor promoting non-conventional renewable energies is the desire among certain private companies to reduce the carbon footprint of the electricity they consume. The firms’ intention is, firstly, to improve their public image as major polluters and, secondly, to protect themselves against possible trade barriers on projects with a large carbon footprint. The first case could include Wal-Mart in Mexico; the second includes CEMEX in Mexico and CODELCO (with a 1 MW solar park) and the Los Pelambres mining company in Chile. Small-scale consumers could also have the opportunity to reduce their
50 Mexico’s production will use clean energy sources, including large-scale hydroelectric and nuclear energy. Nonetheless, given the timeframes involved in constructing nuclear power plants (there is no planning yet) and the difficulties in setting up large-scale hydroelectric plants in Mexico, nearly all of the investment needed to reach this level will come from non-conventional renewable energy sources.
51 Although Ecuador has not yet received investments in renewable energies, in 2011 it adopted a system of regulated rates to promote them (see [online] http://www.renewableenergyfocus.com/view/17982/ecuador-adopts-feedin-tariffs/).
52 The Eurus project of ACCIONA in Mexico earned 6 million tons of CO2 credit in 10 years, which, depending on the price at which it can be sold on the fluctuating emissions market, could earn between US$ 5 million and US$ 10 million per year (the investment cost of the project was estimated at US$ 295 million).
carbon footprint if “green tariffs” were implemented in the region. This provides the opportunity to consume electricity generated with renewable sources, for which a higher price is normally paid. Worldwide there are over 6 million customers with these systems, of whom 2.6 million are in Germany.
More important could be the trend of international agreements on climate change mitigation and the potential inclusion of Latin American countries — thus far exempt — from emissions reduction obligations. The reduction in CO2 emissions being achieved by using renewable energies is still a very small part of what the world’s governments have stated as their objective. Although the details of emission reduction programmes in Latin America and other developing regions are poorly known, there is an unequivocal trend towards containing emissions that can only favour the medium-term expansion of renewable sources of electricity.
This expected growth of renewable energies will have implications throughout the electricity system, mainly in terms of backup capacity for intermittent sources and the adaptation of distribution grids. The IEA estimates that for each 5 MW of capacity in variable renewable sources, 1 MW of flexible capacity is needed to ensure the system can deliver electricity at times of high demand (IEA, 2011a). Worldwide, it is estimated that this will represent 8% of all non-variable capacity additions until 2035, and that this additional capacity (which will remain partly idle) will add between US$ 3 and US$ 5 to the per-MW cost.
The need for idle capacity in the system could be reduced by improving transmission grids and interconnection between regions and countries. This will be all the more necessary the greater the distance separating production and consumption zones: for example, in the case of wind power in Brazil, concentrated in the north of the country, while consumption is mainly in the south. Estimates of the additional cost vary between US$ 2 and US$ 13 per MW. In addition, there is a further US$ 1 to US$ 7 per MW needed to improve the systemic balance through flexible generation, energy storage, or smart grids. To contextualize these investments, it is worth noting that just 3% of all investments foreseen in transmission and distribution from now until 2035 will be destined for adjusting the increase in intermittent renewable energies. These smart grids (in reality a continuous improvement in distribution grid possibilities) pose a challenge for transmission firms, which will need to make large investments in the future to deal with these changes (see box IV.3).
173Foreign Direct Investment in Latin America and the Caribbean • 2011
Box IV.3 SMART GRIDS
Smart grids use advanced technologies (mainly digital) to monitor and manage the flow of electricity. This is not a specific technological solution, but a set of solutions that allow for greater information exchange at all levels of the system. There are two key components of smart grids: transformation of the distribution network from unidirectional to multidirectional, which allows for distributed generation; and management that is better adjusted to electricity supply and demand, which makes it possible to introduce intermittent energy sources, such as wind, solar, and pass-through hydroelectric, in a more reliable way.
The many potential advantages of introducing smart grids include: (i) a more reliable electricity service and better quality; (ii) lower labour costs in the distributor firms as a result of increased automation; (iii) smaller distribution and transmission losses; (iv) the possibility for customers to adapt their consumption according to systemic needs and thus reduce their expense; and (v) greater systemic capacity to incorporate energy produced through distributed generation and intermittent energy sources. Given their ability to increase efficiency in consumption and promote electricity generation with non-conventional renewable energies, smart grids are one of the most promising tools for making the electricity system more sustainable.
Although the distributors will be responsible for leading the necessary
investment, the smart grid system will require collaboration from firms in other sectors, such as manufacturers of equipment for electricity grids, the information and communications technologies industry, and construction firms (IEA, 2011b). Apart from the electricity system, the presence of smart grids in increasing numbers of markets will have a significant impact on the expansion of electric-powered vehicles and the manufacture of “smart” electrical appliances, the market for which, according to the European Commission (2011), is set to grow from US$ 3.06 billion in 2011 to US$ 15.12 billion in 2015.
Smart meters have been the tool most widely used in smart grid components thus far. In Europe, 75% of the ‐5.5 billion invested in smart grids over the last decade was applied to projects to introduce smart meters. As the use of such meters spreads, other solutions will gain importance, and it is estimated that just 15% of future smart grid investments in will be on meters (European Commission, 2011).
The development of smart grids will represent a major additional investment effort for the distribution companies. Part of this will be recoverable through smaller losses and service quality improvements, which can be passed on to consumers through price increases. Nonetheless, other benefits of smart grids, such as the capacity of the system to include intermittent energy sources, will have repercussions on
the other system players. For this reason, a regulatory incentive or public subsidy will be needed to ensure optimal investment.
The development of smart grids has a long way to go in Latin America, and will be driven largely by the desire to reduce losses in electricity distribution. As is the case in other innovative technologies, transnational enterprises with experience in this field will have a competitive advantage that they can exploit in the region. Enel is in a key position in this regard, since it is the firm that has developed the expansion of smart meters most in Europe, with almost 9 million customers in its distribution businesses in Latin America.
Enel stresses this aspect in its strategic plans and identifies Brazil and Chile as markets where smart meter implementation will begin. In both countries, the firm is implementing pilot “smart cities” projects, combining the distribution of smart meters with other measures, such as automatic remote control of the medium-voltage grid, installation of more efficient street lighting and recharging systems for electric automobiles. Thus far, the largest project for installing smart meters in Latin America is being undertaken by another Enel subsidy in Brazil (Ampla), with an investment of US$ 432 million, covering over 540,000 customers in Río de Janeiro state. As a result of this intervention, the firm has cut its energy losses by 5.6%.
Source: Economic Commission for Latin America and the Caribbean (ECLAC) on the basis of Michele De Nigris and Federico Bernardelli, “Redes inteligentes de energía (smart grids) en América Latina y el Caribe: viabilidad y desafíos”, paper presented at the Regional Conference on smart energy grids (Santiago, Chile, 12 and 13 October 2010), Santiago, Chile, 2010; European Commission, “Smart Grids: from innovation to deployment”, 2011; International Energy Agency (IEA), “Technology Roadmap: Smart Grids”, 2011; Michele de Nigris and Manlio F. Coviello, “Smart Grids in Latin America and the Caribbean”, Santiago, Chile, Economic Commission for Latin America and the Caribbean (ECLAC), forthcoming.
F. Challenges and prospects
In the next few decades Latin America’s electricity sectors will have to make major investments to expand and improve the service they provide and upgrade their infrastructure. The IEA estimates that the region will need to invest US$ 404 billion in generation, and US$ 313 billion in transmission and distribution by 2035.53 The challenge is to make these electricity systems more secure, competitive, sustainable and inclusive.
53 This estimated investment does not include Mexico. The figures are expressed in dollars at constant 2010 prices (IEA, 2011a).
The electricity sector has received very large FDI flows, and transnational companies have a very important role in most of the region’s markets. Nonetheless, unlike what is happening in telecommunications infrastructure, these transnationals do not completely dominate the industry, but coexist with a number of large public-sector enterprises. In view of this, and the strict regulatory control exerted by governments on the electricity sector, the investment decisions that will need to be taken to ensure systemic expansion need to be the responsibility of both sectors.

Economic Commission for Latin America and the Caribbean (ECLAC)174
The sector’s reform and privatization processes attracted major FDI flows between 1996 and 2001, but most of the investment was used to buy existing assets, which merely involved public enterprises being replaced by private firms. The reform programme called for increased investment by the private sector, but the firms in question did not always expand capacity at the expected rate, and, in many cases in later years, there was a reduction in total investment in energy infrastructure.
This process involving the sale of certain assets and deregulation of market segments came to an end in 2001, since when there has been no new large-scale privatization and very few nationalizations. The public enterprises, which all countries have preserved to a greater or lesser extent, with the single exception of Chile, have become a tool of energy policy that is very useful on several fronts. In some countries, these firms play a social role by distributing electricity in rural and remote areas that are of no interest to private investors. Others operate as catalyst partners for private investors by implicitly offering political support for certain projects. In other cases they are a tool to undertake investments that do not have assured profitability, but could be worthwhile from the standpoint of balance in the generating structure or technology policy.
In the last few years, three of the largest State-owned electricity firms, the Colombian ISA and EPM, and Brazil’s Eletrobras, have embarked on the internationalization path. In the first two cases, the strategy reflects a need for the firm itself to grow, which is impossible in the local market; in the case of Eletrobras, however, the strategy forms part of government policy on electricity integration with neighbouring countries and development cooperation in Central America. FDI by State firms is not exclusive to Latin America: many of the largest transnational electric power companies, such as GDF Suez or Enel are State-owned, as is State Grid, Kepco and most of the Asian firms in the sector.
Apart from public investment, governments act in the electricity market through regulations aimed at encouraging private investment. The behaviour of this investment, most of which is in the hands of transnationals, varies greatly between the different countries of the region, since the regulatory frameworks governing such investment vary widely. The Latin American experience shows that private ownership and management of electricity assets is not necessarily synonymous with greater investment, universal quality service or low prices; but private investors have helped to increase generating and distribution capacity in most countries. Although private investments slumped between 2001 and 2006, transnational firms have since resumed their plans for investment in new capacity, attracted by the sustained increase in demand and stable regulatory frameworks that are generally private-investment-friendly.
The proportion of private generation has grown in Brazil, Mexico, Peru and Central America. In Chile, the number and size of investment projects undertaken has also increased. This expansion does not affect all countries equally: whereas investment in Mexico has been held back by excess capacity, in Argentina, the Bolivarian Republic of Venezuela and the Plurinational State of Bolivia, private firms have not yet found the incentives needed to invest and in some cases have been nationalized.
The international situation of stalled demand for electricity in the developed economies, and many emerging markets that are closed to FDI in this sector, is helpful for attracting FDI into the sector in Latin America. Although the European companies were affected by economic problems in their domestic markets, owing to smaller profits and more difficult access to credit, the expansion opportunities offered by Latin American markets would be exploited by Asian firms or those from the region itself, as to some extent has been happening in the last two years.
In general, FDI may continue to be channelled into the region’s electricity sector, and may even increase, boosted by a possible process of asset restructuring of and enterprise consolidation. In Latin America, the nine largest transnationals between them have less than 50,000 MW generating capacity, 16% of installed capacity in the region, which shows that the sector is less concentrated than others, such as telecommunications or the automotive industry for example. In the short run, however, consolidation will probably be confined to specific countries and market segments, such as wind power generation, which is currently highly fragmented.
Investment in new capacity is likely to maintain the pace of the last few years, driven by good prospects for demand growth, which in some South American countries depends largely on growth in the mining sector and other natural resource-based industries. The expansion of non-conventional renewable energies and smart distribution grids will also tend to promote private investment in the sector. In some economies thus far dominated by State firms, certain generating projects might be opened up to private investment; and, as a result, the role of transnational corporations as builders of generating plants could extend to ownership and management.
As noted above, a large proportion of the FDI in the electricity sector was used to acquire existing assets, in a corporate restructuring process that demonstrates the interest that exists among transnationals to expand their presence in the region, but does not add new capacity to electricity systems. To increase this capacity, apart from a regulatory framework that enhances the profitability of existing assets, conditions are needed that make it easier to implement new projects. These include offering investors a system for assessing and mitigating environmental and social impacts
175Foreign Direct Investment in Latin America and the Caribbean • 2011
which, without neglecting due care of the environment and the rights of affected communities, affords certainty to the decision-making process and provides guarantees on acquired rights. Electricity firms perceive that the risk of large generating and transmission projects being derailed by protests in the affected communities, even in projects currently under construction, has increased significantly in the last few years; and this could hamper investment in new capacity which the region’s economies need.
Apart from attracting investments to expand generating and distribution capacity, governments have a special role to play in promoting a balance in the electricity generation structure, which reflects the country’s natural conditions and ensures electricity can be produced at a reasonable price with secure long-term supply. Restricting investments in generating capacity to sources that offer the best financial return at a given moment has long-term implications for the country’s energy security and for the value chain of technologies that are momentarily ignored. For this reason, the governments of Brazil and Uruguay, for example, are considering specific measures to support biomass, which is in danger of extinction owing to the recent success of wind power.
Climate-change-mitigation measures will be decisive for the future of the sector. Apart from policies that promote efficient electricity use, the most important measures in this regard will seek to replace the most polluting generating sources by cleaner alternatives and, where possible, by renewable energies. Both unilateral measures taken by the region’s governments, and a future multilateral agreement on climate change mitigation that includes developing economies, will almost certainly tend to raise emissions reduction targets and, therefore, encourage electricity production using renewable sources (and nuclear energy). At the present time, many Latin American countries are implementing specific policies to increase the use of renewable energies. These regulatory incentives will be supported by decreasing production costs, as has happened in the last few years with wind power, and is currently happening with solar power, rendering projects in regions with good natural resources competitive.
This technical progress, in conjunction with support policies, will underpin the growth of renewable energies over the next few years. The IEA estimates that in the coming decade, the use of renewables will increase on a broadly uniform basis, irrespective of the political scenario in question; but in 2020-2035, growth will be much greater if governments adopt measures to restrict global warming to a tolerable range (AIE, 2010 and 2011a).54
54 This is the “450 Scenario”, because it limits the concentration of CO2 in the atmosphere to 450 particulates, which climate models equate to a rise in temperature of 2°C.
In fact, although the growth of renewable energies thus far (2.9% per year from 1990 to 2008) has outpaced all other energy sources, it is small compared to energy transformations in the past: the use of coal grew by 5% per year between 1850 and 1870, and oil use expanded at a rate of 8% between 1880 and 1900. The new energy transformation involving a move towards clean energy sources, which would have to be the fastest ever to achieve the accepted climate change mitigation targets, is the slowest thus far (UNDESA, 2011).
Although the regulatory framework has successfully launched the industry in some countries, tools will need to be adapted as the sources gradually develop. Some of those which serve to develop an incipient technology such as wind power could create tensions in the system when this exceeds 10% of electricity generation for example. An example are mechanisms to absorb the intermittent nature of these sources in the system. Another area of adjustment to the spread of new renewable energies is the trend towards smart distribution grids, which will be more necessary the greater the pressure to improve energy efficiency or the greater the proportion of intermittent energies such as wind power, solar, or pass-through hydroelectric energy in the generating matrix.
Alongside efforts to reduce CO2 emissions, industrial and technology policy will also be a reason for many governments to support technologies that are not currently competitive but are expected to be so in the future, such as thermodynamic solar energy. The developed economies are in a technological race to develop more efficient electricity generating systems without CO2 emissions; and governments are providing major support to R&D in this sector. The United States Energy Secretary has recently said that the country could either develop the next generation of clean energy technologies, which would help to create thousands of new jobs and export opportunities in the United States, or else it could wait for other countries to take the lead (see [ online] http://energy.gov/articles/energy-department-takes-first-step-spur-us-manufacturing-small-modular-nuclear-reactors). Clean energy technology transfer is one of the negotiating points in international conversations on climate change mitigation, and although no specific proposal has yet emerged in this regard, FDI in renewable energies can be expected to be one of the main vehicles for this transmission (Peterson, 2008).
In Latin America, some governments have made a major effort to develop local capacities in the nascent wind power industry —particularly in Brazil, where local content requirements in tenders and, particularly, conditions of access to BNDES financing, have led all of the world’s 12 largest component manufacturers for the wind power industry to set up a production plant in Brazil.
Economic Commission for Latin America and the Caribbean (ECLAC)176
In Mexico, in contrast, there are no component production plants, even though wind power is developing strongly. In fact, the development of a domestic components industry for renewable energies is likely to depend more on the expansion of these energy sources in the United States than in Mexico itself. In the region’s smaller economies, which cannot create capacities throughout the value chain of the industry, it will also be important to develop suppliers and services associated with new renewable energies, with a view to reducing the investment cost of generating plants and increasing their local content.
The rapid development of wind power in Latin America clearly reflects the adoption of support policies in certain countries. Nonetheless, unlike what happened in Europe, which has the leading countries in wind power generation, in Brazil, Mexico and Uruguay, this has happened without recourse to large-scale direct subsidies. Nonetheless, the region has benefited from the development of renewable energies in Europe at various levels —firstly, through FDI in wind power generation by many European firms (Iberdrola, ACCIONA, Fenosa, SN Power, Enel, GDF Suez and others) and in component manufacturing capacity, particularly in Brazil (Vestas, Siemens and Alstom, among others). Direct investment by these firms, which have more than a decade of experience in wind power in their countries of origin, have driven the development of the wind power industry at a pace that would have been impossible without this knowledge transfer. Moreover, the opportunity to develop wind power in Latin America has given these European firms an area of expansion that they needed when the sector was going through a major crisis in Europe.
In the public-policy domain, the countries of the region have been able to learn from the European experience and avoid making the same policy errors, such as setting regulated rates for renewable technologies that prove too high and which, although they rapidly promoted the industry, entailed a high fiscal cost that later had to be revised.
Lastly, the new renewable energies have opened up an area for bilateral development cooperation between Europe and Latin America, which although perhaps not very significant for the largest economies of the region, is important in specific cases and in the smaller countries. The proportion of worldwide development assistance targeting energy, which had shrunk by half since the 1980s, grew substantially between 2003 and 2008 (the latest period for which figures are available) at a rate of 16% per year —mainly as a result of the adoption of the Kyoto Protocol, which generated additional assistance for renewable energy projects.55 After Japan and the United States, the largest donors in this area would Germany and Spain, countries with a large number of firms specializing in this segment. In 2010 German cooperation targeted 30% of its funding (US$ 1.333 billion) on the energy area, with renewable energies accorded a very important role.56 Another key donor for many of the region’s countries is the European Investment Bank, whose criteria for approving loans for projects in Latin America include the project’s contribution to environmental sustainability and participation by European firms through FDI.
In the electricity sector, therefore, economic relations between Europe and Latin America will remain close over the next few years, both because of European investments in the region and because of technological and political efforts to reduce atmospheric CO2 emissions, in which the European Union has thus far played a leading role.
With its abundant water, solar, wind, and geothermal resources, Latin America has an opportunity to harness its natural resources to productive activities that generate local capacities in high-productivity sectors. Achieving this requires overcoming ideological attitudes towards public or private control of the sector’s assets, and seeking public-private partnerships that make it possible to continue attracting private investment through a fair distribution of the risks and benefits. Energy policy must also be reconciled with industrial and science and technology policies, that make it possible to develop capacities today to be able to continue producing electricity during the twenty-first century.
<?> Figures provided by the Development Assistance Committee (DAC) of the Organization for Economic Cooperation and Development (OECD).
56 This refers to the funds of Instituto de Crédito para la Reconstrucción (KfW) or financial cooperation, which is recorded in separate accounts from technical cooperation.
55 Figures provided by the Development Assistance Committee (DAC) of the Organization for Economic Cooperation and Development (OECD).
177Foreign Direct Investment in Latin America and the Caribbean • 2011
Bibliography
Altomonte, Hugo (2002), “Las complejas mutaciones de la industria eléctrica en América Latina: Falencias institucionales y regulatorias”, La industria eléctrica mexicana en el umbral del siglo XXI, Víctor Rodríguez Padilla (coord.), Mexico City, National Autonomous University of Mexico.
Altomonte, Hugo and others (2011), “The dynamics of industrial energy consumption in Latin America and their implications for sustainable development”, CEPAL Review, No. 105 (LC/G.2508-P), Santiago, Chile, Economic Commission for Latin America and the Caribbean (ECLAC).
Bernardelli, Federico (2011), “Energía solar termodinámica en América Latina: Los casos del Brasil, Chile y México”, Project documents, No. 402 (LC/W.402-P), Santiago, Chile, Economic Commission for Latin America and the Caribbean (ECLAC).
Bloomberg (2011), “Global Trends in Renewable Energy Investment 2011”, United Nations Environment Programme (UNEP)/Bloomberg New Energy Finance [online] http://www.unep.org/pdf/BNEF_global_trends_in_renewable_energy_investment_2011_report.pdf.
Coviello, Manlio, Juan Gollán and Miguel Pérez (2012), “Las alianzas public-privadas en energías renovables en América Latina y el Caribe”, project document, Santiago, Chile, Economic Commission for Latin America and the Caribbean (ECLAC), in press.
D’Araújo, Roberto Pereira (2009), O setor elétrico brasileiro: uma aventura mercantil, Brasilia, Federal Council of Engineering, Architecture and Agronomy (CONFEA).
DESA (Department of Economic and Social Affairs) (2011), World Economic and Social Survey 2011: The Great Green Technological Transformation (E/2011/50/Rev.1), New York, United Nations. United Nations publication, Sales No. E.11.II.C.1.
ECLAC (Economic Commission for Latin America and the Caribbean) (2011a), Foreign Direct Investment in Latin America and the Caribbean, 2010 (LC/G.2494-P), Santiago, Chile. United Nations publication, Sales No. E.11.II.G.4.(2011b), Centroamérica: Estadísticas del subsector eléctrico, 2010 (LC/MEX.L.1039), Mexico City, ECLAC subregional headquarters in Mexico. (2010a), Espacios iberoamericanos: Vínculos entre universidades y empresas para el desarrollo tecnológico (LC/G.2478), Santiago, Chile.
(2010b), Preliminary Overview of the Economies of Latin America and the Caribbean (LC/G.2480-P), Santiago, Chile. United Nations publication, Sales No. E.11.II.G.2.(2005), Foreign Investment in Latin America and the Caribbean 2004 (LC/G.2269-P), Santiago, Chile, March. United Nations publication, Sales No. E.05.II.G.32.
EIU (Economist Intelligence Unit) (2004), “Venezuela: Energy Report”, November.
EPIA (European Photovoltaic Industry Association) (2011), “Solar Photovoltaics Competing in the Energy Sector: On the Road to Competitiveness” [online] http://www.epia.org/publications/photovoltaic-publications-global-market-outlook/solar-photovoltaics-competing-in-the-energy-sector.html.
GDF Suez (2011), Informe de actividad 2010 [online] http://www.gdfsuez-energia.es/wp-content/files_mf/86.pdf.
IBERDROLA (2010), Informe anual 2010 [online] http://www.iberdrolainforme2010.com/ES/informe_anual.php.
IEA (International Energy Agency) (2011a), World Energy Outlook 2011, Paris.(2011b), “Electricity Information 2011” [online] http://wds.iea.org/wds/pdf/Electricity%20Information%202011.pdf.(2010), Projected Costs of Generating Electricity. 2010 Edition, Paris.
IPCC (Intergovernmental Panel on Climate Change) (2011), “Special Report on Renewable Energy Sources and Climate Change Mitigation” [online] http://srren.ipcc-wg3.de.
Maldonado, Pedro and Rodrigo Palma (2004), “Seguridad y calidad del abastecimiento eléctrico a más de 10 años de la reforma de la industria eléctrica en países de América del Sur”, Recursos naturales e infraestructura series, No. 72 (LC/L.2158-P), Santiago, Chile, Economic Commission for Latin America and the Caribbean (ECLAC).
NREL (National Renewable Energy Laboratory) (2011), “2010 Renewable Energy Databook”, Department of Energy [online] http://www.nrel.gov/analysis/pdfs/51680.pdf.
Peterson, Sonja (2008), “Greenhouse gas mitigation in developing countries through technology transfer? A survey of empirical evidence”, Mitigation and Adaptation Strategies for Global Change, vol. 13, No. 3.

Economic Commission for Latin America and the Caribbean (ECLAC)178
REN21 (Renewable Energy Policy Network for the 21st Century) (2011), “Renewables 2011 Global Status Report” [online] http://www.ren21.net/REN21Activities/Publications/GlobalStatusReport/GSR2011/tabid/56142/Default.aspx.
Rozas, Patricio (2010), “Latin America: problems and challenges of infrastructure financing”, CEPAL Review, No. 101 (LC/G.2455-P), Santiago, Chile, Economic Commission for Latin America and the Caribbean (ECLAC), August.
(2009), Internacionalización y expansión de las empresas eléctricas españolas en América Latina, Santiago, Chile, Economic Commission for Latin America and the Caribbean (ECLAC)/LOM Ediciones.
SENER (Secretariat of Energy) (2010), Prospectiva del sector eléctrico 2010-2025, Mexico City, Directorate General for Energy Planning.

Publicaciones de la CEPAL / ECLAC publications Comisión Económica para América Latina y el Caribe / Economic Commission for Latin America and the Caribbean
Casilla 179-D, Santiago de Chile. E-mail: [email protected] Véalas en: www.cepal.org/publicaciones
Publications may be accessed at: www.eclac.org
Revista CEPAL / CEPAL Review La Revista se inició en 1976 como parte del Programa de Publicaciones de la Comisión Económica para América Latina y el Caribe, con el propósito de contribuir al examen de los problemas del desarrollo socioeconómico de la región. Las opiniones expresadas en los artículos firmados, incluidas las colaboraciones de los funcionarios de la Secretaría, son las de los autores y, por lo tanto, no reflejan necesariamente los puntos de vista de la Organización.
La Revista CEPAL se publica en español e inglés tres veces por año. Los precios de suscripción anual vigentes son de US$ 30 para la versión en español y US$ 35 para la versión en inglés. El precio por
ejemplar suelto es de US$ 15 para ambas versiones. Los precios de suscripción por dos años son de US$ 50 para la versión en español y US$ 60 para la versión en inglés. CEPAL Review first appeared in 1976 as part of the Publications Programme of the Economic Commission for Latin America and the Caribbean, its aim being to make a contribution to the study of the economic and social development problems of the region. The views expressed in signed articles, including those by Secretariat staff members, are those of the authors and therefore do not necessarily reflect the point of view of the Organization.
CEPAL Review is published in Spanish and English versions three times a year. Annual subscription costs are US$ 30 for the Spanish version and US$ 35 for the English version. The price of single issues is US$ 15 for
both versions. The cost of a two-year subscription is US$ 50 for the Spanish version and US$ 60 for the English version.
Informes periódicos institucionales / Annual reports Todos disponibles para años anteriores / Issues for previous years also available • Balance preliminar de las economías de América Latina y el Caribe 2011, 184 p. Preliminary Overview of the Economies of Latin America and the Caribbean 2011, 164 p. • Estudio económico de América Latina y el Caribe 2010-2011, 344 p. Economic Survey of Latin America and the Caribbean 2010-2011, 318 p. • Panorama de la inserción internacional de América Latina y el Caribe, 2010-2011, 140 p. Latin America and the Caribbean in the World Economy, 2010-2011, 168 p. • Panorama social de América Latina, 2011, 252 p. Social Panorama of Latin America, 2011, 242 p. • La inversión extranjera directa en América Latina y el Caribe, 2010, 216 p. Foreign Direct Investment of Latin America and the Caribbean, 2010, 204 p. • Anuario estadístico de América Latina y el Caribe / Statistical Yearbook for Latin America and the Caribbean, 2011, 220 p..
Libros de la CEPAL 114 China y América Latina y el Caribe. Hacia una relación económica y comercial estratégica, Osvaldo Rosales y Mikio Kuwayama,
2012, 258 p. 114 China and Latin America and the Caribbean Building a strategic economic and trade relationship, Osvaldo Rosales y
Mikio Kuwayama, 2012, 244 p. 113 Competitividad, sostenibilidad e inclusión social en la agricultura: Nuevas direcciones en el diseño de políticas en América Latina
y el Caribe, Octavio Sotomayor, Adrián Rodríguez y Mônica Rodrigues, 2012, 352 p.

112 El desarrollo inclusivo en América Latina y el Caribe. Ensayos sobre políticas de convergencia productiva para la igualdad, Ricardo Infante (editor), 2011, 384 p.
111 Protección social inclusiva en América Latina. Una mirada integral, un enfoque de derechos, Simone Cecchini y Rodrigo Martínez, 2011, 284 p.
110 Envejecimiento en América Latina. Sistema de pensiones y protección social integral, Antonio Prado y Ana Sojo (eds.), 2010, 304 p. 109 Modeling Public Policies in Latin America and the Caribbean, Carlos de Miguel, José Durán Lima, Paolo Giordiano, Julio Guzmán,
Andrés Schuschny and Masazaku Watanuki (eds.), 2011, 322 p. 108 Alianzas público-privadas. Para una nueva visión estratégica del desarrollo, Robert Devlin y Graciela Moguillansky, 2010, 196 p. 107 Políticas de apoyo a las pymes en América Latina. Entre avances innovadores y desafíos institucionales, Carlos Ferraro y Giovanni
Stumpo, 2010, 392 p. 106 Temas controversiales en negociaciones comerciales Norte-Sur, Osvaldo Rosales V. y Sebastián Sáez C. (compiladores), 2011, 322 p. 105 Regulation, Worker Protection and Active Labour-Market Policies in Latin America, Jürgen Weller (ed.), 2009, 236 p. 104 La República Dominicana en 2030: hacia una sociedad cohesionada, Víctor Godínez y Jorge Máttar (coords.), 2009, 582 p. 103 L’Amérique latine et les Caraïbes au seuil du troisième millénaire, 2009, 138 p. 102 Migración interna y desarrollo en América Latina entre 1980 y 2005, Jorge Rodríguez y Gustavo Busso, 2009, 272 p. 101 Claves de la innovación social en América Latina y el Caribe, Adolfo Rodríguez Herrera y Hernán Alvarado Ugarte, 2009, 236 p.
Copublicaciones recientes / Recent co-publications Sentido de pertenencia en sociedades fragmentadas. América Latina desde una perspectiva global, Martín Hopenhayn y Ana Sojo (comps.),
CEPAL/Siglo Veintiuno, Argentina, 2011. Las clases medias en América Latina. Retrospectiva y nuevas tendencias, Rolando Franco, Martín Hopenhayn y Arturo León (eds.),
CEPAL/Siglo XXI, México, 2010. Innovation and Economic Development. The Impact of Information and Communication Technologies in Latin America, Mario Cimoli,
André Hofman and Nanno Mulder, ECLAC/Edward Elgar Publishing, United Kingdom, 2010. Sesenta años de la CEPAL. Textos seleccionados del decenio 1998-2008, Ricardo Bielschowsky (comp.), CEPAL/Siglo Veintiuno, Argentina, 2010. El nuevo escenario laboral latinoamericano. Regulación, protección y políticas activas en los mercados de trabajo, Jürgen Weller (ed.),
CEPAL/Siglo Veintiuno, Argentina, 2010. Internacionalización y expansión de las empresas eléctricas españolas en América Latina, Patricio Rozas, CEPAL/Lom, Chile, 2009. Gobernanza corporativa y desarrollo de mercados de capitales en América Latina, Georgina Núñez, Andrés Oneto y Germano M. de Paula
(coords.), CEPAL/Mayol, Colombia, 2009.
Coediciones recientes / Recent co-editions La sostenibilidad del desarrollo a 20 años de la Cumbre para la Tierra. Avances, brechas y lineamientos estratégicos para América Latina y
el Caribe, CEPAL/Naciones Unidas, 2012. Sustainable development 20 years on from the Earth Summit. Progress, gaps and strategic guidelines for Latin America and the
Caribbean, ECLAC/United Nations, 2012. Perspectivas económicas de América Latina 2012.Transformación del Estado para el desarrollo, CEPAL/OCDE, 2011. Latin America Outlook 2012. Transforming the State for Development, ECLAC/OECD, 2011. Perspectives économiques de l’Amérique latine 2012. Transformation de l’État et Développement, CEPALC/OCDE, 2012. Breeding Latin American Tigers. Operational principles for rehabilitating industrial policies, Robert Devlin and
Graciela Moguillansky, ECLAC/World Bank, 2011. Espacios iberoamericanos: Hacia una nueva arquitectura del Estado para el desarrollo, CEPAL/SEGIB, 2011. Espaços ibero-americanos: A uma nova arquitetura do Estado para o desenvolvimento. CEPAL/SEGIB, 2011. Perspectivas de la agricultura y del desarrollo rural en las Américas: una mirada hacia América Latina y el Caribe, CEPAL/FAO/IICA, 2011. The Oulook for Agriculture and Rural Development in the Americas: A Perspective on Latin America and the Caribbean,
ECLAC/FAO/IICA, 2011. Pobreza infantil en América Latina y el Caribe, CEPAL/UNICEF, Chile, 2010. Espacios iberoamericanos: vínculos entre universidades y empresas para el desarrollo tecnológico, CEPAL/SEGIB, 2010 Espaços ibero-Americanos: vínculos entre universidades e empresas para o desenvolvimento tecnológico, CEPAL/SEGIB, 2010. Clases medias y desarrollo en América Latina, Alicia Bárcena y Narcís Serra (eds.), CEPAL/SEGIB/CIDOB, Chile, 2010.
Cuadernos de la CEPAL 99 Si no se cuenta, no cuenta, Diane Alméras y Coral Calderón Magaña (coords.), 2012, 394 p. 98 Macroeconomic cooperation for uncertain times: The REDIMA experience, Rodrigo Cárcamo-Díaz, 2012,164 p. 97 El financiamiento de la infraestructura: Propuestas para el desarrollo sostenible de una política sectorial, Patricio Rozas Balbontín, José
Luis Bonifaz y Gustavo Guerra-García, 2012, 414 p.
96 Una mirada a la crisis desde los márgenes, Sonia Montaño (coord.), 2011, 102 p. 95 Programas de transferencias condicionadas. Balance de la experiencia reciente en América Latina y el Caribe, Simone Cecchini y Aldo
Madariaga, 2011, 226 p. 95 Conditional cash transfer programmes. The recent experience in Latin America and the Caribbean, Simone Cecchini and Aldo
Madariaga, 2011, 220 p. 94 El cuidado en acción. Entre el derecho y el trabajo, Sonia Montaño Virreira y Coral Calderón Magaña (coords.), 2010, 236 p. 93 Privilegiadas y discriminadas. Las trabajadoras del sector financiero, Flavia Marco Navarro y María Nieves Rico Ibáñez (eds.),
2009, 300 p.
Cuadernos estadísticos de la CEPAL 39 América Latina y el Caribe: indicadores macroeconómicos del turismo. Solo disponible en CD, 2010. 38 Indicadores ambientales de América Latina y el Caribe, 2009. Solo disponible en CD, 2010. 37 América Latina y el Caribe: Series históricas de estadísticas económicas 1950-2008. Solo disponible en CD, 2009. 36 Clasificaciones estadísticas internacionales incorporadas en el Banco de Datos de Comercio Exterior de América Latina y el Caribe de la
CEPAL (Revisión 3). Solo disponible en CD, 2008.
Observatorio demográfico / Demographic Observatory Edición bilingüe (español e inglés) que proporciona información estadística actualizada, referente a estimaciones y proyecciones de población de los países de América Latina y el Caribe. Incluye también indicadores demográficos de interés, tales como tasas de natalidad, mortalidad, esperanza de vida al nacer, distribución de la población, etc.
El Observatorio aparece dos veces al año, en los meses de enero y julio. Suscripción anual: US$ 25. Valor por cada ejemplar: US$ 15. Bilingual publication (Spanish and English) proving up-to-date estimates and projections of the populations of the Latin American and Caribbean countries. Also includes various demographic indicators of interest such as fertility and mortality rates, life expectancy, measures of population distribution, etc.
The Observatory appears twice a year in January and July. Annual subscription: US$ 25. Per issue: US$ 15.
Notas de población Revista especializada que publica artículos e informes acerca de las investigaciones más recientes sobre la dinámica demográfica en la región, en español, con resúmenes en español e inglés. También incluye información sobre actividades científicas y profesionales en el campo de población.
La revista se publica desde 1973 y aparece dos veces al año, en junio y diciembre. Suscripción anual: US$ 20. Valor por cada ejemplar: US$ 12.
Specialized journal which publishes articles and reports on recent studies of demographic dynamics in the region, in Spanish with abstracts in Spanish and English. Also includes information on scientific and professional activities in the field of population.
Published since 1973, the journal appears twice a year in June and December. Annual subscription: US$ 20. Per issue: US$ 12.
Series de la CEPAL Comercio internacional / Desarrollo productivo / Desarrollo territorial / Estudios estadísticos y prospectivos / Estudios y perspectivas (Bogotá, Brasilia, Buenos Aires, México, Montevideo) / Studies and Perspectives (The Caribbean, Washington) / Financiamiento del desarrollo / Gestión pública / Informes y estudios especiales / Macroeconomía del desarrollo / Manuales / Medio ambiente y desarrollo / Mujer y desarrollo / Población y desarrollo / Políticas sociales / Recursos naturales e infraestructura / Seminarios y conferencias. Véase el listado completo en: www.cepal.org/publicaciones / A complete listing is available at: www.cepal.org/publicaciones

Las publicaciones de la Comisión Económica para América Latina y el Caribe (CEPAL) y las del Instituto Latinoamericano y del Caribe de Planificación Económica y Social (ILPES) se pueden adquirir a los distribuidores locales o directamente a través de:
Publicaciones de las Naciones Unidas Publicaciones de las Naciones Unidas 2 United Nations Plaza, Room DC2-853 Sección de Ventas Nueva York, NY, 10017 Palais des Nations Estados Unidos 1211 Ginebra 10 Tel. (1 800)253-9646 Fax (1 212)963-3489 Suiza E-mail: [email protected] Tel. (41 22)917-2613 Fax (41 22)917-0027 Unidad de Distribución Comisión Económica para América Latina y el Caribe (CEPAL) Av. Dag Hammarskjöld 3477, Vitacura 7630412 Santiago Chile Tel. (56 2)210-2056 Fax (56 2)210-2069 E-mail: [email protected]
Publications of the Economic Commission for Latin America and the Caribbean (ECLAC) and those of the Latin American and the Caribbean Institute for Economic and Social Planning (ILPES) can be ordered from your local distributor or directly through:
United Nations Publications United Nations Publications 2 United Nations Plaza, Room DC2-853 Sales Sections New York, NY, 10017 Palais des Nations USA 1211 Geneva 10 Tel. (1 800)253-9646 Fax (1 212)963-3489 Switzerland E-mail: [email protected] Tel. (41 22)917-2613 Fax (41 22)917-0027 Distribution Unit Economic Commission for Latin America and the Caribbean (ECLAC) Av. Dag Hammarskjöld 3477, Vitacura 7630412 Santiago Chile Tel. (56 2)210-2056 Fax (56 2)210-2069 E-mail: [email protected]