foreign direct investment in latin america and the
TRANSCRIPT
Foreign Direct Investmentin Latin America and the Caribbean
Fore
ign
Dir
ect
Inve
stm
en
t in
L
atin
Am
eri
ca a
nd
th
e C
arib
be
an 2
020
2020
ECLACPublications
Thank you for your interest in
this ECLAC publication
Please register if you would like to receive information on our editorial
products and activities. When you register, you may specify your particular
areas of interest and you will gain access to our products in other formats.
www.cepal.org/en/publications
Publicaciones www.cepal.org/apps
2 Economic Commission for Latin America and the Caribbean (ECLAC)Executive summary
Alicia BárcenaExecutive Secretary
Mario CimoliDeputy Executive Secretary
Raúl García-BuchacaDeputy Executive Secretary for Management and Programme Analysis
Ricardo PérezChief, Publications and Web Services Division
United Nations publication
ISBN: 978-92-1-122055-1 (print)
ISBN: 978-92-1-004748-7 (pdf)
ISBN: 978-92-1-358298-5 (ePub)
Sales No.: E.20.II.G.3
LC/PUB.2020/15-P
Distribution: G
Copyright © United Nations, 2020
All rights reserved
Printed at United Nations, Santiago
S.20-00594
The 2020 version of Foreign Direct Investment in Latin America and the Caribbean is the most recent edition of an annual series published by the Unit on Investment and Corporate Strategies of the Division of Production, Productivity and Management of the Economic Commission for Latin America and the Caribbean (ECLAC). This year’s edition was prepared by Ana Abeliansky, Álvaro Calderón, Mathilde Closset, Felipe Correa, Marco Dini, Georgina Núñez, Cecilia Plottier and Nunzia Saporito, under the coordination of Giovanni Stumpo. The databases were prepared by Leandro Cabello.
Comments and suggestions were received from Alicia Bárcena, Mario Cimoli, Hugo Beteta, Martín Abeles, Olga Lucía Acosta, Anahí Amar, Filipe Da Silva, Sebastián Herreros, Álvaro Lalanne, Jorge Mario Martínez, Machel Pantin, Juan Carlos Ramírez, Joaquín Vargas and Helvia Velloso.
Thanks are due to the government authorities and executives of companies consulted, for their inputs for the preparation of this document.
Any comments or suggestions concerning the contents of this document should be addressed to Giovanni Stumpo (Giovanni.Stumpo@ cepal.org) and Cecilia Plottier ([email protected]).
The boundaries and names shown on the maps included in this publication do not imply official acceptance or endorsement by the United Nations.
Explanatory notes
- Three dots (…) indicate that data are missing, are not available or are not separately reported. - A dash (-) indicates that the amount is nil or negligible. - A full stop (.) is used to indicate decimals.- The word “dollars” refers to United States dollars unless otherwise specified. - A slash (/) between years (e.g. 2013/2014) indicates a 12-month period falling between the two years.- Individual figures and percentages in tables may not always add up to the corresponding total due to rounding.
This publication should be cited as: Economic Commission for Latin America and the Caribbean (ECLAC), Foreign Direct Investment in Latin America and the Caribbean, 2020 (LC/PUB.2020/15-P), Santiago, 2020.
Applications for authorization to reproduce this work in whole or in part should be sent to the Economic Commission for Latin America and the Caribbean (ECLAC), Publications and Web Services Division, [email protected]. Member States and their governmental institutions may reproduce this work without prior authorization, but are requested to mention the source and to inform ECLAC of such reproduction.
3ContentsForeign Direct Investment in Latin America and the Caribbean • 2020
CONTENTS
Executive summary.................................................................................................................................................... 9
Chapter IOverview of foreign direct investment in the region ......................................................................................... 19
A. 2019 saw a slight increase in global FDI after two years of decline ............................................................. 21B. The region’s FDI has been in an almost steady decline since 2012 .............................................................. 25
1. FDI inflows fell by 7.8% in 2019 .............................................................................................................. 252. Capital outflows in the form of FDI income accounted for 1.9% of GDP in 2019 ................................... 293. Market access and natural resources drove FDI in most countries ........................................................ 324. Europe and the United States accounted for 82% of FDI ....................................................................... 40
C. Latin American investments overseas: difficult times ................................................................................... 44D. Complicated prospects for the world and the region in 2020 ........................................................................ 51E. Conclusions ..................................................................................................................................................... 56F. Analysis by country ......................................................................................................................................... 58
1. Brazil: the region’s biggest host country is hit hard ................................................................................ 602. South America: FDI rose in Chile, Colombia, Peru and Paraguay ........................................................... 633. Mexico: the European Union outstripped the United States in FDI ........................................................ 684. Panama and Costa Rica remain the main recipients of FDI in Central America ..................................... 715. The Caribbean: growth in FDI inflows is explained by increases observed in the Dominican Republic and Guyana ....................................................................................................... 76
Bibliography ........................................................................................................................................................... 81
Chapter IITowards a new post-pandemic global production geography: the reorganization of global value chains ............................................................................................................................................. 85
Introduction ........................................................................................................................................................... 87
A. Evolution of global value chains ..................................................................................................................... 871. Global value chains have changed the nature and structure of the world economy .............................. 872. A production organization model under pressure ................................................................................. 103
B. The COVID-19 pandemic: a cataclysmic event for global value chains ....................................................... 1091. Causes of COVID-19’s strong impact on global value chains ............................................................... 1102. A crisis with an uneven impact ............................................................................................................. 1123. How to regain control and ensure the stability of global value chains? ............................................... 117
C. Possible future trajectories of global value chains and policy recommendations ....................................... 1221. Potential trajectories and impacts of megatrends and catastrophic events ........................................ 1232. The cost of geographic reconfiguration ................................................................................................. 1283. Considerations on productive development policies ............................................................................. 130
Bibliography ......................................................................................................................................................... 132
Chapter IIINew scenarios for the medical device sector in Latin America and the Caribbean ................................. 135
Introduction ......................................................................................................................................................... 137
A. A heterogeneous and constantly changing sector ....................................................................................... 1381. The value chain ...................................................................................................................................... 1402. Supply and demand are concentrated in developed countries ............................................................. 1413. Innovation and regulation are key elements of competition ................................................................. 145
B. International trade in medical devices grew moderately in recent years .................................................... 1461. The United States, Germany and China accounted for 41% of world exports ..................................... 1462. Increase in exports in the region and concentration in Mexico and Costa Rica ................................... 1483. Goods of medium and low technological complexity generate more exports ...................................... 1504. Intraregional trade has had a small share ............................................................................................. 154
4 Economic Commission for Latin America and the Caribbean (ECLAC)Contents
C. Foreign direct investment (FDI) has been concentrated in the advanced economies .................................. 1561. In emerging countries, investment has targeted market access and, in a few cases, the pursuit of efficiency ......................................................................................................................... 1562. Investment in export manufacturing in the region is concentrated in a few countries ........................ 164
D. Production capacities and specialization in the region ................................................................................ 1701. Production capacities for export in areas close to the United States ................................................... 1712. Costa Rica and the Dominican Republic: national strategies drive the industry .................................. 1723. Production has become more complex, although with few linkages .................................................... 1734. Other countries in the region: dependence on imports despite productive capacities ........................ 175
E. Towards a new scenario: how to boost regional integration ...................................................................... 177
Bibliography ......................................................................................................................................................... 179
Annex III.A1 ......................................................................................................................................................... 182
ECLAC recent publications ................................................................................................................................... 185
TablesTable I.1 Global FDI inflows, rate of change and distribution by region, 2008–2019 .................................. 21
Table I.2 Latin America and the Caribbean: inflows of foreign direct investment, by recipient country and subregion, 2005–2019 ............................................................................................................. 27
Table I.3 Latin America and the Caribbean: 20 largest cross-border mergers and acquisitions, 2019 ............ 36
Table I.4 Latin America and the Caribbean: outward foreign direct investment flows, 2005–2019 ............ 45
Table I.5 Latin America and the Caribbean (6 countries): outward foreign direct investment flows, by quarter, 2018–2020 .................................................................................................................... 45
Table I.6 Largest mergers and acquisitions carried out successfully by Trans-Latin corporations, 2019–2020 ...................................................................................................................................... 46
Table I.7 Central America (6 countries): countries’ share of total FDI in the subregion, 2018 and 2019................................................................................................................................. 72
Table I.8 Central America: distribution of the number and amount of project announcements by sector, 2019 ................................................................................................................................ 73
Table II.1 Latin America (8 countries): business digitization, 2018 .............................................................. 115
Table II.2 Possible evolutionary trajectories of global value chains ............................................................ 123
Table II.3 Variation in geographical concentration by industrial chain ........................................................ 129
Table III.1 Top 20 firms in the global medical device market, by sales, 2017 .............................................. 143
Table III.2 Ranking of countries based on average annual medical device exports and imports, 2014–2018 .................................................................................................................................... 148
Table III.3 Latin America and the Caribbean: country ranking based on average annual medical device exports and imports, 2014–2018 .................................................................................................. 149
Table III.4 Latin America and the Caribbean: main medical devices exported, average 2014–2018 ........... 153
Table III.5 Top ten global cross-border mergers and acquisitions in the medical device industry, 2010–2019 .................................................................................................................................... 160
Table III.6 Medical technology firms among the 100 largest non-financial transnational corporations in the world, 2019 ......................................................................................................................... 164
Table III.7 World and Latin America and the Caribbean: project announcements, by destination sector and project activity, 2003–2019 ................................................................................................... 167
Table III.8 Latin America and the Caribbean: project announcements in the medical devices and equipment sector, by firm, 2010–2019 .................................................................................. 168
Table III.A1.1 Activities included in “Manufacture of medical and surgical equipment and orthopaedic appliances” (ISIC 3311) ................................................................................................................. 182
Table III.A1.2 Tariff lines included in the analysis of medical devices by reference source ............................. 182

5ContentsForeign Direct Investment in Latin America and the Caribbean • 2020
FiguresFigure I.1 Global foreign direct investment flows by group of economies, 1990–2019 ................................ 22
Figure I.2 Change in FDI inflows to selected regions and groups of economies, 2018–2019 ....................... 22
Figure I.3 Net cross-border mergers and acquisitions, by destination region or country, 2003–2019 .......... 23
Figure I.4 Global investment project announcements, by destination region or country, 2003–2019 .......... 24
Figure I.5 Mergers and acquisitions by companies from China and Hong Kong Special Administrative Region (SAR) of China, by destination region, 2014–2019 ............................................................ 24
Figure I.6 Latin America and the Caribbean: foreign direct investment (FDI) inflows, 2010–2019 ............... 25
Figure I.7 Latin America and the Caribbean (selected countries and subregions): foreign direct investment (FDI) inflows, 2010–2019....................................................................................................26
Figure I.8 Latin America and the Caribbean: foreign direct investment (FDI) inflows, by components, 2010–2019 ...................................................................................................................................... 28
Figure I.9 Latin America and the Caribbean: cross-border capital inflows, 2010–2019 ................................ 29
Figure I.10 Latin America and the Caribbean: foreign direct investment (FDI) stock and average return, 2010–2019 ...................................................................................................................................... 30
Figure I.11 Latin America and the Caribbean (15 countries): average return on foreign direct investment (FDI), 2010–2014, 2018 and 2019 ..........................................................................................................................31
Figure I.12 Latin America and the Caribbean: balance-of-payments current account, by components, 2010–2019 ..................................................................................................................................... 31
Figure I.13 Latin America and the Caribbean (15 countries):sectoral breakdown of foreign direct investment inflows, 2010–2019 ..................................................................................................... 32
Figure I.14 Latin America and the Caribbean (selected countries and subregions): sectoral breakdown of foreign direct investment inflows, 2010–2019 .......................................................................... 33
Figure I.15 Brazil and Mexico: foreign direct investment inflows to the manufacturing industry, by sector, 2010–2019...................................................................................................................... 34
Figure I.16 Latin America and the Caribbean: cross-border mergers and acquisitions targeting companies in the region, 2005–2019 ................................................................................................................. 34
Figure I.17 Latin America and the Caribbean: cross-border mergers and acquisitions targeting companies in the region, by economic activity, 2005–2019 ............................................................................. 35
Figure I.18 Latin America and the Caribbean: cross-border mergers and acquisitions targeting companies in the region, by destination country or subregion, 2015–2017, 2018 and 2019 .......................... 37
Figure I.19 Latin America and the Caribbean: investment project announcements, 2005–2019 .................... 38
Figure I.20 Latin America and the Caribbean: investment project announcements, by sector, 2005–2019 ....... 38
Figure I.21 Latin America and the Caribbean: investment project announcements, by sector, 2019 ............. 39
Figure I.22 Latin America and the Caribbean (9 countries): breakdown of foreign direct investment inflows by origin, 2010–2019 ......................................................................................................... 40
Figure I.23 Latin America and the Caribbean (selected subregions and countries) breakdown of foreign direct investment inflows by origin, 2010–2019 ............................................................................ 41
Figure I.24 Latin America and the Caribbean: mergers and acquisitions, and investment project announcements, by country of origin, 2010–2019 ......................................................................... 42
Figure I.25 Latin America and the Caribbean: cross-border mergers and acquisitions, by region of origin, 2010–2019 ...................................................................................................................................... 44
Figure I.26 Latin America and the Caribbean (selected countries and subregions): foreign direct investment (FDI) inflows, 2019 and 2020 ...................................................................................................52
Figure I.27 Latin America and the Caribbean: foreign direct investment (FDI) inflows, 2010–2019 and 2020 estimate .......................................................................................................................... 53
Figure I.28 Latin America and the Caribbean: amounts and numbers of investment projects announced from January to September each year, 2016–2020 ....................................................................... 53
Figure I.29 Latin America and the Caribbean: value of investment projects announced, by sector, from January to September each year, 2016–2019 and 2020 ...................................................... 54
6 Economic Commission for Latin America and the Caribbean (ECLAC)Contents
Figure I.30 Latin America and the Caribbean (selected countries and subregions): value of investment projects announced from January to September each year, 2019 and 2020 ................................ 55
Figure I.31 Latin America and the Caribbean: amount and number of cross-border merger and acquisition transactions carried out from January to September each year, 2019 and 2020 .......................... 55
Figure I.32 Brazil: foreign direct investment inflows for manufacturing, by sector, 2010–2014 and 2015–2019 ............................................................................................................ 61
Figure I.33 Brazil: foreign direct investment inflows for services, by sector, 2010–2014 and 2015–2019 ......... 62
Figure II.1 Global gross domestic product (GDP), exports and foreign direct investment (FDI), 1990–2019 ...................................................................................................................................... 88
Figure II.2 Exports of goods, by selected regions and countries and type of product, 1995–2018 ................ 91
Figure II.3 Global goods exports, by category, 1990–2018 ............................................................................. 92
Figure II.4 Global goods exports, by category, 1990–2019 ............................................................................. 92
Figure II.5 Global value added by components of production, 2005–2015 ..................................................... 94
Figure II.6 Global annual growth rate of value added of components of production, 2006–2015 ................. 95
Figure II.7 Foreign value added participation in exports ................................................................................ 96
Figure II.8 Index of participation in global value chains by value added, 2015 .............................................. 97
Figure II.9 Latin America and Asia (selected countries): index of participation in global value chains by value added, 2015 ...................................................................................................................... 97
Figure II.10 Latin America (7 countries): forward and backward linkages by sector, 2005–2015 .................... 99
Figure II.11 Latin America (7 countries): forward and backward linkages by branch of manufacturing activity, 2005–2015......................................................................................... 100
Figure II.12 Origin of value added in final demand, by region and product, 2005–2015 ................................ 102
Figure II.13 Import intensity of international production, 1990–2019 ............................................................ 104
Figure II.14 China: foreign value added in exports, 2005–2016 ...................................................................... 105
Figure II.15 United States: trade deficit with China, in manufacturing and total, 1990–2019 ....................... 106
Figure II.16 Industrial robot facilities, by country ............................................................................................ 108
Figure II.17 Exposure of global value chains to the COVID-19 pandemic shock, by sector, August 2020 .......... 113
Figure II.18 Latin America (11 countries): Internet users in urban and rural areas, 2018 ............................... 115
Figure II.19 Actions taken by leader companies of global value chains to mitigate the short-term effects of the COVID-19 crisis on their suppliers, July 2020 ....................................................... 120
Figure III.1 Current expenditure on health, by country and region, 2017 ....................................................... 142
Figure III.2 Market share of top ten firms worldwide by sales, by segment, 2017 ....................................... 144
Figure III.3 Global medical device exports, 2014–2018 ................................................................................. 147
Figure III.4 Latin America and the Caribbean: international trade in medical devices, 2014–2018 .............. 149
Figure III.5 Latin America and the Caribbean: balance of trade in medical devices, by technological complexity, 2014–2018 ................................................................................................................. 150
Figure III.6 Medical device exports, by technological complexity, average 2014–2018 ............................... 151
Figure III.7 Costa Rica and Mexico: medical device exports, by technological complexity, 2002–2018 and 2007–2018 ............................................................................................................................ 152
Figure III.8 Latin America and the Caribbean: medical device imports by origin, 2014–2018 ...................... 154
Figure III.9 Latin America and the Caribbean: medical device imports by origin, 2014 and 2018 ................. 155
Figure III.10 Latin America and the Caribbean: medical device imports by origin, by technological complexity, average 2014–2018 ................................................................................................... 155
Figure III.11 Cross-border mergers and acquisitions and announcements of projects abroad in the medical device sector, cumulative 2010–2014 and 2015–2019 ............................................ 157
Figure III.12 Cross-border mergers and acquisitions in the medical device industry worldwide by origin and destination region, cumulative 2010–2019 ........................................................................... 158
Figure III.13 Cross-border mergers and acquisitions in the medical device industry worldwide by country of destination, 2010–2019 ............................................................................................................ 159
7ContentsForeign Direct Investment in Latin America and the Caribbean • 2020
Figure III.14 Announcements of projects abroad in the medical device sector, by region of origin and destination, 2010–2019 ......................................................................................................... 161
Figure III.15 World: project announcements in the medical device sector by destination country, 2010–2019 .................................................................................................................................... 162
Figure III.16 World: project announcements in the medical device sector by country of origin, 2010–2019 ......... 162
Figure III.17 Latin America and the Caribbean: cross-border mergers and acquisitions and project announcements in the medical devices sector, cumulative 2010–2014 and 2015–2019 ............... 165
Figure III.18 Latin America and the Caribbean: project announcements and mergers and acquisitions in the medical device sector, by country of destination, 2010–2019 .......................................... 166
Figure III.19 Latin America and the Caribbean: project announcements and mergers and acquisitions in the medical device sector, by country of origin, 2010–2019 ................................................... 167
BoxesBox I.1 The fall in industrial output and the disruption of certain value chains in the United States ........... 70
Box II.1 Decomposition of production and global value chains .................................................................. 93
Box III.1 Risk classifications in the world’s leading markets ..................................................................... 146
Box III.2 Medical technology start-ups in Latin America and the Caribbean ............................................. 169
Box III.3 Production capacities and export in times of local health emergency ........................................ 171
DiagramsDiagram II.1 Global production centres in value added trade ............................................................................ 90
Diagram II.2 Latin America and the Caribbean: different levels of impact of the COVID-19 pandemic on production sectors, July 2020 .................................................................................................. 114
Diagram II.3 Megatrends and potential trajectories of global value chains .................................................... 125
Diagram II.4 Likelihood of chains undergoing relocation processes ................................................................ 129
Diagram III.1 Major medical technology segments ........................................................................................... 138
Diagram III.2 Medical devices by technological complexity .............................................................................. 139
Diagram III.3 Medical devices value chain......................................................................................................... 141
MapsMap I.1 South America (10 countries), Central America and the Caribbean: foreign direct
investment inflows, 2018, 2019 and first halves of 2019 and 2020 ........................................... 59
Map I.2 Central America (6 countries): foreign direct investment received, 2018 and 2019 ...................... 72
Map I.3 The Caribbean (15 countries): foreign direct investment received, 2018 and 2019 ...................... 78

9Executive summaryForeign Direct Investment in Latin America and the Caribbean • 2020
A. Overview of foreign direct investment in the region
B. Towards a new post-pandemic global production geography: the reorganization of global value chains
C. New scenarios for the medical device sector in Latin America and the Caribbean
Executive summary


11Executive summaryForeign Direct Investment in Latin America and the Caribbean • 2020EXECUTIVE SUMMARY
A. Overview of foreign direct investment in the region
The decade ending in 2019 saw the highest ever foreign direct investment (FDI) inflows to Latin America and the Caribbean, which reached their peak in 2012. Since then, foreign investment inflows have declined steadily, bringing into focus, especially in South American countries, the relationship between FDI flows, the macroeconomic cycle and commodity price cycles in the region. In 2019, the region received US$ 160.721 billion in foreign direct investment, which was down 7.8% from 2018; FDI thus represented 3.2% of GDP, slightly less than the average of 3.4% for the last decade (see figure 1).
Figure 1 Latin America and the Caribbean: foreign direct investment (FDI) inflows, 2010–2019(Billions of dollars and percentages of GDP)
FDI inflows FDI inflows as a percentage of GDP (right scale)
160.72
3.2
2
3
4
5
6
7
8
140
150
160
170
180
190
200
210
220
2010 2011 2012 2013 2014 2015 2016 2017 2018 2019
Source: Economic Commission for Latin America and the Caribbean (ECLAC), on the basis of official figures and estimates as of 1 December 2020.Note: Information according to Balance of Payments and International Investment Position Manual, sixth edition (MBP6), published by the International Monetary Fund
(IMF, 2009), except in the cases of Bahamas, Barbados, Guyana, Haiti, Paraguay, Peru and Suriname, which use the methodology of the Balance of Payments and International Investment Position Manual: Fifth Edition (BPM5). No information has been available for the Bolivarian Republic of Venezuela since 2016. No information is available for 2019 for Antigua and Barbuda, Dominica, Grenada, Saint Kitts and Nevis, Saint Lucia and Saint Vincent and the Grenadines.
While the overall situation varies, FDI inflows increased in only nine of the region’s countries compared with 2018. The five countries receiving the most investment in 2019 were Brazil (43% of the total), Mexico (18%), Colombia (9%), Chile (7%) and Peru (6%). The two largest recipients recorded less investment than in 2018, while the three South American countries of the Pacific Alliance and Paraguay were the only ones in the subregion to receive more investment than that year. In Central America, only Panama and Guatemala saw growth in inflows. In the Caribbean subregion, the Dominican Republic reversed the previous year’s decline, Trinidad and Tobago received a positive investment flow after three years of negative balances, and Guyana saw a very significant year-on-year increase, as it had done in 2018, boosted by investments in hydrocarbon exploitation and related sectors, which positioned the country as the subregion’s second largest FDI recipient.
The outlook for the world and the region for 2020 is much more complex. The results achieved in the 2010s already underscored the need to rethink the role of FDI in

12 Economic Commission for Latin America and the Caribbean (ECLAC)Executive summary
supporting sustained growth with greater social equity and environmental sustainability. And that is the scenario that Latin America and the Caribbean face in 2020, a year that has been marked by the global health and economic crisis caused by the coronavirus disease (COVID-19) pandemic, largely unprecedented in history.
Indeed, the outlook is very uncertain and prospects depend on how long the health crisis lasts and how effective the public policy interventions are in mitigating the pandemic’s economic impact. It is estimated that global FDI will fall by 40% in 2020, and by between 5% and 10% in 2021.1
In Latin America, the situation is particularly complex. The Economic Commission for Latin America and the Caribbean (ECLAC) projects sharp declines in GDP and exports in 2020.2 The economic contraction would sink per capita GDP to 2010 levels and poverty rates to figures not seen since 2006.3 In that context, the prospects for FDI in Latin America and the Caribbean are particularly negative. According to official data for 2020, which in some countries refer to the third quarter of the year and in others to the second quarter, FDI fell by 36% in year-on-year terms. Several countries reported more severe drops than the regional average: Peru (-72%), Colombia (-50%), Brazil (-45%), Argentina (-35%) and Chile (-33%); meanwhile Mexico (-6%) did considerably better (see figure 2).
1 United Nations Conference on Trade and Development (UNCTAD), World Investment Report: International Production beyond the Pandemic, Geneva, 2020.
2 Economic Commission for Latin America and the Caribbean (ECLAC), “Addressing the growing impact of COVID-19 with a view to reactivation with equality: new projections,” COVID-19 Special Report, No. 5, Santiago, July 2020.
3 Ibid.
Figure 2 Latin America and the Caribbean (selected subregions and countries): foreign direct investment (FDI) inflows, 2019 and 2020(Billions of dollars and percentages)
20192020
-45% (October)
-6% (third quarter)
-50% (third quarter)
-33% (third quarter)
-47% (second quarter)
-72% (third quarter)
-35% (second quarter)
-27% (second quarter)
0 10 20 30 40 50 60 70
Brazil
Mexico
Colombia
Chile
Central America
Peru
Argentina
The Caribbean
Source: Economic Commission for Latin America and the Caribbean (ECLAC), on the basis of official information as of 1 December 2020.
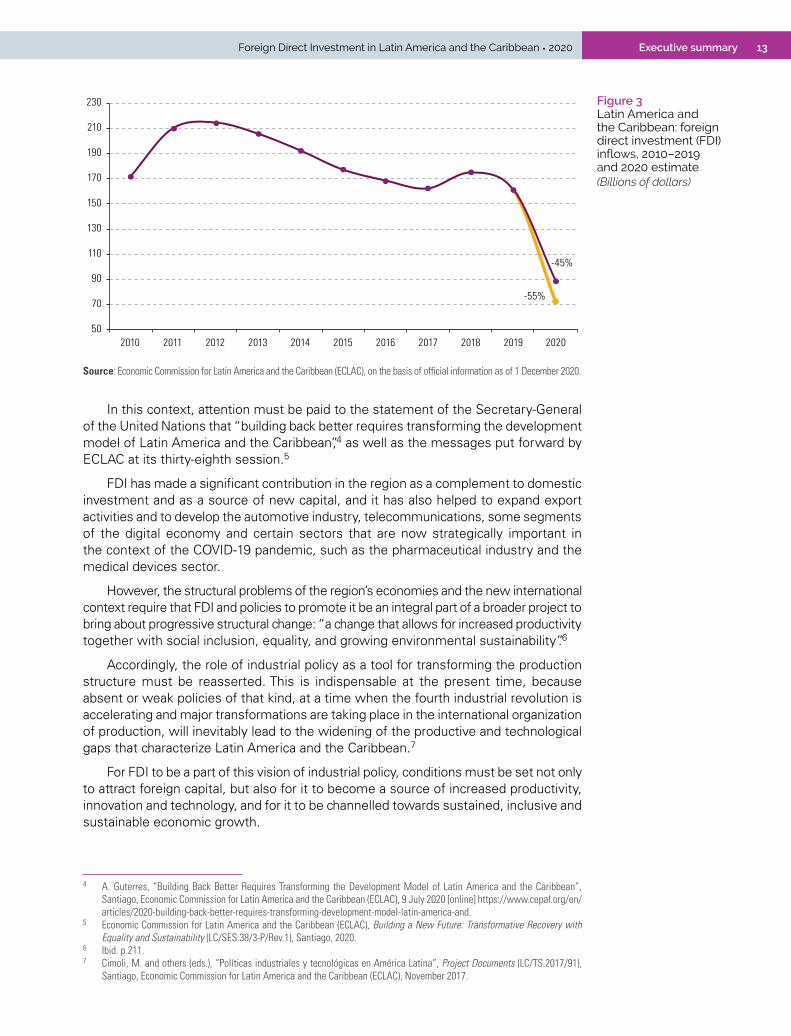
Across the region, the impact of the economic crisis was milder during the first quarter of the year; over that period, FDI inflows fell by 17% compared to the corresponding quarter in 2019. The impact of the pandemic, social constraints and the economic crisis deepened over the course of 2020, and this suggests that, compared to 2019, by the end of the year the FDI volume will have fallen by more than the figures for the first half of the year indicate. As a result, it has been estimated that FDI inflows into Latin America and the Caribbean as a whole will fall by between 45% and 55% (see figure 3).
13Executive summaryForeign Direct Investment in Latin America and the Caribbean • 2020
Figure 3 Latin America and the Caribbean: foreign direct investment (FDI) inflows, 2010–2019 and 2020 estimate(Billions of dollars)
50
70
90
110
130
150
170
190
210
230
2010 2011 2012 2013 2014 2015 2016 2017 2018 2019 2020
-55%
-45%
Source: Economic Commission for Latin America and the Caribbean (ECLAC), on the basis of official information as of 1 December 2020.
In this context, attention must be paid to the statement of the Secretary-General of the United Nations that “building back better requires transforming the development model of Latin America and the Caribbean”,4 as well as the messages put forward by ECLAC at its thirty-eighth session.5
FDI has made a significant contribution in the region as a complement to domestic investment and as a source of new capital, and it has also helped to expand export activities and to develop the automotive industry, telecommunications, some segments of the digital economy and certain sectors that are now strategically important in the context of the COVID-19 pandemic, such as the pharmaceutical industry and the medical devices sector.
However, the structural problems of the region’s economies and the new international context require that FDI and policies to promote it be an integral part of a broader project to bring about progressive structural change: “a change that allows for increased productivity together with social inclusion, equality, and growing environmental sustainability”.6
Accordingly, the role of industrial policy as a tool for transforming the production structure must be reasserted. This is indispensable at the present time, because absent or weak policies of that kind, at a time when the fourth industrial revolution is accelerating and major transformations are taking place in the international organization of production, will inevitably lead to the widening of the productive and technological gaps that characterize Latin America and the Caribbean.7
For FDI to be a part of this vision of industrial policy, conditions must be set not only to attract foreign capital, but also for it to become a source of increased productivity, innovation and technology, and for it to be channelled towards sustained, inclusive and sustainable economic growth.
4 A. Guterres, “Building Back Better Requires Transforming the Development Model of Latin America and the Caribbean”, Santiago, Economic Commission for Latin America and the Caribbean (ECLAC), 9 July 2020 [online] https://www.cepal.org/en/articles/2020-building-back-better-requires-transforming-development-model-latin-america-and.
5 Economic Commission for Latin America and the Caribbean (ECLAC), Building a New Future: Transformative Recovery with Equality and Sustainability (LC/SES.38/3-P/Rev.1), Santiago, 2020.
6 Ibid. p.211.7 Cimoli, M. and others (eds.), “Políticas industriales y tecnológicas en América Latina”, Project Documents (LC/TS.2017/91),
Santiago, Economic Commission for Latin America and the Caribbean (ECLAC), November 2017.
14 Economic Commission for Latin America and the Caribbean (ECLAC)Executive summary
With regard to mechanisms for policy implementation, it is important to consider that the dynamics in production specialization are linked to the incentives that determine how investments are allocated. Therefore, consensus is needed (among public and private actors and, more generally, in society as a whole) on which goals are priorities, with clear and well-defined leadership from the State.
B. Towards a new post-pandemic global production geography: the reorganization of global value chains
In the early 1990s, the interconnectedness of the world economy began to accelerate, driven by the rapid growth of international production, trade and FDI, and increasingly structured around global value chains. This was the result of technological advances and geopolitical and economic changes, which allowed the fragmentation and relocation of production, the reduction of trade-related costs and the coordination of complex cross-border supply networks.
This trend was concentrated in the machinery, electronics and transport equipment sectors. Although many countries have become incorporated into global value chains, these are firmly based around three large, interconnected regional production centres (or global factories): North America, with the United States at the heart; Asia, with China, Japan and the Republic of Korea as the main players; and Europe, centred around the large regional economies, particularly Germany.
In this period there were significant changes in the international insertion of Latin America and the Caribbean. On the one hand, South America’s specialization in primary commodities and natural-resource-based manufactures deepened. Thanks to its proximity to the United States and low relative wages, Central America’s exports of manufactured goods (mainly low-technology products, such as clothing) increased and the relative importance of primary commodities declined. With the signing of the North American Free Trade Agreement (NAFTA), Mexico became a very important link in the regional value chains of North America and progressively increased the technological intensity of its exports, mainly to the United States. The region’s integration into global value chains has been mainly in the area of extraction and processing of raw materials. On the other hand, the manufacturing sector has the highest levels of integration in complex chains and backward linkages. This suggests that this sector imports the most intermediate inputs, which are then used for the production of final goods for domestic consumption or re-export.
At the beginning of the 2010s, the same factors that drove the growth of international production and global value chains began to exert pressure in the opposite direction. Those factors include advances in technology, which erode comparative advantages based on low costs and increased protectionism in certain key economies for the linkage of global value chains.
China’s growing role in world production has generated, among other things, large trade deficits in manufactured goods with some of its major partners, particularly the United States. Thus, as China became an increasingly important source of manufactured goods, the relative importance of the rest of the industrialized world overall declined because many companies in those economies moved their manufacturing and assembly facilities to China through FDI. In this context, protectionist policies (tariff and non-tariff
15Executive summaryForeign Direct Investment in Latin America and the Caribbean • 2020
measures in trade and restrictive measures on foreign investment) have proliferated worldwide and have contributed to the slowdown in international production over the last decade, although they have not yet succeeded in bringing about a major reconfiguration of global value chains.
The lowering of the costs of technologies that reduce the need for labour –such as digitization, automation and additive manufacturing (3D printing)– tends to cancel out the disadvantage in labour costs that the more industrialized countries have historically experienced, allowing processes of reshoring and of bringing production closer to the markets of these countries, or nearshoring.
In the midst of these transformations, the COVID-19 pandemic struck. Its effects compound and accentuate the changes triggered by the technological and geopolitical factors mentioned above. While the crisis caused by COVID-19 has been widespread, the extent of its impact of has differed greatly from sector to sector. This highlights some of the weaknesses of this configuration of international production, which merits careful analysis, given that exogenous shocks, such as pandemics, are not isolated occurrences. However, there is evidence that environmental and global economic changes are increasing the frequency and magnitude of such disruptive events.
One of the main elements to consider is the hyperfragmentation of international production. Hyperfragmentation has allowed static (mainly labour cost) and dynamic (specialization by production phase) advantages to be exploited, but it has also generated morally questionable and unsustainable working conditions and increased the difficulties of managing the operation as a whole. It is in relation to the last that the crisis has exposed the greatest weaknesses: the violent external shock has led many leader companies to the realization that they do not have control over the global production process and that they do not even know the exact state of their suppliers, particularly those at the second and third tiers.
Companies have used different and somewhat incompatible strategies to take back control of their supply networks. The most frequent strategies are those that aim to increase the resilience or the robustness of the network. Resilience strategies focus on reducing the complexity of the network and strengthening relationships of trust with suppliers. Robustness strategies focus on increased inventories and redundancy and geographical diversification of suppliers.
The implementation of these strategies varies depending on the industry, the characteristics of the leader companies and the political and institutional context in which the companies operate. Any number of combinations are therefore possible. However, four possible trajectories can be established in stylized terms: reshoring, diversification of external suppliers, development of regional production poles and replication. The technological and geopolitical megatrends affect the potential paths described above in different ways, along with the growing sensitivity of markets to environmental sustainability issues.
It is difficult to foresee how this process will affect the productive structure of Latin America and the Caribbean. What is clear, however, is that the region will be influenced by forces acting in opposite directions, towards the reshoring of companies in countries of origin or towards regionalization. One factor that may tip the balance one way or the other is the policies adopted by the governments of the countries in the region. Against this backdrop, some key policy areas can be identified: improving security by strengthening production infrastructure; boosting innovation and technological capacities in companies, especially in the area of digital technologies; and promoting economic and political integration processes at regional level.
16 Economic Commission for Latin America and the Caribbean (ECLAC)Executive summary
C. New scenarios for the medical device sector in Latin America and the Caribbean
The medical device sector has played a fundamental role in combating the pandemic; and it is very interesting to analyse its characteristics and how it operates, for the design of policies that support sustainable development and productive diversification in the region. The medical devices sector embraces an extremely wide universe of products of varying technological complexity and risk for people’s health (from bandages and needles to prostheses and ultrasound equipment, for example) and can be considered strategic for Latin America and the Caribbean, both because of the technological, business and skill capacities it requires, and from the standpoint of the development and strength of the countries’ health systems.
The global medical devices market is dominated by firms based in developed countries. Nonetheless, there are a number of firms in the region that compete successfully in this industry, both domestically and internationally, through exports. Although in some cases the firms in question rely on foreign capital —for example, in conjunction with transnational corporations that export successfully from Costa Rica, the Dominican Republic or Mexico— there also are locally owned firms that compete in the domestic market with imports from large transnationals and also succeed in exporting. There are examples in Argentina, Brazil, Costa Rica, Mexico and Uruguay, and elsewhere.
In several manufacturing industries of medium and high technological complexity, such as automotive and electronics, production has been organized in global value chains. The internationalization strategy that involves leveraging of cost advantages, seeking efficiency, accessing markets and, sometimes, having access to strategic assets is not widespread in the medical device industry. The sector offshored its production to a limited extent, as shown in low cross-border capital flows.
Certain characteristics of the medical device industry explain this low propensity to set up plants overseas to exploit cost advantages. Firstly, it is an industry with high innovation requirements, mainly in the medium- and high-technological complexity segments. This means that the protection of intellectual property in production locations is an important decision factor. Moreover, many of the medical devices have high risks for human health; and nearly all, even those of low technological complexity, have certification requirements. Regulations are strict, and become more demanding as the risk to individuals increases; and the fact that they are not standardized internationally affects potential relocation processes. Also, many medical devices are tailor-made for the patient and adjusted according to their needs, which makes proximity to the end user a key requirement. As a result, as is the case in the rest of the world, FDI in medical devices in Latin America and the Caribbean has involved relatively small amounts compared to other manufacturing industries, such as automotive and autoparts, electronics, chemicals or pharmaceuticals.
The region is thus increasingly important as a supplier to the global medical device market, with a share of global exports of 7.8% between 2014 and 2018. However, the region’s strong positioning in medical device exports is not due to widespread specialization across Latin American and Caribbean countries. On the contrary, the exports come from a very few countries: Mexico and Costa Rica in first and second place, respectively, followed by the Dominican Republic and Brazil. Furthermore, the

17Executive summaryForeign Direct Investment in Latin America and the Caribbean • 2020
exports of the three main exporting countries in Latin America and the Caribbean have a larger share of medium- and low-complexity goods than both the global average and the world’s three main exporting countries (United States, Germany and China). The expansion of the medical device industry in the last few decades has fuelled not only a sustained increase in exports in Costa Rica and Mexico, but also an increase in the share of highly complex technological goods in the export basket of this value chain. In Costa Rica, for example, between 2002 and 2007 only 6.4% of the value exported represented goods of high technological complexity; but the proportion had risen since 2008 to reach 26% in 2017 and 2018.
Despite this growth, the fact that a few of the region’s countries have specialized in exports of certain medical devices has not been sufficient to make intraregional trade the main source of supply in Latin America and the Caribbean. Instead, most imports come from outside the region, particularly from the United States, the European Union and China. On average, just 6% of the region’s medical device imports in 2014–2018 came from the within region.
In this scenario, the countries of the region that have medical device production capacity display a duality in the type of firms and their production. This reflects the region’s structural heterogeneity in nearly all of its production activities: firstly, an industry consisting of transnational corporations, operating within fairly narrow global value chains, which in the region operates in the segments of medium and low technological complexity, but also (increasingly) manufactures goods of high technological complexity; and, secondly another industry, consisting of national firms that mainly supply the domestic market, with fewer export opportunities, but some exceptions of very sophisticated firms, generally SMEs, which compete successfully in specific segments.
At the regional level, the COVID-19 crisis shows the increasing importance of stimulating cooperation in the region and developing a regional market for health and medical devices, along with cross-border industrial centres. The medical device industry requires manufacturing, scientific and technological capacities which exist in several countries of the region and whose potential became apparent during the health emergency. Developing industrial and technological capacities in countries and improving access to medical devices for the Latin American and Caribbean population is a strategic challenge, one that will demand national and regional policy guidelines in order to be successfully addressed.


19Chapter IForeign Direct Investment in Latin America and the Caribbean • 2020
ICHAPTER
A. 2019 saw a slight increase in global FDI after two years of decline
B. The region’s FDI has been in an almost steady decline since 2012
C. Latin American investments overseas: difficult times
D. Complicated prospects for the world and the region in 2020
E. Conclusions
F. Analysis by country
Bibliography
Overview of foreign direct investment in the region

21Chapter IForeign Direct Investment in Latin America and the Caribbean • 2020 IA. 2019 saw a slight increase in global FDI
after two years of decline
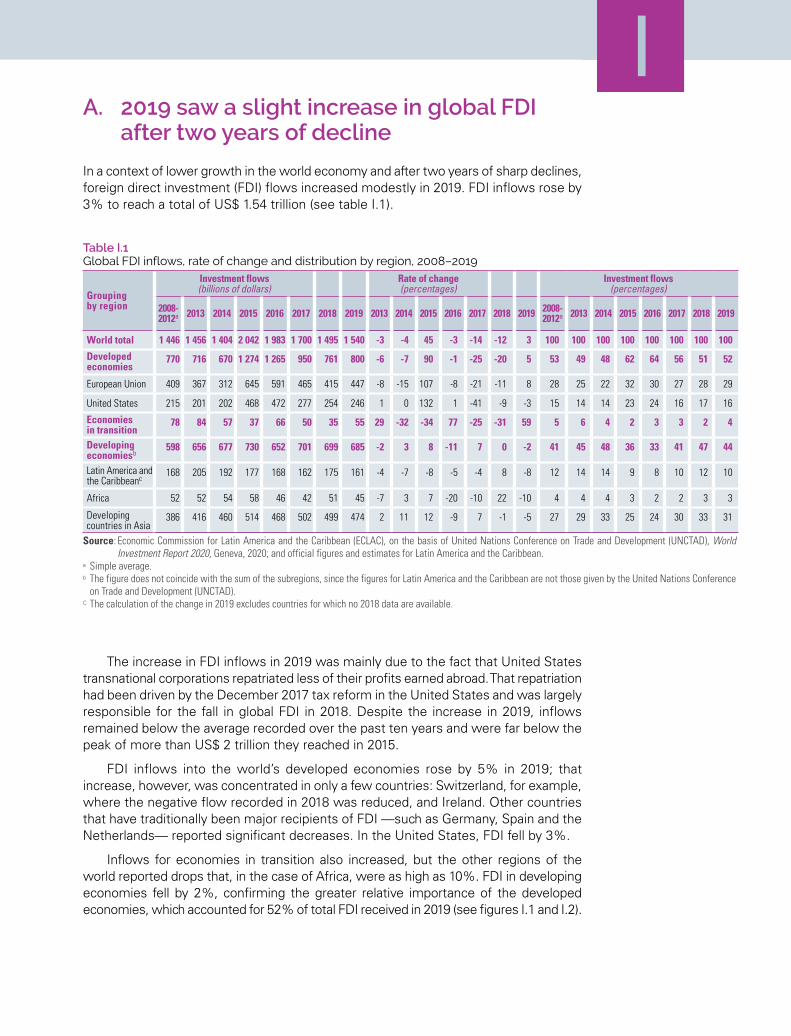
In a context of lower growth in the world economy and after two years of sharp declines, foreign direct investment (FDI) flows increased modestly in 2019. FDI inflows rose by 3% to reach a total of US$ 1.54 trillion (see table I.1).
Table I.1 Global FDI inflows, rate of change and distribution by region, 2008–2019
Grouping by region
Investment flows (billions of dollars) Rate of change
(percentages) Investment flows (percentages)
2008-2012a 2013 2014 2015 2016 2017 2018 2019 2013 2014 2015 2016 2017 2018 2019 2008-
2012a 2013 2014 2015 2016 2017 2018 2019
World total 1 446 1 456 1 404 2 042 1 983 1 700 1 495 1 540 -3 -4 45 -3 -14 -12 3 100 100 100 100 100 100 100 100
Developed economies
770 716 670 1 274 1 265 950 761 800 -6 -7 90 -1 -25 -20 5 53 49 48 62 64 56 51 52
European Union 409 367 312 645 591 465 415 447 -8 -15 107 -8 -21 -11 8 28 25 22 32 30 27 28 29
United States 215 201 202 468 472 277 254 246 1 0 132 1 -41 -9 -3 15 14 14 23 24 16 17 16
Economies in transition
78 84 57 37 66 50 35 55 29 -32 -34 77 -25 -31 59 5 6 4 2 3 3 2 4
Developing economiesb
598 656 677 730 652 701 699 685 -2 3 8 -11 7 0 -2 41 45 48 36 33 41 47 44
Latin America and the Caribbeanc
168 205 192 177 168 162 175 161 -4 -7 -8 -5 -4 8 -8 12 14 14 9 8 10 12 10
Africa 52 52 54 58 46 42 51 45 -7 3 7 -20 -10 22 -10 4 4 4 3 2 2 3 3
Developing countries in Asia
386 416 460 514 468 502 499 474 2 11 12 -9 7 -1 -5 27 29 33 25 24 30 33 31
Source: Economic Commission for Latin America and the Caribbean (ECLAC), on the basis of United Nations Conference on Trade and Development (UNCTAD), World Investment Report 2020, Geneva, 2020; and official figures and estimates for Latin America and the Caribbean.
a Simple average.b The figure does not coincide with the sum of the subregions, since the figures for Latin America and the Caribbean are not those given by the United Nations Conference
on Trade and Development (UNCTAD).C The calculation of the change in 2019 excludes countries for which no 2018 data are available.
The increase in FDI inflows in 2019 was mainly due to the fact that United States transnational corporations repatriated less of their profits earned abroad. That repatriation had been driven by the December 2017 tax reform in the United States and was largely responsible for the fall in global FDI in 2018. Despite the increase in 2019, inflows remained below the average recorded over the past ten years and were far below the peak of more than US$ 2 trillion they reached in 2015.
FDI inflows into the world’s developed economies rose by 5% in 2019; that increase, however, was concentrated in only a few countries: Switzerland, for example, where the negative flow recorded in 2018 was reduced, and Ireland. Other countries that have traditionally been major recipients of FDI —such as Germany, Spain and the Netherlands— reported significant decreases. In the United States, FDI fell by 3%.
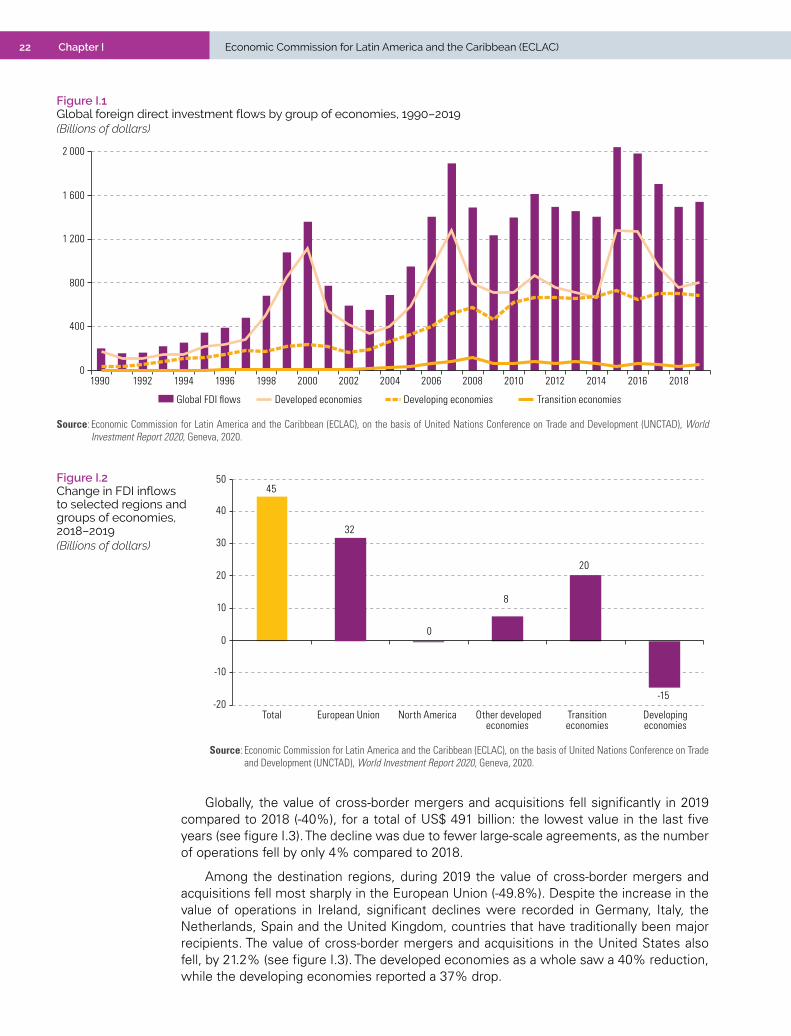
Inflows for economies in transition also increased, but the other regions of the world reported drops that, in the case of Africa, were as high as 10%. FDI in developing economies fell by 2%, confirming the greater relative importance of the developed economies, which accounted for 52% of total FDI received in 2019 (see figures I.1 and I.2).
22 Chapter I Economic Commission for Latin America and the Caribbean (ECLAC)
Figure I.1 Global foreign direct investment flows by group of economies, 1990–2019(Billions of dollars)
0
400
800
1 200
1 600
2 000
1990 1992 1994 1996 1998 2000 2002 2004 2006 2008 2010 2012 2014 2016 2018
Global FDI flows Developed economies Developing economies Transition economies
Source: Economic Commission for Latin America and the Caribbean (ECLAC), on the basis of United Nations Conference on Trade and Development (UNCTAD), World Investment Report 2020, Geneva, 2020.
Globally, the value of cross-border mergers and acquisitions fell significantly in 2019 compared to 2018 (-40%), for a total of US$ 491 billion: the lowest value in the last five years (see figure I.3). The decline was due to fewer large-scale agreements, as the number of operations fell by only 4% compared to 2018.
Among the destination regions, during 2019 the value of cross-border mergers and acquisitions fell most sharply in the European Union (-49.8%). Despite the increase in the value of operations in Ireland, significant declines were recorded in Germany, Italy, the Netherlands, Spain and the United Kingdom, countries that have traditionally been major recipients. The value of cross-border mergers and acquisitions in the United States also fell, by 21.2% (see figure I.3). The developed economies as a whole saw a 40% reduction, while the developing economies reported a 37% drop.
Figure I.2 Change in FDI inflows to selected regions and groups of economies, 2018–2019(Billions of dollars)
0
10
-10
-20
20
30
40
5045
32
0
8
20
-15
Total European Union North America Other developedeconomies
Transition economies
Developingeconomies
Source: Economic Commission for Latin America and the Caribbean (ECLAC), on the basis of United Nations Conference on Trade and Development (UNCTAD), World Investment Report 2020, Geneva, 2020.

23Chapter IForeign Direct Investment in Latin America and the Caribbean • 2020
Figure I.3 Net cross-border mergers and acquisitions, by destination region or country, 2003–2019(Billions of dollars)
0
200
400
600
800
1 000
1 200
2003 2004 2005 2006 2007 2008 2009 2010 2011 2012 2013 2014 2015 2016 2017 2018 2019
European Union United States Developing economies in Asia Rest of world
Source: Economic Commission for Latin America and the Caribbean (ECLAC), on the basis of United Nations Conference on Trade and Development (UNCTAD), World Investment Report 2020, Geneva, 2020.
Note: The net cross-border mergers and acquisitions figures given by the United Nations Conference on Trade and Development (UNCTAD) indicate the value of sales of companies in the receiving economy to foreign companies, minus the value of the sale of foreign affiliates in the receiving economy.
Thus, the fact that the 2017 tax reform in the United States led to increased liquidity for companies based in that country does not seem to have translated into cross-border purchases in 2019, in contrast to the strong upswing in those operations in the final quarter of 2018.
At the same time, the fall in total merger and acquisition activity, which includes domestic operations, has been considerably smaller (-14%), and that confirms the lower inclination of investors towards cross-border operations (UNCTAD, 2020).
Among the different sectors, the most pronounced drops in the service industries occurred in information and communications services1 and financial and insurance activities and, among manufacturing activities, in the chemical industry, electronics and computers. The pharmaceutical industry reported a considerable increase of 70% over 2018, largely on account of the purchase of the Irish company Shire for approximately US$ 60 billion. The buyer was Takeda, Japan’s largest pharmaceutical company, and this acquisition placed it among the world’s largest ten pharmaceutical companies by sales volume.
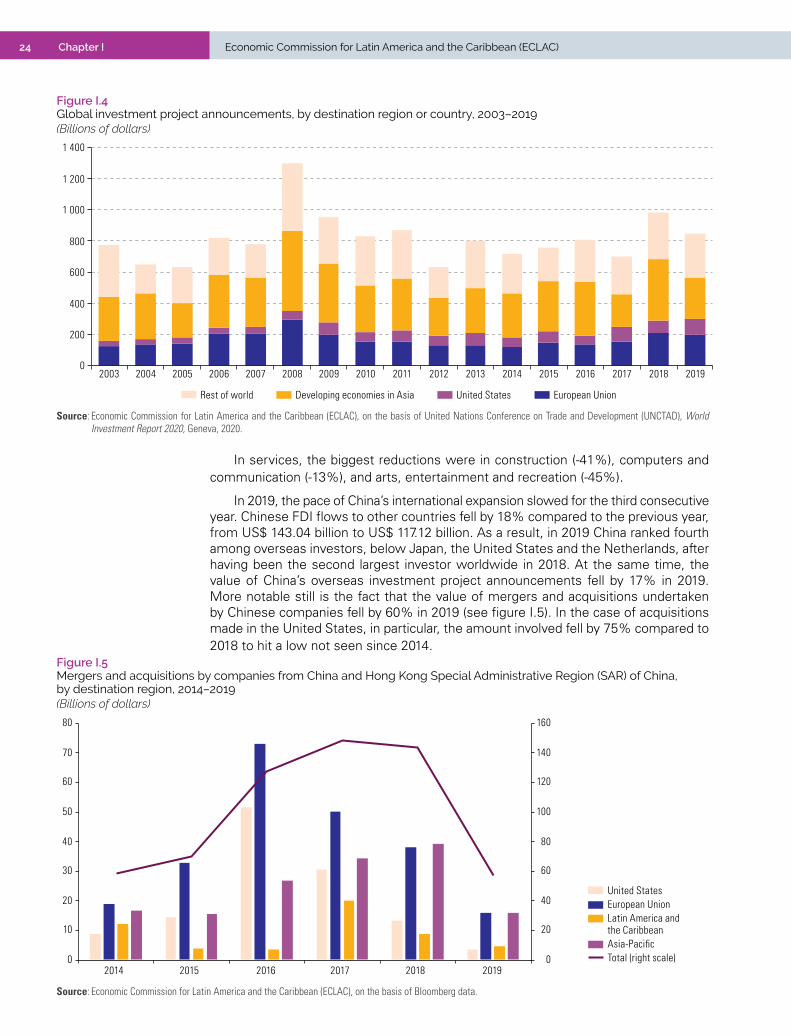
In 2019, the total value of investment project announcements fell by 14% to US$ 846 billion. In the United States there was a significant increase of 36%, but the European Union and in the developing economies of Asia reported decreases of 6% and 33% respectively (see figure I.4).
Falls in investment announcements were seen in the primary sector (-53%), manufacturing (-14%) and services (-10%). In the primary sector, the decrease was essentially due to the sharp decline in projects associated with mining activities, the value of which fell by 55% (from US$ 43 billion to US$ 18 billion).
In manufacturing as a whole, the final result was negative due to the drops observed in the chemical industry (-44%) and in metallurgy and metal products (-46%), as well as in some high-technology sectors, such as electronics and computers, and automobiles and other transport equipment. That notwithstanding, there were increases in oil refining projects (12%) and paper and cellulose projects (41%).
1 The information and communication sector covers publishing, television and radio, telecommunications, information technology, software and data processing.
24 Chapter I Economic Commission for Latin America and the Caribbean (ECLAC)
Figure I.4 Global investment project announcements, by destination region or country, 2003–2019(Billions of dollars)
0
200
400
600
800
1 000
1 200
1 400
2003 2004 2005 2006 2007 2008 2009 2010 2011 2012 2013 2014 2015 2016 2017 2018 2019
European UnionUnited States Developing economies in AsiaRest of world
Source: Economic Commission for Latin America and the Caribbean (ECLAC), on the basis of United Nations Conference on Trade and Development (UNCTAD), World Investment Report 2020, Geneva, 2020.
In services, the biggest reductions were in construction (-41%), computers and communication (-13%), and arts, entertainment and recreation (-45%).
In 2019, the pace of China’s international expansion slowed for the third consecutive year. Chinese FDI flows to other countries fell by 18% compared to the previous year, from US$ 143.04 billion to US$ 117.12 billion. As a result, in 2019 China ranked fourth among overseas investors, below Japan, the United States and the Netherlands, after having been the second largest investor worldwide in 2018. At the same time, the value of China’s overseas investment project announcements fell by 17% in 2019. More notable still is the fact that the value of mergers and acquisitions undertaken by Chinese companies fell by 60% in 2019 (see figure I.5). In the case of acquisitions made in the United States, in particular, the amount involved fell by 75% compared to 2018 to hit a low not seen since 2014.
Figure I.5 Mergers and acquisitions by companies from China and Hong Kong Special Administrative Region (SAR) of China, by destination region, 2014–2019(Billions of dollars)
0
20
40
60
80
100
120
140
160
0
10
20
30
40
50
60
70
80
2014 2015 2016 2017 2018 2019
United States European Union Latin America and the Caribbean Asia-Pacific Total (right scale)
Source: Economic Commission for Latin America and the Caribbean (ECLAC), on the basis of Bloomberg data.

25Chapter IForeign Direct Investment in Latin America and the Caribbean • 2020
In 2017, the Chinese authorities’ instructions for Chinese transnational corporations to redirect their investments towards national priorities (the Belt and Road Initiative, and the Made in China 2025 industrial development strategy) came into effect. This goes some way towards explaining these results. Similarly, the controls and restrictions imposed by the United States and the European Union countries on certain high-technology sectors had an impact on the lower number of acquisitions by Chinese transnational corporations.
B. The region’s FDI has been in an almost steady decline since 2012
1. FDI inflows fell by 7.8% in 2019
At the beginning of the 2010s, foreign direct investment inflows into Latin America and the Caribbean were expanding. At a time when the world was still reeling from the effects of the 2008 global financial crisis, developing economies were gaining prominence as recipients of capital flows of this kind, commodity prices were booming and the region’s growth rates were robust. The picture this painted suggested that Latin America and the Caribbean would receive more and more investment. Thus, FDI entering the region in 2011 and 2012 marked a historic high, accounting for 14% of the global total. Those healthy inflows, however, did not survive the first two years of the decade and, in 2013, FDI began to fall (see figure I.6). Moreover, this took place against a backdrop of weak economic growth and falling commodity prices.
Figure I.6 Latin America and the Caribbean: foreign direct investment (FDI) inflows, 2010–2019(Billions of dollars and percentages of GDP)
FDI inflows FDI inflows as a percentage of GDP (right scale)
160.72
3.2
2
3
4
5
6
7
8
140
150
160
170
180
190
200
210
220
2010 2011 2012 2013 2014 2015 2016 2017 2018 2019
Source: Economic Commission for Latin America and the Caribbean (ECLAC), on the basis of official figures and estimates as of 1 December 2020. Note: Information according to the Balance of Payments and International Investment Position Manual: Sixth Edition (BPM6) of the International Monetary Fund (IMF, 2009),
except for the Bahamas, Barbados, Guyana, Haiti, Paraguay, Peru and Suriname, which use the methodology of the Balance of Payments and International Investment Position Manual: Fifth Edition (BPM5). No information is available from the Bolivarian Republic of Venezuela for 2016 or thereafter. No 2019 figures are available for Antigua and Barbuda, Dominica, Grenada, Saint Kitts and Nevis, Saint Vincent and the Grenadines or Saint Lucia.

26 Chapter I Economic Commission for Latin America and the Caribbean (ECLAC)
Comparing the first and second halves of the decade, average annual FDI inflows fell by 13.9%. The stagnation of recent years was not an isolated phenomenon: it arrived alongside a weakening of investment dynamism worldwide. Thus, in 2019, Latin America and the Caribbean received US$ 160.721 billion in FDI, 7.8% less than in 2018. With that result, FDI inflows represented 3.2% of GDP, slightly below the decade’s average (3.4%).
This evolution unfolded unevenly across the different countries and subregions that make up Latin America and the Caribbean. Between the first and second halves of the decade, investment inflows fell primarily in the South American countries; in contrast, in Mexico, Central America and the Caribbean, investment grew or at least held steady over the course of the decade (see figure I.7).
Figure I.7 Latin America and the Caribbean (selected countries and subregions): foreign direct investment (FDI) inflows, 2010–2019(Billions of dollars)
0
10
20
30
40
50
60
70
80
90
100
Brazil Remainder ofSouth America
Mexico Central America The Caribbean
2010-20142015-2019
Source: Economic Commission for Latin America and the Caribbean (ECLAC), on the basis of International Monetary Fund (IMF), Balance of Payments and International Investment Position Manual: Sixth Edition (BPM6), Washington, D.C., 2009; official figures and estimates as of 1 December 2020.
Note: Information according to the Balance of Payments and International Investment Position Manual: Sixth Edition (BPM6) of the International Monetary Fund (IMF, 2009), except for the Bahamas, Barbados, Guyana, Haiti, Paraguay, Peru and Suriname, which use the methodology of the Balance of Payments and International Investment Position Manual: Fifth Edition (BPM5). The Bolivarian Republic of Venezuela is not included in the analysis, as no information is available for 2016 or thereafter. No 2019 figures are available for Antigua and Barbuda, Dominica, Grenada, Saint Kitts and Nevis, Saint Vincent and the Grenadines or Saint Lucia.
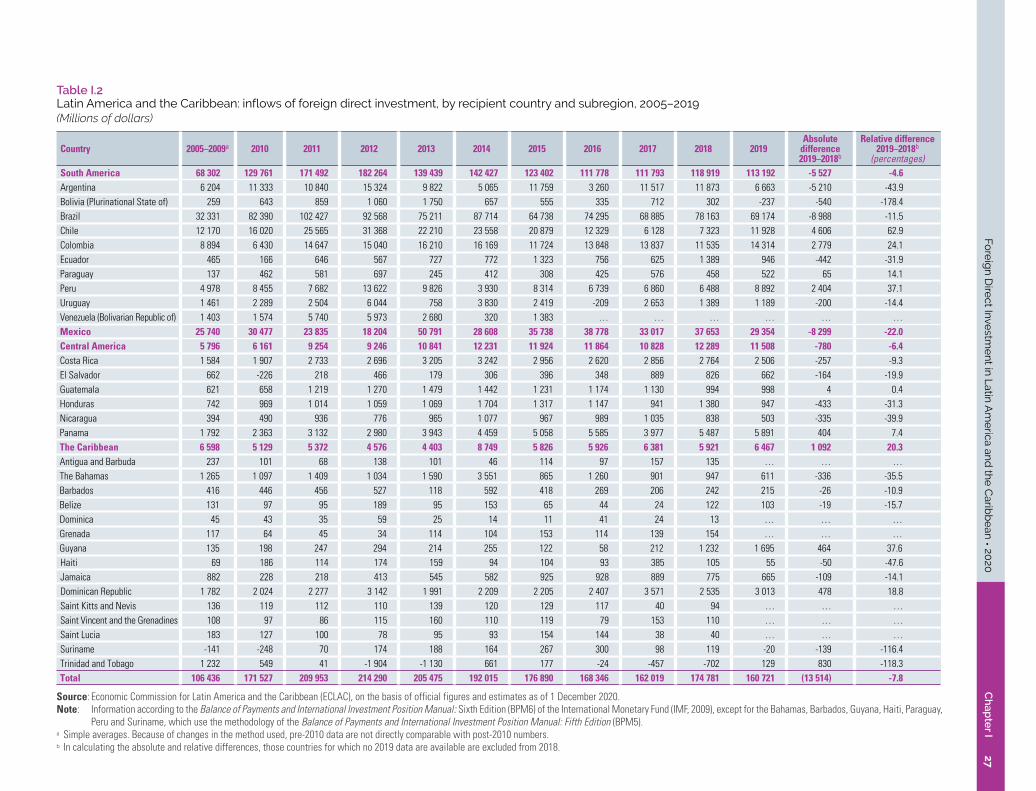
Comparing 2019 to 2018, FDI inflows increased in only nine of the region’s countries, which means that most economies posted negative performances (see table I.2). The five countries that received the most investment that year were Brazil (43% of the total), Mexico (18%), Colombia (9%), Chile (7%) and Peru (6%). Brazil and Mexico received less investment than in 2018, while Paraguay and the three South American countries of the Pacific Alliance received more. In Central America, inflows increased in only Panama and Guatemala, and then only weakly. In the Caribbean subregion, the Dominican Republic reversed the previous year’s decline, Trinidad and Tobago received a positive investment flow after three years of negative balances, and Guyana saw a very significant year-on-year increase, as it had done in 2018, boosted by investments in hydrocarbon exploitation and related sectors, which positioned the country as the subregion’s second largest FDI recipient.
27C
hap
ter I
Fore
ign
Dire
ct Investm
ent in
Latin
Am
erica an
d th
e C
aribb
ean
• 2020
Table I.2 Latin America and the Caribbean: inflows of foreign direct investment, by recipient country and subregion, 2005–2019(Millions of dollars)
Country 2005–2009a 2010 2011 2012 2013 2014 2015 2016 2017 2018 2019Absolute
difference 2019–2018b
Relative difference 2019–2018b
(percentages)South America 68 302 129 761 171 492 182 264 139 439 142 427 123 402 111 778 111 793 118 919 113 192 -5 527 -4.6Argentina 6 204 11 333 10 840 15 324 9 822 5 065 11 759 3 260 11 517 11 873 6 663 -5 210 -43.9Bolivia (Plurinational State of) 259 643 859 1 060 1 750 657 555 335 712 302 -237 -540 -178.4Brazil 32 331 82 390 102 427 92 568 75 211 87 714 64 738 74 295 68 885 78 163 69 174 -8 988 -11.5Chile 12 170 16 020 25 565 31 368 22 210 23 558 20 879 12 329 6 128 7 323 11 928 4 606 62.9Colombia 8 894 6 430 14 647 15 040 16 210 16 169 11 724 13 848 13 837 11 535 14 314 2 779 24.1Ecuador 465 166 646 567 727 772 1 323 756 625 1 389 946 -442 -31.9Paraguay 137 462 581 697 245 412 308 425 576 458 522 65 14.1Peru 4 978 8 455 7 682 13 622 9 826 3 930 8 314 6 739 6 860 6 488 8 892 2 404 37.1Uruguay 1 461 2 289 2 504 6 044 758 3 830 2 419 -209 2 653 1 389 1 189 -200 -14.4Venezuela (Bolivarian Republic of) 1 403 1 574 5 740 5 973 2 680 320 1 383 … … … … … …Mexico 25 740 30 477 23 835 18 204 50 791 28 608 35 738 38 778 33 017 37 653 29 354 -8 299 -22.0Central America 5 796 6 161 9 254 9 246 10 841 12 231 11 924 11 864 10 828 12 289 11 508 -780 -6.4Costa Rica 1 584 1 907 2 733 2 696 3 205 3 242 2 956 2 620 2 856 2 764 2 506 -257 -9.3El Salvador 662 -226 218 466 179 306 396 348 889 826 662 -164 -19.9Guatemala 621 658 1 219 1 270 1 479 1 442 1 231 1 174 1 130 994 998 4 0.4Honduras 742 969 1 014 1 059 1 069 1 704 1 317 1 147 941 1 380 947 -433 -31.3Nicaragua 394 490 936 776 965 1 077 967 989 1 035 838 503 -335 -39.9Panama 1 792 2 363 3 132 2 980 3 943 4 459 5 058 5 585 3 977 5 487 5 891 404 7.4The Caribbean 6 598 5 129 5 372 4 576 4 403 8 749 5 826 5 926 6 381 5 921 6 467 1 092 20.3Antigua and Barbuda 237 101 68 138 101 46 114 97 157 135 … … …The Bahamas 1 265 1 097 1 409 1 034 1 590 3 551 865 1 260 901 947 611 -336 -35.5Barbados 416 446 456 527 118 592 418 269 206 242 215 -26 -10.9Belize 131 97 95 189 95 153 65 44 24 122 103 -19 -15.7Dominica 45 43 35 59 25 14 11 41 24 13 … … …Grenada 117 64 45 34 114 104 153 114 139 154 … … …Guyana 135 198 247 294 214 255 122 58 212 1 232 1 695 464 37.6Haiti 69 186 114 174 159 94 104 93 385 105 55 -50 -47.6Jamaica 882 228 218 413 545 582 925 928 889 775 665 -109 -14.1Dominican Republic 1 782 2 024 2 277 3 142 1 991 2 209 2 205 2 407 3 571 2 535 3 013 478 18.8Saint Kitts and Nevis 136 119 112 110 139 120 129 117 40 94 … … …Saint Vincent and the Grenadines 108 97 86 115 160 110 119 79 153 110 … … …Saint Lucia 183 127 100 78 95 93 154 144 38 40 … … …Suriname -141 -248 70 174 188 164 267 300 98 119 -20 -139 -116.4Trinidad and Tobago 1 232 549 41 -1 904 -1 130 661 177 -24 -457 -702 129 830 -118.3Total 106 436 171 527 209 953 214 290 205 475 192 015 176 890 168 346 162 019 174 781 160 721 (13 514) -7.8
Source: Economic Commission for Latin America and the Caribbean (ECLAC), on the basis of official figures and estimates as of 1 December 2020. Note: Information according to the Balance of Payments and International Investment Position Manual: Sixth Edition (BPM6) of the International Monetary Fund (IMF, 2009), except for the Bahamas, Barbados, Guyana, Haiti, Paraguay,
Peru and Suriname, which use the methodology of the Balance of Payments and International Investment Position Manual: Fifth Edition (BPM5).a Simple averages. Because of changes in the method used, pre-2010 data are not directly comparable with post-2010 numbers. b In calculating the absolute and relative differences, those countries for which no 2019 data are available are excluded from 2018.

28 Chapter I Economic Commission for Latin America and the Caribbean (ECLAC)
An analysis of the different components of FDI reveals that capital inflows from intercompany loans, which fell by 60%, accounted for the lower total in 2019, as equity and reinvested earnings increased by 17% and 2%, respectively, over the previous year (see figure I.8). The growth in equity inflows can be seen as a positive sign, since this component best indicates the renewed interest of companies in setting up in the region’s countries; the amount received, however, was still below the results observed up to 2017. At the same time, reinvested earnings as a proportion of FDI, which reflect established companies’ confidence in the region, hit a record level in 2019 (41% of the total). That year, FDI inflows from loans between subsidiaries and parent companies accounted for 11% of the total, the component’s lowest share this decade.
Figure I.8 Latin America and the Caribbean: foreign direct investment (FDI) inflows, by components, 2010–2019(Billions of dollars)
Equity
Reinvested earnings
Intercompany loans0
20
40
60
80
100
120
2010 2011 2012 2013 2014 2015 2016 2017 2018 2019
Source: Economic Commission for Latin America and the Caribbean (ECLAC), on the basis of official figures and estimates as of 1 December 2020.Note: Antigua and Barbuda, the Bolivarian Republic of Venezuela, Dominica, Grenada, Saint Kitts and Nevis, Saint Lucia, Saint Vincent and the Grenadines, Suriname and
Trinidad and Tobago and are not included because 2019 data from those countries are not available. El Salvador, Guyana, Haiti, Jamaica and Nicaragua are also excluded because figures broken down by components are not available. The component data for the Plurinational State of Bolivia represent gross FDI inflows.
Equity inflows was the least volatile component, although it declined gradually over the decade. In 2019, the region’s five largest recipients reported a year-on-year increase in equity. In fact, the reduction in FDI inflows observed in Brazil and Mexico in 2019 was due to lower inflows from loans between subsidiaries, as inflows from reinvested earnings increased in both countries. In Chile, Colombia and Peru, the year-on-year increase was explained by increased equity inflows and intercompany loans, while inflows from reinvested earnings fell.
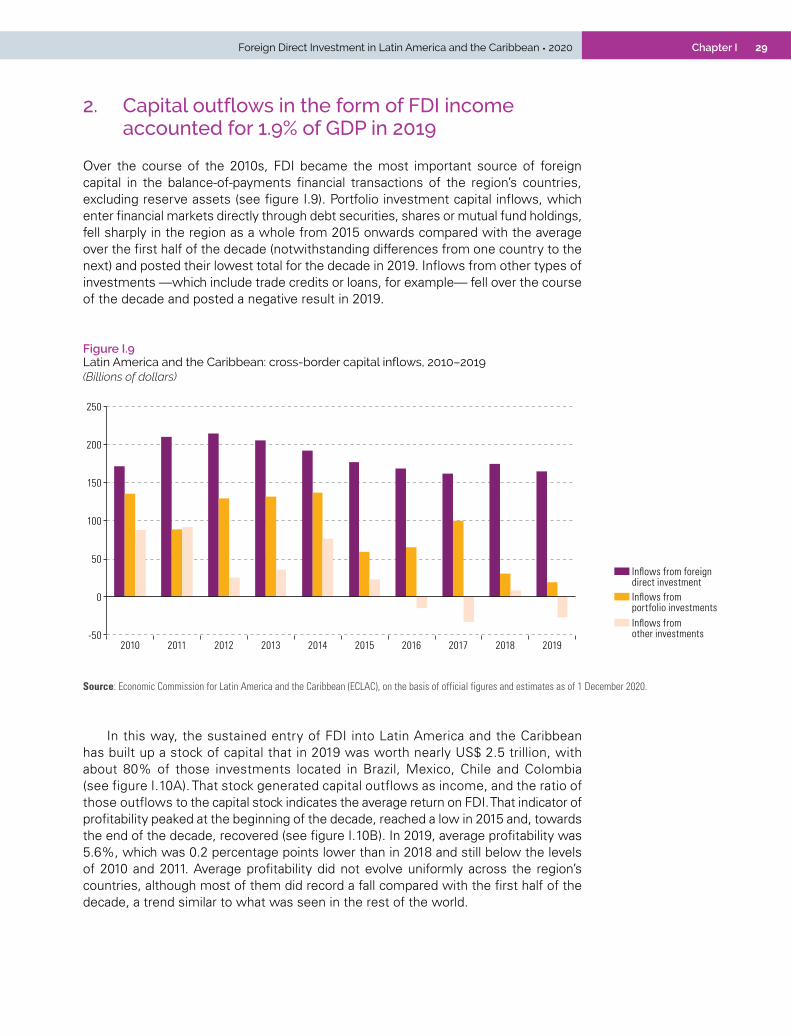
29Chapter IForeign Direct Investment in Latin America and the Caribbean • 2020
2. Capital outflows in the form of FDI income accounted for 1.9% of GDP in 2019
Over the course of the 2010s, FDI became the most important source of foreign capital in the balance-of-payments financial transactions of the region’s countries, excluding reserve assets (see figure I.9). Portfolio investment capital inflows, which enter financial markets directly through debt securities, shares or mutual fund holdings, fell sharply in the region as a whole from 2015 onwards compared with the average over the first half of the decade (notwithstanding differences from one country to the next) and posted their lowest total for the decade in 2019. Inflows from other types of investments —which include trade credits or loans, for example— fell over the course of the decade and posted a negative result in 2019.
Figure I.9 Latin America and the Caribbean: cross-border capital inflows, 2010–2019(Billions of dollars)
-50
0
50
100
150
200
250
2010 2011 2012 2013 2014 2015 2016 2017 2018 2019
Inflows from foreigndirect investment Inflows from portfolio investments Inflows fromother investments
Source: Economic Commission for Latin America and the Caribbean (ECLAC), on the basis of official figures and estimates as of 1 December 2020.
In this way, the sustained entry of FDI into Latin America and the Caribbean has built up a stock of capital that in 2019 was worth nearly US$ 2.5 trillion, with about 80% of those investments located in Brazil, Mexico, Chile and Colombia (see figure I.10A). That stock generated capital outflows as income, and the ratio of those outflows to the capital stock indicates the average return on FDI. That indicator of profitability peaked at the beginning of the decade, reached a low in 2015 and, towards the end of the decade, recovered (see figure I.10B). In 2019, average profitability was 5.6%, which was 0.2 percentage points lower than in 2018 and still below the levels of 2010 and 2011. Average profitability did not evolve uniformly across the region’s countries, although most of them did record a fall compared with the first half of the decade, a trend similar to what was seen in the rest of the world.
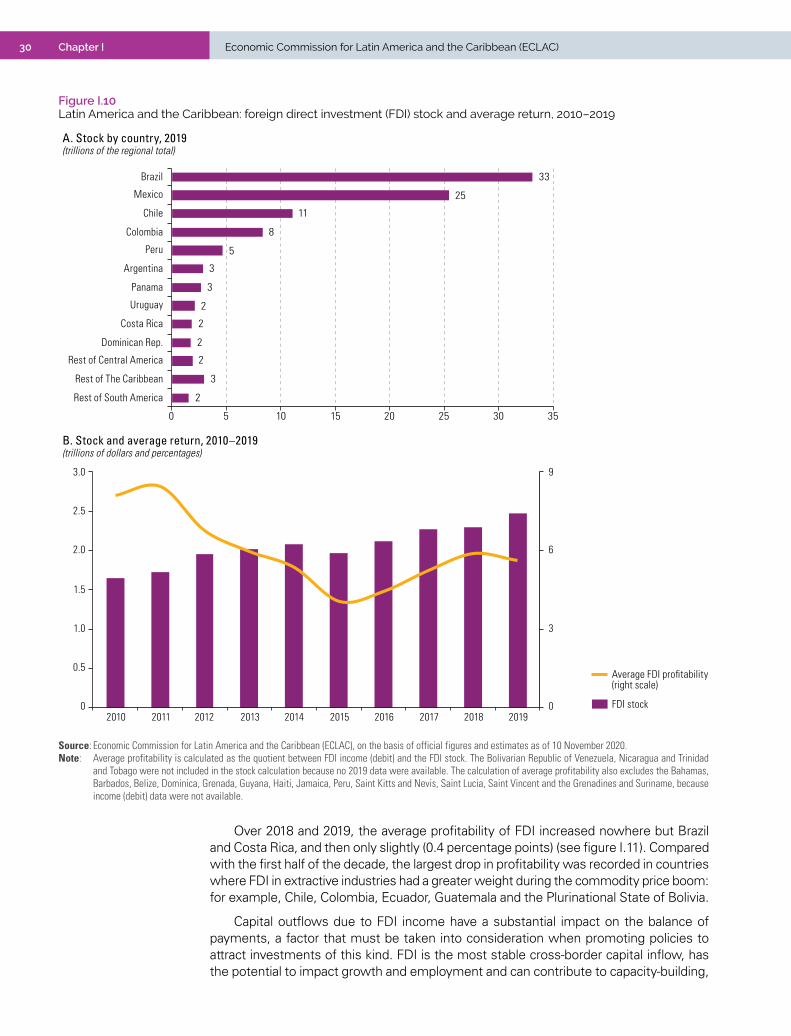
30 Chapter I Economic Commission for Latin America and the Caribbean (ECLAC)
Figure I.10 Latin America and the Caribbean: foreign direct investment (FDI) stock and average return, 2010–2019
A. Stock by country, 2019 (trillions of the regional total)
33
25
11
8
5
3
3
2
2
2
2
3
2
50 10 15 20 25 30 35
Brazil
Mexico
Chile
Colombia
Peru
Argentina
Panama
Uruguay
Costa Rica
Dominican Rep.
Rest of Central America
Rest of The Caribbean
Rest of South America
0
3
6
9
0
0.5
1.0
1.5
2.0
2.5
3.0
2010 2011 2012 2014 20152013 2016 2017 2018 2019FDI stock
Average FDI profitability (right scale)
B. Stock and average return, 2010–2019 (trillions of dollars and percentages)
Source: Economic Commission for Latin America and the Caribbean (ECLAC), on the basis of official figures and estimates as of 10 November 2020.Note: Average profitability is calculated as the quotient between FDI income (debit) and the FDI stock. The Bolivarian Republic of Venezuela, Nicaragua and Trinidad
and Tobago were not included in the stock calculation because no 2019 data were available. The calculation of average profitability also excludes the Bahamas, Barbados, Belize, Dominica, Grenada, Guyana, Haiti, Jamaica, Peru, Saint Kitts and Nevis, Saint Lucia, Saint Vincent and the Grenadines and Suriname, because income (debit) data were not available.
Over 2018 and 2019, the average profitability of FDI increased nowhere but Brazil and Costa Rica, and then only slightly (0.4 percentage points) (see figure I.11). Compared with the first half of the decade, the largest drop in profitability was recorded in countries where FDI in extractive industries had a greater weight during the commodity price boom: for example, Chile, Colombia, Ecuador, Guatemala and the Plurinational State of Bolivia.
Capital outflows due to FDI income have a substantial impact on the balance of payments, a factor that must be taken into consideration when promoting policies to attract investments of this kind. FDI is the most stable cross-border capital inflow, has the potential to impact growth and employment and can contribute to capacity-building,

31Chapter IForeign Direct Investment in Latin America and the Caribbean • 2020
but it also generates income with a negative effect on the balance of payments. The region has run a current account deficit over the past decade, which reached 1.8% of GDP in 2019 (see figure I.12). Capital outflows on the income account, which include FDI income and other investments income, were the most important factor in this negative balance (3.4% of GDP). In particular, FDI income, including the repatriation of earnings, were equal to 1.9% of the region’s GDP in 2019, after peaking at the beginning of the decade and in 2018. In 2019, the increase in net current transfers and a larger merchandise trade surplus were insufficient to offset shortfalls on the services and income accounts.
Figure I.11 Latin America and the Caribbean (15 countries): average return on foreign direct investment (FDI), 2010–2014, 2018 and 2019(Percentages)
0
2
4
6
8
10
12
14
16
18
20
Braz
il
Mex
ico
Chile
Colo
mbi
a
Arge
ntin
a
Pana
ma
Urug
uay
Cost
a Ri
ca
Dom
inic
anRe
p.
Ecua
dor
Guat
emal
a
Hond
uras
Boliv
ia(P
lur.
Stat
e of
)
El S
alva
dor
Para
guay
2010–2014 2018 2019
Source: Economic Commission for Latin America and the Caribbean (ECLAC), on the basis of official figures and estimates as of 10 November 2020.Note: Average profitability is calculated as the quotient between FDI income (debit) and the FDI stock.
Figure I.12 Latin America and the Caribbean: balance-of-payments current account, by components, 2010–2019 (Percentages of GDP)
1.0 1.1 0.7 0.1-0.2 -1.0
0.20.8 0.4 0.7
-1.1 -1.2 -1.3 -1.4- -1.4
-1.2
-1.0 -1.0 -1.0 -0.9
-2.2 - -2.1 -1.7 -1.6 -1.5
-1.6 -1.7 -2.2 - -1.9
-0.7 -0.7 -0.7-0.8
-0.9
-1.0
-0.9 -0.9-1.1
-1.1
-0.10 -0.1
-0.1-0.1
-0.1
-0.2 -0.2
-0.1 -0.4
1.2 1.11.0
1.0 1.1 1.31.5
1.51.6
1.8
-2.0 -1.9-2.5
-2.9 -3.1-3.4
-2.0-1.6
-2.4-1.8
-6
-5
-4
-3
-2
-1
0
1
2
3
2010 2011 2012 2013 2014 2015 2016 2017 2018 2019
Goods trade balance
Services trade balance
Direct investmentincome balance
Portfolio investmentincome balance Other investmentincome balance
Balance of currenttransfers
Current account balance
-2.4
Source: Economic Commission for Latin America and the Caribbean (ECLAC), on the basis of official data.
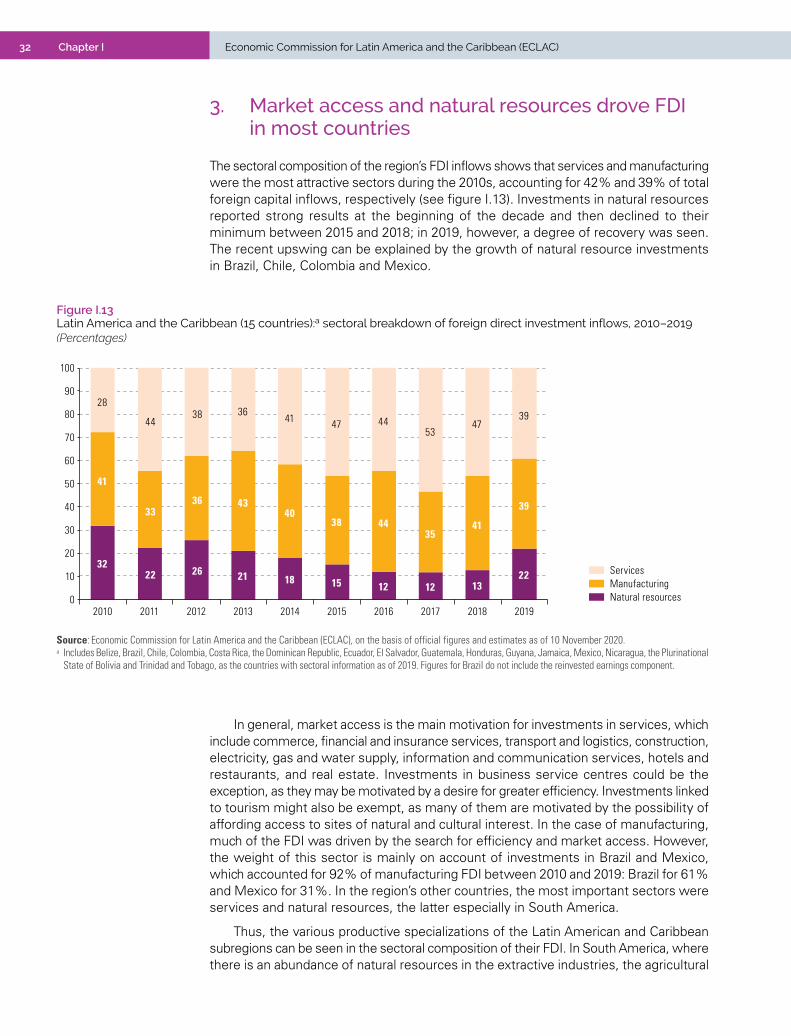
32 Chapter I Economic Commission for Latin America and the Caribbean (ECLAC)
3. Market access and natural resources drove FDI in most countries
The sectoral composition of the region’s FDI inflows shows that services and manufacturing were the most attractive sectors during the 2010s, accounting for 42% and 39% of total foreign capital inflows, respectively (see figure I.13). Investments in natural resources reported strong results at the beginning of the decade and then declined to their minimum between 2015 and 2018; in 2019, however, a degree of recovery was seen. The recent upswing can be explained by the growth of natural resource investments in Brazil, Chile, Colombia and Mexico.
Figure I.13 Latin America and the Caribbean (15 countries):a sectoral breakdown of foreign direct investment inflows, 2010–2019(Percentages)
3222 26 21 18 15 12 12 13
22
41
3336 43
4038 44
3541
39
28
4438 36
41 47 4453
4739
0
10
20
30
40
50
60
70
80
90
100
2010 2011 2012 2013 2014 2015 2016 2017 2018 2019Natural resources Manufacturing Services
Source: Economic Commission for Latin America and the Caribbean (ECLAC), on the basis of official figures and estimates as of 10 November 2020.a Includes Belize, Brazil, Chile, Colombia, Costa Rica, the Dominican Republic, Ecuador, El Salvador, Guatemala, Honduras, Guyana, Jamaica, Mexico, Nicaragua, the Plurinational
State of Bolivia and Trinidad and Tobago, as the countries with sectoral information as of 2019. Figures for Brazil do not include the reinvested earnings component.
In general, market access is the main motivation for investments in services, which include commerce, financial and insurance services, transport and logistics, construction, electricity, gas and water supply, information and communication services, hotels and restaurants, and real estate. Investments in business service centres could be the exception, as they may be motivated by a desire for greater efficiency. Investments linked to tourism might also be exempt, as many of them are motivated by the possibility of affording access to sites of natural and cultural interest. In the case of manufacturing, much of the FDI was driven by the search for efficiency and market access. However, the weight of this sector is mainly on account of investments in Brazil and Mexico, which accounted for 92% of manufacturing FDI between 2010 and 2019: Brazil for 61% and Mexico for 31%. In the region’s other countries, the most important sectors were services and natural resources, the latter especially in South America.
Thus, the various productive specializations of the Latin American and Caribbean subregions can be seen in the sectoral composition of their FDI. In South America, where there is an abundance of natural resources in the extractive industries, the agricultural

33Chapter IForeign Direct Investment in Latin America and the Caribbean • 2020
sector, forestry and fisheries, investment aimed at accessing these resources was more significant than in the other subregions. In Colombia, for example, 34% of 2019 FDI was spent on natural resources, and in Brazil, while manufacturing was the main recipient, natural resource investments accounted for almost a quarter of the inflow (see figure I.14). That proportion was even higher in Ecuador and the Plurinational State of Bolivia, where those investments accounted for 54% and 46%, respectively. In Mexico, efficiency-seeking investment by transnational corporations drove the development of certain manufacturing industries that are integrated into global value chains and oriented towards the United States market: most notably, the automotive and electronics sectors (ECLAC, 2018 and 2019). For most of the decade, therefore, manufacturing was Mexico’s main recipient of FDI, although its share declined in 2019. Investment in manufacturing in Central America, while on a smaller scale, was driven by similar considerations, and transnational corporations assisted the development of certain sectors. One example of this is the medical device industry in Costa Rica, where 60% of the FDI received in 2019 went into manufacturing (chapter III provides an overview of the medical device industry in the region). In the Caribbean, in contrast, the growth of the tourism industry has meant that most FDI focuses on services.
Figure I.14 Latin America and the Caribbean (selected countries and subregions): sectoral breakdown of foreign direct investment inflows, 2010–2019(Percentages)
Natural resources
Services Services 18 14
2410 5 6
4531 37
9 3 4 10 1732
2114
13
22 1
2834
39
5447 46
8
97
27 36 34 28 165
33 3725
3546 47 44
6141 61 57 58 54 56 55
0 0
-2
3 4 4 9 11 8
-20
0
20
40
60
80
100
2010
–201
4
2015
–201
9
2019
2010
–201
4
2015
–201
9
2019
2010
–201
4
2015
–201
9
2019
2010
–201
4
2015
–201
9
2019
2010
–201
4
2015
–201
9
2019
Brazil Mexico Andean region Central America The Caribbean
Not identifiedNot identified
0 0 0 0 315
Natural-resource-intensivemanufactures
Other manufactures
Source: Economic Commission for Latin America and the Caribbean (ECLAC), on the basis of official figures and estimates as of 10 November 2020.Note: Belize, the Dominican Republic, Guyana, Jamaica and Trinidad and Tobago, where 2019 sectoral information is available, are the Caribbean countries included; the
data for Central America cover Costa Rica, El Salvador, Guatemala, Honduras and Nicaragua for the same reason. Figures for Brazil do not include the reinvested earnings component. The Andean region includes Bolivia (Plurinational State of), Chile, Colombia and Ecuador.
Brazil and Mexico are the largest manufacturing hubs in Latin America and the Caribbean, and they accounted for most of the region’s manufacturing FDI. Taking both countries together, the industries with the greatest weight over the decade were transport equipment manufacturing, where investments rose throughout the 2010s, and industries linked to the extractive sectors and the supply of the domestic market, where investments decreased between the first and second halves of the decade (see figure I.15). Those sectors include oil and coal products, basic metal industries, the food industry, and the beverage and tobacco sector.

34 Chapter I Economic Commission for Latin America and the Caribbean (ECLAC)
Figure I.15 Brazil and Mexico: foreign direct investment inflows to the manufacturing industry, by sector, 2010–2019(Billions of dollars)
0
10
20
30
40
50
60
70
80
Transportequipment
Oil- and carbon-based
products
Foodstuffs Chemicals Pharmaceuticals Otherindustries
Cumulative total 2010–2014 Cumulative total 2015–2019
Beverages andtobacco
Base metals Paper and paper products
Non-metallicminerals
Source: Economic Commission for Latin America and the Caribbean (ECLAC), on the basis of official figures and estimates as of 10 November 2020. Note: The figure for Brazil does not include the reinvested earnings component. Mexico’s sectoral data are computed according to the directional criterion (IMF, 1993).
At the same time, investments by transnational corporations through mergers and acquisitions have behaved similarly to FDI inflows: striking dynamism in the first half of the decade followed by stabilization at lower values over the last five years (see figure I.16). The decade’s weakest result was recorded in 2019, when the number of mergers and acquisitions targeting companies in Latin America and the Caribbean decreased by 28% compared to 2018 and by 44% compared to the levels reached in 2010.
Figure I.16 Latin America and the Caribbean: cross-border mergers and acquisitions targeting companies in the region, 2005–2019(Billions of dollars and number of operations)
0
100
200
300
400
500
600
0
10
20
30
40
50
60
70
80
2005 2006 2007 2008 2009 2010 2011 2012 2013 2014 2015 2016 2017 2018 2019Amount
Number of operations(right scale)
Source: Economic Commission for Latin America and the Caribbean (ECLAC), on the basis of Bloomberg. Note: Includes cross-border transactions completed as of 31 December of each year considered to be foreign direct investment according to the criterion of the Balance
of Payments and International Investment Position Manual: Sixth Edition (BPM6) of the International Monetary Fund (IMF, 2009), i.e. transactions that represent more than 10% of the capital of the acquired company. The completion of a transaction does not imply that capital inflows to the region will be generated; first, because the data include operations where the selling firm is also foreign; and, second, because the payment methods do not always include cross-border capital flows between the countries of the parties involved.

35Chapter IForeign Direct Investment in Latin America and the Caribbean • 2020
The sectoral composition of this evolution also reflects changes in the economic scenario during both periods. In the first half of the decade, the region was in a period of economic expansion with average annual growth rates of 4.5% in 2011 and 2.9% in 2013, and commodity prices remained high. In that context, at the beginning of the decade, mergers and acquisitions increased compared to the previous five years (2005–2009), predominantly in manufacturing, the extractive sector, financial services and transport (see figure I.17). In the last five years of the decade, however, the amount involved of operations of this kind fell almost across the board, with the exception of electricity, gas and water supply companies —which attracted increasing interest from international investors— and hotels and restaurants, where, although the amounts increased, they were much smaller than those seen from 2005 to 2009.
Figure I.17 Latin America and the Caribbean: cross-border mergers and acquisitions targeting companies in the region, by economic activity, 2005–2019(Billions of dollars)
0
10
20
30
40
50
60
70
80
90
Man
ufac
turin
gin
dust
ry
Min
ing
and
quar
ryin
g
Elec
trici
ty, g
asan
d w
ater
sup
ply
Fina
ncia
l ser
vice
san
d in
sura
nce
Info
rmat
ion
and
com
mun
icat
ions
Tran
spor
tan
d st
orag
e
Com
mer
ce
Agric
ultu
re,
lives
tock
, for
estr
yan
d fis
herie
s
Hote
ls a
ndre
stau
rant
s
Real
est
ate
activ
ities
Othe
rac
tiviti
es
Cumulative total 2005–2009 Cumulative total 2010–2014 Cumulative total 2015–2019
Source: Economic Commission for Latin America and the Caribbean (ECLAC), on the basis of Bloomberg.Note: Includes cross-border transactions completed as of 31 December of each year considered to be foreign direct investment according to the criterion (more than 10%
of the capital) of the Balance of Payments and International Investment Position Manual: Sixth Edition (BPM6) of the International Monetary Fund (IMF, 2009). The completion of a transaction does not imply that capital inflows to the region will be generated; first, because the data include operations where the selling firm is also foreign; and, second, because the payment methods do not always include cross-border capital flows between the countries of the parties involved.
In 2019, in the face of increased global uncertainty and rising trade tensions between the United States and China, the mergers and acquisitions volume fell compared to the previous year in most economic activities, with the exception of electricity, gas and water supply, commerce and the agricultural sector. The attractiveness of the energy sector is clear from an analysis of the 20 largest transactions in 2019, which together accounted for 78% of the total amount of cross-border mergers and acquisitions (see table I.3). The year’s largest operation was the privatization of Brazil’s Transportadora Associada de Gás (TAG), which has the largest natural gas distribution network in the country, accounting for 4,500 km of pipelines and 47% of Brazil’s gas infrastructure. TAG was acquired by a consortium led by France’s Engie and also involving Canada’s Caisse de dépôt et placement du Québec (CDPQ). The consortium won the competitive bidding process carried out by Petrobras to sell a 90% stake in 2019 and, subsequently, it acquired the remaining 10% in July 2020. France’s Engie now owns 65% of TAG (half through its Brazilian subsidiary), and Canada’s CDPQ holds the remaining 35%. In Peru, a consortium led by the Chinese company Hubei Energy Group bought the Huallaga
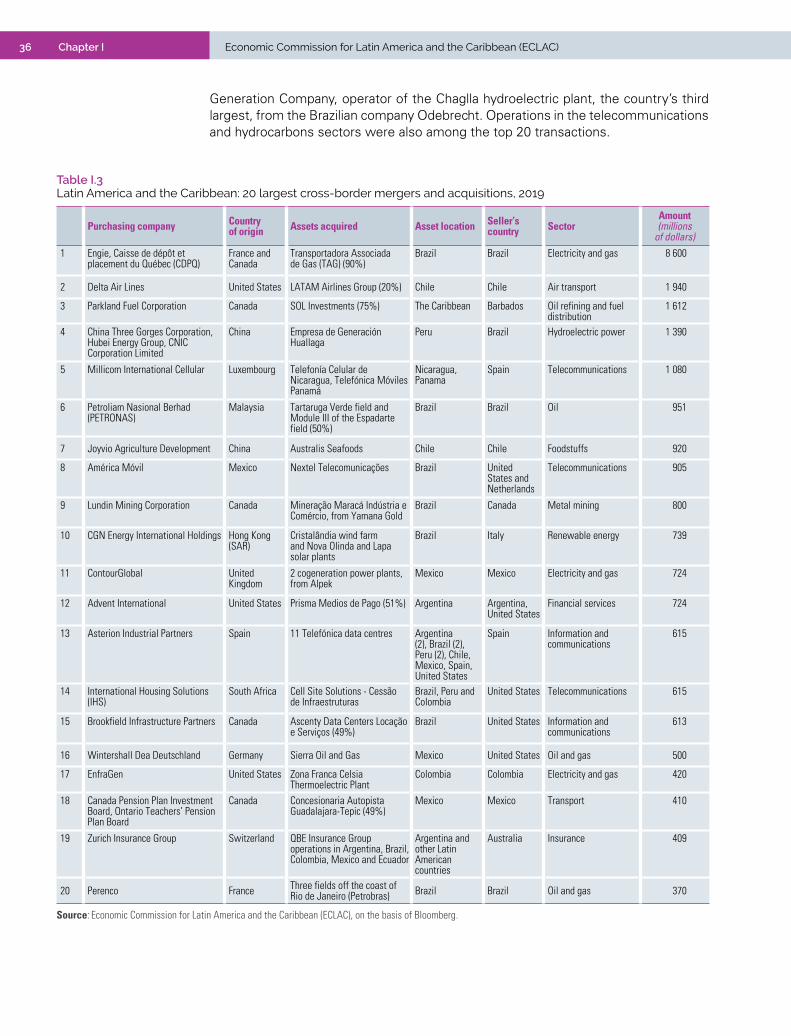
36 Chapter I Economic Commission for Latin America and the Caribbean (ECLAC)
Generation Company, operator of the Chaglla hydroelectric plant, the country’s third largest, from the Brazilian company Odebrecht. Operations in the telecommunications and hydrocarbons sectors were also among the top 20 transactions.
Table I.3 Latin America and the Caribbean: 20 largest cross-border mergers and acquisitions, 2019
Purchasing company Country of origin Assets acquired Asset location Seller’s
country SectorAmount (millions
of dollars)1 Engie, Caisse de dépôt et
placement du Québec (CDPQ)France and Canada
Transportadora Associada de Gas (TAG) (90%)
Brazil Brazil Electricity and gas 8 600
2 Delta Air Lines United States LATAM Airlines Group (20%) Chile Chile Air transport 1 940
3 Parkland Fuel Corporation Canada SOL Investments (75%) The Caribbean Barbados Oil refining and fuel distribution
1 612
4 China Three Gorges Corporation, Hubei Energy Group, CNIC Corporation Limited
China Empresa de Generación Huallaga
Peru Brazil Hydroelectric power 1 390
5 Millicom International Cellular Luxembourg Telefonía Celular de Nicaragua, Telefónica Móviles Panamá
Nicaragua, Panama
Spain Telecommunications 1 080
6 Petroliam Nasional Berhad (PETRONAS)
Malaysia Tartaruga Verde field and Module III of the Espadarte field (50%)
Brazil Brazil Oil 951
7 Joyvio Agriculture Development China Australis Seafoods Chile Chile Foodstuffs 920
8 América Móvil Mexico Nextel Telecomunicações Brazil United States and Netherlands
Telecommunications 905
9 Lundin Mining Corporation Canada Mineração Maracá Indústria e Comércio, from Yamana Gold
Brazil Canada Metal mining 800
10 CGN Energy International Holdings Hong Kong (SAR)
Cristalândia wind farm and Nova Olinda and Lapa solar plants
Brazil Italy Renewable energy 739
11 ContourGlobal United Kingdom
2 cogeneration power plants, from Alpek
Mexico Mexico Electricity and gas 724
12 Advent International United States Prisma Medios de Pago (51%) Argentina Argentina, United States
Financial services 724
13 Asterion Industrial Partners Spain 11 Telefónica data centres Argentina (2), Brazil (2), Peru (2), Chile, Mexico, Spain, United States
Spain Information and communications
615
14 International Housing Solutions (IHS)
South Africa Cell Site Solutions - Cessão de Infraestruturas
Brazil, Peru and Colombia
United States Telecommunications 615
15 Brookfield Infrastructure Partners Canada Ascenty Data Centers Locação e Serviços (49%)
Brazil United States Information and communications
613
16 Wintershall Dea Deutschland Germany Sierra Oil and Gas Mexico United States Oil and gas 500
17 EnfraGen United States Zona Franca Celsia Thermoelectric Plant
Colombia Colombia Electricity and gas 420
18 Canada Pension Plan Investment Board, Ontario Teachers’ Pension Plan Board
Canada Concesionaria Autopista Guadalajara-Tepic (49%)
Mexico Mexico Transport 410
19 Zurich Insurance Group Switzerland QBE Insurance Group operations in Argentina, Brazil, Colombia, Mexico and Ecuador
Argentina and other Latin American countries
Australia Insurance 409
20 Perenco France Three fields off the coast of Rio de Janeiro (Petrobras) Brazil Brazil Oil and gas 370
Source: Economic Commission for Latin America and the Caribbean (ECLAC), on the basis of Bloomberg.

37Chapter IForeign Direct Investment in Latin America and the Caribbean • 2020
Among the countries and subregions of destination for these mergers and acquisitions, Brazil was the country that attracted the greatest interest from transnational companies in 2019, as 53% of the total amount was concentrated there (see figure I.18). In addition, the very large agreements recorded in the Caribbean and Central America increased those subregions’ share compared to the average over previous years. Notable in the Caribbean was the purchase of SOL Investments by the Canadian company Parkland, an acquisition that involved a total amount of US$ 1.612 billion. SOL Investments is the largest independent fuel trader in the Caribbean and has operations in 22 of the subregion’s jurisdictions. In Central America, dynamism was seen among telecommunications companies, particularly those involved in mobile networks: Spain’s Telefónica sold its assets in order to reduce its debt and withdrew from the subregion (Marco, 2019). Among the company’s planned transactions, it confirmed the sale of its operations in Panama and Nicaragua to the Swedish company Millicom International Cellular, and the sale of those in Guatemala to the Mexican company América Móvil. In El Salvador, in contrast, América Móvil withdrew from the purchase of Telefónica’s operations and, in Costa Rica, after the agreement with Millicom International Cellular failed to materialize, Telefónica announced an agreement whereby Liberty Global would buy those assets for US$ 425 million (Telefónica, 2020).
Figure I.18 Latin America and the Caribbean: cross-border mergers and acquisitions targeting companies in the region, by destination country or subregion, 2015–2017, 2018 and 2019(Percentages of the total volume)
4 4
54 42
53
10 32 11
15
8
7
3 6
4
5
4
4 2
5
4 9
3 5
0
10
20
30
40
50
60
70
80
90
100
2015–2017 2018 2019BrazilChileMexicoArgentinaColombiaPeruThe Caribbean Central America
Other South Americancountries
Source: Economic Commission for Latin America and the Caribbean (ECLAC), on the basis of Bloomberg.
In contrast to mergers and acquisitions, the number of investment announcements by foreign companies in Latin America and the Caribbean has followed an upward trend over the past 15 years (see figure I.19). However, the accumulated value in the last five years was lower than in the first half of the decade: the amounts announced from 2015 to 2019 were 18% lower than those of the 2010–2014 period. Despite this, at the end of the decade a degree of recovery in companies’ interest in undertaking new projects in the region was seen: in 2019 the total value of announcements made rose by 35% over the 2018 level, while the number remained stable.

38 Chapter I Economic Commission for Latin America and the Caribbean (ECLAC)
Figure I.19 Latin America and the Caribbean: investment project announcements, 2005–2019(Billions of dollars and number of projects)
Amount
Number of projects(right scale)
0
200
400
600
800
1 000
1 200
1 400
1 600
1 800
2 000
0
20
40
60
80
100
120
140
2005 2006 2007 2008 2009 2010 2011 2012 2013 2014 2015 2016 2017 2018 2019
Source: Economic Commission for Latin America and the Caribbean (ECLAC), on the basis of Financial Times, fDi Markets [online database] https://www.fdimarkets.com/.
The renewed interest in investing in the region over recent years has focused on the electricity sector; renewable energies, in particular, have accounted for the largest announced amounts since 2015 (with the exception of 2017, when they ranked second after telecommunications). Thus, with a medium-term perspective, transnational companies’ investment announcements in renewable energies grew over the course of the decade (see figure I.20). In turn, those sectors that were leading the region’s investment announcements ten years ago —such as metals, telecommunications and the automobile industry— have seen their shares decline over the course of the decade, while those of other sectors, such as transport and logistics, and hotels and tourism, have increased.
Figure I.20 Latin America and the Caribbean: investment project announcements, by sector, 2005–2019(Percentages of the total amount)
0
55
10
15
20
25
Rene
wab
le e
nerg
y
Auto
mot
ive
and
auto
part
s
Tele
com
mun
icat
ions
Coal
, oil
and
gas
Met
als
Tran
spor
tan
d st
orag
e
Food
, bev
erag
esan
d to
bacc
o
Hote
ls a
nd to
uris
m
Labo
ur-in
tens
ive
indu
strie
s
Nat
ural
reso
urce
-in
tens
ive
indu
strie
s
Tech
nolo
gy-in
tens
ive
indu
strie
s
Fina
ncia
l ser
vice
s
Chem
ical
s
Real
-est
ate
sect
or
Soft
war
e an
dIT
ser
vice
s
Busi
ness
serv
ices
Min
eral
s
2005–2009 2010–2014 2015–2019
Source: Economic Commission for Latin America and the Caribbean (ECLAC), on the basis of Financial Times, fDi Markets [online database] https://www.fdimarkets.com/.

39Chapter IForeign Direct Investment in Latin America and the Caribbean • 2020
The decade’s record for the number of renewable energy announcements and the amounts involved was posted in 2019. The total estimated amount was around US$ 21 billion, which represented 19% of the total for the year’s projects (see figure I.21); in terms of numbers, 120 announcements were made, far more than the previous record of 63 set in 2013. Brazil, Chile and Mexico accounted for 84% of the value of the renewable energy project announcements made in 2019, taking 37%, 29% and 18% of the total, respectively. Colombia’s performance was also notable that year, taking 6% of the total with the announcement of five new projects: three for solar energy and two for wind energy projects (previously there had never been more than one project announced per year in the country). Good performances were also reported by Paraguay, where Brazil’s ECB Group announced a soybean-based biofuel project, and by Peru, with announcements by Chinese companies for hydroelectric and solar energy projects.
Announcements in the metal mining sector also increased in 2019: four copper mining projects were announced in Peru, where 62% of the announced amount was concentrated in that sector, and a project for iron mining — the country’s largest mining project— was announced in Brazil. In the transport and logistics sector, Peru was again the country with the largest project announcement: the Chinese company COSCO Shipping Ports signed an agreement with the Peruvian mining company Volcán to build a multipurpose port terminal with an investment of US$ 3 billion.
Figure I.21 Latin America and the Caribbean: investment project announcements, by sector, 2019(Percentages of the total amount)
199
9
9
8
87
7
5
5
43
3
4
Renewable energy
Hotels and tourism
Metals
Transport and storage
Automotive and autopartsTelecommunications
Coal, oil and gas
Other natural resource-intensive industries
Labour-intensive industries
Food, beverages and tobaccoTechnology-intensive industries
Financial services
Chemicals
Other
0 2 4 6 8 10 12 14 16 18 20
Source: Economic Commission for Latin America and the Caribbean (ECLAC), on the basis of Financial Times, fDi Markets [online database] https://www.fdimarkets.com/.
The growth in announcements in 2019 was largely on account of an increase in projects from the European Union and China, while announcements from the United States remained constant compared to 2018. As the next section will show, companies from those three places of origin, together with Japanese and Canadian firms, were the region’s biggest investors.

40 Chapter I Economic Commission for Latin America and the Caribbean (ECLAC)
4. Europe and the United States accounted for 82% of FDI
The countries of origin of FDI remained relatively unchanged over the decade. Companies from Europe and the United States were the region’s main investors, accounting for 82% of 2019’s inflows for which the source can be identified (see figure I.22). As indicated in previous editions of this report, determining origin on the basis of national account data yields imprecise results: first, because they account only for the immediate origin of the capital, making it impossible to identify the funds coming in from third countries; and second, because few of the region’s countries include that information in their official statistics.2 Nevertheless, on the basis of the information available, it can be concluded that between the first and second halves of the decade there was a drop in investment from the European Union —although its share in the total did not decrease— from Japan, and from Latin America and the Caribbean. Inflows from the United States, in contrast, increased. The drop in intra-regional investment is consistent with the fact that Latin American transnationals carried out less FDI during the period under review (see section C). In 2019, the breakdown of countries and regions of origin was similar to that seen over the previous five years.
2 The countries that provide this information are Brazil, Chile, Colombia, Costa Rica, the Dominican Republic, Ecuador, El Salvador, Guatemala, Honduras and Mexico. In the other countries, either no statistics by country of origin are presented, or the data for 2019 were not available at the closing date of this report. Brazil’s figures do not include the reinvested earnings component.
Figure I.22 Latin America and the Caribbean (9 countries):a breakdown of foreign direct investment inflows by origin, 2010–2019(Percentages)
51 52 55
1210
65
EuropeUnited States
Latin America andthe Caribbean
CanadaJapan Other
22 2527
6 54 3 45 5 4
0
10
20
30
40
50
60
70
80
90
100
2010–2014 2015–2019 2019
Source: Economic Commission for Latin America and the Caribbean (ECLAC), on the basis of official figures and estimates as of 10 November 2020.a Includes Brazil, Chile, Colombia, Costa Rica, the Dominican Republic, Ecuador, El Salvador, Guatemala, Honduras and Mexico, which are the countries for which origin
information is available up to 2019. The figure for Brazil does not include the reinvested earnings component. In all cases, funds for which the origin cannot be determined because they enter through tax havens are excluded.
That structure, however, has differed from one country to the next: the differences can mainly be seen between South America on the one hand and Mexico and Central America on the other. Europe weighed heavily in the Southern Cone, particularly in Brazil, while the United States was the main country of origin for investments entering Mexico over the past decade and one of the most important countries of origin for
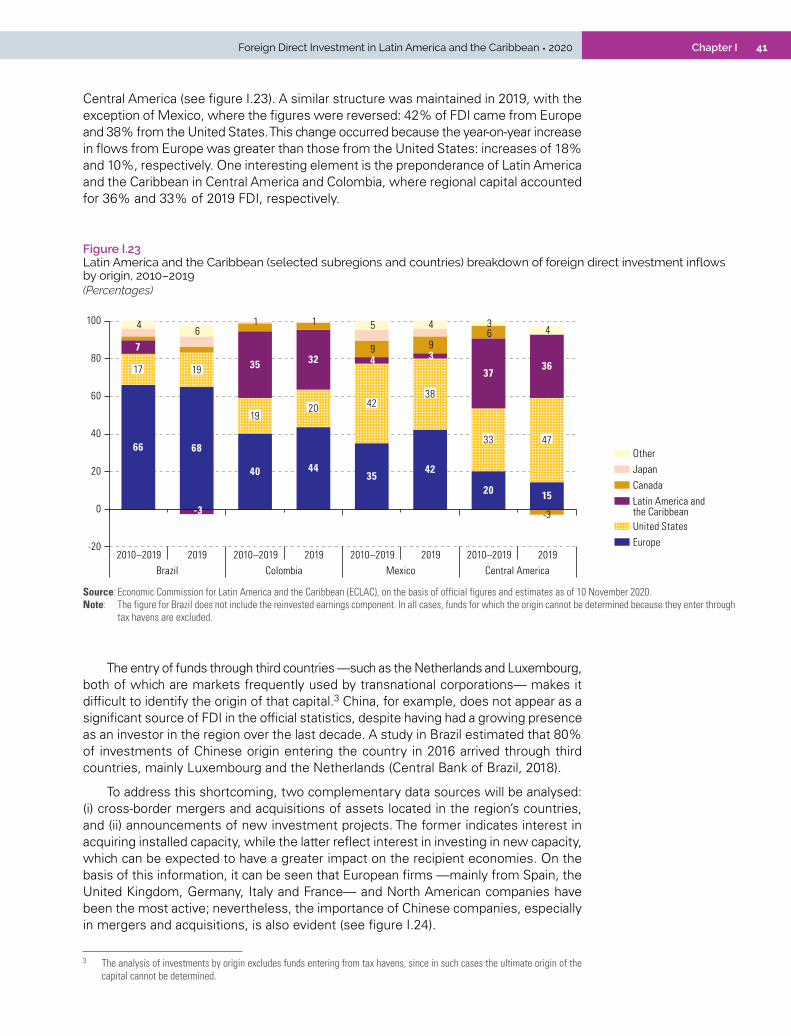
41Chapter IForeign Direct Investment in Latin America and the Caribbean • 2020
Central America (see figure I.23). A similar structure was maintained in 2019, with the exception of Mexico, where the figures were reversed: 42% of FDI came from Europe and 38% from the United States. This change occurred because the year-on-year increase in flows from Europe was greater than those from the United States: increases of 18% and 10%, respectively. One interesting element is the preponderance of Latin America and the Caribbean in Central America and Colombia, where regional capital accounted for 36% and 33% of 2019 FDI, respectively.
Figure I.23 Latin America and the Caribbean (selected subregions and countries) breakdown of foreign direct investment inflows by origin, 2010–2019(Percentages)
EuropeUnited States
Latin America andthe Caribbean
CanadaJapan Other66 68
40 4435
42
20 15
17 19
1920 42
38
33 47
7
-3
35 32 4 3
3736
9 96
-3
4 61 1 5 4 3
4
-20
0
20
40
60
80
100
2010–2019 2019 2010–2019 2019 2010–2019 2019 2010–2019 2019Brazil Colombia Mexico Central America
Source: Economic Commission for Latin America and the Caribbean (ECLAC), on the basis of official figures and estimates as of 10 November 2020.Note: The figure for Brazil does not include the reinvested earnings component. In all cases, funds for which the origin cannot be determined because they enter through
tax havens are excluded.
The entry of funds through third countries —such as the Netherlands and Luxembourg, both of which are markets frequently used by transnational corporations— makes it difficult to identify the origin of that capital.3 China, for example, does not appear as a significant source of FDI in the official statistics, despite having had a growing presence as an investor in the region over the last decade. A study in Brazil estimated that 80% of investments of Chinese origin entering the country in 2016 arrived through third countries, mainly Luxembourg and the Netherlands (Central Bank of Brazil, 2018).
To address this shortcoming, two complementary data sources will be analysed: (i) cross-border mergers and acquisitions of assets located in the region’s countries, and (ii) announcements of new investment projects. The former indicates interest in acquiring installed capacity, while the latter reflect interest in investing in new capacity, which can be expected to have a greater impact on the recipient economies. On the basis of this information, it can be seen that European firms —mainly from Spain, the United Kingdom, Germany, Italy and France— and North American companies have been the most active; nevertheless, the importance of Chinese companies, especially in mergers and acquisitions, is also evident (see figure I.24).
3 The analysis of investments by origin excludes funds entering from tax havens, since in such cases the ultimate origin of the capital cannot be determined.
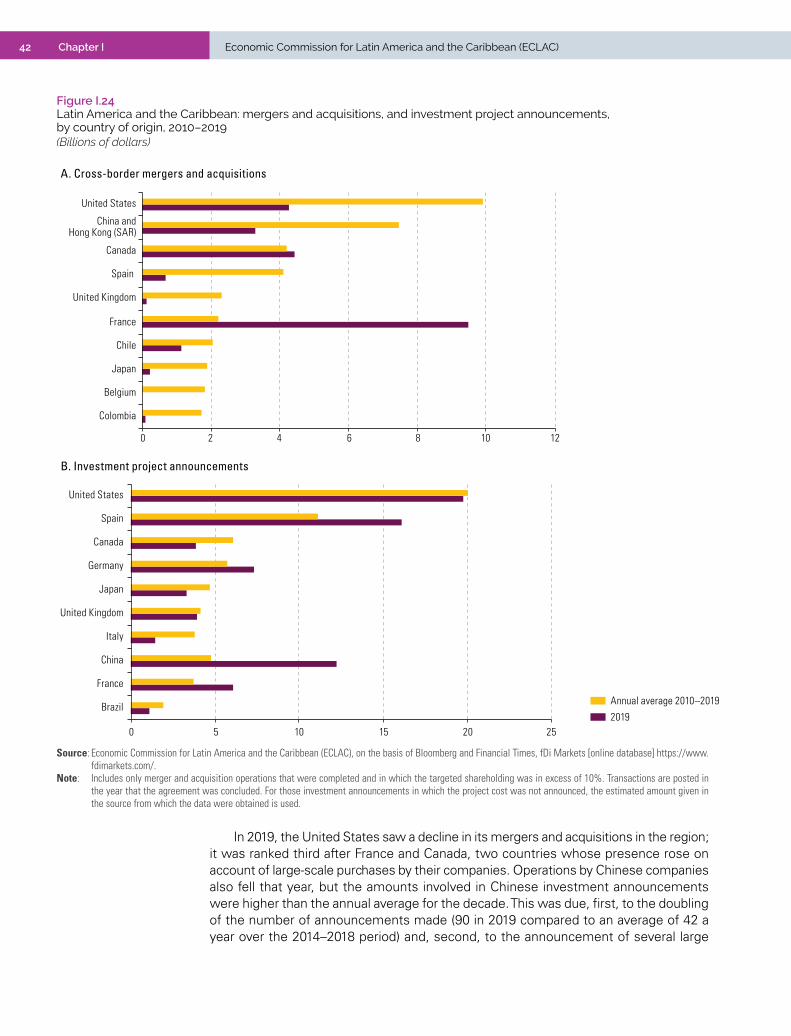
42 Chapter I Economic Commission for Latin America and the Caribbean (ECLAC)
Figure I.24 Latin America and the Caribbean: mergers and acquisitions, and investment project announcements, by country of origin, 2010–2019 (Billions of dollars)
A. Cross-border mergers and acquisitions
0 2 4 6 8 10 12
Colombia
Belgium
Japan
Chile
France
United Kingdom
Spain
Canada
China andHong Kong (SAR)
United States
B. Investment project announcements
Annual average 2010–2019
2019 0 5 10 15 20 25
Brazil
France
China
Italy
United Kingdom
Japan
Germany
Canada
Spain
United States
Source: Economic Commission for Latin America and the Caribbean (ECLAC), on the basis of Bloomberg and Financial Times, fDi Markets [online database] https://www.fdimarkets.com/.
Note: Includes only merger and acquisition operations that were completed and in which the targeted shareholding was in excess of 10%. Transactions are posted in the year that the agreement was concluded. For those investment announcements in which the project cost was not announced, the estimated amount given in the source from which the data were obtained is used.
In 2019, the United States saw a decline in its mergers and acquisitions in the region; it was ranked third after France and Canada, two countries whose presence rose on account of large-scale purchases by their companies. Operations by Chinese companies also fell that year, but the amounts involved in Chinese investment announcements were higher than the annual average for the decade. This was due, first, to the doubling of the number of announcements made (90 in 2019 compared to an average of 42 a year over the 2014–2018 period) and, second, to the announcement of several large

43Chapter IForeign Direct Investment in Latin America and the Caribbean • 2020
projects. For example, COSCO Shipping Ports acquired 60% of the company Terminales Portuarios Chancay (TPCH) in Peru and announced investments of US$ 3 billion to build a multipurpose port terminal. In Brazil, an agreement was signed with the Government of Pará to build a rail corridor to the port of Barcarena to carry exports of iron and other natural resources. This corridor, with an estimated investment of some US$ 1.4 billion, is not without controversy on account of its environmental impact (Kemeny, 2020).
China has also made several infrastructure investments in Latin America and the Caribbean that will allow it greater control of supplies originating in the region. That growth positioned the country among the main investors in Latin America and the Caribbean, which further bolstered its status as a major trade partner. In terms of the decade’s accumulated value, China and Hong Kong Special Administrative Region (SAR) of China ranked second after the United States as the origin of cross-border mergers and acquisitions, accounting for a higher volume of business than several of the region’s traditional investors, such as Spain, Canada, the United Kingdom or France.
The form taken by investments is one of the differences between China’s investments, which rose to prominence during the second half of the decade, and those of the region’s traditional investors (the United States, the European Union and Japan). Among companies from those three investors, the amounts linked to investment announcements were higher than those for mergers and acquisitions; among Chinese companies, in contrast, the amounts associated with mergers and acquisitions were higher than announced investments amounts, except in 2019. These figures do not include construction contracts or concessions granted to Chinese companies, especially in the construction and transport and logistics sectors, as these do not constitute FDI per se. However, this is a form of participation by Chinese companies in the economies of Latin America and the Caribbean that continued to run at high levels until the end of the decade.
At the same time, the amount associated with mergers and acquisitions fell by 42% between the first and second halves of the decade because of reduced operations by companies from Europe, Asia (particularly Japan and Singapore) and Latin America and the Caribbean (see figure I.25). Mergers and acquisitions by European companies fell across the board with the exception of the electricity, gas and water supply sectors; the biggest reductions were in mining, manufacturing and telecommunications. Thus, Europe’s share dropped from 38% between 2010 and 2014 to 27% between 2015 and 2019. Amounts associated with mergers and acquisitions by companies from China and North America, in contrast, remained stable, and the share of funds from those two parts of the world increased from the first half of the decade to the second. In 2019, however, China’s expansion through mergers and acquisitions slowed down considerably across the world, and the region was no exception. Although the operations of Chinese companies accounted for an average of 18% of the volume of cross-border mergers and acquisitions completed in the region between 2015 to 2019, the weight of those operations has decreased over the past three years, falling from 34% of the total in 2017 to 20% in 2018 and only 9% in 2019.

44 Chapter I Economic Commission for Latin America and the Caribbean (ECLAC)
Figure I.25 Latin America and the Caribbean: cross-border mergers and acquisitions, by region of origin, 2010–2019(Billions of dollars)
0
50
100
150
200
250
300
350
2010–2014 2015–2019EuropeNorth America China and Hong Kong (SAR)
Latin America andthe Caribbean
Other Asia-Pacificeconomies
Africa and Middle East
123.31
40.64
39.72
37.42
12.92
71.03
52.28
34.12
70.86
22.99 6.69 5.69
Source: Economic Commission for Latin America and the Caribbean (ECLAC), on the basis of Bloomberg. Note: Includes only merger and acquisition operations that were completed and in which the targeted shareholding was in excess of 10%. Transactions are posted in
the year that the agreement was closed.
C. Latin American investments overseas: difficult times
In 2019, FDI outflows from Latin American countries totalled US$ 44.543 billion, 74.6% more than in 2018. In recent years, most of the region’s outward FDI originated in Brazil, Chile, Colombia and Mexico and, in 2019, those four countries accounted for 91% of the total (see table I.4). This was not a stable or homogeneous trend, however, and there were some differences from one country to the next. In 2019, foreign direct investment flows from Chile and Brazil increased, after posting a low volume the previous year. Colombia, Mexico and Argentina —which also accounted for a significant share of the region’s outward FDI— experienced declines, while there was a strong increase in equity investment. Equity investment and reinvested earnings recovered in Brazil, which could indicate that some of the larger local groups needed to maintain the positions they had secured abroad in previous years. In Mexico, in contrast, equity investments fell, while Argentina posted a reduction in the reinvested earnings.
In the first half of 2020, particularly after the COVID-19 pandemic struck, Latin America’s outward direct investment flows underwent major changes. This was particularly noticeable among Brazilian companies, as their overseas subsidiaries transferred considerable amounts of financial resources to support the parent companies inside the country (see table I.5).
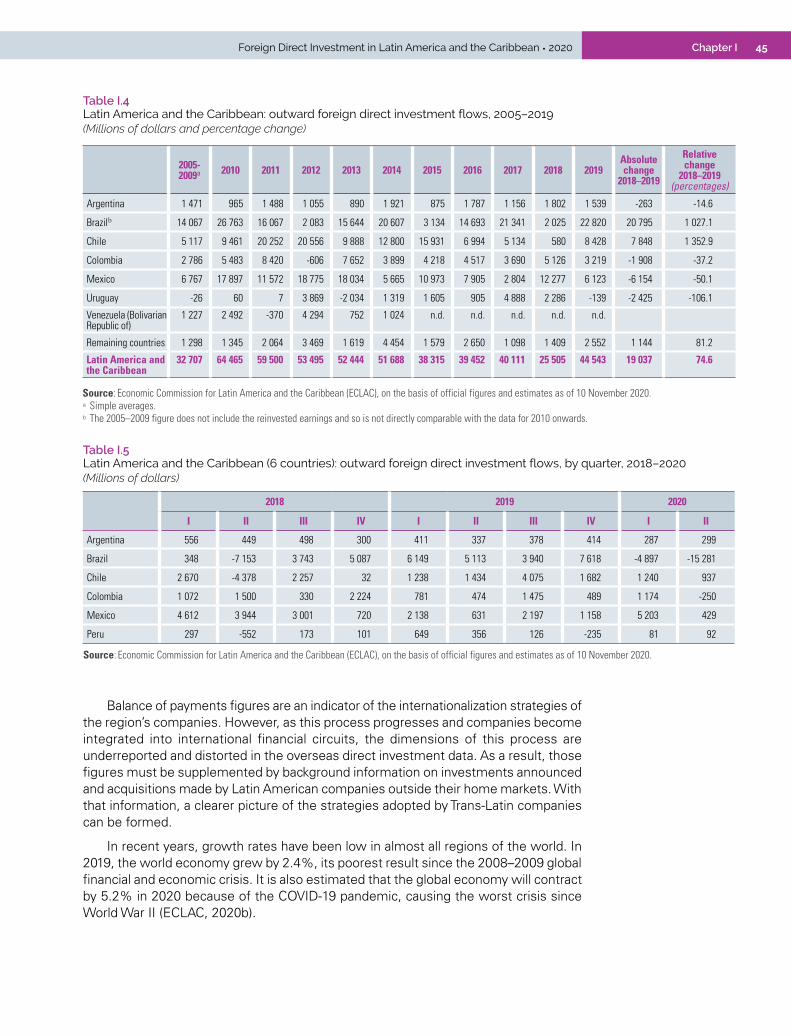
45Chapter IForeign Direct Investment in Latin America and the Caribbean • 2020
Table I.4 Latin America and the Caribbean: outward foreign direct investment flows, 2005–2019(Millions of dollars and percentage change)
2005-2009a 2010 2011 2012 2013 2014 2015 2016 2017 2018 2019
Absolute change
2018–2019
Relative change
2018–2019 (percentages)
Argentina 1 471 965 1 488 1 055 890 1 921 875 1 787 1 156 1 802 1 539 -263 -14.6
Brazilb 14 067 26 763 16 067 2 083 15 644 20 607 3 134 14 693 21 341 2 025 22 820 20 795 1 027.1
Chile 5 117 9 461 20 252 20 556 9 888 12 800 15 931 6 994 5 134 580 8 428 7 848 1 352.9
Colombia 2 786 5 483 8 420 -606 7 652 3 899 4 218 4 517 3 690 5 126 3 219 -1 908 -37.2
Mexico 6 767 17 897 11 572 18 775 18 034 5 665 10 973 7 905 2 804 12 277 6 123 -6 154 -50.1
Uruguay -26 60 7 3 869 -2 034 1 319 1 605 905 4 888 2 286 -139 -2 425 -106.1
Venezuela (Bolivarian Republic of)
1 227 2 492 -370 4 294 752 1 024 n.d. n.d. n.d. n.d. n.d.
Remaining countries 1 298 1 345 2 064 3 469 1 619 4 454 1 579 2 650 1 098 1 409 2 552 1 144 81.2
Latin America and the Caribbean
32 707 64 465 59 500 53 495 52 444 51 688 38 315 39 452 40 111 25 505 44 543 19 037 74.6
Source: Economic Commission for Latin America and the Caribbean (ECLAC), on the basis of official figures and estimates as of 10 November 2020.a Simple averages.b The 2005–2009 figure does not include the reinvested earnings and so is not directly comparable with the data for 2010 onwards.
Table I.5 Latin America and the Caribbean (6 countries): outward foreign direct investment flows, by quarter, 2018–2020(Millions of dollars)
2018 2019 2020
I II III IV I II III IV I II
Argentina 556 449 498 300 411 337 378 414 287 299
Brazil 348 -7 153 3 743 5 087 6 149 5 113 3 940 7 618 -4 897 -15 281
Chile 2 670 -4 378 2 257 32 1 238 1 434 4 075 1 682 1 240 937
Colombia 1 072 1 500 330 2 224 781 474 1 475 489 1 174 -250
Mexico 4 612 3 944 3 001 720 2 138 631 2 197 1 158 5 203 429
Peru 297 -552 173 101 649 356 126 -235 81 92
Source: Economic Commission for Latin America and the Caribbean (ECLAC), on the basis of official figures and estimates as of 10 November 2020.
Balance of payments figures are an indicator of the internationalization strategies of the region’s companies. However, as this process progresses and companies become integrated into international financial circuits, the dimensions of this process are underreported and distorted in the overseas direct investment data. As a result, those figures must be supplemented by background information on investments announced and acquisitions made by Latin American companies outside their home markets. With that information, a clearer picture of the strategies adopted by Trans-Latin companies can be formed.
In recent years, growth rates have been low in almost all regions of the world. In 2019, the world economy grew by 2.4%, its poorest result since the 2008–2009 global financial and economic crisis. It is also estimated that the global economy will contract by 5.2% in 2020 because of the COVID-19 pandemic, causing the worst crisis since World War II (ECLAC, 2020b).

46 Chapter I Economic Commission for Latin America and the Caribbean (ECLAC)
Facing that prospect, as already noted, Trans-Latin corporations have scaled back their international expansion processes, which might indicate the end of a cycle. At a time of economic uncertainty, a lack of dynamism across the board and trade conflicts, many companies postponed or cancelled their international expansion plans. Tensions between the United States and its main trading partners, especially China, had a negative impact on companies’ strategies, particularly those based in Mexico. The negotiations for the new Agreement between the United States of America, the United Mexican States, and Canada (USMCA) also caused uncertainty for Mexican companies seeking to consolidate their presence in the expanded economic space of North America.
Mergers and acquisitions are sensitive to such scenarios and to economic cycles. Faced with economic deceleration, companies that bet on growth and took on debt may have to get rid of some non-strategic assets to cope with the difficult situation. Thus, between January and August 2020, operations led by Latin American companies practically dried up as a result of the heightened uncertainty caused by the COVID-19 pandemic. Against that complex backdrop, as in the previous year, the undertakings of Mexican and Chilean companies, together with the scant activity of Brazilian companies, are worthy of particular note.
In Chile, the main operations involving Trans-Latin companies in recent years have been in the airline, forestry and retail sectors (see table I.6).
At these difficult times, Latin America’s leading airline has made important moves and tackled major challenges. In late 2018, LATAM Airlines Group announced that it would not renew its operating agreement with Multiplus, a coalition of loyalty programmes that offers the accumulation and redemption of points. At the same time, LATAM Airlines Brazil announced that it would make a public tender offer (PTO) to buy the Multiplus stock that it did not own. That operation was completed successfully in April 2019 and LATAM Airlines acquired 23.5% of Multiplus for around US$ 300 million, thus becoming the owner of 96.2% of the company. The acquisition of Multiplus and its full integration into LATAM Airlines will create, in conjunction with LATAM Pass, what is calculated to be the fourth largest frequent flyer and loyalty programme in the world.
Table I.6 Largest mergers and acquisitions carried out successfully by Trans-Latin corporations, 2019–2020(Millions of dollars)
Date Purchasing company Country Acquired assets Country Sector Amount
18/12/2019 América Móvil Mexico Nextel Telecomunicações Brazil Telecommunications 905
01/11/2019 Empresas CMPC Chile Serrados e Pasta de Celulose (SEPAC) Brazil Forestry products and paper 329
23/04/2019 LATAM Airlines Group Chile Multiplus Brazil Airlines 288
11/03/2019 BICECORP Chile Life annuity business in Chile Colombia Financial services 232
13/05/2019 NCB Financial Group Jamaica Guardian Holdings Limited Trinidad and Tobago
Financial services 207
13/02/2019 Arauco Chile Two Masisa plants Mexico Forestry products 160
27/11/2019 Enel Américas Chile Eletropaulo Metropolitana Eletricidade de São Paulo
Brazil Electricity 104
14/01/2019 Mineros Colombia Gualcamayo gold mine Argentina Mining 85
03/12/2019 Credicorp Peru Banco Compartir Colombia Financial services 79
02/10/2019 Hochschild Mining Peru Rare earth project Chile Mining 56
31/07/2019 Despegar Argentina Viajes Falabella Chile Internet 27
02/01/2019 Marfrig Global Foods Brazil Quickfood Argentina Foodstuffs 14
21/01/2019 SONDA Chile M2M Solutions Brazil Information and communication technologies (ICT)
11
Source: Economic Commission for Latin America and the Caribbean (ECLAC), on the basis of Bloomberg.

47Chapter IForeign Direct Investment in Latin America and the Caribbean • 2020
In September 2019, LATAM Airlines was involved in one of that year’s largest mergers and acquisitions in Latin America. The United States airline Delta Air Lines made a surprise announcement of its purchase of 20% of the company for US$ 1.94 billion (see table I.3). In addition to acquiring part ownership of the Chilean airline, which is an ally of its main competitor, American Airlines, Delta Air Lines announced the sale of its stake in Brazil’s Gol, the main competitor of LATAM Airlines in Brazil. The United States airline also expressed its intention to have LATAM Airlines —at the time a member of Oneworld, an alliance composed of American Airlines, Iberia, British Airways and various others— become part of SkyTeam, the alliance led by Delta Air Lines. This operation would allow the Chilean airline to reduce its debt and improve its capital structure. In May 2020, the two airlines signed a trans-American joint venture agreement to combine their complementary North and South American destination networks.
Against that backdrop of changes, in mid-2020 LATAM Airlines announced the suspension of its operations in Argentina for an indefinite period of time, after 15 years’ presence in the country. Thus, it will no longer cover 12 domestic routes and four international connections to Santiago, São Paulo, Lima and Miami, although the international routes will still be operated by other group subsidiaries.
With the spread of the COVID-19 pandemic and the adoption of mobility restrictions, including border closures, the airline industry entered a deep crisis. Within the space of a few weeks, Colombia’s Avianca, Mexico’s Aeroméxico and LATAM Airlines were all undergoing reorganization under chapter 11 of the United States Bankruptcy Code. In mid-September 2020, after intense negotiations between the creditors and major shareholders of LATAM Airlines, the United States District Court for the Southern District of New York approved a debtor-in-possession financing proposal involving funds in the amount of US$ 2.45 billion needed to address the impact of COVID-19.
International operations in the Chilean forestry sector were particularly active during 2019. At the beginning of the year, Arauco, a subsidiary of the conglomerate Empresas Copec, completed the purchase of two plants in Mexico owned by Masisa, another Chilean company, for US$ 160 million. The operation was part of the divestiture of Masisa’s industrial assets in Argentina, Brazil and Mexico, intended to reduce the company’s debt level and focus on businesses with a higher added value without losing production and export capacity in Chile, Mexico and the Bolivarian Republic of Venezuela.4 In turn, Empresas CMPC acquired Serrados e Pasta de Celulose (SEPAC) for US$ 329 million, becoming, through Softys, Brazil’s largest tissue paper producer.
In mid-2019, Embotelladora Andina opened Latin America’s most modern bottling plant for Coca-Cola products in Brazil. The new plant is part of a project to expand its operations in the State of Rio de Janeiro by approximately US$ 365 million.
In 2019, the retail sector —a pioneer in the international expansion of Chilean companies— remained prominent. Despite the prevailing uncertainty, and within the framework of its US$ 4.2 billion 2019–2022 investment plan, Falabella spend nearly US$ 1.4 billion to consolidate its regional presence: notably, through a new distribution centre in Peru and new Sodimac stores in Mexico. Rival chains Ripley and Casaideas also announced new stores in Peru and Colombia, respectively. However, there have also been signs of a certain withdrawal from overseas activities as a result of the bleak economic outlook in several of the region’s countries. In mid-2019, Falabella sold its travel business (Viajes Falabella) in Chile, Colombia, Peru and Argentina to Despegar,
4 In late 2017, Masisa had sold its Brazilian assets to Arauco for US$ 103 million.

48 Chapter I Economic Commission for Latin America and the Caribbean (ECLAC)
along with the licence to use the brand, for US$ 27 million.5 Retail commerce has been one of the activities most affected by the arrival of the pandemic and the introduction of measures to reduce mobility, forcing companies to reformulate their expansion strategies. In September 2020, Falabella announced it was seeking a partner for its operations in Argentina. The company does not plan to leave the country, but it is apparently evaluating different options to make the subsidiaries it has there profitable, which could include the entry of a strategic partner. For the time being, it is to close four of its stores in Buenos Aires. Ripley also announced it was to suspend the construction of three shopping centres in Peru.
In 2019, América Móvil, FEMSA, Grupo Bimbo, Alsea and others were responsible for the most important —in terms of the amounts involved or because of their strategic importance— mergers and acquisitions in Mexico. While some Mexican companies were buying abroad in order to diversify, others decided to sell assets to strengthen their financial situation. Those selling included CEMEX, Elementia and Banco Azteca. In that context, the share of foreign income in the total net sales of the largest Mexican companies fell from 42% in 2017 to 38.7% in 2019 (Expansión, 2020a).
The announcement by Spanish transnational Telefónica that it would concentrate on its most profitable markets opened up the possibility of a significant reduction in its Latin American presence, giving its eternal rival, Mexico’s América Móvil, the chance to improve its share in the region’s main markets.
In early 2019, América Móvil bought Telefónica’s operations in Guatemala and El Salvador for US$ 648 million. The agreement included the transfer of 100% of the assets of Telefónica Guatemala and 99.3% of the assets of Telefónica El Salvador. With this operation, the Mexican company was going to exceed 280 million users in the 21 countries in which it operates and was going to attain shares of 47% and 38% in the Guatemalan and Salvadoran markets. In early September 2020, however, América Móvil and Telefónica cancelled the purchase contract for the operations in El Salvador (La Jornada, 2020).6
In Brazil, América Móvil acquired the operations of Nextel Telecomunicações for US$ 905 million, increasing its market share to almost 26%, within six points of Telefónica. With this acquisition, América Móvil strengthened its presence in the postpaid market in Brazil’s largest cities (São Paulo and Rio de Janeiro) and became the largest mobile operator in Latin America (Expansión, 2020b). However, those operations and the economic uncertainty are putting pressure on América Móvil’s capacity to invest in the upcoming 5G technology spectrum auctions.
For years, first at home and then abroad, the Mexican company FEMSA has been pursuing an active diversification strategy. In the first stage, it acquired several Coca-Cola bottling companies, and it then entered other segments linked mainly to the retail trade (convenience stores, fuel stations, pharmacies and so on). In general, FEMSA’s strategy has been to make relatively modest initial investments, and then evaluate the results of its strategy before expanding more intensely. This was the case with its purchase of a US$ 750 million minority stake in the restaurant supplier Jetro Restaurant Depot in late 2019. With this operation, FEMSA intends to spread Jetro Restaurant Depot’s business model across Mexico and Latin America, as well as to access a new market: the United States.
5 This operation was part of a strategic alliance between Falabella and Despegar, under which they signed an extendable ten-year commercial agreement in Chile, Colombia, Peru and Argentina. The agreement included the transfer of 100% of Viajes Falabella’s operations to Despegar.
6 The decision was taken after jointly evaluating the conditions need to secure the regulatory authorization required by the final resolution issued shortly before by El Salvador’s Superintendency of Competition. In August 2020, the country’s regulator approved the sale, but subjected the US$ 315 million transaction to certain conditions that América Móvil had to meet.
49Chapter IForeign Direct Investment in Latin America and the Caribbean • 2020
In 2019, FEMSA concluded two acquisitions to develop its Oxxo convenience store business model and to grow in the Brazilian fuel station market. It first bought 50% of the convenience store and service station chain Raízen Conveniências for around US$ 136 million, and then acquired AGV, a storage and distribution company, for US$ 156 million.7
In 2015, FEMSA spent almost US$ 500 million to acquire 60% of the Chilean group Socofar, which is the parent company of Farmacias Cruz Verde; in January 2020 it bought the remaining 40%. In April 2019, FEMSA completed the acquisition of the Corporación GPF pharmacy chain, which secured it 620 retail outlets in Ecuador under the Fybeca and SanaSana names.
In addition to pursuing a strategy of growth and diversification through acquisitions, FEMSA has also divested itself of some of its less strategic assets. That was the case with the December 2018 sale of its stake in the Philippines bottling sector for US$ 715 million. With that operation, FEMSA restricted its diversification strategy to Latin America. It currently has a presence in 13 countries: Argentina, the Bolivarian Republic of Venezuela, Brazil, Chile, Colombia, Costa Rica, Ecuador, Guatemala, Mexico, Nicaragua, Panama, Peru and Uruguay.
In 2019, Grupo Bimbo, the largest bakery company in the world, acquired the Mr. Bagels company in the United Kingdom and the Siro sliced bread production plant located in Paterna, Valencia, Spain. The Siro plant belonged to the Spanish company Cerealto Siro Foods, which produces bread for the Mercadona supermarket chain. With the purchase of this plant, Grupo Bimbo was aiming to consolidate its presence in the Spanish market. Although these new acquisitions are not located in Grupo Bimbo’s priority region (the United States and Canada), they are in rapidly expanding markets. Grupo Bimbo continues to monitor the performance of each region, to focus on those with the greatest potential. In November 2019, it closed the Maestro Cubano plant in Uruguay. It currently has 199 plants in 33 countries in the Americas, Africa, Asia and Europe, including China, Colombia, Brazil, India, Spain and the United States.
In the space of just a few years, the Mexican company Alsea has become one of the largest international operators of global branded restaurant franchises. Through an active acquisition strategy, it currently operates 16 brands and 4,495 restaurants in 11 Latin American and European countries. Foreign sales already account for more than 50% of its revenue. In 2019 it acquired Grupo Vips in Spain and the Starbucks operations in France, Belgium and Luxembourg. The latter operation expanded Alsea’s existing Starbucks operations in Spain, the Netherlands and Portugal.
In mid 2019, Bio Pappel, Mexico’s largest manufacturer of paper and paper products, acquired 55% of the paper company U.S. Corrugated and its subsidiaries. With this operation —carried out through its subsidiary in the United States, the McKinley Paper Company— Bio Pappel doubled its presence in the United States, which will allow it to achieve greater integration and thus offer products of higher added value and bolster its export capacity. Less than a year after the purchase, the Mexican company increased its stake in U.S. Corrugated to 80%, and it now has 34 production plants and 13 storage facilities in Mexico, the United States and Colombia.
In 2019, the petrochemical company Alpek, the largest producer of polyethylene terephthalate (PET) in North America, completed its entry into the European market with the purchase of Lotte Chemical in the United Kingdom. The operation was estimated to be worth around US$ 255 million (El Economista, 2019a). Alpek now operates 28 plants in the United States, Mexico, Canada, Brazil, Argentina, Chile and
7 Raízen Conveniências is a joint venture, owned in equal parts by Cosan and Shell. The company currently operates more than 6,200 Shell fuel stations in Brazil and, to date, approximately 1,000 of them are equipped with a Select brand convenience store.
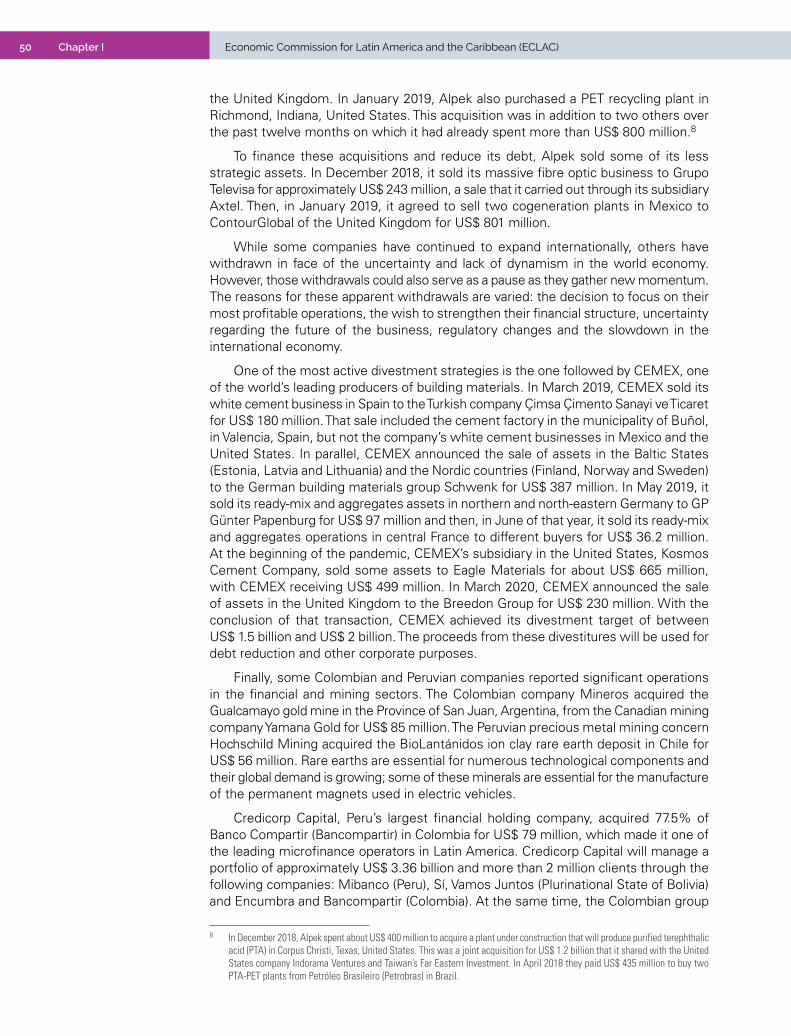
50 Chapter I Economic Commission for Latin America and the Caribbean (ECLAC)
the United Kingdom. In January 2019, Alpek also purchased a PET recycling plant in Richmond, Indiana, United States. This acquisition was in addition to two others over the past twelve months on which it had already spent more than US$ 800 million.8
To finance these acquisitions and reduce its debt, Alpek sold some of its less strategic assets. In December 2018, it sold its massive fibre optic business to Grupo Televisa for approximately US$ 243 million, a sale that it carried out through its subsidiary Axtel. Then, in January 2019, it agreed to sell two cogeneration plants in Mexico to ContourGlobal of the United Kingdom for US$ 801 million.
While some companies have continued to expand internationally, others have withdrawn in face of the uncertainty and lack of dynamism in the world economy. However, those withdrawals could also serve as a pause as they gather new momentum. The reasons for these apparent withdrawals are varied: the decision to focus on their most profitable operations, the wish to strengthen their financial structure, uncertainty regarding the future of the business, regulatory changes and the slowdown in the international economy.
One of the most active divestment strategies is the one followed by CEMEX, one of the world’s leading producers of building materials. In March 2019, CEMEX sold its white cement business in Spain to the Turkish company Çimsa Çimento Sanayi ve Ticaret for US$ 180 million. That sale included the cement factory in the municipality of Buñol, in Valencia, Spain, but not the company’s white cement businesses in Mexico and the United States. In parallel, CEMEX announced the sale of assets in the Baltic States (Estonia, Latvia and Lithuania) and the Nordic countries (Finland, Norway and Sweden) to the German building materials group Schwenk for US$ 387 million. In May 2019, it sold its ready-mix and aggregates assets in northern and north-eastern Germany to GP Günter Papenburg for US$ 97 million and then, in June of that year, it sold its ready-mix and aggregates operations in central France to different buyers for US$ 36.2 million. At the beginning of the pandemic, CEMEX’s subsidiary in the United States, Kosmos Cement Company, sold some assets to Eagle Materials for about US$ 665 million, with CEMEX receiving US$ 499 million. In March 2020, CEMEX announced the sale of assets in the United Kingdom to the Breedon Group for US$ 230 million. With the conclusion of that transaction, CEMEX achieved its divestment target of between US$ 1.5 billion and US$ 2 billion. The proceeds from these divestitures will be used for debt reduction and other corporate purposes.
Finally, some Colombian and Peruvian companies reported significant operations in the financial and mining sectors. The Colombian company Mineros acquired the Gualcamayo gold mine in the Province of San Juan, Argentina, from the Canadian mining company Yamana Gold for US$ 85 million. The Peruvian precious metal mining concern Hochschild Mining acquired the BioLantánidos ion clay rare earth deposit in Chile for US$ 56 million. Rare earths are essential for numerous technological components and their global demand is growing; some of these minerals are essential for the manufacture of the permanent magnets used in electric vehicles.
Credicorp Capital, Peru’s largest financial holding company, acquired 77.5% of Banco Compartir (Bancompartir) in Colombia for US$ 79 million, which made it one of the leading microfinance operators in Latin America. Credicorp Capital will manage a portfolio of approximately US$ 3.36 billion and more than 2 million clients through the following companies: Mibanco (Peru), Sí, Vamos Juntos (Plurinational State of Bolivia) and Encumbra and Bancompartir (Colombia). At the same time, the Colombian group
8 In December 2018, Alpek spent about US$ 400 million to acquire a plant under construction that will produce purified terephthalic acid (PTA) in Corpus Christi, Texas, United States. This was a joint acquisition for US$ 1.2 billion that it shared with the United States company Indorama Ventures and Taiwan’s Far Eastern Investment. In April 2018 they paid US$ 435 million to buy two PTA-PET plants from Petróleo Brasileiro (Petrobras) in Brazil.

51Chapter IForeign Direct Investment in Latin America and the Caribbean • 2020
SURA, through SURA Asset Management Chile, sold its life annuity business in Chile to the local BICECORP group for US$ 232 million.
In short, because of the very difficult circumstances, the international expansion of Latin American companies has slowed down and, in some cases, has been reversed. In a world badly hit by the COVID-19 pandemic, it is likely that it will take some time for this dynamic to resume at the pace observed in recent years.
D. Complicated prospects for the world and the region in 2020
The results achieved over the decade already underscored the need to rethink the role of FDI in supporting sustained growth with greater social equity and environmental sustainability. And that is the scenario that Latin America and the Caribbean face in 2020, a year that has been marked by a global health and economic crisis largely unprecedented in history.
The current economic crisis has its origins in both supply and demand. On the supply side, the physical distancing measures that governments have adopted to contain the pandemic have affected the operations and output of businesses, leading to the total or partial suspension of productive activities. This effect has been felt most strongly in those sectors that involve crowds and physical proximity, such as tourism, entertainment, hotels and restaurants, transport and personal services, and less pronounced in sectors deemed indispensable, such as food, disinfectants, cleaning supplies, medicines, and medical supplies and equipment.
The disruption of so many productive activities has also created problems in supplying domestic and imported inputs to the companies that have continued to operate: either because the raw materials and supplies they need are produced in locations affected by the pandemic, or because the international transport networks that carry the required supplies have been disrupted or because transport costs have increased.
On the demand side, reduced consumer incomes and rising uncertainty have led to a drop in consumption and shifts in consumption patterns. This effect has been particularly noticeable in consumer durables —such as cars, furniture, household appliances, housing, clothing and footwear— while the impact has been smaller or even positive on sales of other types of goods and services: cleaning products and disinfectants, foodstuffs with long shelf lives, streaming television and telecommunications.
In addition, the fall in economic activity and other aspects of the international context, such as the oil situation, have led to a general reduction in external demand (ECLAC, 2020a).
In addition to these factors, changes in the business climate, as well as in trade and investment policy, have taken place due to widespread concern about the rapid spread of the economic impact of the crisis. In that context, there has been a resurgence of protectionism and measures restricting the export of essential goods (medical supplies), as well as policies explicitly aimed at controlling activities deemed to be of strategic value. In addition, the enormous uncertainty about the shape the recovery will take and its duration has been strongly felt by both actors and markets, and this has led to a dramatic fall in cross-border investments.
Indeed, the outlook is very uncertain and prospects depend on how long the health crisis lasts and how effective the public policy interventions are in mitigating the pandemic’s economic impact. It is estimated that global FDI will fall by 40% in 2020,
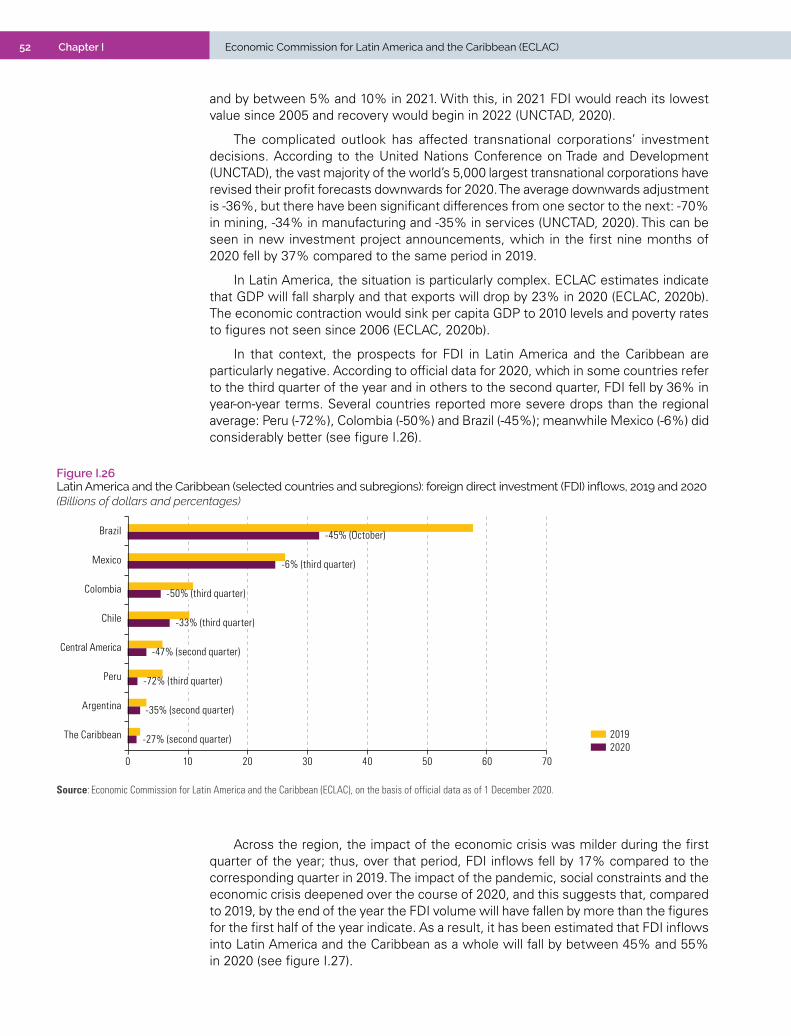
52 Chapter I Economic Commission for Latin America and the Caribbean (ECLAC)
and by between 5% and 10% in 2021. With this, in 2021 FDI would reach its lowest value since 2005 and recovery would begin in 2022 (UNCTAD, 2020).
The complicated outlook has affected transnational corporations’ investment decisions. According to the United Nations Conference on Trade and Development (UNCTAD), the vast majority of the world’s 5,000 largest transnational corporations have revised their profit forecasts downwards for 2020. The average downwards adjustment is -36%, but there have been significant differences from one sector to the next: -70% in mining, -34% in manufacturing and -35% in services (UNCTAD, 2020). This can be seen in new investment project announcements, which in the first nine months of 2020 fell by 37% compared to the same period in 2019.
In Latin America, the situation is particularly complex. ECLAC estimates indicate that GDP will fall sharply and that exports will drop by 23% in 2020 (ECLAC, 2020b). The economic contraction would sink per capita GDP to 2010 levels and poverty rates to figures not seen since 2006 (ECLAC, 2020b).
In that context, the prospects for FDI in Latin America and the Caribbean are particularly negative. According to official data for 2020, which in some countries refer to the third quarter of the year and in others to the second quarter, FDI fell by 36% in year-on-year terms. Several countries reported more severe drops than the regional average: Peru (-72%), Colombia (-50%) and Brazil (-45%); meanwhile Mexico (-6%) did considerably better (see figure I.26).
Figure I.26 Latin America and the Caribbean (selected countries and subregions): foreign direct investment (FDI) inflows, 2019 and 2020(Billions of dollars and percentages)
20192020
-45% (October)
-6% (third quarter)
-50% (third quarter)
-33% (third quarter)
-47% (second quarter)
-72% (third quarter)
-35% (second quarter)
-27% (second quarter)
0 10 20 30 40 50 60 70
Brazil
Mexico
Colombia
Chile
Central America
Peru
Argentina
The Caribbean
Source: Economic Commission for Latin America and the Caribbean (ECLAC), on the basis of official data as of 1 December 2020.
Across the region, the impact of the economic crisis was milder during the first quarter of the year; thus, over that period, FDI inflows fell by 17% compared to the corresponding quarter in 2019. The impact of the pandemic, social constraints and the economic crisis deepened over the course of 2020, and this suggests that, compared to 2019, by the end of the year the FDI volume will have fallen by more than the figures for the first half of the year indicate. As a result, it has been estimated that FDI inflows into Latin America and the Caribbean as a whole will fall by between 45% and 55% in 2020 (see figure I.27).

53Chapter IForeign Direct Investment in Latin America and the Caribbean • 2020
50
70
90
110
130
150
170
190
210
230
2010 2011 2012 2013 2014 2015 2016 2017 2018 2019 2020
-55%
-45%
Source: Economic Commission for Latin America and the Caribbean (ECLAC), on the basis of official data as of 1 December 2020.
An analysis of investment projects confirms that the reduction in the region’s FDI could be very significant. In the first nine months of 2020, the announced volume was estimated at US$ 38.993 billion between a total of 696 projects, which is significantly lower than the numbers recorded between January and September 2019: 1,496 projects worth US$ 89.688 billion (see figure I.28). This represents a reduction of 57% and 53% in the monetary volume and numbers of announcements, respectively.
Figure I.28 Latin America and the Caribbean: amounts and numbers of investment projects announced from January to September each year, 2016–2020(Billions of dollars and number of announcements)
0
200
400
600
800
1 000
1 200
1 400
1 600
1 800
2 000
0
10
20
30
40
50
60
70
80
90
100
2016 2017 2018 2019 2020
Number of announcements(right scale)
Amount
Amount-57%
Number -53%
Source: Economic Commission for Latin America and the Caribbean (ECLAC), on the basis of Financial Times, fDi Markets [online database] https://www.fdimarkets.com/.
Figure I.27 Latin America and the Caribbean: foreign direct investment (FDI) inflows, 2010–2019 and 2020 estimate(Billions of dollars)
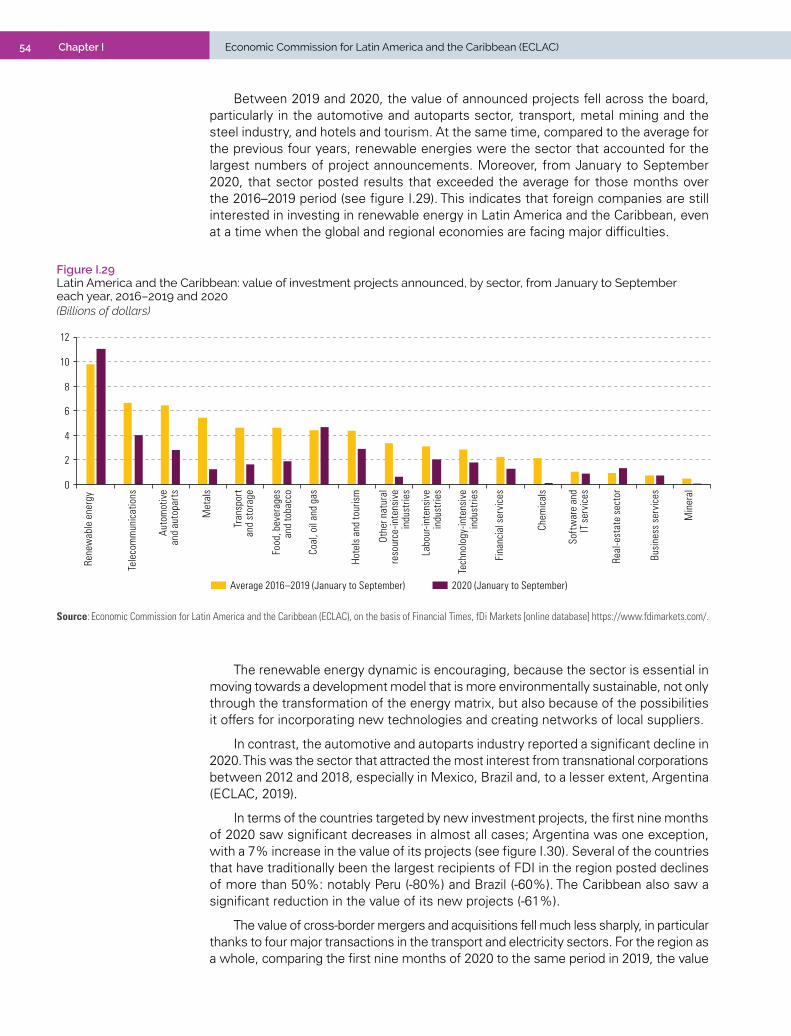
54 Chapter I Economic Commission for Latin America and the Caribbean (ECLAC)
Between 2019 and 2020, the value of announced projects fell across the board, particularly in the automotive and autoparts sector, transport, metal mining and the steel industry, and hotels and tourism. At the same time, compared to the average for the previous four years, renewable energies were the sector that accounted for the largest numbers of project announcements. Moreover, from January to September 2020, that sector posted results that exceeded the average for those months over the 2016–2019 period (see figure I.29). This indicates that foreign companies are still interested in investing in renewable energy in Latin America and the Caribbean, even at a time when the global and regional economies are facing major difficulties.
Figure I.29 Latin America and the Caribbean: value of investment projects announced, by sector, from January to September each year, 2016–2019 and 2020 (Billions of dollars)
0
2
4
6
8
10
12
Rene
wab
le e
nerg
y
Tele
com
mun
icat
ions
Auto
mot
ive
and
auto
part
s
Met
als
Tran
spor
tan
d st
orag
e
Food
, bev
erag
esan
d to
bacc
o
Coal
, oil
and
gas
Hote
ls a
nd to
uris
m
Othe
r nat
ural
reso
urce
-inte
nsiv
ein
dust
ries
Tech
nolo
gy-in
tens
ive
indu
strie
s
Labo
ur-in
tens
ive
indu
strie
s
Fina
ncia
l ser
vice
s
Chem
ical
s
Sof
twar
e an
dIT
ser
vice
s
Real
-est
ate
sect
or
Busi
ness
ser
vice
s
Min
eral
Average 2016–2019 (January to September) 2020 (January to September)
Source: Economic Commission for Latin America and the Caribbean (ECLAC), on the basis of Financial Times, fDi Markets [online database] https://www.fdimarkets.com/.
The renewable energy dynamic is encouraging, because the sector is essential in moving towards a development model that is more environmentally sustainable, not only through the transformation of the energy matrix, but also because of the possibilities it offers for incorporating new technologies and creating networks of local suppliers.
In contrast, the automotive and autoparts industry reported a significant decline in 2020. This was the sector that attracted the most interest from transnational corporations between 2012 and 2018, especially in Mexico, Brazil and, to a lesser extent, Argentina (ECLAC, 2019).
In terms of the countries targeted by new investment projects, the first nine months of 2020 saw significant decreases in almost all cases; Argentina was one exception, with a 7% increase in the value of its projects (see figure I.30). Several of the countries that have traditionally been the largest recipients of FDI in the region posted declines of more than 50%: notably Peru (-80%) and Brazil (-60%). The Caribbean also saw a significant reduction in the value of its new projects (-61%).
The value of cross-border mergers and acquisitions fell much less sharply, in particular thanks to four major transactions in the transport and electricity sectors. For the region as a whole, comparing the first nine months of 2020 to the same period in 2019, the value
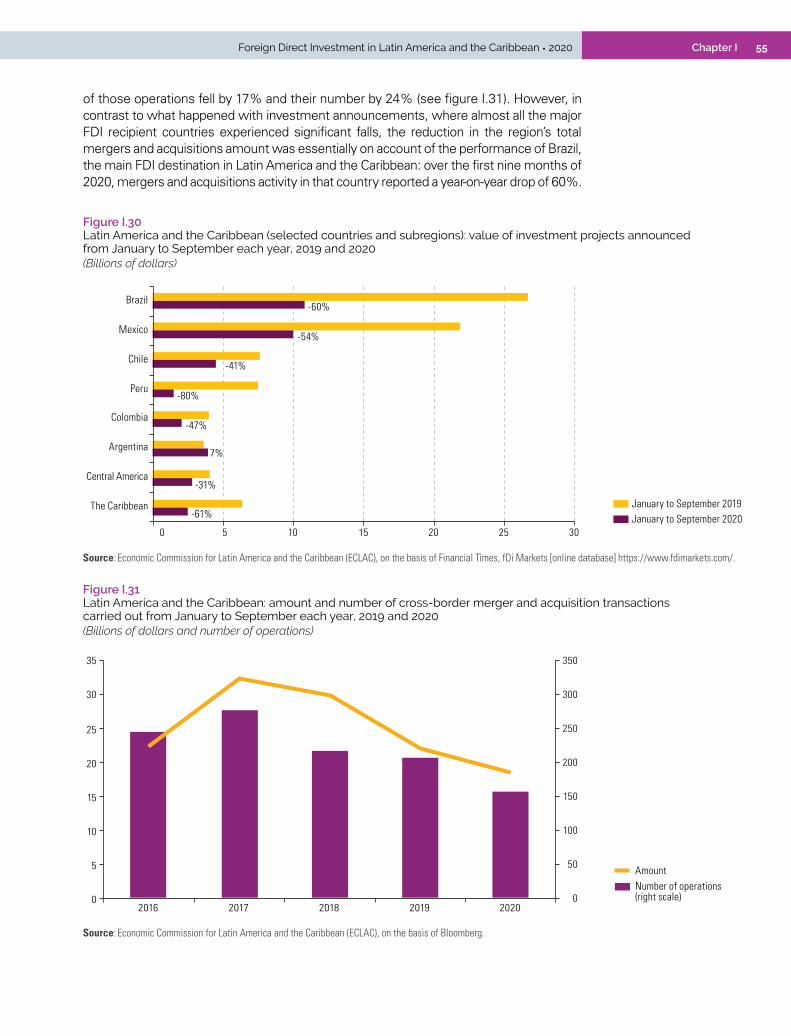
55Chapter IForeign Direct Investment in Latin America and the Caribbean • 2020
of those operations fell by 17% and their number by 24% (see figure I.31). However, in contrast to what happened with investment announcements, where almost all the major FDI recipient countries experienced significant falls, the reduction in the region’s total mergers and acquisitions amount was essentially on account of the performance of Brazil, the main FDI destination in Latin America and the Caribbean: over the first nine months of 2020, mergers and acquisitions activity in that country reported a year-on-year drop of 60%.
Figure I.30 Latin America and the Caribbean (selected countries and subregions): value of investment projects announced from January to September each year, 2019 and 2020(Billions of dollars)
-60%
-54%
-41%
-80%
-47%
7%
-31%
-61%
0 5 10 15 20 25 30
Brazil
Mexico
Chile
Peru
Colombia
Argentina
Central America
The Caribbean January to September 2019 January to September 2020
Source: Economic Commission for Latin America and the Caribbean (ECLAC), on the basis of Financial Times, fDi Markets [online database] https://www.fdimarkets.com/.
Figure I.31 Latin America and the Caribbean: amount and number of cross-border merger and acquisition transactions carried out from January to September each year, 2019 and 2020(Billions of dollars and number of operations)
Number of operations(right scale)
Amount
0
50
100
150
200
250
300
350
0
5
10
15
20
25
30
35
2016 2017 2018 2019 2020
Source: Economic Commission for Latin America and the Caribbean (ECLAC), on the basis of Bloomberg.

56 Chapter I Economic Commission for Latin America and the Caribbean (ECLAC)
E. Conclusions
The impact of the current crisis will lead to a deep drop in FDI. Global flows could fall by 40% in 2020, and by between 5% and 10% in 2021. This means that FDI will only begin to recover in 2022 (UNCTAD, 2020).
One important element to consider is that the magnitude and characteristics of the recovery will depend not only on how long the COVID-19 pandemic lasts and on the capacity of governments to deal with the economic crisis in their countries, but also on possible transformations in the international organization of production and trade. The crisis has highlighted the fragility of global supply chains and has exacerbated tensions, forcing companies to seek new formulas that allow them to modify their organizational and business models.
It is possible that changes with a direct impact on FDI flows will occur in the near future. In addition to traditional cost factors, companies will incorporate strategic geopolitical considerations in defining the location of their operations. Investments may be further diversified to strengthen the resilience of global value chains led by transnational corporations. Thus, it is possible that some processes, such as nearshoring and reshoring, still incipient at present, will intensify in the coming years, as discussed in the second chapter of this report. That dynamic could open up a window of opportunity for improving the insertion of some developing countries into the global economy. To this end, policy actions must be designed to strengthen or build the capacities that the new production landscape will begin to demand.
2019 marks the end of the decade when FDI inflows into Latin America and the Caribbean reached an all-time high. That milestone was hit in 2012; after that landmark result, however, the region’s FDI flows began to fall almost continuously, underscoring their dependence on commodity price cycles, especially in the South American countries. Thus, FDI inflows in 2019 were 25% lower than in 2012.
At the same time, there is no evidence to suggest that FDI contributed to significant changes in the region’s productive structure over the course of the decade. While it is true there was an increase in investment projects and FDI for renewable energies, the vast majority of flows were channelled towards sectors that were already consolidated in the productive structures of the region’s countries and where transnationals have been playing a prominent role for decades, such as the automobile, steel, telecommunications, trade and financial services sectors. Accordingly, foreign investment did not act as a catalyst for major changes in the region’s production dynamics. This was also due to the lack of interconnection between productive development policies and policies to attract FDI. Investment agencies were, in many cases, effective in their mission to attract foreign capital into new sectors. As noted in the third chapter of this report, one good example of this is the Costa Rican Investment Promotion Agency (CINDE), an agency dedicated to promoting foreign investment in Costa Rica. However, the region’s industrial and productive development policies were not closely connected to FDI-related initiatives.
At the same time, the absolute value of FDI-associated income rose by 24% in the second half of the decade, and the income balance deficit grew from the equivalent of 1.6% of GDP in 2014 to 1.9% in 2019. At the same time, profit repatriation increased
57Chapter IForeign Direct Investment in Latin America and the Caribbean • 2020
by 10%. In short, the balance sheet for the decade shows that FDI adapted to the dynamics of the existing productive structure, to the macroeconomic situation of the region’s countries and to trends in international commodity markets.
At the end of 2020, the prospects for foreign investment inflows into Latin America and the Caribbean are highly negative. Balance of payments data for the first half of the year, information on investment project announcements and mergers and acquisitions in the first nine months of the year, and ECLAC forecasts of how the region’s GDP provide grounds for estimating that FDI inflows into Latin America and the Caribbean as a whole will fall by between 45% and 55%.
In that context, attention must again be paid to the observation of the Secretary-General of the United Nations that “building back better requires transforming the development model of Latin America and the Caribbean”, as well as the messages transmitted by ECLAC during its thirty-eighth session (ECLAC, 2020c).
FDI has made a significant contribution in the region as a complement to domestic investment and as a source of new capital, and it has also helped to expand export activities and to develop the automotive industry, telecommunications, some segments of the digital economy and certain sectors that are now strategically important in the context of the COVID-19 pandemic, such as the pharmaceutical industry and the medical devices sector.
However, the structural problems of the region’s economies and the new international context require that FDI and policies to promote it be an integral part of a broader project to bring about progressive structural change: “a change that allows for increased productivity together with social inclusion, equality, and growing environmental sustainability” (ECLAC, 2020c, p. 211).
Accordingly, the role of industrial policy as a tool for transforming the production structure must be reasserted. This is indispensable at the present time, because absent or weak policies of that kind, at a time when the fourth industrial revolution is accelerating and major transformations are taking place in the international organization of production, will inevitably lead to the widening of the productive and technological gaps that characterize Latin America and the Caribbean (Cimoli and others, 2017).
For FDI to be a part of this vision of industrial policy, conditions must be set not only to attract foreign capital, but also for it to become a source of increased productivity, innovation and technology, and for it to be channelled towards sustained, inclusive and sustainable economic growth.
The policy of transforming the productive structure must be structured around three major areas of intervention (ECLAC, 2020d) and, in each of them, FDI can make an important contribution to the region.
Firstly, industrial policy should target those sectors and production chains that will become more dynamic in the global economy: for example, biomaterials, new materials and services associated with smart buildings, renewable energy, electromobility, products and services related to the health system, such as pharmaceuticals, medical devices and telemedicine, and agri-foods that use traceable production processes, short circuits and local production systems. In each of those areas, foreign companies
58 Chapter I Economic Commission for Latin America and the Caribbean (ECLAC)
have know-how, technologies, good practices, standards and business models that could be very useful for creating new sectors or substantially improving existing ones.
Secondly, the countries of the region must make efforts to significantly increase the density of businesses with higher levels of productivity. Thus, and taking into account the value chains with the greatest potential for dynamism, plans are needed that will effectively allow for the inclusion of a critical mass of firms to modify national productivity dynamics. In this case, appropriate incentives and rules must be established to guide transnational corporations’ investments into the development of supply chains and business networks.
Third, there are factors that could favour the interconnection of regional productive activities. One of these is the reorganization of global value chains, as discussed in the second chapter of this report. Another factor is the fact that the evolution of technology and many of the new products and services emerging from the most dynamic chains involve very large scales of production and technological infrastructure, and this makes it difficult (or even impossible) for a country in the region to develop the necessary capacities to exploit them on its own. Here too, transnational corporations can play a significant role in accompanying countries’ efforts to promote complementarities and productive cooperation agreements that can replace the traditional competitive relationships that characterize many countries specializing in similar final products (ECLAC, 2020d).
With regard to mechanisms for implementing policies, it should not be forgotten that the dynamics of productive specialization are linked to the incentives that define how investments are allocated. Consensus is therefore needed between public and private actors —and, more generally, within society as a whole— regarding what the priority objectives are to be, along with clear and defined leadership by the State.
F. Analysis by country
Because of the prevailing uncertainty in the international context, FDI fell in the vast majority of countries and subregions, in some cases sharply (see map I.1). In 2019, FDI inflows to South America increased in only four countries (Chile, Colombia, Paraguay and Peru). Central America (with the exception of Guatemala and Panama) and Mexico recorded significant declines, against a backdrop of tensions with the United States. The Caribbean reported a slight increase in FDI inflows, driven by the encouraging performances of Guyana, the Dominican Republic and Trinidad and Tobago. In the first half of 2020, the decrease in FDI inflows was exacerbated by the outbreak of the COVID-19 pandemic.
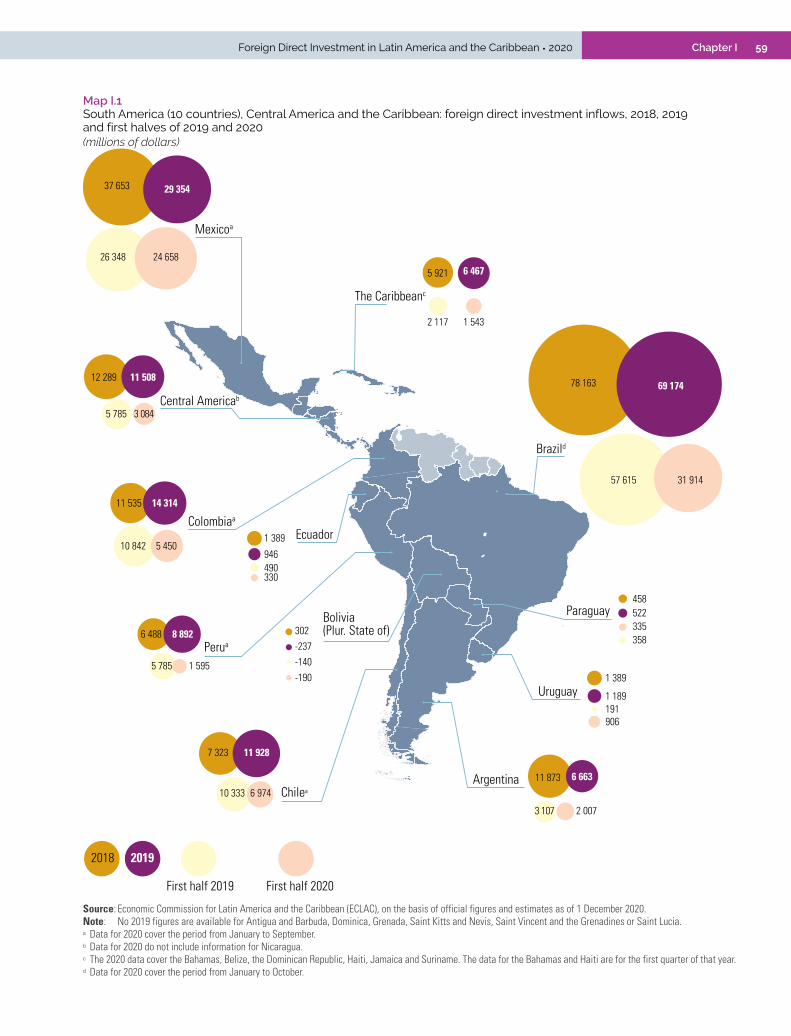
59Chapter IForeign Direct Investment in Latin America and the Caribbean • 2020
Map I.1 South America (10 countries), Central America and the Caribbean: foreign direct investment inflows, 2018, 2019 and first halves of 2019 and 2020(millions of dollars)
Brazild
Mexicoa
Colombiaa
Perua
Argentina
Central Americab
The Caribbeanc
2018
First half 2019 First half 2020
Chilea
Bolivia(Plur. State of)
Ecuador
Uruguay
Paraguay302-237-140-190
2019
37 653
26 348 24 658
29 354
1 389
458522335358
1 189191906
11 873
3 107 2 007
78 16312 289
11 535
1 389
946490330
6 488
7 323
10 333 6 974
5 785 1 595
10 842 5 450
5 785 3 084
5 921
57 615
2 117 1 543
31 914
6 663
11 928
8 892
14 314
11 50869 174
6 467
Source: Economic Commission for Latin America and the Caribbean (ECLAC), on the basis of official figures and estimates as of 1 December 2020. Note: No 2019 figures are available for Antigua and Barbuda, Dominica, Grenada, Saint Kitts and Nevis, Saint Vincent and the Grenadines or Saint Lucia. a Data for 2020 cover the period from January to September.b Data for 2020 do not include information for Nicaragua. c The 2020 data cover the Bahamas, Belize, the Dominican Republic, Haiti, Jamaica and Suriname. The data for the Bahamas and Haiti are for the first quarter of that year.d Data for 2020 cover the period from January to October.

60 Chapter I Economic Commission for Latin America and the Caribbean (ECLAC)
1. Brazil: the region’s biggest host country is hit hard
In 2019, FDI inflows to Brazil fell by 11.5% compared to the previous year; the total amount was US$ 69.174 billion, making the country the sixth largest host country in the world (UNCTAD, 2020). This result was reported at a time of weak economic growth (1.1% in 2019) and was in line with the country’s average FDI receipts over the past five years (about US$ 72 billion a year); however, it is less than the nearly US$ 88 billion per year recorded in the first half of the decade (2010–2014). Because of the pandemic, a significant drop in FDI inflows is expected in 2020. Data for the first 10 months of the year indicate receipts of US$ 31.914 billion, indicating a decline of 45% compared to the same period last year.
A breakdown of this FDI shows that the drop in 2019 was due to a fall in intercompany loans, which were 73% lower than in 2018; at the same time, equity and reinvested earnings increased by 5% and 27%, respectively. As a result, equity accounted for 62% of the total 2019 FDI inflow, highlighting transnational companies’ interest in operating in the country, while reinvested earnings, which can be interpreted as a sign of confidence on the part of established companies, made up 30%. The opposite scenario was recorded in 2018, when intercompany loan inflows grew substantially and offset the decline in the other components. Thus, in both 2019 and 2018, intercompany loans were a determining factor in the variation of total FDI flows; this underscores the impact that transnational corporations’ capital movements can have on national accounts, even in large economies such as Brazil.
Of the total 2019 FDI, 63% less investment was received from the Netherlands and 25% less from the United States, although both remained Brazil’s main sources of FDI (16% and 14% of the total, respectively).9 Other notable countries of origin were France (8%), Chile (8%), Austria (7%), the United Kingdom (6%) and Norway (5%), all of which invested more than in 2018.10
Over the decade, manufacturing and services were the sectors that received most of Brazil’s FDI: between 2010 and 2019, their shares of average receipts were, respectively, 49% and 34%. That pattern was maintained in 2019, when manufacturing accounted for 51% of FDI and services for 25%. In the services sector, however, there was a sharp year-on-year drop of 32%, giving it its lowest share in the decade. Inflows into manufacturing fell by 26% compared to 2018, but there was a recovery in investments in natural resources which, in 2019, accounted for 24% of FDI inflows, their highest share since 2011.
The increased share of natural resources in 2019 can largely be explained by increased investments in hydrocarbon extraction. Over the first half of the decade (2010–2014), hydrocarbons and metal mining were the main recipients of natural resource FDI, with shares of 52% and 33%, respectively. That situation shifted in 2015, as capital inflows for metal mining slowed down: there were years when the flow was positive and others when it was negative (2019, for example, reported a negative flow). In contrast, investments in hydrocarbons have been bolstered in recent years by the exploitation of the pre-salt layer and the divestiture of assets by Petrobras. Thus, 2019 saw the sale of 50% of the exploration and production rights in the Tartaruga Verde field (concession BM-C-36) and Module III of the Espadarte field to PETRONAS Petróleo Brasil Ltda. (PPBL), a subsidiary of Malaysia’s Petroliam Nasional Berhad (PETRONAS). The sale was worth US$ 950 million and was one of the country’s largest operations.
9 Data by origin and by sector do not include profit reinvestments. 10 As already noted, FDI statistics by country of origin record the immediate country and not the ultimate origin of the funds, which
is particularly important for investments recorded as originating in the Netherlands or Luxembourg, as these are markets that companies from other countries often use as a platform for overseas investments.
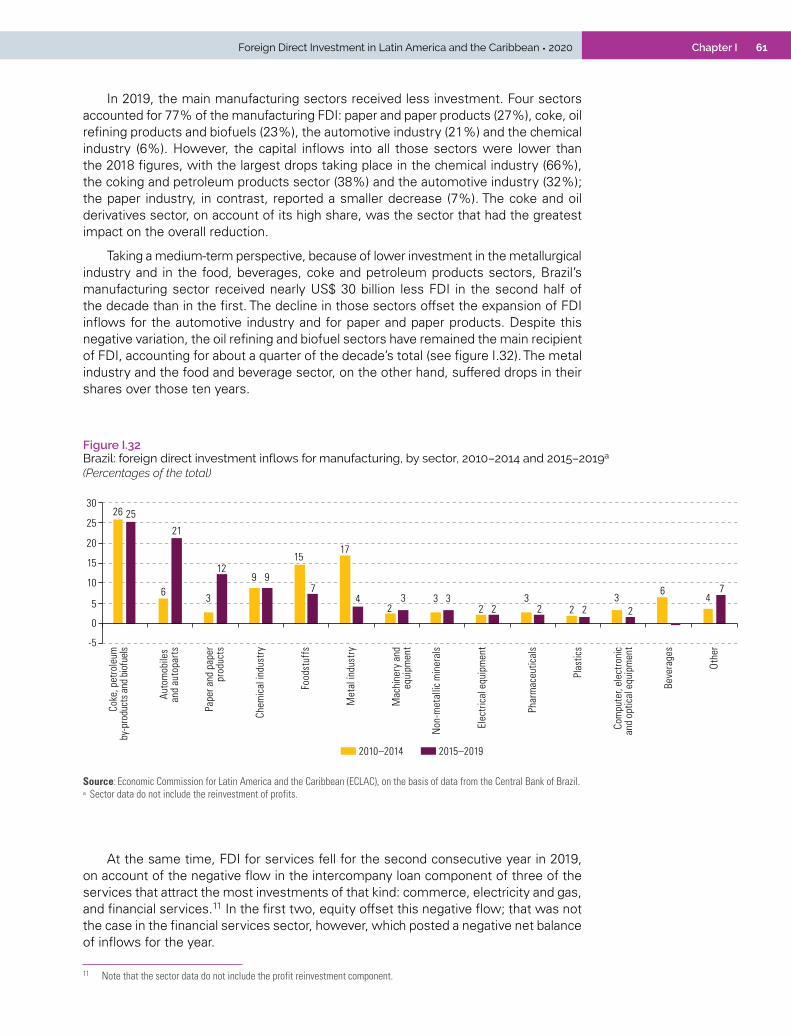
61Chapter IForeign Direct Investment in Latin America and the Caribbean • 2020
In 2019, the main manufacturing sectors received less investment. Four sectors accounted for 77% of the manufacturing FDI: paper and paper products (27%), coke, oil refining products and biofuels (23%), the automotive industry (21%) and the chemical industry (6%). However, the capital inflows into all those sectors were lower than the 2018 figures, with the largest drops taking place in the chemical industry (66%), the coking and petroleum products sector (38%) and the automotive industry (32%); the paper industry, in contrast, reported a smaller decrease (7%). The coke and oil derivatives sector, on account of its high share, was the sector that had the greatest impact on the overall reduction.
Taking a medium-term perspective, because of lower investment in the metallurgical industry and in the food, beverages, coke and petroleum products sectors, Brazil’s manufacturing sector received nearly US$ 30 billion less FDI in the second half of the decade than in the first. The decline in those sectors offset the expansion of FDI inflows for the automotive industry and for paper and paper products. Despite this negative variation, the oil refining and biofuel sectors have remained the main recipient of FDI, accounting for about a quarter of the decade’s total (see figure I.32). The metal industry and the food and beverage sector, on the other hand, suffered drops in their shares over those ten years.
Figure I.32 Brazil: foreign direct investment inflows for manufacturing, by sector, 2010–2014 and 2015–2019a
(Percentages of the total)
-5
0
5
15
10
20
25
3026
6 3
9
15 17
2 3
2 3
2 2 3
6 4
25
21
12 9
7 4 3 3
2 2 2
7
Coke
, pet
role
umby
-pro
duct
s and
bio
fuel
s
Auto
mob
iles
and
auto
part
s
Pape
r and
pap
erpr
oduc
ts
Chem
ical
indu
stry
Food
stuf
fs
Met
al in
dust
ry
Mac
hine
ry a
ndeq
uipm
ent
Non
-met
allic
min
eral
s
Phar
mac
eutic
als
Elec
trica
l equ
ipm
ent
Plas
tics
Com
pute
r, el
ectro
nic
and
optic
al e
quip
men
t
Beve
rage
s
Othe
r
2010–2014 2015–2019
Source: Economic Commission for Latin America and the Caribbean (ECLAC), on the basis of data from the Central Bank of Brazil. a Sector data do not include the reinvestment of profits.
At the same time, FDI for services fell for the second consecutive year in 2019, on account of the negative flow in the intercompany loan component of three of the services that attract the most investments of that kind: commerce, electricity and gas, and financial services.11 In the first two, equity offset this negative flow; that was not the case in the financial services sector, however, which posted a negative net balance of inflows for the year.
11 Note that the sector data do not include the profit reinvestment component.
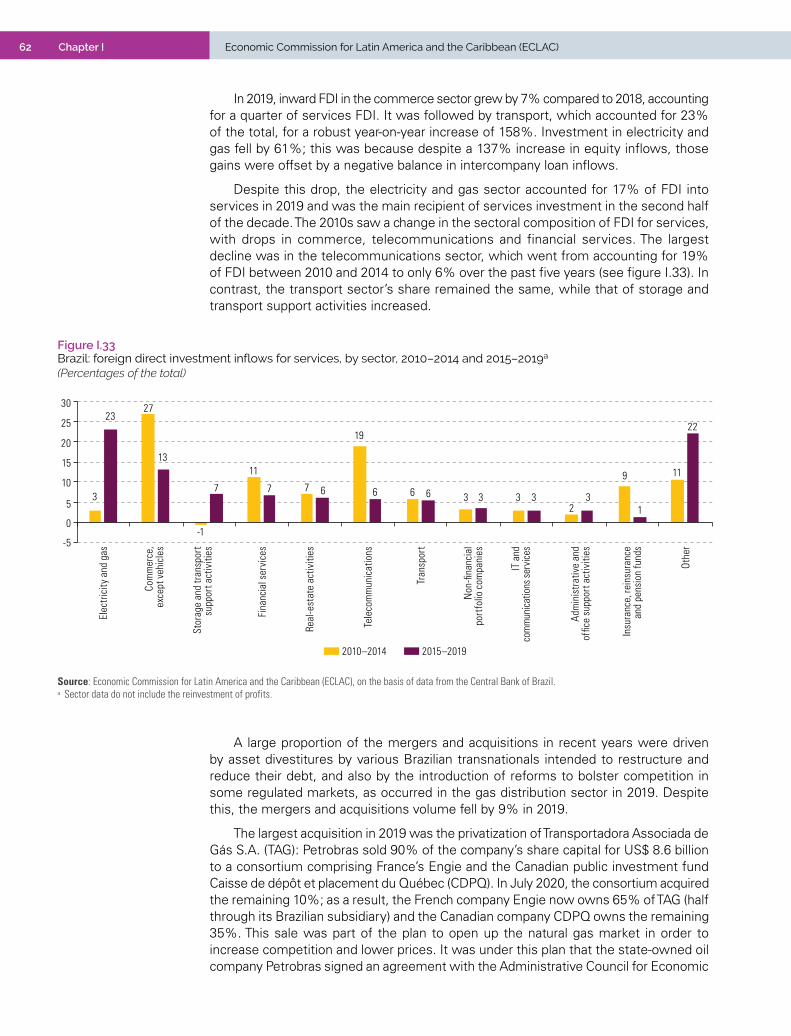
62 Chapter I Economic Commission for Latin America and the Caribbean (ECLAC)
In 2019, inward FDI in the commerce sector grew by 7% compared to 2018, accounting for a quarter of services FDI. It was followed by transport, which accounted for 23% of the total, for a robust year-on-year increase of 158%. Investment in electricity and gas fell by 61%; this was because despite a 137% increase in equity inflows, those gains were offset by a negative balance in intercompany loan inflows.
Despite this drop, the electricity and gas sector accounted for 17% of FDI into services in 2019 and was the main recipient of services investment in the second half of the decade. The 2010s saw a change in the sectoral composition of FDI for services, with drops in commerce, telecommunications and financial services. The largest decline was in the telecommunications sector, which went from accounting for 19% of FDI between 2010 and 2014 to only 6% over the past five years (see figure I.33). In contrast, the transport sector’s share remained the same, while that of storage and transport support activities increased.
Figure I.33 Brazil: foreign direct investment inflows for services, by sector, 2010–2014 and 2015–2019a
(Percentages of the total)
-5
0
5
15
10
20
25
30
2010–2014 2015–2019
3
27
-1
11
7
19
6 3 3 2
9 11
23
13
7 7 6 6 6 3 3 3 1
22
Elec
trici
ty a
nd g
as
Com
mer
ce,
exce
pt v
ehic
les
Stor
age
and
tran
spor
tsu
ppor
t act
iviti
es
Fina
ncia
l ser
vice
s
Real
-est
ate
activ
ities
Tele
com
mun
icat
ions
Tran
spor
t
Non
-fina
ncia
lpo
rtfo
lio c
ompa
nies
IT a
ndco
mm
unic
atio
ns se
rvice
s
Adm
inis
trat
ive
and
offic
e su
ppor
t act
iviti
es
Insu
ranc
e, re
insu
ranc
ean
d pe
nsio
n fu
nds
Othe
rSource: Economic Commission for Latin America and the Caribbean (ECLAC), on the basis of data from the Central Bank of Brazil. a Sector data do not include the reinvestment of profits.
A large proportion of the mergers and acquisitions in recent years were driven by asset divestitures by various Brazilian transnationals intended to restructure and reduce their debt, and also by the introduction of reforms to bolster competition in some regulated markets, as occurred in the gas distribution sector in 2019. Despite this, the mergers and acquisitions volume fell by 9% in 2019.
The largest acquisition in 2019 was the privatization of Transportadora Associada de Gás S.A. (TAG): Petrobras sold 90% of the company’s share capital for US$ 8.6 billion to a consortium comprising France’s Engie and the Canadian public investment fund Caisse de dépôt et placement du Québec (CDPQ). In July 2020, the consortium acquired the remaining 10%; as a result, the French company Engie now owns 65% of TAG (half through its Brazilian subsidiary) and the Canadian company CDPQ owns the remaining 35%. This sale was part of the plan to open up the natural gas market in order to increase competition and lower prices. It was under this plan that the state-owned oil company Petrobras signed an agreement with the Administrative Council for Economic
63Chapter IForeign Direct Investment in Latin America and the Caribbean • 2020
Defence (CADE) —Brazil’s monopolies watchdog— whereby it undertook to sell, by 2021, a large portion of its assets in the national gas transport and distribution sectors.
Before the pandemic crisis, investment announcements were on the rise again in Brazil, after reporting their lowest values in the decade in 2016 and 2017. In 2019, the greatest dynamism was seen in the renewable energy sector, with hydro, wind and solar energy projects; in hydrocarbons, where the projects were mainly in the gas market; and in the automotive industry, the iron mining sector and transport and storage. The biggest announcement was made by the Fiat Chrysler Automobiles (FCA), a joint United States–Italian company, which unveiled a project to expand its activities in the Goiana Automotive Pole with an investment of nearly US$ 1.8 billion. In spite of the pandemic, in July 2020 the company reaffirmed its interest in further expanding its investments (Expansión, 2020c).
2. South America: FDI rose in Chile, Colombia, Peru and Paraguay
In 2019, Colombia was the region’s third largest recipient of FDI, with inflows totalling US$ 14.314 billion, up 24.1% over 2018. Among the components of FDI, the biggest increase —both relative and absolute— was in equity, which rose by 59.2% and accounted for 50.3% of all FDI. Intercompany loans, meanwhile, grew by 50.3% and accounted for 16.8% of the total; and reinvested earnings fell by 13.1% compared to 2018 and represented 32.8% of the total. In the third quarter of 2020, FDI inflows fell by 50% compared to the same period the previous year, for a total of US$ 5.450 billion.
The financial and business services sector attracted most of Colombia’s 2019 FDI: inflows there increased by 26.7% over the 2018 result and accounted for 20.6% of the total. The only sector to report a decline was transport, storage and communications (-19.2%), accounting for 8.6% of the year’s total. Taken together, the country’s non-extractive sectors received US$ 11.676 billion in FDI, which was in line with the target set in the 2018–2022 National Development Plan.
In 2019, the main investor in Colombia was the United States, with investments that rose by 3.3% over 2018 and accounted for 18.5% of the total. The second largest investor was Spain, whose investments increased by 44% over the 2018 figure and made up 16.7% of the total. FDI from Brazil rose significantly to hit US$ 1.077 billion in 2019, a 17-fold increase compared to the annual average observed between 2014 and 2018 (US$ 65 million).
Between late 2019 and mid-2020, several large operations were carried out in Colombia’s energy sector that have repositioned some of the major operators. In September 2019, the United States–based Glenfarne Group completed its acquisition of the generating assets of Zona Franca Celsia (formerly Termoflores) from the Colombian company Celsia for US$ 420 million; the plants it acquired have an installed capacity of 610 MW. In June 2020 the Canadian company Northland Power bought Empresa de Energía de Boyacá S.A. (EBSA) from the Canadian investment fund Brookfield for US$ 790 million. There was also an uptick in investment announcements, with projects in the renewable energy, oil and gas, and creative industry sectors.
In 2019, Chile received investments in the amount of US$ 11.928 billion, which represented a healthy 62.9% increase over the 2018 figure. This was Chile’s second consecutive year of increased FDI, making it the region’s the fourth largest recipient, behind Brazil, Mexico and Colombia. Of the three components that make up FDI, equity inflows were the biggest contributor to the increase, with a rise of 150% over 2018.

64 Chapter I Economic Commission for Latin America and the Caribbean (ECLAC)
During the first half of 2020, Chile managed to sustain an increase in FDI inflows compared to the same period the previous year; by the end of the third quarter, however, those inflows were lower than those received in the corresponding period of 2019 (-33%).
In recent months, Chinese investors completed two of the largest acquisitions in the country. In July 2019, China’s Joyvio Group, a subsidiary of the Legend Holdings Corporation conglomerate, which is Lenovo’s parent company, acquired 99.8% of Australis Seafoods in a public share offering for US$ 967 million. This was the largest operation in the local salmon farming industry and, as a result, the Chinese group will be the Chilean salmon industry’s third largest exporter. In June 2020, the State Grid Corporation of China acquired the electricity distribution assets in Chile of the United States company Sempra Energy, which is withdrawing from Latin America. The sale was for US$ 2.23 billion, and the assets sold were Chilquinta Energía and TecnoRed, the latter of which provides the former with construction and electrical infrastructure services.
In addition to the change of ownership in Chilquinta Energía, there were other major operations in the Chilean energy sector. At the end of 2019, the Portuguese company Redes Energéticas Nacionais (REN) acquired 100% of the Transemel electricity transmission company for US$ 168.6 million. In May 2020, Canada’s independent renewable energy producer Innergex Renewable Energy acquired the 68 MW Salvador solar park for US$ 66.1 million, as well as 11-year power purchase agreements.
Finally, and as already mentioned, one of the year’s biggest acquisitions was made in September 2019, involving one of the main Latin American air carriers: LATAM Airlines. The United States airline Delta acquired a 20% stake in its Chilean counterpart for US$ 1.94 billion.
The FDI that Chile received in 2019 corresponds to investment announcements made in previous periods, with both traditional and new sectors of economic activity accounting for significant shares. Among the traditional sectors, mining continues to attract considerable amounts of investment: according to the Chilean Copper Commission (COCHILCO, 2019), the production capacity of eight of the deposits currently being exploited is to be expanded. Among new productive sectors, the renewable energy sector has been one of the most dynamic. In 2018 this sector accounted for 37% of the announced investment amount; in 2019 it represented 70% of the total, an annual increase of 86.6%. The biggest projects announced in this sector involve solar energy (57%) and wind energy (32%). In terms of the announcements’ territorial distribution, the wind energy projects were established in the regions of Antofagasta, Biobío, Los Ríos, O’Higgins and Los Lagos, while the solar energy projects mainly focused on Maule, Atacama, Valparaíso and Tarapacá.
The territorial distribution of investments is the result of a major policy that InvestChile, the foreign investment promotion agency, has been implementing in recent years in partnership with regional governments (InvestChile, 2019). Recently, under the new legal framework for the regional governments, new Promotion and Industry Divisions were created in each of the regions with the task of promoting their economic development. Thus, under article 21 of Law 20.848 of 2015, on foreign direct investment in Chile, those divisions share the power to attract foreign investment into each region, in coordination and collaboration with InvestChile. The creation of dedicated FDI units in each of these new divisions helps assure the multilevel coordination needed to attract and retain investments of this kind.
FDI inflows into Peru increased by 37.1% in 2019 to reach US$ 8.892 billion, the highest total since 2013. The recovery came both from equity flows, which increased after their 2018 low, and from loans between subsidiaries, which reached a peak not seen since 2006. In turn, the reinvestment of earnings accounted for 34.4% of total FDI flows, in spite of a drop of 45.2% with respect to 2018.
65Chapter IForeign Direct Investment in Latin America and the Caribbean • 2020
In the third quarter of 2020, Peru’s FDI inflows fell by 72% in year-on-year terms, for a total of US$ 1.595 billion. This drop in FDI was the largest recorded in the region as a result of the economic crisis caused by the COVID-19 pandemic.
In recent months, three of the largest operations were undertakings by Chinese companies, two of which involved a change of ownership between foreign investors. In October 2019, the Chinese company Cosco Shipping Ports (CSP) bought 60% of the company Terminales Portuarios Chancay (TPCh), a subsidiary of Volcan Compañía Minera, for US$ 225 million. The project, which consists of a multipurpose port terminal, has an estimated cost of US$ 3 billion and is intended to become a hub for products from China and other Asian production centres headed for locations along South America’s Pacific coast. There will be two specialized terminals: one for containers, which will include 11 moorings, and one for bulk and general cargo and vehicles, which will have four moorings.
In April 2019, a consortium led by Brazil’s Odebrecht sold Empresa de Generación Huallaga, the operator of Peru’s third largest hydroelectric plant, for US$ 1.4 billion.12
The buyer was a consortium led by the State-owned China Three Gorges Corporation (CTG). The agreement to sell the hydroelectric plant came at a time when Odebrecht was seeking to divest itself of some assets to meet its creditor obligations and to pay reparations owed due to a corruption scandal in Peru.
In April 2020, the United States company Sempra Energy sold 83.6% of Luz del Sur S.A. to the Chinese company Yangtze Power International (Hong Kong) Co. for US$ 3.59 billion. The purchaser is a subsidiary of China Yangtze Power Co., Ltd. and its parent company is CTG, the consortium that bought the Chaglla plant. For Sempra Energy, the sale was part of its planned exit from South America to focus on markets in the United States and Mexico.
The high inflow of FDI into Peru in 2019 was accompanied by announcements of large investments for the coming years: 2019’s announcements were the largest in a single year since 2005. There are four particularly notable projects among the 91 planned: three involving metals and one in the transport sector. The investments in the metal sector are related to the expansion of the projects that Southern Peru, a subsidiary of Grupo México’s Southern Copper, has ongoing in Moquegua, Apurímac and Cajamarca. The total amount of these investments is US$ 8 billion (Horizonte Minero, 2019), which also includes the construction of a new copper smelter at Ilo (Minería Chilena, 2019). The planned investment in the transport sector, amounting to US$ 1.3 billion, is the first stage of the Terminales Portuarios Chancay project.
Argentina’s 2019 FDI inflows totalled US$ 6.663 billion, making the country the fifth largest recipient in the region. That figure was 43.9% down from the 2018 total, mainly because equity and reinvestments of earnings fell by 33.1% and 40%, respectively; nevertheless, taken together, they still accounted for 97.5% of FDI flows. Reinvestment of earnings was the main component, accounting for 64.8% of total FDI. Intercompany loans, on the other hand, fell sharply (-88.2%). In the first half of 2020, FDI inflows posted a year-on-year drop of 35.4%, for a total of US$ 2.007 billion.
In 2019, Argentina reported high levels of dynamism in cross-border mergers and acquisitions. There were 25 operations involving assets located in Argentine territory, with the highest value acquisitions taking place in the financial sector. In one of those operations, the United States investment fund Advent International spent US$ 724 million to buy 51% of Prisma Medios de Pagos, a company formed in 2014 through the merger of Banelco and Visa Argentina. In another, Switzerland’s Zurich
12 The construction of Chaglla, in the Huánuco region of central Peru, required an investment of US$ 1.5 billion; the plant came on line in 2016.

66 Chapter I Economic Commission for Latin America and the Caribbean (ECLAC)
Insurance Group bought the Latin American operations of Australia’s QBE Insurance Group Ltd. for US$ 409 million. With this transaction, the Swiss company positioned itself as the leading insurance company in Argentina and increased its scale and capacities in Brazil, Colombia and Mexico.13 Another Swiss firm, Glencore, upped its stake in Renova, a producer of flour, soy oils and biodiesel, to 66.7% and, in April 2020, offered US$ 325 million for the remaining capital, held by Vicentín.14
Argentina’s hydrocarbon sector has been particularly attractive for foreign investors. In early 2020, the Norwegian company Equinor and the Netherlands company Royal Dutch Shell plc jointly acquired a 49% stake in the Bandurria Sur land block, in the central area of Vaca Muerta in the Province of Neuquén, for US$ 355 million.15 The stake was previously held by Schlumberger Ltd., a United States oil company. The British oil company Echo Energy plc acquired 70% of the assets of the Santa Cruz Sur area (five mature crude oil and natural gas blocks) located in the Austral basin, in the Province of Santa Cruz, for a total of US$ 8.5 million. A few months earlier, Echo Energy had signed a purchase agreement with UGA SEISMIC S.A. to carry out a 3D seismic programme on its assets in Argentina. That programme was launched in the Tapi Aike block, where the company has an operating permit. At the end of 2019, President Energy —another British oil and gas exploration and production company with a diverse portfolio of assets mainly in Argentina— acquired an exploration contract in Angostura, Province of Río Negro, for US$ 1.83 million.
Argentina’s mining sector has also attracted the interest of foreign investors. In March 2020, the Canadian mining company Cerrado Gold completed its purchase of 100% of Minera Don Nicolás, a gold producer in the Province of Santa Cruz, for US$ 45 million. This acquisition complements the Canadian company’s exploration work in Monte do Carmo, Brazil. Similarly, in August 2020, the Chinese company Ganfeng Lithium Co., Ltd. acquired a US$ 16.3 million stake in Minera Exar S.A., the outright owner of the Caucharí-Olaroz lithium project in Jujuy. As a result of this operation, Ganfeng Lithium now owns 51% of Minera Exar, with the remaining 49% in the hands of Canada’s Lithium Americas.
Mercado Libre continues to consolidate its position in Argentina’s e-commerce sector and, in 2019, made a US$ 1.8 billion public offering through which it received US$ 750 million from PayPal of the United States, allowing both companies to move forward in creating payment solutions for their customers. This operation cannot be classified as FDI, since it involved less than 10% of the company’s share capital, but it highlights the importance of e-commerce in the region.
Finally, in 2019, the number and value of new investments announced in Argentina decreased. The largest announcements were for projects involving minerals (22% of the total), food and beverages (19%) and telecommunications (16%). The telecommunications sector announced the largest investment project: Telecom Argentina, a subsidiary of Telecom Italia, announced its intention to invest US$ 2.5 billion over the next few years to increase its wireless communications capacity. Other large investment announcements in this sector were made by the Spanish company Telefónica (US$ 2.1 billion) and the Mexican operator América Móvil, (US$ 1.5 billion). Two major announcements were also made in the energy sector. The Malaysian company Petronas announced it was to invest US$ 2.3 billion in a project in the Province of Neuquén, while the Spanish
13 The acquired operations combined gross written premiums worth approximately US$ 790 million. Argentina represented about 50% of the total. With this transaction, Zurich Insurance Group AG doubled its property and casualty business in the country and will increase its share of that market, along with that of life insurance, to 8.4%.
14 In 2007, Glencore and Vicentín created the company Renova in equal parts. 15 The operator of Bandurria Sur is the Argentine state oil company YPF S.A., which currently holds a 51% stake. However, Equinor
and Royal Dutch Shell reached a preliminary agreement with YPF to acquire an additional stake. If the operation is approved, each company would have a 30% non-operating share, while YPF would maintain a 40% stake and continue as the operator.

67Chapter IForeign Direct Investment in Latin America and the Caribbean • 2020
group Guascor announced a US$ 2.4 billion investment in a wind energy project in the city of Pico Truncado, Province of Santa Cruz. In contrast to 2019, between January and September 2020 Argentina was one of the few countries where new project announcement amounts did not fall. Instead, the total rose by 7% in year-on-year terms. In addition, major announcements were made in the country in October: the Canadian mining company Lundin Mining, for example, reported that it planned to invest US$ 3 billion in a copper and gold project (Gammacurta, 2020).
FDI for Uruguay totalled US$ 1.189 billion in 2019, down 14.4% from the previous year. This was primarily due to the negative change in the reinvestment of earnings, which fell by 176% compared to 2018. The equity component, on the other hand, rose by 214% to reach US$ 540 million in 2019. Although this variation was positive, it remains far from the results posted between 2010 and 2016, when the average equity inflows were US$ 1.487 billion per year. In the first half of 2020, FDI inflows increased by 374% in year-on-year terms to reach US$ 906 million.
In November 2019, the Canadian pharmaceutical company Knight Therapeutics bought a majority stake (51.21%) in the Uruguayan group Biotoscana, which produces medicines, for US$ 144.6 million. In August 2020, Knight Therapeutics launched a takeover bid for the remaining 48.79%, for which it paid out US$ 137.8 million.
In 2019, a major investment announcement was made by the Finnish company UPM-Kymmene Corp.; worth an estimated US$ 3.05 billion (UPM, 2019), it constituted the largest private investment in the country’s history. Its projects cover the construction of a cellulose plant near Paso de los Toros in the centre of the country, the construction of railway infrastructure from the plant to the port, and investments in port operations in Montevideo. Although this investment is expected to have a positive impact through the creation of more than 6,000 jobs, it is imperative that project safeguard environmental assets, properly manage forest resources and moderate its potential negative effects in the territories affected by the construction of the new productive plant and associated infrastructure.
In 2019, FDI into Ecuador fell by 31.9% compared to 2018, totalling US$ 946 million. The drop was largely due to a 49.6% reduction in the amount of loans entering the country through related companies. The government finalized a significant investment through an agreement with Korea Airports Corporation for the remodelling, construction work and management of the General Eloy Alfaro International Airport in the city of Manta, which was damaged by the 2016 earthquake. This project involves an investment of US$ 182 million (El Comercio, 2020). In the first half of 2020, FDI inflows fell by 33% in year-on-year terms, for a total of US$ 330 million.
Paraguay received US$ 522 million in FDI in 2019, up 7% over the previous year. Among its components, equity rose by 84%, an increase that offset the drop in earnings reinvestments, which fell by 72.5%. Equity inflows were the main source of revenue (89% of the total). The upward trend continued into the first half of 2020, with FDI inflows increasing by 7% over the same period the previous year.
In 2019 a major investment worth nearly US$ 800 million was announced: it involves the construction of Latin America’s first plant for the production of renewable biofuels. The project is led by Brazil’s ECB Group, and the plant’s construction will be undertaken by the Spanish engineering group ACCIONA. The plant is expected to come on line in 2022 (América Economía, 2019) and most of the production is expected to be exported to Paris Agreement signatory countries, where efforts are being made to accelerate the reduction of greenhouse gas (GHG) emissions by replacing fossil fuels (La Nación, 2019).
68 Chapter I Economic Commission for Latin America and the Caribbean (ECLAC)
In the Plurinational State of Bolivia, FDI fell by US$ 540 million in 2019, resulting in a negative flow of US$ 237 million.16 This amount is lower than the 2018 result, which was itself the lowest since 2005, and probably reflects the institutional and legal instability prevailing in the country and the resulting increased uncertainty for estimating the variables of future profitability associated with investments. Three major investment announcements were made in 2019. The smallest was an initial agreement reached between the French group Aéroports de Paris and the national government to design, build, operate, maintain and finance Viru Viru International Airport in Santa Cruz de la Sierra, for an initial estimated amount of US$ 420 million (Actualidad Aeroespacial, 2019). The two larger investment announcements came as part of an agreement reached by the national government and China’s Xinjiang TBEA Group in February 2019 to pursue the industrialization of lithium. To that end, a mixed company was set up in August 2019, with majority Bolivian ownership, and an estimated initial investment of US$ 2.39 billion was announced. This investment includes the construction of five plants in the Department of Oruro, three plants in the Department of Potosí and one plant in China (Xinhua, 2019). Because of political changes, however, the implementation of the agreement has been put on hold until new political authorities take office following the October 2020 elections.
3. Mexico: the European Union outstripped the United States in FDI
Mexico remains the region’s second largest recipient of FDI. In 2019, inflows totalled US$ 29.354 billion —down 22.0% from 2018— and accounted for 17.8% of all FDI received by Latin America and the Caribbean. The dynamics of FDI were different from what the country reported in 2018. Equity and earnings reinvestments were higher than in the previous year, increasing by 16.4% and 35.8%, respectively. At the same time, loans between subsidiaries fell by 113.7% with respect to 2018. Equity, reinvestment of earnings and loans between subsidiaries represented 45%, 61% and -6.1% of the FDI inflows, respectively. The period of low growth and uncertainty due to the geopolitical tensions that arose amidst the negotiations for the Agreement between the United States of America, the United Mexican States, and Canada (USMCA) seems to have favoured transfers from Mexican subsidiaries to their parent companies. The trend observed since the mid-1990s continues: manufacturing remains the main attraction for FDI in Mexico. In 2019, the investment amounts in that industry were 2.7% higher than in 2018, accounting for almost half of total inflows (46.8%). In turn, services attracted a substantial share of capital (47.3%), but there was a 3% drop over 2018. Inflows into the natural resources sector rose by 23.6% in year-on-year terms.
Investments by transnational companies in the manufacturing of transport equipment were ranked first in the manufacturing sector: with an increase of 11% over the 2018 result, they accounted for 46% of manufacturing industry FDI. Funds for the beverages and tobacco sectors and for the chemical industry also increased, accounting respectively for 12% and 11% of FDI manufacturing inflows in 2019. Inflows for financial services almost tripled to represent 33% of the sector’s total income, and inflows for commerce (accounting for 12% of the services total) and telecommunications (10%) also rose. Electricity, gas and water supplies and construction, in contrast, received less investment than in 2018, and that was the reason for the lower investment in services. Higher inflows for hydrocarbons, mining and mining services explained the increase in FDI in natural resources.
16 In the first half of 2020, FDI inflows fell by 36% in year-on-year terms, for a negative flow of US$ 190 million.
69Chapter IForeign Direct Investment in Latin America and the Caribbean • 2020
In Mexico, the largest transactions concluded in 2019 and 2020 were in the infrastructure sector. At the end of 2019, an agreement was signed to transfer partial ownership of the company Impulsora del Desarrollo y el Empleo en América Latina (IDEAL) to two Canadian pension operators, the Canada Pension Plan Investment Board (CPPIB) and the Ontario Teachers’ Pension Plan. The Mexican company IDEAL belongs to Grupo Carso and is dedicated to infrastructure construction: it operates 15 highway concessions, three transport terminals and two water projects and is constructing several highways.17 Similarly, CPPIB and Ontario Teachers’ already had a presence in the infrastructure sector in Mexico, through the Arco Norte and Pacífico-Sur toll roads. In March 2020, the two pension funds launched a mandatory public tender offer for 40% of IDEAL’s stock, for which they paid out about US$ 2.177 billion. Under that operation, Grupo Carso maintained control of IDEAL.
The second largest operation involved the Spanish construction company Abertis. It was completed in June 2020 and allowed Abertis to acquire 51.3% of the company Red de Carreteras de Occidente (RCO) for around US$ 1.658 billion. With this, Abertis acquired control of the company.18 RCO controls five concessions for a network of eight highways that, covering 876 km, is one of Mexico’s most important: it forms the backbone of the central-western region and connects the country’s main industrial corridor, El Bajío, with the two largest cities, Mexico City and Guadalajara. This operation was announced in October 2019 and, since then, Abertis has expressed its wish to continue investing in the country and to strengthen its commitment to public-private partnerships. In February 2020 RCO and the Government of Mexico signed an investment programme to expand the highways of the concessionaire Fideicomiso de Apoyo para el Rescate de Autopistas Concesionadas (FARAC) in exchange for extending the concession for six years. The company will invest more than 300 million euros in the construction of three toll-free feeder roads to improve mobility in the States of Guanajuato, Michoacán and Jalisco (Agencia EFE, 2020).
As in the previous year, during 2019 transnational companies showed their interest in acquiring energy assets. Alpek, a Mexican chemical company, sold two natural gas cogeneration plants located in Cosoleacaque and Altamira, on the Gulf of Mexico, to the British company ContourGlobal plc for US$ 774 million. Similarly, German’s Wintershall Dea acquired the Mexican oil company Sierra Oil & Gas for US$ 500 million, thereby obtaining a 40% stake in block 7, where the Zama field is located. In addition, DEA Deutsche Erdoel AG is a partner of Petróleos Mexicanos (PEMEX) in the Ogarrio contract area in the State of Tabasco. It also has interests in ten exploration blocks in the Tampico-Misantla and Southeast basins: in three of those basins it acts as an operator.
Historically, U.S. transnational corporations have been at the forefront of FDI inflows into Mexico; 2019 was, however, the exception. The United States accounted for 37.5% of that year’s total, and stood in second place after the European Union. In 2018, FDI from the United States was 0.2% higher than that of the European Union. That notwithstanding, the United States continues to rank first among the countries providing Mexico with FDI. In 2019, FDI from the United States rose by 10%. The launch of the USMCA was expected to have positive effects on the evolution of United States investments in Mexico. However, that prospect could fail to materialize because of the negative impact of the COVID-19 pandemic on the Mexican economy.
17 Grupo Carso is one of the largest and most important conglomerates in Mexico and Latin America. It controls and operates a wide variety of companies in the communications, commerce, manufacturing and infrastructure sectors.
18 Abertis formed an alliance with GIC, an investment firm that manages Singapore’s foreign reserves, to buy a 72.3% stake in RCO. The consortium acquired 70% from Goldman Sachs Infrastructure Partners (GSIP) and an additional 2.3% from Mexican investors and pension fund managers (Administradoras de Fondos para el Retiro), the company’s minority shareholders. As a result of this operation, Abertis was left with 51.3% of the company, and GIC with 20%.
70 Chapter I Economic Commission for Latin America and the Caribbean (ECLAC)
As noted above, in 2019 the European Union was, exceptionally, Mexico’s main source of FDI. The bloc’s investments rose by 19.27% over the 2018 figure and made up 40% of the total. There were increases in inflows from France (66%), Germany (17%) and Belgium (1980%), which accounted for 7%, 25% and 10% of the European total, respectively. Flows from Spain fell by 3.12%, although it maintained its position as the top country within the European bloc, with investments accounting for 30% of the European total. Japan was the Asian country with the highest levels of investment (4.3% of the total), in spite of a drop in the actual amount (-35%). Investments originating in the Republic of Korea also fell (-75%). Despite the growth recorded between 2017 and 2018 (50%), investments from China and Hong Kong Special Administrative Region (SAR) of China fell, and their share of the Mexican market remained low (0.4% of the total). To summarize, the United States, Spain and Germany (replacing Canada) were the main source countries of Mexico’s FDI in 2019.
During 2019, project announcements in Mexico remained at levels similar to those of 2018 (with a 0.4% drop in the total amount). The automotive and autoparts sector saw the highest announced amounts (14.8% of the total), although the total amount was down compared to the previous year (-6.1%). Renewable energies were the sector with the second highest amount of announced projects (13% of the total), followed by hotels and tourism (12%); in both those sectors, the amounts were higher than in 2018.
In the first half of 2020, Mexico felt the effects of the contraction in the economy of the United States. Box I.1 describes the fall in industrial production in the United States, the impact of which can be seen in demand for intermediate and final goods from abroad, despite the emergency measures the country adopted.
Box I.1 The fall in industrial output and the disruption of certain value chains in the United States
The shutdown measures taken in response to the COVID-19 pandemic have profoundly affected the capacity of the United States economy to produce goods and services (ECLAC, 2020). In April 2020, industrial output —which is a broad indicator covering factory, mine and utility production— plummeted by 12.9% in seasonally adjusted terms. This was the sharpest monthly decline since August 1945 (when a drop of 10.38% was posted) and it came on the heels of a 4.4% contraction in March 2020, according to the Federal Reserve Board of Governors (2020).
After two consecutive months of contraction, industrial output started to pick up slowly in May, when it rose by 0.98%, and grew strongly in June, when it increased by 6.14%. Since then, the growth rate has slowed down and was weaker than expected in August: the consensus forecast was for an increase of 1.00%, but the actual rise was only 0.36%. Total industrial output remains 7.26% below the pre-pandemic level recorded in February.
Manufacturing production, the largest component of industrial output, also fell at unprecedented rates in March and April (5.0% and 16.1%, respectively). The decline was particularly pronounced in the production of machinery (3.2% in March and 19.6% in April) and of motor vehicles and autoparts (29.2% in March and 76.8% in April).
Although many factories resumed operations in June and manufacturing activities in the United States increased robustly (7.6%), the recovery has been slower since (4.0% in July and 1.0% in August). This activity remains 6.4% below its pre-pandemic February result, while the production of machinery and of motor vehicles and autoparts remained, respectively, 9.2% and 2.0% below the result posted that month.
According to the Office of the United States Trade Representative (USTR, 2020), machinery, motor vehicles and autoparts are among the main components of the bilateral trade between the United States and Mexico.a In addition, the manufacturing sector is one of the driving forces of United States foreign direct investment (FDI) in Mexico. As noted by the United States Congressional Research Service (CRS), the flow of intermediate inputs produced in the United States and exported to Mexico and the return flow of finished products has greatly increased the importance of the countries’ border region as a production location. United States manufacturing industries, including automotive, electronics, appliances, and machinery, all rely on the assistance of Mexican manufacturers (United States Congressional Research Service, 2020).
Since its onset, the COVID-19 coronavirus pandemic has led to a drop in United States trade with Mexico: between January and September 2020, goods exports fell by 21% compared to the same period in 2019, and imports by 14% (United States Bureau of the Census, 2020).
71Chapter IForeign Direct Investment in Latin America and the Caribbean • 2020
The health crisis has affected global supply chains and caused major disruptions throughout the United States economy. The greatest disruptions have been in the supply chains for medical products and equipment, automobiles and food. For the medical supplies chain, the Federal Emergency Management Agency (FEMA) enacted a temporary rule prohibiting the export of certain medical equipment needed to combat COVID-19 from the United States without authorization.b This has restricted sales of that equipment to hospitals in Canada and Mexico. In many cases, the production facilities for safe and high-quality personal protective equipment are located in Mexico.
Automobile production in the three member countries of the Agreement between the United States of America, the United Mexican States, and Canada (USMCA) has been closely linked through supply chains, and these have been severely disrupted by the pandemic. The measures that the three governments adopted to contain the pandemic and protect worker health caused a halt in production in several sectors, including automotive operations. According to some analyses, more time will be needed for this sector to adapt to the new rules of origin provided for in the USMCA, which came into force on 1 July 2020.c There are basically two reasons for this: the temporary closure of some production facilities, and the reconversion of some automobile manufacturing plants that were turned over to the production of medical equipment.d
In the automotive value chain, it is estimated that the output of United States automobile companies will fall by between 16% and 45% because of the coronavirus pandemic. The Mexican Association of Automobile Distributors (AMDA), meanwhile, forecasts that sales of new vehicles manufactured in the country will decrease by at least 26% in 2020 compared to the previous year, a drop of more than 330,000 units.
Source: Economic Commission for Latin America and the Caribbean (ECLAC), on the basis of ECLAC, “Impact of COVID-19 on the United States economy and the policy response”, COVID-19 Reports, Santiago, August 2020; Federal Reserve Board, “Industrial production and capacity utilization”, Federal Reserve Statistical Release, Washington, D.C., October 2020; Office of the United States Trade Representative (USTR), “Mexico”, 2020 [online] https://ustr.gov/countries-regions/americas/mexico; Congressional Research Service (CRS), U.S.-Mexico Economic Relations: Trends, Issues, and Implications, 25 June 2020 [online] https://fas.org/sgp/crs/row/RL32934.pdf; United States Bureau of the Census, “Trade in goods with Mexico”, 2020 [online] https://www.census.gov/foreign-trade/balance/c2010.html#2020.
a FDI from the United States to Mexico is led by companies in the manufacturing, finance and insurance sectors, and by non-bank holding companies (USTR, 2020).b Temporary rule “Prioritization and Allocation of Certain Scarce or Threatened Health and Medical Resources for Domestic Use”, published in the Federal Register
Notice of 10 April 2020 (see section 328.102(a) of the new Title 44 Code of Federal Regulations) (ECLAC, 2020). c A number of Democratic and Republican legislators wrote to the USTR asking for more time for the automotive industry to adapt to the USMCA’s new rules of
origin. This would be take place gradually over a period of three to four years, but the automobile manufacturers had to certify their compliance with the initial requirements when the agreement came into effect. The regulations provide for a transition period (ECLAC, 2020).
d On 8 April 2020, the United States Department of Health and Human Services issued the first contract to General Motors, worth US$ 489 million, to build 30,000 ventilators under the Defense Production Act (ECLAC, 2020).
Box I.1 (concluded)
4. Panama and Costa Rica remain the main recipients of FDI in Central America
In 2019, Central America received US$ 11.508 billion in FDI, a drop of 6.4% over 2018. A similar contraction occurred in Latin America and the Caribbean as a whole, with Central American FDI accounting for 7.0% of the region’s total. Most of these investments were in the service sector (58%) and in manufacturing (34%); natural resources (4%) and other sectors accounted for just over 3%.19 The United States was the main country of origin of that FDI (52%), with the Central American countries accounting approximately 6% of the total inflow.20 In terms of its composition, earning reinvestments made up 46% and intercompany loans accounted for 43%; equity constituted 11% of the total. An analysis of the distribution of FDI among the Central American countries reveals that Panama recorded an increase in 2019 over the previous year, Guatemala remained at practically the same level and the other countries received lower amounts (see map I.2).
19 Data for 2019 broken down by sector are not available for Panama. 3.6% was included in the official statistics under the heading “others”.
20 These data cover the FDI for the four Central American countries that provided information on the origin of the investments they received: Costa Rica, El Salvador, Guatemala and Honduras.
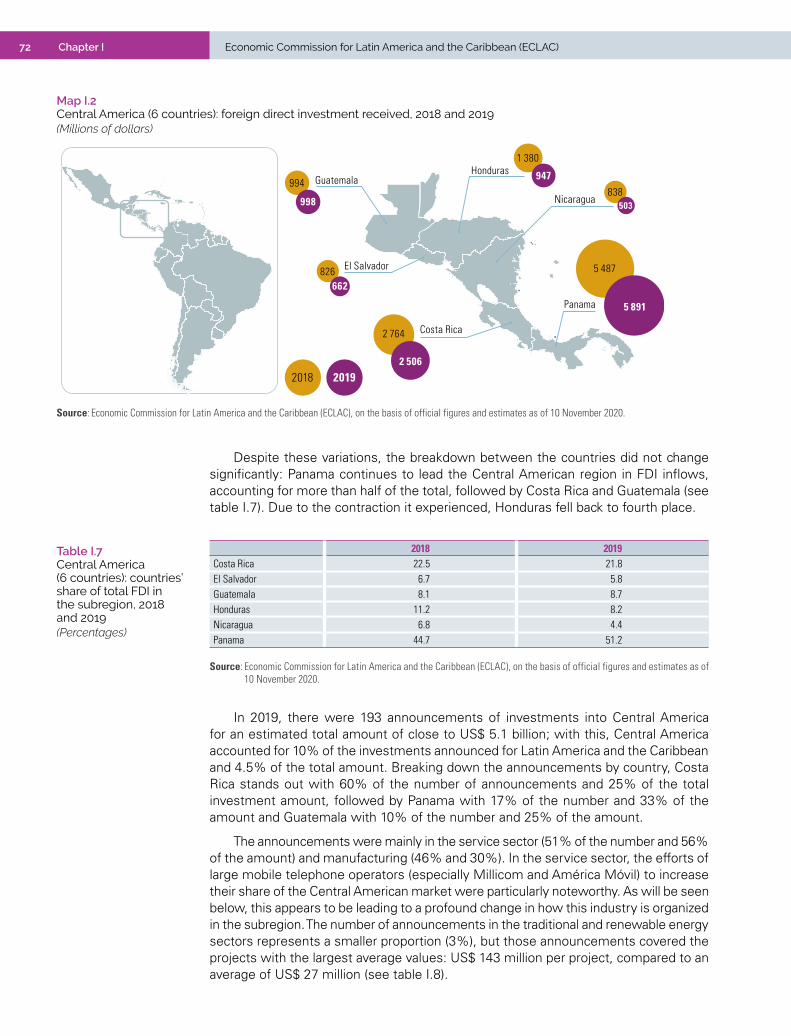
72 Chapter I Economic Commission for Latin America and the Caribbean (ECLAC)
Map I.2 Central America (6 countries): foreign direct investment received, 2018 and 2019(Millions of dollars)
Panama
Nicaragua
HondurasGuatemala
El Salvador
Costa Rica
2018 2019
838
2 506
2 764
5 891
5 487
662826
994
998
947
1 380
503
Source: Economic Commission for Latin America and the Caribbean (ECLAC), on the basis of official figures and estimates as of 10 November 2020.
Despite these variations, the breakdown between the countries did not change significantly: Panama continues to lead the Central American region in FDI inflows, accounting for more than half of the total, followed by Costa Rica and Guatemala (see table I.7). Due to the contraction it experienced, Honduras fell back to fourth place.
Table I.7 Central America (6 countries): countries’ share of total FDI in the subregion, 2018 and 2019(Percentages)
2018 2019Costa Rica 22.5 21.8 El Salvador 6.7 5.8 Guatemala 8.1 8.7 Honduras 11.2 8.2 Nicaragua 6.8 4.4 Panama 44.7 51.2
Source: Economic Commission for Latin America and the Caribbean (ECLAC), on the basis of official figures and estimates as of 10 November 2020.
In 2019, there were 193 announcements of investments into Central America for an estimated total amount of close to US$ 5.1 billion; with this, Central America accounted for 10% of the investments announced for Latin America and the Caribbean and 4.5% of the total amount. Breaking down the announcements by country, Costa Rica stands out with 60% of the number of announcements and 25% of the total investment amount, followed by Panama with 17% of the number and 33% of the amount and Guatemala with 10% of the number and 25% of the amount.
The announcements were mainly in the service sector (51% of the number and 56% of the amount) and manufacturing (46% and 30%). In the service sector, the efforts of large mobile telephone operators (especially Millicom and América Móvil) to increase their share of the Central American market were particularly noteworthy. As will be seen below, this appears to be leading to a profound change in how this industry is organized in the subregion. The number of announcements in the traditional and renewable energy sectors represents a smaller proportion (3%), but those announcements covered the projects with the largest average values: US$ 143 million per project, compared to an average of US$ 27 million (see table I.8).

73Chapter IForeign Direct Investment in Latin America and the Caribbean • 2020
Table I.8 Central America: distribution of the number and amount of project announcements by sector, 2019
Number Amount Average
Number Percentages Millions of dollars Percentages Millions of dollars
per announcement
Manufacturing 89 46 1 573 31 18Energy 5 3 715 14 143Services 99 51 2 868 56 29Total 193 100 5 155 100 27
Source: Economic Commission for Latin America and the Caribbean (ECLAC), on the basis of Financial Times, fDi Markets [online database] https://www.fdimarkets.com.
The US$ 5.891 billion of FDI that Panama received during 2019 represents the country’s highest foreign investment amount since 2005. The increase over 2018 (7.4%) was the highest in Central America. That result confirms Panama as the country attracting the most investment in the subregion and as the sixth largest recipient in all of Latin America and the Caribbean. It should be noted, however, that the main component of these investments is loans between subsidiaries, which accounted for 59% of the country’s total FDI in 2019. Although these funds represent a positive contribution to the country’s capital balance, their contribution to the development of its technological and entrepreneurial capacities cannot be evaluated. In the first half of 2020, FDI inflows fell by 61% in year-on-year terms, for a final result of US$ 1.333 billion.
One particularly interesting operation was in the logistics sector. In this area, the United States company Minerva Bunkering —a subsidiary of Mercuria Energy Group that markets lubricants and refined marine fuel and supplies them to ships in port and at sea— announced the acquisition of 100% of the share capital of CEPSA Panamá S.A., a company owned by Compañía Española de Petróleos. For the divesting company, the operation is part of the strategy to focus its business on the main markets in Spain and Gibraltar. Minerva Bunkering, for its part, acquires a strategically located asset near the Panama Canal, providing it with an optimal location to provide reliable supply solutions close to one of the shipping industry’s major transit points (Mundo Marítimo, 2019). This operation is also relevant in view of the entry into force of International Maritime Organization regulation IMO-2020, which requires a maximum sulphur content of 0.5% for fuel used on board ships as of 1 January 2020. In that context, Minerva Bunkering, which has low-sulphur fuel sources, is well positioned to improve the supply base for the Panamanian market.
Panama was also a part of the restructuring process in the Central American telecommunications sector, thanks to Millicom’s acquisition of Telefónica Móviles Panamá for US$ 650 million. The investments announced confirm the country’s importance in the telecommunications sector: the sector accounted for 60% of the investment amounts announced in 2019. In addition to Millicom’s positioning strategy referred to above, another notable project was announced by the Mexican telecommunications company América Móvil (Claro): according to the State Secretariat of Communications, the company committed to invest US$ 300 million in fifth-generation technology and mobile networks (5G) in Panama over the next three years (La Prensa, 2019).
During 2019, Costa Rica received US$ 2.506 billion in FDI, US$ 257 million less than in 2018. The United States accounted for 70% of the total, which means that its importance as a source of investments is much higher in Costa Rica than the regional average. Earnings reinvestments accounted for 57% of the total, and equity for 21%, which is almost double the regional average. Broken down by sectors, 60% of Costa Rica’s FDI was for manufacturing and 40% was for services: a different trend from the one observed in the other three countries that provided disaggregated sectoral data. In the first half of 2020, FDI inflows fell by 24% in year-on-year terms and were worth a total of US$ 780 million.
74 Chapter I Economic Commission for Latin America and the Caribbean (ECLAC)
Costa Rica was the location of seven of Central America’s 16 most important cross-border mergers and acquisitions, four of which involved companies in the manufacturing sector. Among those, one operation in the agrochemical industry and another in the pharmaceutical sector were particularly notable. The first one involved UPL Ltd., an Indian transnational company that is one of the world’s five largest agricultural solutions companies. The company, which provides biological solutions for crop protection, seed treatment and post-harvest, has a turnover of more than US$ 5 billion and is present in more than 130 countries (Redagrícola Comunicaciones Limitada, 2019). In 2019, through its subsidiary UPL Costa Rica, the company acquired the stock of Industrias BioQuim Centroamericanas and other group companies located in the Caribbean and Central America (El Economista, 2019b). BioQuim is a Costa Rican company, created in 1987, that has designed a wide range of products for agricultural use and has an annual turnover of around US$ 20 million.21 The acquisition of the products designed and registered by BioQuim will allow UPL to expand its product portfolio and penetrate the Central American market more decisively (Financial Express, 2018).
The second manufacturing sector operation was led by Laboratorios Stein S.A, a Costa Rican-owned pharmaceutical company that produces and markets medicines for human use, and by Eurofarma, a Brazilian pharmaceutical company. Laboratorios Stein S.A. sold Eurofarma a series of brands sold in the private market, with which the Brazilian company expects to climb from position 33 to 16 in the Central American market (Lex-Latin, 2019).
The importance of the health industry in Costa Rica is also confirmed by the 21 investment announcements made in 2019 (17 in the medical equipment sector and four in the pharmaceutical sector), which accounted for 100% of the announcements aimed at these two sectors in Central America. Among those projects is one by the United States company Medtronic, a producer of precision medical instruments, through which it would invest close to US$ 50 million and double its current production capacity (CINDE, 2019).
During 2019, Guatemala recorded FDI inflows of US$ 998 million, which was similar to the 2018 result and about 15% lower than the average between 2010 and 2018. The geographical origin of those investments is less concentrated than in the other Central American countries. Thus, the top three countries —the United States, Colombia and Mexico— account for 56% of FDI, which is significantly different to the situation in El Salvador, Costa Rica and Honduras, where the top three countries account for 89%, 77% and 73% of FDI, respectively. Almost all the investments involve the reinvestment of earnings, suggesting that the investing companies have some degree of confidence in the country’s stability. In sectoral terms, Guatemala’s FDI is mostly concentrated in the services sector, which accounts for 60% of the total, and in manufacturing, which accounts for 28%. In the first half of 2020, FDI inflows showed a slight year-on-year increase of 5% to reach US$ 505 million.
Among the manufacturing industry investments announced is a project by SAE-A, a Republic of Korea company that plans to invest approximately US$ 400 million to build a high-tech chemical fibre, weaving and dyeing plant for the production of polyester yarn. The new plant will increase domestic output, taking advantage of the new trade agreement with the United States and consolidating the Korean company’s penetration of the North American market (Forbes México, 2019).
21 The company began by marketing synthetic amino acids for agricultural use and then gradually developed its production and commercial capacity until it secured its “own line of agricultural pesticides, with more than 80 active ingredients and 150 registered finished products that are marketed in Latin America through 400 phytosanitary registrations in 16 of the region’s countries” (Estrategia & Negocios, 2019a).
75Chapter IForeign Direct Investment in Latin America and the Caribbean • 2020
In the services sector, the Mexican company América Móvil carried out two important operations in the telecommunications industry. First, it signed a cooperation agreement with Telxius Telecom S.A., a global telecommunications infrastructure company and subsidiary of Telefónica, to lay a new 7,000 km marine cable along the Pacific coast (Converge Media Ventures, 2019), and second, it announced the purchase of Movistar Guatemala’s assets for US$ 333 million (Next-TV News Latin America, 2019).
In Honduras, FDI fell by 31.3% in 2019 compared to the previous year, which was the largest contraction ever recorded in the subregion. Its FDI inflows, at US$ 947 million, placed Honduras in fourth position in this group and represented a drop of approximately 11% compared to the average recorded between 2010 and 2018. Breaking the investments down by their geographical origin, the first four places were taken by Latin American countries: Mexico, Guatemala, Colombia and Panama. Broken down into its components, the vast majority of this FDI was reinvestment of earnings (73%) and about a quarter was loans between subsidiaries. In sectoral terms, services (US$ 600 million) accounted for the lion’s share, particularly transport, communications and basic services. In manufacturing, in contrast, a US$ 110 million divestment was recorded. In the first quarter of 2020, FDI inflows totalled US$ 300 million, a decrease of 24% in year-on-year terms.
Notable investment announcements included a project presented by Tigo, the brand under which the Luxembourg-based Millicom operates. This project, which is intended to develop high-speed networks in the country, is estimated to involve investments of US$ 500 million over five years. Information on this project was presented during the inauguration of the first data centre in Honduras, which is part of a network of data centres that Millicom maintains in Latin America. Those centres are interconnected by fibre optics and will allow Tigo to provide world-class cloud services.
El Salvador received US$ 662 million in FDI in 2019, of which 88% were equity inflows. While this represented a fall of US$ 164 million compared to 2018, the result was 75% higher than the average FDI received between 2010 and 2018.
In the first half of 2020, FDI inflows totalled US$ 347 million, a drop of 7% in year-on-year terms.
The main countries of origin of the 2019 FDI were Panama (44%) and the Cayman Islands (44%); the true origin of the funds therefore cannot be identified, since the Cayman Islands handle transnational investments from a wide range of sources. Spain contributed 38% of El Salvador’s FDI, while companies from Guatemala, the United States and Canada reported a negative value in excess of US$ 300 million, or around 46% of the total. Almost all the FDI entering the country in 2019 went into services sectors: transport and communications, accounting for 40% of the total, led the field.
One notable operation in this regard was the acquisition of 40% of the capital of CenterCom, which belongs to the Global BPO group, by the United States company Surge Holdings, which specializes in technology, telecommunications, blockchains, techno-finance and software. CenterCom, which has an annual turnover of around US$ 50 million, defines itself as a nearshore offshoring company that specializes in providing business support services for outsourcing. It is based in El Salvador and belongs to the United States group Glass Mountain Holdings, LLC. CenterCom was already providing Surge with operational support in several areas, including sales, customer service, information technology infrastructure design, graphic media, database programming and software design. The acquisition will give Surge access to the bilingual staff it needs to sustain its growth in the subregion (Globe-Newswire, 2019).
During 2019, the attempts of the Mexican company América Móvil to close a deal that would allow it to buy 99% of the stock of Telefónica El Salvador were notable in the

76 Chapter I Economic Commission for Latin America and the Caribbean (ECLAC)
communications sector; the operation ultimately failed to go through, however, because of the conditions imposed on it by the Superintendency of Competition (Pautasio, 2020).
Energy was the leading sector for investment announcements. One of the most notable was the project announced by Energía del Pacífico, majority-owned by the United States company Invenergy, intended to complete the liquefied natural gas (LNG) conversion infrastructure being built at the Port of Acajutla, which could become the largest private investment ever made in the country (CISION PR Newswire, 2019).
During 2019, FDI inflows into Nicaragua fell by 39.9% over the previous year for a total of US$ 503 million. Most of this change can be explained by a 50% drop in service sector investments, although it remained the dominant sector and accounted for 43% of all the country’s inflows. The only sector that received more investment than in 2018 was the natural resources sector: investments rose by 29% and accounted for 27% of inflows in 2019.
The largest operations involving transnational capital were in the services sector, particularly in mobile telephony. One notable transaction was carried out by the Luxembourg-based company Millicom International Cellular S.A., owner of the Tigo brand, which bought Telefonía Celular de Nicaragua S.A., the Nicaraguan subsidiary of the Spanish company Telefónica, for US$ 430 million. This operation is part of Telefónica’s reorganization plan that involves selling a considerable part of its Latin American assets to raise US$ 2.2 billion and focus on its main markets in Europe and Brazil. The Central American package, which also includes the purchase of the Panamanian subsidiary, is the most important component of this operation. With this, Millicom hopes to consolidate itself as one of Central America’s main mobile operators.22
Notable in the area of electricity production was the memorandum of understanding that Soventix —a subsidiary of the German solar energy company of the same name— drew up with the Government of Nicaragua to install a 100 MW solar plant in the west of the country (Energía Limpia XXI, 2019).
5. The Caribbean: growth in FDI inflows is explained by increases observed in the Dominican Republic and Guyana
FDI inflows into the Caribbean totalled US$ 6.467 billion in 2019, a rise of 20.3% over 2018.23 This growth was on account of higher FDI inflows destined for the Dominican Republic, which remained the main recipient and attracted 47% of the subregion’s FDI, and for Guyana, which received 26% of the total and overtook Jamaica (10%) and the Bahamas (9%). Before the expansion of Guyana’s FDI, those two countries, along with the Dominican Republic, were the main investment recipients. In 2019, the only countries in the Caribbean where FDI inflows increased were the Dominican Republic, Guyana and Trinidad and Tobago.
In 2019, the region was the target of a large operation by the company Parkland Fuel, Canada’s largest independent seller of fuel and oil products (Petrol World, 2019), which acquired the Caribbean-based company SOL Investment Limited and its subsidiaries (SOL) for US$ 1.612 billion. SOL began operations in 2005 when, at
22 The agreement with Telefónica also included the purchase of the company’s subsidiary in Costa Rica (Telefónica de Costa Rica TC, S.A.) for a total of US$ 570 million. However, after the deadline for completing the operation had passed, and although the Superintendency of Telecommunications gave its approval in August 2019, Millicom announced that it was withdrawing from the operation due to disagreements with Telefónica regarding compliance with regulatory conditions (El País, 2020; Estrategia & Negocios, 2019b).
23 Only those countries that provided data for 2019 are included in the comparison.
77Chapter IForeign Direct Investment in Latin America and the Caribbean • 2020
the behest of a prominent Barbadian businessman, it acquired Shell’s business in the Eastern Caribbean, Guyana, Suriname and Belize. Over time, the company expanded its activities and secured a presence in 22 Caribbean territories. Its headquarters is currently located in the Cayman Islands, and its assets include 32 import terminals, 7 pipelines, 3 marine berths and 10 ships (Sol Petroleum, 2018). In addition, SOL owns 526 retail fuel stations, operating under the Shell, Esso and SOL brands, and has business interests in lubricants, liquefied petroleum gas, convenience stores, and marine and aviation fuels. The acquisition of SOL is unlikely to impact the region’s FDI inflows, but it does show the importance of Caribbean markets for North American transnational corporations.
The countries that make up the Organization of Eastern Caribbean States (OECS) —Antigua and Barbuda, Dominica, Grenada, Saint Kitts and Nevis, Saint Vincent and the Grenadines and Saint Lucia— had not released their 2019 FDI figures as of this report’s publication date. In 2018, they received a total of US$ 546 million, with the largest recipients being Antigua and Barbuda, which received 25% of the total, and Saint Vincent and the Grenadines, which received 20% (see map I.3).
The Dominican Republic remains the Caribbean’s top destination for FDI. The sustained economic growth of the last decade, with a GDP growth rate of 5.1% in 2019, was accompanied by increased interest from foreign investors. In 2019 the country received US$ 3.013 billion in FDI, 18.8% more than in 2018, and although this amount does not equal 2017’s record level, it is almost 22% higher than the average investments received between 2010 and 2017. In the first half of 2020, however, inflows fell by 22%, reflecting the severe impact of the pandemic on the tourism industry, which is one of the country’s most attractive sectors for foreign capital.
The United States was the main source of investments, accounting for 31% of the total in 2019, while the other two major investors were Mexico (21%) and Spain (13%).
Tourism was the sector that attracted the most interest from foreign investors, accounting for 29% of 2019’s FDI. It was followed by the real estate sector, which accounted for 15% of the total, although that represented a 13% drop compared to 2018. The following sectors were electricity, where inflows rose by 85%, telecommunications —which, after recording a negative balance in 2018, accounted for 11% of FDI in 2019— and mining, where investments grew by 50%. In contrast, capital inflows for manufacturing industry fell by 53%, from 20% of the 2018 total to 8% in 2019. FDI inflows into the financial sector also declined by 44%.
During 2019, 19 investment projects worth an estimated total of US$ 1.083 billion were announced. Six projects were in the tourism sector, in an aggregate amount of US$ 583 million. For example, Serenade Caribbean Resorts, the new Caribbean business division of Spain’s Best Hotels chain, was scheduled to open its first resort in September 2020: the Serenade Punta Cana Beach, Spa & Casino Resort, a five-star seafront hotel complex, offering 600 rooms and luxury services (Europa Press, 2019). Pure Salt Luxury Hotels, another Spanish concern, announced that it planned to expand in the Caribbean and would open its first resort in the country in 2021, with an investment of nearly US$ 85 million (Travelweek, 2019).
In addition, two renewable energy projects were announced, together with six for various manufacturing industries: building materials, chemicals, food and beverages, plastic and paper packaging, cement products and textiles.
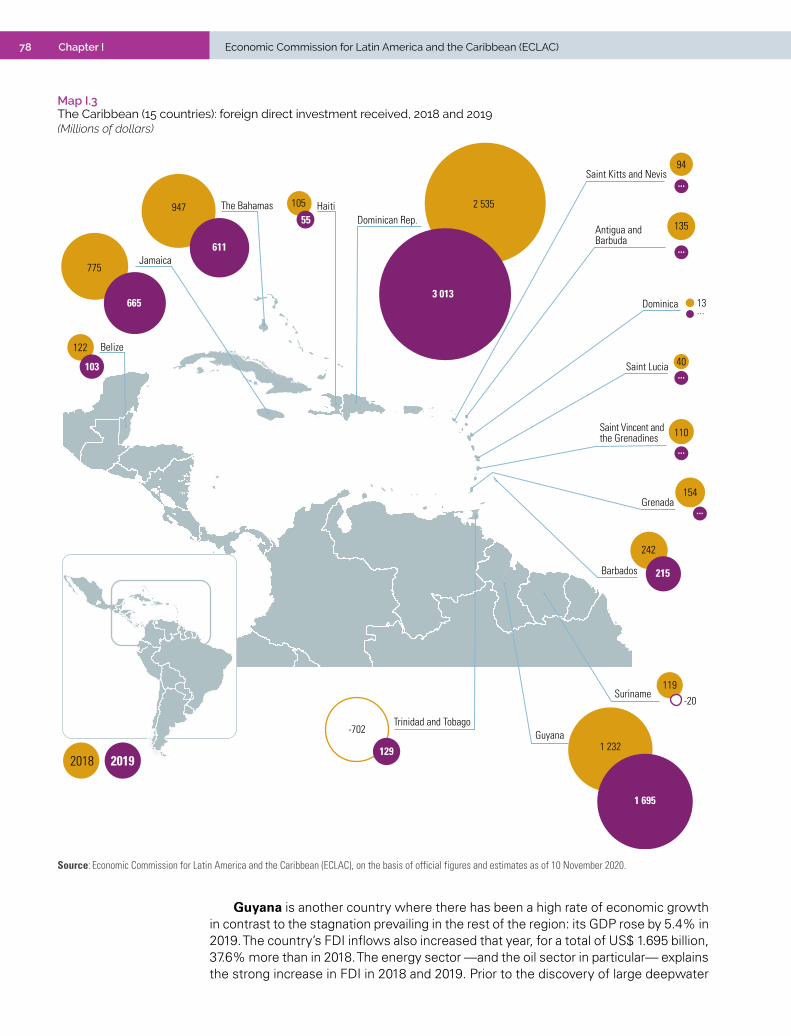
78 Chapter I Economic Commission for Latin America and the Caribbean (ECLAC)
Map I.3 The Caribbean (15 countries): foreign direct investment received, 2018 and 2019(Millions of dollars)
Dominican Rep.
Dominica
Trinidad and TobagoGuyana
Suriname
Barbados
Grenada
Saint Vincent and the Grenadines
Saint Lucia
Antigua and Barbuda
Saint Kitts and Nevis
HaitiThe Bahamas
Jamaica
Belize
2018 2019
775
665
94
110
40...
-702
129
119
2 535
3 01313...
122
103
947
611
242
215
154
1 232
1 695
105
55
-20
135
...
...
...
...
Source: Economic Commission for Latin America and the Caribbean (ECLAC), on the basis of official figures and estimates as of 10 November 2020.
Guyana is another country where there has been a high rate of economic growth in contrast to the stagnation prevailing in the rest of the region: its GDP rose by 5.4% in 2019. The country’s FDI inflows also increased that year, for a total of US$ 1.695 billion, 37.6% more than in 2018. The energy sector —and the oil sector in particular— explains the strong increase in FDI in 2018 and 2019. Prior to the discovery of large deepwater
79Chapter IForeign Direct Investment in Latin America and the Caribbean • 2020
oil fields in 2015, transport, communications and agriculture were the sectors that attracted the most investments. In contrast, the oil sector accounted for most of the FDI received in 2019 (85%). However, the country’s oil boom and prospects for income growth also attracted other types of investment, and in 2019 and early 2020 projects were announced in the transport, logistics and infrastructure sectors.
On 20 December 2019, a milestone was reached in the country’s hydrocarbons industry: the United States-based Exxon Mobil Corporation and its partners —the Hess Corporation, also of the United States, and the China National Offshore Oil Corporation (CNOOC)— produced Guyana’s first commercial crude, extracted from Liza, the first oil field discovered by Exxon Mobil in 2015. This first crude production was a very important landmark in the country’s oil boom, where the reserves that have already been found are enormous. It is estimated that the exploitable resources in the Stabroek block, which includes the Liza oil field, exceed 8 billion barrels of oil equivalent (Smith, 2020).
In addition, it is estimated that US$ 53.4 billion will be invested in the Guyana-Suriname basin over the 2019–2030 period, with three companies accounting for 94% of the total: ExxonMobil (US$ 22.6 billion), Hess (US$ 15.1 billion) and CNOOC (US$ 12.6 billion). Almost 20% of the investments will be earmarked for expansion projects and the rest will be invested in new projects (World Energy Trade 2020). By 2026, Stabroek is expected to produce 750,000 gross barrels of oil per day, which would mean that Guyana, with a population of 780,000, could be producing more oil per capita than any other country in the world (Chuwiruch and Crowley, 2019; Argus Media, 2020). These new circumstances offer the country great opportunities, but they also pose the risk that the oil sector will exclude traditional sectors and prevent the diversification of the Guyanese economy.
Jamaica was the third largest recipient of investment in 2019, although FDI declined for the third consecutive year: it fell by 14.1% compared to 2018 and was worth US$ 665 million. That amount, however, is in line with the average annual investments received during the 2010s. The two main destination sectors were mining and tourism, which accounted for 50% and 20% of FDI in 2019, respectively.
The mining sector is undergoing a revitalization process and efforts are being made to diversify it. Although most of the FDI inflows into this sector were for bauxite mining, opportunities to develop other types of mining are also being explored. In 2019, the government signed 27 exploration licenses to evaluate possibilities for gold, zinc and copper mining, as well as to expand the limestone industry (The Japan Times, 2020).
The tourism sector remains attractive to foreign capital, despite not attracting levels of investment comparable to those recorded in 2015 and 2016. In 2019, two Spanish chains, H10 Hotels and Princess Hotels & Resorts, announced they were to invest US$ 250 million and US$ 500 million, respectively, in building new hotels by 2021, for a total of 3,000 new rooms (Empresa Exterior, 2019). The country’s authorities have said that they expect tourism to continue to expand and that more opportunities for local development will be generated around hotel investments (Jamaica Observer, 2019).
In 2019, FDI in the Bahamas declined by 35.5% compared to 2018: a total of US$ 611 million was received, the weakest result in a decade. The drop occurred both in equity, which fell by 35%, and in intercompany loans, which fell by 36%. The investments received in 2019 were equal to 42% of the average annual FDI received from 2011 to 2018.
The decrease in investments was mainly due to the slowdown in hotel and construction projects, which had to be delayed on account to Hurricane Dorian. A joint report by ECLAC and the Inter-American Development Bank (IDB) has estimated that the total cost of Hurricane Dorian’s impact in the Bahamas amounted to US$ 3.4 billion, equal to a quarter of the country’s GDP (ECLAC/IDB, 2020).

80 Chapter I Economic Commission for Latin America and the Caribbean (ECLAC)
Lower FDI inflows were also recorded in Barbados: in 2019, US$ 215 million entered the country, for a drop of 10% compared to the previous year. The tourism sector remains the backbone of the economy and continues to attract investment to the country. In 2019 Marriott International announced that it planned to acquire Elegant Hotels, confirming that the island is attractive for investment in that sector (Elegant owns and operates seven hotels with a total of 588 rooms and an oceanfront restaurant).
In 2019, and for the first time in three years, Trinidad and Tobago reported positive FDI inflows (US$ 129 million). Traditionally, the oil sector has been the main destination for foreign capital, and the movement of funds by transnational companies in the sector was the explanation for the high volatility of the country’s FDI. After several years of stagnation, in 2019 Australia’s BHP Group announced that it was to invest some US$ 283 million in an oil and gas project (Reuters, 2019).
Belize’s FDI fell by 15.7% in 2019 in year-on-year terms, for a total of US$ 103 million. Most of the investments were earmarked for real estate and tourism: construction accounted for 33% of total receipts, real estate for 20%, and hotels and restaurants for 9%.
Business services have also attracted the interest of foreign firms. Transparent BPO, a commercial services company based in the United States, announced plans to expand its operations in Belize by opening a new delivery centre in Belmopan in early 2020. While this expansion represents a low investment amount of around US$ 19 million, it has a significant impact on employment and will allow the company to employ more than 2,000 people in a variety of roles, including management positions (Transparent BPO, 2019).
Haiti received US$ 55 million in FDI in 2019, 48% less than the previous year. The country’s investment facilitation centre (Centre de Facilitation des Investissements, IFC) identifies four sectors that are key in attracting foreign capital: textiles, agro-industry, tourism and business services. Despite the country’s adoption of FDI-friendly policies, such as free zones, investment levels remain very modest.
Suriname’s 2019 FDI reported a negative balance of US$ 20 million, which means that capital outflows from foreign companies established in the country —either through divestments or the payment of previously acquired debts— were greater than the inflow. Traditionally, gold and bauxite mining,24 the oil sector and the forestry industry have been the most attractive sectors for FDI. After oil was discovered in Guyana, similar discoveries were expected in its neighbour. Thus, France’s Total S.A. and its United States partner Apache announced three significant oil discoveries off the coast of Suriname between January and August 2020 (France-info, 2020).
24 With the shutdown of the alumina industry in 2016, however, no further FDI in this sector is expected in the short term.
81Chapter IForeign Direct Investment in Latin America and the Caribbean • 2020
BibliographyActualidad Aeroespacial (2019), “ADP firma un acuerdo para el desarrollo del principal aeropuerto
de Bolivia”, 2 October [online] https://actualidadaeroespacial.com/adp-firma-un-acuerdo-para-el-desarrollo-del-principal-aeropuerto-de-bolivia/.
Agencia EFE (2020), “Abertis compra el 51,3 % de Red de Carreteras de Occidente por 1.500 millones”, 5 June [online] https://www.efe.com/efe/espana/economia/abertis-compra-el-51-3-de-red-carreteras-occidente-por-1-500-millones/10003-4263875.
América Economía (2019), “Grupo español Acciona construirá planta de biocombustibles en Paraguay”, 26 November [online] https://www.americaeconomia.com/negocios-industrias/grupo-espanol-acciona-construira-planta-de-biocombustibles-en-paraguay.
Argus Media (2020), “Guyana crude production climbs past 100,000 b/d”, 3 November [online] https://www.argusmedia.com/en/news/2156234-guyana-crude-production-climbs-past-100000-bd.
Central Bank of Brazil (2018), Relatório de Investimento Direto no País, Brasilia, May. Chuwiruch, P. and K. Crowley (2019), “Oil boom begins in Guyana as Exxon produces first Liza
crude”, Bloomberg, 23 December [online] https://www.bloomberg.com/news/articles/2019-12-21/hess-exxon-report-first-oil-output-from-liza-field-near-guyana.
Cimoli, M. and others (eds.) (2017), “Políticas industriales y tecnológicas en América Latina”, Project Documents (LC/TS.2017/91), Santiago, Economic Commission for Latin America and the Caribbean (ECLAC), November.
CINDE (Costa Rican Investment Promotion Agency) (2019), “Medtronic inaugura planta con planes de expansión en Costa Rica”, 11 September [online] https://www.cinde.org/es/noticias/press-release/medtronic-inaugura-planta-con-planes-de-expansion-en-costa-rica.
CISION PR Newswire (2019), “Energía del Pacífico closes financing on largest ever foreign direct investment in El Salvador”, 23 December [online] https://www.prnewswire.com/news-releases/energia-del-pacifico-closes-financing-on-largest-ever-foreign-direct-investment-in-el-salvador-300978857.html.
COCHILCO (Chilean Copper Commission) (2019), Inversión en la minería chilena: cartera de proyectos 2019-2028, Santiago, November [online], https://www.cochilco.cl/Listado%20Temtico/Cartera%20de%20proyectos%202019%20-%202028%20vf.pdf.
Converge Media Ventures (2019), “América Móvil and Telxius to build 108 Tbps Pacific cable”, 25 June [online] https://www.convergedigest.com/2019/06/america-movil-and-telxius-to-build-108.html.
CRS (Congressional Research Service) (2020), U.S.-Mexico Economic Relations: Trends, Issues, and Implications, 25 June [online] https://fas.org/sgp/crs/row/RL32934.pdf.
ECLAC (Economic Commission for Latin America and the Caribbean) (2020a), “Sectors and businesses facing COVID-19: emergency and reactivation”, COVID-19 Special Report, No. 4, Santiago, July.(2020b), “Addressing the growing impact of COVID-19 with a view to reactivation with equality: new projections”, COVID-19 Special Report, No. 5, Santiago, July.(2020c), Building a New Future: Transformative Recovery with Equality and Sustainability (LC/SES.38/3-P/Rev.1), Santiago.(2020d), Reconstruction and transformation with equality and sustainability in Latin America and the Caribbean (LC/SES.38/11), Santiago, 2020.(2020e), “Impact of COVID-19 on the United States economy and the policy response”, COVID-19 Reports, Santiago, August.(2019), Foreign Direct Investment in Latin America and the Caribbean, 2019 (LC/PUB.2019/16-P), Santiago.(2018), Foreign Direct Investment in Latin America and the Caribbean, 2018 (LC/PUB.2018/13-P), Santiago.
ECLAC/IDB (Economic Commission for Latin America and the Caribbean/Inter-American Development Bank) (2020), Assessment of the Effects and Impacts of Hurricane Dorian in the Bahamas (LC/TS.2020/31), Santiago.
El Comercio (2020), “Firma coreana KAC administrará el Aeropuerto de Manta, dice Moreno al recorrer construcción de nueva terminal”, 21 August [online] https://www.elcomercio.com/actualidad/empresa-coreana-administracion-aeropuerto-manta.html.

82 Chapter I Economic Commission for Latin America and the Caribbean (ECLAC)
El Economista (2019a), “Alpek busca expandir su negocio de PET a Europa; compra planta”, 30 October [online] https://www.eleconomista.com.mx/empresas/Alpek-busca-expandir-su-negocio-de-PET-a-Europa-compra-planta-20191030-0011.html.(2019b), “Transnacional UPL concretó compra de agroquímica BioQuim de Costa Rica”, 11 July [online] https://www.eleconomista.net/economia/Transnacional-UPL-concreto-compra-de-agroquimica-BioQuim-de-Costa-Rica---20190711-0033.html.
El País (2020), “Millicom da el paso de frenar la compra del negocio de Telefónica en Costa Rica”, 3 May [online] https://cincodias.elpais.com/cincodias/2020/05/03/companias/1588507444 _787042.html.
Empresa Exterior (2019), “Jamaica anuncia nuevas inversiones de cadenas hoteleras españolas”, 28 January [online] https://empresaexterior.com/art/69129/jamaica-anuncia-nuevas-inversiones-de-cadenas-hoteleras-espanolas.
Energía Limpia XXI (2019), “Soventix invertirá en planta solar en Nicaragua”, 2 August [online] https://energialimpiaparatodos.com/2019/08/02/solventix-invertira-en-planta-solar-en-nicaragua/.
Estrategia & Negocios (2019a), “Costa Rica: UPL compra Industrias BioQuim Centroamericanas S.A.”, 10 July [online] https://www.estrategiaynegocios.net/empresasymanagement/1300772-330/costa-rica-upl-compra-industrias-bioquim-centroamericanas-sa. (2019b), “Millicom (Tigo) compra la operación de Telefónica en Nicaragua, Costa Rica y Panamá”, 20 February [online] https://www.estrategiaynegocios.net/lasclavesdeldia/1260929-330/millicom-tigo-compra-la-operaci%F3n-de-telef%F3nica-en-nicaragua-costa-rica-y.
Europa Press (2019), “Best Hotels crea Serenade Caribbean Resorts, una nueva gestora para el mercado caribeño”, 19 December [online] https://www.europapress.es/turismo/hoteles/noticia-best-hotels-crea-serenade-caribbean-resorts-nueva-gestora-mercado-caribeno-20191219140600.html.
Expansión (2020a), “100 mexicanas globales”, Revista Expansión, No. 1264, January. (2020b), “500 empresas más importantes de México”, Revista Expansión, No. 1269, Mexico City, July .(2020c), “Fiat Chrysler ratifica que llevará a cabo millonarias inversiones en Brasil”, 4 July [online] https://www.expansion.com/latinoamerica/2020/07/04/5f0049ed468aebd0338b4645.html.
Federal Reserve Board (2020), “Industrial production and capacity utilization”, Federal Reserve Statistical Release, Washington, D.C., October.
Financial Express (2018), “UPL set to acquire Bioquim Group to enhance presence in Central America”, 22 November [online] https://www.financialexpress.com/industry/upl-set-to-acquire-bioquim-group-to-enhance-presence-in-central-america/1389538/.
Forbes México (2019), “Empresa coreana invertirá 400 mdd para construir complejo industrial en Guatemala”, 8 February [online] https://www.forbes.com.mx/empresa-coreana-invertira-400-mdd-para-construir-complejo-industrial-en-guatemala/.
Franceinfo (2020), “Une troisième découverte de pétrole offshore au large du Suriname”, 1 August [online] https://la1ere.francetvinfo.fr/guyane/troisieme-decouverte-petrole-offshore-au-large-du-suriname-858320.html.0.
Gammacurta, G. (2020), “Anuncios de inversión en Argentina: minería, gran protagonista”, Mining Press, 3 November [online] http://miningpress.com/nota/333280/anuncios-de-inversion-en-argentina-mineria-gran-protagonista.
GlobeNewswire (2019), “SURGE HOLDINGS, Inc. Completes Acquisition of Stake in Centercom Global BPO”, 17 January [online] https://www.globenewswire.com/news-release/2019/01/17/1701226/0/en/SURGE-HOLDINGS-INC-COMPLETES-ACQUISITION-OF-STAKE-IN-CENTERCOM-GLOBAL-BPO.html.
Guterres, A. (2020), “Building back better requires transforming the development model of Latin America and the Caribbean”, Santiago, Economic Commission for Latin America and the Caribbean (ECLAC), 9 July [online] https://www.cepal.org/en/articles/2020-building-back-better-requires-transforming-development-model-latin-america-and.
Horizonte Minero (2019), “Southern proyecta invertir más de US$ 8,000 millones en próximos 5 años”, 19 December [online] https://www.horizonteminero.com/southern-proyecta-invertir-mas-de-us-8000-millones-en-proximos-5-anos/.
IMF (International Monetary Fund) (2009), Balance of Payments and International Investment Position Manual: Sixth Edition (BPM6), Washington, D.C.(1993), Balance of Payments and International Investment Position Manual: Fifth Edition, Washington, D.C.
83Chapter IForeign Direct Investment in Latin America and the Caribbean • 2020
InvestChile (2019), “Gobierno Regional lanza InvestAraucanía para atraer inversión extranjera a la zona”, 18 October [online] https://investchile.gob.cl/es/regional-government-launches-investaraucania-to-attract-foreign-investment-to-the-region/.
Jamaica Observer (2019), “H10 hotel in Trelawny to start receiving guests next month”, 22 November [online] http://www.jamaicaobserver.com/business-report/h10-hotel-in-trelawny-to-start-receiving-guests-next-month_180148?profile=1442.
Kemeny, R. (2020), “New Pará railway divides the state”, 3 March [online] https://dialogochino.net/en/infrastructure/33830-new-para-railway-divides-the-state/.
La Jornada (2020), “América Móvil y Telefónica terminan contrato de compra en el Salvador”, 3 September [online] https://www.jornada.com.mx/ultimas/economia/2020/09/03/america-movil-y-telefonica-terminan-contrato-de-compra-en-el-salvador-8046.html.
La Nación (2019), “Planta de biocombustible en Villeta generará miles de empleos”, 4 September [online] https://www.lanacion.com.py/negocios/2019/09/04/planta-de-biocombustible-en-villeta-generara-miles-de-empleos/.
La Prensa (2019), “Claro invertirá $300 millones en tecnología 5G en Panamá”, 12 October [online] https://www.prensa.com/economia/Claro-invertira-millones-redes-Panama_0_5417458212.html.
LexLatin (2019), “Eurofarma adquiere negocio de prescripción médica de Laboratorio Stein”, 26 March [online] https://lexlatin.com/noticias/eurofarma-adquiere-negocio-de-prescripcion-medica-de-laboratorios-stein.
Marco, A. (2019), “Telefónica vende Centroamérica a Millicom por 1.450 millones para adelgazar la deuda”, El Confidencial, 20 February [online] https://www.elconfidencial.com/empresas/2019-02-20/telefonica-vende-centroamerica-millicom-adelgazar-deuda_1838114/.
Minería Chilena (2019), “Southern Copper planea construir nueva fundición en Perú por US$1.300M y evalúa proyecto de litio en México”, 26 August [online] https://www.mch.cl/2019/08/26/southern-copper-planea-construir-nueva-fundicion-en-peru-por-us1-300m-y-evalua-proyecto-de-litio-en-mexico/.
Mundo Marítimo (2019), “Minerva Bunkering se prepara para enfrentar IMO 2020 y adquiere el 100% de CEPSA Panamá”, 20 December [online] https://www.mundomaritimo.cl/noticias/minerva-adquirio-el-100-de-cepsa-panama.
NextTV News Latin America (2019), “América Móvil adquiere Telefónica Guatemala y El Salvador”, 25 January [online] https://nextvlatam.com/america-movil-adquiere-telefonica-guatemala-y-el-salvador/.
Pautasio, L. (2020), “Telefónica encuentra un freno en El Salvador y cancela contrato para vender la operación a América Móvil”, TeleSemana [online] https://www.telesemana.com/blog/2020/09/03/telefonica-encuentra-un-freno-en-el-salvador-y-cancela-contrato-para-vender-la-operacion-a-america-movil/.
Petrol World (2019), “Caribbean: Parkland Fuel Acquires 75% Of Sol Investments”, 10 January [online] https://www.petrolworld.com/latin-america/item/31579-caribbean-parkland-fuel-acquires-75-of-sol-investments.
Redagrícola Comunicaciones Limitada (2019), “UPL OPENAG: nueva marca para el ingreso de un gigante mundial a Chile”, Redagrícola, No. 104, Santiago, July.
Reuters (2019), “BHP Group to invest $283 million in Trinidad and Tobago petroleum project”, 7 August [online] https://www.reuters.com/article/us-bhp-group-au-project-trinidadtobago/bhp-group-to-invest-283-million-in-trinidad-and-tobago-petroleum-project-idUSKCN1UX2LC.
Smith, M. (2020), “Can Guyana salvage its much-hyped oil boom?”, 25 August, Oilprice [online] https://oilprice.com/Energy/Crude-Oil/Can-Guyana-Salvage-Its-Much-Hyped-Oil-Boom.html.
Sol Petroleum (2018), “Parkland fuel corporation to acquire 75% of SOL, the largest independent fuel marketer in the Caribbean”, 10 October [online] https://solpetroleum.com/blog/2018/10/10/parkland-fuel-corporation-to-acquire-75-of-sol-the-largest-independent-fuel-marketer-in-the-caribbean/.
Surge Holdings (2020), “Annual report pursuant to section 13 and 15(d)”, 31 December [online] https://ir.surgeholdings.com/sec-filings/all-sec-filings/xbrl_doc_only/1378.
Telefónica (2020), “Telefónica vende su negocio en Costa Rica a Liberty Latin America por 425 millones de euros”, 30 July [online] https://www.telefonica.com/es/web/sala-de-prensa/-/telefonica-vende-su-negocio-en-costa-rica-a-liberty-latin-america-por-425-millones-de-euros.
The Japan Times (2020), “The revitalization of Jamaica’s mining sector”, 9 January [online] https://www.japantimes.co.jp/country-report/2020/01/09/global-insight/jamaica-report-2020/revitalization-jamaicas-mining-sector/.
84 Chapter I Economic Commission for Latin America and the Caribbean (ECLAC)
Transparent BPO (2019), “Transparent BPO opens third contact center in Belize, continued expansion planned”, 29 August [online] https://transparentbpo.com/transparent-to-open-contact-center-in-belmopan-belize/.
Travelweek (2019), “First look at luxe new US$85-million adults-only resort coming to Punta Cana”, 17 July [online] http://www.travelweek.ca/news/luxe-new-us85-million-adults-only-resort-coming-to-punta-cana/.
UNCTAD (United Nations Conference on Trade and Development) (2020), World Investment Report: International Production beyond the Pandemic, Geneva.
United States Bureau of the Census (2020), “Trade in goods with Mexico” [online] https://www.census.gov/foreign-trade/balance/c2010.html#2020.
UPM (2019), “UPM continues its strategic transformation and invests in a world class pulp mill in central Uruguay”, 23 July [online] https://www.upm.com/about-us/for-media/releases/2019/07/upm-continues-its-strategic-transformation-and-invests-in-a-world-class-pulp-mill-in-central-uruguay/.
USTR (Office of the United States Trade Representative) (2020), “Mexico” [online] https://ustr.gov/countries-regions/americas/mexico.
World Energy Trade (2020), “El enorme potencial de la cuenca Guyana-Surinam atrae la inversión de las grandes petroleras mundiales”, 17 February [online] https://www.worldenergytrade.com/finanzas-energia/economia/el-enorme-potencial-de-la-cuenca-guyana-surinam-atrae-la-inversion-de-las-grandes-petroleras-mundiales.
Xinhua (2019), “Bolivia y China crean empresa mixta para industrializar salares de Pastos Grandes y Coipasa”, 21 August [online] http://spanish.xinhuanet.com/2019-08/21/c_138325593.htm.
85Foreign Direct Investment in Latin America and the Caribbean • 2020 Chapter II
IICHAPTER
Towards a new post-pandemic global production geography: the reorganization of global value chains
Introduction
A. Evolution of global value chains
B. The COVID-19 pandemic: a cataclysmic event for global value chains
C. Possible future trajectories of global value chains and policy recommendations
Bibliography

87Foreign Direct Investment in Latin America and the Caribbean • 2020 Chapter IIIIIntroduction
The last three decades have been characterized by growth in international production as a result of major changes in the strategies of transnational corporations. Thanks to technological advances and geopolitical and economic changes, they have deployed complex production networks to boost their efficiency, taking advantage of cost and productivity differences between countries. While growth of these forms of production organization has stagnated since the 2008–2009 global financial crisis, they are still at the heart of the globalization process. The very factors that brought the growth caused this trajectory change by exerting pressure in the opposite direction.
The weakening of multilateralism in the area of trade and investment, the spread of unilateral protectionist measures and of trade tensions between the main blocs, and technological changes that have eroded competitive advantages associated with low costs, mainly in terms of labour, have conditioned the dynamics of production and international trade and, in so doing, the behaviour of transnational corporations and global value chains. In this new competitive environment, there are indications that global value chains have begun to reconfigure geographically and functionally. Likewise, the strategies for seeking efficiency incorporate new strategic elements to increase the resilience of global value chains in the face of economic, political and environmental instability on the international stage.
In this context, coronavirus disease (COVID-19) is battering the global economy, causing the worst crisis since the Second World War. The pandemic has disrupted multiple intermediate-product supply chains, stymieing many global value chains around the world. Also, the strong concentration of manufacturing and input supply activities where the pandemic originated in China put the resilience and geographic diversification of global value chains at the centre of the debate within companies. Indeed, as a result of the depth and breadth of the crisis, some trends that were beginning to emerge may accelerate and consolidate in the near future.
Based on the wide-ranging current debate, this chapter provides an overview of the features that enabled the transformation of international production and of the role that Latin American and Caribbean countries have played in those changes. Against this background, the effects of the coronavirus on global value chains are analysed and some future scenarios are outlined based on recent trends and disruptions caused by the pandemic.
A. Evolution of global value chains
1. Global value chains have changed the nature and structure of the world economy
In the early 1990s, the interconnectedness of the world economy began to accelerate, driven by the rapid growth of international production, trade and foreign direct investment (FDI) (see figure II.1).1 The above was the result of technological advances
1 International production refers to the global production networks of transnational corporations that generate and coordinate trade in global value chains. In fact, a significant part of cross-border trade in inputs and final goods is between affiliates, contractual partners and independent suppliers of transnational corporations. The value added generated by transnational corporations in their home countries and foreign affiliates represents about one third of the world’s gross domestic product (GDP).
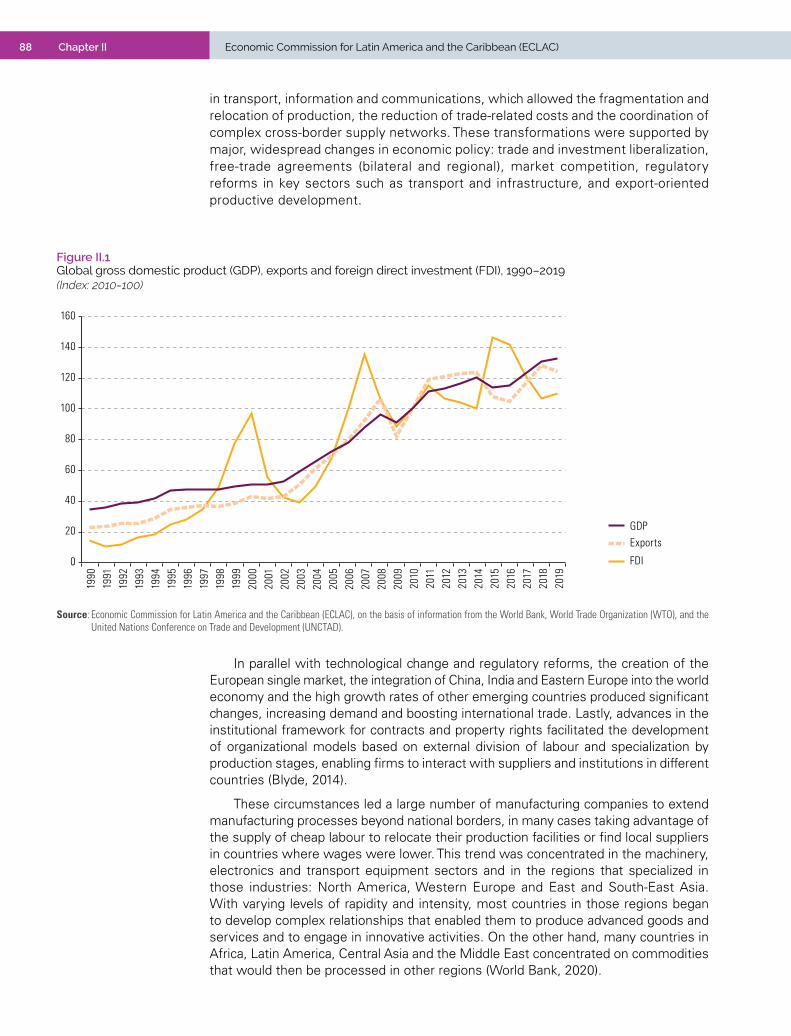
88 Economic Commission for Latin America and the Caribbean (ECLAC)Chapter II
in transport, information and communications, which allowed the fragmentation and relocation of production, the reduction of trade-related costs and the coordination of complex cross-border supply networks. These transformations were supported by major, widespread changes in economic policy: trade and investment liberalization, free-trade agreements (bilateral and regional), market competition, regulatory reforms in key sectors such as transport and infrastructure, and export-oriented productive development.
Figure II.1 Global gross domestic product (GDP), exports and foreign direct investment (FDI), 1990–2019(Index: 2010=100)
0
20
40
60
80
100
120
140
160
FDI
ExportsGDP
1990
1991
1992
1993
1994
1995
1996
1997
1998
1999
2000
2001
2002
2003
2004
2005
2006
2007
2008
2009
2010
2011
2012
2013
2014
2015
2016
2017
2018
2019
Source: Economic Commission for Latin America and the Caribbean (ECLAC), on the basis of information from the World Bank, World Trade Organization (WTO), and the United Nations Conference on Trade and Development (UNCTAD).
In parallel with technological change and regulatory reforms, the creation of the European single market, the integration of China, India and Eastern Europe into the world economy and the high growth rates of other emerging countries produced significant changes, increasing demand and boosting international trade. Lastly, advances in the institutional framework for contracts and property rights facilitated the development of organizational models based on external division of labour and specialization by production stages, enabling firms to interact with suppliers and institutions in different countries (Blyde, 2014).
These circumstances led a large number of manufacturing companies to extend manufacturing processes beyond national borders, in many cases taking advantage of the supply of cheap labour to relocate their production facilities or find local suppliers in countries where wages were lower. This trend was concentrated in the machinery, electronics and transport equipment sectors and in the regions that specialized in those industries: North America, Western Europe and East and South-East Asia. With varying levels of rapidity and intensity, most countries in those regions began to develop complex relationships that enabled them to produce advanced goods and services and to engage in innovative activities. On the other hand, many countries in Africa, Latin America, Central Asia and the Middle East concentrated on commodities that would then be processed in other regions (World Bank, 2020).
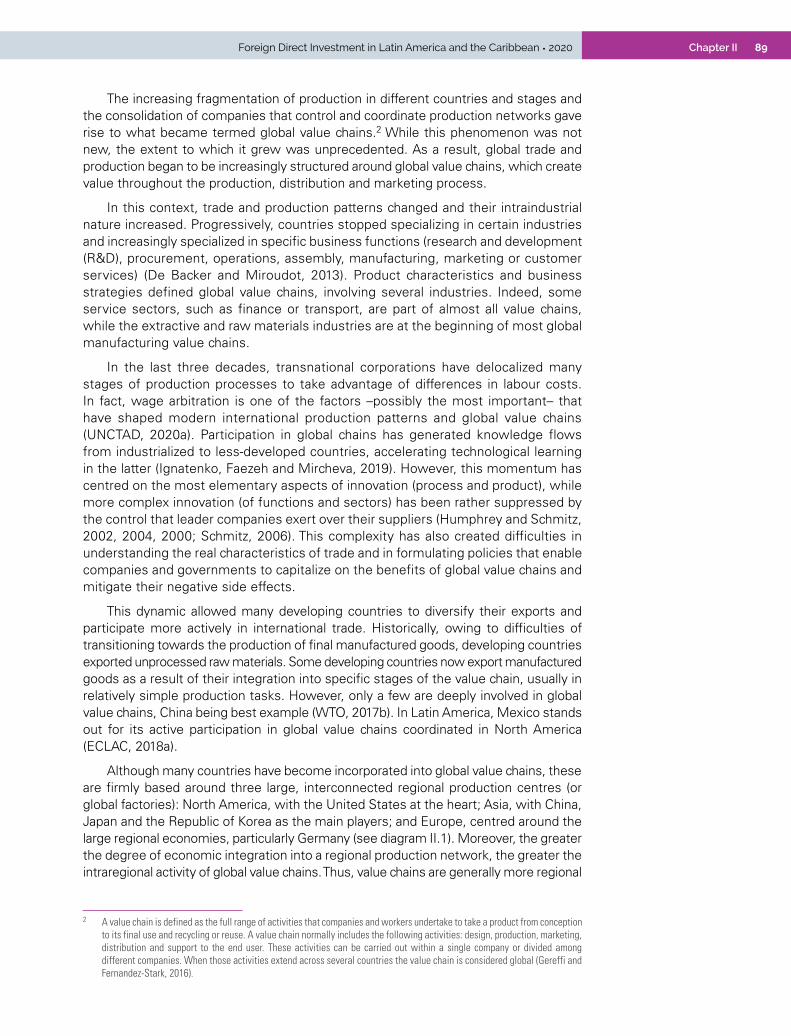
89Foreign Direct Investment in Latin America and the Caribbean • 2020 Chapter II
The increasing fragmentation of production in different countries and stages and the consolidation of companies that control and coordinate production networks gave rise to what became termed global value chains.2 While this phenomenon was not new, the extent to which it grew was unprecedented. As a result, global trade and production began to be increasingly structured around global value chains, which create value throughout the production, distribution and marketing process.
In this context, trade and production patterns changed and their intraindustrial nature increased. Progressively, countries stopped specializing in certain industries and increasingly specialized in specific business functions (research and development (R&D), procurement, operations, assembly, manufacturing, marketing or customer services) (De Backer and Miroudot, 2013). Product characteristics and business strategies defined global value chains, involving several industries. Indeed, some service sectors, such as finance or transport, are part of almost all value chains, while the extractive and raw materials industries are at the beginning of most global manufacturing value chains.
In the last three decades, transnational corporations have delocalized many stages of production processes to take advantage of differences in labour costs. In fact, wage arbitration is one of the factors –possibly the most important– that have shaped modern international production patterns and global value chains (UNCTAD, 2020a). Participation in global chains has generated knowledge flows from industrialized to less-developed countries, accelerating technological learning in the latter (Ignatenko, Faezeh and Mircheva, 2019). However, this momentum has centred on the most elementary aspects of innovation (process and product), while more complex innovation (of functions and sectors) has been rather suppressed by the control that leader companies exert over their suppliers (Humphrey and Schmitz, 2002, 2004, 2000; Schmitz, 2006). This complexity has also created difficulties in understanding the real characteristics of trade and in formulating policies that enable companies and governments to capitalize on the benefits of global value chains and mitigate their negative side effects.
This dynamic allowed many developing countries to diversify their exports and participate more actively in international trade. Historically, owing to difficulties of transitioning towards the production of final manufactured goods, developing countries exported unprocessed raw materials. Some developing countries now export manufactured goods as a result of their integration into specific stages of the value chain, usually in relatively simple production tasks. However, only a few are deeply involved in global value chains, China being best example (WTO, 2017b). In Latin America, Mexico stands out for its active participation in global value chains coordinated in North America (ECLAC, 2018a).
Although many countries have become incorporated into global value chains, these are firmly based around three large, interconnected regional production centres (or global factories): North America, with the United States at the heart; Asia, with China, Japan and the Republic of Korea as the main players; and Europe, centred around the large regional economies, particularly Germany (see diagram II.1). Moreover, the greater the degree of economic integration into a regional production network, the greater the intraregional activity of global value chains. Thus, value chains are generally more regional
2 A value chain is defined as the full range of activities that companies and workers undertake to take a product from conception to its final use and recycling or reuse. A value chain normally includes the following activities: design, production, marketing, distribution and support to the end user. These activities can be carried out within a single company or divided among different companies. When those activities extend across several countries the value chain is considered global (Gereffi and Fernandez-Stark, 2016).
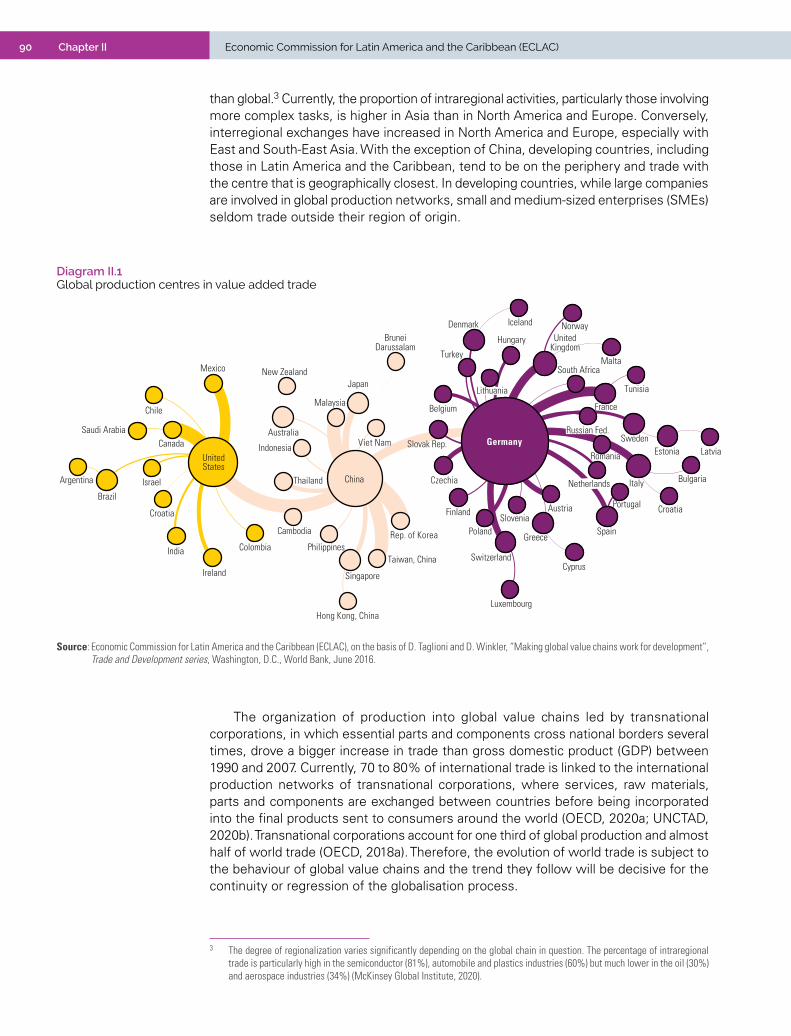
90 Economic Commission for Latin America and the Caribbean (ECLAC)Chapter II
than global.3 Currently, the proportion of intraregional activities, particularly those involving more complex tasks, is higher in Asia than in North America and Europe. Conversely, interregional exchanges have increased in North America and Europe, especially with East and South-East Asia. With the exception of China, developing countries, including those in Latin America and the Caribbean, tend to be on the periphery and trade with the centre that is geographically closest. In developing countries, while large companies are involved in global production networks, small and medium-sized enterprises (SMEs) seldom trade outside their region of origin.
3 The degree of regionalization varies significantly depending on the global chain in question. The percentage of intraregional trade is particularly high in the semiconductor (81%), automobile and plastics industries (60%) but much lower in the oil (30%) and aerospace industries (34%) (McKinsey Global Institute, 2020).
The organization of production into global value chains led by transnational corporations, in which essential parts and components cross national borders several times, drove a bigger increase in trade than gross domestic product (GDP) between 1990 and 2007. Currently, 70 to 80% of international trade is linked to the international production networks of transnational corporations, where services, raw materials, parts and components are exchanged between countries before being incorporated into the final products sent to consumers around the world (OECD, 2020a; UNCTAD, 2020b). Transnational corporations account for one third of global production and almost half of world trade (OECD, 2018a). Therefore, the evolution of world trade is subject to the behaviour of global value chains and the trend they follow will be decisive for the continuity or regression of the globalisation process.
Diagram II.1 Global production centres in value added trade
Argentina
Australia
Austria
Belgium
Bulgaria
Brazil
BruneiDarussalam
Canada
Switzerland
Chile
China
Colombia
Croatia
Cyprus
Czechia
Germany
Denmark
Spain
Estonia
Finland
France
UnitedKingdom
Greece
Hong Kong, China
Croatia
Hungary
Indonesia
India
Ireland
Iceland
Israel Italy
Japan
Cambodia Rep. of Korea
Lithuania
Luxembourg
Latvia
MexicoMalta
Malaysia
Netherlands
Norway
New Zealand
Philippines
Poland
Portugal
Romania
Russian Fed.Saudi Arabia
Singapore
Slovak Rep.
Slovenia
Sweden
Thailand
Tunisia
Turkey
Taiwan, China
UnitedStates
Viet Nam
South Africa
Source: Economic Commission for Latin America and the Caribbean (ECLAC), on the basis of D. Taglioni and D. Winkler, “Making global value chains work for development”, Trade and Development series, Washington, D.C., World Bank, June 2016.
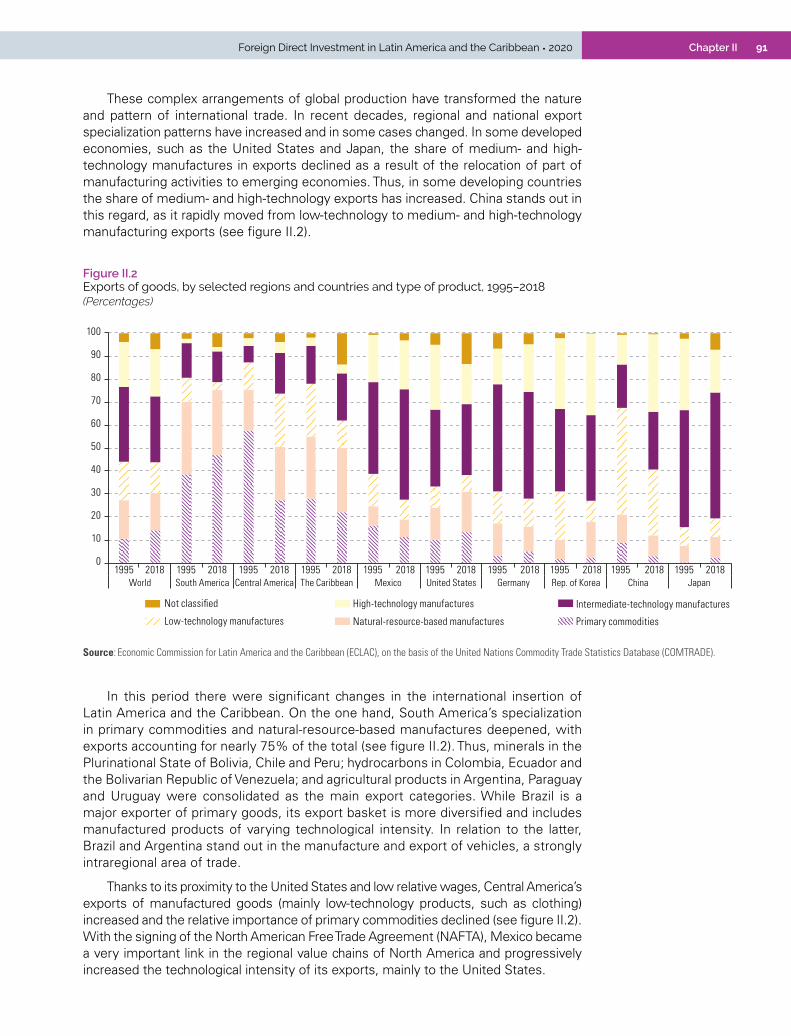
91Foreign Direct Investment in Latin America and the Caribbean • 2020 Chapter II
These complex arrangements of global production have transformed the nature and pattern of international trade. In recent decades, regional and national export specialization patterns have increased and in some cases changed. In some developed economies, such as the United States and Japan, the share of medium- and high-technology manufactures in exports declined as a result of the relocation of part of manufacturing activities to emerging economies. Thus, in some developing countries the share of medium- and high-technology exports has increased. China stands out in this regard, as it rapidly moved from low-technology to medium- and high-technology manufacturing exports (see figure II.2).
Figure II.2 Exports of goods, by selected regions and countries and type of product, 1995–2018(Percentages)
0
10
20
30
40
50
60
70
80
90
100
1995 2018 1995 2018 1995 2018 1995 2018 1995 2018 1995 2018 1995 2018 1995 2018 1995 2018 1995 2018World South America Central America The Caribbean Mexico United States Germany Rep. of Korea China Japan
Intermediate-technology manufactures
Low-technology manufactures Natural-resource-based manufactures Primary commodities
Not classified High-technology manufactures
Source: Economic Commission for Latin America and the Caribbean (ECLAC), on the basis of the United Nations Commodity Trade Statistics Database (COMTRADE).
In this period there were significant changes in the international insertion of Latin America and the Caribbean. On the one hand, South America’s specialization in primary commodities and natural-resource-based manufactures deepened, with exports accounting for nearly 75% of the total (see figure II.2). Thus, minerals in the Plurinational State of Bolivia, Chile and Peru; hydrocarbons in Colombia, Ecuador and the Bolivarian Republic of Venezuela; and agricultural products in Argentina, Paraguay and Uruguay were consolidated as the main export categories. While Brazil is a major exporter of primary goods, its export basket is more diversified and includes manufactured products of varying technological intensity. In relation to the latter, Brazil and Argentina stand out in the manufacture and export of vehicles, a strongly intraregional area of trade.
Thanks to its proximity to the United States and low relative wages, Central America’s exports of manufactured goods (mainly low-technology products, such as clothing) increased and the relative importance of primary commodities declined (see figure II.2). With the signing of the North American Free Trade Agreement (NAFTA), Mexico became a very important link in the regional value chains of North America and progressively increased the technological intensity of its exports, mainly to the United States.

92 Economic Commission for Latin America and the Caribbean (ECLAC)Chapter II
In addition to changes in the composition of international trade, there was also a marked increase in terms of the amount. Between 1990 and 2018, gross exports of goods grew more than five times, with intermediate goods accounting for a relatively stable proportion of around 60% (see figures II.3 and II.4).
Figure II.3 Global goods exports, by category, 1990–2018(Trillions of dollars)
0
2
4
6
8
10
12
14
16
18
1990
1991
1992
1993
1994
1995
1996
1997
1998
1999
2000
2001
2002
2003
2004
2005
2006
2007
2008
2009
2010
2011
2012
2013
2014
2015
2016
2017
2018
Capital goodsIntermediate goods-Food
Intermediate goods-Industrial inputs
Intermediate goods-Fuel
Intermediate goods-Equipment parts
Final consumer goods
Source: Economic Commission for Latin America and the Caribbean (ECLAC), on the basis of the United Nations Commodity Trade Statistics Database (COMTRADE).
Figure II.4 Global goods exports, by category, 1990–2019(Percentages)
0
10
20
30
40
50
60
70
1990
1991
1992
1993
1994
1995
1996
1997
1998
1999
2000
2001
2002
2003
2004
2005
2006
2007
2008
2009
2010
2011
2012
2013
2014
2015
2016
2017
2018
2019
Intermediate goodsFinal consumer goodsCapital goods
Source: Economic Commission for Latin America and the Caribbean (ECLAC), on the basis of the United Nations Commodity Trade Statistics Database (COMTRADE).
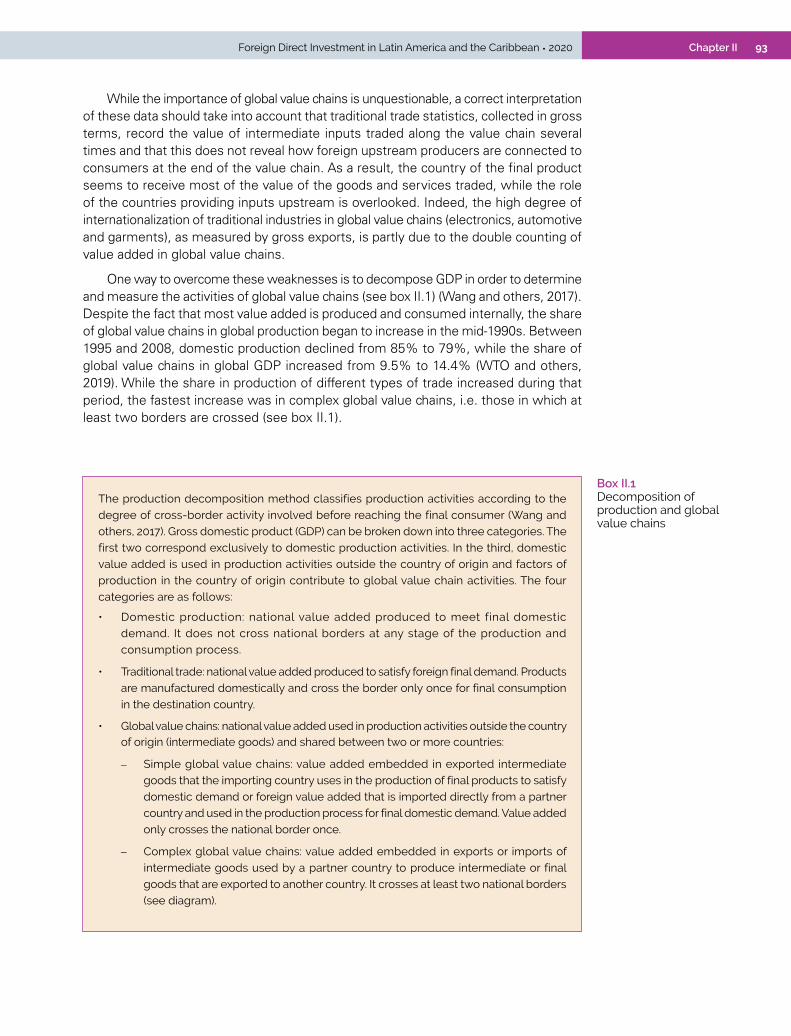
93Foreign Direct Investment in Latin America and the Caribbean • 2020 Chapter II
While the importance of global value chains is unquestionable, a correct interpretation of these data should take into account that traditional trade statistics, collected in gross terms, record the value of intermediate inputs traded along the value chain several times and that this does not reveal how foreign upstream producers are connected to consumers at the end of the value chain. As a result, the country of the final product seems to receive most of the value of the goods and services traded, while the role of the countries providing inputs upstream is overlooked. Indeed, the high degree of internationalization of traditional industries in global value chains (electronics, automotive and garments), as measured by gross exports, is partly due to the double counting of value added in global value chains.
One way to overcome these weaknesses is to decompose GDP in order to determine and measure the activities of global value chains (see box II.1) (Wang and others, 2017). Despite the fact that most value added is produced and consumed internally, the share of global value chains in global production began to increase in the mid-1990s. Between 1995 and 2008, domestic production declined from 85% to 79%, while the share of global value chains in global GDP increased from 9.5% to 14.4% (WTO and others, 2019). While the share in production of different types of trade increased during that period, the fastest increase was in complex global value chains, i.e. those in which at least two borders are crossed (see box II.1).
The production decomposition method classifies production activities according to the
degree of cross-border activity involved before reaching the final consumer (Wang and
others, 2017). Gross domestic product (GDP) can be broken down into three categories. The
first two correspond exclusively to domestic production activities. In the third, domestic
value added is used in production activities outside the country of origin and factors of
production in the country of origin contribute to global value chain activities. The four
categories are as follows:
• Domestic production: national value added produced to meet final domestic
demand. It does not cross national borders at any stage of the production and
consumption process.
• Traditional trade: national value added produced to satisfy foreign final demand. Products
are manufactured domestically and cross the border only once for final consumption
in the destination country.
• Global value chains: national value added used in production activities outside the country of origin (intermediate goods) and shared between two or more countries:
– Simple global value chains: value added embedded in exported intermediate
goods that the importing country uses in the production of final products to satisfy
domestic demand or foreign value added that is imported directly from a partner
country and used in the production process for final domestic demand. Value added
only crosses the national border once.
– Complex global value chains: value added embedded in exports or imports of
intermediate goods used by a partner country to produce intermediate or final
goods that are exported to another country. It crosses at least two national borders
(see diagram).
Box II.1 Decomposition of production and global value chains
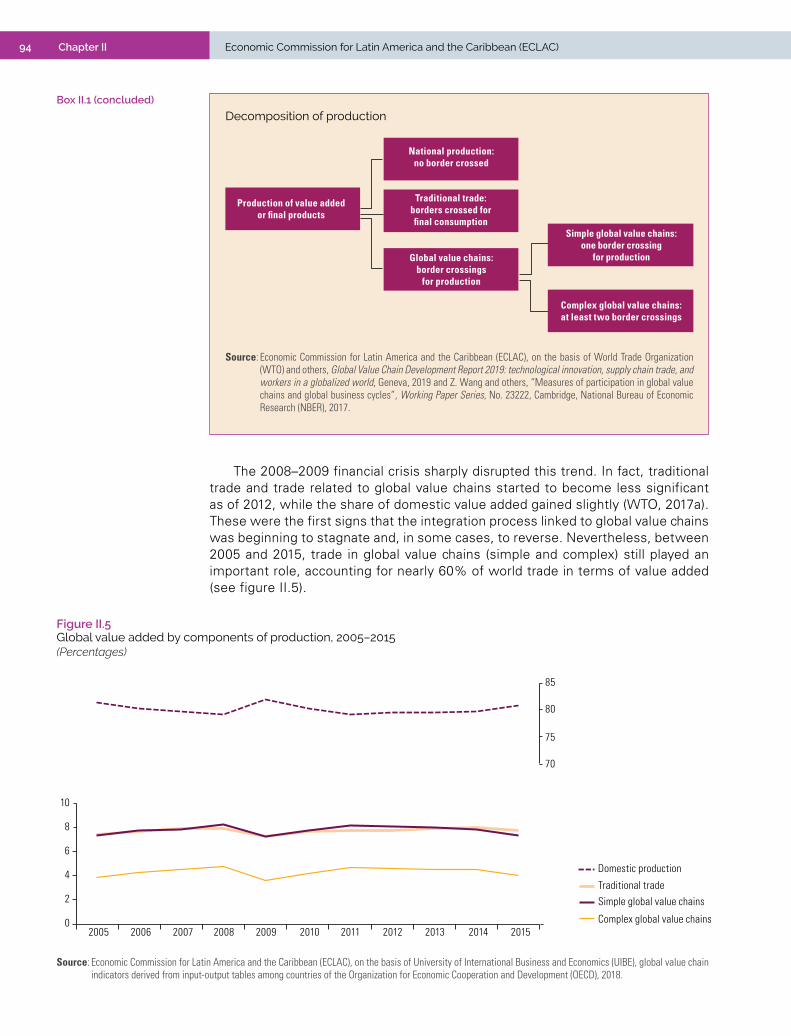
94 Economic Commission for Latin America and the Caribbean (ECLAC)Chapter II
Decomposition of production
Production of value added or final products
National production: no border crossed
Traditional trade: borders crossed for final consumption
Global value chains: border crossings
for production
Simple global value chains: one border crossing
for production
Complex global value chains: at least two border crossings
Source: Economic Commission for Latin America and the Caribbean (ECLAC), on the basis of World Trade Organization (WTO) and others, Global Value Chain Development Report 2019: technological innovation, supply chain trade, and workers in a globalized world, Geneva, 2019 and Z. Wang and others, “Measures of participation in global value chains and global business cycles”, Working Paper Series, No. 23222, Cambridge, National Bureau of Economic Research (NBER), 2017.
Box II.1 (concluded)
The 2008–2009 financial crisis sharply disrupted this trend. In fact, traditional trade and trade related to global value chains started to become less significant as of 2012, while the share of domestic value added gained slightly (WTO, 2017a). These were the first signs that the integration process linked to global value chains was beginning to stagnate and, in some cases, to reverse. Nevertheless, between 2005 and 2015, trade in global value chains (simple and complex) still played an important role, accounting for nearly 60% of world trade in terms of value added (see figure II.5).
Figure II.5 Global value added by components of production, 2005–2015(Percentages)
70
75
80
85
0
2
4
6
8
10
2005 2006 2007 2008 2009 2010 2011 2012 2013 2014 2015
Traditional tradeSimple global value chains
Complex global value chains
Domestic production
Source: Economic Commission for Latin America and the Caribbean (ECLAC), on the basis of University of International Business and Economics (UIBE), global value chain indicators derived from input-output tables among countries of the Organization for Economic Cooperation and Development (OECD), 2018.

95Foreign Direct Investment in Latin America and the Caribbean • 2020 Chapter II
From the mid-1990s until the financial crisis of 2008–2009, value added in global value chains grew faster than other components of GDP.4 This trend was especially pronounced after China joined the World Trade Organization (WTO) in 2001. Despite the fact that the different components of production recovered quickly after the crisis, the growth rate of all production activities fell sharply from 2012, with a very marked slowdown in the activities of global value chains, particularly in complex chains (see figure II.6). In this regard, it should be noted that the value added production of complex global value chains, which involves the crossing of at least two borders, mirrors changes in world trade. Indeed, when complex global value chain activities grow more slowly than domestic production activities, world trade increases at a slower pace than GDP (WTO and others, 2019).5 Thus, the stimulating effect of trade on global GDP seen in recent decades began to decline, a result directly related to the stagnation of cross-border investment.6 The situation was further complicated by trade tensions between the United States and its major trading partners, especially China, which introduced uncertainty into the global economic arena.
4 During this period, not only did the share of global value chains increase, but the growth rate of nominal value added was also very high in all components of production due to rapid real growth, moderate inflation and the appreciation of most currencies against the dollar (WTO, 2017a).
5 Some of these changes in GDP may be due to changes in commodity prices. Since the early 2000s, the prices of oil and other raw materials have passed through a super cycle of high prices. Due to the fact that these commodities are important intermediate inputs in global output, price fluctuations could have affected the relative nominal growth patterns of different types of value adding activities measured in current dollars (WTO and others, 2019).
6 Since the Second World War, the volume of world trade in goods tended to grow at about 1.5 times the rate of world GDP, although in the 1990s it grew at more than twice the rate. However, after the global financial crisis, the ratio of trade growth to GDP growth declined to about 1:1. In 2016, for the first time since 2001, that ratio fell below 1 (WTO, 2017b).
Figure II.6 Global annual growth rate of value added of components of production, 2006–2015(Percentages)
-30
-20
-10
0
10
20
30
2006 2007 2008 2009 2010 2011 2012 2013 2014 2015
Complex global value chains
Simple global value chainsDomestic productionTraditional trade
Source: Economic Commission for Latin America and the Caribbean (ECLAC), on the basis of University of International Business and Economics (UIBE), global value chain indicators derived from input-output tables among countries of the Organization for Economic Cooperation and Development (OECD), 2018.
To analyse differences in countries’ participation in foreign trade, it is necessary to assess how and to what extent they are inserted into global value chains. On the one hand, backward participation reflects the relationship between foreign value added (i.e. imported inputs) and the local value contained in exports. On
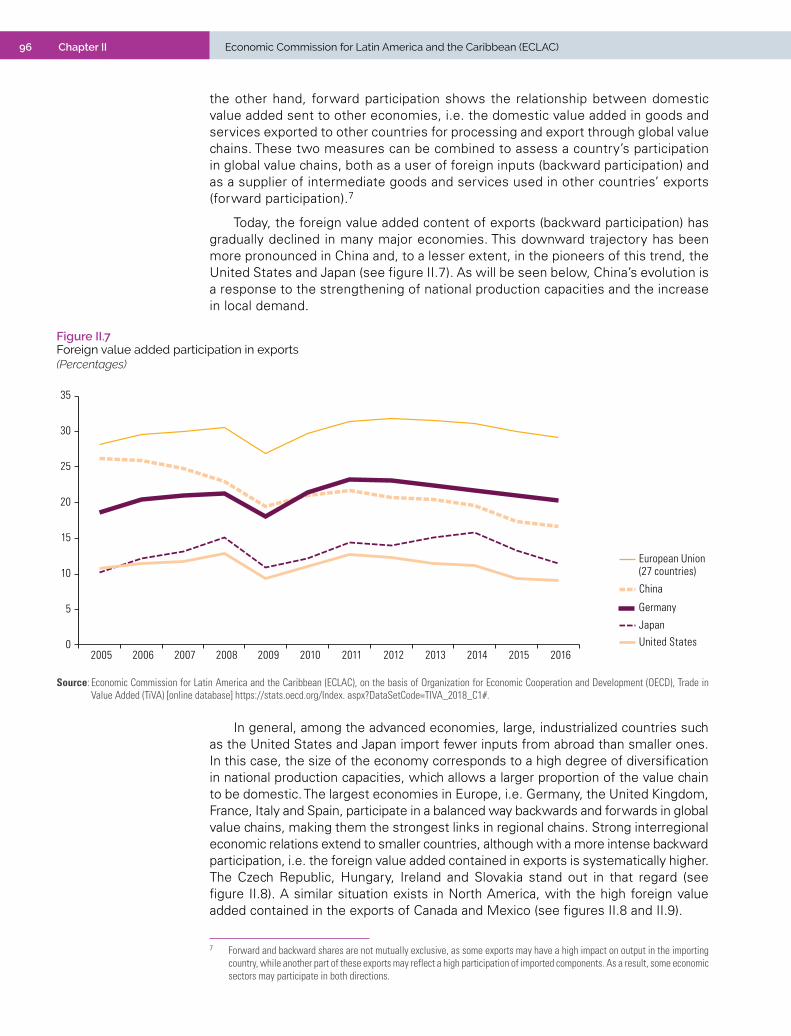
96 Economic Commission for Latin America and the Caribbean (ECLAC)Chapter II
the other hand, forward participation shows the relationship between domestic value added sent to other economies, i.e. the domestic value added in goods and services exported to other countries for processing and export through global value chains. These two measures can be combined to assess a country’s participation in global value chains, both as a user of foreign inputs (backward participation) and as a supplier of intermediate goods and services used in other countries’ exports (forward participation).7
Today, the foreign value added content of exports (backward participation) has gradually declined in many major economies. This downward trajectory has been more pronounced in China and, to a lesser extent, in the pioneers of this trend, the United States and Japan (see figure II.7). As will be seen below, China’s evolution is a response to the strengthening of national production capacities and the increase in local demand.
7 Forward and backward shares are not mutually exclusive, as some exports may have a high impact on output in the importing country, while another part of these exports may reflect a high participation of imported components. As a result, some economic sectors may participate in both directions.
Figure II.7 Foreign value added participation in exports (Percentages)
0
5
10
15
20
25
30
35
2005 2006 2007 2008 2009 2010 2011 2012 2013 2014 2015 2016
Japan United States
Germany
China
European Union (27 countries)
Source: Economic Commission for Latin America and the Caribbean (ECLAC), on the basis of Organization for Economic Cooperation and Development (OECD), Trade in Value Added (TiVA) [online database] https://stats.oecd.org/Index. aspx?DataSetCode=TIVA_2018_C1#.
In general, among the advanced economies, large, industrialized countries such as the United States and Japan import fewer inputs from abroad than smaller ones. In this case, the size of the economy corresponds to a high degree of diversification in national production capacities, which allows a larger proportion of the value chain to be domestic. The largest economies in Europe, i.e. Germany, the United Kingdom, France, Italy and Spain, participate in a balanced way backwards and forwards in global value chains, making them the strongest links in regional chains. Strong interregional economic relations extend to smaller countries, although with a more intense backward participation, i.e. the foreign value added contained in exports is systematically higher. The Czech Republic, Hungary, Ireland and Slovakia stand out in that regard (see figure II.8). A similar situation exists in North America, with the high foreign value added contained in the exports of Canada and Mexico (see figures II.8 and II.9).

97Foreign Direct Investment in Latin America and the Caribbean • 2020 Chapter II
Figure II.8 Index of participation in global value chains by value added, 2015(Percentages)
0
10
20
30
40
50
60
70
80
Luxe
mbo
urg
Slov
akia
Hung
ary
Czec
hia
Belg
ium
Irela
nd
Slov
enia
Esto
nia
Rep.
of K
orea
Pola
nd
Net
herla
nds
Aust
ria
Finl
and
Denm
ark
Lith
uani
a
Nor
way
Mex
ico
Port
ugal
Fran
ce
Swed
en
Germ
any
Chile
Suec
ia
Italy
Latv
ia
Spai
n
Unite
d Ki
ngdo
m
Icel
and
Gree
ce
Aust
ralia
Cana
da
Japa
n
Isra
el
Turk
ey
Unite
d St
ates
New
Zea
land
Forward participation Backward participation
Source: Economic Commission for Latin America and the Caribbean (ECLAC), on the basis of Organization for Economic Cooperation and Development (OECD), Trade in Value Added (TiVA) [online database] https://stats.oecd.org/Index. aspx?DataSetCode=TIVA_2018_C1#.
Note: Backward participation indicates the relationship between foreign value added (i.e. imported inputs) and the local value contained in exports. Forward participation reflects the relationship between national value added sent to other economies and total exports.
Figure II.9 Latin America and Asia (selected countries): index of participation in global value chains by value added, 2015(Percentages)
0
10
20
30
40
50
60
Mex
ico
Chile
Peru
Colo
mbi
a
Braz
il
Cost
a Ri
ca
Arge
ntin
a
Sing
apor
e
Mal
aysi
a
Viet
Nam
Rep.
of K
orea
Cam
bodi
a
Thai
land
Phili
ppin
es
Hong
Kon
g,Ch
ina
Indo
nesia
Chin
a
Indi
a
Forward participation
Backward participation
Source: Economic Commission for Latin America and the Caribbean (ECLAC), on the basis of Organization for Economic Cooperation and Development (OECD), Trade in Value Added (TiVA) [online database] https://stats.oecd.org/Index. aspx?DataSetCode=TIVA_2018_C1#.
Note: Backward participation indicates the relationship between foreign value added (i.e. imported inputs) and the local value contained in exports. Forward participation reflects the relationship between national value added sent to other economies and total exports.
98 Economic Commission for Latin America and the Caribbean (ECLAC)Chapter II
There are important differences among the emerging economies of Latin America and Asia in terms of integration into global value chains. In general, Asian countries have higher foreign value added in their exports than their Latin American peers. The large economies of both regions (Argentina, Brazil, to a lesser extent Mexico, China and India) have a smaller backward participation than the smaller economies in their respective regions. In Asia, those economies have been integrated into the regional economy which, as mentioned above, has grown significantly accentuated, with China as the main hub. On the other hand, the smaller Latin American countries, with the exception of Costa Rica, have a higher forward share, determined by the high proportion of raw materials in exports, low levels of industrialization and weak progress in economic integration (see figure II.9).
Latin American countries are mostly integrated into simple chain activities and forward linkages. Therefore, the region’s integration into global value chains has been mainly in the area of extraction and processing of raw materials. Mining is the most integrated sector in terms of forward participation, i.e., exports from this sector are incorporated into production processes in other countries for final consumption or re-export. On the other hand, the manufacturing sector has the highest levels of integration in complex chains and backward linkages. This suggests that this sector imports the most intermediate inputs, which are then used for the production of final goods for domestic consumption or re-export (see figure II.10).
Between 2005 and 2015, significant changes occurred in the manufacturing sector as regards integration into global value chains. In general, the value of backward linkage activities increased, which would imply greater integration at intermediate or final stages of the chain. In particular, backward linkages expanded significantly in the electrical equipment, vehicle and other transport equipment sectors. Forward linkages remain important in the basic metals and wood products sectors (see figure II.11).
Thus, Latin American countries export more domestic value added than they absorb when importing foreign factor content into value chains, due to integration into simple chains. At the same time, with the exception of Brazil, Costa Rica and Mexico, most countries are not integrated into production processes at the global level through intermediate goods processing. From a sectoral point of view, mining exports most of its domestic value added to other countries, mainly through simple chains. By contrast, manufacturing is the sector that absorbs the most inputs from other countries for the production of final goods or exports.
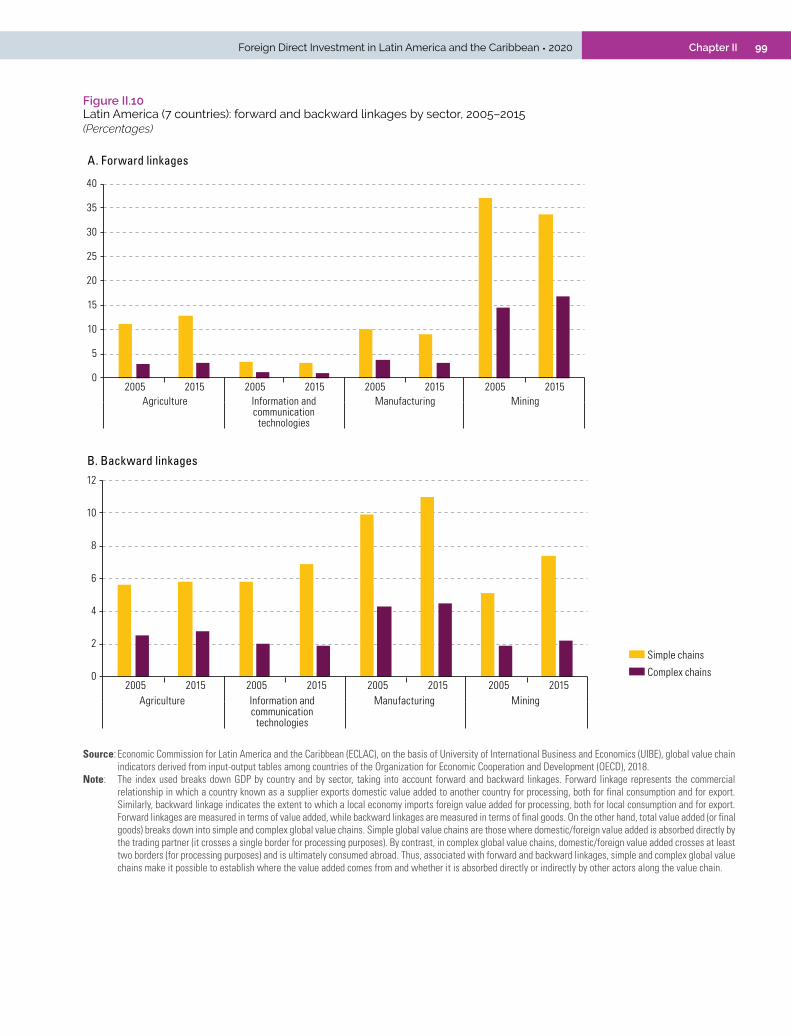
99Foreign Direct Investment in Latin America and the Caribbean • 2020 Chapter II
Figure II.10 Latin America (7 countries): forward and backward linkages by sector, 2005–2015(Percentages)
0
5
10
15
20
25
30
35
40
2005 2015 2005 2015 2005 2015 2005 2015Agriculture Information and
communication technologies
Manufacturing Mining
A. Forward linkages
Simple chains
Complex chains
0
2
4
6
8
10
12
2005 2015 2005 2015 2005 2015 2005 2015
B. Backward linkages
Agriculture Information and communication
technologies
Manufacturing Mining
Simple chains
Complex chains
Source: Economic Commission for Latin America and the Caribbean (ECLAC), on the basis of University of International Business and Economics (UIBE), global value chain indicators derived from input-output tables among countries of the Organization for Economic Cooperation and Development (OECD), 2018.
Note: The index used breaks down GDP by country and by sector, taking into account forward and backward linkages. Forward linkage represents the commercial relationship in which a country known as a supplier exports domestic value added to another country for processing, both for final consumption and for export. Similarly, backward linkage indicates the extent to which a local economy imports foreign value added for processing, both for local consumption and for export. Forward linkages are measured in terms of value added, while backward linkages are measured in terms of final goods. On the other hand, total value added (or final goods) breaks down into simple and complex global value chains. Simple global value chains are those where domestic/foreign value added is absorbed directly by the trading partner (it crosses a single border for processing purposes). By contrast, in complex global value chains, domestic/foreign value added crosses at least two borders (for processing purposes) and is ultimately consumed abroad. Thus, associated with forward and backward linkages, simple and complex global value chains make it possible to establish where the value added comes from and whether it is absorbed directly or indirectly by other actors along the value chain.
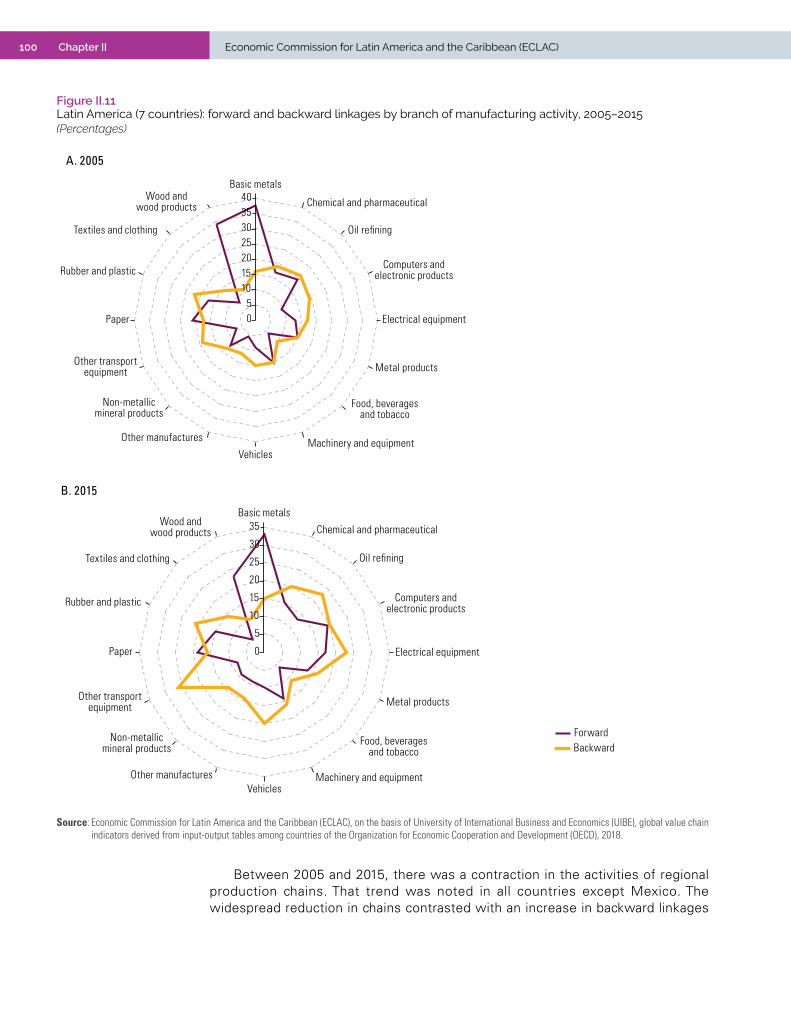
100 Economic Commission for Latin America and the Caribbean (ECLAC)Chapter II
Figure II.11 Latin America (7 countries): forward and backward linkages by branch of manufacturing activity, 2005–2015(Percentages)
05
10152025303540
Basic metals
Chemical and pharmaceutical
Oil refining
Computers andelectronic products
Electrical equipment
Metal products
Food, beveragesand tobacco
Machinery and equipmentVehicles
Other manufactures
Non-metallicmineral products
Other transportequipment
Paper
Rubber and plastic
Textiles and clothing
Wood andwood products
A. 2005
ForwardBackward
B. 2015
0
5
10
15
20
25
30
35Basic metals
Chemical and pharmaceutical
Oil refining
Computers andelectronic products
Electrical equipment
Metal products
Food, beveragesand tobacco
Machinery and equipmentVehicles
Other manufactures
Non-metallicmineral products
Other transportequipment
Paper
Rubber and plastic
Textiles and clothing
Wood andwood products
ForwardBackward
Source: Economic Commission for Latin America and the Caribbean (ECLAC), on the basis of University of International Business and Economics (UIBE), global value chain indicators derived from input-output tables among countries of the Organization for Economic Cooperation and Development (OECD), 2018.
Between 2005 and 2015, there was a contraction in the activities of regional production chains. That trend was noted in all countries except Mexico. The widespread reduction in chains contrasted with an increase in backward linkages

101Foreign Direct Investment in Latin America and the Caribbean • 2020 Chapter II
in all sectors, particularly in manufacturing activities. Thus, some economies in the region, especially those that have developed manufacturing sectors, experienced a weak process of productive specialisation.
More recently, some significant changes have taken place. First, global value chain activities recovered more quickly in high-income countries than in middle-income countries. Second, in high-income countries, participation in the global value chain increased more rapidly forwards than backwards. Especially in the manufacturing and services sectors, this meant a faster upgrade of production activities in the global value chain, as well as a deepening of specialisation. Third, some middle-income economies, such as Mexico, advanced more quickly in terms of backward participation.
At the same time, despite the slowdown in the activities of global value chains, the relationship structure has changed little and proved resilient to the various major external shocks it has had to face. Indeed, the loss of momentum in international production did not necessarily reduce interdependence between countries, as the use of intermediate inputs continued to increase in absolute terms (UNCTAD, 2020a and 2020b). Between 2000 and 2017, the three major regional supply hubs experienced little change, with the United States and Germany continuing to be the hubs for operations in North America and Europe, respectively. In Asia, however, China replaced Japan, becoming a global supply hub for value added in trade in final goods. In doing so, it significantly strengthened its ties with the United States, Germany and its Asian neighbours.
Three of the most globally integrated sectors (motor vehicles; manufacturing of computers, electronics and optical products; and textiles and clothing) showed a slowdown in interregional fragmentation and a strengthening of intraregional supply networks, with some differences in the three major global production hubs (see figure II.12). In East and South-East Asia, there was a small increase in intraregional value added supply. The manufacture of computers, electronics and optical products maintains a high content of intraregional value added in final demand (over 90%), as does textiles and clothing. In contrast, in North America and the European Union there was a marked decline in intraregional supply, particularly in the textiles and clothing sector. The automotive sector in the European Union has maintained the same level of internal supply since 2005.
Thus, the more complex the production chain, the higher the geographical concentration in the regional poles. In fact, the contribution of regional production in the automotive sector exceeds 70% in three of the four macroregions and is approximately 65% in North America. These percentages are much lower in the textile and clothing sector for North America and the European Union, while the computer, electronics and optical products sector achieves intermediate values. This is because in recent years regional trade agreements have made more progress than WTO negotiations in reducing transaction costs, including the tariff and non-tariff barriers involved in each border crossing. At the same time, regional trade agreements also follow rules of origin that are likely to promote complex global value chain activities.
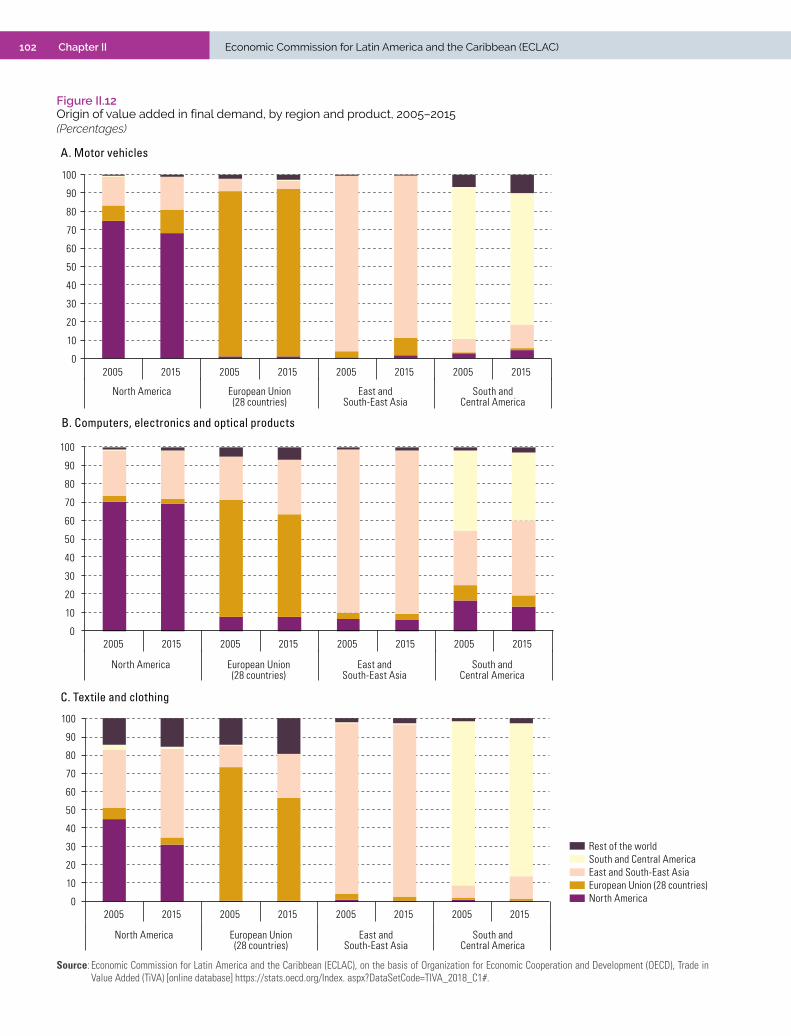
102 Economic Commission for Latin America and the Caribbean (ECLAC)Chapter II
Figure II.12 Origin of value added in final demand, by region and product, 2005–2015(Percentages)
0
10
20
30
40
50
60
70
80
90
100
2005 2015 2005 2015 2005 2015 2005 2015
North America European Union(28 countries)
East andSouth-East Asia
South andCentral America
North AmericaEuropean Union (28 countries)East and South-East AsiaSouth and Central AmericaRest of the world
A. Motor vehicles
0
10
20
30
40
50
60
70
80
90
100
2005 2015 2005 2015 2005 2015 2005 2015
B. Computers, electronics and optical products
North America European Union(28 countries)
East andSouth-East Asia
South andCentral America
North AmericaEuropean Union (28 countries)East and South-East AsiaSouth and Central AmericaRest of the world
0
10
20
30
40
50
60
70
80
90
100
2005 2015 2005 2015 2005 2015 2005 2015
C. Textile and clothing
North America European Union(28 countries)
East andSouth-East Asia
South andCentral America
North AmericaEuropean Union (28 countries)East and South-East AsiaSouth and Central AmericaRest of the world
Source: Economic Commission for Latin America and the Caribbean (ECLAC), on the basis of Organization for Economic Cooperation and Development (OECD), Trade in Value Added (TiVA) [online database] https://stats.oecd.org/Index. aspx?DataSetCode=TIVA_2018_C1#.

103Foreign Direct Investment in Latin America and the Caribbean • 2020 Chapter II
In short, in the last three decades the structure of the world economy changed significantly with the expansion of global value chains as a form of production organization. Between the early 1990s and the financial crisis of 2008–2009, the rapid expansion of global value chains resulted in a very considerable increase in exports and FDI. As a result of the strong relationship between trade and investment, a significant share of trade consists of trade between affiliates of the same transnational corporation and trade within supply chains coordinated by transnational corporations (UNCTAD, 2020a).
Global value chains have been essentially regional in nature around three production hubs led by the United States, Germany and, more recently, China. The most important changes were the emergence of China and its rapid output escalation that saw it evolve from a low-cost destination to a more technologically sophisticated export and import hub. As China’s importance increased, the interregional nature of global value chains weakened slightly with the increase in intraregional value added trade. Together with other factors, these changes in global balances, expressed in rising trade deficits (mainly of the United States with China), affected this form of organization of global production.
2. A production organization model under pressure
At the beginning of the 2010 decade, several structural factors began to slow the pace of expansion of global value chains. This resulted in a stagnation of international production and, thus, of exports and investment. Indeed, the decline of FDI in production capacity was a key factor in the trade slowdown (UNCTAD, 2020a). For every dollar of production in the world, there was less trade in intermediate goods and services, and it is worth noting that companies are reducing their use of foreign inputs (OECD, 2020b) (see figure II.13). Likewise, the process of fragmentation was unable to maintain the pace achieved in the previous decade either, since it depends on a balance between lower production costs and higher coordination costs.8 Thus, while the level of integration of global value chains remains high and only slightly lower than in 2005, after the 2008–2009 financial crisis, stagnation began to be seen in some chains, particularly in the automotive and electronics industries, which became shorter and less complex (De Backer and Miroudot, 2013). Indicators measuring the length of value chains confirm that they have shortened and that only the international part is affected by this trend (Miroudot and Nordström, 2019).
However, perhaps the most interesting element in this process has been the way in which the same factors that drove the growth of international production and global value chains began to exert pressure in the opposite direction. Those factors include advances in technology, which erode comparative advantages based on low costs; increased protectionism in certain key economies for the linkage of global value chains; changes in manufacturing driven by exports to the domestic market in China and the rise in wages in Asia.
8 By locating some production in low-cost countries, firms lower the marginal cost of production, but incur higher fixed and variable costs corresponding to the services needed to maintain production in various locations.
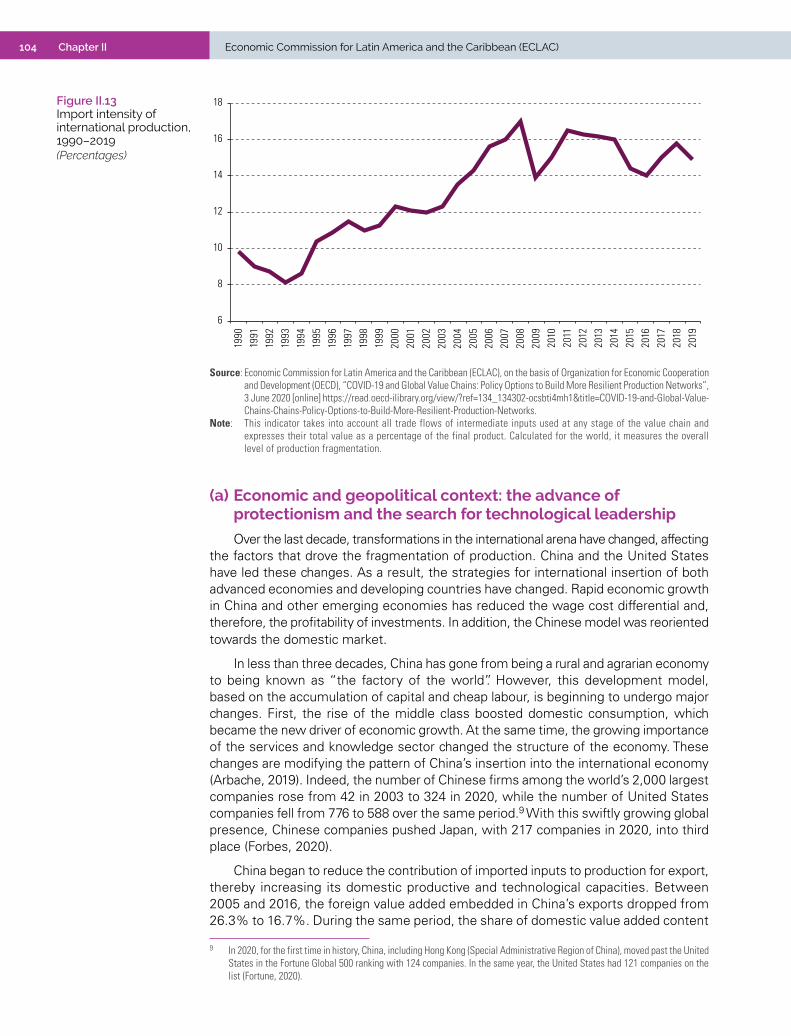
104 Economic Commission for Latin America and the Caribbean (ECLAC)Chapter II
6
8
10
12
14
16
18
1990
1991
1992
1993
1994
1995
1996
1997
1998
1999
2000
2001
2002
2003
2004
2005
2006
2007
2008
2009
2010
2011
2012
2013
2014
2015
2016
2017
2018
2019
Source: Economic Commission for Latin America and the Caribbean (ECLAC), on the basis of Organization for Economic Cooperation and Development (OECD), “COVID-19 and Global Value Chains: Policy Options to Build More Resilient Production Networks”, 3 June 2020 [online] https://read.oecd-ilibrary.org/view/?ref=134_134302-ocsbti4mh1&title=COVID-19-and-Global-Value-Chains-Chains-Policy-Options-to-Build-More-Resilient-Production-Networks.
Note: This indicator takes into account all trade flows of intermediate inputs used at any stage of the value chain and expresses their total value as a percentage of the final product. Calculated for the world, it measures the overall level of production fragmentation.
(a) Economic and geopolitical context: the advance of protectionism and the search for technological leadership
Over the last decade, transformations in the international arena have changed, affecting the factors that drove the fragmentation of production. China and the United States have led these changes. As a result, the strategies for international insertion of both advanced economies and developing countries have changed. Rapid economic growth in China and other emerging economies has reduced the wage cost differential and, therefore, the profitability of investments. In addition, the Chinese model was reoriented towards the domestic market.
In less than three decades, China has gone from being a rural and agrarian economy to being known as “the factory of the world”. However, this development model, based on the accumulation of capital and cheap labour, is beginning to undergo major changes. First, the rise of the middle class boosted domestic consumption, which became the new driver of economic growth. At the same time, the growing importance of the services and knowledge sector changed the structure of the economy. These changes are modifying the pattern of China’s insertion into the international economy (Arbache, 2019). Indeed, the number of Chinese firms among the world’s 2,000 largest companies rose from 42 in 2003 to 324 in 2020, while the number of United States companies fell from 776 to 588 over the same period.9 With this swiftly growing global presence, Chinese companies pushed Japan, with 217 companies in 2020, into third place (Forbes, 2020).
China began to reduce the contribution of imported inputs to production for export, thereby increasing its domestic productive and technological capacities. Between 2005 and 2016, the foreign value added embedded in China’s exports dropped from 26.3% to 16.7%. During the same period, the share of domestic value added content
9 In 2020, for the first time in history, China, including Hong Kong (Special Administrative Region of China), moved past the United States in the Fortune Global 500 ranking with 124 companies. In the same year, the United States had 121 companies on the list (Fortune, 2020).
Figure II.13 Import intensity of international production, 1990–2019(Percentages)

105Foreign Direct Investment in Latin America and the Caribbean • 2020 Chapter II
driven by foreign final demand fell from 23.6% to 15%, while the proportion of imported intermediate inputs incorporated into exports descended from 41.8% to 28%. This is indicative of a major shift in production from satisfying external final demand to domestic consumption and a significant effort at import substitution (see figure II.14). In addition, despite the fact that the United States is its largest trading partner, in gross and value added terms, the intensity of China’s integration with some of its neighbours (Viet Nam, Cambodia, Malaysia and Hong Kong Special Administrative Region of China) has increased substantially over the past decade (OECD, 2018b). The latter would suggest that China participates relatively less in global value chains, but is increasingly integrated into regional value chains in Asia, becoming the economic hub of the region.
Figure II.14 China: foreign value added in exports, 2005–2016(Percentages)
15
20
25
30
35
40
45
2005 2006 2007 2008 2009 2010 2011 2012 2013 2014 2015 2016
Foreign value added in exports
Imported intermediate inputsembedded in exports
Domestic value added drivenby foreign final demand
Source: Economic Commission for Latin America and the Caribbean (ECLAC), on the basis of Organization for Economic Cooperation and Development (OECD), Trade in Value Added (TiVA) [online database] https://stats.oecd.org/Index. aspx?DataSetCode=TIVA_2018_C1#.
China’s growing role in world production has generated, among other things, large trade deficits in manufactured goods with some of its major partners, particularly the United States (see figure II.15). The United States trade deficit in manufactured goods grew sharply in the late 1990s, accelerated after China joined the WTO, and widened in the wake of the global financial crisis. To a large extent, this strong increase is the result of the transfer of production capacities from other industrialized countries to China. Thus, as China became an increasingly important source of manufactured goods, the relative importance of the rest of the industrialized world overall declined because many companies in those economies moved their manufacturing and assembly facilities to China through FDI. Similarly, other emerging economies, most notably Mexico, have become increasingly integrated into global value chains over the past two decades and increased their share of the United States manufacturing trade deficit. This suggests that the development of several global value chains is one of the key drivers of the growing trade deficit of the United States with China in manufactured goods (WTO and others, 2019).
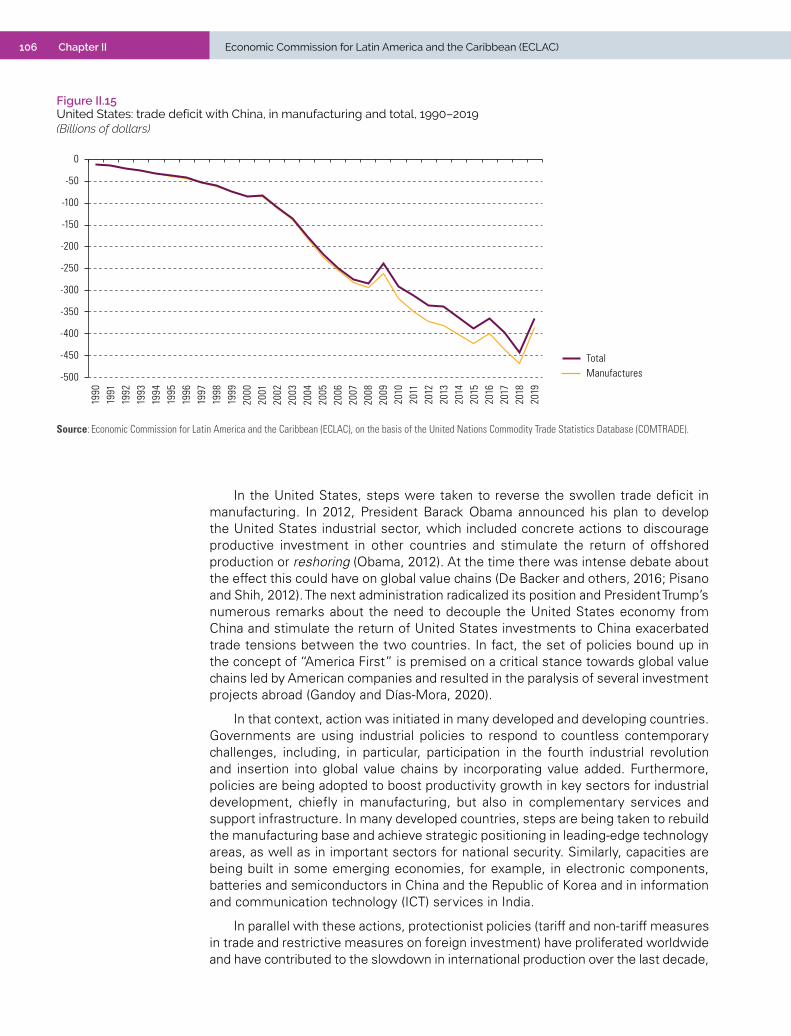
106 Economic Commission for Latin America and the Caribbean (ECLAC)Chapter II
Figure II.15 United States: trade deficit with China, in manufacturing and total, 1990–2019(Billions of dollars)
-500
-450
-400
-350
-300
-250
-200
-150
-100
-50
0
1990
1991
1992
1993
1994
1995
1996
1997
1998
1999
2000
2001
2002
2003
2004
2005
2006
2007
2008
2009
2010
2011
2012
2013
2014
2015
2016
2017
2018
2019
ManufacturesTotal
Source: Economic Commission for Latin America and the Caribbean (ECLAC), on the basis of the United Nations Commodity Trade Statistics Database (COMTRADE).
In the United States, steps were taken to reverse the swollen trade deficit in manufacturing. In 2012, President Barack Obama announced his plan to develop the United States industrial sector, which included concrete actions to discourage productive investment in other countries and stimulate the return of offshored production or reshoring (Obama, 2012). At the time there was intense debate about the effect this could have on global value chains (De Backer and others, 2016; Pisano and Shih, 2012). The next administration radicalized its position and President Trump’s numerous remarks about the need to decouple the United States economy from China and stimulate the return of United States investments to China exacerbated trade tensions between the two countries. In fact, the set of policies bound up in the concept of “America First” is premised on a critical stance towards global value chains led by American companies and resulted in the paralysis of several investment projects abroad (Gandoy and Días-Mora, 2020).
In that context, action was initiated in many developed and developing countries. Governments are using industrial policies to respond to countless contemporary challenges, including, in particular, participation in the fourth industrial revolution and insertion into global value chains by incorporating value added. Furthermore, policies are being adopted to boost productivity growth in key sectors for industrial development, chiefly in manufacturing, but also in complementary services and support infrastructure. In many developed countries, steps are being taken to rebuild the manufacturing base and achieve strategic positioning in leading-edge technology areas, as well as in important sectors for national security. Similarly, capacities are being built in some emerging economies, for example, in electronic components, batteries and semiconductors in China and the Republic of Korea and in information and communication technology (ICT) services in India.
In parallel with these actions, protectionist policies (tariff and non-tariff measures in trade and restrictive measures on foreign investment) have proliferated worldwide and have contributed to the slowdown in international production over the last decade,
107Foreign Direct Investment in Latin America and the Caribbean • 2020 Chapter II
although they have not yet succeeded in bringing about a major reconfiguration of global value chains. New investment restrictions often reflect concerns about national security and foreign ownership of high-tech companies, strategic assets, land and natural resources. However, there has been no significant increase in disinvestment levels, while return on investment to the country of origin (reshoring) remains only an emerging trend (UNCTAD, 2020a). Finally, while efforts to advance regional integration initiatives have intensified, this is at the expense of broader multilateral cooperation (UNCTAD, 2020b). December 2018 and July 2020 saw the entry into force of the Comprehensive and Progressive Agreement for Trans-Pacific Partnership (TIPAT) and the new Agreement between the United States of America, the United Mexican States, and Canada (USMCA), respectively, initiatives that could encourage greater regionalization of global value chains.
In the current health crisis, this process has been further accentuated. Some world leaders, such as the prime minister of Australia, Scott Morrison and the then-Prime Minster of Japan, Shinzo Abe, respectively, pointed to the need to reduce dependence on China, strengthen local production and avoid the negative effects of the fragility of global value chains (Strange, 2020; Hedwall, 2020). The French Government announced an 8 billion euro program to support the automotive industry, linking public support to the repatriation of production (BBC, 2020). Likewise, the European Commission unveiled a new industrial strategy in which it advocated a more balanced globalization and pointed out that reducing external dependence on goods and services was key to safeguarding technological and economic sovereignty (European Commission, 2020). Similarly, the Indian prime minister presented an economic stimulus plan and announced the beginning of a new era of economic self-sufficiency (RSIS, 2020).
(b) Technological disruption alters the weighting of costs
Technological changes are changing the way goods and services are produced and thus driving the fourth industrial revolution, the growth of trade in services, the widespread use of new forms of control over global value chains used by transnational corporations, the beginning of a large-scale digital transformation in supply chains, and the rapid positioning of a number of digital and technology companies among the world’s leading firms.10
The emergence of new technologies is generating profound changes in the international division of labour. The effects are complex, not unilateral and very different, depending on the production chain in question. The lowering of the costs of technologies that reduce the need for labour such as digitization, automation and additive manufacturing (3D printing) tends to cancel out the disadvantage in labour costs that the more industrialized countries have historically experienced, allowing processes of reshoring and of bringing production closer to the markets of these countries, or nearshoring (World Bank, 2020).
The forces driving the fourth industrial revolution are the use of digital technologies in production processes (digitization) and the use of machines to replace physical work (automation). While digitization and automation work synergistically to alter traditional production patterns, their impact on international production may differ and even go in opposite directions (UNCTAD, 2020a).
10 The operations of transnational corporations abroad have become increasingly intangible and less dependent on investment in fixed assets. Non-equity approaches have enabled transnational corporations to access foreign markets through contracts, rather than FDI, while still exercising a significant degree of control over operations.
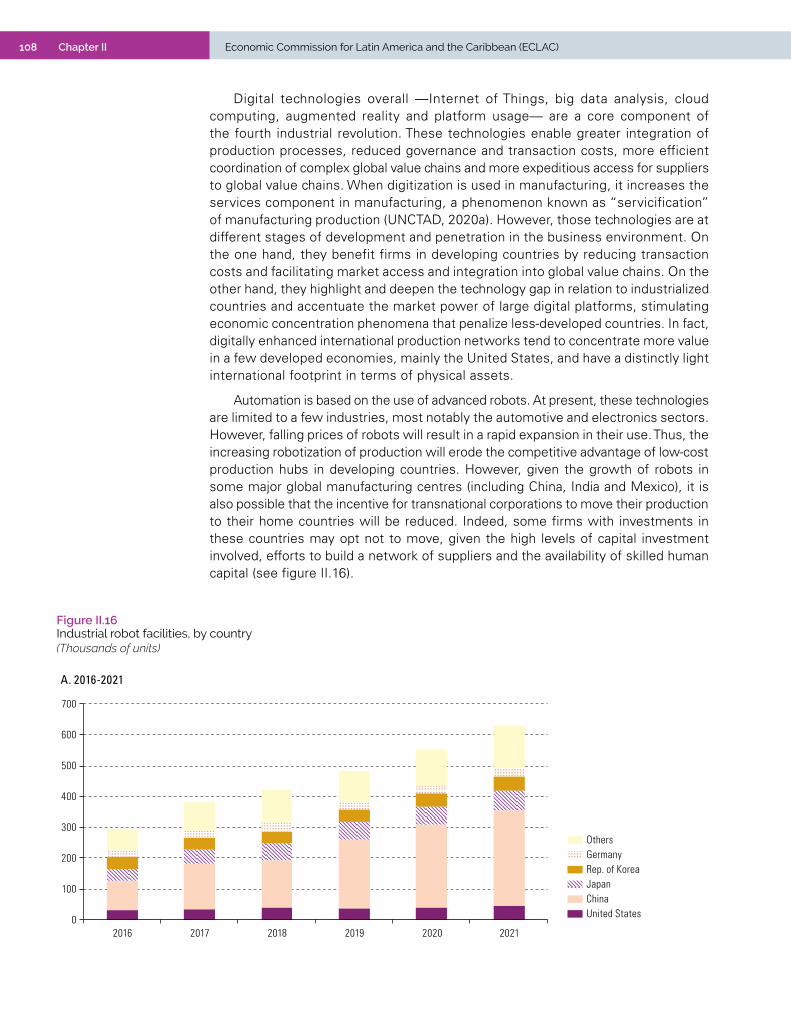
108 Economic Commission for Latin America and the Caribbean (ECLAC)Chapter II
Digital technologies overall —Internet of Things, big data analysis, cloud computing, augmented reality and platform usage— are a core component of the fourth industrial revolution. These technologies enable greater integration of production processes, reduced governance and transaction costs, more efficient coordination of complex global value chains and more expeditious access for suppliers to global value chains. When digitization is used in manufacturing, it increases the services component in manufacturing, a phenomenon known as “servicification” of manufacturing production (UNCTAD, 2020a). However, those technologies are at different stages of development and penetration in the business environment. On the one hand, they benefit firms in developing countries by reducing transaction costs and facilitating market access and integration into global value chains. On the other hand, they highlight and deepen the technology gap in relation to industrialized countries and accentuate the market power of large digital platforms, stimulating economic concentration phenomena that penalize less-developed countries. In fact, digitally enhanced international production networks tend to concentrate more value in a few developed economies, mainly the United States, and have a distinctly light international footprint in terms of physical assets.
Automation is based on the use of advanced robots. At present, these technologies are limited to a few industries, most notably the automotive and electronics sectors. However, falling prices of robots will result in a rapid expansion in their use. Thus, the increasing robotization of production will erode the competitive advantage of low-cost production hubs in developing countries. However, given the growth of robots in some major global manufacturing centres (including China, India and Mexico), it is also possible that the incentive for transnational corporations to move their production to their home countries will be reduced. Indeed, some firms with investments in these countries may opt not to move, given the high levels of capital investment involved, efforts to build a network of suppliers and the availability of skilled human capital (see figure II.16).
Figure II.16 Industrial robot facilities, by country(Thousands of units)
0
100
200
300
400
500
600
700
2016 2017 2018 2019 2020 2021
United StatesChinaJapanRep. of KoreaGermanyOthers
A. 2016-2021
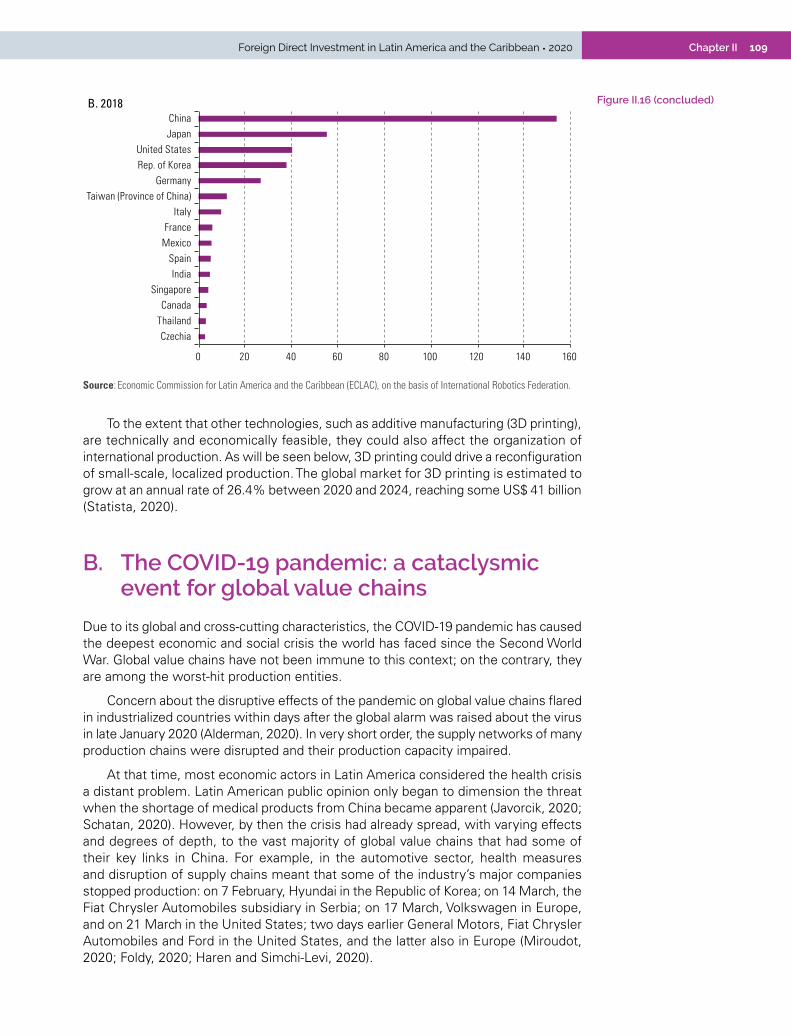
109Foreign Direct Investment in Latin America and the Caribbean • 2020 Chapter II
0 20 40 60 80 100 120 140 160
ChinaJapan
United StatesRep. of Korea
GermanyTaiwan (Province of China)
ItalyFrance
MexicoSpainIndia
SingaporeCanada
ThailandCzechia
B. 2018
Source: Economic Commission for Latin America and the Caribbean (ECLAC), on the basis of International Robotics Federation.
To the extent that other technologies, such as additive manufacturing (3D printing), are technically and economically feasible, they could also affect the organization of international production. As will be seen below, 3D printing could drive a reconfiguration of small-scale, localized production. The global market for 3D printing is estimated to grow at an annual rate of 26.4% between 2020 and 2024, reaching some US$ 41 billion (Statista, 2020).
B. The COVID-19 pandemic: a cataclysmic event for global value chains
Due to its global and cross-cutting characteristics, the COVID-19 pandemic has caused the deepest economic and social crisis the world has faced since the Second World War. Global value chains have not been immune to this context; on the contrary, they are among the worst-hit production entities.
Concern about the disruptive effects of the pandemic on global value chains flared in industrialized countries within days after the global alarm was raised about the virus in late January 2020 (Alderman, 2020). In very short order, the supply networks of many production chains were disrupted and their production capacity impaired.
At that time, most economic actors in Latin America considered the health crisis a distant problem. Latin American public opinion only began to dimension the threat when the shortage of medical products from China became apparent (Javorcik, 2020; Schatan, 2020). However, by then the crisis had already spread, with varying effects and degrees of depth, to the vast majority of global value chains that had some of their key links in China. For example, in the automotive sector, health measures and disruption of supply chains meant that some of the industry’s major companies stopped production: on 7 February, Hyundai in the Republic of Korea; on 14 March, the Fiat Chrysler Automobiles subsidiary in Serbia; on 17 March, Volkswagen in Europe, and on 21 March in the United States; two days earlier General Motors, Fiat Chrysler Automobiles and Ford in the United States, and the latter also in Europe (Miroudot, 2020; Foldy, 2020; Haren and Simchi-Levi, 2020).
Figure II.16 (concluded)

110 Economic Commission for Latin America and the Caribbean (ECLAC)Chapter II
According to a survey conducted at the beginning of the pandemic, approximately 75% of mostly United States businesses experienced disruptions in their supply chains. Fifty-seven per cent recorded delays in delivery times of components from their first-tier suppliers in China, which on average were more than double those of the same period in 2019. Also, more than half of the companies surveyed had difficulty obtaining information from links in their supply chain located in China (ISM, 2020a and 2020b). At the end of March, a new survey found that 95% of companies had been or would be affected by coronavirus disruptions in the supply chain (ISM, 2020c).
In the weeks and months that followed, the first episode of supply-side pressure due to restrictions on the movement of workers and inputs was compounded by the contraction in demand that hit the vast majority of the world’s production sectors in a widespread, if uneven manner, and which later spread to cross-border investments, which could register a reduction of between 30% and 40% in 2020–2021 (UNCTAD, 2020b).
1. Causes of COVID-19’s strong impact on global value chains
Although the COVID-19 is not the first external shock to judder international production in recent decades and was announced a few weeks in advance, it caused unprecedented upheaval in global value chains.11 Indeed, there is evidence that environmental and global economic changes are increasing the frequency and magnitude of such disruptive events. It is estimated that, on average, supply chain disruptions of one month or more in duration will occur every 3.7 years (McKinsey Global Institute, 2020). In the current health crisis, global value chains and their constituent companies have been affected via four main avenues:
• Direct effect on supply: the disease and the physical distancing measures adopted by governments to contain the pandemic affected the operation and production capacity of businesses. Although the direct effect is not specific to global value chains but to the places where the virus has spread, the current crisis has impacted most countries and companies around the world.
• Indirect effects on supply: The production capacity of firms has also been affected by supply chain disruptions, either because the raw materials or inputs they need are produced in locations affected by the pandemic, or because of the disruption (or increased costs) of international transport networks responsible for the delivery of the supplies needed.12
11 The severe acute respiratory syndrome (SARS) epidemic in 2002–2003, the volcanic eruption in Iceland in March 2010, the earthquake and tsunami in Japan in March 2011 and the flooding in Thailand in August 2011 (Haren and Simchi-Levi, 2020) are some examples. In 2017, Hurricane Harvey, a category 4 storm, struck the states of Texas and Louisiana, disrupting some of the largest oil refineries and petrochemical plants in the United States and creating shortages of key plastics and resins for a wide variety of industries (McKinsey Global Institute, 2020). In addition to natural disasters, global value chains have also been affected by economic and financial shocks, such as the 1997 Asian crisis, the 2001 dotcom crisis and the 2008–2009 international financial crisis.
12 International transport networks have also been affected during the current crisis, due to restrictions on the movement of people and additional requirements at borders for customs clearance, in addition to the direct impact on workers in the transport industry and national customs. The movement of goods involves many people (crews, pilots, port workers, etc.) and in the case of air transport, a significant part of air cargo was sent by passenger flights, many of which were cancelled (OECD, 2020b).

111Foreign Direct Investment in Latin America and the Caribbean • 2020 Chapter II
• Demand effect: the economic crisis, lockdown measures and changes in consumer behaviour reduced demand for many goods and services. While a small number of sectors, such as medical supplies, experienced an increase in demand for their products, others had to profoundly modify their business model to respond to qualitative changes in demand, in particular by incorporating digital technologies for marketing their products and services. Global value chains play an important role in transmitting economic shocks through demand channels. In fact, lower demand for final products in a given country reduces demand for inputs produced in other countries. This may lead to a simultaneous reduction in demand in many countries, as seen with the COVID-19 pandemic.
• Changes in the business climate and in trade and investment policy: there is widespread concern about the rapid transmission of the economic effects of the crisis. In this context, there is a resurgence of protectionist positions and restrictive measures on the export of essential goods (e.g. medical supplies), as well as explicit policies for the control of activities considered to be of strategic value. In addition, the great uncertainty about the trajectory and duration of the recovery spread dramatically among actors and markets, affecting cross-border investments, which have been drastically reduced.
Therefore, the transmission and depth of the crisis is explained by a combination of factors, including the configuration of the international economic system and, in particular, the role played (and still played) by China at the time of the shock caused by the pandemic.
(a) Idiosyncrasies of the COVID-19 crisis
There are two aspects of the current health crisis that explain the violent impact it has had on global value chains: the spread of the pandemic and its impact on people’s health and mobility. To find an event of the same magnitude —not a relatively limited epidemic, but a pandemic that has affected a significant part of the planet— we have to go back about 100 years when, following the First World War, the “Spanish flu” infected a third of the world’s population and claimed approximately 50 million lives (CDC, 2020). Unlike what happened in the 2008–2009 international financial crisis, when the impact was also global but exclusively economic and financial, in the current situation the worst affected have been human beings and their health. In this regard, the lockdown measures instituted by governments to deal with the pandemic and protect people’s lives –mainly restricting social interaction– have deeply affected the workings of the economy.13 At present, as there are no effective treatments yet, it is not possible to avoid the paralysis of economic activity (especially at the most acute moments of contagion), with the effects mentioned above.
(b) China and the organization of the global economy
The role that China has come to play in the world economy over the last 20 years is a key factor in explaining the intensity of the impact of the health crisis on global value chains. Between the 2002–2003 SARS epidemic and the current pandemic,
13 As a result of the spread of the virus, more than half of the world’s population has been subjected to some form of lockdown and containment measures (RTVE, 2020).

112 Economic Commission for Latin America and the Caribbean (ECLAC)Chapter II
China’s share of global GDP increased from 4.3% to 16%. In the same period, its share of world trade more than doubled, becoming the leader in areas such as consumer products and new technologies (the technology, media and telecommunications (TMT) industry) where it accounts for 41% and 60%, respectively, of world exports (Hedwall, 2020; Haren and Simchi-Levi, 2020; World Economic Forum, 2020a). As mentioned above, from the point of view of global value chains, this meant that China replaced Japan and became the main global export supply hub (WTO and others, 2019). Thus, the COVID-19 crisis exposed the high geographical concentration of production of certain critical supplies and the high levels of exposure of international production to systemic risks.
Many large companies in China that are strongly integrated with the rest of the world are located precisely in the 19 provinces worst affected by the pandemic. In fact, 51,000 companies (163 of which are on the Fortune 1000 list) around the world have one or more first-tier suppliers in those provinces, while some 5 million companies (938 of which are Fortune 1000) have one or more second-tier suppliers there. Moreover, nearly 49,000 companies in the worst-hit areas are subsidiaries of transnational corporations with headquarters in other countries, while 17,000 are located in Hubei province, ground zero of the pandemic (Dun and Bradstreet, 2020).
2. A crisis with an uneven impact
Despite being widespread and very profound, the economic impact of COVID-19 has not been homogeneous but differed greatly from sector to sector and country to country.
Recent surveys conducted around the world, especially in developed countries, offer fairly consistent results that provide clues to the different reactions of global value chains in a number of production sectors. In terms of large companies, the automotive industry was one of the most affected by the pandemic and, as mentioned above, suffered the disruptive effects on its supply and production chains. It is also among the sectors that consider themselves to have adapted less successfully to the situation brought on by the health crisis and that believe it more likely that facilities will close if the pandemic continues (World Economic Forum, 2020b). At the opposite end of the spectrum are the telecommunications and health industries. The former were most likely to use new-generation data and technologies to support their supply chains and that adapted best to the new scenario in terms of meeting the population’s health needs and countering the effects of physical distancing. The health industry deems it least likely to see facility closures in the event of a prolonged health crisis. The consumer goods industries were in an intermediate situation (World Economic Forum, 2020b).
In the current crisis, demand has plummeted for non-essential products and travel, which were affected on both the demand and the supply side. Labour-intensive global value chains, such as those for clothing, textiles and furniture, were hit hard by the pandemic. Conversely, while production in value chains in sectors such as agriculture and food and beverages was affected, demand remained high because of the essential nature of those products (McKinsey Global Institute, 2020) (see figure II.17).
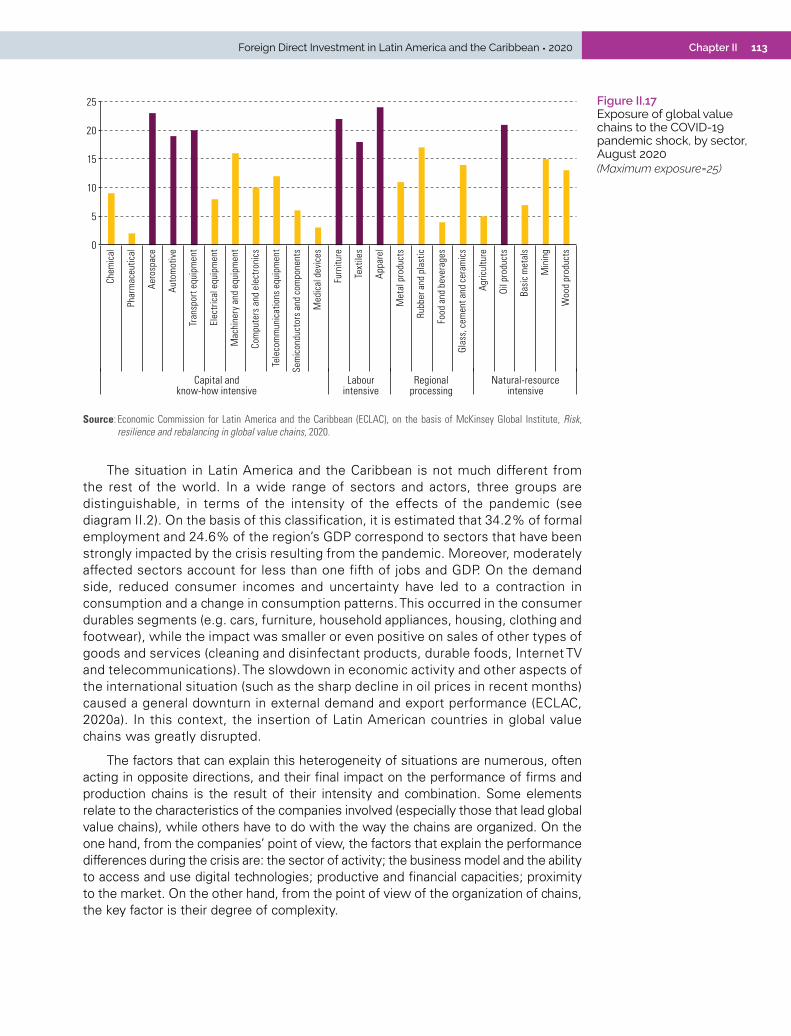
113Foreign Direct Investment in Latin America and the Caribbean • 2020 Chapter II
0
5
10
15
20
25Ch
emic
al
Phar
mac
eutic
al
Aero
spac
e
Auto
mot
ive
Tran
spor
t equ
ipm
ent
Elec
tric
al e
quip
men
t
Mac
hine
ry a
nd e
quip
men
t
Com
pute
rs a
nd e
lect
roni
cs
Tele
com
mun
icat
ions
equ
ipm
ent
Sem
icon
duct
ors
and
com
pone
nts
Med
ical
dev
ices
Furn
iture
Text
iles
Appa
rel
Met
al p
rodu
cts
Rubb
er a
nd p
last
ic
Food
and
bev
erag
es
Glas
s, c
emen
t and
cer
amic
s
Agric
ultu
re
Oil p
rodu
cts
Basi
c m
etal
s
Min
ing
Woo
d pr
oduc
ts
Capital andknow-how intensive
Labourintensive
Regionalprocessing
Natural-resourceintensive
Source: Economic Commission for Latin America and the Caribbean (ECLAC), on the basis of McKinsey Global Institute, Risk, resilience and rebalancing in global value chains, 2020.
The situation in Latin America and the Caribbean is not much different from the rest of the world. In a wide range of sectors and actors, three groups are distinguishable, in terms of the intensity of the effects of the pandemic (see diagram II.2). On the basis of this classification, it is estimated that 34.2% of formal employment and 24.6% of the region’s GDP correspond to sectors that have been strongly impacted by the crisis resulting from the pandemic. Moreover, moderately affected sectors account for less than one fifth of jobs and GDP. On the demand side, reduced consumer incomes and uncertainty have led to a contraction in consumption and a change in consumption patterns. This occurred in the consumer durables segments (e.g. cars, furniture, household appliances, housing, clothing and footwear), while the impact was smaller or even positive on sales of other types of goods and services (cleaning and disinfectant products, durable foods, Internet TV and telecommunications). The slowdown in economic activity and other aspects of the international situation (such as the sharp decline in oil prices in recent months) caused a general downturn in external demand and export performance (ECLAC, 2020a). In this context, the insertion of Latin American countries in global value chains was greatly disrupted.
The factors that can explain this heterogeneity of situations are numerous, often acting in opposite directions, and their final impact on the performance of firms and production chains is the result of their intensity and combination. Some elements relate to the characteristics of the companies involved (especially those that lead global value chains), while others have to do with the way the chains are organized. On the one hand, from the companies’ point of view, the factors that explain the performance differences during the crisis are: the sector of activity; the business model and the ability to access and use digital technologies; productive and financial capacities; proximity to the market. On the other hand, from the point of view of the organization of chains, the key factor is their degree of complexity.
Figure II.17 Exposure of global value chains to the COVID-19 pandemic shock, by sector, August 2020(Maximum exposure=25)

114 Economic Commission for Latin America and the Caribbean (ECLAC)Chapter II
• Tourism• Traditional cultural industry• Trade• Goods repair• Hotels and restaurants• Transport• Fashion• Automotive
• Mining• Electricity, gas and water• Construction and building materials• Business services• Financial activities• Beverages• Furniture and wood• Chemical industry• Electronics; machinery and equipment
• Agriculture, livestock and fishing• Food production for the domestic market• Medical supplies and equipment• Medicines• Telecommunications• Containers
Strong Significant Moderate
Source: Economic Commission for Latin America and the Caribbean (ECLAC), “Sectors and businesses facing COVID-19: emergency and reactivation”, COVID-19 Special Report, No. 4, 2 July 2020.
(a) Production sectors, business models and digital technologies
Free movement of people is fundamental to the operation of many production sectors, as their value proposition cannot be replaced with activities carried out remotely. This is the case for international logistics and transport chains, as well as tourism, where activities have been disrupted by the closure by national authorities of internal and international borders to contain the spread of the pandemic.
In a second group of production activities affected by the health crisis (in some cases dramatically), it was possible to alter the business model, either totally or partially. This involved creating new distribution channels (strengthening home delivery, as in the retail and catering sectors), reinventing the value proposition (companies organizing live shows or museums) and developing new digital products or services. Naturally, the development of these new business modalities requires knowledge and resources to learn, adapt and incorporate new technologies –particularly digital ones– and management capacities to implement initiatives that in many respects are completely new.
This array of factors depends not only on the individual characteristics of companies, but also on those of the production system in which they operate. In particular, the quality of the available infrastructure and the existence of a supporting institutional framework that stimulates innovation and encourages the process of incorporating new technologies, adapting the business model and transforming customer and supplier relations can make the difference in firms’ response to a major shock such as the current pandemic. With regard to digital infrastructure, it is important to note that, although the average level of broadband access has increased considerably in Latin America and the Caribbean, disparities between countries and even between urban and rural areas within countries remain significant (see figure II.18)
These differences are even greater in terms of penetration of digital technologies in the production processes of companies. At present, Latin American companies have a high level of Internet connectedness. However, only a very small proportion of them use the Internet in their supply chains and distribution channels (see table II.1) (CAF and others, 2020).
Diagram II.2 Latin America and the Caribbean: different levels of impact of the COVID-19 pandemic on production sectors, July 2020

115Foreign Direct Investment in Latin America and the Caribbean • 2020 Chapter II
Figure II.18 Latin America (11 countries): Internet users in urban and rural areas, 2018(Percentages of the total population of each area)
Dom
inic
an R
ep.
Boliv
ia(P
lur.
Stat
e of
)
Urban areaRural area0
10
20
30
40
50
60
70
80
90
Urug
uay
Cost
a Ri
ca
Chile
Colo
mbi
a
Mex
ico
Braz
il
Ecua
dor
Peru
El S
alva
dor
Source: Economic Commission for Latin America and the Caribbean (ECLAC), Regional Broadband Observatory (ORBA).
Table II.1 Latin America (8 countries): business digitization, 2018(Percentages)
Companies connected to the Internet
Companies using e-banking
Companies using the Internet for input
procurementCompanies with
a websiteCompanies with digital
sales channels
Argentina 94.9 79’6 45.8 63.6 18.5Brazil 96.4 88.0 66.0 59.5 22.0Chile 86.2 84.4 28.8 78.8 10.6Colombia 92.8 95.4 37.0 67.2 38.0Ecuador 93.9 47.1 13.9 … 9.2Mexico 94.6 76.6 13.5 49.8 8.7Peru 94.0 34.2 15.2 … 7.2Uruguay 93.4 68.4 38.4 52.8 35.4
Source: Economic Commission for Latin America and the Caribbean (ECLAC), on the basis of Telecom Advisory Services.Note: The differences between countries are mainly due to the degree of inclusion of small and medium-sized enterprises (SMEs) in the sample. The information for some
countries has been estimated based on the correlation of this level with the level of Internet adoption.
From the point of view of strategies and support institutions, the most main are in the advancement of policies and the solidity of the entities that support the penetration of digital technologies in firms. In Latin America and the Caribbean, especially in microenterprises and SMEs, awareness and training measures predominate, while there is a shortage of programmes to support the digital transformation of business models and the incorporation and application of new digital technologies in production chains (Heredia, 2020).
(b) Company size
Throughout the world, smaller companies have been most exposed to the ravages of the pandemic. In Latin America and the Caribbean, an estimated 2.7 million formal businesses, the vast majority of which are micro, small and medium-sized enterprises,

116 Economic Commission for Latin America and the Caribbean (ECLAC)Chapter II
could close between June and December 2020 (ECLAC, 2020a). Firstly, this relative weakness is due to the fact that, owing to their small size, they lack the necessary liquidity to meet their obligations in the event of business interruptions. For the same reason, they do not have the inventory necessary to support possible supply chain imbalances. Secondly, despite being human resource intensive, they generally do not have permanent resources and procedures for staff training and development, which limits their capacity to adapt to change. Last but not least, a very significant percentage of these companies operate in service sectors particularly affected by the restrictions imposed by health authorities, such as tourism, restaurants and hotels, personal services and retail trade.
In general, the companies that lead the production chains are not small. However, even where they are well above the SME threshold, if the companies exercising this leadership are relatively small, the problems described above arise and are transmitted to the chain concerned. Such difficulties have come about, for example, in many European industrial districts, where leader companies have a turnover of a few tens of millions of dollars.14 Large companies also face significant difficulties in disruptive scenarios. For example, companies with sales of less than $10 billion rate their response to the crisis worse than larger companies because they do not have the same technological tools to manage the supply network and because they have less capacity to negotiate with suppliers and sources of financing, especially to ensure the supply of scarce products (World Economic Forum, 2020b).
(c) Complexity of global value chains
The high fragmentation of production processes increased the complexity of global value chains and, with it, management costs. The production of the iPhone or the Airbus A380 aircraft are prime examples of this phenomenon: 200 companies in 43 countries are involved in the manufacture of the iPhone, while the Airbus A380 requires more than 4 million parts manufactured by 1,500 suppliers located in 30 countries around the world (World Economic Forum, 2019; ECLAC, 2018b).
The configuration of international production is based on a model whose main objective is to increase efficiency. The calculation that shapes global value chains includes several elements. First, it seeks to minimize the costs of labour, transportation of parts and assembly, among other elements. Secondly, production facilities should be close to the consumers of the final products. As mentioned above, the rise and increasing purchasing power of a huge middle class in China further strengthen that country as a major destination of FDI linked to global value chains. These two factors combine to make China the key link in the global value chain. However, these elements must be combined with appropriate risk management (e.g. those associated with the exchange rate or delays in delivery of key components). In global value chains these risks are managed with insurance, storage of key components and supplier diversification.
Obviously, although it is possible to manage a complex chain efficiently, to achieve that it is necessary to have appropriate tools, skills and resources. In this regard, the most advanced companies have adopted control units that allow them to monitor flows of inputs in real time and anticipate interruptions in the supply chain (OECD, 2020b). However, these practices are not yet widespread among leader companies in global
14 In the case of Italy, see, for example, Bricco (2020) and Marro (2020).

117Foreign Direct Investment in Latin America and the Caribbean • 2020 Chapter II
value chains. In fact, it is estimated that most transnational corporations do not have a clear idea of their actual exposure to risk (Haren and Simchi-Levi, 2020). Under these conditions, complexity becomes a disadvantage that may explain to some extent the mixed performance of global chains in the crisis.
3. How to regain control and ensure the stability of global value chains?
The pandemic highlighted the weaknesses of an international production system based on efficiency-seeking strategies. As mentioned above, hyperfragmentation has allowed static (mainly labour cost) and dynamic (specialization by production phase) advantages to be exploited, but it has also generated morally questionable and unsustainable working conditions and increased the difficulties of managing the operation as a whole.15 It is in relation to the last that the crisis has exposed the greatest weaknesses: the violent external shock has led many leader companies to the realization that they do not have control over the global production process and that they do not even know the exact state of their suppliers, particularly those at the second and third tiers (McKinsey Global Institute, 2020). In this context, a debate has emerged on how to take back control of this process and ensure its integrity in an uncertain future, with disruptive events becoming more and more frequent (Javorcik, 2020; Miroudot, 2020; World Economic Forum, 2020c; UNCTAD, 2020b).
As expected, there has been no consensus on possible paths. Complex systems, such as global value chains, composed of a large number of firms in different sectors and countries, are subject to too many potentially disruptive factors to assume that there is an effective, one-size-fits-all answer. However, the current debate focuses on three concepts that help clarify the challenges facing leader companies in global value chains: complexity (mentioned in the previous section), resilience and robustness.
(a) Resilience or robustness?
The words resilience and robustness are often used synonymously. However, although both concepts allude to increased security of global value chains against external shocks, they embody two distinct and somewhat incompatible strategies. In the field of international production, these concepts can be defined as follows (Miroudot, 2020):
• Resilience is the ability of a global value chain to return to normal, within an acceptable time, after an external shock has caused its activity to be interrupted.
• Robustness is the ability of a global value chain to sustain operations during a crisis, in spite of external shocks.
Companies can develop these capacities or risk management strategies by means of measures to modify the productive organization of the global value chain. Some of
15 The international network of experts “Capturing the Gains” has shown that working conditions are not only determined by national rules and laws regulating the labour market, but also by the standards and requirements set by the large foreign buyers that make up the production chains and by the supervision and control systems that they implement. In this context, it has been found that improved working conditions, employment protection and workers’ rights (also referred to as social improvement) are not an inevitable result of the economic development of value chains. Evidence suggests a possible correspondence between improved economic performance and the worsening of working conditions (Barrientos, Gereffi and Rossi, 2010).

118 Economic Commission for Latin America and the Caribbean (ECLAC)Chapter II
these measures are valid for both strategies, but there are also diverging decisions that force a choice between one path or the other.
The robustness option requires substantial investment to expand the assets or productive capacities of the leader company (or its strategic suppliers). This path is justified if the companies that promote it (or their strategic suppliers) operate in areas that would be seriously affected by the interruption of the supply of inputs or raw materials and the stoppage of production processes. This is the case for companies that supply essential goods (such as key medical supplies, pharmaceuticals or food) and companies whose production processes cannot be easily restarted once they are stopped (e.g. furnaces in the steel industry or nuclear reactors in the energy industry). These companies will spend more resources to mitigate risks and ensure continued security of supply and this will be reflected in their supply strategies.16 Resilience, on the other hand, is a strategy best suited to companies that do not have sufficient financial resources for large investments in the area of security and that operate in more technologically flexible sectors.
As mentioned, some measures that strengthen the robustness of a global value chain also increase its resilience. Among the most important are the following:
(i) Obtain clear, complete and timely information (in real time) on the status of all companies connected to the network: availability of inventories, financial liquidity, state of the workforce, etc. (Miroudot, 2020; World Economic Forum, 2020b, 2020c; Liao and Fan, 2020; RSIS, 2020). Chain visibility is a critical attribute for any global value chain. It is also important to have information about the context in which they operate in order to know, for example, possible weaknesses in external logistics or the political and institutional framework that shapes the environment. The more complete this mapping is, the more feasible it will be to determine in a timely manner the points at which a possible external shock would produce most damage, in order to develop responses that would allow the productive activity to be restored to its initial state (resilience) or the shock to be absorbed without interrupting operations (robustness).
(ii) Establish governance mechanisms that enable the leader firm to organize the necessary adjustments along the global value chain. Such mechanisms may provide for varying degrees of participation and empowerment of providers (especially first-tier providers) but always require clear and known communication protocols between parties.
(iii) Use digital technologies for effective control of global value chains. Evidence shows that the companies that have had the best capacity to adapt to the crisis are precisely those that have digital technologies and use them efficiently to generate a new value proposition and adjust their business model (World Economic Forum, 2020a, 2020c). At the same time, these technologies are key to managing the global value chain more efficiently and flexibly. The wider and more complex the supply network, the more essential digital technologies are for the development of control systems that enable informed decisions to be made in narrow timeframes and turbulent contexts. A survey revealed that during the health crisis 85% of companies have experienced problems with digital technologies in their supply chains. In
16 As will be seen below, robust global value chains require a degree of supplier redundancy. Dependence on a single supplier creates risks of disruption, so these companies must have a range of alternative suppliers for each of their inputs (OECD, 2020b).
119Foreign Direct Investment in Latin America and the Caribbean • 2020 Chapter II
the same survey half of the respondents were able successfully to manage the supply chain through teleworking, while the other half experienced a reduction in the speed of decision-making with telework (Knut, Gupta and Trautwein, 2020).
(iv) Prepare the staff of companies in order to develop adaptive strategies to contend with unforeseen crises. In order to have teams with a strong propensity for change and innovation and strong skills in the use of new technologies, especially digital ones, many companies have invested (or expressed interest in investing) in building these skills, through training for permanent staff and recruitment of new professionals (World Economic Forum, 2020b; Knut, Gupta and Trautwein, 2020).
(v) Make a selection of suppliers. Recent disruptive events, particularly the health crisis, have made clear that in addition to the variables traditionally used by purchasing companies to select their suppliers (price, delivery time and compliance with standards) there is a need to incorporate safety variables that, in parallel with other conditions, evaluate the stability of supply. From that point of view, the elements to be weighed are not only the individual characteristics of the suppliers (e.g. communication system, inventory management modalities and installed technologies), but also the characteristics of the environment and, in particular, the quality of the production infrastructure and the institutional context in which those suppliers operate (Jain, Girotra and Netessine, 2016).
These five lines of action help to strengthen the security of global value chains by enhancing both the resilience and the robustness of the system. Other lines of action, by contrast, lead to diverging paths. The two main actions that help to increase the robustness of a company and its supply chain are to increase inventories and redundancy and to diversify the geographical origin of suppliers. However, these measures are not in line with a strategy, such as resilience, that seeks to ensure continuity of operations by limiting investments in security:
• Increased inventories extend a company’s autonomy in the event of an interruption in the supply chain. In fact, disruptive events in recent years have led companies to increase their inventories (Haren and Simchi-Levi, 2020). However, on average their range is only between 15 and 30 days of operation (Ivanov, 2020).
• Redundancy and geographical diversification of suppliers, on the other hand, allows the leader company in the global value chain to maintain the necessary supply in the event of an unexpected event that compromises the operation of suppliers in a given location. In this case, the leader firm can, within a relatively short time, reassign orders for inputs normally supplied by firms experiencing difficulty among other suppliers in its network. The cost implicit in this decision is the renunciation of economies of scale that it could obtain by concentrating orders in a few larger production units. There is evidence that geographical diversification of suppliers is taking place in China for reasons of cost, security or long-term stability. As China progresses, creates greater domestic capacities and increases wages, several companies with a high concentration of interests in the country are looking for new alternatives for offshoring to other South-East Asian economies. Without

120 Economic Commission for Latin America and the Caribbean (ECLAC)Chapter II
abandoning the capacities built in China, they have started new operations in Viet Nam, Indonesia, Malaysia, Thailand and the Philippines, taking advantage of lower costs while also protecting themselves from potential impacts of trade tensions between China and the United States. This strategy is known as “China Plus One”.
The path to building resilience is different (and to some extent opposite): rather than increasing the number of suppliers, the focus is on strengthening and deepening collaborative relationships with selected suppliers. While supplier redundancy is useful for recovering from external shocks (i.e., it is also useful for increasing resilience), there is some empirical evidence that greater advantages are achieved (in terms of resilience) when the number of suppliers is limited and the leader company develops a stable, long-term relationship of trust with them (Jain, Girotra and Netessine, 2016).17
Developing relationships based on mutual trust between customers and suppliers is not always feasible. It is particularly difficult in chains where customers impose very low margins on suppliers, as is the case, for example, in the global automotive value chain. Due to strong pressure from vehicle manufacturers to reduce prices, smaller suppliers operate with very low margins that undermine any possibility of implementing their own resilience ( World Economic Forum, 2020b).18 However, there is evidence that configuring collaborative systems is feasible. Indeed, many companies have made significant investments to help their suppliers overcome the crisis as quickly as possible (see figure II.19).
17 This system of relationships can give rise to a model of collaboration that has been termed strategic outsourcing, in which the leader company delegates important functions to suppliers and configures with them the development of its competitive strategies (Mauri, 1999).
18 Original equipment manufacturers (OEM).
Figure II.19 Actions taken by leader companies of global value chains to mitigate the short-term effects of the COVID-19 crisis on their suppliers, July 2020(Percentages)
53
49
46
40
1
0 10 20 30 40 50 60
Support suppliers with risk analyses for certain components
Purchase guarantee for supplier
Advance payment to alleviate pressure/facilitate
production upstream
Premium payment to compensate for additional precautions
imposed on suppliers
No actions to mitigate immediate impact on suppliers
Source: Economic Commission for Latin America and the Caribbean (ECLAC), on the basis of World Economic Forum, “Building resilience in manufacturing and supply systems in the COVID-19 context and beyond: Latin America perspectives”, Regional Insight, Geneva, July 2020.
On the basis of these elements, it seems necessary to move towards a new model of cooperation by which to face increasingly turbulent scenarios. Through a joint effort by companies and public institutions, it is possible to generate a business climate that allows the deployment of skills, technologies and resources appropriate to these challenges.
121Foreign Direct Investment in Latin America and the Caribbean • 2020 Chapter II
In regions such as Latin America and the Caribbean, where production systems are less developed and public institutions weaker, this collaborative strategy should be promoted within a strategic framework of regional integration. Collaboration between countries would make it possible to complement national strategies and use resources more efficiently, increase the negotiating capacity of regional actors with their public and private peers in other latitudes, and facilitate the achievement of appropriate scales for investment in research and technological development projects that no single country could promote alone (World Economic Forum, 2020b; ECLAC, 2020 b).
(b) Ways to reduce complexity
Finally, there seems to be a trade-off between security and the complexity of global value chains (Strange, 2020; RSIS, 2020; World Economic Forum, 2020c; Miroudot, 2020).
The complexity of a supply network is the result of the number and variety of suppliers in it. If complexity grows too great, the leader company may lose control of the supply chain, as indeed happened in many global chains during the pandemic. To prevent this from happening, the company has to adapt the system it uses to manage supplier relations, which may involve significant investment. This system basically consists of a set of actions and procedures that allow the generation and analysis of necessary, timely information to make consistent decisions throughout the chain and ensure smooth communication with strategic suppliers. The more numerous and dispersed the companies connected to the supply network (i.e. the greater the complexity of the network), the more complex the information protocols, data analysis and verification, and coordination mechanisms, among other aspects, will be. These are particularly necessary and pivotal in the event of a crisis, because they make it possible to adjust the system and create conditions that prevent its breakdown (robustness of the chain) or stimulate a rapid recovery (resilience). The risk of external events that may harm the normal functioning of a production system (such as a global value chain) has increased and, whatever security strategy is adopted (resilience or robustness), it is increasingly necessary to develop preventive strategies based on a mapping of the critical points of the production system and an estimation of the risks to the production activity from possible direct shocks (that impact the capacity of the leader company) or indirect shocks (that affect its suppliers).19
In light of the above, the need to know and analyse the effects of complexity is evident. First, it is necessary to assess whether the degree of complexity attained by the production chain is strictly necessary. The growth of the supply network (and therefore of its complexity) may respond to strategies that aim, as mentioned above, at enhancing the robustness of the chain through redundancy and diversification of suppliers or at seeking greater efficiency. In other cases, however, it may be necessary to review the decisions that have driven this diversification. Sometimes the increase in complexity is the result of diversification of the product portfolio which, while trying to respond to variations in demand in changing markets, generates a return that does not justify such an option. The solution in such cases is a rigorous product focus and meticulous standardization of parts and processes (Miroudot, 2020; World Economic Forum, 2020b).
19 Ivanov distinguishes between operational risks and disruptive risks (Ivanov, 2020). This section focuses on the latter.
122 Economic Commission for Latin America and the Caribbean (ECLAC)Chapter II
Secondly, while robustness requires a degree of geographical diversification, it is also possible to make this strategy compatible with a certain spatial concentration of suppliers. If the chain is oriented exclusively to national production, its robustness is seriously compromised. Therefore, a combination of local supply and international trade would be a better option (Miroudot, 2020), as it reduces geographical dispersal (and thus the complexity of the chain) without compromising its robustness.
This issue is related to another aspect that generates controversy: Are nearshoring and reshoring of productive activities previously farshored from the leader company effective practices for adapting global chains to the new international context? Those who support this idea highlight the importance of reducing the risks related to complex logistics, while those who disapprove of it emphasize that nearshoring production activities (especially if they are concentrated in the same country as the leader company (reshoring)) means the loss of other advantages related to the market, the supply of raw materials or access to specific knowledge that can be harnessed in different parts of the world by developing a broad supply network (Strange, 2020; RSIS, 2020; World Economic Forum, 2020b).
One point on which there is a clear convergence of opinion is that the security guarantees that a supplier can offer are an increasingly important factor in the leader company’s selection process. This point is particularly important for less-industrialized countries that are interested in encouraging the linkage of domestic firms to global value chains, especially in an international context where domestic relocation (reshoring) or nearshoring policies are gaining ground. From that perspective, investment attraction policies must emphasize elements of this context and, in particular, the country’s production infrastructure and institutional framework must be able to demonstrate that, in the event of possible external shocks, the risks of interruption are limited and controllable.
Finally, global trends will be based on a heterogeneous array of strategies, determined by the individual responses that each company will develop according to its specific circumstances. In general, decisions aimed at strengthening the robustness of production chains prevail, as do –to a lesser extent– those that seek to reduce geographical dispersal in order to lower the complexity of the chain. Another key aspect is the strengthening of capacities, especially through re-skilling or by hiring of new skills (Knut, Gupta and Trautwein, 2020).
C. Possible future trajectories of global value chains and policy recommendations
So far, Latin America and the Caribbean has achieved a relatively marginal participation in international trade flows associated with global value chains, although with significant differences between countries. As mentioned above, there is a strong orientation towards primary commodities and natural resource-based manufactures in South American countries, low-skilled labour-intensive manufactures in Central America and medium- and high-tech manufactures, such as electronics and automobiles, in Mexico. On the other hand, the COVID-19 pandemic has caused deep disruptions in supply chains and would seem to be accelerating some of the changes that were emerging in international production. In this context, it

123Foreign Direct Investment in Latin America and the Caribbean • 2020 Chapter II
is particularly important to identify the possible evolutionary trajectories of global value chains in the near future, while looking closely at the region’s sectors of specialization. In this way, it will be possible to visualize areas of opportunity for the implementation of support policies that, depending on the development goals of countries, encourage or stop these processes.
Technological and geopolitical trends affect international production in different ways. Sometimes they reinforce each other, sometimes they act in opposite directions and have a different impact on different economic sectors and geographical areas. Changes in global value chains can also have to do, among other things, with the modalities of coordination among the firms that make up the chain, the predominant business models and their market linkage strategies. Although the crisis caused by the coronavirus pandemic could lead the changes in international production to take many directions, some possible trajectories can be visualized. This section focuses on the changes concerning the physical relocation of firms and the attendant reconfiguration of global value chains.
However, as regards the speed and intensity of the transformations, it is important to bear in mind that, so far, global value chains have exhibited a great deal of inertia where changes are concerned. In fact, the multiple shocks that global value chains have experienced have modified their contribution to international trade and changed their structure; however, these have been gradual and incremental processes.
1. Potential trajectories and impacts of megatrends and catastrophic events
Among the transformations that global value chains will undergo over the coming decade, everything points to a withdrawal, to varying degrees, from international production (UNCTAD, 2020b). In this scenario, four possible trajectories for global value chains can be established in stylized terms: reshoring, regionalization, replication and diversification. While the first three involve some form of retreat from global value chains, the fourth projects higher growth, but with a smaller geographical distribution of value added (greater concentration) and downward pressure on investment in physical production assets (see table II.2).
Table II.2 Possible evolutionary trajectories of global value chains
Potential trajectory What does it consist of?
Reshoring Reshoring of previously offshored production activities.
Diversification or duplication of the network of external suppliers
Duplication of suppliers, especially those of strategic importance, differentiating their geographic origin.
Regionalization or development of regional production poles
Creation of production chains that are concentrated in a geographically limited area.
Replication Replication or cloning of standardized production facilities with similar characteristics owned by the leader company or by specialized suppliers located near important markets. The leader company centralizes network management, innovation and design capabilities.
Source: Economic Commission for Latin America and the Caribbean (ECLAC), on the basis of McKinsey Global Institute, Risk, resilience and rebalancing in global value chains, 2020.
124 Economic Commission for Latin America and the Caribbean (ECLAC)Chapter II
Reshoring questions the most distinctive elements of global value chains: fragmentation of tasks (disaggregation) and geographical dispersal (offshoring). The main objectives of reshoring are: (i) reduction of chain complexity to decrease transaction costs and risks associated with long-distance supply logistics; (ii) establishment of more direct governance modalities by the leader company or companies in the chain with regard to key stages of the production process; (iii) increased economies of scale; and (iv) reduction of the environmental impact of the production chain by shortening the transit routes of intermediate inputs. This model reverses historical trends in international production: from disaggregation to regrouping, from offshoring to reshoring and from outsourcing to greater control by leader transnational corporations (inshoring) (UNCTAD, 2020b).
The supplier diversification strategy aims to increase the robustness of the production chain and decrease the risk that a disruptive event that impacts the leader company’s supply network might interrupt production. At the same time, by accessing specialized suppliers belonging to other production systems, the leader company can diversify its learning possibilities and access new sources of knowledge and innovation. A correct development of this strategy requires that these suppliers are chosen taking into account both the degree of robustness they can guarantee as companies, and the soundness of the production and institutional system in which they operate. However, this strategy means that some economies of scale must be relinquished by involving more suppliers and locations in the value chain.
Regionalization seeks to reduce the costs and risks of excessive geographical dispersal while maintaining the advantages of a supply system composed of different suppliers, i.e. diversification of risk and sources of know-how. Geographical concentration also helps to reduce the environmental impact of production processes by reducing movements of intermediate inputs. Finally, regionalization allows the development of production systems with strong territorial roots that, as part of their business model, increase the value of the diversity and specificity of the territories encompassed. The regionalization of value chains can result from a retreat from global value chains (transnational corporations replicate value chains at the regional level) or from the growth of international production at the regional level (transnational corporations structure their operations close to markets). The shift from global to regional brings the extremes of value chains closer together geographically. At the same time, the geographical distribution of value added will tend to increase.
A feature of the replication strategy is to locate the distributed production capacity near important markets in order to reduce the response time to changes in demand and the transportation costs of finished products. The main elements of the strategy are: (i) centralization of key functions in the leader company; and (ii) standardization and automation of production processes carried out at facilities located near markets. The latter component is essential to reduce control and management costs and, at the same time, to ensure flexibility, i.e. the ability to adapt to changes in demand in a short time and at low cost. The resulting chains can be more or less short, depending on how close the leader companies are to the target markets. As a result, the geographical dispersal of economic activities is high, with a concentration of high-value activities in a few places, but wide participation in the manufacturing process. Governance is likely to be polarized: stronger control by transnational corporations of the design and value added coordination phase and significant opportunities for local outsourcing of highly standardized, replicated manufacturing stages.

125Foreign Direct Investment in Latin America and the Caribbean • 2020 Chapter II
(a) The effect of megatrends
As mentioned above, the two trends that have done the most to shape the evolution of global value chains are the development and dissemination of new technologies (particularly in the digital arena) and international geopolitical relations. In addition to these forces, there is growing concern about the environmental sustainability of highly geographically dispersed global value chains. This factor will have an increasing influence on the strategic decisions of companies that lead global value chains and, therefore, on the governance and territorial configuration of those chains. In all three cases, these megatrends affect the potential paths described above in different ways (see diagram II.3).
Diagram II.3 Megatrends and potential trajectories of global value chains
New technologies Neoprotectionism Environmental sustainability
Reshoring +/- + +
Diversification or duplication of the network of external suppliers + - -
Regionalization (development of regional production poles) +/- +/- +
Replication + - +
Source: Economic Commission for Latin America and the Caribbean (ECLAC).Note: The colours represent the intensity of the impact of each component (white corresponds to low intensity, black to high intensity and grey to medium intensity) and
the signs indicate whether that impact is positive or negative.
Reshoring tends to increase in an unstable geopolitical environment. The impact of new technologies, on the contrary, has uncertain effects. On the one hand, advanced automation driven by robotics plays a key role in returning production to the country of origin. Progress in this area erodes the benefits of offshoring. In such a setting, automation makes reshoring a viable option for many transnational corporations (UNCTAD, 2020b). On the other hand, as the technological capabilities of the host countries of the offshored activities increase, the effect may be opposite and inhibit reshoring, given the huge capital investment that is difficult to move and recover. With regard to the sustainability of production processes, this trend may lead to a return to the country of origin (reshoring), as it promises a reduction in the environmental impact of the companies involved.
The diversification of external suppliers benefits from the new capabilities of remote management, coordination and control made possible by digital technologies. Just as automation is the technological trigger for reshoring, digitization of the supply chain is fundamental to the process of diversification. These dynamics will take place in a hybrid, highly fragmented environment where manufacturing activities are increasingly integrated with digital services. Diversified, “servicified” and digitally enhanced global value chains represent an Industry 4.0 version of traditional
126 Economic Commission for Latin America and the Caribbean (ECLAC)Chapter II
global value chains, in an important continuity with the historical and expansive trend of international production. On the other hand, diversification is difficult in unstable geopolitical environments and creates resistance on the environmental front owing to the potential negative effects of a more widespread global supply and distribution network.
The effects of megatrends on the regionalization strategy are less clear. Digitization plays an important role in facilitating the coordination of regional value chains. However, it also reduces the cost of coordination with businesses in other latitudes. In the same way, international geopolitical tensions could prompt a decision to nearshore, but on the condition that there are solid institutions that contribute to the development of integration processes and the management of stable political relations. Reducing the length of the chain can be considered positive because of its lower environmental impact and can be supported by markets and institutions that are sensitive to this issue.
The replication strategy is strengthened by the development of new technologies that allow leader companies to exercise centralized control of the relationship with suppliers at low cost and respond more quickly to changes in demand. In addition to automation and digitization, additive manufacturing or 3D printing could play an important role in replication strategies. Proximity to markets reduces the environmental impact of the distribution chain, while the network dispersal that this strategy generates becomes difficult in an unstable geopolitical environment.
With these elements, some considerations can be formulated regarding global value chains in Latin America and the Caribbean.
In the manufacturing sector, reshoring could become important for high-tech industries such as machinery and equipment, electronics and automotive vehicles. In the current context, a degree of reduction in international production in these industries seems inevitable, with increasing pressure for shorter and more sustainable value chains and more diversified and flexible production systems (UNCTAD, 2020b). A possible return on offshored production (reshoring) will depend on the economic profitability of automation and cost-benefit considerations, taking into account various factors, including labour costs, quality, security of supply, protection of intellectual property rights, distance from customers, geopolitical risks and many others. In these industries, the economic viability of automation is already established and confirmed by the growing role of robots. As the price of robots decreases, the synergy between automation and reshoring could be one of the major drivers in shaping global value chain trajectories. The scenario is different for low-tech industries, such as textiles and apparel, where labour cost differentials remain key competitive factors.
Reshoring could affect the automotive sector chains. On the one hand, the high degree of automation in the sector reduces the importance of the relative cost of labour, which could drive a return to the countries of origin of the main brands of vehicles that have operations in Latin America, primarily in Mexico. On the other hand, the high amount of investments already made in the main Latin American vehicle producing countries (Argentina, Brazil and Mexico) and the degree of technical readiness achieved by their labour force generate a high level of territorial

127Foreign Direct Investment in Latin America and the Caribbean • 2020 Chapter II
anchorage that makes the return of these industries to their home countries unlikely. In fact, Mexico has some of the most modern and efficient plants in North America in the automotive industry (ECLAC, 2017). However, it cannot be ruled out that a sustained, aggressive United States industrial policy to encourage the reshoring option may upset this balance and bring about the relocation desired by recent United States administrations. To date, these government initiatives have had little effect on the major vehicle manufacturers and have been essentially confined to deferring investment.
As mentioned, it is possible to formulate opposite considerations for Central American and Caribbean companies that are integrated in the textile and clothing industry chains. In these cases, the lower level of automation in this sector tends to preserve labour cost advantages and discourage reshoring. On the other hand, less territorial anchorage, due to the lower degree of development of the business system in which the companies in these production chains operate (especially the scant relationship with universities and training and research centres, as well as the low level of integration with local suppliers), tends to increase the volatility of investments and facilitate the relocation of companies, but not necessarily to the home country of the leader transnational companies.
The decision to diversify the supplier network, which is often associated with that of increasing inventories of critical inputs is a strategy for strengthening robustness that may be necessary in Latin America and the Caribbean for health or food processing chains, which are extremely vulnerable to supply disruption. In this area, however, Latin America is experiencing a significant digital divide. Although high percentages of the population have access to the Internet, the quality of the connection is low and the percentage of companies that have incorporated advanced digital technologies into their business models is still limited (ECLAC, 2020).
Other manufacturing sectors, such as regional processing industries, have a more limited scope for reshoring. This type of path, like offshoring, requires operational mobility, and these industries often have structural links with the locations to access raw materials (processing industries) or market specificities (pharmaceuticals). Leader companies in food and beverage and mining chains could benefit from the development of regional production systems associated with the generation or consolidation of networks of specialized suppliers. However, the possibility of developing regional production and technology poles of significant size which, by achieving important economies of scale, can attract investment and launch long-term research projects, requires a stable political and institutional environment strongly committed to economic integration processes, which has not been achieved so far.
Some reshoring can also be expected in services, particularly in lower value added services, such as parts of retail and wholesale trade value chains and transport and logistics value chains (UNCTAD, 2020b). While it is true that the implementation of these services requires some presence in local markets, this may be lighter due to digitization, which allows for central coordination of tasks, since automation erodes labour cost advantages. The most notable case is the growth of e-commerce, which leads to significant centralization of sales and marketing activities.

128 Economic Commission for Latin America and the Caribbean (ECLAC)Chapter II
(b) The effects of external shocks
The effects of macrotrends intersect and are reinforced by those of disruptive events that have hit the supply chains, increasing the sense of fragility of these systems of organization of international production. As mentioned above, these facts have prompted different responses from leader companies that, schematically, can deal with these unexpected circumstances by means of strategies to boost the robustness or resilience of the production chain.
Considering the predominant typology in Latin America and the Caribbean, it can be seen that, in general terms, the effects of external shocks are more intense in chains that combine large geographic dispersal with a structure of relations that facilitates the transmission of effects between industries and regions. In the region, these characteristics are found in the global value chains of technology-intensive sectors.20 Conversely, the lowest degrees of exposure are found in chains with high regional concentration, typically those that are intensive in natural resources. Specifically, it can be seen that technology intensive industries are more exposed to massive cyberattacks, pandemics and trade conflicts, since they affect their supply networks more directly. On the contrary, they are little affected by episodes related to natural events (climatic catastrophes or floods). Natural resource-intensive chains and human resource-intensive chains clearly behave differently. In the latter case, there are higher degrees of exposure to natural events, while the intensity of the effects of cyberattacks and trade conflicts tend to be lower. As for pandemics, the effects vary by sector: they are significant for the furniture, garment and oil chains but have little impact on agriculture and basic metals (McKinsey Global Institute, 2020).
2. The cost of geographic reconfiguration
The megatrends and external shocks described above generate changes in global value chains. However, despite the intensity of these phenomena, the transformation of global value chains has been rather gradual. This is particularly so with regard to changes in physical structure, investment amounts, access to qualified personnel and networks of consolidated relationships with specialized suppliers, and availability of raw materials and favourable natural conditions, since territorial anchorage makes it difficult for companies to relocate geographically. These elements have a different impact depending on the production chain concerned. Moreover, the final result is due both to the industry’s characteristics (e.g. degree of automation, level of penetration of digital technologies, etc.) and to individual decisions by companies which, in the same industry, may structure their supply network very differently.
This explains the increases (or decreases) in the rate of geographic concentration of exports over the last two decades, which are recorded across the main categories of global value chains. For example, some recent studies show that among technology-intensive chains there is increasing concentration in the mobile phone and computer industries, while a decrease is being seen in the aerospace, automotive and industrial machinery industries, among others. A similar situation can be seen in natural resource-intensive chains: while concentration is increasing in those related to mining, in oil-related chains it is decreasing. Global
20 There is empirical evidence suggesting that not all technology-intensive global value chains are equally geographically distributed (McKinsey Global Institute, 2020). There is a very significant level of spatial concentration in semiconductor chains, for example. However, these chains are not relevant to the economy of Latin America and the Caribbean.

129Foreign Direct Investment in Latin America and the Caribbean • 2020 Chapter II
human resource-intensive value chains are the exception (see table II.3). In these cases, empirical evidence would point to a uniform process of increasing spatial concentration, possibly related to the growing leadership of China in these sectors (McKinsey Global Institute, 2020).
Table II.3 Variation in geographical concentration by industrial chain
Increasing concentration Decreasing concentration
Technology intensive Mobile telephones, computers Aerospace, automotive vehicles and industrial machinery
Labour intensive Textile, clothing and furniture …
Natural resource intensive Mining Oil
Source: Economic Commission for Latin America and the Caribbean (ECLAC), on the basis of McKinsey Global Institute, Risk, resilience and rebalancing in global value chains, 2020.
According to this empirical evidence, among the most important chains in Latin America, those most likely to see company relocation are the human-resource-intensive ones, while those that are natural-resource-intensive are the least likely to alter their structures through changes in the geographical location of suppliers (see diagram II.4).
Diagram II.4 Likelihood of chains undergoing relocation processes
Production chains Relocation due to economic factors
Relocation due to non-economic factors
Intensive in medium complexity technology Chemical Pharmaceutical Medical equipment
Sophisticated technology intensive Aerospace Automotive
Labour intensive Furniture Textile Apparel
Natural resource intensive Food and beverages Agriculture Oil Basic metals Mining Wood products
Low likelihood High likelihood
Source: Economic Commission for Latin America and the Caribbean (ECLAC), on the basis of McKinsey Global Institute, Risk, resilience and rebalancing in global value chains, 2020.
Note: The colours express the likelihood of the impact.
130 Economic Commission for Latin America and the Caribbean (ECLAC)Chapter II
In chains like those of medical equipment and pharmaceuticals the results are less clear. If, on the one hand, a country’s strategic interest can lead to the development of explicit relocation policies to develop production capacities in sectors considered to be of critical importance for public health, on the other hand, the specificity of the investments made to comply with the standards of the countries in which these companies operate and the complexity of having to go through the certification processes again in the event of relocation reduce the probability of changes in the location of companies.
3. Considerations on productive development policies
Barring a few exceptions, Latin America is on the periphery of the most globalized chains and has concentrated on those with strong forward linkages, such as primary commodities and natural resource-based manufactures.
The transformation under way, driven by the megatrends and disruptive phenomena described above, poses new challenges and, at the same time, opens up new possibilities for participation in the international division of labour to promote a more sustainable and inclusive development model.
Productive development policies are a key instrument for moving in this direction. Governments have a responsibility to set long-term national goals, shared with the private sector, academia and civil society (including workers’ organizations) that facilitate convergence of action by the various agencies operating in favour of productive development.
In this context, there are at least two areas that can be enhanced to improve the performance of global value chains:
• Strengthening of regional integration processes, with a marked emphasis on the search for productive complementarities and synergies. This would enable South America, in particular, to shape and strengthen regional production chains, seeking to gradually increase value incorporation and technological intensity.
• Taking advantage of the geographical proximity of the largest market in the world: the United States. In a period of increasing geopolitical change and tensions, Latin America should focus on strengthening the conditions that make it more attractive for the relocation of operations, with a focus on nearshoring.
In both cases, the focus of productive development policies should be on strengthening the territorial anchorage of the enterprises and investments involved (whether national or foreign, small and medium-sized enterprises or large, or public or private) by creating or consolidating economic and institutional systems featuring specialized supply networks, qualified human resources and stable, easily accessible institutions, especially with regard to certification, protection of intellectual property and privacy in the use of data, regulation of competition and contractual rules.
The security of production chains will be a determining factor in the investment decisions of leader companies in global value chains. In this area, the countries of the region have an opportunity to attract investment by strengthening communication and transport infrastructure, defining or improving protocols for action in the event of
131Foreign Direct Investment in Latin America and the Caribbean • 2020 Chapter II
disasters, strengthening the agencies responsible for monitoring natural phenomena and operations in disaster areas (civil protection) and promoting the creation of public-private coordination bodies, at both national and regional levels.
Innovation policies should concentrate a considerable part of the resources invested in productive development. Despite public and private initiatives in these areas, it will be necessary to focus and prioritize areas of intervention in order to produce significant effects. While such decisions will have to emerge from discussions among the main economic and social actors, two areas are of unquestionable importance:
• New digital technologies: being a key factor in the development of integrated production systems, it is necessary to advance towards service standards that approach the international threshold. A particularly important area requiring regional coordination is that of cybersecurity and deployment of new telecommunications networks (5G).
• Research and development in strategic sectors: the way to break the vicious circle of Latin American productive specialization is to invest in know-how that will enable the region to move up to higher value added links.
Finally, in the area of trade, it is vitally important to make progress with facilitation measures, i.e. simplification and harmonization of procedures and information flows associated with the import and export of goods and services. It is also important to reduce the time and cost of trade transactions, i.e. to remove barriers at the borders. Trade facilitation is a vehicle for economic development, increased international competitiveness, regional integration and the strategic insertion of developing countries into global and regional value chains.
In the same vein, updating the numerous existing free trade agreements signed by Latin American countries is particularly important. In this sense, the adequate incorporation of topics such as scientific-technological cooperation, respect for workers’ rights and environmental protection is increasingly relevant for an adequate insertion in an increasingly complex global economy. In this regard, the new treaty between Mexico, the United States and Canada (USMCA) that replaced NAFTA is significant. In this new agreement, under pressure from labour unions in the United States and Canada, Mexico increased the minimum wage and ratified new conventions with the International Labour Organization (ILO). Rules of origin were also established to increase regional content and thus prioritize inputs and outputs needed for the supply chains in the three countries. For example, in the automotive industry, the North American content is increased from 62.5% to 75%, the use of steel and aluminium produced in one of the three countries is encouraged, and it is established that between 40% and 45% of vehicles must be manufactured by workers who earn at least US$ 16 an hour and preferably area unionized. This avoids excessive outsourcing of production, mainly in Mexico, eroding competitive advantages based on low wages. These changes could help foster more balanced productive integration.
132 Economic Commission for Latin America and the Caribbean (ECLAC)Chapter II
BibliographyAlderman, L. (2020), “As Coronavirus spreads, face mask makers go into overdrive”, New York
Times, 7 February.Arbache, J. (2019), “¿Hecho en China o hecho para China?”, Visiones, Caracas, Development
Bank of Latin America (CAF), October.Barrientos, S., G. Gereffi and A. Rossi (2010), “Economic and social upgrading in global production
networks: developing a framework for analysis”, International Labor Review.BBC (2020), “Coronavirus: France announces €8bn rescue plan for car industry”, 26 May.Blyde, J. (ed.) (2014), Fábricas sincronizadas: América Latina y el Caribe en la era de las cadenas
globales de valor, Washington, D.C., Inter-American Development Bank (IDB).Bricco, P. (2020), “Come il virus sta colpendo i distretti industriali cuore del made in Italy”, il Sole
24 ore, Milan, 24 March.CAF (Development Bank of Latin America) and others (2020), Las oportunidades de la digitalización
en América Latina frente al COVID-19, Santiago. CDC (Centers for Disease Control and Prevention) (2020), “Pandemia de 1918 (virus H1N1)”
[online] https://espanol.cdc.gov/flu/pandemic-resources/1918-pandemic-h1n1.html.De Backer, K. and S. Miroudot (2013), “Mapping global value chains”, Trade Policies Papers,
No. 159, Paris, Organization for Economic Cooperation and Development (OECD).De Backer, K. and others (2016), “Reshoring: myth or reality?”, OECD Science, Technology and
Industry Policy Papers, No. 27, Paris.Dun and Bradstreet (2020), Business Impact of the Coronavirus: Business and Supply Chain Analysis
Due to the Coronavirus Outbreak, Special Briefing [online] https://www.dnb.com/content/dam/english/economic-and-industry-insight/DNB_Business_Impact_of_the_Coronavirus_US.pdf.
ECLAC (Economic Commission for Latin America and the Caribbean) (2020a), “Sectors and businesses facing COVID-19: emergency and reactivation”, Special Report COVID-19, No. 4, 2 July. (2020b), “Measuring the impact of COVID-19 with a view to reactivation”, Special Report COVID-19, No. 2, Santiago, April. (2018a), Data, algorithms and policies: redefining the digital world (LC/CMSI.6/4), Santiago. (2018), Foreign Direct Investment in Latin America and the Caribbean, 2018 (LC/PUB.2018/13-P), Santiago. (2017), Foreign Direct Investment in Latin America and the Caribbean, 2017 (LC/PUB.2017/18-P), Santiago.
European Commission (2020), A New Industrial Strategy for Europe, Brussels.Foldy, B. (2020), “Coronavirus pinching car-industry supply chains”, Market Watch, February.Forbes (2020), “Global 2000 Highlights: Inside the Numbers of the World’s Largest Public
Companies”, 13 May.Fortune (2020), “Global 500” [online] https://fortune.com/global500/.Gandoy, R. and C. Días-Mora (2020), “El futuro de las cadenas globales de valor”, Madrid, Club
de Exportadores e Inversores Españoles, Comité de Reflexión sobre Internacionalización.Gereffi, G. and K. Fernandez-Stark (2016), Global Value Chain Analysis: A Primer, Durham, Duke
University, July. Haren, P. and D. Simchi-Levi (2020), “Cómo el Coronavirus podría afectar a la cadena de suministro
mundial a mediados de marzo”, Harward Business Review, February.Hedwall, M. (2020), “The ongoing impact of COVID-19 on global supply chains”, Geneva, World
Economic Forum (WEF), June.Heredia, A. (2020), “Políticas de fomento para la incorporación de las tecnologías digitales en
las micro, pequeñas y medianas empresas de América Latina: revisión de experiencias y oportunidades”, Project Documents (LC/TS.2019/96), Santiago, Economic Commission for Latin America and the Caribbean (ECLAC).
Humphrey, J. and H. Schmitz (2004), “Local upgrading in global chains: recent findings”, paper presented at the DRUID Summer Conference 2004 on Industrial Dynamics, Innovation and Development, Elsinore.(2002), “How does insertion in global value chains affect upgrading in industrial clusters?”, Regional Studies, vol. 36, No. 9, Sussex, Institute of Development Studies (IDS).
133Foreign Direct Investment in Latin America and the Caribbean • 2020 Chapter II
(2000), “Governance and upgrading: linking industrial cluster and global value chain research”, Working Paper, vol. 120, Brighton.
Ignatenko, A., R. Faezeh and B. Mircheva (2019), “Global value chains: what are the benefits and why do countries participate?”, IMF Working Papers, No. WP/19/18, Washington, D.C, International Monetary Fund (IMF).
ISM (Institute for Supply Management) (2020a), “COVID-19 survey: impacts on global supply chains” [online] https://www.prnewswire.com/news-releases/covid-19-survey-impacts-on-global-supply-chains-301021528.html.(2020b), “COVID-19 and supply chains: increasing impacts, decreasing revenues. White paper” [online] https://www.ismworld.org/supply-management-news-and-reports/reports/research-and-surveys/.(2020c), “COVID-19 Global Supply Chain Disruptions Continue” [online] https://www.prnewswire.com/news-releases/covid-19-global-supply-chain-disruptions-continue-301040385.html.
Ivanov, D. (2020), “Predicting the impacts of epidemic outbreaks on global supply chains: A simulation-based analysis on the coronavirus outbreak (COVID-19/SARS-CoV-2) case”, Transportation Research Part E: Logistics and Transportation Review, vol. 136.
Jain, N., K. Girotra and S. Netessine (2016), “Recovering from supply interruptions: the role of sourcing strategy”, INSEAD Working Paper Series, No. 58.
Javorcik, B. (2020), “Global supply chains will not be the same in the post-COVID-19 world”, COVID-19 and Trade Policy: Why Turning Inward Won’t Work, R. Baldwin and S. Evenett (eds.), London, Centre for Economic Policy Research.
Knut, A., R. Gupta and V. Trautwein (2020), “Resetting supply chains for the next normal”, Operation Practice, McKinsey and Company, July.
Liao, R. and Z. Fan (2020), “Supply chains have been upended. Here’s how to make them more resilient”, Geneva, World Economic Forum (WEF), April.
Marro, E. (2020), “Il virus travolge le filiere globali del made in Italy: come uscire dalla crisi in 8 mosse”, il Sole 24 ore, 16 May.
Mauri, A. G. (1999), “Trust and knowledge in the outsourcing relationships: the rise of the virtual company”, Sinergie, No. 50/99.
McKinsey Global Institute (2020), Risk, resilience and rebalancing in global value chains.Miroudot, S. (2020), “Resilience versus robustness in global value chains: some policy implications”,
COVID-19 and Trade Policy: Why Turning Inward Won’t Work, R. Baldwin and S. Evenett (eds.), London, Centre for Economic Policy Research.
Miroudot, S. and H. Nordström (2019), “Made in the world revisited”, RSCAS Applied Network Science Working Paper, No. 2019/84, European University Institute.
Obama, B. (2012), An America Built to Last, Washington, D.C., White House, January.OECD (Organization for Economic Cooperation and Development) (2020a), “Trade Policy
Implications of Global Value Chains” [online] http://www.oecd.org/sti/ind/Trade_Policy_Implicatipns_May_2013.pdf.(2020b), “COVID-19 and Global Value Chains: Policy Options to Build More Resilient Production Networks”, 3 June [online] https://read.oecd-ilibrary.org/view/?ref=134_134302-ocsbti4mh1&title=COVID-19-and-Global-Value-Chains-Chains-Policy-Options-to-Build-More-Resilient-Production-Networks.(2018a), Multinational Enterprises in the Global Economy: Heavily Debated but Hardly Measured, Paris.(2018b), Trade in Value added: China, Paris.
Pisano, G. and W. Shih (2012), “Does America really need manufacturing?”, Harvard Business Review.RSIS (Rajaratnam School of International Studies) (2020), “Building critical supply chain resilience in
the wake of COVID-19”, Policy Report RSIS, Singapore, Nanyang Technological University, July.RTVE (2020), “El mapa mundial del coronavirus: más de 27,1 millones de casos y más de
890.000 muertos en todo el mundo” [online] https://www.rtve.es/noticias/20200907/mapa-mundial-del-coronavirus/1998143.shtml.
Schatan, C. (2020), “Las cadenas de valor global al desnudo con el COVID-19”, El Semanario, Mexico City, 18 March.
Schmitz, H. (2006), “Learning and earning in global garment and footwear chains”, The European Journal of Development Research, vol. 18, No. 4, Palgrave Macmillan, December.
Statista (2020), “Global 3D printing products and services market size from 2020 to 2024” [online] https://www.statista.com/statistics/315386/global-market-for-3d-printers/.

134 Economic Commission for Latin America and the Caribbean (ECLAC)Chapter II
Strange, R. (2020), “The 2020 Covid-19 pandemic and global value chains”, Journal of Industrial and Business Economics, June.
Taglioni, D. and D. Winkler (2016), “Making global value chains work for development”, Trade and Development series, Washington, D.C., World Bank, June.
UNCTAD (United Nations Conference on Trade and Development) (2020a), World Investment Report 2020: International Production Beyond the Pandemic, Geneva.(2020b), “Impact of the COVID-19 Pandemic on global FDI and GVCs”, Global Investment Trends Monitor, No. 35, Geneva, March.
Wang, Z. and others (2017), “Measures of participation in global value chains and global business cycles”, Working Paper Series, No. 23222, Cambridge, National Bureau of Economic Research (NBER).
World Bank (2020), World Development Report 2020: Trading for Development in the Age of Global Value Chains, Washington, D.C.
World Economic Forum (2020a), “The ongoing impact of COVID-19 on global supply chains”, Geneva, June.(2020b), “How to rebound stronger from COVID-19: Resilience in manufacturing and supply systems”, White Papers, Geneva, April.(2020c), “Building resilience in manufacturing and supply systems in the COVID-19 context and beyond: Latin America perspectives”, Regional Insight, Geneva, July.(2019), “Reshaping global value technology, climate, trade: global value chains under Pressure”, White Papers, Geneva, September.
WTO (World Trade Organization) (2017a), Global Value Chain Development Report 2017, Washington, D.C.(2017b), World Trade Statistical Review 2017, Geneva.
WTO (World Trade Organization) and others (2019), Global Value Chain Development Report 2019: technological innovation, supply chain trade, and workers in a globalized world, Geneva.
135Chapter IIIForeign Direct Investment in Latin America and the Caribbean • 2020
IIICHAPTER
Introduction
A. A heterogeneous and constantly changing sector
B. International trade in medical devices grew moderately in recent years
C. Foreign direct investment (FDI) has been concentrated in the advanced economies
D. Production capacities and specialization in the region
E. Towards a new scenario: how to boost regional integration
Bibliography
Annex III.A1
New scenarios for the medical device sector in Latin America and the Caribbean


137Chapter IIIForeign Direct Investment in Latin America and the Caribbean • 2020 IIIIntroduction
In the first few months of 2020, the world was confronted by a pandemic with characteristics that also triggered a global economic crisis. In this situation, many countries found it difficult to source inputs to address the health emergency (ECLAC, 2020; Gereffi, 2020). The demand for medical devices and personal protection equipment, particularly those specific to coronavirus disease (such as masks and ventilators), increased sharply. Supply was not able to adjust immediately to this sudden large-scale surge in demand; and least 70 countries found it necessary to impose export restrictions on certain medical devices and personal protection equipment (ECLAC, 2020). These restrictions, in turn, reduced supply even further for import-dependent countries.
This situation highlighted the risks of relying on global value chains to supply products that are strategic for the population’s well-being, such as health-care inputs; and it underlined the importance of having quality domestic production to supply domestic demand and hence a more robust health system to confront crises.
Latin America and the Caribbean were not exempt from this process; and the production of medical devices and personal protection equipment within national borders played a major role in dealing with the health emergency in many countries. The emergency enhanced the value of capacities to produce products required by the health sector; and several governments launched initiatives to achieve innovative advances in the industries in question.
The medical device sector has played a fundamental role in combating the pandemic; and it is very interesting to analyse its characteristics and how it operates, for the design of policies that support sustainable development and productive diversification in the region. As a contribution to that endeavour, this chapter seeks to improve knowledge on the production capacities of this sector in Latin America and the Caribbean, and the role that foreign direct investment (FDI) has played in its development.
The global medical devices market is dominated by firms based in developed countries. Nonetheless, there are a number of firms in the region that compete successfully in this industry, both domestically and internationally, through exports. Although in some cases the firms in question rely on foreign capital —for example, in conjunction with transnational corporations that export successfully from Costa Rica, the Dominican Republic or Mexico— there also are locally owned firms that compete in the domestic market with imports from large transnationals and also succeed in exporting. There are examples in Argentina, Brazil, Costa Rica, Mexico and Uruguay, and elsewhere.
This chapter will discuss medical devices, one of the segments of medical technology. Other industries that are complementary and fundamental for health systems, such as basic chemistry, pharmaceuticals and health services provision, will not be analysed here because they involve very different production processes, scales and internationalization strategies.

138 Chapter III Economic Commission for Latin America and the Caribbean (ECLAC)
A. A heterogeneous and constantly changing sector
Medical devices are essential for health systems to be able to perform the tasks of prevention, diagnosis, treatment and rehabilitation of diseases and illnesses both safely and efficiently1. The sector encompasses activities that form part of the broader area of medical technology, along with the in vitro diagnostic and digital health sectors (see diagram III.1).
1 See World Health Organization (WHO), “Medical Devices” [online] https://www.who.int/medical_devices/es/.
Diagram III.1 Major medical technology segments
Medical technology
Medical devicesProduct, instrument, apparatus or machine for the prevention, diagnosis or treatment of disease and illnesses, or to detect, measure, restore, correct or modify the anatomy or function of the organism for a health purpose, using physical means
In vitro diagnosis (IVD)Non-invasive tests performed on biological samples, such as blood, or tissue, to check health status, and to help diagnose, cure, treat or prevent diseases
Digital healthTools and services that use information and communication technologies (ICTs) to improve the prevention, diagnosis, treatment, monitoring and management of health-care and lifestyle. Examples include, telemedicine, health information technology, mobile health apps
Source: Economic Commission for Latin America and the Caribbean (ECLAC), on the basis of MedTech Europe, The European Medical Technology Industry in Figures 2020, Brussels, 2020; World Health Organization (WHO), Local Production and Technology Transfer to Increase Access to Medical Devices: Addressing the Barriers and Challenges in Low- and Middle-Income Countries, Geneva, 2012.
The first challenge when analysing the medical device sector is to identify the set of products to be considered. The sector embraces an extremely wide universe of products, ranging from low-risk goods for personal use (bandages, crutches, hospital beds), through intermediate-risk goods (needles, ultrasound equipment, ventilators), to products of high-risk for people’s health (prostheses, breast implants, pacemakers or defibrillators). More than 10,000 types of devices and around 500,000 medical products are sold on the market (Velázquez and Díaz, 2017), at a very wide range of prices, ranging from a few cents to hundreds of thousands of dollars (Bamber and Gereffi, 2013).
This heterogeneity makes it difficult to analyse the sector from the production standpoint, since there are substantial differences in the value chains in which the different goods are manufactured. Realities differ in terms of requirements for capital, human resources, technology and research and development, and also in sales and distribution strategies, after-sales services and the regulations that frame them.
Based on the technological and innovation requirements for the production of medical devices, Peirano (2017) proposes three main categories of devices (see diagram III.2). These respond to a rough conceptual definition; and the products are not static in one or another group, but can be relocated as technologies advance and production processes become standardized.
Among products of low technological complexity, innovations are rare, competition is mainly based on cost, and medical knowledge requirements are lower, although health standards have to be met before they can be sold. This category includes products that are produces using mature technologies (Bamber and Gereffi, 2013; Peirano, 2017); large-scale production is a competitive factor, and several Asian countries have successfully penetrated international markets.
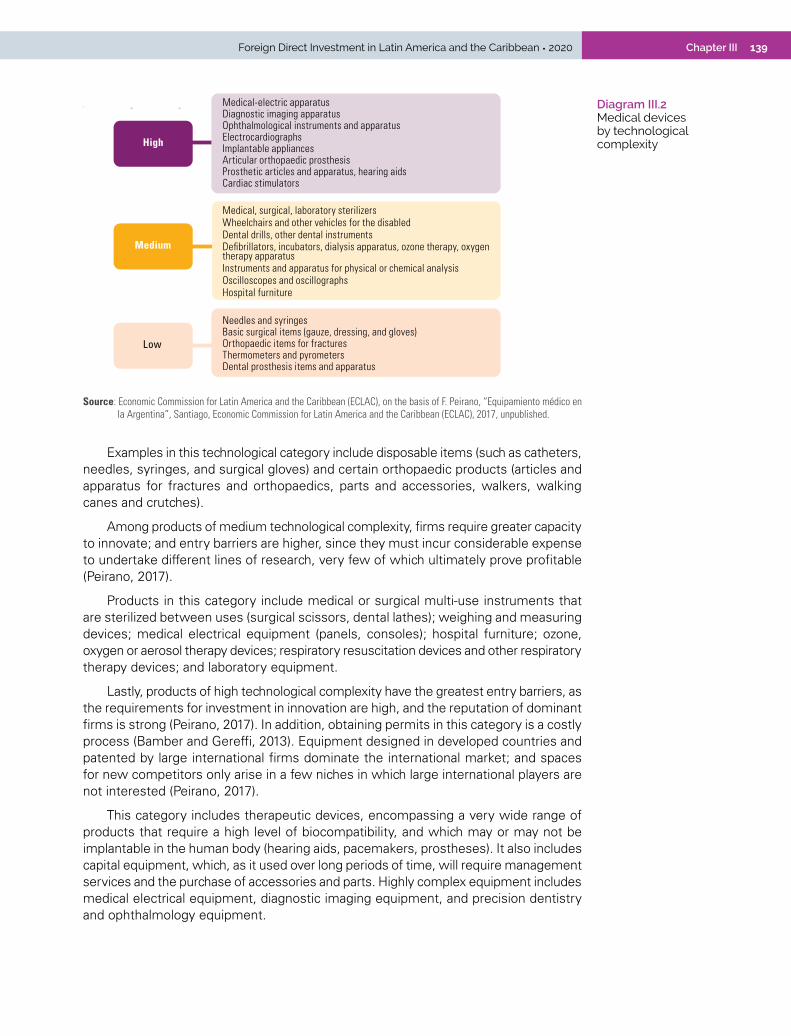
139Chapter IIIForeign Direct Investment in Latin America and the Caribbean • 2020
Diagram III.2 Medical devices by technological complexity
Low
Medium
High
Needles and syringesBasic surgical items (gauze, dressing, and gloves)Orthopaedic items for fracturesThermometers and pyrometersDental prosthesis items and apparatus
Medical, surgical, laboratory sterilizersWheelchairs and other vehicles for the disabledDental drills, other dental instrumentsDefibrillators, incubators, dialysis apparatus, ozone therapy, oxygen therapy apparatusInstruments and apparatus for physical or chemical analysisOscilloscopes and oscillographsHospital furniture
Medical-electric apparatusDiagnostic imaging apparatusOphthalmological instruments and apparatusElectrocardiographsImplantable appliancesArticular orthopaedic prosthesisProsthetic articles and apparatus, hearing aidsCardiac stimulators
Source: Economic Commission for Latin America and the Caribbean (ECLAC), on the basis of F. Peirano, “Equipamiento médico en la Argentina”, Santiago, Economic Commission for Latin America and the Caribbean (ECLAC), 2017, unpublished.
Examples in this technological category include disposable items (such as catheters, needles, syringes, and surgical gloves) and certain orthopaedic products (articles and apparatus for fractures and orthopaedics, parts and accessories, walkers, walking canes and crutches).
Among products of medium technological complexity, firms require greater capacity to innovate; and entry barriers are higher, since they must incur considerable expense to undertake different lines of research, very few of which ultimately prove profitable (Peirano, 2017).
Products in this category include medical or surgical multi-use instruments that are sterilized between uses (surgical scissors, dental lathes); weighing and measuring devices; medical electrical equipment (panels, consoles); hospital furniture; ozone, oxygen or aerosol therapy devices; respiratory resuscitation devices and other respiratory therapy devices; and laboratory equipment.
Lastly, products of high technological complexity have the greatest entry barriers, as the requirements for investment in innovation are high, and the reputation of dominant firms is strong (Peirano, 2017). In addition, obtaining permits in this category is a costly process (Bamber and Gereffi, 2013). Equipment designed in developed countries and patented by large international firms dominate the international market; and spaces for new competitors only arise in a few niches in which large international players are not interested (Peirano, 2017).
This category includes therapeutic devices, encompassing a very wide range of products that require a high level of biocompatibility, and which may or may not be implantable in the human body (hearing aids, pacemakers, prostheses). It also includes capital equipment, which, as it used over long periods of time, will require management services and the purchase of accessories and parts. Highly complex equipment includes medical electrical equipment, diagnostic imaging equipment, and precision dentistry and ophthalmology equipment.

140 Chapter III Economic Commission for Latin America and the Caribbean (ECLAC)
1. The value chain
The manufacture of medical devices is included in the heading “Manufacture of medical and surgical equipment and orthopaedic appliances” (3311, International Standard Industrial Classification of All Economic Activities (ISIC), Rev. 3.1).2 This is classified as a high technology branch of industry, as indicated by the intensity of expenditure on research and development (R&D), which is greater than 8% (Loschky, 2010). However, as noted above, not all goods require medium- or high-tech production processes. According to the Pavitt taxonomy (1984), this category belongs to science-based industries, in which innovation is based on scientific advances, R&D and laboratory research are important, and these lead to high levels of product innovation and high patenting propensity (Bogliacino and Pianta, 2016). These elements give the industry a strategic status in Latin America and the Caribbean that goes beyond its contribution to the health system. This is because the production structure of the region’s economies still needs a profound transformation, including productivity increases and further innovation, to move forward in a sustainable and inclusive development process.
The value chain in medium- and high-tech goods starts with R&D activities (see diagram III.3). In this segment, prototypes are developed and tested; and capacity requirements for production are determined, which requires collaboration with the manufacturing area. The product is also submitted for regulatory approval in the target market. Developing a new product in this segment can take up to six years; and releasing of a new product on the market can take up to eight (Bamber and Gereffi, 2013). These processes can be undertaken in the firms themselves; but sometimes leading firms acquire new products through mergers and acquisitions (Simoens, 2009).
In the manufacturing segments (component manufacture and assembly) the inputs and the complexity of the process will depend on the final product. In the preliminary phases of the chain, steel and iron plate are key raw materials —in some cases having undergone previous treatment (bending, drawing, forging)— which enter the manufacturing stage where they are processed and mechanized. Another very key input is plastic, a material that is becoming increasingly important and opens up the possibility of incorporating various innovations from developments in nanotechnology. Glass, paper and cardboard, along with textiles, make up the rest of the suppliers map. In some production lines, the use of specific materials, such as special steels, stainless steel, titanium and tungsten carbide in surgical instruments and precision metal instruments (Hamrick and Bamber, 2019), or bronze in installation firms, are widely used. In a broad range of products, these materials are used to build the structural support and coating, which are combined with a set of electrical, electronic and computer components. As digital health care advances, medical devices will increasingly contain electronic components.
Assembly may be either automated or manual, depending on the product. Labelling is a central part of packaging, since it provides the information needed to ensure that the equipment does not pose a risk to human health. Lastly, once packaged, the medical devices are sterilized.
The distribution, sales and post-sales links in the chain also vary widely, depending on the type of product, the medical specialty and the consumer. The most expensive capital equipment and therapeutic devices are usually sold directly to hospitals (Bamber and Gereffi, 2013).
Lastly, in the most complex equipment, after-sales services are a key element, as is the way the equipment is managed by the end-users —mainly the health services. In developed countries, high-value medical equipment is administered by a designated unit of trained professionals. According to the Pan American Health Organization (PAHO), however, this still needs to be improved in Latin America, since inadequate management means that many items of equipment become damaged or are underused.3
2 This belongs to Division 33, “Manufacture of medical, optical and precision instruments and watches” (United Nations, 2005) (see annex III. A1 for full description).
3 See Pan American Health Organization (PAHO), “Health Technology Management” [online] https://www.paho.org/hq/index.php?option=com_content&view=article&id=11582:health-tech-management&Itemid=41686&lang=es.

141Chapter IIIForeign Direct Investment in Latin America and the Caribbean • 2020
Diagram III.3 Medical devices value chain
Prototype Assembly
Packaging
Sterilization
Training
Assistance
High-tech products
Medium tech products
Low tech products
Export
Resins and plastics
Suppliers of inputs, parts and components
Product research and development
Manufactureof components
Assembly/production
Sales, distribution and marketing
After salesservice
Regulatoryapproval
Development process
Maintenance engineering and
technical support
Software development
Electrical and electronic
components
Precision metrology
Textilemanufacture
Extrusion and moulding of
plastics
Wholesale distributors
Doctorsand nurses
Publicand private hospitals
Individualpatients
Repair and maintenance
Metals
Chemicals
Glass
Textiles
Source: Economic Commission for Latin America and the Caribbean (ECLAC), on the basis of G. Gereffi, “What does the COVID-19 pandemic teach us about global value chains? The case of medical supplies”, Journal of International Business Policy, vol. 3, Berlin, Springer, 2020; P. Bamber and G. Gereffi, “Costa Rica in the medical devices global value chain: opportunities for upgrading”, Durham, Duke University, 2013.
2. Supply and demand are concentrated in developed countries
In 2018, the global market for medical devices had an estimated value of approximately US$ 425.5 billion (Fortune Business Insights, 2019), more than double the US$ 169 billion that this market was worth in 2000 (Panescu, 2006). Thus, the medical device industry has kept pace with GDP growth over the past 20 years; and, prior to the crisis triggered by the COVID-19 pandemic, it was expected to continue growing at 5.6% per year, projecting a market of US$ 594.5 billion in 2024 (Evaluate, 2018).
The market has traditionally been dominated by the developed economies, led by the United States and Europe. In 2018, the latter accounted for 27% of the global medical device market (MedTech Europe, 2020). The United States absorbs 39% of global medical device sales revenues; and, in Europe, Germany accounts for 10%, which is more than twice the share of other major countries (such as the United Kingdom, France, and Italy). Among the Asian countries, Japan has a 9% share, while China accounts for 8.1% of sales revenue. This country has one of the most dynamic markets: it doubled in size between 2011 and 2017 (Huang, 2019), and it is projected to post the highest annual growth rate in the world between 2013 and 2020, at 14% —well
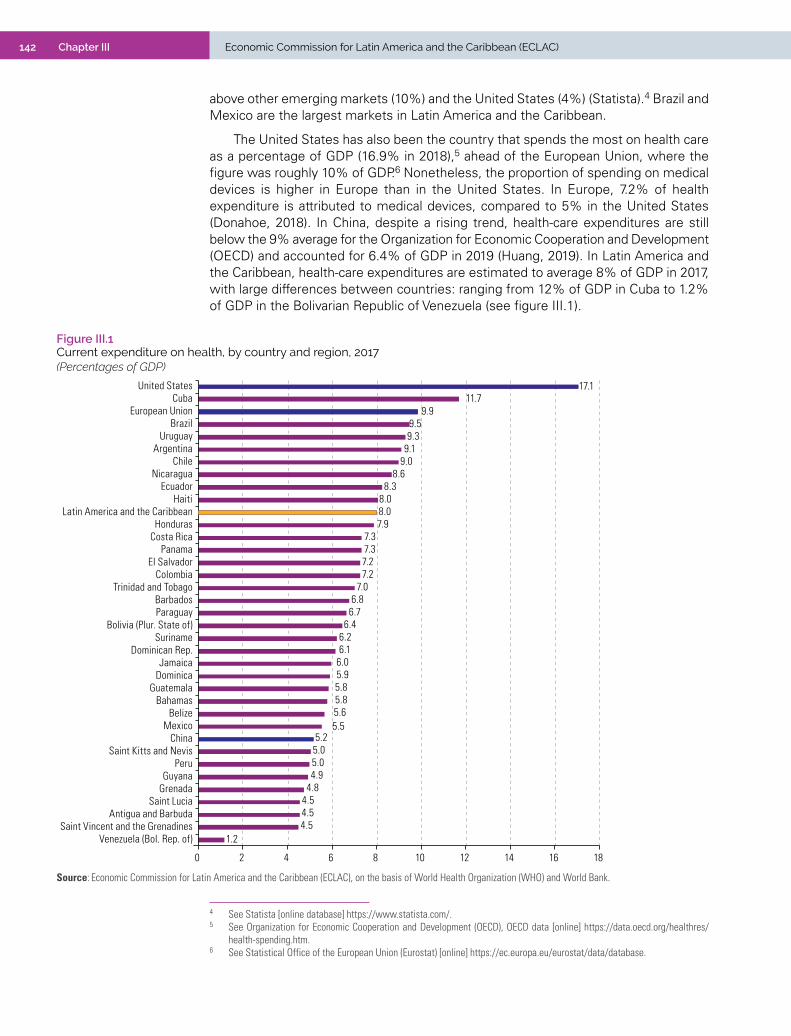
142 Chapter III Economic Commission for Latin America and the Caribbean (ECLAC)
above other emerging markets (10%) and the United States (4%) (Statista).4 Brazil and Mexico are the largest markets in Latin America and the Caribbean.
The United States has also been the country that spends the most on health care as a percentage of GDP (16.9% in 2018),5 ahead of the European Union, where the figure was roughly 10% of GDP.6 Nonetheless, the proportion of spending on medical devices is higher in Europe than in the United States. In Europe, 7.2% of health expenditure is attributed to medical devices, compared to 5% in the United States (Donahoe, 2018). In China, despite a rising trend, health-care expenditures are still below the 9% average for the Organization for Economic Cooperation and Development (OECD) and accounted for 6.4% of GDP in 2019 (Huang, 2019). In Latin America and the Caribbean, health-care expenditures are estimated to average 8% of GDP in 2017, with large differences between countries: ranging from 12% of GDP in Cuba to 1.2% of GDP in the Bolivarian Republic of Venezuela (see figure III.1).
4 See Statista [online database] https://www.statista.com/.5 See Organization for Economic Cooperation and Development (OECD), OECD data [online] https://data.oecd.org/healthres/
health-spending.htm.6 See Statistical Office of the European Union (Eurostat) [online] https://ec.europa.eu/eurostat/data/database.
Figure III.1 Current expenditure on health, by country and region, 2017(Percentages of GDP)
0 2 4 6 8 10 12 14 16 18
Venezuela (Bol. Rep. of)Saint Vincent and the Grenadines
Antigua and BarbudaSaint Lucia
GrenadaGuyana
PeruSaint Kitts and Nevis
ChinaMexico
BelizeBahamas
GuatemalaDominicaJamaica
Dominican Rep.Suriname
Bolivia (Plur. State of)ParaguayBarbados
Trinidad and TobagoColombia
El SalvadorPanama
Costa RicaHonduras
Latin America and the CaribbeanHaiti
EcuadorNicaragua
ChileArgentina
UruguayBrazil
European UnionCuba
United States
4.54.54.54.84.95.05.05.2
5.55.65.85.85.96.06.16.2
6.46.76.8
7.07.27.27.37.3
7.98.08.0
8.38.6
9.09.19.39.5
9.911.7
17.1
1.2
UE
Source: Economic Commission for Latin America and the Caribbean (ECLAC), on the basis of World Health Organization (WHO) and World Bank.
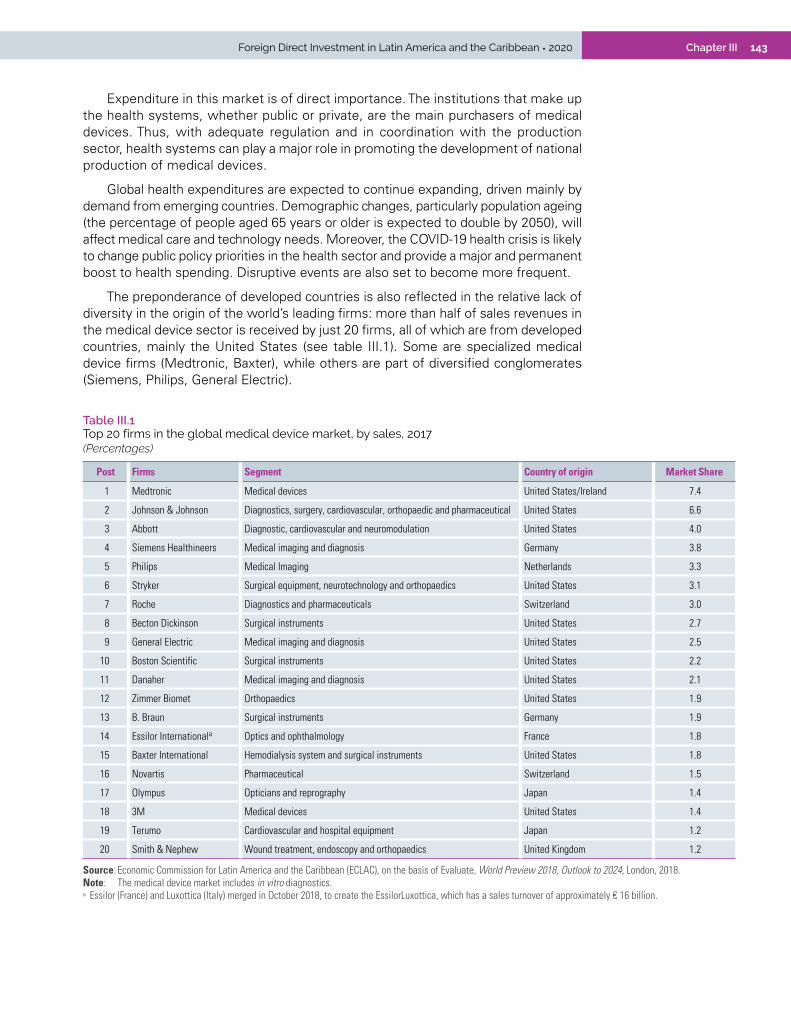
143Chapter IIIForeign Direct Investment in Latin America and the Caribbean • 2020
Expenditure in this market is of direct importance. The institutions that make up the health systems, whether public or private, are the main purchasers of medical devices. Thus, with adequate regulation and in coordination with the production sector, health systems can play a major role in promoting the development of national production of medical devices.
Global health expenditures are expected to continue expanding, driven mainly by demand from emerging countries. Demographic changes, particularly population ageing (the percentage of people aged 65 years or older is expected to double by 2050), will affect medical care and technology needs. Moreover, the COVID-19 health crisis is likely to change public policy priorities in the health sector and provide a major and permanent boost to health spending. Disruptive events are also set to become more frequent.
The preponderance of developed countries is also reflected in the relative lack of diversity in the origin of the world’s leading firms: more than half of sales revenues in the medical device sector is received by just 20 firms, all of which are from developed countries, mainly the United States (see table III.1). Some are specialized medical device firms (Medtronic, Baxter), while others are part of diversified conglomerates (Siemens, Philips, General Electric).
Table III.1 Top 20 firms in the global medical device market, by sales, 2017(Percentages)
Post Firms Segment Country of origin Market Share
1 Medtronic Medical devices United States/Ireland 7.4
2 Johnson & Johnson Diagnostics, surgery, cardiovascular, orthopaedic and pharmaceutical United States 6.6
3 Abbott Diagnostic, cardiovascular and neuromodulation United States 4.0
4 Siemens Healthineers Medical imaging and diagnosis Germany 3.8
5 Philips Medical Imaging Netherlands 3.3
6 Stryker Surgical equipment, neurotechnology and orthopaedics United States 3.1
7 Roche Diagnostics and pharmaceuticals Switzerland 3.0
8 Becton Dickinson Surgical instruments United States 2.7
9 General Electric Medical imaging and diagnosis United States 2.5
10 Boston Scientific Surgical instruments United States 2.2
11 Danaher Medical imaging and diagnosis United States 2.1
12 Zimmer Biomet Orthopaedics United States 1.9
13 B. Braun Surgical instruments Germany 1.9
14 Essilor Internationala Optics and ophthalmology France 1.8
15 Baxter International Hemodialysis system and surgical instruments United States 1.8
16 Novartis Pharmaceutical Switzerland 1.5
17 Olympus Opticians and reprography Japan 1.4
18 3M Medical devices United States 1.4
19 Terumo Cardiovascular and hospital equipment Japan 1.2
20 Smith & Nephew Wound treatment, endoscopy and orthopaedics United Kingdom 1.2
Source: Economic Commission for Latin America and the Caribbean (ECLAC), on the basis of Evaluate, World Preview 2018, Outlook to 2024, London, 2018.Note: The medical device market includes in vitro diagnostics.a Essilor (France) and Luxottica (Italy) merged in October 2018, to create the EssilorLuxottica, which has a sales turnover of approximately € 16 billion.

144 Chapter III Economic Commission for Latin America and the Caribbean (ECLAC)
In some segments (such as ophthalmology, orthopaedic products, and diagnostic imaging), the top ten firms account for nearly all market sales, which may be due either to a very high concentration in these segments or a very small number of firms (see figure III.2).
Figure III.2 Market share of top ten firms worldwide by sales, by segment, 2017(Percentages)
39
7480
91 8898
61
2620
9 122
0
10
20
30
40
50
60
70
80
90
100
Medicaldevices
In vitrodiagnostics
Cardiology Diagnosticimaging
Orthopaedics Ophthalmology
Top 10Others
Source: Economic Commission for Latin America and the Caribbean (ECLAC), on the basis of Evaluate, World Preview 2018, Outlook to 2024, London, 2018.Note: The category “Medical devices” includes in vitro diagnostics.
Larger firms have sometimes strengthened their dominant position through successive mergers and acquisitions (see section C.1). For example, the American firm Medtronic kept first place by taking over the Irish firm Covidien for US$ 52 billion in 2015 (for which reason it is now headquartered in Ireland), thus keeping Johnson & Johnson in second place.
Nonetheless, a wide range of players coexist in the medical device industry and compete for different market segments, Alongside the large transnationals, there are also many emerging firms and university-based spin-offs among the 100 largest firms in the sector (Donze and Imer, 2020).
In this connection, small and medium-sized enterprises (SMEs) are an important part of the medical device industry, both in Europe and the United States, and also in Latin America and the Caribbean (for example, in Argentina, Brazil and Mexico). In Europe, there are some 32,000 firms operating the medical device industry, 95% of which are SMEs. Most of these are from Germany, Italy, the United Kingdom, France and Switzerland (MedTech Europe 2020). In the United States, it is estimated that over 80% of medical device firms employ fewer than 50 workers.7
7 See International Trade Administration, “Medical technology spotlight” [online] https://www.selectusa.gov/medical-tech-industry-united-states.

145Chapter IIIForeign Direct Investment in Latin America and the Caribbean • 2020
3. Innovation and regulation are key elements of competition
The medical device industry is focused on improving efficiency and quality in the diagnosis, prognosis and treatment of various ailments and diseases. To achieve this objective, innovations are very important, especially in high-tech goods. Medical devices are estimated to have a life cycle of 18 to 24 months before an improved device enters the market (MedTech Europe, 2020).
A report analysing the R&D investment of the 2,500 firms with the largest investments (Hernández and others, 2020), finds that health-care industries, which include pharmaceuticals, biotechnology and medical devices, have a large share in this investment. In the United States and the European Union, the health-care industries accounted for 26.7% and 21.6% of total R&D investment in 2018, respectively. In contrast, the share is lower in Asia (12.1% in Japan and 4.8% in China).
In 2019, nearly 14,000 medical technology patent applications (including medical devices, in vitro diagnostics and digital health) were filed with the European Patent Office (EPO), representing 7.7% of all patent applications. This ranked the industry second, behind digital communication (14,175 patents) and ahead of the other areas of intensive innovation in the health sector, such as the pharmaceutical industry or biotechnology, in which 7,700 and 6,800 patents were filed, respectively (MedTech Europe, 2020).
Emerging firms and SMEs are key players in the innovation ecosystem of the medical device industry. This is partly explained by the specific nature of research and development within the sector. In medical devices, innovation often arises out of close collaboration between health-care professionals, academia, and manufacturers —an approach for which small firms are particularly well-suited. This characteristic, represents an opportunity for the sector to develop in Latin America and the Caribbean, because scale can be a problem for many high-tech industrial productions in several countries in the region. At the same time, however, it also requires close and collaborative relationships between academia and research, the health world and the business sector —which poses a huge challenge. These links have not been easy to forge in the region, although the fact that successful and innovative firms exist suggests they have the capacities needed to promote and grow this industry.
In addition to constant technological progress, another challenge for firms that develop and produce medical devices, and in particular for those entering the activity for the first time, is to keep informed and up-to-date on the regulatory requirements and to implement them in their production and marketing processes. Processing the authorizations needed to market a product in a given country can be a long and costly process, which must be completed in order to have a presence in the markets. For example, although the United States Food and Drug Administration (FDA) imposes the strictest procedures in the world, an approval from that office does not allow the approved products to be marketed in China or the European Union. Although multilateral efforts have been made to harmonize regulations, such as the International Medical Device Regulators Forum, the risk classifications of individual devices, as well as the approval process, are specific to each country (see box III.1).8
8 The International Medical Device Regulators Forum was set up in February 2011 to discuss future directions in medical device regulatory harmonization. It consists of a voluntary group of medical device regulators from around the world who came together to continue the work that began in the Global Harmonization Working Group (which operated from 1992 to 2012), and to speed up international regulatory harmonization and convergence for medical devices. It is currently composed of: Australia, Brazil, Canada, China, the European Union, Japan, the Republic of Korea, the Russian Federation, Singapore, and the United States. The World Health Organization (WHO) is an official observer. The Asian Harmonization Working Group, PAHO and the Steering Committee on Regulatory Harmonization of the Asia-Pacific Economic Cooperation (APEC) Forum are regional harmonization initiatives of the International Forum of Medical Device Regulators.

146 Chapter III Economic Commission for Latin America and the Caribbean (ECLAC)
Box III.1 Risk classifications in the world’s leading markets
The United States and the European Union classify medical devices in similar ways, based on intended use and potential health risk. Specific evaluation and monitoring rules apply to each category. Medical devices are classified in three categories in the United States and four in the European Union. The regulatory rules for approval are different in each country. In general, the regulatory approval process is estimated to take longer in the United States than in the European Union; but the time from when a device is submitted for approval until it is available for use is similar or shorter in the United States. This is basically because reimbursement decisions take significantly longer in the European Union than in the United States (Van Norman, 2016). Once authorized by the regulatory authority, health insurers have to approve the device for user reimbursement. Thus devices have to demonstrate not only clinical efficacy, but also real value (in other words, lower costs and better results).
Classification of medical devices in the United States and the European Union
United States European Union
Class I: low risk of illness or injury (examples: gauze, gloves, oxygen masks) Class I: lowest risk (examples: dressings, gloves, stethoscopes, vehicles for persons with disabilities)
Class II: moderate risk of disease or injury (examples: catheters, syringes, sutures, needles)
Class II a: moderate potential risk (examples: syringes, tracheotomy tubes, dental implants) Class II b: high potential risk (examples: ventilators, anaesthetic apparatus, radiotherapy equipment)
Class III: significant risk of disease or injury (examples: pacemakers, defibrillators, implantable prostheses)
Class III: higher risk for the individual (examples: breast implants, stents, hip prosthesis, pacemaker)
Source: Economic Commission for Latin America and the Caribbean (ECLAC), on the basis of G. Van Norman, “Drugs and devices: comparison of European and U.S. approval processes”, JACC: Basic to Translational Science, vol 1, No. 5, Amsterdam, Elsevier, 2016
B. International trade in medical devices grew moderately in recent years
1. The United States, Germany and China accounted for 41% of world exports
The value of medical device exports was about US$ 244 billion in 2018, representing 1.3% of the total value of all goods exports in that year (see figure III.3).9 Medical device exports have grown at a cumulative average annual rate of 3.0% over the past four years, thus outpacing total exports (+0.8%) although lagging the growth rate of the total medical device market. Only tariff lines for goods identifiable as medical devices were considered, based on medical supplies and medical equipment included in WTO (2020) and Helble (2012), and excluding medical supplies corresponding to the chemical or pharmaceutical industries (such as ethyl alcohol or enzymes) (see annex III.A1). This set of products does not include machines or apparatus of ambiguous use (such as certain weighing and measuring machines, or refrigeration equipment). Although these may be used in the hospital environment, their end use is not identifiable at the six-digit level of the Harmonized System. It also excludes textile products, which have the same identification problem.
9 This includes the medical device tariff lines included in WTO (2020) and Helble (2012) on the basis of the 2007 Harmonized System (see Annex III. A1). The database is the revision of the BACI International Trade Statistics Database (UN Comtrade) (Gaulier and Zignano, 2010). See Centre for Information and Prospective Studies (CEPII), BACI [online] http://www.cepii.fr/CEPII/en/bdd_modele/presentation.asp?id=37.

147Chapter IIIForeign Direct Investment in Latin America and the Caribbean • 2020
Figure III.3 Global medical device exports, 2014–2018 (Billions of dollars at current prices and percentages)
1.05
1.10
1.15
1.20
1.25
1.30
1.35
1.40
180
190
200
210
220
230
240
250
2014 2015 2016 2017 2018
Share of total exports(right scale)
Amount
Source: Economic Commission for Latin America and the Caribbean (ECLAC), on the basis of World Trade Organization (WTO), “Trade in medical goods in the context of tackling COVID-19: information note”, Geneva, 2020 [online] https://www.wto.org/english/news_e/news20_e/rese_03apr20_e.pdf; M. Helble, “More trade for better health? International trade and tariffs on health products”, Staff Working Paper, No. ERSD-2012-17, Geneva, World Trade Organization (WTO), 2012; G. Gaulier and S. Zignano, “BACI: International Trade Database at the Product-Level. The 1994-2007 Version”, CEPII Working Paper 2010, No. 23, Paris, Centre for International Prospective Studies and Information (CEPII), 2010; Centre for International Prospective Studies and Information (CEPII), BACI [online] http://www.cepii.fr/CEPII/en/bdd_modele/presentation.asp?id=37; Organization for Economic Cooperation and Development (OECD), “Harmonized System 2007 (Edition 2015)”, International Trade by Commodity Statistics, 2016 [online database] https://www.oecd-ilibrary.org/trade/data/international-trade-by-commodity-statistics/harmonized-system-2007-edition-2015-1_86252354-en.
Note: Includes the medical device tariff lines included in WTO (2020) and Helble (2012), based on the 2007 Harmonized System.
The United States and Germany account for one third of all international trade in medical devices. Data for the latest available five-year period (2014–2018) show that the joint market share of the two countries was 33.2% in exports and 26.7% in imports (see table III.2). China accounted for 7.6% of exports and 6.8% of imports on average for the period, and it is the only developing country that is present in both rankings. In general, the countries that are among the top ten exporters coincide with the importers.10 There are some exceptions, however: Ireland and Mexico are large exporters only, while Italy and the United Kingdom are only large importers. Nearly all of the major exporting countries are net exporters or have a very small deficit, and they are highly diversified in terms of destinations and origins, although the average number of origins is lower.
10 Positions in the ranking may vary marginally from year to year, as differences in trade between some countries are small.
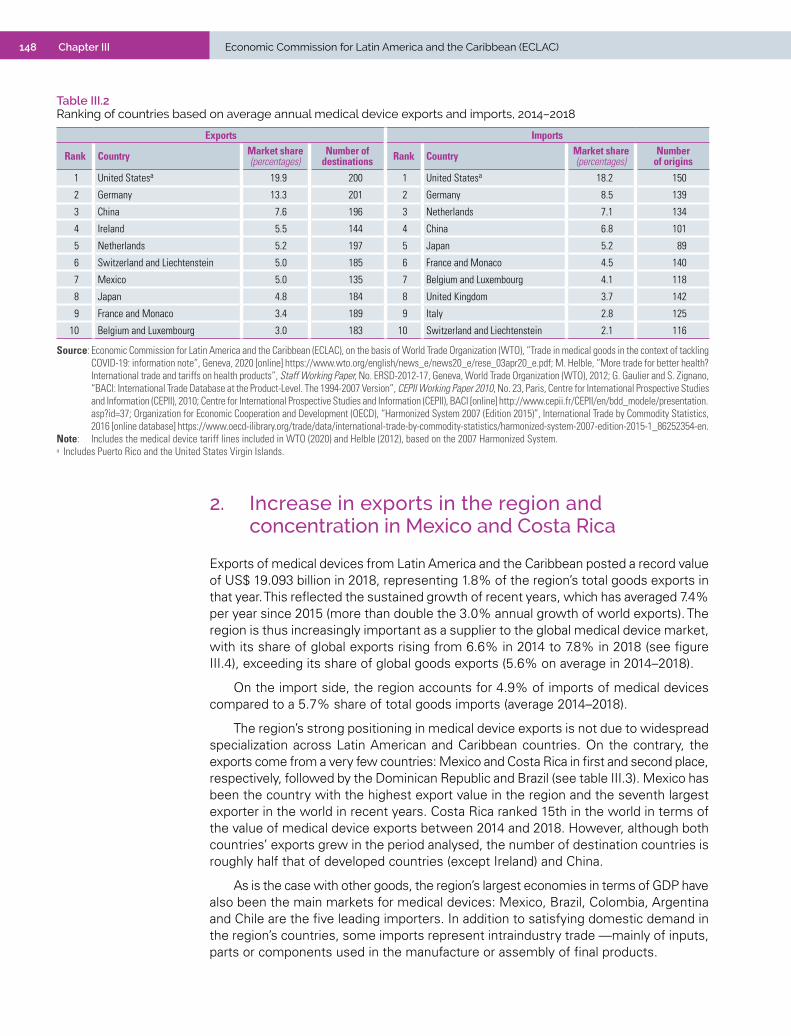
148 Chapter III Economic Commission for Latin America and the Caribbean (ECLAC)
Table III.2 Ranking of countries based on average annual medical device exports and imports, 2014–2018
Exports Imports
Rank Country Market share(percentages)
Number of destinations Rank Country Market share
(percentages)Number
of origins
1 United Statesa 19.9 200 1 United Statesa 18.2 150
2 Germany 13.3 201 2 Germany 8.5 139
3 China 7.6 196 3 Netherlands 7.1 134
4 Ireland 5.5 144 4 China 6.8 101
5 Netherlands 5.2 197 5 Japan 5.2 89
6 Switzerland and Liechtenstein 5.0 185 6 France and Monaco 4.5 140
7 Mexico 5.0 135 7 Belgium and Luxembourg 4.1 118
8 Japan 4.8 184 8 United Kingdom 3.7 142
9 France and Monaco 3.4 189 9 Italy 2.8 125
10 Belgium and Luxembourg 3.0 183 10 Switzerland and Liechtenstein 2.1 116
Source: Economic Commission for Latin America and the Caribbean (ECLAC), on the basis of World Trade Organization (WTO), “Trade in medical goods in the context of tackling COVID-19: information note”, Geneva, 2020 [online] https://www.wto.org/english/news_e/news20_e/rese_03apr20_e.pdf; M. Helble, “More trade for better health? International trade and tariffs on health products”, Staff Working Paper, No. ERSD-2012-17, Geneva, World Trade Organization (WTO), 2012; G. Gaulier and S. Zignano, “BACI: International Trade Database at the Product-Level. The 1994-2007 Version”, CEPII Working Paper 2010, No. 23, Paris, Centre for International Prospective Studies and Information (CEPII), 2010; Centre for International Prospective Studies and Information (CEPII), BACI [online] http://www.cepii.fr/CEPII/en/bdd_modele/presentation.asp?id=37; Organization for Economic Cooperation and Development (OECD), “Harmonized System 2007 (Edition 2015)”, International Trade by Commodity Statistics, 2016 [online database] https://www.oecd-ilibrary.org/trade/data/international-trade-by-commodity-statistics/harmonized-system-2007-edition-2015-1_86252354-en.
Note: Includes the medical device tariff lines included in WTO (2020) and Helble (2012), based on the 2007 Harmonized System.a Includes Puerto Rico and the United States Virgin Islands.
2. Increase in exports in the region and concentration in Mexico and Costa Rica
Exports of medical devices from Latin America and the Caribbean posted a record value of US$ 19.093 billion in 2018, representing 1.8% of the region’s total goods exports in that year. This reflected the sustained growth of recent years, which has averaged 7.4% per year since 2015 (more than double the 3.0% annual growth of world exports). The region is thus increasingly important as a supplier to the global medical device market, with its share of global exports rising from 6.6% in 2014 to 7.8% in 2018 (see figure III.4), exceeding its share of global goods exports (5.6% on average in 2014–2018).
On the import side, the region accounts for 4.9% of imports of medical devices compared to a 5.7% share of total goods imports (average 2014–2018).
The region’s strong positioning in medical device exports is not due to widespread specialization across Latin American and Caribbean countries. On the contrary, the exports come from a very few countries: Mexico and Costa Rica in first and second place, respectively, followed by the Dominican Republic and Brazil (see table III.3). Mexico has been the country with the highest export value in the region and the seventh largest exporter in the world in recent years. Costa Rica ranked 15th in the world in terms of the value of medical device exports between 2014 and 2018. However, although both countries’ exports grew in the period analysed, the number of destination countries is roughly half that of developed countries (except Ireland) and China.
As is the case with other goods, the region’s largest economies in terms of GDP have also been the main markets for medical devices: Mexico, Brazil, Colombia, Argentina and Chile are the five leading importers. In addition to satisfying domestic demand in the region’s countries, some imports represent intraindustry trade —mainly of inputs, parts or components used in the manufacture or assembly of final products.
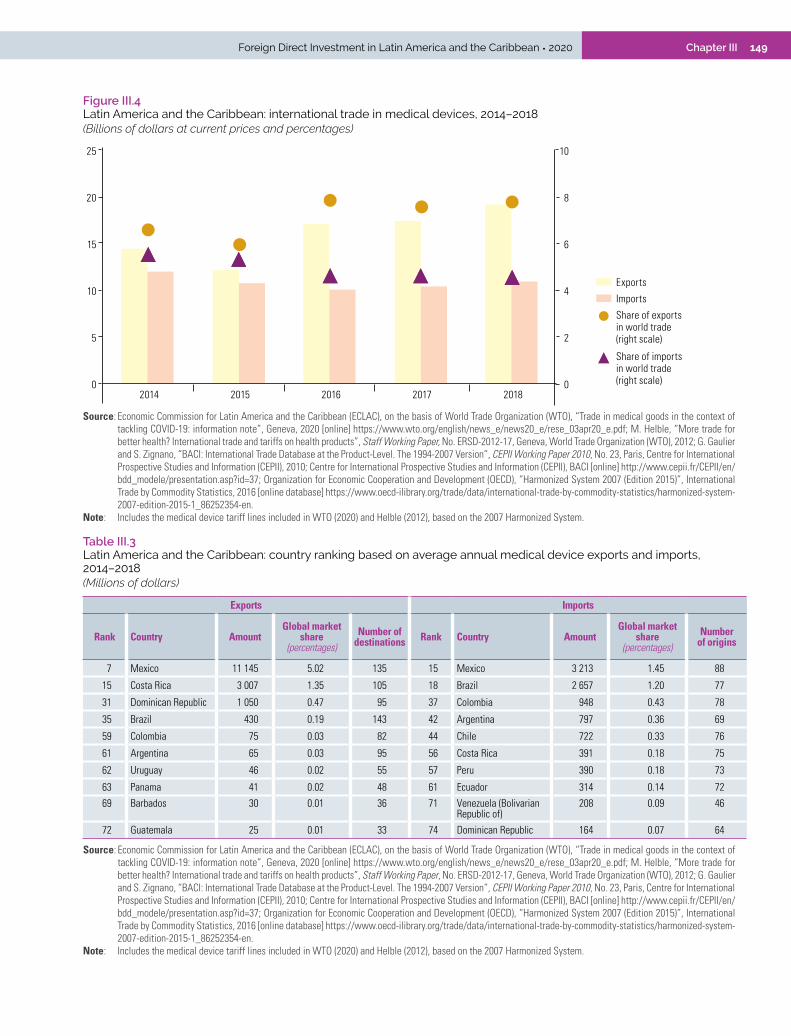
149Chapter IIIForeign Direct Investment in Latin America and the Caribbean • 2020
Figure III.4 Latin America and the Caribbean: international trade in medical devices, 2014–2018 (Billions of dollars at current prices and percentages)
0
2
4
6
8
10
0
5
10
15
20
25
2014 2015 2016 2017 2018
Share of exportsin world trade(right scale)
Imports
Exports
Share of importsin world trade(right scale)
Source: Economic Commission for Latin America and the Caribbean (ECLAC), on the basis of World Trade Organization (WTO), “Trade in medical goods in the context of tackling COVID-19: information note”, Geneva, 2020 [online] https://www.wto.org/english/news_e/news20_e/rese_03apr20_e.pdf; M. Helble, “More trade for better health? International trade and tariffs on health products”, Staff Working Paper, No. ERSD-2012-17, Geneva, World Trade Organization (WTO), 2012; G. Gaulier and S. Zignano, “BACI: International Trade Database at the Product-Level. The 1994-2007 Version”, CEPII Working Paper 2010, No. 23, Paris, Centre for International Prospective Studies and Information (CEPII), 2010; Centre for International Prospective Studies and Information (CEPII), BACI [online] http://www.cepii.fr/CEPII/en/bdd_modele/presentation.asp?id=37; Organization for Economic Cooperation and Development (OECD), “Harmonized System 2007 (Edition 2015)”, International Trade by Commodity Statistics, 2016 [online database] https://www.oecd-ilibrary.org/trade/data/international-trade-by-commodity-statistics/harmonized-system-2007-edition-2015-1_86252354-en.
Note: Includes the medical device tariff lines included in WTO (2020) and Helble (2012), based on the 2007 Harmonized System.
Table III.3 Latin America and the Caribbean: country ranking based on average annual medical device exports and imports, 2014–2018(Millions of dollars)
Exports Imports
Rank Country AmountGlobal market
share (percentages)
Number of destinations Rank Country Amount
Global market share
(percentages)Number
of origins
7 Mexico 11 145 5.02 135 15 Mexico 3 213 1.45 88
15 Costa Rica 3 007 1.35 105 18 Brazil 2 657 1.20 77
31 Dominican Republic 1 050 0.47 95 37 Colombia 948 0.43 78
35 Brazil 430 0.19 143 42 Argentina 797 0.36 69
59 Colombia 75 0.03 82 44 Chile 722 0.33 76
61 Argentina 65 0.03 95 56 Costa Rica 391 0.18 75
62 Uruguay 46 0.02 55 57 Peru 390 0.18 73
63 Panama 41 0.02 48 61 Ecuador 314 0.14 72
69 Barbados 30 0.01 36 71 Venezuela (Bolivarian Republic of)
208 0.09 46
72 Guatemala 25 0.01 33 74 Dominican Republic 164 0.07 64
Source: Economic Commission for Latin America and the Caribbean (ECLAC), on the basis of World Trade Organization (WTO), “Trade in medical goods in the context of tackling COVID-19: information note”, Geneva, 2020 [online] https://www.wto.org/english/news_e/news20_e/rese_03apr20_e.pdf; M. Helble, “More trade for better health? International trade and tariffs on health products”, Staff Working Paper, No. ERSD-2012-17, Geneva, World Trade Organization (WTO), 2012; G. Gaulier and S. Zignano, “BACI: International Trade Database at the Product-Level. The 1994-2007 Version”, CEPII Working Paper 2010, No. 23, Paris, Centre for International Prospective Studies and Information (CEPII), 2010; Centre for International Prospective Studies and Information (CEPII), BACI [online] http://www.cepii.fr/CEPII/en/bdd_modele/presentation.asp?id=37; Organization for Economic Cooperation and Development (OECD), “Harmonized System 2007 (Edition 2015)”, International Trade by Commodity Statistics, 2016 [online database] https://www.oecd-ilibrary.org/trade/data/international-trade-by-commodity-statistics/harmonized-system-2007-edition-2015-1_86252354-en.
Note: Includes the medical device tariff lines included in WTO (2020) and Helble (2012), based on the 2007 Harmonized System.

150 Chapter III Economic Commission for Latin America and the Caribbean (ECLAC)
3. Goods of medium and low technological complexity generate more exports
Export specialization, according to the technological complexity of the medical devices in question, shows that most of the surplus in Latin America and the Caribbean corresponds to products classified as low- and medium-technological complexity (see section A). In contrast, the region as a whole has a deficit in products of high technological complexity. The total trade balance, which came in at US$ 8.112 billion in 2018, was explained mainly by Mexico, followed by Costa Rica and, thirdly, by the Dominican Republic (see figure III.5).
Figure III.5 Latin America and the Caribbean: balance of trade in medical devices, by technological complexity, 2014–2018 (Billions of dollars)
-2
-1
0
1
2
3
4
5
Latin
Am
eric
aan
d th
e Ca
ribbe
an
Mex
ico
Cost
a Ri
ca
Dom
inic
an R
ep.
Othe
r Car
ibbe
anco
untri
es
Peru
Othe
r Cen
tral
Amer
ican
cou
ntrie
s
Chile
Othe
r Sou
thAm
eric
an c
ount
ries
Arge
ntin
a
Colo
mbi
a
Braz
il
LowMediumHigh
Source: Economic Commission for Latin America and the Caribbean (ECLAC), on the basis of World Trade Organization (WTO), “Trade in medical goods in the context of tackling COVID-19: information note”, Geneva, 2020 [online] https://www.wto.org/english/news_e/news20_e/rese_03apr20_e.pdf; M. Helble, “More trade for better health? International trade and tariffs on health products”, Staff Working Paper, No. ERSD-2012-17, Geneva, World Trade Organization (WTO), 2012; G. Gaulier and S. Zignano, “BACI: International Trade Database at the Product-Level. The 1994-2007 Version”, CEPII Working Paper 2010, No. 23, Paris, Centre for International Prospective Studies and Information (CEPII), 2010; Centre for International Prospective Studies and Information (CEPII), BACI [online] http://www.cepii.fr/CEPII/en/bdd_modele/presentation.asp?id=37; F. Peirano, “Equipamiento médico en la Argentina”, Santiago, Economic Commission for Latin America and the Caribbean (ECLAC), 2017, unpublished; Organization for Economic Cooperation and Development (OECD), “Harmonized System 2007 (Edition 2015)”, International Trade by Commodity Statistics, 2016 [online database] https://www.oecd-ilibrary.org/trade/data/international-trade-by-commodity-statistics/harmonized-system-2007-edition-2015-1_86252354-en.
Note: Includes tariff lines published by WTO (2020) and Helble (2012), based on the 2007 Harmonized System. The classification by technological category follows the criteria proposed by Peirano (2017).
The exports of the three main exporting countries in Latin America and the Caribbean have a larger share of medium- and low-complexity goods than both the global average and the world’s three main exporting countries (see figure III.6). Globally, just over a quarter of the value exported in medical devices corresponds to goods that can be classified as of low technological complexity; whereas, in the region, this proportion is close to 40%. High-complexity goods are predominant in the leading countries in the industry (Germany and the United States). China has a more homogeneous structure among the three categories, but high-complexity goods also have a larger share than in the case of Latin America and the Caribbean. The region’s exports had a 12.3% share of the world market for low-complexity goods, 8.1% for medium-complexity goods and 3.3% for high-complexity products.

151Chapter IIIForeign Direct Investment in Latin America and the Caribbean • 2020
Figure III.6 Medical device exports, by technological complexity, average 2014–2018 (Percentages)
41 44 4535
19 1724
15
33 3238
34
44 4438
69
26 2417
3138 39 38
16
0
10
20
30
40
50
60
70
80
90
100
UnitedStates
Germany China Latin Americaand the Caribbean
World Costa Rica DominicanRep.
MexicoHighMedium Low
Source: Economic Commission for Latin America and the Caribbean (ECLAC), on the basis of World Trade Organization (WTO), “Trade in medical goods in the context of tackling COVID-19: information note”, Geneva, 2020 [online] https://www.wto.org/english/news_e/news20_e/rese_03apr20_e.pdf; M. Helble, “More trade for better health? International trade and tariffs on health products”, Staff Working Paper, No. ERSD-2012-17, Geneva, World Trade Organization (WTO), 2012; G. Gaulier and S. Zignano, “BACI: International Trade Database at the Product-Level. The 1994-2007 Version”, CEPII Working Paper 2010, No. 23, Paris, Centre for International Prospective Studies and Information (CEPII), 2010; Centre for International Prospective Studies and Information (CEPII), BACI [online] http://www.cepii.fr/CEPII/en/bdd_modele/presentation.asp?id=37; F. Peirano, “Equipamiento médico en la Argentina”, Santiago, Economic Commission for Latin America and the Caribbean (ECLAC), 2017, unpublished; Organization for Economic Cooperation and Development (OECD), “Harmonized System 2007 (Edition 2015)”, International Trade by Commodity Statistics, 2016 [online database] https://www.oecd-ilibrary.org/trade/data/international-trade-by-commodity-statistics/harmonized-system-2007-edition-2015-1_86252354-en.
Note: Includes tariff lines published by WTO (2020) and Helble (2012), Harmonized System 2002 to 2006 and Harmonized System 2007 onwards. The classification by technological category follows the criteria proposed by Peirano (2017).
The expansion of the medical device industry in the last few decades has fuelled not only a sustained increase in exports in Costa Rica and Mexico, but also an increase in the share of highly complex technological goods in the export basket of this value chain. In Costa Rica, for example, between 2002 and 2007 only 6.4% of the value exported represented goods of high technological complexity; but the proportion had risen since 2008 to reach 26% in 2017 and 2018 (see figure III.7).
It is worth considering the products in which the countries of the region are specialized. Two tariff lines account for most of the value of international trade in medical devices, both in the region and worldwide: (i) instruments and apparatus for medical, surgical or veterinary use, not covered elsewhere, including a wide variety of products (such as pressure measuring devices, defibrillators, incubators, heart monitors, dialysis devices, anesthesia devices and others) and their parts and accessories (code 901890 of the 2007 Harmonized System (HS)), and (ii) syringes, needles, catheters, cannulae and the like, for medical use (HS code 901839). Between 2014 and 2018, 31% of world trade was concentrated in these two lines (20% and 11%, respectively), while in Latin America and the Caribbean the percentage was 62% (37.4% and 24.4%, respectively) (see table III.4). The first tariff line includes medical and surgical instruments and devices that are considered of medium technological complexity, while the second refers mainly to disposable items (syringes, needles and similar), which are classified as low technological complexity.

152 Chapter III Economic Commission for Latin America and the Caribbean (ECLAC)
Figure III.7 Costa Rica and Mexico: medical device exports, by technological complexity, 2002–2018 and 2007–2018 (Billions of dollars)
0
0.5
1.0
1.5
2.0
2.5
3.0
3.5
4.0
4.5
2002 2003 2004 2005 2006 2007 2008 2009 2010 2011 2012 2013 2014 2015 2016 2017 2018HighMediumLow
A. Costa Rica
HighMediumLow
0
2
4
6
8
10
12
14
16
2007 2008 2009 2010 2011 2012 2013 2014 2015 2016 2017 2018
B. Mexico
Source: Economic Commission for Latin America and the Caribbean (ECLAC), on the basis of World Trade Organization (WTO), “Trade in medical goods in the context of tackling COVID-19: information note”, Geneva, 2020 [online] https://www.wto.org/english/news_e/news20_e/rese_03apr20_e.pdf; M. Helble, “More trade for better health? International trade and tariffs on health products”, Staff Working Paper, No. ERSD-2012-17, Geneva, World Trade Organization (WTO), 2012; G. Gaulier and S. Zignano, “BACI: International Trade Database at the Product-Level. The 1994-2007 Version”, CEPII Working Paper 2010, No. 23, Paris, Centre for International Prospective Studies and Information (CEPII), 2010; Centre for International Prospective Studies and Information (CEPII), BACI [online] http://www.cepii.fr/CEPII/en/bdd_modele/presentation.asp?id=37; F. Peirano, “Equipamiento médico en la Argentina”, Santiago, Economic Commission for Latin America and the Caribbean (ECLAC), 2017, unpublished; Organization for Economic Cooperation and Development (OECD), “Harmonized System 2007 (Edition 2015)”, International Trade by Commodity Statistics, 2016 [online database] https://www.oecd-ilibrary.org/trade/data/international-trade-by-commodity-statistics/harmonized-system-2007-edition-2015-1_86252354-en; “Harmonized System 2002 (Edition 2018)”, International Trade by Commodity Statistics, 2019 [online database] https://www.oecd-ilibrary.org/trade/data/international-trade-by-commodity-statistics/harmonized-system-2002-edition-2018_108400ef-en.
Note: Includes tariff lines published by WTO (2020) and Helble (2012), Harmonized System 2002 to 2006 and Harmonized System 2007 onwards. The classification by technological category follows the criteria proposed by Peirano (2017).

153Chapter IIIForeign Direct Investment in Latin America and the Caribbean • 2020
Table III.4 Latin America and the Caribbean: main medical devices exported, average 2014–2018
Harmonized System 2007 Description Share
(percentages)High (24 tariff positions)
902139 Artificial parts of the body (other than artificial teeth and joints 5. 7
901819 Electro-diagnostic apparatus, including apparatus for functional exploratory examination or for checking of physiological parameters 5. 4
902190 Appliances; worn, carried, or implanted in the body, to compensate for a defect or disability (other than artificial parts of the body and apparatus, as well as hearing aids and cardiac stimulators, complete)
3. 8
902140 Hearing aids (excluding parts and accessories) 1. 5
902290 Apparatus based on use of x-rays and similar; parts and accessories (x-ray generators, tubes, high tension generators, control panels and desks, screens, examination or treatment tables, chairs and like, parts thereof and other apparatus of heading 9022 n.e.c.
0. 5
Other high 2,0Medium (11 tariff positions)
901890 Medical, surgical or dental instruments and appliances n.e.c.(defibrillators, incubators, heart monitors, dialysis equipment, anaesthesia equipment; parts and accessories)
37. 4
901920 Therapeutic respiration apparatus; ozone, oxygen, aerosol therapy apparatus; artificial respiration or other therapeutic respiration apparatus
2. 6
940290 Operating tables, examination tables and other special furniture for medicine, surgery, dentistry or veterinary medicine (excluding dentist’s chairs and other seats and tables specially designed for radiological examinations, as well as stretchers with or without wheels)
1. 5
902780 Instruments and apparatus for physical or chemical analysis, for testing viscosity, porosity, expansion, surface tension or similar, or for calorimetric, acoustic or photometric measurements, n.e.c.
0. 6
841920 Medical, surgical or laboratory sterilizers 0. 5
Other medium 1.0
Low (12 tariff positions)
901839 Syringes, needles, catheters, cannulas and similar instruments for medical use 24. 4
902110 Orthopaedic and fracture devices 4. 8
901831 Syringes, with or without needles 2. 5
902129 Dentures (excluding teeth) 1. 4
901832 Tubular metal needles and needles for sutures 1. 4
300510 Dressings and other articles, with an adhesive layer, for medical, surgical, dental or veterinary purposes 1. 1
902519 Thermometers and pyrometers; (other than liquid filled, for direct reading), not combined with other instruments 1. 1
Other low 0.9
Source: Economic Commission for Latin America and the Caribbean (ECLAC), on the basis of World Trade Organization (WTO), “Trade in medical goods in the context of tackling COVID-19: information note”, Geneva, 2020 [online] https://www.wto.org/english/news_e/news20_e/rese_03apr20_e.pdf; M. Helble, “More trade for better health? International trade and tariffs on health products”, Staff Working Paper, No. ERSD-2012-17, Geneva, World Trade Organization (WTO), 2012; G. Gaulier and S. Zignano, “BACI: International Trade Database at the Product-Level. The 1994-2007 Version”, CEPII Working Paper 2010, No. 23, Paris, Centre for International Prospective Studies and Information (CEPII), 2010; Centre for International Prospective Studies and Information (CEPII), BACI [online] http://www.cepii.fr/CEPII/en/bdd_modele/presentation.asp?id=37; F. Peirano, “Equipamiento médico en la Argentina”, Santiago, Economic Commission for Latin America and the Caribbean (ECLAC), 2017, unpublished; Organization for Economic Cooperation and Development (OECD), “Harmonized System 2007 (Edition 2015)”, International Trade by Commodity Statistics, 2016 [online database] https://www.oecd-ilibrary.org/trade/data/international-trade-by-commodity-statistics/harmonized-system-2007-edition-2015-1_86252354-en.
Note: n.e.c. – not elsewhere classified.
Exports of products of high technological complexity include therapeutic devices (including prostheses, implants and hearing aids), while diagnostic and imaging equipment included a large share of electrodiagnostic devices and X-ray generating devices. Therapeutic devices had a larger share in the value of high-complexity exports in Costa Rica (87%), where diagnostic and imaging equipment was ranked second (11%). In Mexico both had a similar share (50% and 49%, respectively), while in the Dominican Republic diagnostic equipment accounted for 93% of its exports of high-complexity products. In all countries, ophthalmological instruments and devices absorbed a very small share, although exports are steadily increasing.
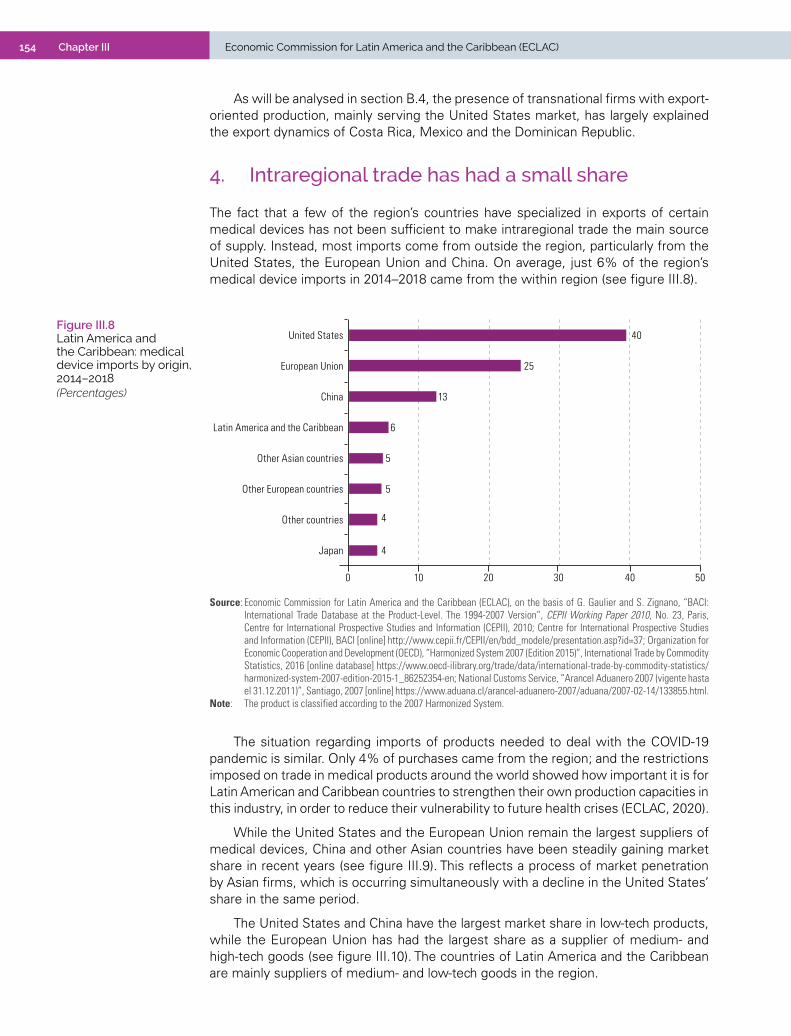
154 Chapter III Economic Commission for Latin America and the Caribbean (ECLAC)
As will be analysed in section B.4, the presence of transnational firms with export-oriented production, mainly serving the United States market, has largely explained the export dynamics of Costa Rica, Mexico and the Dominican Republic.
4. Intraregional trade has had a small share
The fact that a few of the region’s countries have specialized in exports of certain medical devices has not been sufficient to make intraregional trade the main source of supply. Instead, most imports come from outside the region, particularly from the United States, the European Union and China. On average, just 6% of the region’s medical device imports in 2014–2018 came from the within region (see figure III.8).
Figure III.8 Latin America and the Caribbean: medical device imports by origin, 2014–2018 (Percentages)
4
4
5
5
6
13
25
40
10 20 30 40 50
Japan
Other countries
Other European countries
Other Asian countries
Latin America and the Caribbean
China
European Union
United States
0
Source: Economic Commission for Latin America and the Caribbean (ECLAC), on the basis of G. Gaulier and S. Zignano, “BACI: International Trade Database at the Product-Level. The 1994-2007 Version”, CEPII Working Paper 2010, No. 23, Paris, Centre for International Prospective Studies and Information (CEPII), 2010; Centre for International Prospective Studies and Information (CEPII), BACI [online] http://www.cepii.fr/CEPII/en/bdd_modele/presentation.asp?id=37; Organization for Economic Cooperation and Development (OECD), “Harmonized System 2007 (Edition 2015)”, International Trade by Commodity Statistics, 2016 [online database] https://www.oecd-ilibrary.org/trade/data/international-trade-by-commodity-statistics/harmonized-system-2007-edition-2015-1_86252354-en; National Customs Service, “Arancel Aduanero 2007 (vigente hasta el 31.12.2011)”, Santiago, 2007 [online] https://www.aduana.cl/arancel-aduanero-2007/aduana/2007-02-14/133855.html.
Note: The product is classified according to the 2007 Harmonized System.
The situation regarding imports of products needed to deal with the COVID-19 pandemic is similar. Only 4% of purchases came from the region; and the restrictions imposed on trade in medical products around the world showed how important it is for Latin American and Caribbean countries to strengthen their own production capacities in this industry, in order to reduce their vulnerability to future health crises (ECLAC, 2020).
While the United States and the European Union remain the largest suppliers of medical devices, China and other Asian countries have been steadily gaining market share in recent years (see figure III.9). This reflects a process of market penetration by Asian firms, which is occurring simultaneously with a decline in the United States’ share in the same period.
The United States and China have the largest market share in low-tech products, while the European Union has had the largest share as a supplier of medium- and high-tech goods (see figure III.10). The countries of Latin America and the Caribbean are mainly suppliers of medium- and low-tech goods in the region.
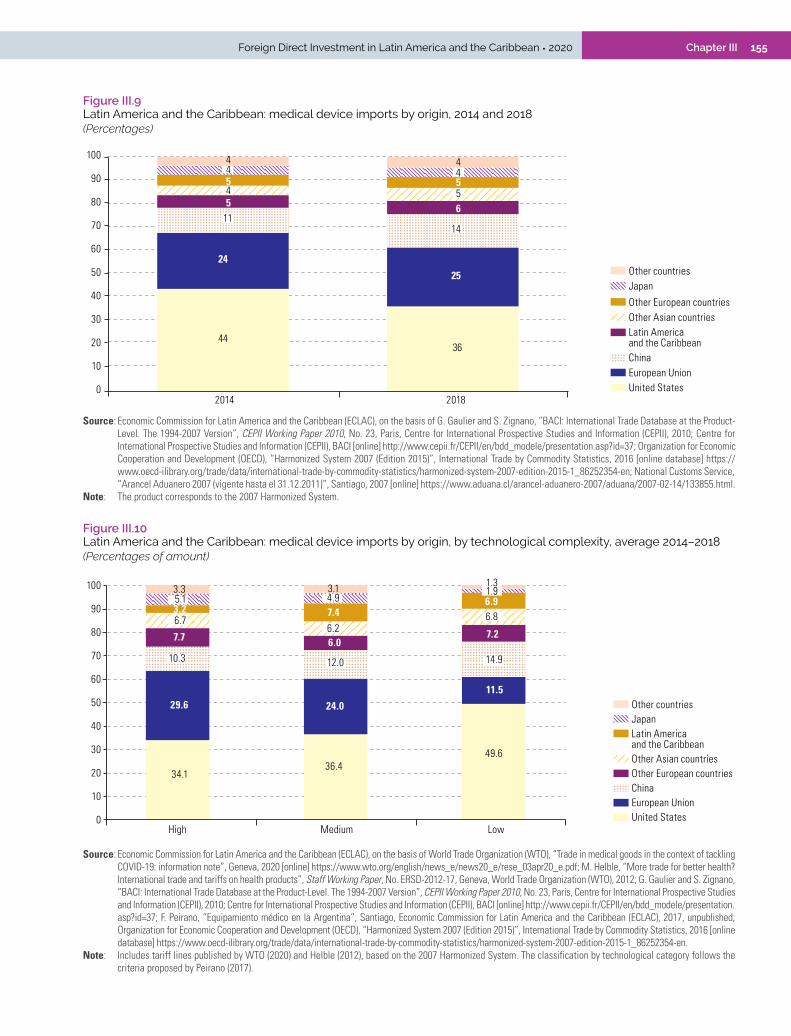
155Chapter IIIForeign Direct Investment in Latin America and the Caribbean • 2020
Figure III.9 Latin America and the Caribbean: medical device imports by origin, 2014 and 2018(Percentages)
4436
24
25
5 6
5 5
4 4
0
10
20
30
40
50
60
70
80
90
100
2014 2018United StatesEuropean UnionChina
Latin Americaand the Caribbean
Other Asian countriesOther European countries
JapanOther countries
4
4
11
4
5
14
Source: Economic Commission for Latin America and the Caribbean (ECLAC), on the basis of G. Gaulier and S. Zignano, “BACI: International Trade Database at the Product-Level. The 1994-2007 Version”, CEPII Working Paper 2010, No. 23, Paris, Centre for International Prospective Studies and Information (CEPII), 2010; Centre for International Prospective Studies and Information (CEPII), BACI [online] http://www.cepii.fr/CEPII/en/bdd_modele/presentation.asp?id=37; Organization for Economic Cooperation and Development (OECD), “Harmonized System 2007 (Edition 2015)”, International Trade by Commodity Statistics, 2016 [online database] https://www.oecd-ilibrary.org/trade/data/international-trade-by-commodity-statistics/harmonized-system-2007-edition-2015-1_86252354-en; National Customs Service, “Arancel Aduanero 2007 (vigente hasta el 31.12.2011)”, Santiago, 2007 [online] https://www.aduana.cl/arancel-aduanero-2007/aduana/2007-02-14/133855.html.
Note: The product corresponds to the 2007 Harmonized System.
Figure III.10 Latin America and the Caribbean: medical device imports by origin, by technological complexity, average 2014–2018(Percentages of amount)
34.1 36.4
49.6
29.6 24.0
11.5
7.7 6.0 7.2
3.2 7.4 6.9
3.3 3.1
High Medium Low0
10
20
30
40
50
60
70
80
90
100
10.3 12.0 14.9
5.1 4.9
6.7 6.2
6.8
1.9 1.3
United StatesEuropean UnionChina
Latin Americaand the CaribbeanOther Asian countriesOther European countries
JapanOther countries
Source: Economic Commission for Latin America and the Caribbean (ECLAC), on the basis of World Trade Organization (WTO), “Trade in medical goods in the context of tackling COVID-19: information note”, Geneva, 2020 [online] https://www.wto.org/english/news_e/news20_e/rese_03apr20_e.pdf; M. Helble, “More trade for better health? International trade and tariffs on health products”, Staff Working Paper, No. ERSD-2012-17, Geneva, World Trade Organization (WTO), 2012; G. Gaulier and S. Zignano, “BACI: International Trade Database at the Product-Level. The 1994-2007 Version”, CEPII Working Paper 2010, No. 23, Paris, Centre for International Prospective Studies and Information (CEPII), 2010; Centre for International Prospective Studies and Information (CEPII), BACI [online] http://www.cepii.fr/CEPII/en/bdd_modele/presentation.asp?id=37; F. Peirano, “Equipamiento médico en la Argentina”, Santiago, Economic Commission for Latin America and the Caribbean (ECLAC), 2017, unpublished; Organization for Economic Cooperation and Development (OECD), “Harmonized System 2007 (Edition 2015)”, International Trade by Commodity Statistics, 2016 [online database] https://www.oecd-ilibrary.org/trade/data/international-trade-by-commodity-statistics/harmonized-system-2007-edition-2015-1_86252354-en.
Note: Includes tariff lines published by WTO (2020) and Helble (2012), based on the 2007 Harmonized System. The classification by technological category follows the criteria proposed by Peirano (2017).

156 Chapter III Economic Commission for Latin America and the Caribbean (ECLAC)
C. Foreign direct investment (FDI) has been concentrated in the advanced economies
1. In emerging countries, investment has targeted market access and, in a few cases, the pursuit of efficiency
In several manufacturing industries of medium and high technological complexity, such as automotive and electronics, production has been organized in global value chains. The firms that own the trademarks and patents have set up manufacturing plants outside their countries of origin. These have followed the rationales generally used to make long-term investments abroad: taking advantage of cost advantages, seeking efficiency, accessing markets and, sometimes, having access to strategic assets. This internationalization strategy is reflected, among other indicators, in the cross-border capital flows in these sectors, mainly between the countries of origin of the parent firms and the countries where the manufacturing activities are located.
In the medical device industry, this phenomenon was not widespread. The sector offshored its production to a limited extent, as shown in low cross-border capital flows. Project announcements make it possible to detect the start of new operations abroad (or at least the intention to establish such operations). Between 2010 and 2019, these announcements in the medical device industry averaged US$ 3.3 billion per year, with a cumulative total of around US$ 16.5 billion per five-year period (see figure III.11B). The medical device industry, with a share of 0.4% of the total value of global announcements (annual average), has been one of the five industries with the lowest amounts of announcements in the world.
In contrast, mergers and acquisitions (M&As) in which the target firms were in the medical device industry have been larger, enabling the growth and consolidation of many of the leading firms, mainly from the most advanced economies. Unlike project announcements that envisage the construction of new capacities abroad, cross-border M&As show interest in acquiring production capacities already existing in the target country; and they may or may not involve FDI inflows into that country, depending on the characteristics of each deal.11 The cumulative values of M&A activity were at least US$ 82 billion and US$ 137 billion in the five-year periods 2010-2014 and 2015-2019, respectively, with an annual average of around US$ 22 billion over the decade (see figure III.11A).12
This difference between the amount of announcements and the amount of M&As in the medical device sector differs somewhat from what usually happens when considering the two magnitudes. On a global average, the annual amount of total cross-border M&A has been less than the amount of project announcements (US$ 724 billion per year as against US$ 819 billion per year, respectively, average 2015-2019) (UNCTAD, 2020).
In addition to mobilizing larger volumes of capital than the announced project of investments, cross-border M&As targeting firms in the medical device industry have been much more dynamic than project announcements and have grown steadily over the past decade. A comparison of the average number of transactions per year between the first and second half of the decade shows that the number of M&As increased by 30% (from 172 to 223 transactions per year, on average), while investment announcements grew by just 3% (from 166 to 171 announcements per year, on average) (see figure III.11).
11 For example, when the target firm is already foreign-owned, it is unlikely that such an operation will generate FDI inflows into the country where it is located.
12 The total value of mergers and acquisitions in the industry is underestimated, since the amount of the operation is only known in 52% of the observations analysed. The largest acquisition to date was recorded in 2015, for US$ 52.630 billion.
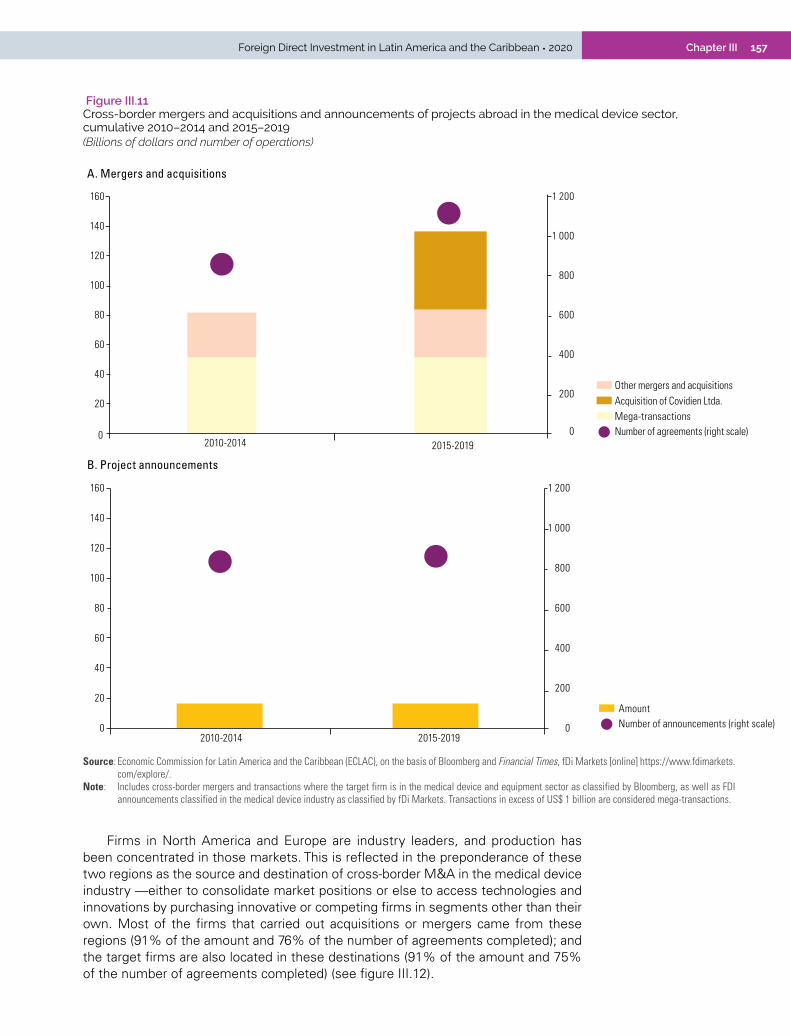
157Chapter IIIForeign Direct Investment in Latin America and the Caribbean • 2020
Figure III.11 Cross-border mergers and acquisitions and announcements of projects abroad in the medical device sector, cumulative 2010–2014 and 2015–2019(Billions of dollars and number of operations)
200
400
600
800
1 000
1 200
20
40
60
80
100
120
140
160
2010-2014 2015-201900 Number of agreements (right scale)
Mega-transactions
Other mergers and acquisitionsAcquisition of Covidien Ltda.
A. Mergers and acquisitions
B. Project announcements
0
200
400
600
800
1 000
1 200
0
20
40
60
80
100
120
140
160
2010-2014 2015-2019Number of announcements (right scale)Amount
Source: Economic Commission for Latin America and the Caribbean (ECLAC), on the basis of Bloomberg and Financial Times, fDi Markets [online] https://www.fdimarkets.com/explore/.
Note: Includes cross-border mergers and transactions where the target firm is in the medical device and equipment sector as classified by Bloomberg, as well as FDI announcements classified in the medical device industry as classified by fDi Markets. Transactions in excess of US$ 1 billion are considered mega-transactions.
Firms in North America and Europe are industry leaders, and production has been concentrated in those markets. This is reflected in the preponderance of these two regions as the source and destination of cross-border M&A in the medical device industry —either to consolidate market positions or else to access technologies and innovations by purchasing innovative or competing firms in segments other than their own. Most of the firms that carried out acquisitions or mergers came from these regions (91% of the amount and 76% of the number of agreements completed); and the target firms are also located in these destinations (91% of the amount and 75% of the number of agreements completed) (see figure III.12).
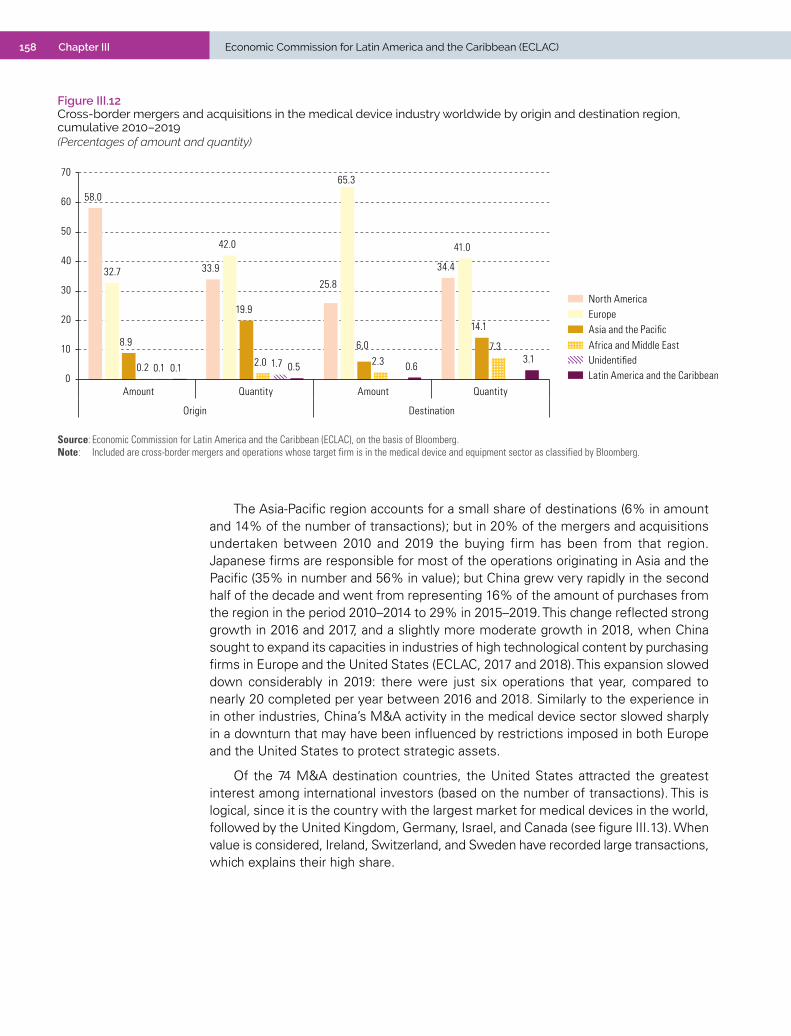
158 Chapter III Economic Commission for Latin America and the Caribbean (ECLAC)
Figure III.12 Cross-border mergers and acquisitions in the medical device industry worldwide by origin and destination region, cumulative 2010–2019(Percentages of amount and quantity)
58.0
33.9
25.8
34.432.7
42.0
65.3
41.0
8.9
19.9
6.0
14.1
0.2 2.0 2.37.3
0.1 1.70.1 0.5 0.63.1
Amount Quantity Amount Quantity
Origin Destination
North AmericaEuropeAsia and the PacificAfrica and Middle EastUnidentifiedLatin America and the Caribbean0
10
20
30
40
50
60
70
Source: Economic Commission for Latin America and the Caribbean (ECLAC), on the basis of Bloomberg.Note: Included are cross-border mergers and operations whose target firm is in the medical device and equipment sector as classified by Bloomberg.
The Asia-Pacific region accounts for a small share of destinations (6% in amount and 14% of the number of transactions); but in 20% of the mergers and acquisitions undertaken between 2010 and 2019 the buying firm has been from that region. Japanese firms are responsible for most of the operations originating in Asia and the Pacific (35% in number and 56% in value); but China grew very rapidly in the second half of the decade and went from representing 16% of the amount of purchases from the region in the period 2010–2014 to 29% in 2015–2019. This change reflected strong growth in 2016 and 2017, and a slightly more moderate growth in 2018, when China sought to expand its capacities in industries of high technological content by purchasing firms in Europe and the United States (ECLAC, 2017 and 2018). This expansion slowed down considerably in 2019: there were just six operations that year, compared to nearly 20 completed per year between 2016 and 2018. Similarly to the experience in in other industries, China’s M&A activity in the medical device sector slowed sharply in a downturn that may have been influenced by restrictions imposed in both Europe and the United States to protect strategic assets.
Of the 74 M&A destination countries, the United States attracted the greatest interest among international investors (based on the number of transactions). This is logical, since it is the country with the largest market for medical devices in the world, followed by the United Kingdom, Germany, Israel, and Canada (see figure III.13). When value is considered, Ireland, Switzerland, and Sweden have recorded large transactions, which explains their high share.

159Chapter IIIForeign Direct Investment in Latin America and the Caribbean • 2020
Figure III.13 Cross-border mergers and acquisitions in the medical device industry worldwide by country of destination, 2010–2019 (Percentages of amount and quantity)
0 5 10 15 20 25 30
IrelandUnited States
SwitzerlandGermanySweden
United KingdomChinaIsrael
FranceItaly
CanadaJapan
NetherlandsAustralia
SingaporeOther countries
A. Amount
27
166
55
2222
2
3
1111
24
0 5 10 15 20 25 30 35
United StatesUnited Kingdom
GermanyIsrael
CanadaFranceChina
SwitzerlandNetherlands
BrazilIndia
SwedenItaly
AustraliaIreland
Other countries
B. Number
298
85
554
33222222
15
Source: Economic Commission for Latin America and the Caribbean (ECLAC), on the basis of Bloomberg.
Over the last decade, six of the ten largest M&As in the industry took place in Ireland, Switzerland and Sweden, and enabled leading firms from developed countries to consolidate in different market segments. The purchase of the Irish firm Covidien by Medtronic of the United States was the largest operation in the industry to date (see table III.5). Founded by two electrical engineers, Medtronic began operating in 1949 as a garage repair shop for medical devices; and in 1957 it launched its first high-impact health product: a portable cardiac pacemaker made at the request of a University of Minnesota surgeon. From there, its product range expanded steadily and in 2015, with the acquisition of Covidien, which had a strong competitive position in the surgical device segment, it became the largest firm in the industry. This enabled it to extend its supply of cardiac devices, spinal implants, insulin pumps, and other products to areas such as weight-loss surgery and laparoscopic procedures (Kelly and Roumeliotis, 2014). Johnson & Johnson, which has been the second largest seller in the medical device market (see table III.1), has a subsidiary, DePuy, affording it one of the most diverse orthopaedic portfolios in the industry. Through its merger with the Swiss firm Synthes, which is recognized for its

160 Chapter III Economic Commission for Latin America and the Caribbean (ECLAC)
innovations in trauma, spine, cranio-maxillofacial and electrical tools, it has consolidated one of the widest ranging and most innovative orthopaedic product ranges in the world (Johnson & Johnson, 2011). Other large-scale transactions have involved large pharmaceutical firms, in the consumer medical products, ophthalmology and nuclear medicine segments; and also large United States firms that expanded their business segments or market position. Cardinal Health, which offers a wide range of health-care products and services, acquired Medtronic’s patient care, deep-vein-thrombosis and nutritional deficiency businesses; Baxter International acquired a leading Swedish producer of dialysis products; and Thermo Fisher Scientific also acquired a Swedish firm, leader in the diagnosis of allergies and autoimmune diseases.
Table III.5 Top ten global cross-border mergers and acquisitions in the medical device industry, 2010–2019
Year Buyer Country of origin Firm acquired Destination country Amount (US$ million)
2015 Medtronic United States Covidien (100%) Ireland 52 630
2012 Johnson & Johnson United States Synthes (100%) Switzerland 18 563
2018 GlaxoSmithKline United Kingdom Percentage of Novartis in joint venture for medical consumer products
Switzerland 13 000
2011 Novartis Switzerland Alcon (23.15% to complete 100%) United States 11 989
2017 Cardinal Health United States Medtronic patient care, deep-vein thrombosis and nutritional deficiency businesses (100%)
Ireland 6 100
2011 Apax Partners, Canada Pension Plan Investment Board, Public Sector Pension Investment Board
Canada Kinetic Concepts (100%) United States 5 727
2013 Baxter International United States Gambro (100%) Sweden 4 020
2011 Thermo Fisher Scientific United States Phadia Sweden 3 533
2018 Novartis Switzerland Advanced Accelerator Applications France 3 316
2018 Innovatus Imaging United States Bayer’s European imaging services Germany 3 000
Source: Economic Commission for Latin America and the Caribbean (ECLAC), on the basis of Bloomberg.
Although most of the large M&As of the last decade took place in developed economies, three emerging economies have also had significant activity: China (82 operations), India (48) and Brazil (48). In Brazil, the largest transactions targeted domestic market access and occurred during a period of economic growth (see section C.2).
In China, interest was greatest in the first half of the decade and subsequently stabilized at a smaller number of operations per year (down from 10 to six per year on average between 2010–2014 and 2015–2019). In the operations analysed, the aim of the investment was to penetrate the Chinese market and access other emerging markets. The largest investments were made by leading firms in therapeutic devices, particularly orthopaedics, traumatology, implants and related surgical products, of varying technological complexity, although not limited to this segment alone. In 2010, the American firm, Zimmer Biomet, which had been founded in 1927, acquired Beijing Montagne Medical Device Firm for an undisclosed amount. At the time, the takeover made it the largest supplier of reconstructive orthopaedic solutions in China (Zimmer Biomet, 2010). In 2012, Medtronic acquired China Kanghui Holdings, one of China’s largest manufacturers of orthopaedic products, for US$ 653 million. As a result, Medtronic altered its participation in the Chinese market, which since 2007 had been done through a joint venture with Shandong Weigao Group Medical Polymer Firm. In 2013, the American firm, Stryker, a specialist in innovative orthopaedic products and services that had been founded by an orthopaedic surgeon in 1941, paid US$ 677 million for Trauson Holdings Firm Limited, a manufacturer of orthopaedic products with which it had had a contract to make instrument kits since 2007 (MPO, 2013).

161Chapter IIIForeign Direct Investment in Latin America and the Caribbean • 2020
In India, in contrast, a large proportion of the operations analysed represent investments by investment funds, rather than the takeover of firms by the industry’s transnationals, as happened in China. A British private investment fund, bought Healthium MedTech (Sutures India), a manufacturer of surgical consumables (sutures, needles, wound closure products and others) that can be classified as low technological complexity, for US$ 350 million). In 2013, Smith & Nephew acquired Adler Mediequip Private Limited (Sushrut Surgicals Private Limited), a leader in medium-level orthopaedic trauma products for the Indian market, with the aim of expanding its presence in India and other emerging markets (amount not disclosed) (Smith & Nephew, 2013).
An analysis of investment announcements shows that regions with emerging economies are becoming more important as destinations. Nonetheless, as noted at the outset, the amounts announced in the medical device sector are small, since there were no widespread offshoring processes. North America and Europe are the predominant origins; but Asia and the Pacific accounted for the largest amount of announcements, while Latin America and the Caribbean appears as the fourth region, with 9.4% of the total amount of announcements in the last decade (see figure III.14).13
13 For comparison, in the same period (2010-2019), an average of US$ 20 billion per year was announced in investments in the electronic components sector, with Asia and the Pacific accounting for 62% of that total.
Figure III.14 Announcements of projects abroad in the medical device sector, by region of origin and destination, 2010–2019(Percentages of amount)
39.1
15.7
26.8
20.0
38.2
1.1
7.6
0.4 1.40.4 0.80.2
9.4
Origin Destination
North AmericaWestern EuropeAsia and the PacificEmerging European countriesMiddle EastAfricaLatin America and the Caribbean
38.9
0
5
10
15
20
25
30
35
40
45
Source: Economic Commission for Latin America and the Caribbean (ECLAC), on the basis of Financial Times, fDi Markets [online] https://www.fdimarkets.com/explore/.
China and India have been the leading destinations in the Asia-Pacific region (see figure III.15). The manufacturing projects of large industrial transnationals in both countries included production plants to serve the global market, exploiting cost advantages. However, most of the announcements have involved facilities to supply the local and regional markets, making products that respond to local health problems. China accounted for the largest amount of announcements in the last decade, with a cumulative total of around US$ 6 billion, while India ranked fourth, with US$ 2.2 billion. Costa Rica and Mexico were the leading destinations in Latin America and the Caribbean.
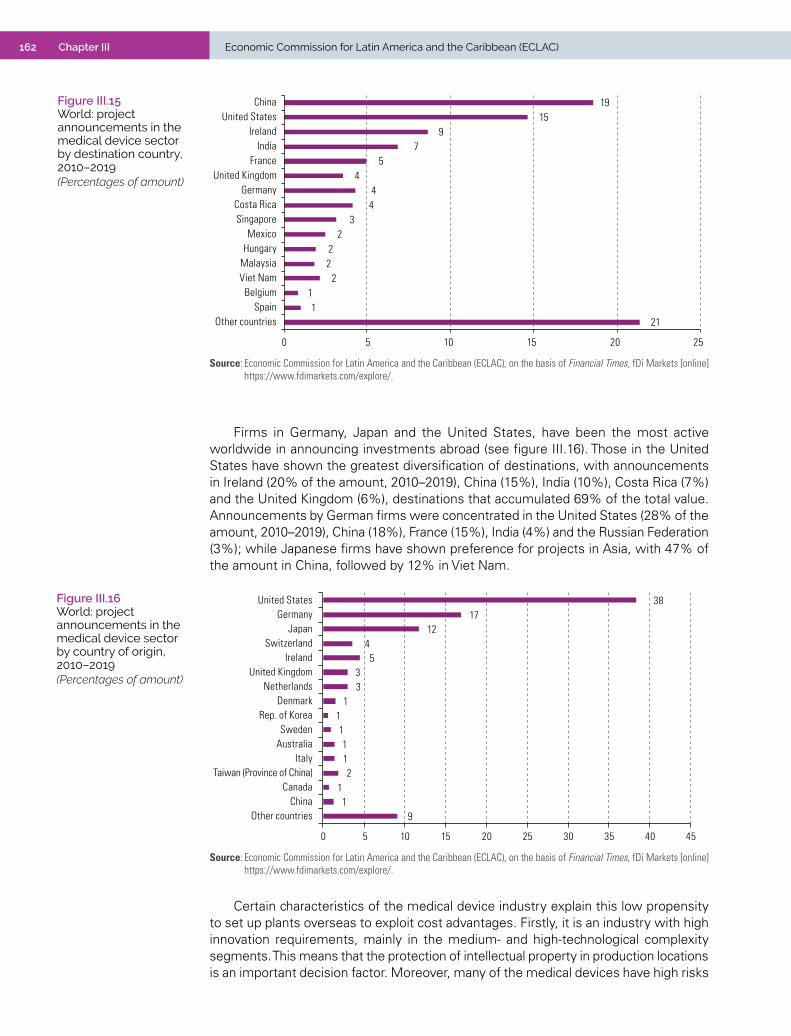
162 Chapter III Economic Commission for Latin America and the Caribbean (ECLAC)
Figure III.15 World: project announcements in the medical device sector by destination country, 2010–2019(Percentages of amount)
19 15
9 7
5 4
4 4
3 2
2 2
2 1 1
21
0 5 10 15 20 25
ChinaUnited States
Ireland India
FranceUnited Kingdom
Germany Costa Rica Singapore
Mexico Hungary
MalaysiaViet Nam Belgium
SpainOther countries
Source: Economic Commission for Latin America and the Caribbean (ECLAC), on the basis of Financial Times, fDi Markets [online] https://www.fdimarkets.com/explore/.
Firms in Germany, Japan and the United States, have been the most active worldwide in announcing investments abroad (see figure III.16). Those in the United States have shown the greatest diversification of destinations, with announcements in Ireland (20% of the amount, 2010–2019), China (15%), India (10%), Costa Rica (7%) and the United Kingdom (6%), destinations that accumulated 69% of the total value. Announcements by German firms were concentrated in the United States (28% of the amount, 2010–2019), China (18%), France (15%), India (4%) and the Russian Federation (3%); while Japanese firms have shown preference for projects in Asia, with 47% of the amount in China, followed by 12% in Viet Nam.
Figure III.16 World: project announcements in the medical device sector by country of origin, 2010–2019(Percentages of amount)
38 17
12 4 5
3 3
1 1 1 1 1 2
1 1
9
0 5 10 15 20 25 30 35 40 45
United States Germany
Japan Switzerland
Ireland United Kingdom
Netherlands Denmark
Rep. of Korea Sweden
Australia Italy
Taiwan (Province of China) Canada
ChinaOther countries
Source: Economic Commission for Latin America and the Caribbean (ECLAC), on the basis of Financial Times, fDi Markets [online] https://www.fdimarkets.com/explore/.
Certain characteristics of the medical device industry explain this low propensity to set up plants overseas to exploit cost advantages. Firstly, it is an industry with high innovation requirements, mainly in the medium- and high-technological complexity segments. This means that the protection of intellectual property in production locations is an important decision factor. Moreover, many of the medical devices have high risks
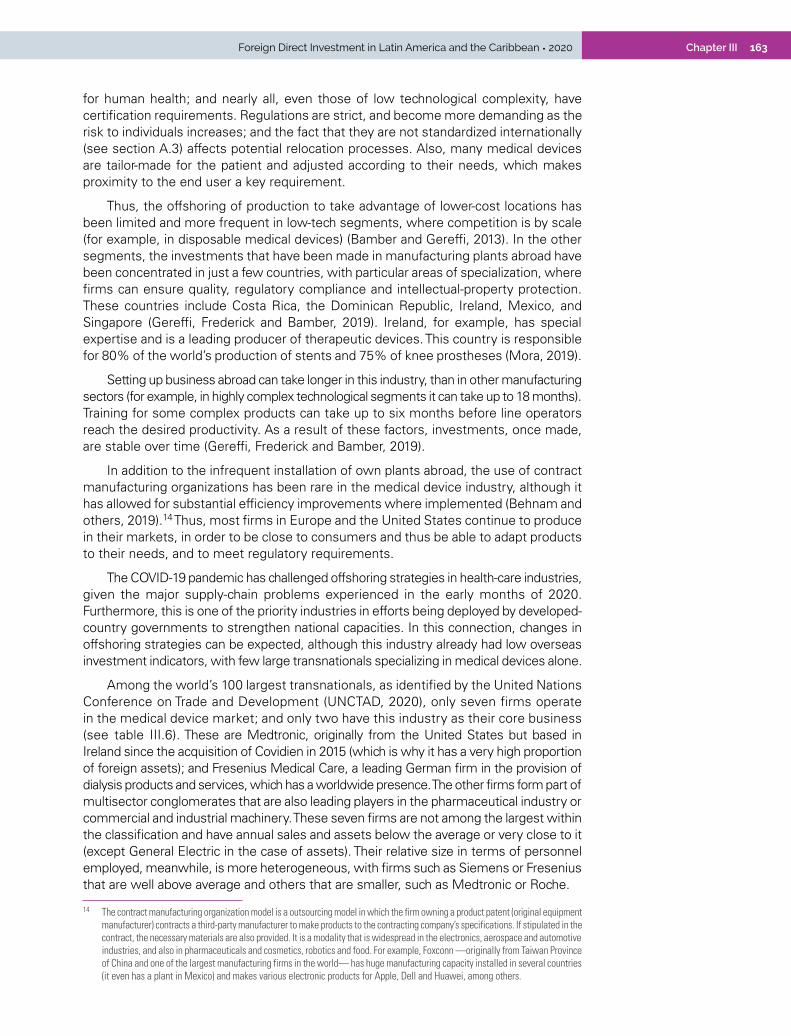
163Chapter IIIForeign Direct Investment in Latin America and the Caribbean • 2020
for human health; and nearly all, even those of low technological complexity, have certification requirements. Regulations are strict, and become more demanding as the risk to individuals increases; and the fact that they are not standardized internationally (see section A.3) affects potential relocation processes. Also, many medical devices are tailor-made for the patient and adjusted according to their needs, which makes proximity to the end user a key requirement.
Thus, the offshoring of production to take advantage of lower-cost locations has been limited and more frequent in low-tech segments, where competition is by scale (for example, in disposable medical devices) (Bamber and Gereffi, 2013). In the other segments, the investments that have been made in manufacturing plants abroad have been concentrated in just a few countries, with particular areas of specialization, where firms can ensure quality, regulatory compliance and intellectual-property protection. These countries include Costa Rica, the Dominican Republic, Ireland, Mexico, and Singapore (Gereffi, Frederick and Bamber, 2019). Ireland, for example, has special expertise and is a leading producer of therapeutic devices. This country is responsible for 80% of the world’s production of stents and 75% of knee prostheses (Mora, 2019).
Setting up business abroad can take longer in this industry, than in other manufacturing sectors (for example, in highly complex technological segments it can take up to 18 months). Training for some complex products can take up to six months before line operators reach the desired productivity. As a result of these factors, investments, once made, are stable over time (Gereffi, Frederick and Bamber, 2019).
In addition to the infrequent installation of own plants abroad, the use of contract manufacturing organizations has been rare in the medical device industry, although it has allowed for substantial efficiency improvements where implemented (Behnam and others, 2019).14 Thus, most firms in Europe and the United States continue to produce in their markets, in order to be close to consumers and thus be able to adapt products to their needs, and to meet regulatory requirements.
The COVID-19 pandemic has challenged offshoring strategies in health-care industries, given the major supply-chain problems experienced in the early months of 2020. Furthermore, this is one of the priority industries in efforts being deployed by developed-country governments to strengthen national capacities. In this connection, changes in offshoring strategies can be expected, although this industry already had low overseas investment indicators, with few large transnationals specializing in medical devices alone.
Among the world’s 100 largest transnationals, as identified by the United Nations Conference on Trade and Development (UNCTAD, 2020), only seven firms operate in the medical device market; and only two have this industry as their core business (see table III.6). These are Medtronic, originally from the United States but based in Ireland since the acquisition of Covidien in 2015 (which is why it has a very high proportion of foreign assets); and Fresenius Medical Care, a leading German firm in the provision of dialysis products and services, which has a worldwide presence. The other firms form part of multisector conglomerates that are also leading players in the pharmaceutical industry or commercial and industrial machinery. These seven firms are not among the largest within the classification and have annual sales and assets below the average or very close to it (except General Electric in the case of assets). Their relative size in terms of personnel employed, meanwhile, is more heterogeneous, with firms such as Siemens or Fresenius that are well above average and others that are smaller, such as Medtronic or Roche.
14 The contract manufacturing organization model is a outsourcing model in which the firm owning a product patent (original equipment manufacturer) contracts a third-party manufacturer to make products to the contracting company’s specifications. If stipulated in the contract, the necessary materials are also provided. It is a modality that is widespread in the electronics, aerospace and automotive industries, and also in pharmaceuticals and cosmetics, robotics and food. For example, Foxconn —originally from Taiwan Province of China and one of the largest manufacturing firms in the world— has huge manufacturing capacity installed in several countries (it even has a plant in Mexico) and makes various electronic products for Apple, Dell and Huawei, among others.

164 Chapter III Economic Commission for Latin America and the Caribbean (ECLAC)
Table III.6 Medical technology firms among the 100 largest non-financial transnational corporations in the world, 2019a (Billions of dollars and thousands of workers)
Firm Country Industryb Totals Abroad(percentages)
Assets Sales Employment Assets Sales EmploymentSiemens Germany Commercial and industrial machinery 164 98 385 82 79 70Johnson & Johnson United States Pharmaceutical 158 82 132 74 48 74General Electric United States Commercial and industrial machinery 266 95 205 42 59 66Medtronic Ireland Instruments and related products 90 31 90 97 100 97Roche Switzerland Pharmaceutical 86 62 98 92 99 57Novartis Switzerland Pharmaceutical 118 49 104 57 98 49Fresenius Germany Health services 75 40 294 80 57 44Average Leading 100 169 100 187 56 59 50
Source: Economic Commission for Latin America and the Caribbean (ECLAC), on the basis of United Nations Conference on Trade and Development (UNCTAD), “World Investment Report: annex tables”, Geneva, 2020 [online] https://unctad.org/en/Pages/DIAE/World%20Investment%20Report/Annex-Tables.aspx.
a Preliminary results based on the firms’ balance sheets (financial year from April 1, 2019 to March 31, 2020)b Sectors according to data from the United Nations Conference on Trade and Development (UNCTAD).
2. Investment in export manufacturing in the region is concentrated in a few countries
Overall, Latin America and the Caribbean has been a relatively minor destination for FDI in medical devices, accounting for just 3.1% of global M&A activity in the industry over the last decade and 9.4% of the amount of project announcements.15 However, some countries in the region have stood out in this scenario and have received investment from leading transnationals seeking to improve efficiency and exploit certain localization advantages, mainly access to the United States market. Costa Rica and Mexico, in particular, have been destinations for announcements on these grounds, and foreign firms have set up manufacturing plants for export in these countries. The process started with goods of low technological complexity, and gradually the basket of goods became more complex. In the Dominican Republic, the same FDI process is taking place in search of export efficiency, although it is at a more incipient stage. In Brazil, investments in market access have been particularly important. The country has been a leading a destination for projects and mergers and acquisitions; and is attractive because of its access to both a large domestic market and the regional market, mainly the countries of the Southern Common Market (MERCOSUR).
As is the case in the rest of the world, FDI in medical devices in Latin America and the Caribbean has involved relatively small amounts compared to other manufacturing industries, such as automotive and autoparts, electronics, chemicals or pharmaceuticals. Between 2010 and 2019, project announcements in the medical device sector averaged US$ 309 million per year, representing 0.3% of the total amount of announcements in the region (the sector share was similar to the 0.4% recorded in the rest of the world). Unlike the global picture, however, new investments were the predominant mode of investment in the region, with a cumulative total of 169 investments announced in the decade, while only 61 mergers and acquisitions were completed (see figure III.17). Only in 20 mergers and acquisitions were the amounts disclosed; and the cumulative total between 2010 and 2019 reached US$ 1.236 billion, compared to nearly US$ 3.1 billion in FDI announcements.
15 Latin America and the Caribbean accounted for 11% of the cumulative amount of announcements worldwide in 2010–2019.

165Chapter IIIForeign Direct Investment in Latin America and the Caribbean • 2020
Figure III.17 Latin America and the Caribbean: cross-border mergers and acquisitions and project announcements in the medical devices sector, cumulative 2010–2014 and 2015–2019(Billions of dollars and number of operations)
0
10
20
30
40
50
60
70
80
90
100
2010-2014 2015-2019
AmountNo. of mergers and acquisitions(right scale)
A. Mergers and acquisitions
0
0.5
1.0
1.5
2.0
2.5
3.0
0
10
20
30
40
50
60
70
80
90
100
02010-2014 2015-2019
Amount No. of announcements(right scale)
B. Project announcements
0.5
1.0
1.5
2.0
2.5
3.0
Source: Economic Commission for Latin America and the Caribbean (ECLAC), on the basis of Bloomberg and Financial Times, fDi Markets [online] https://www.fdimarkets.com/explore/.
Note: Includes cross-border mergers and transactions where the target firm is in the medical device and equipment sector as classified by Bloomberg, as well as project announcements classified in the medical device industry as classified by fDi Markets.
In addition to involving larger amounts, project announcements have been much more dynamic than cross-border M&A. A comparison of the average number of transactions per year between the first and second half of the decade shows that the number of announcements increased by 19% (from 15 to 18 announcements per year, on average), while M&As fell (from 7 to 5 per year, on average) (see figure III.17). Thus, in the period between 2015 and 2019, a cumulative total of 92 investments were announced by foreign firms, involving an amount of approximately US$ 1.8 billion. This growth reflects the establishment and expansion in the region of many of the world’s leading firms, mainly in manufacturing projects, although these are highly concentrated in a small number of countries.
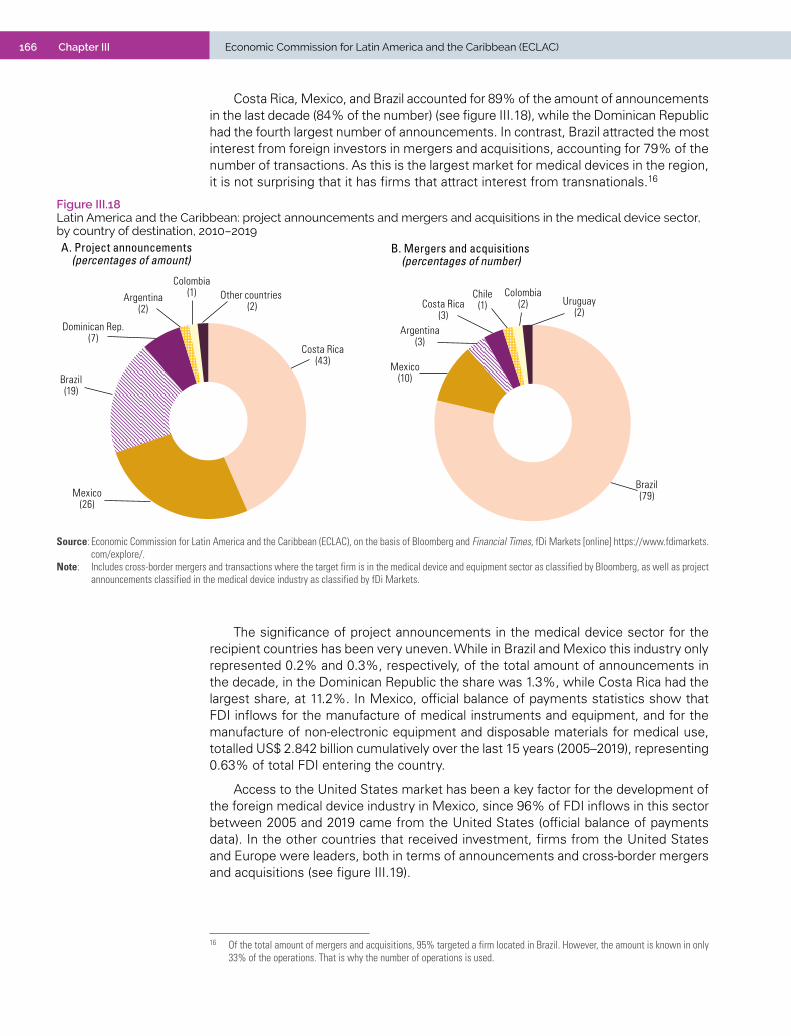
166 Chapter III Economic Commission for Latin America and the Caribbean (ECLAC)
Costa Rica, Mexico, and Brazil accounted for 89% of the amount of announcements in the last decade (84% of the number) (see figure III.18), while the Dominican Republic had the fourth largest number of announcements. In contrast, Brazil attracted the most interest from foreign investors in mergers and acquisitions, accounting for 79% of the number of transactions. As this is the largest market for medical devices in the region, it is not surprising that it has firms that attract interest from transnationals.16
16 Of the total amount of mergers and acquisitions, 95% targeted a firm located in Brazil. However, the amount is known in only 33% of the operations. That is why the number of operations is used.
Figure III.18 Latin America and the Caribbean: project announcements and mergers and acquisitions in the medical device sector, by country of destination, 2010–2019
Brazil(79)
Mexico(10)
Argentina(3)
Costa Rica(3)
Chile(1)
Colombia(2) Uruguay
(2)
Costa Rica(43)
Mexico(26)
Brazil(19)
Dominican Rep.(7)
Argentina(2)
Colombia(1) Other countries
(2)
A. Project announcements (percentages of amount)
B. Mergers and acquisitions (percentages of number)
Source: Economic Commission for Latin America and the Caribbean (ECLAC), on the basis of Bloomberg and Financial Times, fDi Markets [online] https://www.fdimarkets.com/explore/.
Note: Includes cross-border mergers and transactions where the target firm is in the medical device and equipment sector as classified by Bloomberg, as well as project announcements classified in the medical device industry as classified by fDi Markets.
The significance of project announcements in the medical device sector for the recipient countries has been very uneven. While in Brazil and Mexico this industry only represented 0.2% and 0.3%, respectively, of the total amount of announcements in the decade, in the Dominican Republic the share was 1.3%, while Costa Rica had the largest share, at 11.2%. In Mexico, official balance of payments statistics show that FDI inflows for the manufacture of medical instruments and equipment, and for the manufacture of non-electronic equipment and disposable materials for medical use, totalled US$ 2.842 billion cumulatively over the last 15 years (2005–2019), representing 0.63% of total FDI entering the country.
Access to the United States market has been a key factor for the development of the foreign medical device industry in Mexico, since 96% of FDI inflows in this sector between 2005 and 2019 came from the United States (official balance of payments data). In the other countries that received investment, firms from the United States and Europe were leaders, both in terms of announcements and cross-border mergers and acquisitions (see figure III.19).
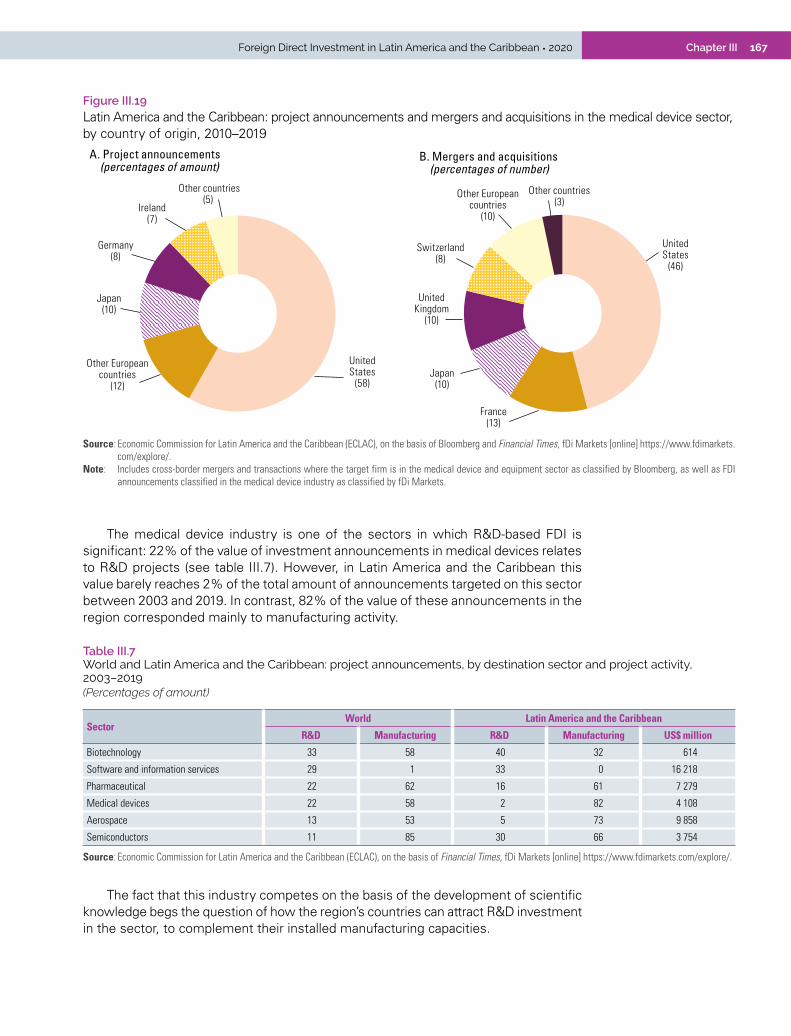
167Chapter IIIForeign Direct Investment in Latin America and the Caribbean • 2020
Figure III.19 Latin America and the Caribbean: project announcements and mergers and acquisitions in the medical device sector, by country of origin, 2010–2019
Japan(10)
Germany(8)
Ireland(7)
Other countries(5)
UnitedStates
(46)
UnitedStates
(58)
France(13)
Japan(10)
UnitedKingdom
(10)
Switzerland(8)
Other Europeancountries
(10)
Other Europeancountries
(12)
Other countries(3)
A. Project announcements (percentages of amount)
B. Mergers and acquisitions (percentages of number)
Source: Economic Commission for Latin America and the Caribbean (ECLAC), on the basis of Bloomberg and Financial Times, fDi Markets [online] https://www.fdimarkets.com/explore/.
Note: Includes cross-border mergers and transactions where the target firm is in the medical device and equipment sector as classified by Bloomberg, as well as FDI announcements classified in the medical device industry as classified by fDi Markets.
The medical device industry is one of the sectors in which R&D-based FDI is significant: 22% of the value of investment announcements in medical devices relates to R&D projects (see table III.7). However, in Latin America and the Caribbean this value barely reaches 2% of the total amount of announcements targeted on this sector between 2003 and 2019. In contrast, 82% of the value of these announcements in the region corresponded mainly to manufacturing activity.
Table III.7 World and Latin America and the Caribbean: project announcements, by destination sector and project activity, 2003–2019(Percentages of amount)
Sector World Latin America and the Caribbean
R&D Manufacturing R&D Manufacturing US$ million
Biotechnology 33 58 40 32 614
Software and information services 29 1 33 0 16 218
Pharmaceutical 22 62 16 61 7 279
Medical devices 22 58 2 82 4 108
Aerospace 13 53 5 73 9 858
Semiconductors 11 85 30 66 3 754
Source: Economic Commission for Latin America and the Caribbean (ECLAC), on the basis of Financial Times, fDi Markets [online] https://www.fdimarkets.com/explore/.
The fact that this industry competes on the basis of the development of scientific knowledge begs the question of how the region’s countries can attract R&D investment in the sector, to complement their installed manufacturing capacities.
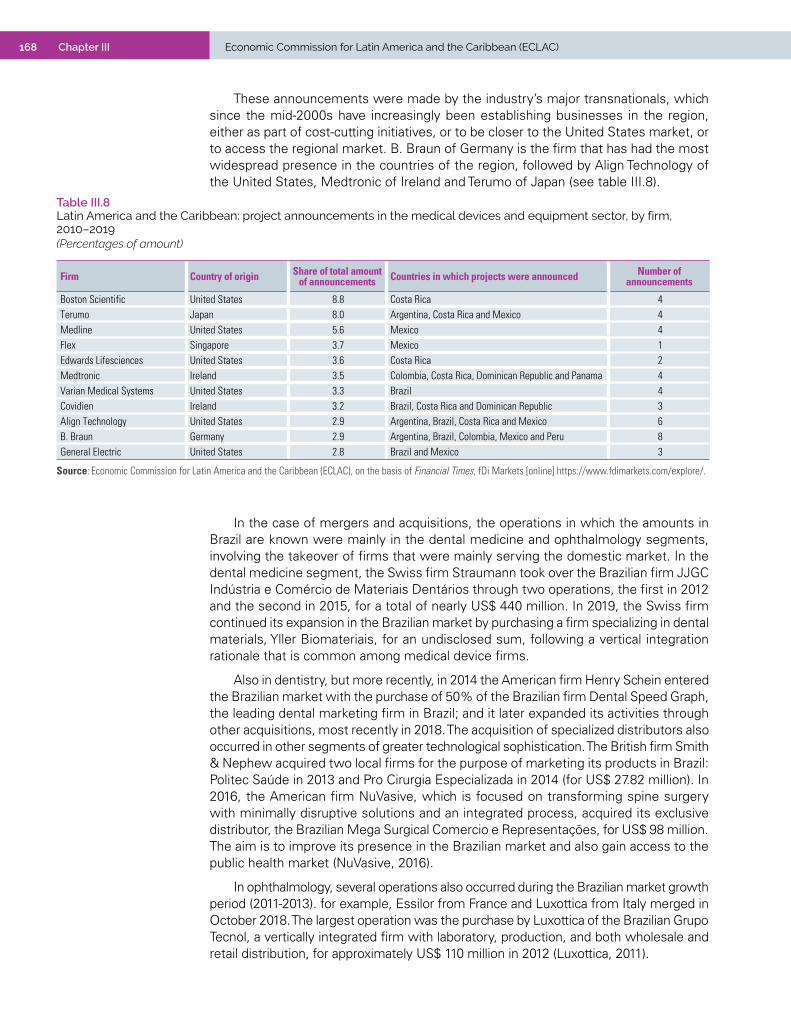
168 Chapter III Economic Commission for Latin America and the Caribbean (ECLAC)
These announcements were made by the industry’s major transnationals, which since the mid-2000s have increasingly been establishing businesses in the region, either as part of cost-cutting initiatives, or to be closer to the United States market, or to access the regional market. B. Braun of Germany is the firm that has had the most widespread presence in the countries of the region, followed by Align Technology of the United States, Medtronic of Ireland and Terumo of Japan (see table III.8).
Table III.8 Latin America and the Caribbean: project announcements in the medical devices and equipment sector, by firm, 2010–2019(Percentages of amount)
Firm Country of origin Share of total amount of announcements Countries in which projects were announced Number of
announcements
Boston Scientific United States 8.8 Costa Rica 4Terumo Japan 8.0 Argentina, Costa Rica and Mexico 4Medline United States 5.6 Mexico 4Flex Singapore 3.7 Mexico 1Edwards Lifesciences United States 3.6 Costa Rica 2Medtronic Ireland 3.5 Colombia, Costa Rica, Dominican Republic and Panama 4Varian Medical Systems United States 3.3 Brazil 4Covidien Ireland 3.2 Brazil, Costa Rica and Dominican Republic 3Align Technology United States 2.9 Argentina, Brazil, Costa Rica and Mexico 6B. Braun Germany 2.9 Argentina, Brazil, Colombia, Mexico and Peru 8General Electric United States 2.8 Brazil and Mexico 3
Source: Economic Commission for Latin America and the Caribbean (ECLAC), on the basis of Financial Times, fDi Markets [online] https://www.fdimarkets.com/explore/.
In the case of mergers and acquisitions, the operations in which the amounts in Brazil are known were mainly in the dental medicine and ophthalmology segments, involving the takeover of firms that were mainly serving the domestic market. In the dental medicine segment, the Swiss firm Straumann took over the Brazilian firm JJGC Indústria e Comércio de Materiais Dentários through two operations, the first in 2012 and the second in 2015, for a total of nearly US$ 440 million. In 2019, the Swiss firm continued its expansion in the Brazilian market by purchasing a firm specializing in dental materials, Yller Biomateriais, for an undisclosed sum, following a vertical integration rationale that is common among medical device firms.
Also in dentistry, but more recently, in 2014 the American firm Henry Schein entered the Brazilian market with the purchase of 50% of the Brazilian firm Dental Speed Graph, the leading dental marketing firm in Brazil; and it later expanded its activities through other acquisitions, most recently in 2018. The acquisition of specialized distributors also occurred in other segments of greater technological sophistication. The British firm Smith & Nephew acquired two local firms for the purpose of marketing its products in Brazil: Politec Saúde in 2013 and Pro Cirurgia Especializada in 2014 (for US$ 27.82 million). In 2016, the American firm NuVasive, which is focused on transforming spine surgery with minimally disruptive solutions and an integrated process, acquired its exclusive distributor, the Brazilian Mega Surgical Comercio e Representações, for US$ 98 million. The aim is to improve its presence in the Brazilian market and also gain access to the public health market (NuVasive, 2016).
In ophthalmology, several operations also occurred during the Brazilian market growth period (2011-2013). for example, Essilor from France and Luxottica from Italy merged in October 2018. The largest operation was the purchase by Luxottica of the Brazilian Grupo Tecnol, a vertically integrated firm with laboratory, production, and both wholesale and retail distribution, for approximately US$ 110 million in 2012 (Luxottica, 2011).
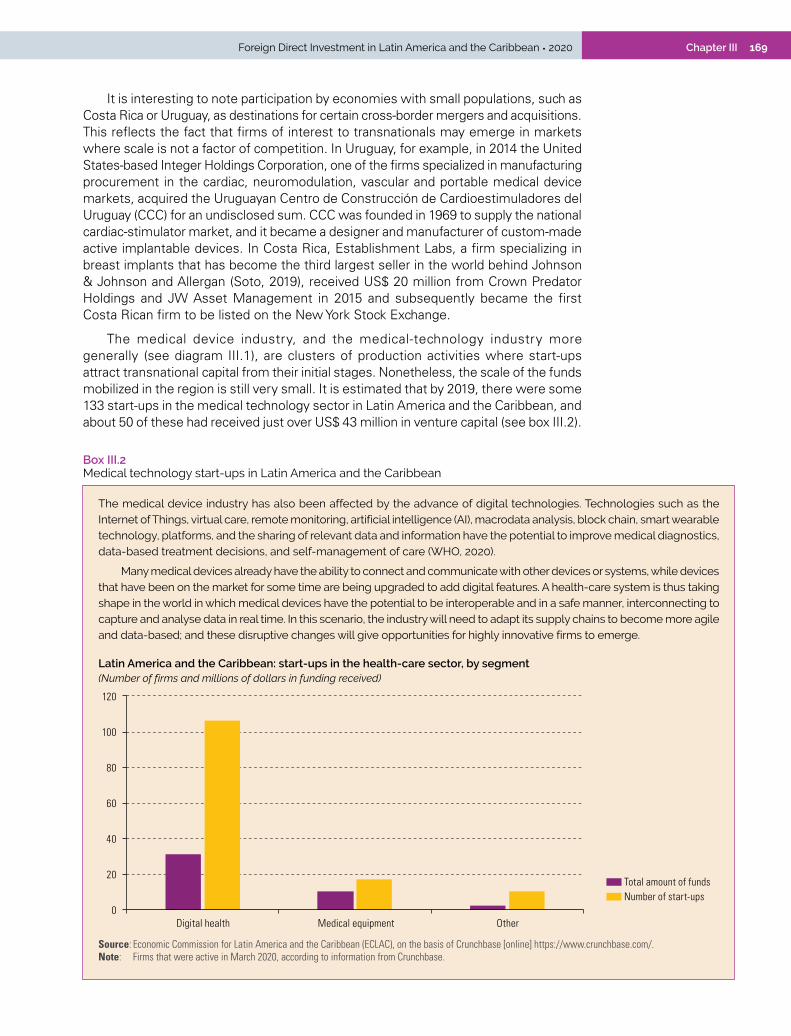
169Chapter IIIForeign Direct Investment in Latin America and the Caribbean • 2020
It is interesting to note participation by economies with small populations, such as Costa Rica or Uruguay, as destinations for certain cross-border mergers and acquisitions. This reflects the fact that firms of interest to transnationals may emerge in markets where scale is not a factor of competition. In Uruguay, for example, in 2014 the United States-based Integer Holdings Corporation, one of the firms specialized in manufacturing procurement in the cardiac, neuromodulation, vascular and portable medical device markets, acquired the Uruguayan Centro de Construcción de Cardioestimuladores del Uruguay (CCC) for an undisclosed sum. CCC was founded in 1969 to supply the national cardiac-stimulator market, and it became a designer and manufacturer of custom-made active implantable devices. In Costa Rica, Establishment Labs, a firm specializing in breast implants that has become the third largest seller in the world behind Johnson & Johnson and Allergan (Soto, 2019), received US$ 20 million from Crown Predator Holdings and JW Asset Management in 2015 and subsequently became the first Costa Rican firm to be listed on the New York Stock Exchange.
The medical device industry, and the medical-technology industry more generally (see diagram III.1), are clusters of production activities where start-ups attract transnational capital from their initial stages. Nonetheless, the scale of the funds mobilized in the region is still very small. It is estimated that by 2019, there were some 133 start-ups in the medical technology sector in Latin America and the Caribbean, and about 50 of these had received just over US$ 43 million in venture capital (see box III.2).
Box III.2 Medical technology start-ups in Latin America and the Caribbean
The medical device industry has also been affected by the advance of digital technologies. Technologies such as the Internet of Things, virtual care, remote monitoring, artificial intelligence (AI), macrodata analysis, block chain, smart wearable technology, platforms, and the sharing of relevant data and information have the potential to improve medical diagnostics, data-based treatment decisions, and self-management of care (WHO, 2020).
Many medical devices already have the ability to connect and communicate with other devices or systems, while devices that have been on the market for some time are being upgraded to add digital features. A health-care system is thus taking shape in the world in which medical devices have the potential to be interoperable and in a safe manner, interconnecting to capture and analyse data in real time. In this scenario, the industry will need to adapt its supply chains to become more agile and data-based; and these disruptive changes will give opportunities for highly innovative firms to emerge.
Latin America and the Caribbean: start-ups in the health-care sector, by segment (Number of firms and millions of dollars in funding received)
0
20
40
60
80
100
120
Digital health Medical equipment Other
Total amount of fundsNumber of start-ups
Source: Economic Commission for Latin America and the Caribbean (ECLAC), on the basis of Crunchbase [online] https://www.crunchbase.com/.Note: Firms that were active in March 2020, according to information from Crunchbase.

170 Chapter III Economic Commission for Latin America and the Caribbean (ECLAC)
In Latin America and the Caribbean, 2,300 start-ups were identified as of March 2020; and health-care was the fifth
largest sector with 133 (6% of the total), behind financial services (19%), information technology (10%), commerce (9%) and
education (8%).a Venture capital funds received by these firms totalled just over US$ 43 million, representing 3% of the
funds of all the region’s start-ups.b Most of these firms operate in the digital health area (80% of the firms and 72% of the
funds), while those in the medical equipment sector have a smaller share (see the figure below). Other activities in digital
health include health insurance and health-care facilities.
The emergence of digital health, and the interest shown in this segment by a number of startups in the region, represent
the disruptive changes that are now affecting the medical technology sector. This new segment of the medical-technology
industry includes very diverse categories that converge with medical devices, such as sensors and portable devices.
Digital health includes mobile health, health-information technology, handheld devices, telehealth and telemedicine,
and personalized medicine, for example.
In the region, the startups that received the largest amount of investment are those providing digital services to
health institutions (29% of total funds received in the digital-health sector in the region), ahead of health apps (19%), office
management systems for health institutions (15%) and back-up platforms and services (13%).
In addition to representing opportunities for innovative firms, the use and expansion of digital-health solutions can
revolutionize the way people achieve higher standards of health and access services, to promote and protect their health
and well-being. Digital health thus provides opportunities to hasten achievement of the Sustainable Development Goals
(SDGs) —particularly Goal 3, which stresses the importance of ensuring a healthy life and promoting the well-being of all
people at all ages as essential to sustainable development (WHO, 2020).
Source: Economic Commission for Latin America and the Caribbean (ECLAC), on the basis of Crunchbase [online] https://www.crunchbase.com/; World Health Organization (WHO), “Draft global strategy on digital health 2020–2025”, Geneva, 2020.
a Prepared on the basis of Crunchbase. Startups are defined as firms that have business models with a high degree of innovation, founded since 2011, with fewer than 50 employees and with a Crunchbase ranking of investor interest above the country’s average.
b Total amount of funding raised as of end-2019. Only 40% of the firms in the database have data on funds received; 39% operate in the health-care sector.
Box III.2 (concluded)
D. Production capacities and specialization in the region
The development of regional value chains can be seen as a major step towards building local capacity and enhancing integration into global value chains. In the context of the pandemic, national or regional production of medical devices has proven to be a major advantage in disease control, particularly in the case of respirator manufacture, although having domestic production by foreign firms was not automatically an advantage (see box III.3).
Medical devices are both produced and exported in the Latin America and the Caribbean region. Although these are mainly of medium and low technological complexity, there are also a number of high-complexity products. Despite having a negative trade balance in the latter segment, the region has capacity and plays a role in global value chains. In most of the region’s countries, the industry’s transnationals maintain a presence through sales offices or representatives to supply the market with imported production. However, the size of the Brazilian market has also been an attraction for firms with manufacturing capacities, while Costa Rica, the Dominican Republic and Mexico have seen more export-oriented investments.
171Chapter IIIForeign Direct Investment in Latin America and the Caribbean • 2020
Box III.3 Production capacities and export in times of local health emergency
Medical devices produced in Mexico have a small share in a large domestic market, the value of which is estimated at around US$ 1.6 billion.a Information from the National Pharmaceutical Industry Chamber (CANIFARMA), shows that Mexico exports 91% of the medical equipment it produces to the United States; and it is the leading exporter of such products to that market.
The COVID-19 crisis thus revealed supply vulnerabilities despite the existence of local production. International trade rules and an aggressive stance adopted by wealthier nations to secure their own supply prevented Mexico from accessing the equipment needed to combat the pandemic in its early stages. The Governor of the State of Baja California even confronted a United States factory making ventilator equipment and said that unless it could find a way to circumvent trade rules and supply nearby local clinics, it would no longer be considered an essential activity and would have to stop producing (CNN Chile, 2020). The conflict was resolved, and the firm agreed to sell ventilators to Baja California and was able to continue operations.
On the other hand, the pandemic may also generate growth opportunities for the sector in states which, like Baja California, are home to various specialized production plants, and throughout Mexico in general (Juárez, 2020). The country expects to benefit from the relocation of firms wishing to move from Asian countries to Mexico, owing to the COVID-19 crisis and the trade dispute between China and the United States.
However, during the crisis, the Mexican manufacturing sector faced major challenges in maintaining operations. According to information provided by the Mexican Association of Innovative Medical Device Industries (AMID), the main challenge for the industry in the face of the pandemic has been to maintain the flow of production chains to the United States, which requires collaboration between the firms and the Government to confront the crisis in a coordinated manner. The second major challenge has been to import the devices Mexico needs and to identify the main distribution problems and the best marketing channels during the emergency.
Source: Economic Commission for Latin America and the Caribbean (ECLAC), on the basis of Mex Newz, “Industria de dispositivos médicos es exportador estrella; ahora quiere vender más en México”, Mexico City, 22 February 2020 [online] https://www.mexnewz.mx/industria-de-dispositivos-medicos-es-exportador-estrella-ahora-quiere-vender-mas-en-mexico/; CNN Chile, “Ordenan cierre de fábrica estadounidense de respiradores en Tijuana por negarse a venderle a México”, Santiago, 11 April 2020 [online] https://www.cnnchile.com/mundo/smiths-medicals-cierre-fabrica-tijuana-mexico_20200411/; A. Juárez, “Baja California desea convertirse en capital global de fabricación de instrumentos médicos”, Mexico City, El CEO, 12 May 2020 [online] https://elceo.com/negocios/baja-california-desea-convertirse-en-capital-global-de-fabricacion-de-instrumentos-medicos/.
a At the exchange rate prevailing on 1 February 2020.
1. Production capacities for export in areas close to the United States
Three countries in the region have a trade surplus in medical devices: Mexico, Costa Rica, and the Dominican Republic (see section B.3). In all three, transnational firms made investments under an export-oriented manufacturing strategy, thereby integrating these countries into their global value chains.
With an annual average export value in excess of US$ 11 billion between 2014 and 2018, Mexico was the leading exporter of medical devices in Latin America and the Caribbean, and became the seventh largest exporter in the world. For its part, Costa Rica positioned itself as the second largest exporter, with average annual exports of around US$ 3 billion (2014–2018), and is one of seven countries that supply medical device to the United States (CINDE, 2020). Although its production is quite small globally, the Dominican Republic has a 0.5% share of medical device exports (average 2014–2018)
172 Chapter III Economic Commission for Latin America and the Caribbean (ECLAC)
and has been the third largest exporter of medical devices in the region. Whereas the medical device sector represents a small share of Mexico’s total manufacturing output, it has been very important for Costa Rica and the Dominican Republic.
Medical devices are currently Costa Rica’s main export product. According to its Foreign Trade Promotion Agency (PROCOMER), 32% of the country’s goods exports in 2019 were medical and other precision and equipment. The sector generated 40% of all exports from the free trade zones in 2019, ahead of information technology and IT-enabled services, which had a 38% share. The medical device industry was also the fastest growing exporter in 2019 (expanding by 12.3% relative to the 2018 level).
In the Dominican Republic, the medical device industry has also been the main export subsector within the free zone; and these devices have become the country’s second most important export good. In 2019, free zone exports accounted for 56% of Dominican exports; and within these, medical and pharmaceutical products represented 26.5% (approximately US$ 1.66 billion) (CNZFE, 2019). As in Costa Rica, this industry has also proven to be a strategic sector with potential to grow exports and create jobs in the country.
In Mexico, the medical device industry for export has taken advantage of its proximity to the United States; and this has been reflected in a strong territorial concentration. Production for export has been located on the northern border; and Chihuahua (with the “Bio El Paso Juárez” binational biomedical cluster) and Baja California are the states exporting most in this sector. Baja California has 79 manufacturing plants that produce 50% of the country’s medical devices, with a workforce of over 71,000 (out of a total sector workforce of approximately 134,000) (Solano, 2020).
Foreign firms have been key actors in developing the export industry in Mexico, with a focus on manufacturing and assembly for export and a predominant presence of firms from the United States. In Tijuana, for example, 70% of the firms in the sector are based in that country (Varney, 2017). The industry also depends on imports for its production: 92% of all inputs needed to manufacture medical electronic equipment and 32% of those needed to manufacture disposable equipment are sourced from abroad.17
2. Costa Rica and the Dominican Republic: national strategies drive the industry
In Costa Rica, the medical device industry developed at the behest of the transnationals and within the framework of a national strategy to boost this industry. The Costa Rican Coalition of Development Initiatives (CINDE) plays a preponderant role, by actively seeking to attract and maintain investments from high-tech firms. This has enabled Costa Rica’s successful positioning in the global medical device industry.
The industry’s origins in the country date back to the late 1980s, when the American firm Baxter opened a plant in 1987. The sector took off between the middle and later years of the 2000 decade (Bamber and Gereffi, 2013; Cornick and Trejos, 2018), a period in which the inflow of foreign firms intensified and the production undertaken in the country became gradually more complex. In 2012, the medical device industry was classified as a sector of public and national interest (SCIJ, 2012); and, to sustain its growth, efforts have been coordinated to train professionals who can fill the jobs needed by the industry, both by promoting greater articulation between the academic sector and the firms, and through strategic partnerships with universities abroad (CINDE, 2020).
17 See Government of Mexico, “Dispositivos médicos” [online] https://www.gob.mx/promexico/acciones-y-programas/dispositivos-medicos-26794.
173Chapter IIIForeign Direct Investment in Latin America and the Caribbean • 2020
In this scenario, between 2000 and 2019 the number of firms in the sector with operations in the country increased from eight to 72 (including 12 of the 30 world’s leading firms); and jobs grew 20-fold (from 1,500 to 29,812 people employed) (CINDE, 2020).
In 2020, medical device firms are focused on exports and are mainly established in the free trade zones, which gives them significant tax exemptions. In Costa Rica, the free trade zones have evolved from hosting low value-added manufacturing and services to accommodating higher-tech manufacturing, especially medical devices, and advanced services. This was achieved through a national strategy oriented to this end. Although free zones are a fundamental part of the export and investment attraction strategy, the tax exemption for firms has generated controversy in the country, especially when the government had to deal with a major fiscal crisis in 2018 (UNCTAD 2019). Nonetheless, the development of this industry has generated a significant increase in the number of jobs in firms requiring high skills. This means that the country’s workers manufacture products that meet the quality standards of the United States health market (FDA) —among the most stringent in the world— and this has generated positive spillover effects for local players, although there are still major challenges in this area.
In the Dominican Republic, the growth of the medical device industry has also been driven by a national strategy to attract investment in strategic areas, and firms have settled in the free trade zones. At least nine of the 30 global leaders in the industry have direct manufacturing operations in the country; and proximity to the United States is an advantage for this. In 2019, there were 34 firms manufacturing for the export market —mostly producing disposable devices, such as intravenous and transfusion sets, surgical supplies, surgical sutures, ostomy devices, orthopaedic components, and other medical supplies and consumables. Most of this production is exported to the United States. Manufacturing plants are primarily engaged in assembly and packaging operations, but are also incorporating more complex complementary operations such as moulding, extrusion, and sterilization, as well as automated or semi-automated operations (MICM, 2019).
The medical and pharmaceutical products sector is the leading economic activity in terms of cumulative investment in the country’s free trade zones; and as of end-2019 it accounted for 26.2% of the total, with a cumulative total close to US$ 1.350 billion. The sector also generated employment for 25,570 people, representing 14.4% of all jobs in the free trade zones (CNZFE, 2019).
3. Production has become more complex, although with few linkages
The presence of Latin American and Caribbean countries in the international export market is still greater in the medium and low technological-complexity segments than in the more complex ones. Nonetheless, several decades of experience working in the region has enabled transnationals to gradually incorporate more complex and sophisticated production processes into their activities in the region. Yet, in Costa Rica and Mexico this process of increasing production complexity has not been matched by linkages with local suppliers.
In Mexico, the manufacture of medical devices has progressed over the years to include the production of sophisticated Class III devices, which have the strictest controls owing to their greater impact on human health (see box III.1). Currently, the industry serves about 75 medical health specialties.
174 Chapter III Economic Commission for Latin America and the Caribbean (ECLAC)
One of the milestones in the process of expanding the industry in Costa Rica and making it more complex resulted from the joint efforts of CINDE and the firms in the sector, and was key to the future expansion of the industry: a first —and later a second— sterilization services firm was inaugurated. This allowed firms in Costa Rica to send their products directly to the final customers, instead of first having to send them to a sterilization facility abroad and only after that to the final customers. According to CINDE, the growth of exports was accompanied by increasing sophistication in the sector. In addition, the number of laboratories and R&D units has gradually increased, firstly focused on process improvement and later on the development of new products. Over the years, the country’s production has evolved from Class I to Class III medical devices (see box III.1). Moreover, between 2000 and 2019, production diversified from five medical specialties to 14 (including women’s health, surgical devices, aesthetic medicine, dentistry, drug delivery systems, respiratory care, radiology, ophthalmology, cardiovascular, endoscopy, and orthopaedics). Exports also include an increasing share of high-tech products (see figure III.7).
This successful international engagement has not yet produced an extensive sophistication of the local production fabric that supports the industry. In Costa Rica, local supply has been meagre, although it has picked up slightly in recent years: in 2014, approximately 9% of intermediate goods inputs were purchased in the country, compared to just 6% in 2012 (Gereffi, Frederick and Bamber, 2019).
The few linkages that exist are mainly due to global supply chain constraints caused by the centralization of decisions at headquarters, long-term relationships of trust with suppliers and industry regulations. Some low value-added linkages (basic services) have been formed; but no linkages in tradable goods and services have been spontaneously generated with the participation of local firms that could gradually move up the value chain and provide increasingly complex and knowledge-intensive inputs, parts, finished products and services to transnationals (Cornick and Trejos, 2018). This issue was included in the political agenda in the late 1990s, with a program financed by the Inter-American Development Bank (IDB); and in 2010 it acquired greater political importance when, for the first time, PROCOMER defined an institutional strategy with a supplier development program focused on high value-added linkages, working on supplier development together with other public institutions (Cornick and Trejos, 2018).
On the other hand, it has been argued that Costa Rica has not taken full advantage of FDI knowledge spillovers, and that, on this front, its performance pales in comparison to other developing countries that have succeeded in attracting high-tech FDI and also in developing local capacities, like Ireland (Cornick and Trejos, 2018). Nonetheless, the sector has gained greater momentum in Costa Rica in the last ten years; and the fact that the first Costa Rican firm to be listed on the New York Stock Exchange was a medical device firm could indicate the existence of knowledge spillover.
In Mexico there are also no major local chains in the medical device export industry; and most of the inputs are imported. In fact, the regulatory environment makes local linkages in this industry very complicated, since exports to the United States have to satisfy strict safety and certification standards; and firms do not want to risk suspension by the United States regulatory body (Food and Drug Administration – FDA), for example. In this connection, a central factor when choosing suppliers is trust, to be certain that all of the destination-market regulatory standards will be met. According to industry experts, large firms prefer a supplier with long experience in the sector, even if this means importing inputs from the other side of the world, rather than tending towards a new local option. As in Costa Rica, this means that in the absence of policies or some type of incentive, transnational firms will either choose a well known international supplier, or else integrate vertically to gain even greater control over production rather than choose local suppliers.

175Chapter IIIForeign Direct Investment in Latin America and the Caribbean • 2020
Despite this, in Mexico there is another group of firms in the medical device industry that manufactures for the domestic market and supplies the large institutional clients of the health system, so they are located mainly in Mexico City and Mexico State. These are mainly SMEs that undertake R&D activities, many of which have been founded by industry professionals (biomedical engineers), so they specialize in developing devices. These firms are not usually export-oriented; and when they export to countries with less structured regulatory requirements, as is the case in some Latin American and Caribbean countries, they can do so with less sophisticated and lower-cost products.
4. Other countries in the region: dependence on imports despite productive capacities
Brazil has the largest medical device market in the region and one of the largest in the world, although its spending in the sector (0.6% of GDP) is below that in the United States or Europe (Torres, 2018). According to the Brazilian Innovative Health Industry Alliance (ABIIS), a consortium of four associations of the medical and hospital products industry, this industry comprises some 14,500 firms, of which 28% are manufacturers and the remainder work in product marketing and distribution —a feature that is mirrored in the employment figures.18 Of the 142,000 people employed in the medical and hospital products industry as of December 2019, 46% are in manufacturing jobs and 54% are in the commercial area (ABIIS, 2020). Moreover, of the roughly 64,600 manufacturing jobs, the vast majority (92%) are in the segment of instruments and materials for medical, dental and optical items, while 8% work in electrical and electronic devices and radiology equipment, where the most products of high technological complexity is concentrated.
As is the case in Mexico with firms that supply the domestic market, many of the firms in the sector are located in the area of highest population density: in Brazil 32% of the firms are located in the state of São Paulo (ABIIS, 2015).
According to the Brazilian Association of the Medical, Dental, Hospital and Laboratory Articles and Equipment Industry (ABIMO), manufacturing firms were predominantly SMEs: 59% of the manufacturing firms in the sector are medium-sized and 16% are small, while medium-to-large and large firms represented 24% of the total (13% and 11%, respectively) (data as of 2018).19 Domestic production in the industry amounted to US$ 2.5 billion in 2017 —13% less than in 2015 and 2% less than in 2016 (ABIMO, 2018). This decline was due partly to the economic crisis, but also to a loss of market share for national production relative to imports. In fact, between 2015 and 2017, the share of national production in the apparent consumption of medical devices dropped from 26.1% to 22.1% (ABIMO, 2018).
Brazil has been characterized as being heavily reliant on imports of medical devices, especially in several segments where national products are scarce. As of end-2019, the deficit in the medical and hospital products industry was estimated to be 6.6% larger than in 2018, around US$ 4 billion in absolute terms (ABIIS, 2020).20 A 5.4% increase in imports and a 1.6% decrease in exports explained this widening deficit, which occurred despite the fact that domestic production increased by 5.1% in 2019 over the previous year (ABIIS, 2020).
18 The Brazilian Innovative Health Industry Alliance (ABIIS) comprises the following entities: the Advanced Medical Technology Association (AdvaMed), the Brazilian Association of High Technology Health Products Industry (ABIMED), the Brazilian Association of Implant Importers and Distributors (ABRAIDI) and the Brazilian Chamber of Laboratory Diagnostics (CBDL).
19 Sales volumes were as follows: small businesses: US$ 70,000 to US$ 700,000; medium-sized enterprises: US$ 700,000 to US$ 1.7 million; medium-sized to large firms: US$ million to US$ million; large firms: over US$ million.
20 This figure includes additional products than just the medical devices discussed in section B.
176 Chapter III Economic Commission for Latin America and the Caribbean (ECLAC)
Notwithstanding this trade deficit, production in Brazilian territory reveals the existence of local capacities, both in manufacturing and in R&D. The largest transnational firms in the industry (Johnson & Johnson, Siemens Healthineers, GE Healthcare, Medtronic, Philips Healthcare, Covidien, Abbott Laboratories, Stryker, BD, Boston Scientific, B. Braun, Novartis (Alcon), 3M Health Care, Terumo and Smith & Nephew) are all present in the country; and, in order to supply the national market, many not only have manufacturing plants, but have also set up R&D facilities (ABIIS, 2015).
The situation is similar in other countries of the region, although on a smaller scale and with capacities more focused on specific segments. In contrast, the sector’s large industrial transnationals have mostly —or only— undertaken commercial sales and distribution activities with imported goods. For example, Argentina and Colombia are the third and fourth largest markets in the region for medical devices, have domestic capacities and are also dependent on imports. The national industry share is estimated at 25% in the Argentine market (Drucaroff, 2020) and 16% in the Colombian market (Invest in Bogotá, 2019).
In Argentina, the medical device industry consists of some 250 firms employing roughly 4,000 workers, with 75% of the jobs being concentrated in SMEs (in manufacturing industry the equivalent share is 50%) (Drucaroff, 2020). Among the members of the Argentine Chamber of Hospital Equipment Manufacturing (CAEHFA), 50% of the firms manufacture electromechanical equipment, 30% produce hospital furniture, and the remaining 20% are distributed among manufacturers of prostheses and disposable products.21 Many of the sector’s large transnationals and distributors of imported medical products (such as GE Healthcare, Siemens Healthineers, Phillips Healthcare, Boston Scientific, Toshiba, Samsung and Hitachi) are present in the country, but with commercial offices rather than manufacturing facilities.
The size of the medical device market is estimated at between US$ 1.25 billion and US$ 1.5 billion; and imported supply has been growing, with the result that the country has maintained a trade deficit in medical products for over a decade. The growth of the domestic market for medical equipment in the last decade elicited a more-than-proportional increase in imports, which shows that the national industry has been unable to capitalize on the additional domestic demand (Peirano, 2017). Moreover, the sector’s exports fell by 33% compared to the annual average between 2016 and 2019 and the same indicator for 2006–2015 (Drucaroff, 2020), reflecting a weakened competitive position in the international market.
Despite this, Argentina has a segment of suppliers that are specialized in medical devices of medium technological complexity, which have high technological and productive capacities. This segment also has firms that have developed significant competitive advantages in certain areas (for example, in medical sterilizers, incubators for babies and oxygen therapy equipment). The country has shown positive trade balances in those segments (Peirano, 2017).
The situation is similar in Colombia; the trade balance is negative and imports are increasing, but there are suppliers —both national firms and the subsidiaries of transnationals— that manufacture in the country and compete with imports, and even manage to export in some segments. The Colombian market for medical devices was worth some US$ 1.2 billion dollars in 2018, with 84% of sales value coming from imports (Invest in Bogotá, 2019). Production that generates export surpluses is mainly concentrated in the low technological-complexity segment (for example, probes, aspirators, plastic syringes, catheters, cannulas and similar instruments, and products for oxygen therapy) (Ministry of Foreign Affairs, 2018).
21 The Argentine Chamber of Hospital Equipment Manufacturing (CAEHFA) brings together 100 SMEs with local production that are registered as manufacturers of medical products with the National Drugs, Food and Medical Technology Administration (ANMAT) and participate regularly in public and private tenders to equip hospitals and clinics.

177Chapter IIIForeign Direct Investment in Latin America and the Caribbean • 2020
E. Towards a new scenario: how to boost regional integration
The medical device industry can be considered strategic for Latin America and the Caribbean, both because of the technological, business and skill capacities it requires, and from the standpoint of the development and strength of the countries’ health systems.
The pandemic, along with the restrictions on international trade in the products needed to deal with the health emergency, highlighted the danger of import dependency in strategic industries such as critical medical devices. In 2010, the World Health Organization (WHO) had already identified health technology as one of the weakest elements of national health systems; and the root of this problem is the absence of adequate health technology policies (WHO, 2010). Achieving availability and affordability in appropriate medical devices in health-care settings fosters health equity and the provision of services that are more responsive to patient needs. Accordingly, ensuring access to safe, effective, affordable, and high-quality medical devices must be part of any national health plan (WHO, 2012a).
In addition to the health-care dimension, which is essential for the countries of the region to be able achieve sustainable development, the development of greater production capacities in the medical device industry helps to diversify the region’s productive structure and improve its innovative capacity.22 Both are central elements in advancing towards the Sustainable Development Goal of decent work and economic growth.
The global market for medical devices, particularly the segments of medium and high technological complexity, has been heavily concentrated in advanced economies, especially the United States and in Europe. The central importance of regulation, along with highly stringent safety requirements and continuous innovation focused on the specific needs of an increasingly sophisticated demand, partly explain why large transnationals have kept most of their operations in their home economies.
Internationalization through FDI has also been limited, with the accent on goods of less technological complexity and where certain countries positioned themselves as specialization centres to supply certain key markets. In the region, this rationale has motivated investments pursuing efficiency through manufacturing facilities in Costa Rica and Mexico, and on a smaller scale in the Dominican Republic, to supply the United States; and market research in Brazil to supply the local and regional markets. The pandemic has caused transnationals to question their offshoring strategies in health-care related industries; and in this connection, the region may offer an advantage for firms seeking to relocate their investments closer to the United States.
In Costa Rica and the Dominican Republic, the industry developed at the behest of large transnationals and as part of national strategies to attract investment to the sector and gain access to increasingly complex industry segments. The sustained efforts of the investment promotion agency in Costa Rica, supported by interaction between different government entities, ministries, agencies, and the private sector, have yielded positive results. It proved possible to expand the number of firms and segments covered, attracting specialized suppliers to produce in a larger number of links in the value chain, thereby making the export basket more complex. It was also possible to develop a number of national production capabilities, although there is still room for further growth in this area.
22 Especially in terms of achieving Goal 3: Ensure healthy lives and promote well-being for all at all ages.

178 Chapter III Economic Commission for Latin America and the Caribbean (ECLAC)
International trade has also reflected the leadership of the advanced economies, and the region has a trade surplus as a result of exports from Costa Rica, Dominican Republic and Mexico. The other economies are running deficits in this sector, however (even those, such as Argentina, Brazil, and Colombia, that have domestic capacities and export medical devices). The demand for medical devices has grown in these countries, but this has been met by increasing imports, while exports have even declined in some cases.
In this scenario, the countries of the region that have medical device production capacity display a duality in the type of firms and their production. This reflects the region’s structural heterogeneity in nearly all of its production activities: firstly, an industry consisting of transnational corporations, operating within fairly narrow global value chains, which in the region operates in the segments of medium and low technological complexity, but also (increasingly) manufactures goods of high technological complexity; and, secondly another industry, consisting of national firms that mainly supply the domestic market, with fewer export opportunities, but some exceptions of very sophisticated firms, generally SMEs, which compete successfully in specific segments.
At the regional level, the COVID-19 crisis shows the increasing importance of stimulating cooperation in the region and developing a regional market for health and medical devices, along with cross-border industrial centres. Large markets have their own regulatory and certification requirements, which means that the standards for exporting to Argentina, Brazil or Mexico are very different. Thus, export opportunities within the region, and the creation of regional value chains, seems to be hamstrung under current regulations; and the challenge appears to be to promote areas of articulation in the region. However, some subregions, such as Central America and the Caribbean, have complementary production capacities and subregional chains could be developed, taking advantage of the capacities of other countries in the region, for example, in textiles.
Regarding the strategic objective of developing production capacities in the sector to make the health system more robust, a country’s integration into the global value chains of the medical equipment industry does not always guarantee local supply. Although investment attraction policies can play a positive role in capacity development, as seen in Costa Rica, there are different potential paths for the development of the medical device industry, depending on the situation of each country and its national priorities.
Local production and innovation in the medical device industry has positive effects for countries for a variety of reasons. As noted by WHO (2012b), the innovations that are carried out are relevant to local health needs; they are implemented by actors committed to the outcome; and are affordable in the local context. They also use local knowledge, help design problem-solving capacities and thus contribute to building a more robust health system. Having local production can reduce transportation costs, which implies a lower carbon footprint. This makes it possible to set up local supplier networks and support the development of industrial capacities, which would increase the security of supply of medical products. Nonetheless, developing a local medical device industry entails significant policy efforts.
One of the key requirements for developing a national medical device industry is to have a fluid relationship between the health sector, research centres and medical device firms. It is also necessary to stimulate technology transfer from the large transnationals present in the country, and also from the academic sector, to the local business sector. One of the sources of innovation in this industry is the search for adapted solutions, which are identified through close collaboration between health professionals, universities and firms.
Another key element is public procurement, which can play a fundamental role in improving purchasing processes, not only to make them transparent and ethical, but also to explore ways to boost local or regional activity, provided that the products offered by local industry can satisfy the health requirements established by health and regulatory authorities.

179Chapter IIIForeign Direct Investment in Latin America and the Caribbean • 2020
Ensuring access to, and the affordability of, appropriate, high-quality medical devices in the region requires policies that are integrated into national health plans, the requirements of which need to be assessed in the national context. In addition, the integration of emerging segments, such as digital health, into health policies and regulations and in policies related to health technologies and medical devices, is critical for the development of the national industry, and also for its contribution to public health policies. For example, telemedicine reinforces patient-centred care and helps to reduce the gap in access to quality health care; but accessibility difficulties may be an obstacle to its development. National plans are therefore needed that address the complexity of the realities that exist in the countries in the region.
Lastly, the region has technological and industrial capacities in the medical device industry, albeit fragmented. Recovery from the economic crisis caused by the pandemic will be a long process, requiring coordinated efforts by the region’s countries. In particular, it will be necessary to move towards a new model of sustainable and inclusive development, with a larger component of innovative and high value-added activities. This will enable the region to move away from the pattern of reprimarization in which it has been immersed in the last decade.
The medical device industry could provide a domain for exploring intraregional synergies with a view to a new development model. While this poses huge coordination challenges, the benefits could also be far-reaching and extensive.
Bibliography
ABIIS (Brazilian Alliance for Innovative Health Industry) (2020), “Medical-device sector (DMAs) in Brazil”, Economic Bulletin, No. 29, São Paulo, February.(2015), Health 4.0: Proposals to boost the innovation cycle in Medical Technology (MedTech) in Brazil, São Paulo.
ABIMO (Brazilian Association of Industries of Medical, Dental, Hospital and Laboratory Equipment) (2018), “Economic Data”, São Paulo [online] https://abimo.org.br/docs/Infografico-dados_br_2018.pdf.
Bamber, P. and G. Gereffi (2013), “Costa Rica in the medical devices global value chain: opportunities for upgrading”, Durham, Duke University, August.
Behnam, M. and others (2019), “Rethinking manufacturing and distribution networks in medtech”, New York, McKinsey & Firm, December [online] https://www.mckinsey.com/industries/pharmaceuticals-and-medical-products/our-insights/rethinking-manufacturing-and-distribution-networks-in-medtech.
Bogliacino, F. and M. Pianta (2016), “The Pavitt Taxonomy, revisited: patterns of innovation in manufacturing and services”, Economia Política, vol. 33, Berlin, Springer.
CINDE (Costa Rican Investment Promotion Agency) (2020), “Life sciences sector: Latin America’s leading med tech hub” [online] https://www.cinde.org/en/sectors/life-sciences.
CNZFE (National Free Zones Council) (2019), Statistical Report: Free Zones Sector 2019, Santo Domingo.Cornick, J. and A. Trejos (2018), “Costa Rica: building on successes to address new productive
development policy challenges”, Building Capabilities for Productive Development, E. Stein and others (eds.), Washington, D.C., Inter-American Development Bank (IDB).
Donahoe, G. (2018), “Estimates of medical device spending in the United States”, Washington, D.C., Advanced Medical Technology Association (AdvaMed), November [online] https://www.advamed.org/sites/default/files/resource/estimates_of_medical_device_spending_in_the_united_states_november_2018.pdf.
Donzé, P. and R. Imer (2020), “Innovation in the global medtech industry: an empirical analysis of patent applications, 1960-2014”, Osaka Economic Papers, vol. 69, No. 4, Osaka, Osaka University.
Drucaroff, S. (2020), “Políticas para promover la autonomía sanitaria basada en el desarrollo de proveedores estratégicos de dispositivos médicos”, Santiago, Economic Commission for Latin America and the Caribbean (ECLAC), unpublished.
180 Chapter III Economic Commission for Latin America and the Caribbean (ECLAC)
ECLAC (Economic Commission for Latin America and the Caribbean) (2020), “Restrictions on the export of medical products hamper efforts to contain coronavirus disease (COVID-19) in Latin America and the Caribbean”, COVID-19 Report, Santiago, May.(2018), Foreign Direct Investment in Latin America and the Caribbean, 2018 (LC/PUB.2018/13-P), Santiago. (2017), Foreign Direct Investment in Latin America and the Caribbean, 2017 (LC/PUB.2017/18-P), Santiago.
Evaluate (2018), World Preview 2018, Outlook to 2024, London, June.Gaulier, G. and S. Zignano (2010), “BACI: International Trade Database at the Product-Level.
The 1994-2007 Version”, CEPII Working Paper 2010, No. 23, Paris, Centre for International Prospective Studies and Information (CEPII), October.
Gereffi, G. (2020), “What does the COVID-19 pandemic teach us about global value chains? The case of medical supplies”, Journal of International Business Policy, vol. 3, Berlin, Springer.
Gereffi, G., S. Frederick and P. Bamber (2019), “Diverse paths of upgrading in high-tech manufacturing: Costa Rica in the electronics and medical devices global value chains”, Transnational Corporations, vol. 26, No. 1, Geneva, United Nations Conference on Trade and Development (UNCTAD).
Hamrick, D. and P. Bamber (2019), “Pakistan in the medical devices global value chain”, Durham, Duke University [online] https://gvcc.duke.edu/wp-content/uploads/PakistanMedicalDeviceGVC.pdf.
Helble, M. (2012), “More trade for better health? International trade and tariffs on health products”, Staff Working Paper, No. ERSD-2012-17, Geneva, World Trade Organization (WTO).
Hernández, H. and others (2020), The 2019 EU Industrial R&D Investment Scoreboard, Luxembourg, European Union.
Huang, Y. (2019), “U.S. firms’ access to health industries and market opportunities in China”, New York, Council on Foreign Relations (CFR), July [online] https://www.uscc.gov/sites/default/files/Yanzhong%20Huang%20-%20U%20S%20-China%20CommissionTestimony.pdf.
Invest in Bogotá (2019), “Dispositivos médicos”, Bogotá [online] https://es.investinbogota.org/sectores-de-inversion/dispositivos-medicos.
Johnson & Johnson (2011), “Johnson & Johnson and Synthes announce definitive merger agreement to create world’s most innovative and comprehensive orthopaedics business”, New Brunswick, 27 April [online] https://www.jnj.com/media-center/press-releases/johnson-johnson-and-synthes-announce-definitive-merger-agreement-to-create-worlds-most-innovative-and-comprehensive-orthopaedics-business.
Kelly, S. and G. Roumeliotis (2014), “Medtronic to buy Covidien for US$ 42.9 billion, rebase in Ireland”, London, Reuters, 15 June [online] https://www.reuters.com/article/us-covidien-medtronic-inc/medtronic-to-buy-covidien-for-42-9-billion-rebase-in-ireland-idUSKBN0ER03420140616.
Loschky, A. (2010), “Reviewing the nomenclature for high-tech: the sectoral approach”, Joint Research Centre Scientific and Technical Reports, No. EUR 24285 EN, Luxembourg, European Commission.
Luxottica (2011), “Luxottica to acquire Tecnol, a leading eyewear firm in Brazil”, Milan, 1 December [online] http://www.luxottica.com/en/luxottica-acquire-tecnol-leading-eyewear-firm-brazil.
MedTech Europe (2020), The European Medical Technology Industry in Figures 2020, Brussels. (2015), “Safer, timely and life-changing: medtech innovation is good for patients and policymakers alike”, Brussels, 6 November [online] https://www.medtecheurope.org/news-and-events/default/safer-timely-and-life-changing-medtech-innovation-is-good-for-patients-and-policymakers-alike/.
Ministry of Foreign Affairs (2018), “El mercado de dispositivos médicos en Colombia,” Ficha de Mercado, Santiago, May [online] https://www.prochile.gob.cl/wp-content/uploads/2018/08/fmp_dispositivos_medicos_colombia.pdf.
Ministry of Industry, Commerce, and MSMEs (2019), “Estudio necesidades de talento sector dispositivos médicos: perfil actual de talento”, Santo Domingo, August [online] https://www.micm.gob.do/images/pdf/publicaciones/libros/estudios/Estudio_Necesidades_de_Talento_Sector_Dispositivos_Medicos.pdf.
Mora, E. (2019), “Desarrollo e integración de la industria de dispositivos médicos en Irlanda: lecciones para Costa Rica”, Estudios de Mercado, San José, Foreign Trade Corporation of Costa Rica (PROCOMER), December.
MPO (Medical Product Outsourcing) (2013), “Stryker to acquire China orthopaedics manufacturer”, Montvale, 2 April [online] https://www.mpo-mag.com/contents/view_columns/2013-02-04/stryker-to-acquire-china-orthopaedics-manufacturer/.
National Customs Service (2007), “Arancel Aduanero 2007 (vigente hasta el 31.12.2011)”, Santiago [online] https://www.aduana.cl/arancel-aduanero-2007/aduana/2007-02-14/133855.html.

181Chapter IIIForeign Direct Investment in Latin America and the Caribbean • 2020
NuVasive (2016), “NuVasive announces agreement to acquire Brazilian distributor Mega Surgical”, San Diego, 7 March [online] https://www.nuvasive.com/news/nuvasive-announces-agreement-to-acquire-brazilian-distributor-mega-surgical/.
OECD (Organization for Economic Cooperation and Development) (2016), “Harmonised System 2007 (Edition 2015)”, International Trade by Commodity Statistics [online database] https://www.oecd-ilibrary.org/trade/data/international-trade-by-commodity-statistics/harmonised-system-2007-edition-2015-1_86252354-en.
Panescu, D. (2006), “Medical-device industry”, Wiley Encyclopedia of Biomedical Engineering, Hoboken, Wiley.
Pavitt, K. (1984), “Patterns of technical change: towards a taxonomy and a theory”, Research Policy, vol. 13, No. 6, Amsterdam, Elsevier.
Peirano, F. (2017), “Equipamiento médico en la Argentina”, Santiago, Economic Commission for Latin America and the Caribbean (ECLAC), unpublished.
SCIJ (Costa Rican Legal Information System) (2012), Executive Decree No. 36952, San José, 11 January [online] http://www.pgrweb.go.cr/scij/Busqueda/Normativa/Normas/nrm_texto_completo.aspx?param1=NRTC&nValor1=1&nValor2=71951&nValor3=87552&strTipM=TC.
Simoens, S. (2009), “Which barriers prevent the efficient use of resources in medical-device sectors?”, Applied Health Economics and Health Policy, vol. 7, No. 4, Berlin, Springer.
Smith & Nephew (2013), “Smith & Nephew to acquire Indian trauma business”, Herts, 2 May [online] https://www.smith-nephew.com/news-and-media/media-releases/news/smith--nephew-to-acquire-indian-trauma-business/.
Solano, D. (2020), “Baja California, considered the capital of medical devices in North America,” Mexico City, Canifarma, 4 March [online] https://dispositivosmedicos.org.mx/baja-california-considerada-la-capital-de-los-dispositivos-medicos-en-america-del-norte/.
Soto, J. (2019), “Establishment Labs projects to obtain first report of clinical studies in the second semester of 2021”, El Financiero, San José, 30 December [online] https://www.elfinancierocr.com/negocios/establishment-labs-proyecta-obtener-primer-reporte/4Q4ITEOUBJFWDN65OGRIKO5LDQ/story/.
Torres, V. (2018), “The market of sanitary technology in Brazil”, Market Studies, São Paulo, ICEX Spain Export and Investment, May.
UNCTAD (United Nations Conference on Trade and Development) (2020), “World Investment Report: annex tables”, Geneva [online] https://unctad.org/en/Pages/DIAE/World%20Investment%20Report/Annex-Tables.aspx.(2019), World Investment Report: Special Economic Zones, Geneva.
United Nations (2002), “International Standard Industrial Classification of All Economic Activities (ISIC): revision 3.1”, Statistical Papers, series M, No. 4 (ST/ESA/STAT/SER.M/4/Rev.3.1), New York.
Varney, S. (2017), “Tijuana has become a world capital in medical device manufacturing,” The New York Times, New York, 4 April [online] https://www.nytimes.com/es/2017/04/04/espanol/america-latina/tijuana-tlcan-dispositivos-medicos.html.
Velázquez, A. and A. Díaz (2017), “The Role of Medical Devices in Universal Health Coverage (UHC) and the Achievement of the ODS,” Geneva, World Health Organization (WHO) [online] https://www.who.int/medical_devices/OMS_Informacion_sobre_Dispositivos_Medicos_10_2017.pdf?ua=1.
WHO (World Health Organization) (2012), Local Production and Technology Transfer to Increase Access to Medical Devices: Addressing the Barriers and Challenges in Low- and Middle-Income Countries, Geneva.(2011), “Development of medical device policies”, WHO Medical device technical series, Geneva [online] https://apps.who.int/iris/bitstream/handle/10665/44600/9789241501637-eng.pdf?sequence=1&isAllowed=y. (2010), “In search for equity in medical devices accessibility”, Kobe, July [online] https://apps.who.int/iris/bitstream/handle/10665/70533/WHO_HSS_EHT_DIM_10.15_eng.pdf. (2007), “Health technologies”, Resolution, No. WHA60.29, Geneva, May [online] http://www.who.int/medical_devices/resolution_wha60_29-en1.pdf.
WTO (World Trade Organization) (2020), “Trade in medical goods in the context of tackling COVID-19: information note”, Geneva, April [online] https://www.wto.org/english/news_e/news20_e/rese_03apr20_e.pdf.
Zimmer Biomet (2010), “Zimmer finalizes acquisition of Chinese orthopaedic implant leader Beijing Montagne Medical Device Co., Ltd.”, Warsaw, 21 December [online] https://investor.zimmerbiomet.com/news-and-events/news/archive/21-12-2010-192355724.
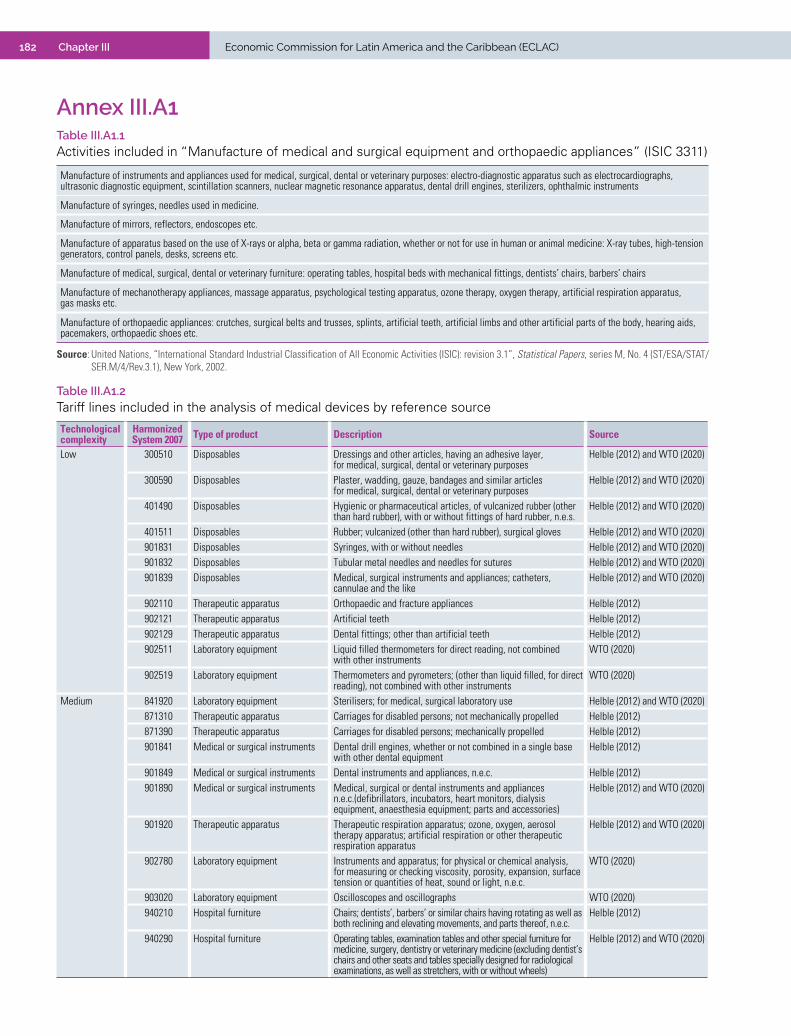
182 Chapter III Economic Commission for Latin America and the Caribbean (ECLAC)
Annex III.A1 Table III.A1.1 Activities included in “Manufacture of medical and surgical equipment and orthopaedic appliances” (ISIC 3311)
Manufacture of instruments and appliances used for medical, surgical, dental or veterinary purposes: electro-diagnostic apparatus such as electrocardiographs, ultrasonic diagnostic equipment, scintillation scanners, nuclear magnetic resonance apparatus, dental drill engines, sterilizers, ophthalmic instruments
Manufacture of syringes, needles used in medicine.
Manufacture of mirrors, reflectors, endoscopes etc.
Manufacture of apparatus based on the use of X-rays or alpha, beta or gamma radiation, whether or not for use in human or animal medicine: X-ray tubes, high-tension generators, control panels, desks, screens etc.
Manufacture of medical, surgical, dental or veterinary furniture: operating tables, hospital beds with mechanical fittings, dentists’ chairs, barbers’ chairs
Manufacture of mechanotherapy appliances, massage apparatus, psychological testing apparatus, ozone therapy, oxygen therapy, artificial respiration apparatus, gas masks etc.
Manufacture of orthopaedic appliances: crutches, surgical belts and trusses, splints, artificial teeth, artificial limbs and other artificial parts of the body, hearing aids, pacemakers, orthopaedic shoes etc.
Source: United Nations, “International Standard Industrial Classification of All Economic Activities (ISIC): revision 3.1”, Statistical Papers, series M, No. 4 (ST/ESA/STAT/SER.M/4/Rev.3.1), New York, 2002.
Table III.A1.2 Tariff lines included in the analysis of medical devices by reference source
Technological complexity
Harmonized System 2007 Type of product Description Source
Low 300510 Disposables Dressings and other articles, having an adhesive layer, for medical, surgical, dental or veterinary purposes
Helble (2012) and WTO (2020)
300590 Disposables Plaster, wadding, gauze, bandages and similar articles for medical, surgical, dental or veterinary purposes
Helble (2012) and WTO (2020)
401490 Disposables Hygienic or pharmaceutical articles, of vulcanized rubber (other than hard rubber), with or without fittings of hard rubber, n.e.s.
Helble (2012) and WTO (2020)
401511 Disposables Rubber; vulcanized (other than hard rubber), surgical gloves Helble (2012) and WTO (2020)901831 Disposables Syringes, with or without needles Helble (2012) and WTO (2020)901832 Disposables Tubular metal needles and needles for sutures Helble (2012) and WTO (2020)901839 Disposables Medical, surgical instruments and appliances; catheters,
cannulae and the likeHelble (2012) and WTO (2020)
902110 Therapeutic apparatus Orthopaedic and fracture appliances Helble (2012)902121 Therapeutic apparatus Artificial teeth Helble (2012)902129 Therapeutic apparatus Dental fittings; other than artificial teeth Helble (2012)902511 Laboratory equipment Liquid filled thermometers for direct reading, not combined
with other instrumentsWTO (2020)
902519 Laboratory equipment Thermometers and pyrometers; (other than liquid filled, for direct reading), not combined with other instruments
WTO (2020)
Medium 841920 Laboratory equipment Sterilisers; for medical, surgical laboratory use Helble (2012) and WTO (2020)871310 Therapeutic apparatus Carriages for disabled persons; not mechanically propelled Helble (2012)871390 Therapeutic apparatus Carriages for disabled persons; mechanically propelled Helble (2012)901841 Medical or surgical instruments Dental drill engines, whether or not combined in a single base
with other dental equipmentHelble (2012)
901849 Medical or surgical instruments Dental instruments and appliances, n.e.c. Helble (2012)901890 Medical or surgical instruments Medical, surgical or dental instruments and appliances
n.e.c.(defibrillators, incubators, heart monitors, dialysis equipment, anaesthesia equipment; parts and accessories)
Helble (2012) and WTO (2020)
901920 Therapeutic apparatus Therapeutic respiration apparatus; ozone, oxygen, aerosol therapy apparatus; artificial respiration or other therapeutic respiration apparatus
Helble (2012) and WTO (2020)
902780 Laboratory equipment Instruments and apparatus; for physical or chemical analysis, for measuring or checking viscosity, porosity, expansion, surface tension or quantities of heat, sound or light, n.e.c.
WTO (2020)
903020 Laboratory equipment Oscilloscopes and oscillographs WTO (2020)940210 Hospital furniture Chairs; dentists’, barbers’ or similar chairs having rotating as well as
both reclining and elevating movements, and parts thereof, n.e.c.Helble (2012)
940290 Hospital furniture Operating tables, examination tables and other special furniture for medicine, surgery, dentistry or veterinary medicine (excluding dentist’s chairs and other seats and tables specially designed for radiological examinations, as well as stretchers, with or without wheels)
Helble (2012) and WTO (2020)

183Chapter IIIForeign Direct Investment in Latin America and the Caribbean • 2020
Technological complexity
Harmonized System 2007 Type of product Description Source
High 900630 Diagnostic and imaging equipment Special cameras for medical examination of internal organs or for forensic medicine or forensic identification laboratories
Helble (2012)
901050 Diagnostic and imaging equipment Other photographic or cinematographic laboratory apparatus and equipment; negatoscopes
WTO (2020)
901110 Diagnostic and imaging equipment Other photographic or cinematographic laboratory apparatus and equipment; negatoscopes
WTO (2020)
901180 Diagnostic and imaging equipment Other microscopes WTO (2020)
901811 Diagnostic and imaging equipment Electrocardiographs Helble (2012) and WTO (2020)
901812 Diagnostic and imaging equipment Diagnostic Ultrasound Equipment Helble (2012) and WTO (2020)
901813 Diagnostic and imaging equipment Diagnostic magnetic resonance imaging apparatus Helble (2012) and WTO (2020)
901814 Diagnostic and imaging equipment Scintigraphic apparatus Helble (2012) and WTO (2020)
901819 Diagnostic and imaging equipment Electro-diagnostic apparatus, including apparatus for functional examination or monitoring of physiological parameters
Helble (2012) and WTO (2020)
901820 Diagnostic and imaging equipment Ultraviolet or infrared medical apparatus Helble (2012) and WTO (2020)
901850 Medical or surgical instruments Ophthalmic instruments and appliances, n.e.c. Helble (2012)
902131 Therapeutic apparatus Orthopaedic joint prosthesis Helble (2012)
902139 Therapeutic apparatus Prosthetic articles and appliances (excluding dentures and artificial joints)
Helble (2012)
902140 Therapeutic apparatus Hearing aids, excluding parts and accessories Helble (2012)
902150 Therapeutic apparatus Heart stimulators (excl. their parts and accessories) Helble (2012) and WTO (2020)
902190 Therapeutic apparatus Appliances worn or implanted in the body to compensate for a defect or disability (e.g. prosthetic devices and appliances, as well as hearing aids and cardiac stimulators, complete)
Helble (2012)
902212 Diagnostic and imaging equipment Tomography apparatus governed by an automatic data processing machine
Helble (2012) and WTO (2020)
902213 Diagnostic and imaging equipment X-ray apparatus for dental use Helble (2012)
902214 Diagnostic and imaging equipment Other x-ray machines and equipment for medical, surgical or veterinary use
Helble (2012) and WTO (2020)
902219 Diagnostic and imaging equipment X-ray apparatus for other uses WTO (2020)
902221 Diagnostic and imaging equipment Apparatus using alpha, beta or gamma radiation, for medical, surgical, dental or veterinary use
Helble (2012) and WTO (2020)
902229 Diagnostic and imaging equipment Apparatus using alpha, beta or gamma radiation for other uses WTO (2020)
902230 Diagnostic and imaging equipment X-ray tubes WTO (2020)
902290 Diagnostic and imaging equipment X-ray generators, voltage generators, control consoles, tables, chairs, screens, examination and treatment tables and similar supports, parts thereof and other apparatus of heading 9022 n.e.c.
WTO (2020)
Source: Economic Commission for Latin America and the Caribbean (ECLAC), on the basis of World Trade Organization (WTO), “Trade in medical goods in the context of tackling COVID-19: information note”, Geneva, 2020 [online] https://www.wto.org/english/news_e/news20_e/rese_03apr20_e.pdf; M. Helble, “More trade for better health? International trade and tariffs on health products”, Staff Working Paper, No. ERSD-2012-17, Geneva, World Trade Organization (WTO), 2012; Organization for Economic Cooperation and Development (OECD), “Harmonized System 2007 (Edition 2015)”, International Trade by Commodity Statistics, 2016 [online database] https://www.oecd-ilibrary.org/trade/data/international-trade-by-commodity-statistics/harmonized-system-2007-edition-2015-1_86252354-en; “Harmonized System 2017 (Edition 2019)”, International Trade by Commodity Statistics, 2019 [online database] https://www.oecd-ilibrary.org/trade/data/international-trade-by-commodity-statistics/harmonized-system-2017-edition-2019_ae15a7a8-en.
Note: The World Trade Organization (WTO) categories are reported under the Harmonized System 2017, so the correspondence tables provided by the United Nations were used. The abbreviation n.e.c. is equivalent to “not elsewhere classified”.
Table III.A1.2 (concluded)
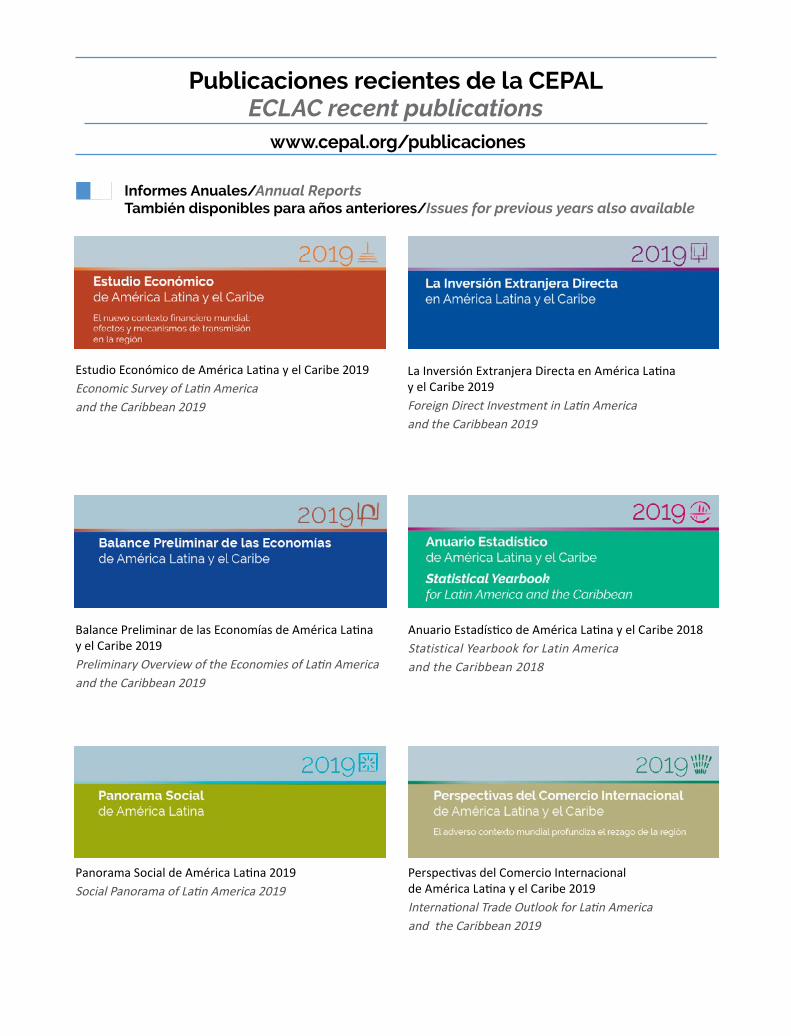
Publicaciones recientes de la CEPAL ECLAC recent publications
www.cepal.org/publicaciones
Informes Anuales/Annual ReportsTambién disponibles para años anteriores/Issues for previous years also available
Estudio Económico de América Latina y el Caribe 2019Economic Survey of Latin America and the Caribbean 2019
Balance Preliminar de las Economías de América Latina y el Caribe 2019Preliminary Overview of the Economies of Latin America and the Caribbean 2019
Panorama Social de América Latina 2019Social Panorama of Latin America 2019
La Inversión Extranjera Directa en América Latina y el Caribe 2019Foreign Direct Investment in Latin America and the Caribbean 2019
Anuario Estadístico de América Latina y el Caribe 2018Statistical Yearbook for Latin America and the Caribbean 2018
Perspectivas del Comercio Internacional de América Latina y el Caribe 2019International Trade Outlook for Latin America and the Caribbean 2019
POR UN DESARROLLOSOSTENIBLE CON IGUALDAD
Des
arro
llo e
igua
ldad
: el p
ensa
mie
nto
de
la C
EPA
L en
su
sépt
imo
dec
enio
Desarrollo e igualdad:el pensamiento de la CEPAL
en su séptimo decenioTextos seleccionados del período 2008-2018
Ricardo Bielschowsky - Miguel Torres | compiladores
COLECCIÓN 70 AÑOS
El Pensamiento de la CEPAL/ECLAC Thinking
Libros y Documentos Institucionales/Institutional Books and Documents
Desarrollo e igualdad: el pensamiento de la CEPAL en su séptimo decenio. Textos seleccionados del período 2008-2018
La ineficiencia de la desigualdadThe Inefficiency of Inequality
Horizontes 2030: la igualdad en el centro del desarrollo sostenibleHorizons 2030: Equality at the centre of sustainable developmentHorizontes 2030: a igualdade no centro do desenvolvimento sustentável
Informe sobre el impacto económico en América Latina y el Caribe de la enfermedad por coronavirus (COVID-19)Report on the economic impact of coronavirus disease (COVID-19) on Latin America and the Caribbean
La Agenda 2030 para el Desarrollo Sostenible en el nuevo contexto mundial y regional: escenarios y proyecciones en la presente crisisThe 2030 Agenda for Sustainable Development in the new global and regional context: Scenarios and projections in the current crisis
Libros de la CEPAL/ECLAC BooksLa emergencia del cambio climático en América Latina y el Caribe: ¿seguimos esperando la catástrofe o pasamos a la acción? The climate emergency in Latin America and the Caribbean: The path ahead – resignation or action?
Los sistemas de pensiones en la encrucijada: desafíos para la sostenibilidad en América Latina
Recursos naturales, medio ambiente y sostenibilidad. 70 años de pensamiento de la CEPAL
Páginas Selectas de la CEPAL/ECLAC Select Pages
Protección social universal en América Latina y el Caribe. Textos seleccionados 2006-2019Universal Social Protection in Latin America and the Caribbean: Selected texts 2006-2019
Migración y desarrollo sostenible: la centralidad de los derechos humanos. Textos seleccionados 2008-2019
Empleo en América Latina y el Caribe. Textos seleccionados 2006-2017
Población
Nº 108ISSN 0303-1829
Comisión Económica para América Latina y el Caribe (CEPAL)
Centro Latinoamericano y Caribeño de Demografía (CELADE)
División de Población de la CEPAL
ENERO-JUNIO
2019
AÑO XLVI
notas de
Amores imposibles: la brecha entre
universitarios y el resto de grupos
educativos en los mercados
matrimoniales de América Latina,
1970-2010
Victoria San Juan Bernuy
Albert Esteve
La estructura de los hogares y el
ahorro en México: un enfoque
de clases latentes
Curtis Huffman
Paloma Villagómez-Ornelas
Delfino Vargas Chanes
Transferencias intergeneracionales
por género y efectos económicos
del envejecimiento demográfico
en México
Iván Mejía-Guevara
Estela Rivero
Isalia Nava
Inmigración e inclusión laboral y
protección social según el origen
y el tiempo de residencia de los
migrantes en países seleccionados
de América Latina
Ignacio Carrasco
José Ignacio Suárez
Epicentros de emigración: un análisis
comparativo de la evolución de sus
dinámicas socioeconómicas y
demográficas en Colombia y el Brasil
Gisela P. Zapata
Construcciones y alcances del derecho
a la salud en el Primer Plan Nacional
de Acción en Derechos Humanos
(Argentina, 2017-2020): prioridades
de agenda y lineamientos de política
pública desde un enfoque
de derechos humanos
Laura Gottero
Una estimación de la mortalidad en la
ciudad de Buenos Aires hacia 1827
Luis Pablo Dmitruk
Tomás Guzmán
La diversidad sexual y de género en
censos y encuestas de América Latina:
entre la invisibilidad y la
lógica heteronormativa
Fernanda Stang Alva
Compresión de la mortalidad en el
Uruguay: niveles y diferencias
regionales en el período 1996-2014
Mariana Paredes
Mariana Tenenbaum
Factores asociados al trabajo infantil en
la República Bolivariana de Venezuela
Malinda Coa Ravelo
Ernesto Ponsot Balaguer
Revista CEPAL/CEPAL Review
Coediciones/Co-editions Copublicaciones/Co-publications
Documentos de Proyectos Project Documents
Series de la CEPAL/ECLAC Series
Observatorio Demográfico Demographic Observatory
Notas de Población
Metodologías de la CEPALECLAC Methodologies
Publicaciones de la CEPAL
Info
rme
s A
nu
ale
s
OBSE
RVA
TORIO
DEM
OG
RÁ
FICO
Libr
os d
e la
CEP
AL
Revi
sta
CEP
AL
Libr
os in
stitu
cion
ales
Pági
nas
Sele
ctas
Libros de la CEPAL
Manuales de la CEPAL
Notas de Población
Cuadernos Estadísticos
www.cepal.org/es/suscripciones www.cepal.org/en/suscripciones
Subscribe to receive up-to-the-minute information on ECLAC publications
Suscríbase y reciba información oportuna sobre las publicaciones de la CEPAL
facebook.com/publicacionesdelacepal
www.cepal.org/publicaciones
Las publicaciones de la CEPAL también se pueden adquirir a través de: ECLAC publications also available at:
shop.un.orgTel. (1-888)254-4286Fax (1-800)338-4550
Contacto/Contact: [email protected]/Orders: [email protected]
United Nations PublicationsPO Box 960
Herndon, VA 20172USA

www.eclac.org