forecasting with sas · forecasting with sas. 2 ... method=winters trend=3; id time; var &v1;...
TRANSCRIPT

Linda Lieu
Advanced Analytics Intern, TransUnion Canada
Golden Horseshoe SAS User Group (GHSUG)
Burlington, Ontario, Canada
May 2015
Forecasting with SAS

2 | © TransUnion. LLC All Rights Reserved
Time Series
• A sequence of observations over a time period.
• Classical Characteristics Trend Seasonality Cycles Residuals
• Applications Economics Finance Medicine Science

3 | © TransUnion. LLC All Rights Reserved
Agenda
Time Series (observe the trend)
Features of Proc Forecast
Methods (determine the best method to forecast the data)
Breakdown of the Code
Applications
Example: Healthcare Labour Force in Ontario from 2009 - 2013
Quirks
Advanced Forecasting Methods

4 | © TransUnion. LLC All Rights Reserved
• Fast and automatic forecasts for many series in one step as long as the series is organized by variables (VAR) or groups (BY).
• Does not require a thorough statistical analysis of the time series.
• Forecast a series based on the historical data (one variable), and does not consider other variables that may affect the time series in question.
Features of Proc Forecast
The BY statement is often
used for cross-sectional
studies.

5 | © TransUnion. LLC All Rights Reserved
General Options
data=<dataset set to forecast>lead=<desired number of forecast values>interval=<frequency of the time series (useful if you want to forecast by year instead of by month)>Out=<outputs the parameter and forecast estimates>Outest=<outputs the statistical measure>
Projects the next 12
months of the
Healthcare variable.
6 | © TransUnion. LLC All Rights Reserved
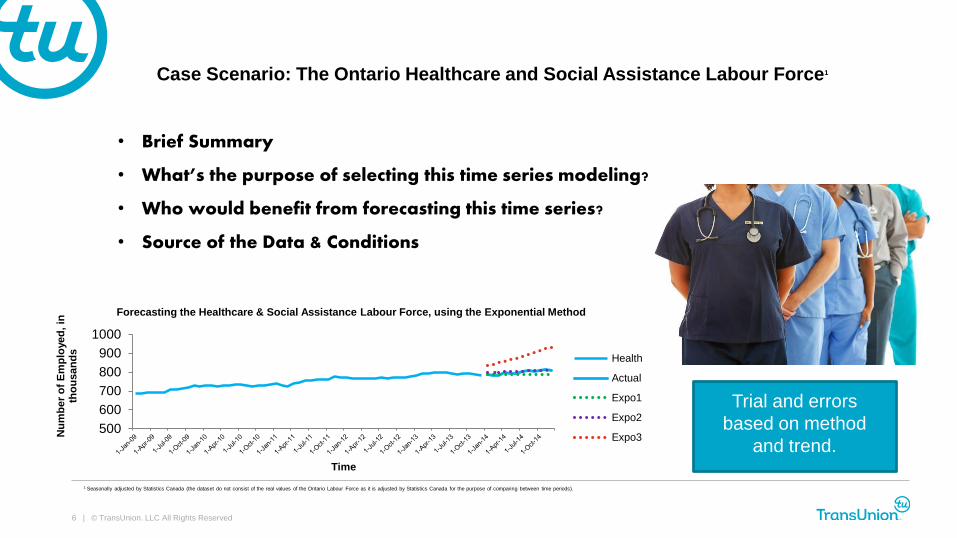
Case Scenario: The Ontario Healthcare and Social Assistance Labour Force1
1 Seasonally adjusted by Statistics Canada (the dataset do not consist of the real values of the Ontario Labour Force as it is adjusted by Statistics Canada for the purpose of comparing between time periods).
• Brief Summary
• What’s the purpose of selecting this time series modeling?
• Who would benefit from forecasting this time series?
• Source of the Data & Conditions
500
600
700
800
900
1000
Nu
mb
er
of
Em
plo
yed
, in
th
ou
san
ds
Time
Forecasting the Healthcare & Social Assistance Labour Force, using the Exponential Method
Health
Actual
Expo1
Expo2
Expo3
Trial and errors
based on method
and trend.

7 | © TransUnion. LLC All Rights Reserved
Smoothing Exponential Methods
SINGLE DOUBLE TRIPLE
Requirement
• The mean of the series
decreases over time
• Constant model
• Must be approximately
linear trend
• Must be at least a
quadratic model
Code
proc forecast data=health.five lead=12
interval=month out=health.forecast_expo1
method=expo trend=1;
id time;
var &v1; run;
proc forecast data=health.five lead=12
interval=month out=health.forecast_expo1
method=expo trend=2;
id time;
var &v1; run;
proc forecast data=health.five lead=12
interval=month out=health.forecast_expo1
method=expo trend=3;
id time;
var &v1; run;
Options
• Smaller smoothing weights are recommended for series with stable trends
whereas larger weights should be used for unstable series.

700
750
800
850
900
950N
um
be
r o
f E
mp
loyed
, in
th
ou
san
ds
Time
Forecasting the Healthcare & Social Assistance Labour Force, using the Exponential Method
Health
Actual
Expo1
Expo2
Expo3
• Recent data are more heavily factored in than the early observations

770
780
790
800
810
820
830
840N
um
be
r o
f E
mp
loyed
, in
th
ou
san
ds
Time
Forecasting the Healthcare & Social Assistance Labour Force, using the STEPAR Method
Health
Actual
STEPAR
STEPAR (Stepwise Autoregressive)
• Automatic forecasting method that fit the series with equal weights.
• Combine models that are suitable for considering long-term trend (trend models) and short-term flux (autoregressive)

10 | © TransUnion. LLC All Rights Reserved
WINTERS Methods
CONSTANT LINEAR QUADRATIC
Description
• Presume the values of the time series’ variable are positive.
• Seasonal parameters are multiplied with the trend.
Features
• Predicts a constant
forecast value for all
future time intervals.
• If trend=n is not specified
in the code, this is
usually the default option.
• Unstable and not advised
to use.
Code
proc forecast data=health.five lead=12
interval=month out=health.forecast_winter1
method=winters trend=1;
id time;
var &v1; run;
proc forecast data=health.five lead=12
interval=month out=health.forecast_winter2
method=winters trend=2;
id time;
var &v1; run;
proc forecast data=health.five lead=12
interval=month out=health.forecast_winter3
method=winters trend=3;
id time;
var &v1; run;
Options• The consideration of seasonality makes use of the INTERVAL and SEASONS
options
760
770
780
790
800
810
820N
um
be
r o
f E
mp
loyed
, in
th
ou
san
ds
Time
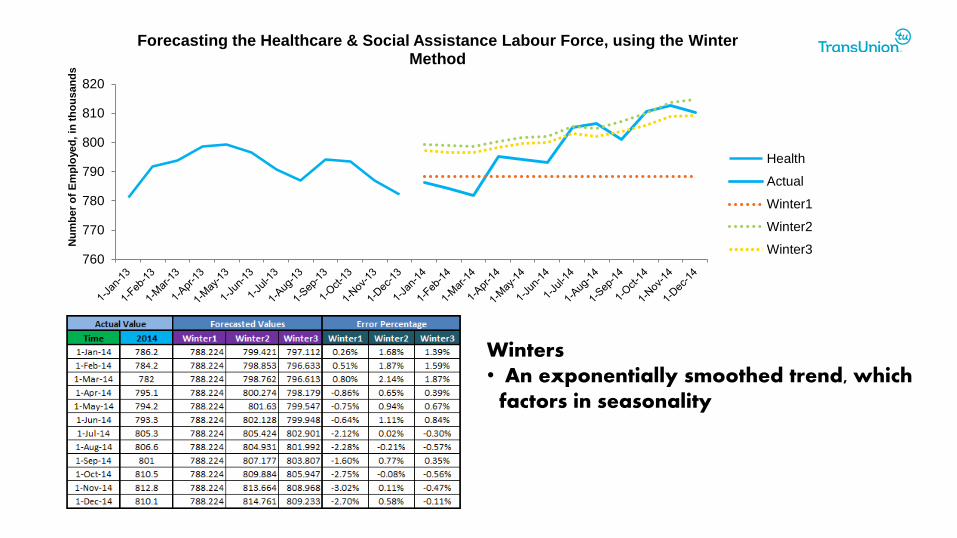
Forecasting the Healthcare & Social Assistance Labour Force, using the Winter Method
Health
Actual
Winter1
Winter2
Winter3
Winters• An exponentially smoothed trend, which
factors in seasonality

500
550
600
650
700
750
800
850N
um
be
r o
f E
mp
loyed
, in
th
ou
san
ds
Time
Forecasting the Healthcare & Social Assistance Labour Force, using the ADDWINTER Method
Health
Actual
ADDWINTER1
ADDWINTER2
ADDWINTER3
Additive Winters• Similar to the Winters Method,
except the seasonal parameters are added to the trend

13 | © TransUnion. LLC All Rights Reserved
• The interval variable must be formatted into a SAS date.
• Since we are forecasting with a time series, make sure the observations are sorted by time from past to present.
• Always try a variety conditions such as the time period, smoothing weight, methods, etc on a test run since every time series have different characteristics.
Quirks

14 | © TransUnion. LLC All Rights Reserved
PROC FORECASTPROC ARIMA (Auto Regression Integrated
Moving Average)
Features
• Automatic trend extrapolation.
• No need for complex statistical
analysis.
• Outputs detail analysis of a series.
• Selects the best fit with the least mean
squared forecast residuals.
• Generates forecast values as a linear
combination of the series’ historical
values and errors.
Best For
• Forecasting numerous of time
series at once.
• Forecasting one series via the
identification, estimation, and forecast
stages.
Univariate Forecasting Models

15 | © TransUnion. LLC All Rights Reserved
PROC VARMAX PROC STATESPACE
Features
• Predict forecasts from the
regression model.
• Provide tests to find constant
error terms, etc.
• Forecast numerous of relevant
variables based on the
autocorrelations.
General
• Forecasts the response variable based on the influence of the predictor
variables (X1, X2, X3, .., Xn) .
• Able to project forecasts, based on scenarios (Example, oil price falls, the
forecast of GDP is expect to fall in Venezuela).
Multivariate Forecasting Models

ContactLinda Lieu
Advanced Analytics Intern, TransUnion Canada, January 2015 - August 2015
3rd Year Student, Actuarial and Financial Mathematics, McMaster University
Expected Graduation: April 2017
A special thank you to Peter Loparco and Justin Jia for their feedbacks and guidance.

17 | © TransUnion. LLC All Rights Reserved
• By 2035, the senior population will consist of 23.8% of the Ontario’s population (grow to 4.1
millions).
• More people are beginning their career past the age of 18 due to post-secondary education.
• Health care professionals tend to be older.
• Factors that affect skills shortage: age structure of the labour sector, training length, mobility,
and workplace conditions (long hours, inconsistent shifts, and difficult patients).
Appendix: Ontario Healthcare Statistics

18 | © TransUnion. LLC All Rights Reserved
Derby, Nate. "Univariate Forecasting Methods." Time-Series Forecasting(2000): n. pag. Calgary SAS Users Group.
11 Dec. 2009. Web. 28 May 2015.
http://www.sas.com/content/dam/SAS/en_ca/User%20Group%20Presentations/Calgary-User-Group/Derby-
TimeSeriesForecasting-Nov2009.pdf
SAS Institute Inc. 2013. SAS/ETS® 12.3 User’s Guide. Cary, NC: SAS Institute Inc.
http://support.sas.com/documentation/cdl/en/etsug/66100/PDF/default/etsug.pdf
Weber, Richard. "Time-Series." SpringerReference (2011): n. pag. Time Series. Web. 28 May 2015.
http://www.statslab.cam.ac.uk/~rrw1/timeseries/t.pdf
References