forecasting convective downburst potential using goes sounder derived produ
DESCRIPTION
The objective of this lession is to better understand and utilize techniques for predicting the risk of convective downbursts using GOES sounder derived product data. - PowerPoint PPT PresentationTRANSCRIPT
Forecasting Convective Downburst Potential Using
GOES Sounder Derived Products
Ken Pryor
Center for Satellite Applications and Research (NOAA/NESDIS)
VISIT, Forecasting Convective Downburst Potential Using GOES Sounder Derived Products Ken Pryor (NOAA/NESDIS/STAR)
Objective
• To better understand and utilize techniques for predicting the risk of convective downbursts utilizing GOES sounder derived data.
VISIT, Forecasting Convective Downburst Potential Using GOES Sounder Derived Products Ken Pryor (NOAA/NESDIS/STAR)
Topics of Discussion
• Convective Downbursts
• Description of the GOES Microburst Products
• Case Studies/Microburst Prediction Exercises
• Use of the GOES Microburst Products with other types of meteorological data (i.e. satellite, radar, NWP model)
VISIT, Forecasting Convective Downburst Potential Using GOES Sounder Derived Products Ken Pryor (NOAA/NESDIS/STAR)
Introduction
• The downburst is defined as a strong downdraft produced by a convective storm (i.e., thunderstorm) that induces an outward burst of damaging winds on or near the earth's surface (Fujita and Wakimoto 1983) .
• Due to the intense wind shear they produce, downbursts are a hazard to aircraft in flight,
especially during takeoff and landing phases. VISIT, Forecasting Convective Downburst Potential Using GOES Sounder Derived Products
Ken Pryor (NOAA/NESDIS/STAR)
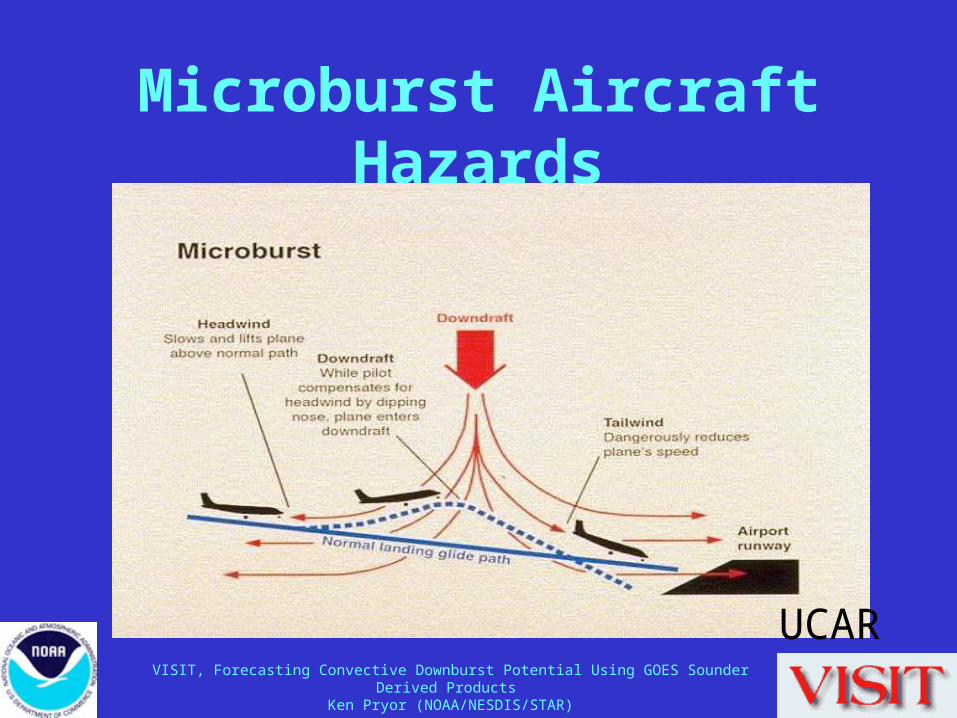
Microburst Aircraft Hazards
UCARVISIT, Forecasting Convective Downburst Potential Using GOES Sounder Derived Products
Ken Pryor (NOAA/NESDIS/STAR)
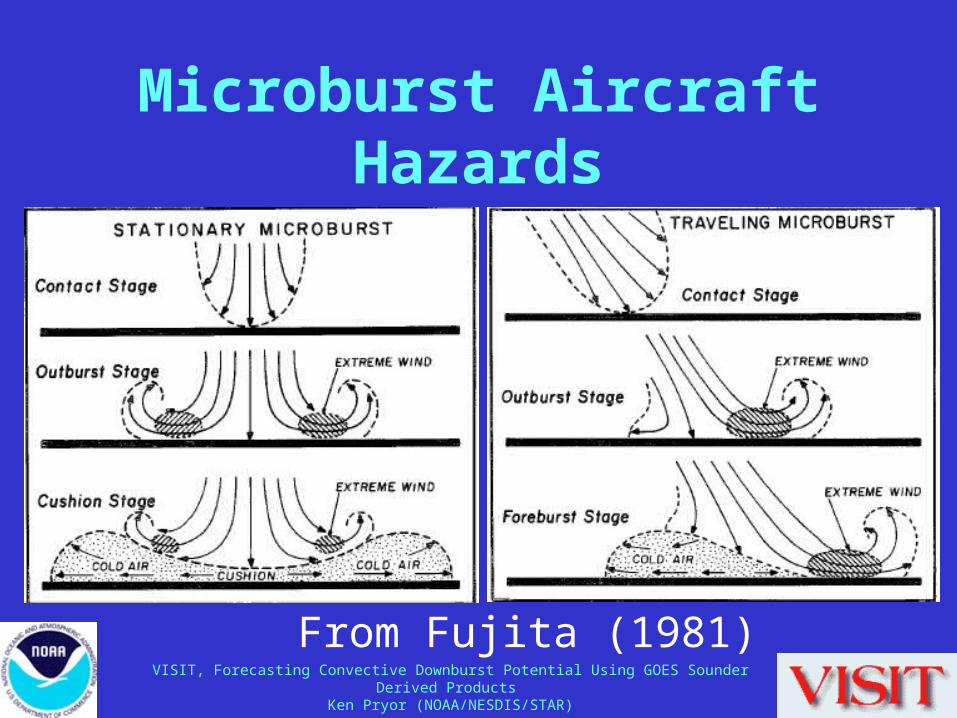
Microburst Aircraft Hazards
From Fujita (1981)VISIT, Forecasting Convective Downburst Potential Using GOES Sounder Derived Products
Ken Pryor (NOAA/NESDIS/STAR)
Historic Downburst-Related Airline Disasters
• Eastern 66, New York (JFK), June 1975
• Continental 426, Denver, August 1975
• Pan American 759, New Orleans, July 1982
• Delta 191, Dallas-Ft. Worth (DFW), August 1985
• USAIR, Charlotte (CLT), July 1994
• American Airlines, Little Rock (LIT), June 1999
• Since 2000, the NTSB has documented ten fatal microburst-related general aviation aircraft accidents, mostly over the southern and western U.S.
VISIT, Forecasting Convective Downburst Potential Using GOES Sounder Derived Products Ken Pryor (NOAA/NESDIS/STAR)
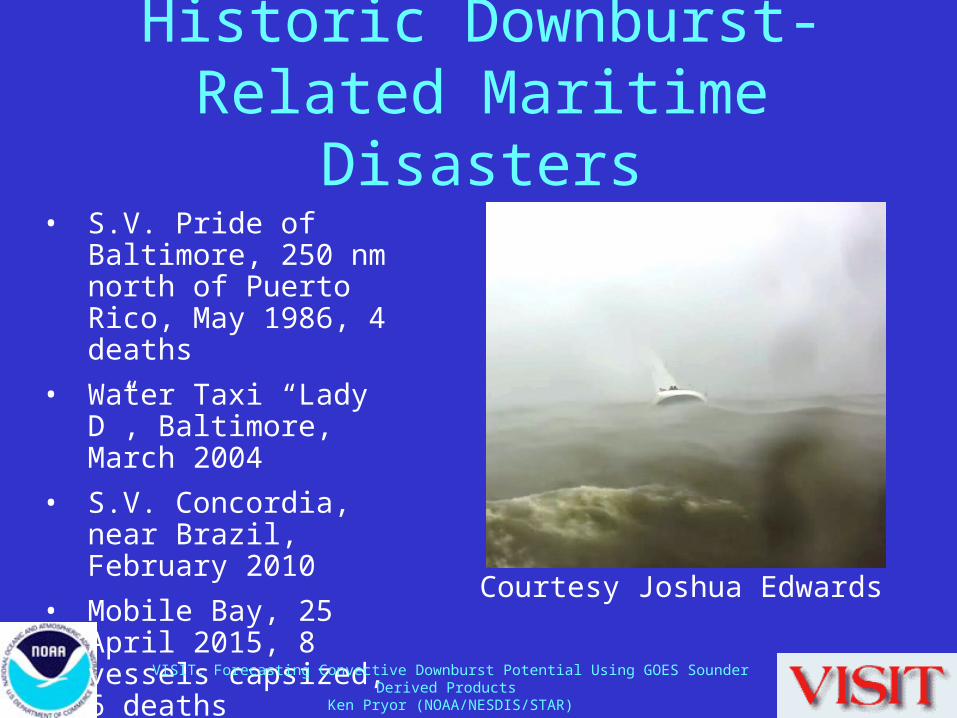
Historic Downburst-Related Maritime Disasters
• S.V. Pride of Baltimore, 250 nm north of Puerto Rico, May 1986, 4 deaths
• Water Taxi “Lady D”, Baltimore, March 2004
• S.V. Concordia, near Brazil, February 2010
• Mobile Bay, 25 April 2015, 8 vessels capsized, 6 deaths
VISIT, Forecasting Convective Downburst Potential Using GOES Sounder Derived Products Ken Pryor (NOAA/NESDIS/STAR)
Courtesy Joshua Edwards
Introduction
• GOES sounder-derived parameters have been shown to be useful in assessing the potential for convective downbursts. Products include:
• Wet Microburst Severity Index (WMSI)
• Dry Microburst Index (DMI)
• Microburst Windspeed Potential Index (MWPI)
• Wind Index (WINDEX) for estimating maximum convective wind gusts
VISIT, Forecasting Convective Downburst Potential Using GOES Sounder Derived Products Ken Pryor (NOAA/NESDIS/STAR)
Downburst Types
• Macroburst: Outflow size > 4 km, duration 5 to 20 minutes (Fujita 1981)
• Microburst: Outflow size < 4 km, duration 2 to 5 minutes (Fujita 1981)
• Microbursts (or clusters of microbursts) can evolve into larger downbursts.
VISIT, Forecasting Convective Downburst Potential Using GOES Sounder Derived Products Ken Pryor (NOAA/NESDIS/STAR)
GOES Microburst Products
• Generated hourly at the NOAA Center for Weather and Climate Prediction (NCWCP).
• Available on the GOES Microburst Products web page at the following URL: http://www.orbit.nesdis.noaa.gov/smcd/
opdb/aviation/mb.html
VISIT, Forecasting Convective Downburst Potential Using GOES Sounder Derived Products Ken Pryor (NOAA/NESDIS/STAR)
GOES Microburst Products
• Microburst program ingests the vertical temperature and moisture profiles derived from GOES sounder radiances, using a subset of single field of view.
• Microburst products are available approximately 50 minutes after sounder scan.
• Based on the thermodynamic structure of the ambient atmosphere.
VISIT, Forecasting Convective Downburst Potential Using GOES Sounder Derived Products Ken Pryor (NOAA/NESDIS/STAR)

GOES Microburst Products Limitations:
• Risk values generated and plotted only in regions of clear skies or partial cloudiness.
• Nighttime low bias for WINDEX, poor correlation for Δθe.
• Assumption that downburst winds are produced by quasi-stationary pulse convective storms: must account for translational motion.
• No explicit accounting for precipitation phase or particle size distribution, and thus, in some cases, will either overestimate or underestimate wind gust potential depending on the concentration and particle size distribution of ice-phase precipitation.
VISIT, Forecasting Convective Downburst Potential Using GOES Sounder Derived Products Ken Pryor (NOAA/NESDIS/STAR)
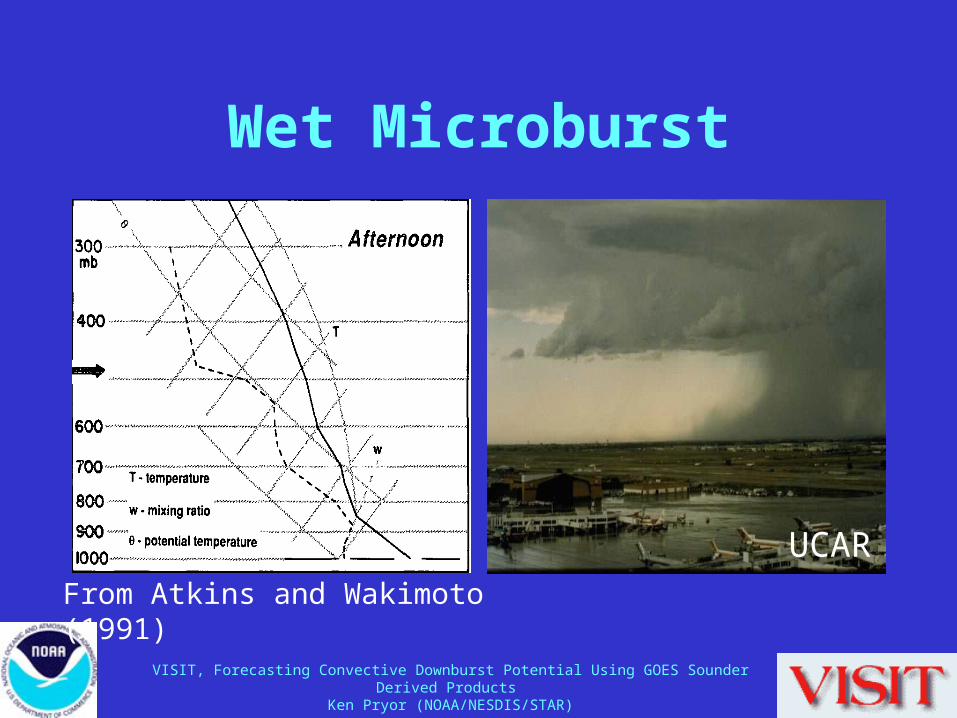
Wet Microburst
From Atkins and Wakimoto (1991)
UCAR
VISIT, Forecasting Convective Downburst Potential Using GOES Sounder Derived Products Ken Pryor (NOAA/NESDIS/STAR)
Wet Microburst Severity Index (WMSI)
• Accounts for convective storm development and downburst generation by incorporating the parameters CAPE to represent the process of updraft formation and Theta-e Deficit (TeD) to represent downburst development.
• Governed by the inviscid vertical momentum equation (Doswell 2001).
VISIT, Forecasting Convective Downburst Potential Using GOES Sounder Derived Products Ken Pryor (NOAA/NESDIS/STAR)
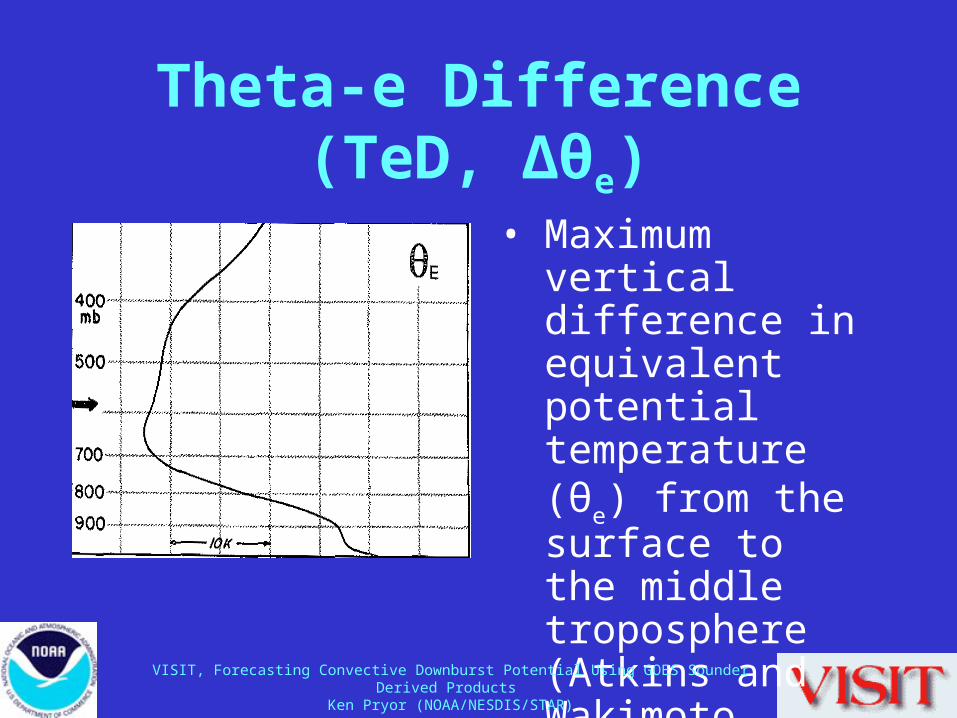
Theta-e Difference (TeD, Δθe)
• Maximum vertical difference in equivalent potential temperature (θe) from the surface to the middle troposphere (Atkins and Wakimoto 1991).
VISIT, Forecasting Convective Downburst Potential Using GOES Sounder Derived Products Ken Pryor (NOAA/NESDIS/STAR)
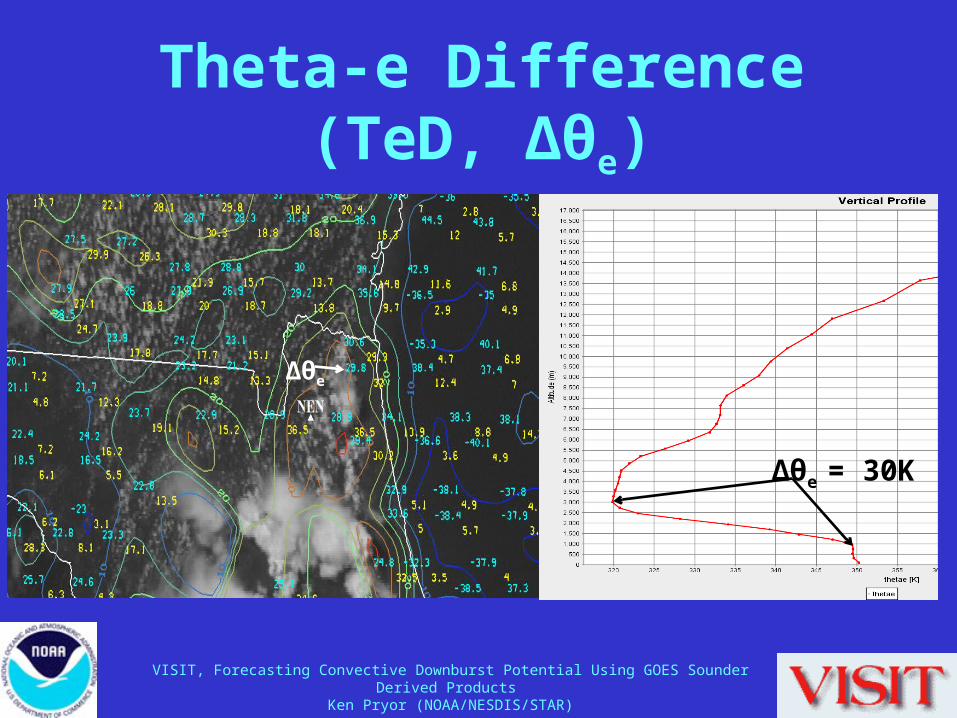
Theta-e Difference (TeD, Δθe)
VISIT, Forecasting Convective Downburst Potential Using GOES Sounder Derived Products Ken Pryor (NOAA/NESDIS/STAR)
Δθe
Δθe = 30K
Theta-e Difference (TeD, Δθe)•Recently, James and Markowski (2010), based on numerical
simulations, found that dry air aloft had a detrimental effect on convective intensity that resulted in a reduction in hydrometeor mass, especially a decrease in hail generation.
•Reduced hail mixing ratio and resulting reduction in hail melting rate was a factor in the offset of the favorable effects of dry air aloft for downdraft development.
•The overall effect of dry air aloft was to reduce downdraft mass flux and cold pool strength in low-to-moderate CAPE environments. Complementary to the results of James and Markowski (2010), a poor correlation between Δθe and downburst magnitude has been found in validation studies over the eastern U.S.
VISIT, Forecasting Convective Downburst Potential Using GOES Sounder Derived Products Ken Pryor (NOAA/NESDIS/STAR)
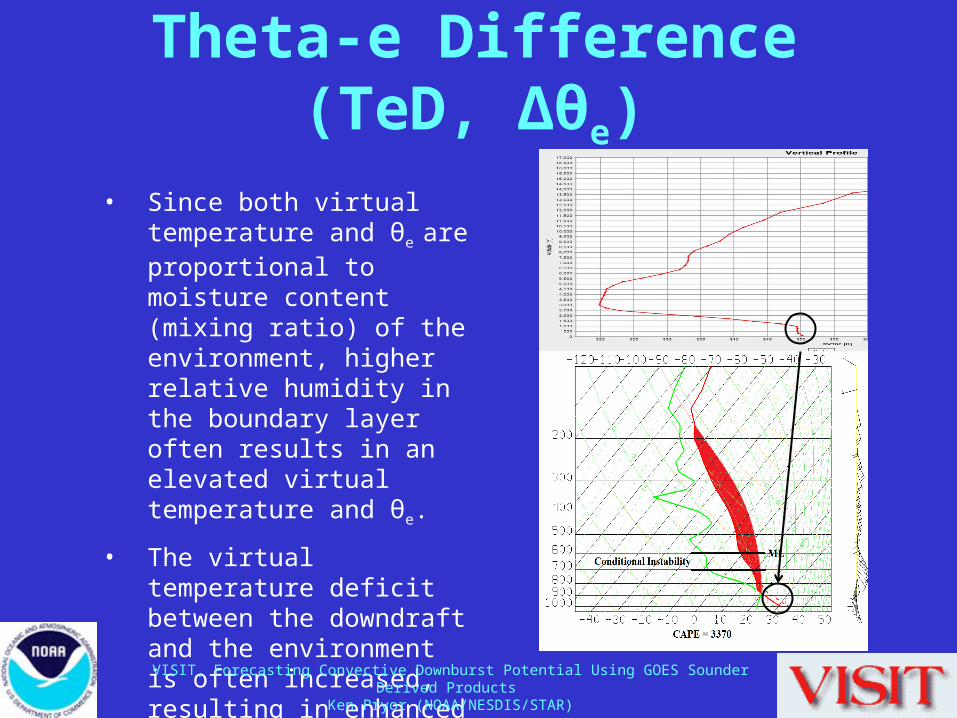
Theta-e Difference (TeD, Δθe)
• Since both virtual temperature and θe are proportional to moisture content (mixing ratio) of the environment, higher relative humidity in the boundary layer often results in an elevated virtual temperature and θe.
• The virtual temperature deficit between the downdraft and the environment is often increased, resulting in enhanced downdraft intensity.
VISIT, Forecasting Convective Downburst Potential Using GOES Sounder Derived Products Ken Pryor (NOAA/NESDIS/STAR)
Wet Microburst Severity Index (WMSI)
WMSI ≡ (CAPE)(TeD)/1000 • Large CAPE (positive buoyancy) results in strong
updrafts that lift the precipitation core within a convective storm to minimum theta-e level.
• TeD indicates the presence of a dry (low theta-e) layer in the middle troposphere that would be favorable for the production of large negative buoyancy due to evaporative cooling.
VISIT, Forecasting Convective Downburst Potential Using GOES Sounder Derived Products Ken Pryor (NOAA/NESDIS/STAR)
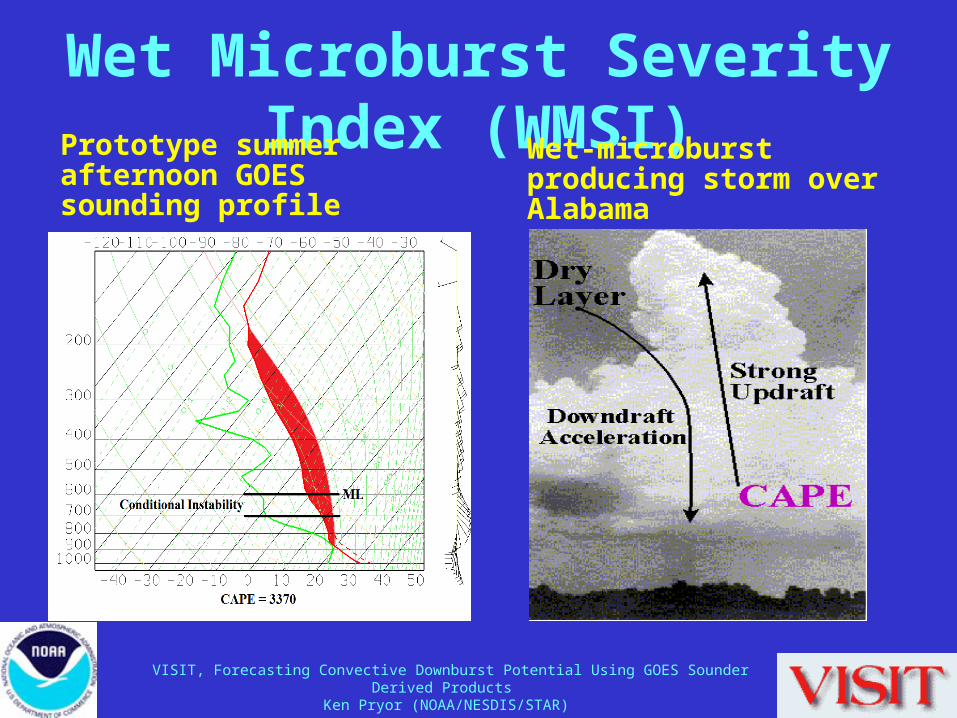
Wet Microburst Severity Index (WMSI)
Prototype summer afternoon GOES sounding profile
Wet-microburst producing storm over Alabama
VISIT, Forecasting Convective Downburst Potential Using GOES Sounder Derived Products Ken Pryor (NOAA/NESDIS/STAR)

Dry Microburst
From Wakimoto (1985)
UCAR
VISIT, Forecasting Convective Downburst Potential Using GOES Sounder Derived Products Ken Pryor (NOAA/NESDIS/STAR)
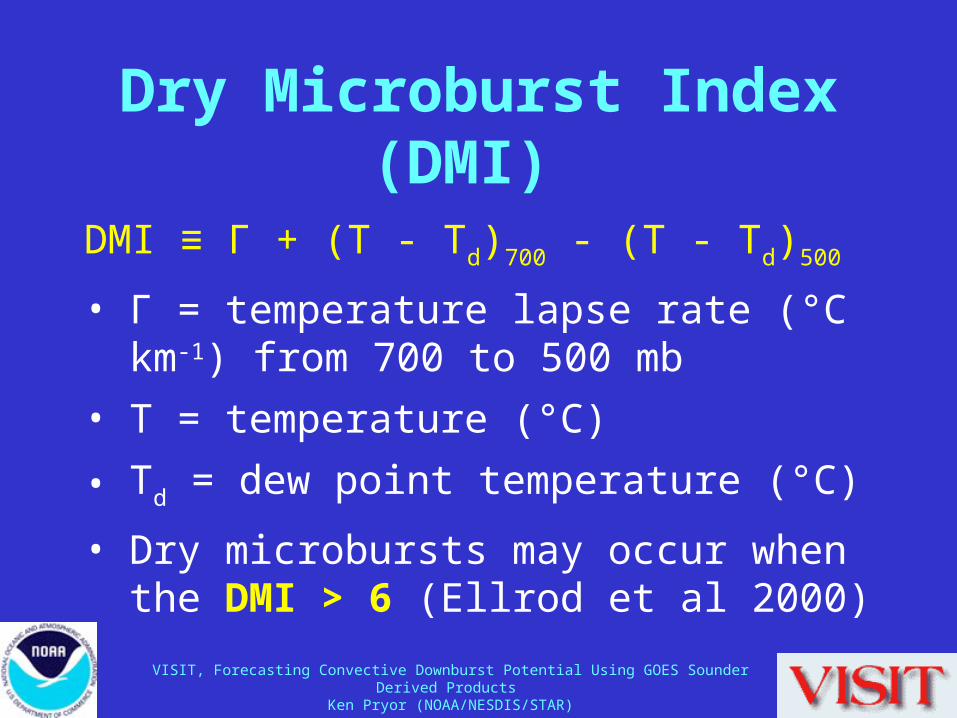
Dry Microburst Index (DMI)
DMI ≡ Γ + (T - Td)700 - (T - Td)500
• Γ = temperature lapse rate (°C km-1) from 700 to 500 mb
• T = temperature (°C)
• Td = dew point temperature (°C)
• Dry microbursts may occur when the DMI > 6 (Ellrod et al 2000)
VISIT, Forecasting Convective Downburst Potential Using GOES Sounder Derived Products Ken Pryor (NOAA/NESDIS/STAR)
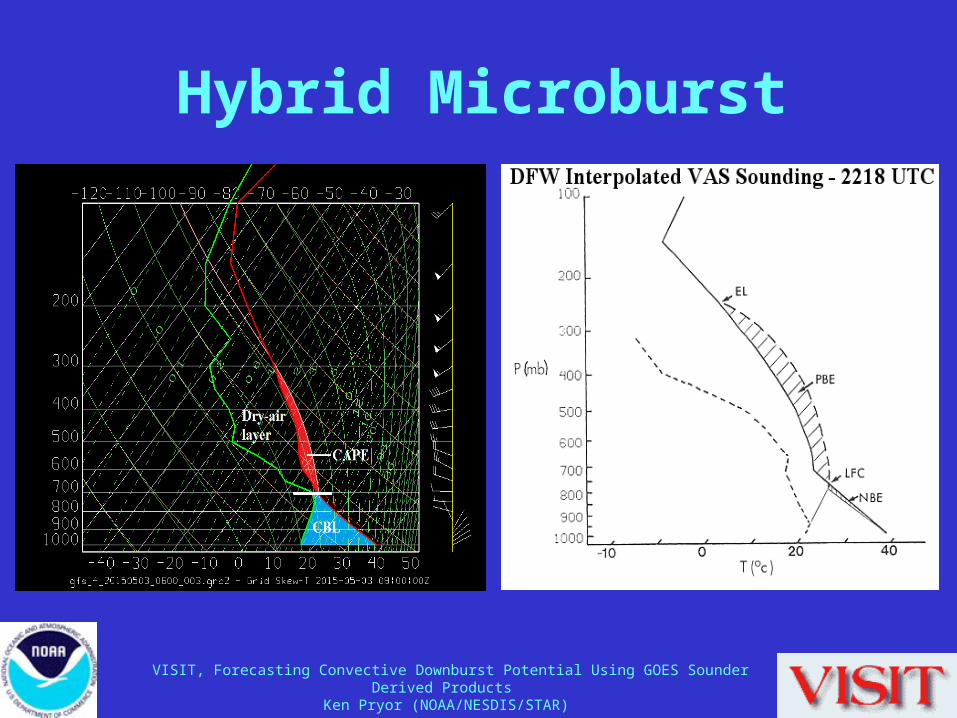
Hybrid Microburst
VISIT, Forecasting Convective Downburst Potential Using GOES Sounder Derived Products Ken Pryor (NOAA/NESDIS/STAR)
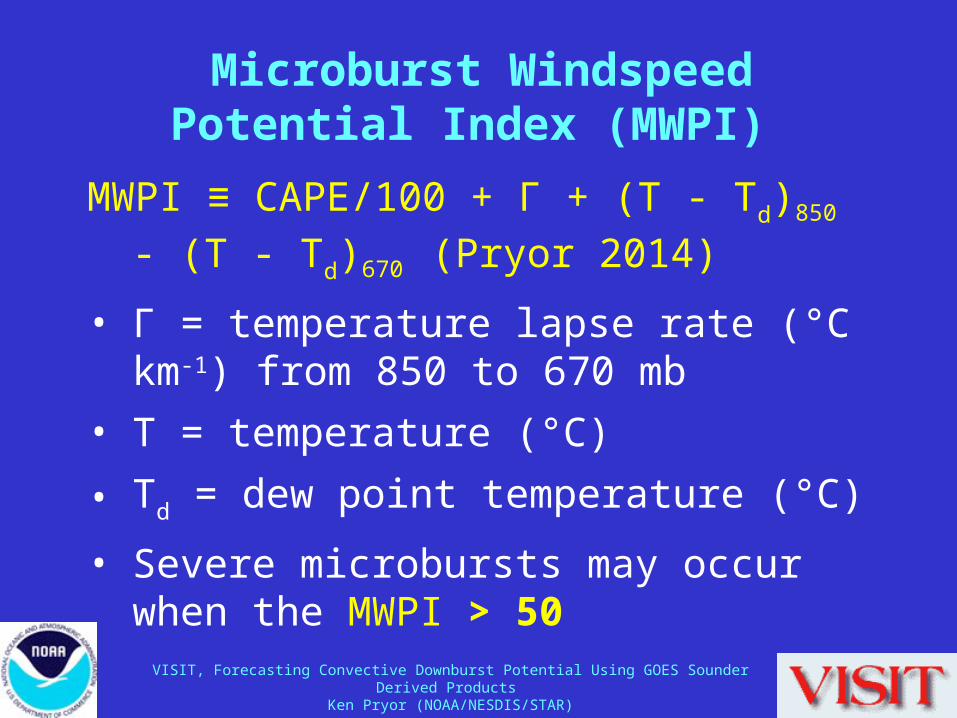
Microburst Windspeed Potential Index (MWPI)
MWPI ≡ CAPE/100 + Γ + (T - Td)850 - (T - Td)670
(Pryor 2014)
• Γ = temperature lapse rate (°C km-1) from 850 to 670 mb
• T = temperature (°C)
• Td = dew point temperature (°C)
• Severe microbursts may occur when the MWPI > 50
VISIT, Forecasting Convective Downburst Potential Using GOES Sounder Derived Products Ken Pryor (NOAA/NESDIS/STAR)
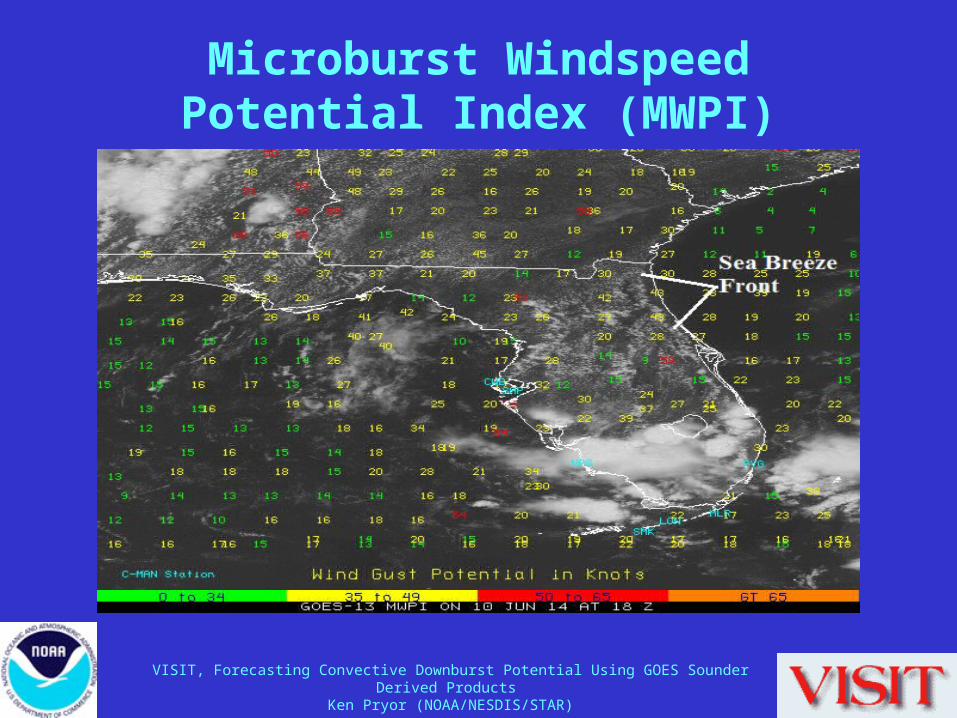
Microburst Windspeed Potential Index (MWPI)
VISIT, Forecasting Convective Downburst Potential Using GOES Sounder Derived Products Ken Pryor (NOAA/NESDIS/STAR)
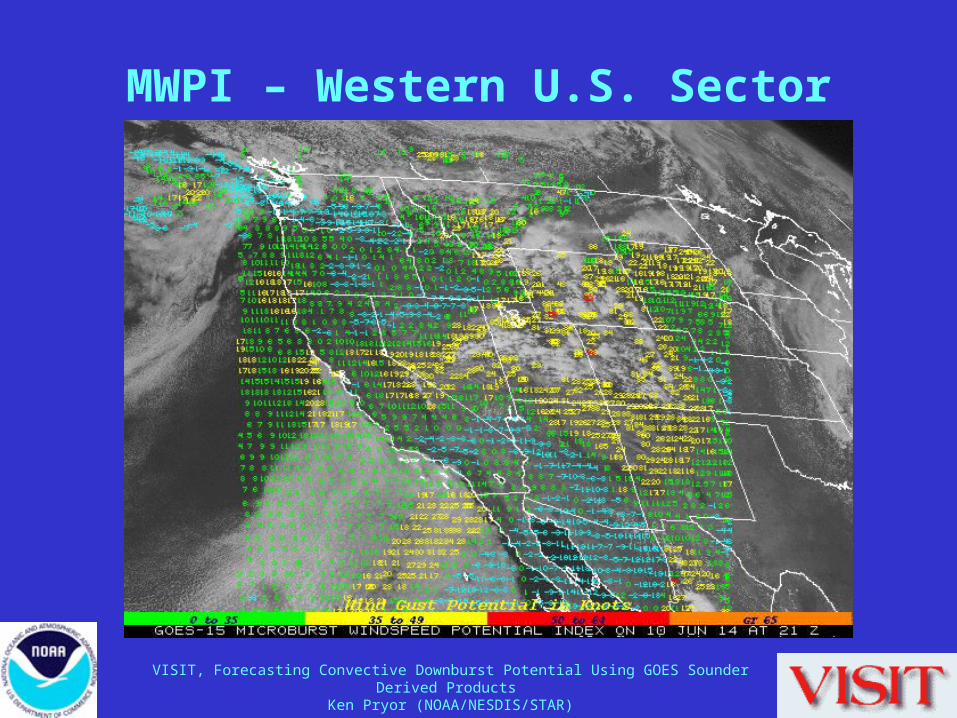
MWPI – Western U.S. Sector
VISIT, Forecasting Convective Downburst Potential Using GOES Sounder Derived Products Ken Pryor (NOAA/NESDIS/STAR)
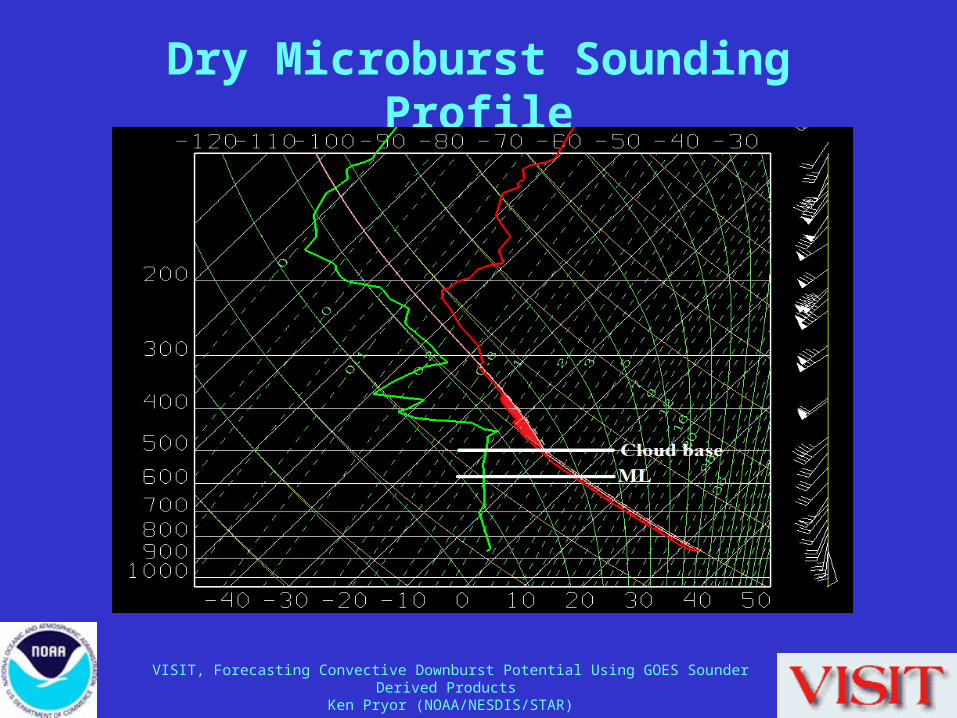
Dry Microburst Sounding Profile
VISIT, Forecasting Convective Downburst Potential Using GOES Sounder Derived Products Ken Pryor (NOAA/NESDIS/STAR)
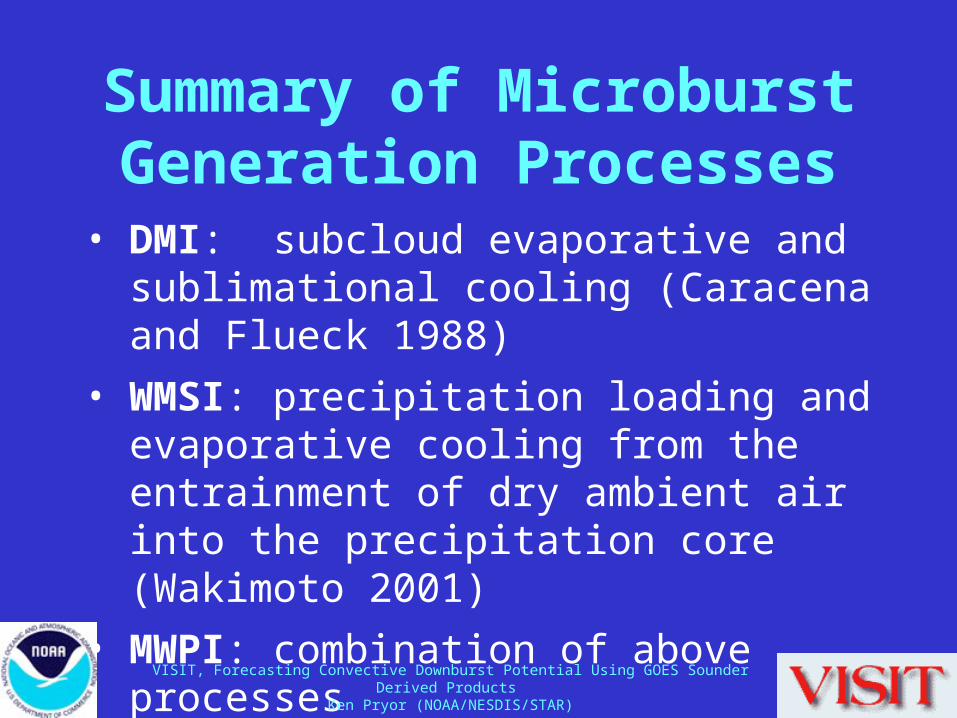
Summary of Microburst Generation Processes
• DMI: subcloud evaporative and sublimational cooling (Caracena and Flueck 1988)
• WMSI: precipitation loading and evaporative cooling from the entrainment of dry ambient air into the precipitation core (Wakimoto 2001)
• MWPI: combination of above processes
VISIT, Forecasting Convective Downburst Potential Using GOES Sounder Derived Products Ken Pryor (NOAA/NESDIS/STAR)
Wind Index (WINDEX)
• Developed by McCann (1994)
• Indicates the maximum possible downburst wind gusts that could occur in stationary convective storms.
• Color-coded numerical values are displayed at sounding retrieval locations on visible or infrared imagery.
VISIT, Forecasting Convective Downburst Potential Using GOES Sounder Derived Products Ken Pryor (NOAA/NESDIS/STAR)
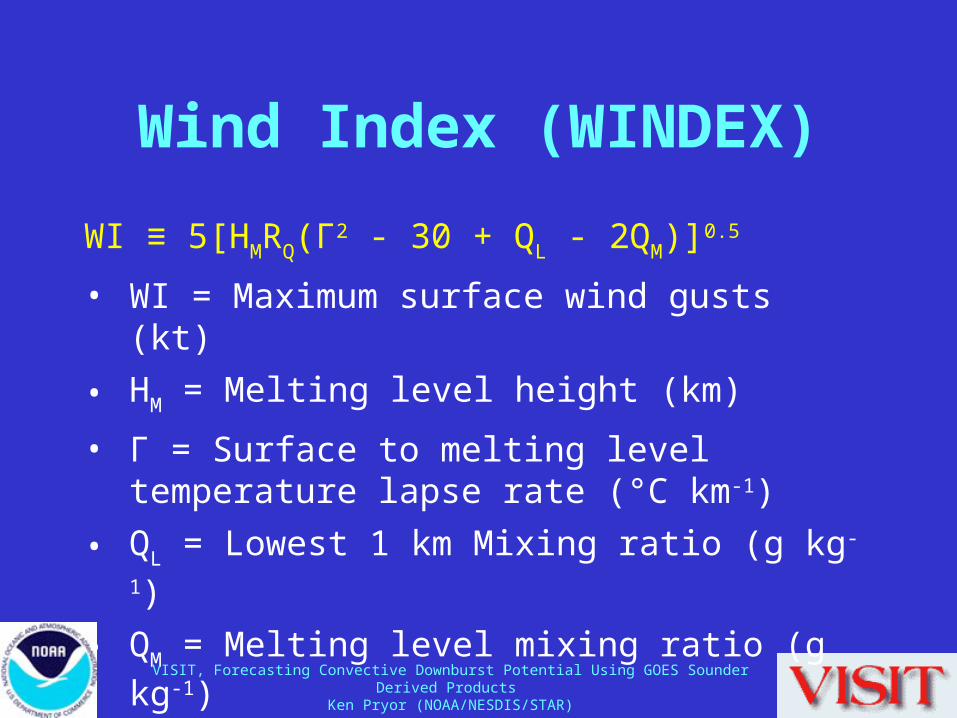
Wind Index (WINDEX)
WI ≡ 5[HMRQ(Γ2 - 30 + QL - 2QM)]0.5
• WI = Maximum surface wind gusts (kt)
• HM = Melting level height (km)
• Γ = Surface to melting level temperature lapse rate (°C km-1)
• QL = Lowest 1 km Mixing ratio (g kg-1)
• QM = Melting level mixing ratio (g kg-1)
• RQ = QL/12VISIT, Forecasting Convective Downburst Potential Using GOES Sounder Derived Products
Ken Pryor (NOAA/NESDIS/STAR)
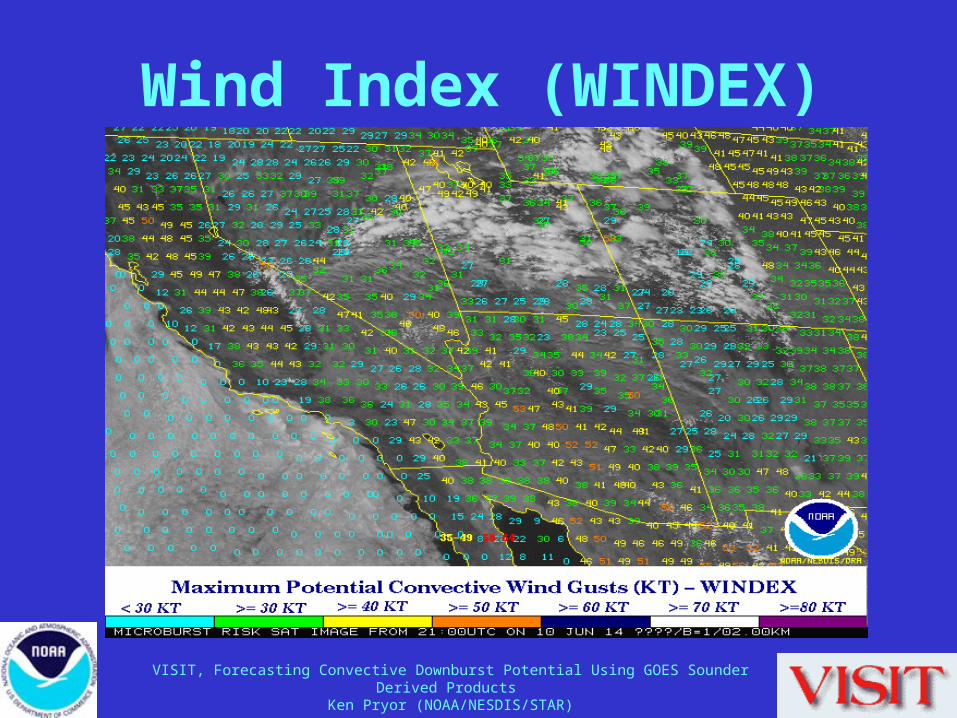
Wind Index (WINDEX)
VISIT, Forecasting Convective Downburst Potential Using GOES Sounder Derived Products Ken Pryor (NOAA/NESDIS/STAR)
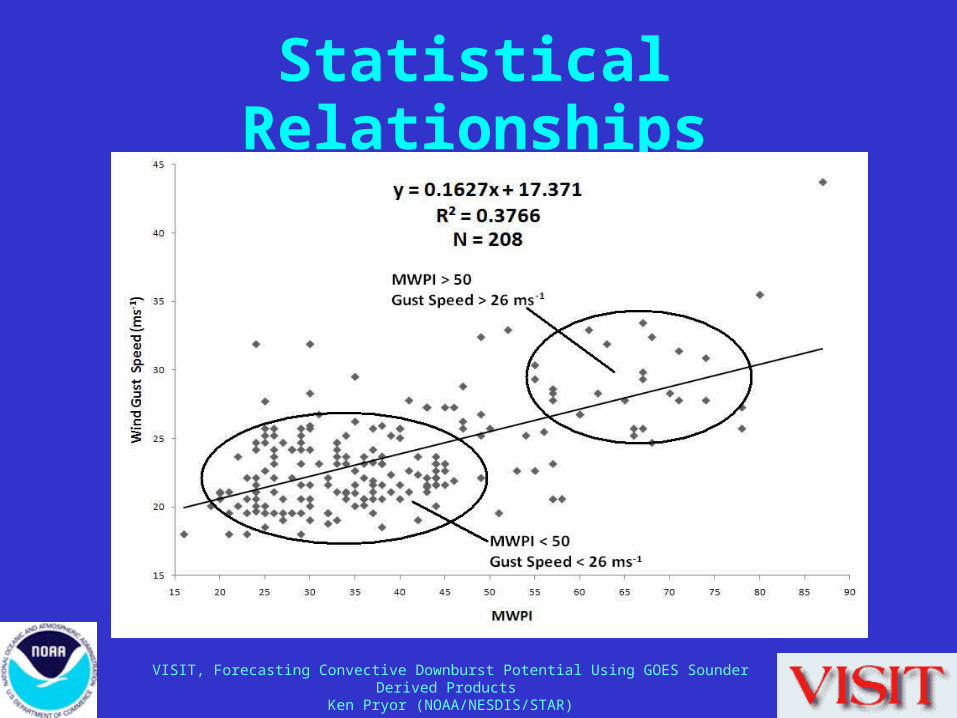
Statistical Relationships
VISIT, Forecasting Convective Downburst Potential Using GOES Sounder Derived Products Ken Pryor (NOAA/NESDIS/STAR)
• Microburst Prediction Exercises
VISIT, Forecasting Convective Downburst Potential Using GOES Sounder Derived Products Ken Pryor (NOAA/NESDIS/STAR)
Research Directions• Application and validation of downburst potential
products over diverse geographic and climate regions (i.e. western Unites States, Florida, India)
• NOAA Technical Report NESDIS 140 :– http://www.star.nesdis.noaa.gov/star/documents/
bios/Pryor_K/nesdistechrpt140.pdf
• SPIE conference paper:– http://proceedings.spiedigitallibrary.org/
proceeding.aspx?/proceeding.aspx?articleid=1935145&articleid=1935145
VISIT, Forecasting Convective Downburst Potential Using GOES Sounder Derived Products Ken Pryor (NOAA/NESDIS/STAR)
ReferencesAtkins, N.T., and R.M. Wakimoto, 1991: Wet microburst activity over the
southeastern United States: Implications for forecasting. Wea. Forecasting, 6, 470-482.
Caracena, F., and J.A. Flueck, 1988: Classifying and forecasting microburst activity in the Denver area. J. Aircraft, 25, 525-530.
Caracena, F., R.L. Holle, and C.A. Doswell, cited 2009: Microbursts-A handbook for visual identification. Available online: http://www.cimms.ou.edu/~doswell/microbursts/Handbook.html.
Doswell, C.A., 2001: Severe convective storms- An overview. Severe Convective Storms, C.A. Doswell, Ed., Amer. Meteor. Soc., 1-26.
Ellrod, G. P., 1989: Environmental conditions associated with the Dallas microburst storm determined from satellite soundings. Wea. Forecasting, 4, 469-484.
VISIT, Forecasting Convective Downburst Potential Using GOES Sounder Derived Products Ken Pryor (NOAA/NESDIS/STAR)
ReferencesEllrod, G.P., J.P. Nelson, M.R. Witiw, L. Bottos, and W.P. Roeder,
2000: Experimental GOES sounder products for the assessment of downburst potential. Wea. Forecasting, 15, 527-542.
Fujita, T.T., and R.M. Wakimoto, 1983: Microbursts in JAWS depicted by Doppler radars, PAM and aerial photographs. Preprints, 21st Conf. on Radar Meteorology, Edmonton, Amer. Meteor. Soc., 638-645.
James, R. P., and P. M. Markowski, 2010: A numerical investigation of the effects of dry air aloft on deep convection. Mon. Wea. Rev., 138, 140–161.
McCann, D.W., 1994: WINDEX-A new index for forecasting microburst potential. Wea. Forecasting, 9, 532-541.
VISIT, Forecasting Convective Downburst Potential Using GOES Sounder Derived Products Ken Pryor (NOAA/NESDIS/STAR)
ReferencesNational Transportation Safety Board, 2006: Capsizing of U.S.
small passenger vessel Lady D, Northwest Harbor, Baltimore, Maryland March 6, 2004. Marine Accident Report. NTSB/MAR-06/01, 114 pp.
Pryor, K. L., 2014: Downburst prediction applications of meteorological geostationary satellites. Proc. SPIE Conf. on Remote Sensing of the Atmosphere, Clouds, and Precipitation V, Beijing, China, doi:10.1117/12.2069283.
Wakimoto, R.M., 1985: Forecasting dry microburst activity over the high plains. Mon. Wea. Rev., 113, 1131-1143.
Wakimoto, R.M., 2001: Convectively Driven High Wind Events. Severe Convective Storms, C.A. Doswell, Ed., Amer. Meteor. Soc., 255-298.
VISIT, Forecasting Convective Downburst Potential Using GOES Sounder Derived Products Ken Pryor (NOAA/NESDIS/STAR)
Questions?
VISIT, Forecasting Convective Downburst Potential Using GOES Sounder Derived Products Ken Pryor (NOAA/NESDIS/STAR)
Thank You!
VISIT, Forecasting Convective Downburst Potential Using GOES Sounder Derived Products Ken Pryor (NOAA/NESDIS/STAR)