forecasting behavior in smart homes based on sleep and ... · we need to design computational...
TRANSCRIPT
1
Forecasting Behavior in Smart Homes Based on Sleep and Wake
Patterns
Jennifer A. Williams and Diane J. Cook
Jennifer A. Williams: [email protected]; Diane J. Cook: [email protected]
School of Electrical Engineering and Computer Science, Washington State University,
Pullman, WA
Abstract
BACKGROUND – The goal of this research is to use smart home technology to assist people
who are recovering from injuries or coping with disabilities to live independently.
OBJECTIVE – We introduce an algorithm to model and forecast wake and sleep behaviors that
are exhibited by the participant. Furthermore, we propose that sleep behavior is impacted by and
can be modeled from wake behavior, and vice versa.
METHODS – This paper describes the Behavior Forecasting (BF) algorithm. BF consists of 1)
defining numeric values that reflect sleep and wake behavior, 2) forecasting wake and sleep
values from past behavior, 3) analyzing the effect of wake behavior on sleep and vice versa, and
4) improving prediction performance by using both wake and sleep scores.
RESULTS – The BF method was evaluated with data collected from 20 smart homes. We found
that regardless of the forecasting method utilized, wake behavior and sleep behavior can be
modeled with a minimum accuracy of 84%. Additionally, normalizing the wake and sleep scores
drastically improves the accuracy to 99%.
2
CONCLUSIONS – The results show that we can effectively model wake and sleep behaviors in
a smart environment. Furthermore, wake behaviors can be predicted from sleep behaviors and
vice versa.
Keywords
Machine learning; smart environments; behavior forecasting; sleep analysis

3
1. Introduction
Smart home technologies offer a unique opportunity to monitor participants in a non-
invasive manner. Recently, smart home technologies have been utilized in health applications.
The ultimate goal of this research is to use smart home technology to enable people recovering
from injuries or coping with disabilities (i.e., people suffering from Post Traumatic Stress
Disorder (PTSD), Autism, Down’s Syndrome) to live independently. A common concern for
caregivers is the ability to be immediately notified and be available should any issues arise, for
instance being available when the person is going to experience a ‘bad’ day. With this in mind,
we are interested in monitoring, analyzing, and ultimately predicting the overall behavior of the
individual in a smart home environment to determine when such ‘bad’ days may arise. To do this,
we need to design computational approaches to forecast aspects of the individual’s day. In this
paper, we accomplish this goal by quantifying daily behavior exhibited by an individual during
wake and sleep periods based on data collected from sensors in a smart home.
Getting a good night’s sleep is important to all but elusive for many. Problems that occur
during sleep are particularly common for individuals who are experiencing stress or are managing
chronic health conditions. The relationship between wake behavior and sleep quality has been
investigated for years. However, only with the maturing of pervasive computing technologies and
machine learning is it possible to quantify sleep quality and quantitatively relate wake behavior to
sleep quality. A smart home offers the capability to monitor sleep and wake behavior in
naturalistic settings. While a large portion of the smart home research to date has focused on
analyzing behavior patterns for health monitoring, much less attention has been given to
anticipating or forecasting upcoming behaviors. In the context of sleep monitoring and assistance,
both behavior monitoring and forecasting are valuable for anticipating and circumventing sleep
difficulties.
4
Sleep is an important component in our everyday lives, and thus should not be considered
just another activity within the smart home. We postulate that behavior during wake periods can
affect sleep behavior and vice versa. We also hypothesize that these behaviors can be predicted
based on prior wake and sleep patterns. To validate these hypotheses, we analyze data from
CASAS smart homes. We evaluate the effectiveness of our forecasting methods with two
evaluation metrics, mean absolute error and root mean squared error, which we then normalize to
analyze performance when predicting the scores.
In this paper we introduce an algorithmic method, Behavioral Forecasting (BF), in which
we forecast wake and sleep behavior using smart home data. Our BF algorithmic method consists
of 1) defining numeric values that reflect sleep behavior and numeric values that reflect wake
behavior, 2) forecasting the numeric wake and sleep values based on past behavior (independent
prediction), 3) analyzing the effect of wake behavior on sleep by using previous wake behavior
when forecasting for the next sleep behavior observed, and vice versa (cross prediction), and 4)
improving the performance of value prediction using both past wake and past sleep values (joint
prediction). We consider this be a univariate forecasting problem, as we are considering how the
individual is behaved previously to predict how they we behave in the future. We provide
evidence for this approach using data collected in actual smart home testbeds.
2. Related Work
As smart home environments are outfitted with various sensors, there is a greater
potential of assistive care for participants with either a cognitive or a physical impairment [1,2].
Assistive healthcare technology that has been researched includes prompting, where the smart
home reminds the participant when an action or activity should take place [3,4]. Another aspect

5
of assistive healthcare is to have physical devices in the smart home to provide residents with
assistance to complete tasks, such as electric wheelchairs, floor lifts, and robotics in the smart
home [5].
There is also a wide range of healthcare monitoring available in a smart home. Physical
healthcare monitoring can include fall detection [6,7], where the researchers need to distinguish
between a normal action (i.e., sitting) and when the participant is falling. Cognitive health
monitoring in a smart home can also be analyzed based on the frequency and quality of activities
completed throughout the day [8–10]. A related area to both physical and cognitive monitoring is
behavioral monitoring. There has been some research regarding behavior predictions [11], in
which the behavior is determined by the usage of the household appliances. In this case,
forecasting has been utilized for predicting appliance usage durations to ultimately predict the
behavior of the participants. Detecting behavior anomalies in a smart home environment has also
been explored [12]; when detecting anomalies, a sequence of the events occurring in each
particular room is analyzed based on the start time and duration of typical sequences. Clusters of
behavior patterns are created for each room and provide the basis for identifying and predicting
anomalies in the home. In both of these cases, research has focused on the older adult population,
often with some form of cognitive impairment.
3. Univariate Quantification of Wake and Sleep Behavior
The goal of this work is to forecast wake and sleep behavior in order to anticipate
potential sleep problems and to understand the relationship between wake and sleep. There are
numerous approaches that can be taken to achieve this goal. We choose to draw from time series
literature in which statistical forecasting techniques are used to predict the value of a single

6
numeric parameter (e.g., daily temperature, stock market values). Time series forecasting
techniques are typically univariate, which means that they forecast values for only a single
variable. In order to utilize these techniques we need to compress all of wake behavior into a
single numeric parameter and all of sleep behavior into a single numeric parameter.
We note that the wake and sleep values themselves may not be easily interpreted in terms
of wake behavior quality or sleep quality. However, if the wake/sleep numbers are reflective of
actual behavior then they can be predicted. In addition to creating predictable numeric values, or
scores, for wake and sleep behavior, we also want a methodology for scoring that is consistent
with the literature on wake and sleep behavior. In this section, we introduce our scoring methods
and motivate them based on previous literature as well as information that can be sensed and
captured from smart home data.
As we are forecasting wake behavior and sleep behavior, we do not analyze the 24-hour
time frame that is commonly accepted as a single day. Instead, we will analyze data in terms of a
single cycle. A cycle consists of one wake period and one sleep period. As we are now
considering a wake/sleep cycle, we develop a separate wake score and sleep score for that cycle.
For the wake score, we utilize smart home sensors and activity recognition to extract activity-
based statistics reflecting an individual’s behavior during their wake period. With the sleep score,
we build upon a common psychology tool for determining sleep quality analysis, Pittsburgh Sleep
Quality Index, and quantify components of this using smart home sensor data. Once these scores
are defined we can use time series techniques to forecast them based on past wake and sleep
behavior.
3.1 Sleep Background

7
In the majority of smart home research, sleep is viewed as just another activity to
recognize and track. However, this is not the most effective use of the sleep data that is being
gathered from smart home environments, since sleep plays a fundamental role in a person’s
overall health and general wellbeing throughout life. In this work, part of our focus is analyzing
and ultimately forecasting sleep behavior, this further enables us to potentially identifying sleep
problems, which often arise in conjunction with problems that occur during an individual’s
waking hours. To understand the relationship between sleep and wake behaviors, we review the
common components that comprise a single night’s sleep and discuss the impact that sleep has on
wake behavior. These discussions lay the groundwork for quantitatively reflecting these
components in our sleep score.
Stages of Sleep. There are two main types of sleep: rapid eye movement (REM) sleep
and non-REM sleep. The non-REM sleep can be further broken down into four stages of sleep;
together, these can often be referred to as the five stages of sleep. When a person sleeps, he or she
cycles through non-REM and REM sleep, spending the majority (approximately 75%) of the time
in non-REM sleep. The sleep cycle begins with non-REM sleep. In stage 1, at the initial onset of
sleep, people will often believe that they have not actually fallen asleep; if the person is currently
in a sleep cycle, then this is the stage in which he or she transitions out of REM sleep. From stage
1, the person then progresses into stage 2 of sleep, in which he or she is no longer aware of the
surroundings and his or her breathing and heart rate become regular. As the person transitions
into stages 3 and 4 of sleep, these are the deepest and the most restorative stages of sleep. In these
stages, blood pressure drops and breathing becomes slower, the person’s muscles relax, the blood
supply to the muscles increases, and hormones are released, promoting tissue growth and repair.
These are also the stages in which energy is restored. After going through the stages of non-REM
sleep, we reverse back through the stages to enter into REM sleep. During REM sleep, a person’s
8
body is immobile and his or her eyes move (as the name of this stage implies). This is also the
stage when the sleeper’s brain is active and when dreaming happens. In this stage, energy is
provided to the brain and the body to ultimately support wake performance [13]. Figure 1
illustrates the stages of sleep that take place throughout the night [14].
Sleep Quantity vs. Sleep Quality. Sleep is very subjective; there is no consistent
definition of “normal” sleep across the population. There are two common areas that are
evaluated with sleep: sleep quantity and sleep quality. Both sleep quantity and quality have major
impacts on mental and physical health. Sleep quantity is the amount of sleep a person gets. Sleep
quantity is subjective to an individual; some people may feel rested after only 5 to 6 hours of
sleep, whereas other may require 9 to 10 hours of sleep. While in general 6 to 8 hours of sleep is
common amount reported by adults, there is no research that supports this is the necessary time
frame. Therefore, the amount of sleep required is whatever is needed for that individual to make
them feel rested.
The other aspect of sleep assessment, which is often considered more influential, is sleep
quality. Sleep quality indicates how well a person sleeps throughout the night. While there are
many ways to determine sleep quality, there is not a single standard for evaluating sleep across
the whole population; furthermore, there is not a single standard for evaluating sleep amongst
academic disciplines. Measures may include total time asleep, sleep latency, total wake time,
sleep efficiency, and sleep disruptions [15]. It is important to note that sleep quality is a more
subjective measure than sleep quality, and as such is more difficult to measure. A widely utilized
approach is the Pittsburgh Sleep Quality Index [16], which is a self-report questionnaire that
measures how the person feels in the morning as well as any sleep disturbances to determine the
overall quality of sleep.

9
Pittsburgh Sleep Quality Index (PSQI). The PSQI contains 19 self-report questions and
5 additional questions that are rated by either a partner sharing the bed or a roommate. The
questions are classified into seven categories that combine to develop the PSQI score. Each
category receives a score between 0 and 3; therefore the combined PSQI score has a maximum
value of 21, with higher values indicating a worse sleep quality. The seven categories measured
are: 1) subjective sleep quality, 2) sleep latency, 3) sleep duration, 4) habitual sleep efficiency, 5)
sleep disturbances, 6) use of sleep medications, and 7) daytime dysfunction. These areas were
derived from three main sources: 1) a clinical institution with experience in sleep disorders, 2)
previous sleep quality questionnaires, and 3) clinical experience during field-testing. Since the
PSQI does not limit the self-report questions to highlight just one category in sleep analysis it has
become a common tool for measuring sleep. The PSQI has also been shown to provide an
acceptable score across multiple participation groups (i.e., insomnia) [17]. Therefore, in this
research, we focus on the PSQI sleep analysis when developing sleep scores from the smart home
data.
Impact of Sleep. Both sleep quantity and quality have major impacts on mental health
and physical health. In the case of physical health, sleep maintains the body’s circadian rhythm.
Circadian rhythms run a large number of biological processes that occur throughout the body
during the day including body temperature, sleep-wake cycles, and hormone release [18,19]. Not
getting the proper amount and quality of sleep can disturb circadian rhythm which will then throw
off biological processes in the body, greatly impacting how a person performs throughout the day.
Furthermore, not only does poor sleep impact circadian rhythm, which in turn influences
biological processes throughout the day, but as we saw with the stages of sleep, poor sleep also
impacts the restorative stages of the sleep cycle, since the person does not spend as much time in
those stages as necessary. It has been shown that poor sleep quality can cause people to be less
10
productive during work [20]. This is in part due to the fact that sleep deficiency can alter brain
activity, which immediately affects how a person will think, react, and behave overall. With sleep
impacting daily behavior and wellbeing, lack of sleep has repercussions on how people behave
throughout the day.
3.2 Defining the Wake/Sleep Cycle
Since sleep can have a dramatic impact on how a person performs throughout the day, we
argue that sleep must be analyzed separately in a smart home, rather than treated as just another
activity when monitoring or predicting health and wellbeing. Thus, instead of creating an overall
daily score, we create a separate wake score and sleep score that will be used in our univariate
forecasting methods to predict the behavior that the house occupant is experiencing.
To define a single sleep score, we switch from the normal view of a single day (24-hour
time frame, often broken into daytime and nighttime) to use the notion of a cycle. We break a
smart home participant’s routine into wake and sleep periods. This is motivated by the
observations that the activities we associate with nighttime, namely sleep, may occur during
daytime hours. In the cycle framework, the current cycle ends with the completion of the end-of-
cycle sleep activity and the next cycle begins with the first wake activity after the end-of-cycle
sleep activity. Since the cycle framework is dependent on the participant’s sleeping pattern to
determine when the cycle has completed, we are no longer constrained to a 24 hour time frame.
End-of-Cycle Sleep Activity. We distinguish between a nap activity and an end-of-cycle
sleep activity by taking into consideration two factors: 1) the time since the cycle began and 2)
the duration of the sleep activity. To consider the time since the cycle began, we need to
determine how long the cycle should be. As previously stated, all organisms have a series of
recurring physiological changes that take place during their day; these are called circadian
11
rhythms. In humans, the circadian rhythm is roughly on a 24-hour time frame; furthermore, a
well-known circadian rhythm is the sleep-wake cycle [21]. Thus, we still consider roughly a 24-
hour time frame. Additionally, studies have shown that adults typically report sleeping between 6
and 8 hours [22–24]. Therefore, we determine that an end-of-cycle sleep activity begins at least
18 hours since their cycle began. The second factor is the duration of the actual sleep activity.
Studies show that people report typically sleeping between 6 and 8 hours. However, a long nap
can last as long as 1 to 2 hours [25]. We split the difference between the maximum nap time (2
hours) and the minimum sleep time (6 hours), to determine that an end-of-cycle sleep activity
duration is there at least 4 hours. Therefore, an end-of-cycle sleep activity occurs at least 18 hours
after the individual’s cycle began and with a sleep activity has lasted at least 4 hours.
Changes Caused by Switching to the Cycle Format. It is worth noting that by
proposing to switch from the standard 24-hour time frame to the cycle format we are mainly
changing the start and end time of the cycle to correspond to the participant’s sleeping patterns. In
the 24-hour time frame, the participant’s cycle starts and ends at midnight. This becomes
problematic when developing a sleep score, as using a set time of day may interrupt a sleep
activity, causing the score inaccurate. However, with the cycle framework, the participant’s cycle
would start with the first activity they complete after waking up from an end-of-cycle sleep
activity, and their cycle would end with the completion of the end-of-cycle sleep activity. Since
the cycle format is based on the participant’s sleeping patterns, we are no longer constrained to a
strictly 24-hour time frame. With that being said, the circadian rhythms that run numerous
biological processes, including the sleep-wake cycle, are roughly on a 24-hour time frame; so we
can still expect to see roughly a 24-hour cycle duration in the cycle format with some minor
variations in cycle duration depending on the participant’s sleeping patterns. Therefore, the only
differences between the 24-hour time frame and the cycle format are the start and end times for
12
the cycle, and the duration of the cycle. Table 1 shows an example of the wake-sleep cycle; the
table illustrates the start date and time, end date and time, and the total duration of the cycle.
3.3 Sleep Score
For our sleep score, we use the PSQI as a reference. It is worth noting that the PSQI asks
the participant about their sleep behavior during the previous month, but here we adapt the scores
to a daily schedule. We also note that scores are generated based on information collected from
the CASAS smart home system [26]. Below, we explain which components of the PSQI were
incorporated into the sleep score.
Component 1: Subjective Sleep Quality. The subjective sleep quality component is
used to understand the participant’s perspective of how they have slept, mainly how restful they
feel upon waking; it does not take into account the actual amount of time the participant has slept.
The CASAS smart home monitors the participants without having any interaction with them, so
the participant’s perception of how they slept is unknown. Therefore, this component was not
included in the sleep score.
Component 2: Sleep Latency. The sleep latency component is used to examine how
long the participant took to fall asleep after they have gone to bed, in other words how long the
participant was in bed before he or she was able to fall asleep. The CASAS smart home is a non-
invasive system that uses only ambient sensors on ceilings and doors; it does not provide enough
information to determine if an individual has actually fallen asleep compared to just lying awake
in bed. Therefore, this component was not included in the sleep score.
Component 3: Sleep Duration. The sleep duration component is used to examine how
long the participant actually slept throughout the night. As we previously stated, from the
information gathered from the CASAS smart home we do not have a way to determine when the

13
participant has actually fallen asleep compared to just staying in bed. However, we use a form of
sleep duration to include this component in the sleep score. We use the total time in an
automatically recognized sleep activity as the duration. For the scoring, the PSQI bins the sleep
duration into four categories (over 7 hours, between 6 and 7 hours, between 5 and 6 hours, and
under 5 hours of sleep) and scores are based off the bin the duration falls into. There can be minor
variations of actual sleep duration (within an hour) while maintaining the same duration score for
this component. The bins for sleep duration and the associated scores for this component are
summarized in Table 2.
Component 4: Habitual Sleep Efficiency. For this habitual sleep efficiency component,
the PSQI considers the ratio of how long the participant slept and the number of hours they
person spent in bed. The number of hours spent in bed is different than the sleep latency
examined in component 2, since the time spent in bed does not just consider the amount of time it
took to fall asleep, but also includes any time the participant wakes up during the night. This
would highlight if a participant wakes often during the night and how long it took the participant
to go back to sleep.
Before we explain how to incorporate a version of habitual sleep efficiency, it is
important to understand how we consider whether two activity instances are part of the same
activity occurrence compared to being two separate occurrences of the same activity. When we
detect an instance of an activity, we first check if the same activity has taken place recently
(within the previous five activities). If the same activity has taken place recently, we determine
that there are two separate occurrences of the activity if there is more than 30 minutes between
the two activities instances. If there is 30 minutes or less between the activity instances, then we
consider the two activity instances to be part of the same activity occurrence. This allows us to
determine any interruptions that take place during activities.
14
To incorporate a version of the habitual sleep efficiency, we must slightly adapt the ratio
to use the information gathered by the CASAS smart home. Therefore to determine the habitual
sleep efficiency we consider the ratio of the amount of time the participant was in the sleep
activity not including any interruptions that took place and the total amount of the participant was
in the sleep activity including any interruption time. The adapted equation for habitual sleep
efficiency is defined as follows:
duration in sleep activity without interruptionstotal duration in sleep activity including interruptations
×100
This is the equation we use to compute part of the sleep score. Again, the PSQI bins the habitual
sleep efficiency into four categories (over 85, between 75 and 85, between 65 and 74, and under
65) and scores are based off the bin the duration falls into. There can be minor variations of actual
habitual sleep efficiency value (within roughly 10 points) while maintaining the same habitual
sleep effiency score for this component. The bins for habitual sleep efficiency and the associated
scores for this component are summarized in Table 2.
Component 5: Sleep Disturbances. The sleep disturbances component is used to
determine any factors that might impact a participant’s sleep. The PSQI evaluates eight factors
that might impact the participants sleep: 1) waking in the middle of the night or early morning, 2)
having to get up to use the bathroom, 3) cannot breathe comfortably, 4) cough or snore loudly, 5)
feel too cold, 6) feel too hot, 7) have bad dreams, and 8) have any pain.
The CASAS smart home is a non-invasive system that uses only ambient sensors on
ceilings and doors; therefore, five of the questions in this section cannot be evaluated.
Specifically, whether the participant is waking in the middle of the night or early morning cannot
be evaluated as the CASAS smart home cannot distinguish whether the participant is asleep or
15
simply in bed. We cannot evaluate whether the participant cannot breathe comfortably, cough or
snore loudly as there is no way to record any sounds in the CASAS smart home. Finally, whether
the participant has bad dreams, or having any pain cannot be evaluated, as there is no way for the
participant to interact with the CASAS smart home.
That leaves three remaining questions that can be evaluated by the information gathered
from the CASAS smart home. We can determine how often the participant has to get up to use
the bathroom during the sleep activity, by the information gathered. However, we expand this to
include any interruptions during sleep activity. To determine the number of interruptions that
occurred during a sleep activity, we measure how often the participants gets out of bed during the
sleep activity for any reason (i.e., getting out of bed to use the bathroom, checking something in
another part of the house). Keeping with the format the PSQI uses, we binned the number of sleep
interruptions into four categories (0 interruptions, 1 interruption, 2 interruptions, and 3 or more
interruptions) and scores are based off the bin the sleep interruption falls into. The bins for sleep
interruptions and the associated scores for this part of the sleep disturbances component are
summarized in Table 2.
The final disturbance category that can potentially be evaluated is whether the participant
is too cold or too hot. We can only potentially monitor temperature disturbances depending upon
where the temperature sensors are located and whether they have any correlation to the statistics
kept for the sleep activity. To determine whether we can include temperature disturbances, we
correlate sensor-based temperature data with the sleep measures of duration, interruptions, and
habitual sleep efficiency. If a strong correlation (r > 0.5) is found between temperature data and
one or more of these measures, then that temperature sensor is included in the sleep disturbance
component, if there are more than one sensor with a strong correlation we choose the temperature

16
sensor with the strongest correlation. If there is not a strong correlation found, temperature
disturbances are not included in this component.
If temperature disturbances are included in this component, we need to determine what
the room temperature range should be during a sleep activity. Similar to how sleep is subjective
to the individual, the room temperature is also dependent on whatever temperature is comfortable
for that particular person. While temperature is based on individual preference, it has been found
that lower temperatures, approximately 65°F [27], are considered ideal for sleeping. While
various ranges have been presented, we focus on the range that is widely accepted and used with
common sleep sensors currently on the market; we consider the room temperature range from
65°F to 72°F [28]. To evaluate temperature disturbances we consider the average, high, and low
temperatures found throughout the sleep activity. To determine the whether the participant is too
cold, we check whether the average, high, or low temperature are below 65°F. Similarly, to
determine where the participant is too hot, we check whether the average, high, or low
temperature is above 72°F. The sleep disturbances component is summarized in Table 2.
Component 6: Use of Sleep Medication. The use of sleep medication component is used
to evaluate whether the participant requires addition help (medications) to get to sleep or stay
asleep. The CASAS smart home can determine when medication is being taken; however, it is not
able to distinguish what the medication is that is being taken. Therefore, we did not include this
component in developing the sleep score.
Component 7: Daytime Dysfunction. The daytime dysfunction component is used to
evaluate whether the participant is have difficulties with daytime performance. In particular this
component evaluates whether the participant has trouble staying awake while they are: 1) driving,
2) eating a meal, or 3) during social activities; it also evaluates whether the participant has trouble
keeping enthusiasm to complete tasks throughout the day. Similar to component 1, the CASAS
17
smart home has no way to interact with participant, to determine the how they are feeling
throughout the day. Additionally, as the CASAS smart home uses ambient sensors in the home, it
has no way of monitoring participants once they leave the home. Therefore, this component was
not included when developing the sleep score.
Combining Components to Develop the Sleep Score. Table 2 summarizes the
equations used in each of the components as well as how each of the components calculated the
sub-scores. The sub-scores from component 3 (sleep duration), component 4 (habitual sleep
efficiency), and component 5 (sleep disturbances) are summed to create a single sleep measure
for a given sleep activity. The individual sleep scores are combined to develop the overall sleep
score for that wake/sleep cycle.
3.4 Wake Score
Unlike sleep scoring, there is no single theory or measure that is commonly used to assess
the quality of wake behavior or to quantify it. In this paper, we are not attempting to quantify the
quality of wake behavior. We are defining a single numeric value that is reflective of the activity-
based sensed behavior for the purpose of studying the correlation between wake behavior (and
changes in wake behavior) and sleep behavior (and changes in sleep behavior). Because our wake
score is built upon information that can be detected by CASAS smart home sensors and labeled
by activity recognition software, our wake score is the combination of the activities seen
throughout the wake period in the cycle. Each activity that is seen in the cycle is scored
individually (i.e., if the Eat activity takes place three times a day, there will be three Eat scores).
Our activities score is built from three activity-centric components: the time since the same
activity last occurred, activity performance statistics, and activity level statistics.
18
Time Since Last Activity. Time since last activity occurred statistic is the amount of
time that elapsed between when the current activity was started and when the same or related
activity was previously performed. A related activity is defined as the activity itself or a subset of
the same activity with a slightly different label, for instance, the Eat activity is related to Eat as
well as to Eat Breakfast, Eat Lunch, and Eat Dinner.
Activity Performance Statistics. We consider two activity performance statistics. The
first activity performance statistic we consider is the time the participant took to perform that
activity; specifically, we evaluate the duration of the activity without including any interruptions.
The second activity performance statistic we consider is the number of interruptions that occurred
during the activity; for this statistic we are evaluating the number of times the activity was
stopped to do a different activity, before completing the activity.
Activity Level Statistics. We consider two activity level statistics for each activity. The
first activity level statistic we consider is the extent to which the occupant is moving around
during the activity. This is not a measure of how much the occupant walked around the room, but
rather a measure of how often the occupant set off the overhead sensors while completing this
activity. The second activity level statistic we consider is the amount of time the participant was
actually working to complete the activity compared to how much time the entire activity took to
complete. We evaluate this statistic by computing the ratio of the time spent in the activity to the
total time it took to complete the activity
Combining Components to Compute the Activity Scores. The activity score
incorporates the three main components: the time since the activity last occurred (TSL); the
activity performance statistics (APS), which are the duration and the number of interruptions; and
the activity level statistics (ALS), which are the amount of movement during activity, and the
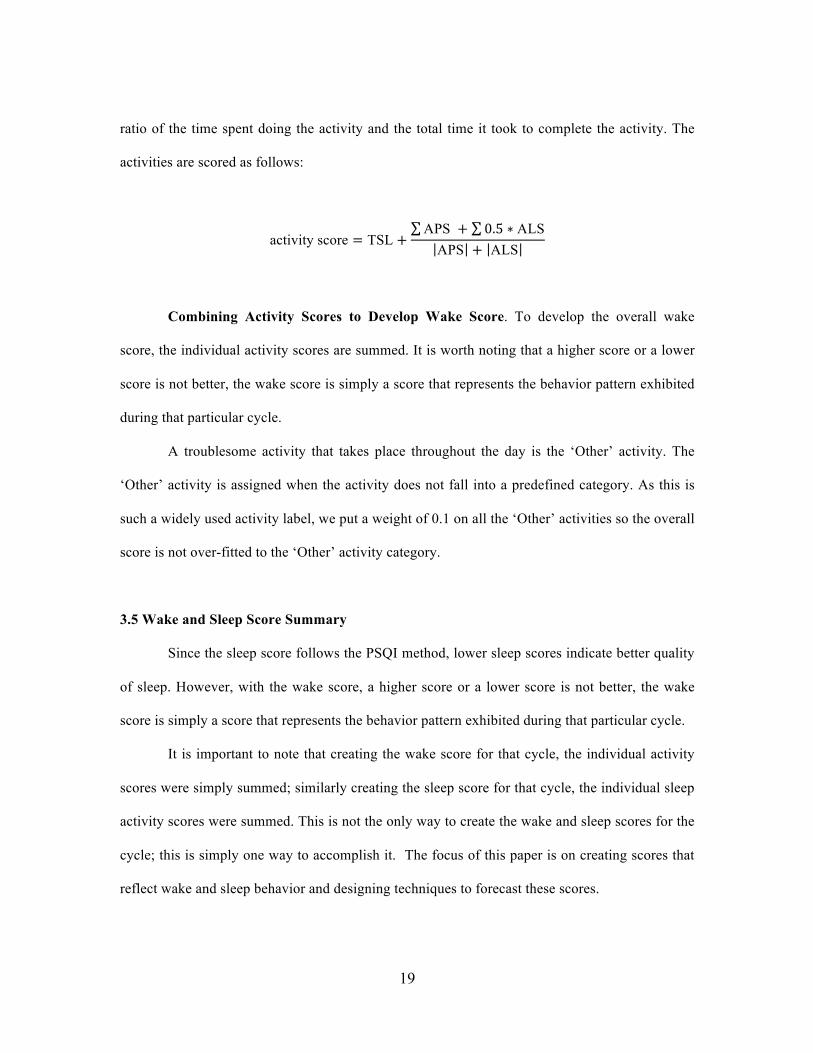
19
ratio of the time spent doing the activity and the total time it took to complete the activity. The
activities are scored as follows:
activity score = TSL +APS + 0.5 ∗ ALSAPS + ALS
Combining Activity Scores to Develop Wake Score. To develop the overall wake
score, the individual activity scores are summed. It is worth noting that a higher score or a lower
score is not better, the wake score is simply a score that represents the behavior pattern exhibited
during that particular cycle.
A troublesome activity that takes place throughout the day is the ‘Other’ activity. The
‘Other’ activity is assigned when the activity does not fall into a predefined category. As this is
such a widely used activity label, we put a weight of 0.1 on all the ‘Other’ activities so the overall
score is not over-fitted to the ‘Other’ activity category.
3.5 Wake and Sleep Score Summary
Since the sleep score follows the PSQI method, lower sleep scores indicate better quality
of sleep. However, with the wake score, a higher score or a lower score is not better, the wake
score is simply a score that represents the behavior pattern exhibited during that particular cycle.
It is important to note that creating the wake score for that cycle, the individual activity
scores were simply summed; similarly creating the sleep score for that cycle, the individual sleep
activity scores were summed. This is not the only way to create the wake and sleep scores for the
cycle; this is simply one way to accomplish it. The focus of this paper is on creating scores that
reflect wake and sleep behavior and designing techniques to forecast these scores.
20
3.6 Normalizing Wake and Sleep Score
Since there are large differences in possible wake score values and possible sleep score
values, normalized scores are analyzed as well. By normalizing the scores, all wake scores and
sleep scores were converted to a value between 0 and 1. A generalized equation for normalizing
a score is:
normalized score =score −min score
max score −min score
Normalizing both the wake and the sleep scores puts the two scores on the same scale. This is
useful for comparing any errors that were found when forecasting the different scores, and will
illustrate which scoring type has more difficulty modeling.
4. Forecasting Methods
The overall hypothesis of this work is that we can predict behavior using novel
independent, cross-component, and joint prediction techniques. Forecasting for both wake
behavior and sleep behavior is a univariate forecasting problem, since we are using past behaviors
to predict future behavior. Therefore, we consider our Behavior Forecasting (BF) approach in
which sensor event data is used to create scores that illustrate the behaviors of the participant
while the participant is awake and asleep; ultimately the scores will be used predict the next
behavior in the sequence. Our BF approach is illustrated in Figure 2.
We use the BF approach to predict the next wake behavior and the next sleep behavior in
the sequence. To do this, features are extracted from the sensor event data. These features are
input to an activity recognizer, in which the sequence of sensor events is classified into activity

21
categories. With activities labeled, statistics for the individual activities (i.e., duration,
interruption count, sensor event count) are computed and the individual activities are scored. The
individual activity is scored with the wake scoring method if the activities take place while the
participant is awake (i.e., Cook, Eat, Work), or with the sleep scoring method otherwise (i.e.,
Nap, Sleep). The wake behavior score for that cycle is the sum of the individual activity scores
for the activities that take place while the participant is awake; the sleep behavior score for that
cycle is the sum of the individual sleep activity scores that take place.
The wake scores and the sleep scores are used for forecasting; each data point
corresponds to one cycle. To model and test the forecasting method we utilized a sliding window
validation approach, in which a window is moved through entire the dataset. A window consists
of 𝑡 training points, which is the training set, and one test data point. Each training point has a
fixed lag length of 𝑖, where 𝑖 is the number of previous cycle scores, as illustrated in Figure 3. As
we move through the dataset, we create a model with the training set and predict the next value
after the training set, or predict the test data point. After the prediction is made, the window is
moved forward one data point. This is repeated until the training window has run through the
entire dataset. The only data points that are not predicted are the data points in the initial training
window.
Since we are considering both wake behaviors and sleep behaviors, we expand the
possible forecasting methods to utilize the behavioral data that we have. Thus, we are interested
in exploring three different types forecasting methods for this research: (1) an independent
forecasting approach, (2) a cross forecasting approach, and (3) a joint forecasting approach. The
forecasting approaches are illustrated in Figure 2. As we are predicting for both wake scores and
sleep scores we perform a total of six different forecasting methods. For the independent
forecasting problem, we are interested in determining whether the scores created are a valid

22
representation of the behaviors exhibited such that we can accurately predict for the next score. In
independent forecasting, previous wake scores are used to predict the next wake score and
previous sleep scores used to predict the next sleep score. For the cross forecasting problem, we
are interested in whether we can get enough information from sleep patterns to predict how the
participant is going to perform during the next wake period, and vice versa. In the cross
forecasting, the previous sleep scores are used to predict the next wake score, and the previous
wake scores are used to predict the next sleep score. For the joint forecasting problem, we are
interested in determining whether adding all the behavioral score information to the model will
increase the accuracies when predicting for the next score. In joint forecasting, both the previous
wake scores and the previous sleep scores are used together to predict the next wake score and/or
the next sleep score.
5. CASAS Smart Home Data
For all the experiments presented in this research, we used data that was collected in
actual smart home systems deployed in communities. The data was collected by the CASAS
smart home system, developed at Washington State University, which was then installed in the
participant’s home. We analyze data collected from 20 single resident CASAS smart home test
beds.
Each of the smart homes used in this research have least one bedroom, a kitchen, a dining
area, a living area, and at least one bathroom. All of the CASAS smart homes have different sizes
and layouts, yet they all include the standard sensor setup; a sample CASAS smart home layout is
illustrated in Figure 4. There are four sensor types that contribute to the CASAS smart home
system: 1) narrow-field motion sensors, these sensors have a limited view of only a few feet and

23
are placed on the ceiling. The motion sensor reports an ON label when motion is detected,
followed by an OFF label when the movement stops. 2) Wide-field motion sensors, these are an
overall area sensor that are usually placed on the walls to determine whether there has been
movement in the room. The wide-field motion sensors can only detect motion in the room, not
where the participant is. 3) Door sensors, these sensors use a magnetic switch to determine
whether the doors are opened or closed. 4) Temperature sensors, these sensors create an event
when the temperature changes.
As the participants are going through their daily routines, when any of the sensors are
triggered a sensor event is created and that event is then recorded into the database. The recorded
sensor events are then run through an activity recognition method (either through an automated
activity recognition software or through human annotation) to label the sequence of sensor events.
A sample sensor data is provided in Table 3.
5.1 Activity Labeling
Sensor events are mapped to activity labels using activity recognition. The activity
recognition algorithm learns a general mapping based on training data labeled with ground truth
activity labels. These ground truth activity labels are provided for one month of data in each
home using human annotation. Human annotators reference the participant’s floor plan with a
sensor layout and interview the participants to determine their daily routines. To ensure
consistency, multiple people are used to annotate activities for the CASAS smart home sites; the
inter-annotator agreement is κ=0.80 for the data used in this research.
The activity recognition utilized by the CASAS smart home system is AR [29,30]. AR
recognizes activities of daily living including cooking, working, and sleeping, from the sensor
24
data collected from the smart homes. Table 4 shows the activity labels distinguished by AR that
were used in this research and which activities are related.
6. Methods
6.1 Machine Learning Algorithms
In our BF algorithm, the goal is to predict the next wake score or sleep score. Because the
scores are continuous values, this can be viewed as a regression problem. We evaluate a wide
range of well known and commonly used machine learning methods to see which method work
best with the data collected from the smart homes. We evaluated methods from four common
types of machine learning methods: 1) linear methods (specifically linear regression and logistic
regression), 2) non-linear methods (support vector machine, with radial basis function kernel), 3)
decision trees (regression tree), and 4) ensemble methods (random forest), for a total of five
tested machine learning algorithms.
6.2 Performance Measures
We validate our approach to wake and sleep score prediction using two evaluation
measures: mean absolute error and the root mean squared error. For all equations used, 𝑦! are the
ground truth values that we are comparing all the predictions against, 𝑦! are the predicted values,
and 𝑁 is the number of instances being evaluated; each instance for evaluation contains the pair
of predicted value and ground truth value, 𝑦! , 𝑦! .
The first evaluation measure that we utilize is the mean absolute error (MAE). MAE
computes the average of the absolute value difference between the predicted value and the
observed value. MAE is defined as:

25
𝑀𝐴𝐸 = ∑ 𝑦! − 𝑦!
𝑁
MAE measures the average scale of errors without considering the direction of the error (negative
or positive error). As only the difference is taken between the predicted value and the ground
truth value, all the examples maintain an equal weight; therefore, MAE simply measures the
accuracy of the prediction. We also explored a normalized MAE (NMAE), using the maximum
score value found in that particular house, defined as:
𝑁𝑀𝐴𝐸 = 𝑀𝐴𝐸
max (𝑦!)
Another common evaluation measure that we utilize is the root mean squared error
(RMSE). RMSE is defined as:
𝑅𝑀𝑆𝐸 =∑ 𝑦! − 𝑦! !
𝑁
Since the difference between the predicted value and the ground truth value is being squared,
RMSE also is indifferent to the direction of the error (whether the error is negative or positive),
and measures the average magnitude of the error providing an emphasis on the higher errors. In
other words, RMSE will uncover and highlight when to find if any large errors occurred. We
explored a normalized RMSE (NRMSE), using the maximum score value found in that particular
house, defined as:

26
𝑁𝑅𝑀𝑆𝐸 =𝑅𝑀𝑆𝐸max (𝑦!)
For both MAE and RMSE (as well as NMAE and NRMSE), the best possible score is
zero, meaning there was no error, in our data. Additionally, there is no upper bound on these
errors. Using the normalized scores, NMAE and NRMSE, shows the percentage of the error;
therefore, the smaller the percentage the better our methods performed.
6.3 Sliding Window Validation
As we are forecasting for wake scores and sleep scores, using a standard cross validation
methods is not feasible. This is due to the fact that the wake and sleep scores have a degree of
dependence on how the occupants behaved the previous cycles. With that in mind, we use an
approach similar to leave-one-out cross validation. We used a sliding window validation method.
In this approach, we choose a fixed training set size and test on a single data point. The training
set starts at the beginning of the dataset and is tested on the next data point after the training set.
The window is then shifted forward one data point in order to preform predictions for the next
point. This is continued until the sliding window has moved through the whole dataset. In this
method, the only data points that are not used for testing are the data points in the initial training
set.
7. Forecasting
7.1 Day Elimination Criteria

27
Before running the forecasting methods, we need to consider any elimination criteria for
the cycles. Because we define a cycle framework there is the potential that the cycles are shorter
than or longer than the standard 24-hours since we are using the participant’s sleeping patterns to
indicate a change of cycle. However, the participant will still have roughly a 24-hour time frame
for wake/sleep cycles because of their circadian rhythms. Therefore, we remove cycles that have
fewer than 20 hours and we removed cycles that have more than 26 hours. Table 5 shows an
example of the cycles duration times before removal and after removal.
7.2 Results
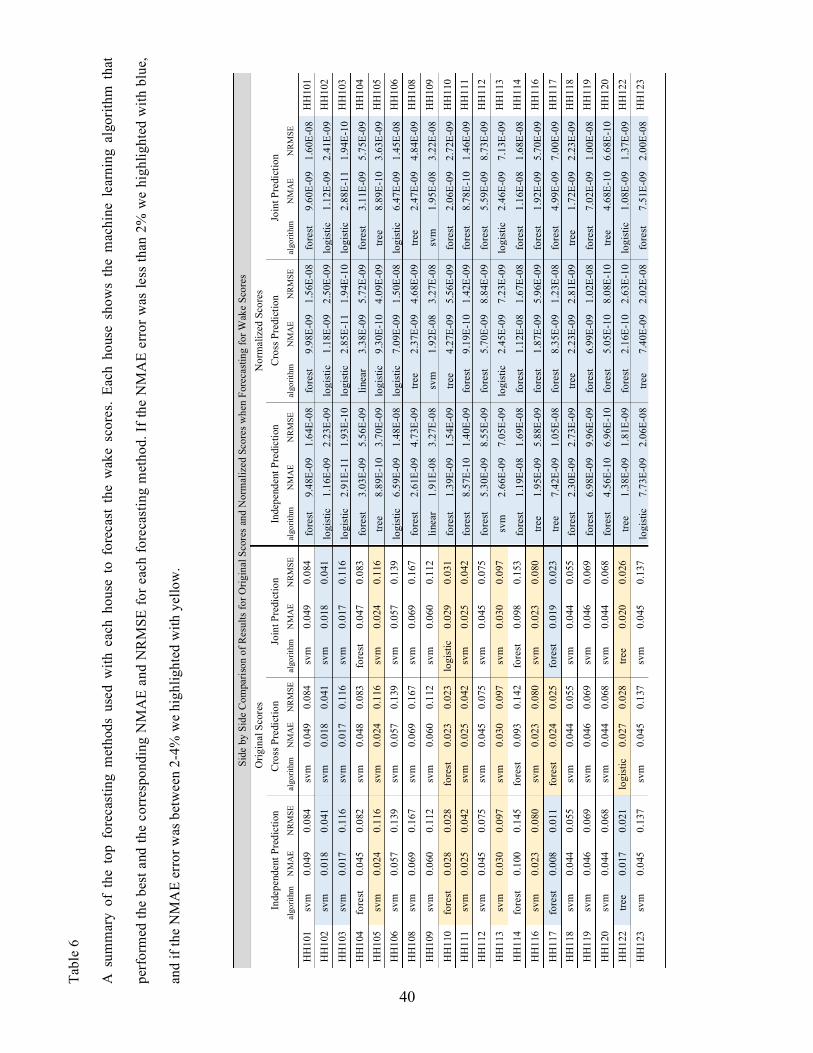
Table 6 shows the results for forecasting original wake scores (left side) and normalized
wake scores (right side) and Table 7 shows the results for forecasting original sleep scores (left
side) and normalized sleep scores (right side). While there were five machine learning algorithms
explored, the results in Tables 6 and 7 show the machine learning algorithm that performed the
best for that particular house.
In all the methods used for forecasting both original wake scores and original sleep
scores, the maximum NMAE error was 14%, representing 86% accuracy. A noticeable result
found was the differences in accuracies when forecasting for wake and sleep scores; forecasting
for wake scores provided higher accuracies.
When forecasting for the original wake scores, with the independent method there was
only one house that yielded more than 10% error; for both the cross method and joint no house
yielded a greater than 10% error. When forecasting for the original sleep scores, with the
independent method there were no houses with a greater than 10% error; however, when using
both the cross method and the joint method there were 8 houses with error greater than 10%.
28
Therefore, when forecasting for both wake and sleep scores, the majority of the results produce
less than 10% error, or a greater than 90% accuracy.
When normalizing the scores, a couple of interesting points arose. First, we found that the
accuracies were drastically improved; again, using the original scores, the top error rate was 14%,
with the error rate typically falling below 10%; after normalizing the error was at most 1%, or
99% accuracy.
The other main difference from using the original scores to normalizing the scores was
the machine learning method that performed the best. With the original scores, for both wake
scores and sleep scores we found that predominantly SVM was out performing the other methods.
However, with the normalized scores, for the wake score we found that mainly the random forest
algorithm performed better. As for the normalized sleep scores, we found that mainly the logistic
algorithm performed the best.
We observe that the independent forecasting method yields better accuracies in general
over the other forecasting methods; this is especially true when forecasting sleep scores. This was
expected since BF used previous behaviors for the same period to predict the next behavior.
The results for the cross forecasting methods showed that the accuracies were only a few
percent different then the accuracies for the independent forecasting method. This is a promising
result, since it shows that wake behavior can be modeled from previous sleep behavior and that
sleep behavior can be modeled from previous wake behavior, with an acceptable accuracy.
In the case of joint forecasting, the accuracies were only a few percent different then the
accuracies for the independent forecasting method; additionally, the results for the joint
forecasting methods were very close (if not the same) to the results for the cross forecasting
methods. This shows that adding all the behavior score information from the cycle does not
improve the accuracies or have much of an effect compared to using just one cycle period.
29
8. Conclusions
Sleep plays an important role in a person’s overall health and wellbeing, thus it is
essential to analyze a person’s sleep patterns in a smart home as part of an overall wellbeing
assessment. Using our BF approach we found that regardless of the forecasting method that is
utilized, we can effectively model wake behavior and sleep behavior within a smart home
environment. We also found that normalizing the wake scores and sleep scores before applying
the forecasting methods drastically improved the accuracies of our methods. As the results for the
joint forecasting methods were only slightly different than the results for the independent
forecasting methods, we found that adding all the behavior score information into the forecasting
models did not provide enough information to make a significant difference in accuracy.
However, the results from cross forecasting methods are promising since it shows that wake
behavior can be modeled from previous sleep behavior and that sleep behavior can be modeled
from previous wake behavior, with an acceptable accuracy. This provides the opportunity to
explore the relationship between wake behavior and sleep behavior, which will be explored as the
research continues.
Before forecasting was performed cycle elimination criteria was applied and, as a result,
there were numerous cycles that were removed from each house. Therefore, we need to
reconsider some of the elimination criteria to ensure that more cycles are included. As stated
previously, the cycle had to span between 20 hours and 26 hours for the cycle duration to be
evaluated, otherwise the cycle was removed. These situations could occur, for instance, when the
sensors stop working, the house occupants do not complete the cycle in the house, or the house
occupant simply wakes up earlier than usual or goes to sleep later than usual. In the case of

30
malfunctioning sensors, we will continue to simply remove the cycles because they are not
representative of how the occupants are behaving. However, when the occupant is not completing
the cycle in the house, the main way to rectify this is to not require a complete wake/sleep cycle.
For instance, if the occupant has left the house, it would be useful to consider a potential end-of-
cycle leave activity. This is an option that will be explored as the research continues.
In this work we used single resident CASAS smart home test beds. It would be
interesting to expand this work to include multiple resident smart home test beds. To evaluate
wake/sleep scores for multiple residents, we first have to apply activity recognition to incorporate
multiple residents when the CASAS smart home only uses ambient sensors. To determine which
resident the activity is associated with, there are several approaches that can be utilized. One
approach involves creating a library of actions for each of the residents, then learning a model of
how the individual resident’s perform that activity [31]. Once the model has been learned, we can
evaluate not only wake/sleep scores for individual residents, but evaluate any correlations
between wake/sleep scores between the residents.
In the BF approach, individual wake activity scores were summed to create the wake
score for the cycle; similarly, the individual sleep activity scores were summed to make the sleep
score. Validation of this and other possible scoring methods is a direction for continued research.
Acknowledgements
This work was supported in part by National Science Foundation grant 0900781. The
authors would like to thank Maureen Schmitter-Edgecombe, Aaron Crandall, and Brian Thomas
for their help in collecting smart home data.
31
References
1. Acampora G, Cook DJ, Rashidi P, Vasilakos AV. A survey on ambient intelligence in
healthcare. Proceedings of the IEEE. 2013 Dec;101(12):2470-94.
2. Morris ME, Adair B, Miller K, Ozanne E, Hansen R, Pearce AJ, Santamaria N, Viega L,
Long M, Said CM. Smart-home technologies to assist older people to live well at home.
Journal of aging science. 2013 Jan 1;1(1):1-9.
3. Das B, Chen C, Dasgupta N, Cook DJ, Seelye AM. Automated prompting in a smart home
environment. InData Mining Workshops (ICDMW), 2010 IEEE International Conference
on 2010 Dec 13 (pp. 1045-1052). IEEE.
4. Chen C, Das B, Cook DJ. A data mining framework for activity recognition in smart
environments. InIntelligent Environments (IE), 2010 Sixth International Conference on
2010 Jul 19 (pp. 80-83). IEEE.
5. Chan M, Campo E, Estève D, Fourniols JY. Smart homes—current features and future
perspectives. Maturitas. 2009 Oct 20;64(2):90-7.
6. Tabar AM, Keshavarz A, Aghajan H. Smart home care network using sensor fusion and
distributed vision-based reasoning. InProceedings of the 4th ACM international workshop
on Video surveillance and sensor networks 2006 Oct 27 (pp. 145-154). ACM.
7. Yu M, Rhuma A, Naqvi SM, Wang L, Chambers J. A posture recognition-based fall
detection system for monitoring an elderly person in a smart home environment.
Information Technology in Biomedicine, IEEE Transactions on. 2012 Nov;16(6):1274-86.
8. Dawadi P, Cook DJ, Schmitter-Edgecombe M. Smart home-based longitudinal functional
assessment. InProceedings of the 2014 ACM International Joint Conference on Pervasive
32
and Ubiquitous Computing: Adjunct Publication 2014 Sep 13 (pp. 1217-1224). ACM.
9. Dawadi PN, Cook DJ, Schmitter-Edgecombe M. Modeling patterns of activities using
activity curves. Pervasive and Mobile Computing. 2016 Jun 30;28:51-68.
10. Dawadi P, Cook D, Schmitter-Edgecombe M. Automated Cognitive Health Assessment
from Smart Home-Based Behavior Data. IEEE journal of biomedical and health
informatics. 2015 Aug.
11. Suryadevara NK, Mukhopadhyay SC, Wang R, Rayudu RK. Forecasting the behavior of
an elderly using wireless sensors data in a smart home. Engineering Applications of
Artificial Intelligence. 2013 Nov 30;26(10):2641-52.
12. Lotfi A, Langensiepen C, Mahmoud SM, Akhlaghinia MJ. Smart homes for the elderly
dementia sufferers: identification and prediction of abnormal behaviour. Journal of
ambient intelligence and humanized computing. 2012 Sep 1;3(3):205-18.
13. Walcutt DL. Stages of Sleep [Internet]. 2009 [cited 2015 Nov 27]. Available from:
http://psychcentral.com/lib/stages-of-sleep/
14. Lovell K, Liszewski C. Summary: Normal Sleep Patterns and Sleep Disorders [lecture
notes] [Internet]. Michigan State University [cited 2016 Mar 28]. Available from:
http://learn.chm.msu.edu/NeuroEd/neurobiology_disease/content/otheresources/sleepdisor
ders.pdf
15. Krystal AD, Edinger JD. Measuring sleep quality. Sleep medicine. 2008 Sep 30;9:S10-7.
16. Buysse DJ, Reynolds CF, Monk TH, Berman SR, Kupfer DJ. The Pittsburgh Sleep
Quality Index: a new instrument for psychiatric practice and research. Psychiatry research.
1989 May 31;28(2):193-213.
17. Backhaus J, Junghanns K, Broocks A, Riemann D, Hohagen F. Test–retest reliability and
validity of the Pittsburgh Sleep Quality Index in primary insomnia. Journal of
33
psychosomatic research. 2002 Sep 30;53(3):737-40.
18. Maury E, Ramsey KM, Bass J. Circadian rhythms and metabolic syndrome from
experimental genetics to human disease. Circulation research. 2010 Feb 19;106(3):447-62.
19. Dagan Y. Circadian rhythm sleep disorders (CRSD). Sleep medicine reviews. 2002 Feb
28;6(1):45-54.
20. Swanson LM, Arnedt J, Rosekind MR, Belenky G, Balkin TJ, Drake C. Sleep disorders
and work performance: findings from the 2008 National Sleep Foundation Sleep in
America poll. Journal of sleep research. 2011 Sep 1;20(3):487-94.
21. Germain A, Kupfer DJ. Circadian rhythm disturbances in depression. Human
Psychopharmacology: Clinical and Experimental. 2008 Oct 1;23(7):571-85.
22. Vgontzas AN, Liao D, Pejovic S, Calhoun S, Karataraki M, Bixler EO. Insomnia with
objective short sleep duration is associated with type 2 diabetes A population-based study.
Diabetes care. 2009 Nov 1;32(11):1980-5.
23. Vgontzas AN, Liao D, Bixler EO, Chrousos GP, Vela-Bueno A. Insomnia with objective
short sleep duration is associated with a high risk for hypertension. Sleep. 2009 Apr
1;32(4):491-7.
24. Gottlieb DJ, Redline S, Nieto FJ, Baldwin CM, Newman AB, Resnick HE, Punjabi NM.
Association of usual sleep duration with hypertension: the Sleep Heart Health Study.
SLEEP-NEW YORK THEN WESTCHESTER-. 2006 Aug 1;29(8):1009.
25. Bursztyn M, Mekler J, Wachtel N, Ben-Ishay D. Siesta and ambulatory blood pressure
monitoring Comparability of the afternoon nap and night sleep. American journal of
hypertension. 1994 Mar 1;7(3):217-21.
26. Cook DJ, Crandall AS, Thomas BL, Krishnan NC. CASAS: A smart home in a box.
Computer. 2013 Jul;46(7).

34
27. National Sleep Foundation: Touch - Comfort and Sleep [Internet]. [cited 2016 Mar 19].
Available from: https://sleepfoundation.org/bedroom/touch.php
28. Withings Aura [Internet]. [cited 2015 Nov 15]. Available from:
http://www.withings.com/us/en/products/aura
29. Cook DJ, Krishnan NC, Rashidi P. Activity discovery and activity recognition: A new
partnership. Cybernetics, IEEE Transactions on. 2013 Jun;43(3):820-8.
30. Krishnan NC, Cook DJ. Activity recognition on streaming sensor data. Pervasive and
mobile computing. 2014 Feb 28;10:138-54.
31. Crandall AS, Cook D. Attributing events to individuals in multi-inhabitant environments.
InIntelligent Environments, 2008 IET 4th International Conference on 2008 Jul 21 (pp. 1-
8). IET.

35
Table 1
An example cycle computation based on the start date and time of a wake event and the end date
and time of the corresponding sleep event.
Cycle Details
Start Date Start Time End Date End Time Cycle Duration
6/15/11 9:58:39 6/16/11 7:00:45 21.04
6/16/11 8:02:41 6/17/11 10:02:02 25.99
6/17/11 10:05:02 6/18/11 11:16:53 25.2
6/18/11 12:24:13 6/19/11 7:36:14 19.2
6/19/11 9:01:04 6/20/11 10:18:07 25.28
6/20/11 10:52:23 6/21/11 9:32:09 22.66
6/21/11 10:25:55 6/22/11 10:38:31 24.21

36
Tabl
e 2
Form
ulas
use
d in
cal
cula
ting
the
slee
p sc
ore.
Com
pone
nt 3
Com
pone
nt 4
Com
pone
nt 5
– S
leep
Dis
turb
ance
s
Slee
p D
urat
ion
H
abitu
al S
leep
Eff
icie
ncy
In
terr
uptio
ns
Feel
too
cold
Fe
el to
o ho
t
Res
pons
e Sc
ore
Res
pons
e Sc
ore
Res
pons
e Sc
ore
duration in sleep
total duration
×100
0
inte
rrup
tions
0
65>avg
+1
72<avg
+1
1 in
terr
uptio
ns
1 65
>high
+1
72
<high
+1
2 in
terr
uptio
ns
2 65
>low
+1
72
<low
+1
≥ 3
inte
rrup
tions
3
Com
pone
nt 3
Sl
eep
Dur
atio
n
Com
pone
nt 4
H
abitu
al S
leep
Eff
icie
ncy
C
ompo
nent
5
Slee
p D
istu
rban
ces
(with
out T
emp)
Com
pone
nt 5
Sl
eep
Dis
turb
ance
s (w
ith T
emp)
Res
pons
e Sc
ore
R
espo
nse
Scor
e
Res
pons
e Sc
ore
R
espo
nse
Scor
e
> 7
hour
s 0
>
85%
0
sub-scores= 0
0
sub-scores= 0
0
6 –
7 ho
urs
1
75%
– 8
4%
1
sub-scores= 1
1
1≤sub-scores≤3
1
5 –
6 ho
urs
2
65%
– 7
4%
2
sub-scores= 2
2
4≤sub-scores≤6
2
< 5
hour
s 3
<
65%
3
sub-scores= 3
3
7≤sub-scores≤9
3

37
Table 3
Sample labeled sensor events from the CASAS smart home system. Each event contains the date
and time the event was created, the location of the sensor and which sensor generated the event,
and the message that was sent. Activity labels are generated using activity recognition and are
applied to the sensor event.
Date Time Sensor Location Sensor Message Activity
2011-06-15 09:48:31.206608 Bedroom Bedroom OFF Sleep
2011-06-15 09:48:31.388937 Bedroom Bed OFF Sleep
2011-06-15 09:48:33.632211 Bedroom Bedroom ON Dress
2011-06-15 09:48:35.695011 Bedroom Bedroom OFF Dress
2011-06-15 09:48:38.832319 Bedroom Bedroom ON Other_Activity

38
Table 4
All possible activity labels and categories of related activities.
Related Activity Activity Related Activity
Bathe Exercise Toilet
Bed_Toilet_Transition Groceries
Wash
Wash_Dishes
Cook
Cook Groom Wash_Breakfast_Dishes
Cook_Breakfast Housekeeping Wash_Lunch_Dishes
Cook_Lunch Laundry Wash_Dinner_Dishes
Cook_Dinner Leave_Home / Enter_Home Watch_TV
Dress Other_Activity
Work
Work
Eat
Drink Personal_Hygiene Work_At_Desk
Eat Phone Work_At_Table
Eat_Breakfast Read Work_On_Computer
Each_Lunch Relax
Sleep
Nap
Eat_Dinner Step_Out Sleep_Out_Of_Bed
Entertain_Guests Take_Medicine Sleep

39
Table 5
Sample cycles from a smart home testbed. The left side of the table shows all the cycles (before
any remove has taken place). The grey text on the right side of the table shows the cycles that
have been removed, and the black text indicates cycles that remain.
Days Before Removal Days After Removal
Start Date Start Time End Date End Time Duration Start Date Start Time End Date End Time Duration
6/29/11 10:21:21 6/30/11 8:14:24 21.88 6/29/11 10:21:21 6/30/11 8:14:24 21.88
6/30/11 8:56:44 7/1/11 8:31:18 23.58 6/30/11 8:56:44 7/1/11 8:31:18 23.58
7/1/11 9:32:08 7/2/11 9:18:04 23.77 7/1/11 9:32:08 7/2/11 9:18:04 23.77
7/2/11 10:41:42 7/3/11 9:38:56 22.95 7/2/11 10:41:42 7/3/11 9:38:56 22.95
7/3/11 10:57:27 7/4/11 6:44:55 19.79 7/3/11 10:57:27 7/4/11 6:44:55 19.79
7/4/11 7:40:59 7/5/11 8:10:48 24.5 7/4/11 7:40:59 7/5/11 8:10:48 24.5
7/5/11 8:34:41 7/6/11 8:57:02 24.37 7/5/11 8:34:41 7/6/11 8:57:02 24.37
7/12/11 15:57:44 7/13/11 18:52:53 26.92 7/12/11 15:57:44 7/13/11 18:52:53 26.92
40
Tabl
e 6
A s
umm
ary
of t
he t
op f
orec
astin
g m
etho
ds u
sed
with
eac
h ho
use
to f
orec
ast
the
wak
e sc
ores
. Ea
ch h
ouse
sho
ws
the
mac
hine
lea
rnin
g al
gorit
hm t
hat
perf
orm
ed th
e be
st a
nd th
e co
rres
pond
ing
NM
AE
and
NR
MSE
for e
ach
fore
cast
ing
met
hod.
If th
e N
MA
E er
ror w
as le
ss th
an 2
% w
e hi
ghlig
hted
with
blu
e,
and
if th
e N
MA
E er
ror w
as b
etw
een
2-4%
we
high
light
ed w
ith y
ello
w.
Side
by
Side
Com
paris
on o
f Res
ults
for O
rigin
al S
core
s an
d N
orm
aliz
ed S
core
s whe
n Fo
reca
stin
g fo
r Wak
e Sc
ores
Orig
inal
Sco
res
Nor
mal
ized
Sco
res
Inde
pend
ent P
redi
ctio
n C
ross
Pre
dict
ion
Join
t Pre
dict
ion
Inde
pend
ent P
redi
ctio
n C
ross
Pre
dict
ion
Join
t Pre
dict
ion
algo
rithm
N
MA
E N
RM
SE
algo
rithm
N
MA
E N
RM
SE
algo
rithm
N
MA
E N
RM
SE
algo
rithm
N
MA
E N
RM
SE
algo
rithm
N
MA
E N
RM
SE
algo
rithm
N
MA
E N
RM
SE
HH
101
svm
0.
049
0.08
4 sv
m
0.04
9 0.
084
svm
0.
049
0.08
4 fo
rest
9.
48E-
09
1.64
E-08
fo
rest
9.
98E-
09
1.56
E-08
fo
rest
9.
60E-
09
1.60
E-08
H
H10
1 H
H10
2 sv
m
0.01
8 0.
041
svm
0.
018
0.04
1 sv
m
0.01
8 0.
041
logi
stic
1.
16E-
09
2.23
E-09
lo
gist
ic
1.18
E-09
2.
50E-
09
logi
stic
1.
12E-
09
2.41
E-09
H
H10
2
HH
103
svm
0.
017
0.11
6 sv
m
0.01
7 0.
116
svm
0.
017
0.11
6 lo
gist
ic
2.91
E-11
1.
93E-
10
logi
stic
2.
85E-
11
1.94
E-10
lo
gist
ic
2.88
E-11
1.
94E-
10
HH
103
HH
104
fore
st 0.
045
0.08
2 sv
m
0.04
8 0.
083
fore
st
0.04
7 0.
083
fore
st
3.03
E-09
5.
56E-
09
linea
r 3.
38E-
09
5.72
E-09
fo
rest
3.
11E-
09
5.75
E-09
H
H10
4 H
H10
5 sv
m
0.02
4 0.
116
svm
0.
024
0.11
6 sv
m
0.02
4 0.
116
tree
8.89
E-10
3.
70E-
09
logi
stic
9.
30E-
10
4.09
E-09
tre
e 8.
89E-
10
3.63
E-09
H
H10
5 H
H10
6 sv
m
0.05
7 0.
139
svm
0.
057
0.13
9 sv
m
0.05
7 0.
139
logi
stic
6.
59E-
09
1.48
E-08
lo
gist
ic
7.09
E-09
1.
50E-
08
logi
stic
6.
47E-
09
1.45
E-08
H
H10
6
HH
108
svm
0.
069
0.16
7 sv
m
0.06
9 0.
167
svm
0.
069
0.16
7 fo
rest
2.
61E-
09
4.73
E-09
tre
e 2.
37E-
09
4.68
E-09
tre
e 2.
47E-
09
4.84
E-09
H
H10
8
HH
109
svm
0.
060
0.11
2 sv
m
0.06
0 0.
112
svm
0.
060
0.11
2 lin
ear
1.91
E-08
3.
27E-
08
svm
1.
92E-
08
3.27
E-08
sv
m
1.95
E-08
3.
22E-
08
HH
109
HH
110
fore
st 0.
028
0.02
8 fo
rest
0.
023
0.02
3 lo
gist
ic
0.02
9 0.
031
fore
st
1.39
E-09
1.
54E-
09
tree
4.27
E-09
5.
56E-
09
fore
st
2.06
E-09
2.
72E-
09
HH
110
HH
111
svm
0.
025
0.04
2 sv
m
0.02
5 0.
042
svm
0.
025
0.04
2 fo
rest
8.
57E-
10
1.40
E-09
fo
rest
9.
19E-
10
1.42
E-09
fo
rest
8.
78E-
10
1.46
E-09
H
H11
1 H
H11
2 sv
m
0.04
5 0.
075
svm
0.
045
0.07
5 sv
m
0.04
5 0.
075
fore
st
5.30
E-09
8.
55E-
09
fore
st
5.70
E-09
8.
84E-
09
fore
st
5.59
E-09
8.
73E-
09
HH
112
HH
113
svm
0.
030
0.09
7 sv
m
0.03
0 0.
097
svm
0.
030
0.09
7 sv
m
2.66
E-09
7.
05E-
09
logi
stic
2.
45E-
09
7.23
E-09
lo
gist
ic
2.46
E-09
7.
13E-
09
HH
113
HH
114
fore
st 0.
100
0.14
5 fo
rest
0.
093
0.14
2 fo
rest
0.
098
0.15
3 fo
rest
1.
19E-
08
1.69
E-08
fo
rest
1.
12E-
08
1.67
E-08
fo
rest
1.
16E-
08
1.68
E-08
H
H11
4
HH
116
svm
0.
023
0.08
0 sv
m
0.02
3 0.
080
svm
0.
023
0.08
0 tre
e 1.
95E-
09
5.88
E-09
fo
rest
1.
87E-
09
5.96
E-09
fo
rest
1.
92E-
09
5.70
E-09
H
H11
6
HH
117
fore
st 0.
008
0.01
1 fo
rest
0.
024
0.02
5 fo
rest
0.
019
0.02
3 tre
e 7.
42E-
09
1.05
E-08
fo
rest
8.
35E-
09
1.23
E-08
fo
rest
4.
99E-
09
7.00
E-09
H
H11
7 H
H11
8 sv
m
0.04
4 0.
055
svm
0.
044
0.05
5 sv
m
0.04
4 0.
055
fore
st
2.30
E-09
2.
73E-
09
tree
2.23
E-09
2.
81E-
09
tree
1.72
E-09
2.
23E-
09
HH
118
HH
119
svm
0.
046
0.06
9 sv
m
0.04
6 0.
069
svm
0.
046
0.06
9 fo
rest
6.
98E-
09
9.96
E-09
fo
rest
6.
99E-
09
1.02
E-08
fo
rest
7.
02E-
09
1.00
E-08
H
H11
9
HH
120
svm
0.
044
0.06
8 sv
m
0.04
4 0.
068
svm
0.
044
0.06
8 fo
rest
4.
56E-
10
6.96
E-10
fo
rest
5.
05E-
10
8.08
E-10
tre
e 4.
68E-
10
6.68
E-10
H
H12
0
HH
122
tree
0.01
7 0.
021
logi
stic
0.
027
0.02
8 tre
e 0.
020
0.02
6 tre
e 1.
38E-
09
1.81
E-09
fo
rest
2.
16E-
10
2.63
E-10
lo
gist
ic
1.08
E-09
1.
37E-
09
HH
122
HH
123
svm
0.
045
0.13
7 sv
m
0.04
5 0.
137
svm
0.
045
0.13
7 lo
gist
ic
7.73
E-09
2.
06E-
08
tree
7.40
E-09
2.
02E-
08
fore
st
7.51
E-09
2.
00E-
08
HH
123
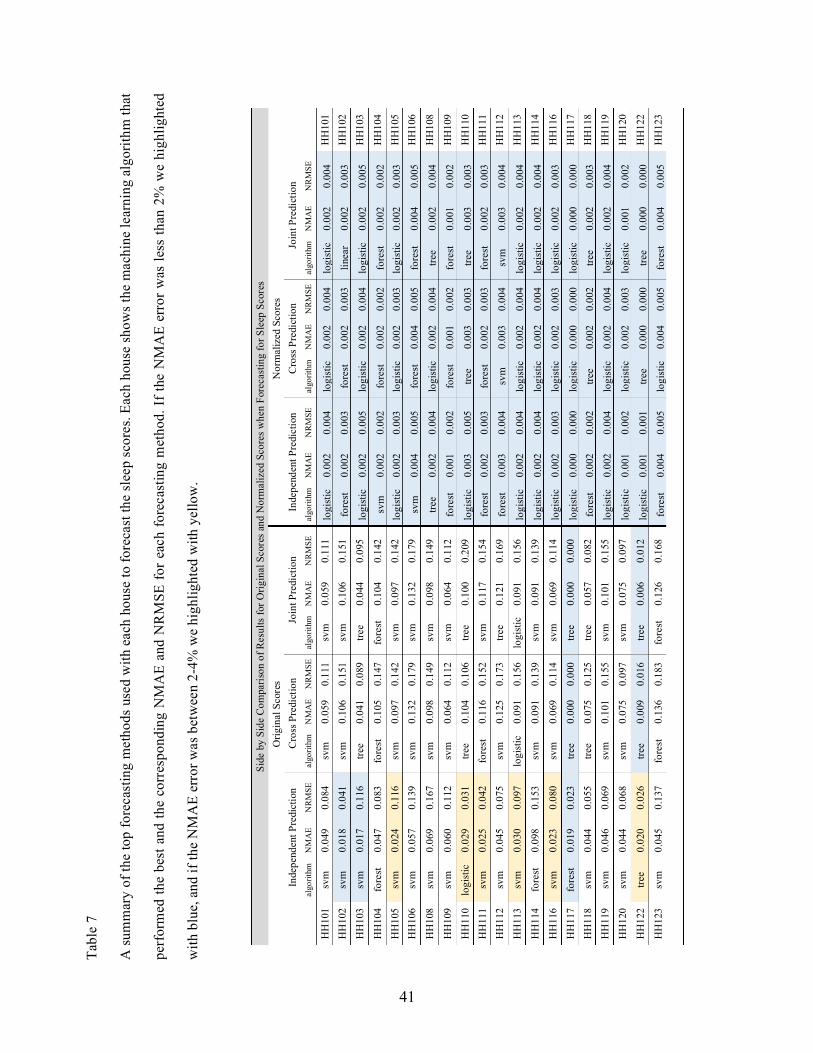
41
Tabl
e 7
A su
mm
ary
of th
e to
p fo
reca
stin
g m
etho
ds u
sed
with
eac
h ho
use
to fo
reca
st th
e sl
eep
scor
es. E
ach
hous
e sh
ows t
he m
achi
ne le
arni
ng a
lgor
ithm
that
perf
orm
ed th
e be
st a
nd th
e co
rres
pond
ing
NM
AE
and
NR
MSE
for
each
fore
cast
ing
met
hod.
If t
he N
MA
E er
ror w
as le
ss th
an 2
% w
e hi
ghlig
hted
with
blu
e, a
nd if
the
NM
AE
erro
r was
bet
wee
n 2-
4% w
e hi
ghlig
hted
with
yel
low
.
Side
by
Side
Com
paris
on o
f Res
ults
for O
rigin
al S
core
s an
d N
orm
aliz
ed S
core
s whe
n Fo
reca
stin
g fo
r Sle
ep S
core
s
Orig
inal
Sco
res
Nor
mal
ized
Sco
res
Inde
pend
ent P
redi
ctio
n C
ross
Pre
dict
ion
Join
t Pre
dict
ion
Inde
pend
ent P
redi
ctio
n C
ross
Pre
dict
ion
Join
t Pre
dict
ion
algo
rithm
N
MA
E N
RM
SE
algo
rithm
N
MA
E N
RM
SE
algo
rithm
N
MA
E N
RM
SE
algo
rithm
N
MA
E N
RM
SE
algo
rithm
N
MA
E N
RM
SE
algo
rithm
N
MA
E N
RM
SE
HH
101
svm
0.
049
0.08
4 sv
m
0.05
9 0.
111
svm
0.
059
0.11
1 lo
gist
ic
0.00
2 0.
004
logi
stic
0.
002
0.00
4 lo
gist
ic
0.00
2 0.
004
HH
101
HH
102
svm
0.
018
0.04
1 sv
m
0.10
6 0.
151
svm
0.
106
0.15
1 fo
rest
0.
002
0.00
3 fo
rest
0.
002
0.00
3 lin
ear
0.00
2 0.
003
HH
102
HH
103
svm
0.
017
0.11
6 tre
e 0.
041
0.08
9 tre
e 0.
044
0.09
5 lo
gist
ic
0.00
2 0.
005
logi
stic
0.
002
0.00
4 lo
gist
ic
0.00
2 0.
005
HH
103
HH
104
fore
st 0.
047
0.08
3 fo
rest
0.
105
0.14
7 fo
rest
0.
104
0.14
2 sv
m
0.00
2 0.
002
fore
st
0.00
2 0.
002
fore
st
0.00
2 0.
002
HH
104
HH
105
svm
0.
024
0.11
6 sv
m
0.09
7 0.
142
svm
0.
097
0.14
2 lo
gist
ic
0.00
2 0.
003
logi
stic
0.
002
0.00
3 lo
gist
ic
0.00
2 0.
003
HH
105
HH
106
svm
0.
057
0.13
9 sv
m
0.13
2 0.
179
svm
0.
132
0.17
9 sv
m
0.00
4 0.
005
fore
st
0.00
4 0.
005
fore
st
0.00
4 0.
005
HH
106
HH
108
svm
0.
069
0.16
7 sv
m
0.09
8 0.
149
svm
0.
098
0.14
9 tre
e 0.
002
0.00
4 lo
gist
ic
0.00
2 0.
004
tree
0.00
2 0.
004
HH
108
HH
109
svm
0.
060
0.11
2 sv
m
0.06
4 0.
112
svm
0.
064
0.11
2 fo
rest
0.
001
0.00
2 fo
rest
0.
001
0.00
2 fo
rest
0.
001
0.00
2 H
H10
9
HH
110
logi
stic
0.
029
0.03
1 tre
e 0.
104
0.10
6 tre
e 0.
100
0.20
9 lo
gist
ic
0.00
3 0.
005
tree
0.00
3 0.
003
tree
0.00
3 0.
003
HH
110
HH
111
svm
0.
025
0.04
2 fo
rest
0.
116
0.15
2 sv
m
0.11
7 0.
154
fore
st
0.00
2 0.
003
fore
st
0.00
2 0.
003
fore
st
0.00
2 0.
003
HH
111
HH
112
svm
0.
045
0.07
5 sv
m
0.12
5 0.
173
tree
0.12
1 0.
169
fore
st
0.00
3 0.
004
svm
0.
003
0.00
4 sv
m
0.00
3 0.
004
HH
112
HH
113
svm
0.
030
0.09
7 lo
gist
ic
0.09
1 0.
156
logi
stic
0.
091
0.15
6 lo
gist
ic
0.00
2 0.
004
logi
stic
0.
002
0.00
4 lo
gist
ic
0.00
2 0.
004
HH
113
HH
114
fore
st 0.
098
0.15
3 sv
m
0.09
1 0.
139
svm
0.
091
0.13
9 lo
gist
ic
0.00
2 0.
004
logi
stic
0.
002
0.00
4 lo
gist
ic
0.00
2 0.
004
HH
114
HH
116
svm
0.
023
0.08
0 sv
m
0.06
9 0.
114
svm
0.
069
0.11
4 lo
gist
ic
0.00
2 0.
003
logi
stic
0.
002
0.00
3 lo
gist
ic
0.00
2 0.
003
HH
116
HH
117
fore
st 0.
019
0.02
3 tre
e 0.
000
0.00
0 tre
e 0.
000
0.00
0 lo
gist
ic
0.00
0 0.
000
logi
stic
0.
000
0.00
0 lo
gist
ic
0.00
0 0.
000
HH
117
HH
118
svm
0.
044
0.05
5 tre
e 0.
075
0.12
5 tre
e 0.
057
0.08
2 fo
rest
0.
002
0.00
2 tre
e 0.
002
0.00
2 tre
e 0.
002
0.00
3 H
H11
8 H
H11
9 sv
m
0.04
6 0.
069
svm
0.
101
0.15
5 sv
m
0.10
1 0.
155
logi
stic
0.
002
0.00
4 lo
gist
ic
0.00
2 0.
004
logi
stic
0.
002
0.00
4 H
H11
9
HH
120
svm
0.
044
0.06
8 sv
m
0.07
5 0.
097
svm
0.
075
0.09
7 lo
gist
ic
0.00
1 0.
002
logi
stic
0.
002
0.00
3 lo
gist
ic
0.00
1 0.
002
HH
120
HH
122
tree
0.02
0 0.
026
tree
0.00
9 0.
016
tree
0.00
6 0.
012
logi
stic
0.
001
0.00
1 tre
e 0.
000
0.00
0 tre
e 0.
000
0.00
0 H
H12
2
HH
123
svm
0.
045
0.13
7 fo
rest
0.
136
0.18
3 fo
rest
0.
126
0.16
8 fo
rest
0.
004
0.00
5 lo
gist
ic
0.00
4 0.
005
fore
st
0.00
4 0.
005
HH
123
42
Figure Captions
Figure 1. Stages of sleep throughout the night. The thick black bar represent REM sleep.
Figure 2. Behavior Forecasting (BF) approach framework. WISO: wake scores input and sleep score
output. SIWO: sleep score input and wake scores output.
Figure 3. Training set and testing set example. Since the framework is the same regardless of the score we
are forecasting for (either wake score or sleep score), we use 𝑂 = 𝑜!, 𝑜!,… , 𝑜! to represent the scores.
Figure 4. An example CASAS smart home floor plan and sensor layout. The example layout has a
bedroom, a kitchen, a dining area, a living area, and two bathrooms. This layout also illustrated where the
sensors are located in this particular smart home layout.
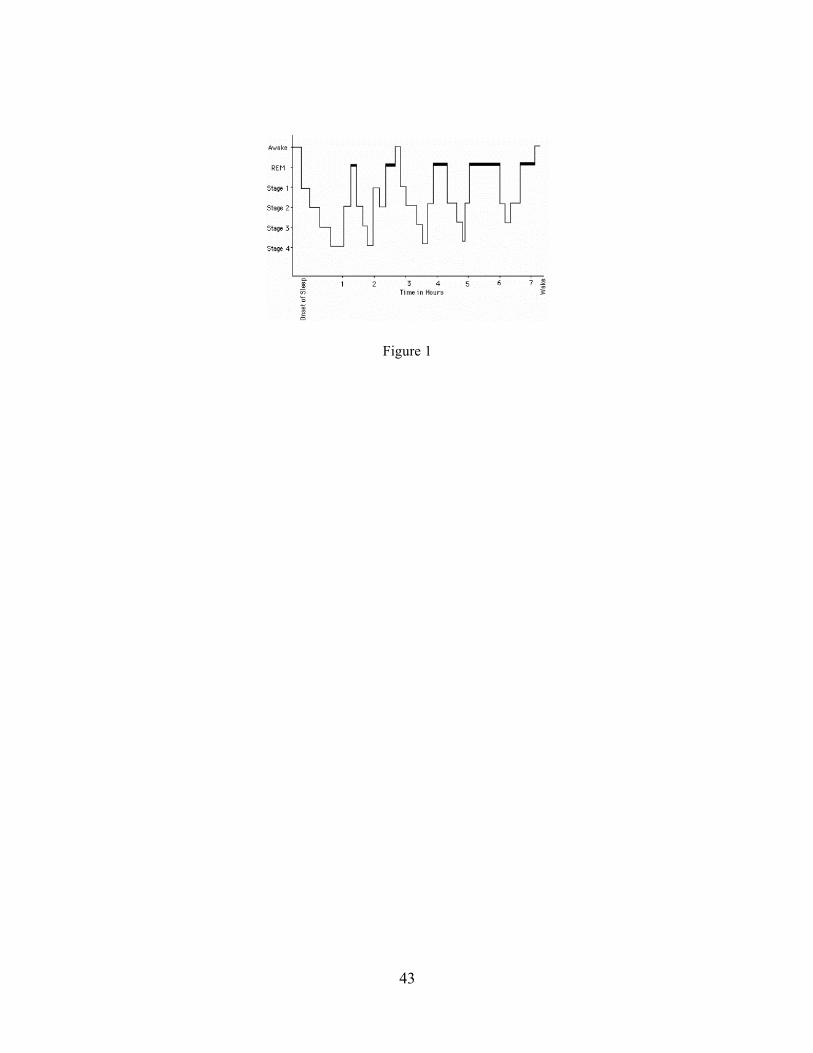
43
Figure 1

44
Figure 2
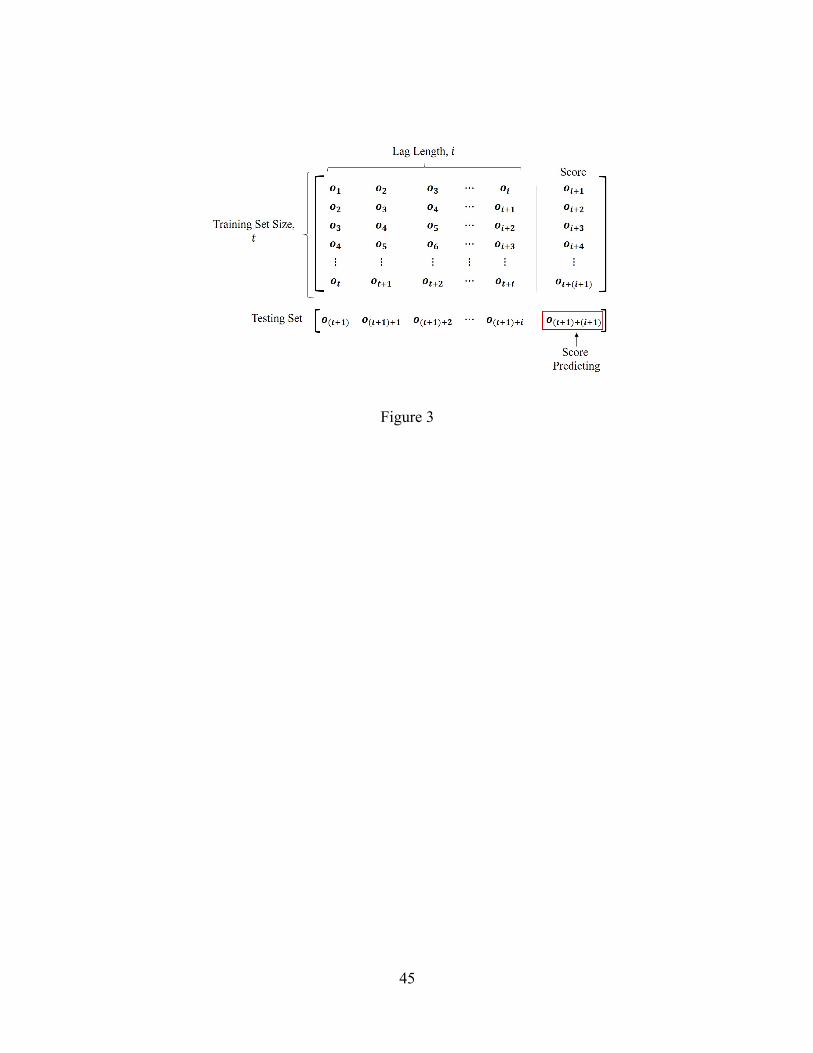
45
Figure 3

46
Figure 4