forecasting and simulation modelling, decision · pdf fileinternational journal of academic...
TRANSCRIPT

International Journal of Academic Research in Economics and Management Sciences May 2013, Vol. 2, No. 3
ISSN: 2226-3624
126 www.hrmars.com
Forecasting and Simulation Modelling, Decision Support Tools for Ambulance Emergency Preparedness
Mapuwei T.W. Bindura University of Science Education, Department of Mathematics and Physics
Email: [email protected]
Masamha B. Bindura University of Science Education, Department of Environmental Science
Email: [email protected]
Mukavhi L.
Bindura University of Science Education, Department of Mathematics and Physics Email: [email protected].
Abstract Ambulance logistics involves managing an efficient ambulance health care, which includes both emergency medical services and patient transportations. There has been a decrease in the total number of operational ambulances and staff establishment at Bulawayo Fire brigade Ambulances Services at any given time. Growing demand due to population growth and expansion of city boundaries prompted the researcher to investigate and propose measures that would ensure equality and efficiency in the distribution of ambulance services with the limited resources. Quantitative forecasting methods using autoregressive integrated moving average were used to forecast ambulance demand. Simulation modelling was used in determining the monthly optimal number of ambulances to be allocated. Response time, service time, ambulance utility ratios and queuing time were the guiding performance measures. Ambulance demand was modelled using a Seasonal Autoregressive Integrated Moving Average Model Monthly optimal allocations were done using simulation modelling to
ensure equality, efficiency and adequate emergency preparedness. Keywords: Ambulance logistics, equality, preparedness, forecasting, simulation 1. Introduction In Bulawayo City, the number of emergency assistance in 1998 increased by nearly 13500 calls over those in 1991. However, there has been a tremendous decline of calls as from 1999 to 2004, which prompted interest to investigate such a trend. One might assume that people have lost confidence in the service delivery due to various reasons which might include lack of efficiency, effectiveness or even equality in the distribution of resources. The ambulance service is provided by the fire department of the municipality of Bulawayo. In 2004 seven ambulances were stationed at four depots together with some fire engines. The

International Journal of Academic Research in Economics and Management Sciences May 2013, Vol. 2, No. 3
ISSN: 2226-3624
127 www.hrmars.com
headquarters is at Famona and the sub-stations are Northend, Nketa and Nkulumane. Each sub-station was assigned to cover particular geographical zones in Bulawayo city for the provision of ambulance services. There has been a decrease in the total number of ambulances that are operational at any given time. This was attributed to the shortage of spare parts, shortage of fuel and foreign currency to purchase new vehicles. The continuous decrease of the staff establishment, coupled with the growing demand due to population growth and expansion of city boundaries prompted the researcher to carry out some investigations and take measures that would ensure efficiency and equality in distribution of services to Bulawayo residents with the limited resources. This called for planning considering issues around the nature of demand from the set geographical areas. Much of the early development of ambulance theory focused on the questions of where and when ambulances should be operated. While this question is central to what is to be done, The researchers were motivated by the question stated as, what decision tools can be used for preparedness in terms of forecasting of demand for the near or distant future to improve equality in the provision of ambulance services? As researchers, we sought to identify operational problems of FBAS and propose recommendations. Develop and demonstrate the use of forecasting and simulation tools in forecasting demand and assessing performance in ambulance logistics at BFABS. Develop tools that would assist management in exploring performance over a specific period of time using the readily available data. At BFABS. The forecasted demand would assist in resource planning which is not limited to the allocation of ambulances to the respective stations but include staff training, ambulance servicing, scheduling of annual leave days for members of staff and routine checks on the alertness of the ambulance team as a whole. The developed tools would assist management in exploring performance under a wide range of possible interpretations of collected data. 1.1 An overview of the Operations of the Bulawayo Ambulance Services Department The Fire Brigade Ambulance Services (FBAS) is a non-profit organisation that is managed by the Bulawayo City Council. The headquarters are at Famona fire station and the other sub-stations are Northend, Nketa and Nkulumane. Each station is assigned to cover particular geographical zones in the city. The control room is manned from the main headquarters in Famona, where all calls and ambulance logistics are managed. The FBAS department uses manual system to capture information on every call that is received. This information enables the FBAS to prepare monthly reports on how they are performing. These reports have indicated that the organisation is finding it more and more difficult to meet its service targets. It was (and continues to be) believed that this is primarily due to shortage of ambulances due to shortage of foreign currency to purchase spare parts and new vehicles, increased demand due to growth of population size and the expansion of the city boundaries and the increasing congestion on the city roads. When a call arrives at FBAS headquarters, staff in the control room identify an available ambulance (i.e., an ambulance either idle at its base station or returning from a previous job) and dispatch this vehicle to the scene. After initial treatment at the scene, the ambulance transports the patient to a hospital, performs a hand over to hospital staff, and then returns to

International Journal of Academic Research in Economics and Management Sciences May 2013, Vol. 2, No. 3
ISSN: 2226-3624
128 www.hrmars.com
its base station. If transport is not required, the ambulance returns directly to its base from the scene. The vehicle is considered available to receive calls as soon as it begins returning to base. During this time the ambulance crew will be reporting to the control room staff on their activities from their time of arrival at the scene, departure from scene, arrival at the hospital right up to when the ambulance is available for the next call through the radio system. The dispatchers for monitoring purposes will record this information that is availed to them by the ambulance team on the ground. 1.2 Operational Challenges faced by FBAS Department It has been discovered that there is no full utilisation of historical data for preparedness. Preparedness in ambulance logistics is a way of describing the current operational situation to help predict the future. If the level of preparedness is good, the dispatcher is confident that it is possible to effectively serve a normal amount of calls in the near future. Historical data will help therefore to forecast demand. This helps to answer questions such as how many ambulances should be at each and every station? Or could there be need to add more stations? Such forecasting tools will ensure that there is equality in the provision of services and at the same time address the issue of efficiency in terms of operations. At the moment the FBAS relies much on the judgemental methods, which are mainly built on knowledge and qualified guesses of the present and future events. There is an absence of tools for measuring performance especially in terms of efficiency and equality. FBAS, as a public service provider is expected to adhere to principles that require equality and efficiency in terms of distribution of services to its residents. The ambulance service has always put much emphasis on the number of calls attended to as a performance measure. Minimum attention has been given to focus on the highly important measure of performance, which is the response time. Henderson [1] defines response time as the time interval between receiving a call to the time an ambulance first arrives at the scene. Response time must therefore be seriously considered as it can make a difference between life and death of a patient in need of ambulance services. Emergency ambulances are being dispatched almost on “first come first serve” despite the fact that priority is being given to Road Traffic Accidents. This implies that the speed of response depends not on the condition of the patient but on the volume of calls being responded to and how far away the nearest ambulance might be. This has serious consequences on the patient’s life. Here efficiency is of concern. There is need therefore, to seriously consider the use of forecasting tools to forecast demand, which would assist in the allocation of ambulances to the respective stations, thus ensuring equality and efficiency in the provision of ambulance services. There is also need to setup performance targets that would assist in measuring and monitoring response time. A priority dispatch system can also be implemented, which is a system that prioritises emergency calls according to the seriousness of the patient’s ailment or injury and then delivering the appropriate level of ambulance response. The system will enhance ambulance efficiency and speed of response for the most serious cases currently being experienced in Bulawayo by sending vehicles to them first.

International Journal of Academic Research in Economics and Management Sciences May 2013, Vol. 2, No. 3
ISSN: 2226-3624
129 www.hrmars.com
To effectively direct efforts into solving the challenges being faced by the FBAS, the researcher for now will focus on the demonstration of how forecasting and simulation techniques can be used in forecasting annual ambulance demand as a preparedness measure and to optimally allocate ambulances to different stations as a way to address issues of equality and efficiency in ambulance logistics. Other challenges will be explored in the future research activities by the researcher. 1.3 Literature Review Ambulance logistics comprises everything that has to do with managing an efficient ambulance health care, which includes both emergency medical services and patient transportations. Ambulance Logistics can be defined as the planning, implementation, and control of resources and information to facilitate an efficient way of serving a person in need of out-of-hospital medical care including possible transportation. Ambulance logistics covers all aspects of maintaining an efficient and effective ambulance health care. The two main products in ambulance health care are medical care and transportation. Medical care may be needed before transportation, and during transportation. The decision of the required level of medical care and the urgency of the service is also part of ambulance logistics. Response time is defined as the period between the receipt of a call at the ambulance depot and arrival of an ambulance at the scene. Response time is very vital as it may mean death or life to people who are in need of emergency medical help. Traffic congestion, distance to travel, availability of ambulances, prioritisation criteria, and road conditions can all affect how long an ambulance needs to respond to each call. However, the aim of this research is to minimise inequalities, and where inequalities in response times are identified, target measures are taken to meet needs and improve response times. Equality is all about fairness with regard to distribution and or access to goods and services. The inequalities that may exist in the ambulance services may be associated with differences between affluent and deprived communities, difficulties in accessing services faced by people living in different communities, and that people may not use ambulance services to the same extent as people from other population groups with similar levels of morbidity because of various reasons. It is against this background that the overall aim of this research is to ensure equity in the allocation of resources, reflecting as far as possible variations in demand across the city of Bulawayo. The use of forecasting techniques is expected to help achieve high levels of preparedness and equity in the allocation of ambulance services. Efficiency is about generating more or better output (volume or quality of service) from the available resources; or achieving the same volume or quality of output with fewer inputs. Efficiency in our scenario is all about matching the resource deployment to the needs of the geographical area. There has been research that has been done concerning areas where the ambulance logistics service can be improved. Anderson [2] presented the entry point into this research project. In their research work they identified areas that an ambulance service provider in Sweden could

International Journal of Academic Research in Economics and Management Sciences May 2013, Vol. 2, No. 3
ISSN: 2226-3624
130 www.hrmars.com
improve on its efficiency in provision of ambulance services. The four key areas that they dwelt on were;
1. Order/call: it encompassed issues of orders from the health care and the correct priority.
2. Planning: it involved the use of statistical information and operative management. 3. Control: this section encompassed the waiting room and the visualisation of the
preparedness. 4. Waiting Room: it dealt with defining who has the medical responsibility for a patient
during a call. The key issue of planning which encompasses the use of statistical data caught the interest of the researcher. In their study, they discovered that statistical information, such as regarding when and where calls are likely to appear, are rarely used to support the decision making process. This is mainly due to the inability of the technical systems used by ambulance organisations (including FBAS) to supply relevant statistical data. Methods for utilising the data have to be developed and are also going to be explored in this research. The demand for ambulance services in a zone, or the probability that an ambulance will be needed in a zone can be estimated in different ways. Common methods for forecasting demand include casual methods, time series models and judgemental methods. In casual methods, the forecasted demand is expressed as a function of independent variables such as for example population and employment in the zone. Kamenetzky [3] described the development of a casual model for estimating the demand for pre-hospital care in Southwestern Pennsylvania. Time series models are based on historical data, which is analysed to find out how the demand varies with time. Common components in these models are trends, cyclical variations and seasonal variations. Chatfield C. [4] defines trend as; “a long-term change in the mean level”. Seasonality refers to a consistent shape in the series that recurs with some periodic regularity. In a demand function for urgent ambulance health care, the seasonal variations will be prominent, since the demand in a zone might vary substantially depending on the time of the day, which day of the week it is, or which month it is. In the study by Repede [5], the demand inter-arrival rate for a district was found to depend on the day of the week and the hour of the day. Judgemental methods are mainly built on knowledge and qualified guesses of the present and future events; for example the knowledge that a big sports event will take place in a zone will of course affect the expected demand for ambulances. In order to obtain a fair estimation of the expected operational demand for in a zone, a combination of the three types of methods may be needed. Quantitative forecasting methods were used to forecast ambulance demand. The univariate approach, autoregressive integrated moving average (ARIMA) modelling was used. This approach expresses a time series in terms of past values of the same variable i.e. the demand for ambulance services as in our case.

International Journal of Academic Research in Economics and Management Sciences May 2013, Vol. 2, No. 3
ISSN: 2226-3624
131 www.hrmars.com
2. RESEARCH METHODOLOGY Secondary data was used in this research. The FBAS department collected this data for the past fifteen years as from 1991 to 2005. The Box-Jenkins methodology was used for forecasting purposes as the determinants of the response variable (ambulance demand) were not readily available. Data splitting method was used as a validation tool using the 2005 monthly demand dataset. ARIMA modelling techniques were employed as our forecasting tool on the 1991 to 2004 monthly data. Model validation was performed using the data collected in the year 2005. Simulation modelling techniques were applied on the forecasted data using ARENA, Excel and Minitab to optimally allocate ambulances to the four substations over a period of one year. 3. Data Analysis, Results And Discussion In Zimbabwe demand for ambulance services is normally high during the festive season, which begins late November to early January and partly in April and August. The bulk of these calls emanate from road accidents, alcoholism and general violence. There is therefore justification in taking into account the seasonal terms in our model. Seasonal differencing was carried out and trend analysis performed to achieve a deseasonalised demand time series (DsDdemand) data. The analysis done using the MINITAB statistical package gave the most significant model
(Table 1).
Table 1: Summary of Model
Parameter type AR 1 SAR 12 MA 1 MA 2 SMA 12 Constant
t-value 14.34 -1.88 72.87 -4.10 12.85 -9.44
p-value 0.000 0.043 0.000 0.001 0.000 0.001
All parameters are significant in this model. To verify the adequacy of the model, The Box-Pierce statistic results were used where;
Since the computed Q value (7.7) at lag 12 does not lie in the critical region we fail to reject the null hypothesis and conclude that the model is adequate for the time series data. Further investigations were performed to check whether the residuals are normally distributed, independent of each other and have a constant mean and variance. These characteristics of residuals were adequately satisfied. With all the characteristics of the residuals satisfied, the demand for ambulance services is modelled by a Seasonal Autoregressive Integrated Moving Average Model given by:
The concept of data splitting was adopted in order to validate the selected model. The monthly ambulance demand data for 2005 was compared with the forecast done by the selected model.

International Journal of Academic Research in Economics and Management Sciences May 2013, Vol. 2, No. 3
ISSN: 2226-3624
132 www.hrmars.com
All the forecasted data values fall within the 95% confidence interval and this validates that the model can adequately forecast ambulance demand for Bulawayo FBAS. A line graph was plotted to check whether there are any notable differences between the forecasted and the actual data collected for 2005 (Fig. 1). The forecasted demand plot is a true reflection of the actual demand trends as it predicts when to expect a peak demand and when it is likely to decline.
Figure 1: Actual against Forecasted Demand Data There are useful quantitative values that can be derived from such forecasts and used for planning purposes. Such calculations could be the total number of calls for ambulance services expected in Bulawayo per week, in a day or per hour for a specific month. Using the month of January forecast as an example with 2045 calls expected, rates of 512 calls per week, 74 calls per day and 4 calls per hour would be expected. Such quantitative data is important for planning purposes. 3.1 Use of Forecasted Data in Ambulance Allocation Expected demand percentage ratios were calculated using existing statistical information of the annual demand for each of the four stations. Percentage ratios were calculated using the formula:
Percentage ratios were used in allocating calls to the sub-stations as part of planning and emergency preparedness. The 2005 forecasted ambulance demand data was used as the expected total calls for ambulance services. Table 2 is a summary of the allocated number of calls to the four stations for January 2005. A total of 2045 calls were expected to be received. This translates to 66 calls being expected on daily basis in the month of January 2005.

International Journal of Academic Research in Economics and Management Sciences May 2013, Vol. 2, No. 3
ISSN: 2226-3624
133 www.hrmars.com
Table 2: Expected Daily Allocation of January calls to the four stations
Famona Station
Northend Station
Nketa Station
Nkulumane Station
Percentage ratio (%) 13.4 15.2 53.5 17.9
Approx. Allocation 8.8 10.0 35.3 11.8
Actual allocation 9 10 35 12
Simulation techniques will help to determine the optimal allocation of the ambulances to sub-stations. The researcher is interested in determining optimal number of ambulances to be allocated using simulation techniques. 3.2 Simulation Model Building Calls for ambulance services on a particular day were recorded and the data collected was grouped by station by category. Category A represented the urgent and life threatening symptoms, Category B represented the urgent but not life threatening symptoms while Category C represented the non-urgent calls. Time between calls, the response time and the service time were calculated using simulation techniques in EXCEL. The following assumptions were made about the model;
The calls are serviced as per first come first serve (FIFO).
The ambulance could only serve one call at a time.
The ambulances are the same in terms of size and equipment used and that each ambulance crew is made up of the driver and an attendant.
Ambulances are going to be allocated randomly.
Response time is the time that elapses from the time when a call is received to when the ambulance crew arrives at the scene.
Service time is the time that elapses from when the ambulance crew arrives at the scene until they arrive at the medical centre.
Total duration in system is the time from when a call is received up to when the ambulance crew arrives at the medical centre.
3.3 Estimation of Model Parameters Distributions of the inter–arrival time of calls, response time and the service time for the sub-stations were generated using ARENA Input Analyser Module (Table 3). Probability of occurrence of the different call categories are summarised in Table 4.

International Journal of Academic Research in Economics and Management Sciences May 2013, Vol. 2, No. 3
ISSN: 2226-3624
134 www.hrmars.com
Table 3: Summary of Distributions of calls
Table 4: Probability of occurrence
Probability of Occurrence
Category 1 Category 2 Category 3
Famona 0.33 0.28 0.39
Northend 0.52 0.19 0.29
Nketa 0.27 0.39 0.34
Nkulumane 0.44 0.28 0.28
Inter-arrival Time Response Time Service Time
Famona 3 + GAMM(168, 0.475)
7.5 + 99 * BETA(0.469, 0.519)
11.5 + 25 * BETA(0.633, 0.862)
Northend 2 + EXPO(44.9) 2.5 + ERLA(9.65, 2) -0.5 + WEIB(20, 1.86)
Nketa -0.5 + LOGN(21.4, 33.5)
-0.5 + 69*BETA(0.794, 1.44) 2.5 + ERLA(6.91, 3)
Nkulumane 3 + EXPO(30.7) 6 + EXPO(25.9) NORM(24.5, 17.5)

International Journal of Academic Research in Economics and Management Sciences May 2013, Vol. 2, No. 3
ISSN: 2226-3624
135 www.hrmars.com
3.4 The Conceptual Model Fig. 2 is a schematic representation of the general ambulance services model. What differed in each of the models were the number of ambulances available, inter-arrival time of calls, response time and service time.
Figure 2: Schematic Representation of Conceptual Model for FBAS Proper diagrams can be viewed when running an ARENA package. For each of the four stations, a single replication was done for 24 hours (a day = 1440 minutes). 3.5 Model Selection and Sensitivity Analysis. Nketa station was expecting 35 calls on this day. Results from the simulation runs indicate an optimal allocation of five ambulances. On average an ambulance will take 31 minutes to respond to a call, service time of 25 minutes and queuing time of 6 minutes. However, the number of ambulances forming a queue is close to zero. An utilisation rate of 11% per day is achieved. A total duration in system 55 minutes is expected for each call. Table 5: Nketa station ambulance performance measurement results
Average Time In System
Average Response Time
Average Response Queue Time
Average Number In Response Queue
Average Ambulance Utility (%)
Average Service Time
5 Ambulances 55.49 30.65 6.43 0.0 11 24.98
4 Ambulances 65.00 24.29 11.24 0.1 15 24.87
3 Ambulances 53.88 28.26 7.39 0.1 17 26.12
2 Ambulances 81.95 54.97 27.14 0.3 34 26.39
Nkulumane station was expecting to receive 12 calls. Three ambulances will be the optimal allocation to Nkulumane sub-station. With three ambulances, almost no queues will be
Incoming Calls
Call allocation desk
Category 2
Category 1
Category 3
Response
Process
Ambulance
Medical
Centre
International Journal of Academic Research in Economics and Management Sciences May 2013, Vol. 2, No. 3
ISSN: 2226-3624
136 www.hrmars.com
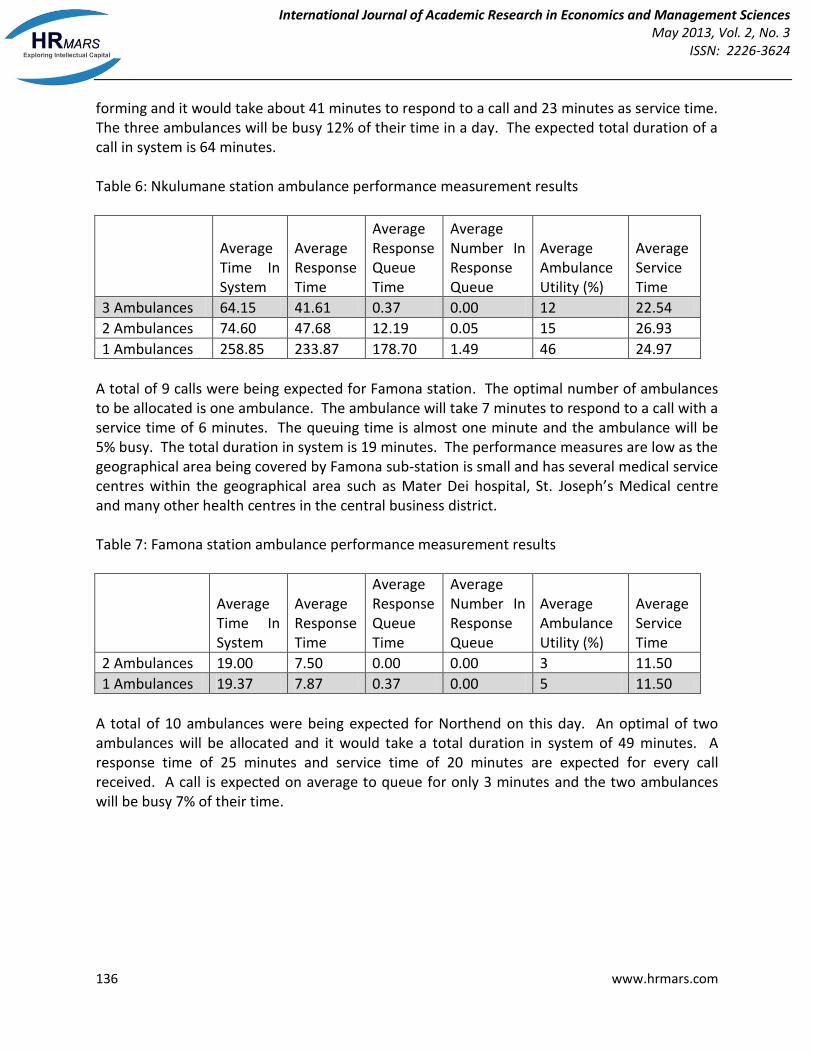
forming and it would take about 41 minutes to respond to a call and 23 minutes as service time. The three ambulances will be busy 12% of their time in a day. The expected total duration of a call in system is 64 minutes. Table 6: Nkulumane station ambulance performance measurement results
Average Time In System
Average Response Time
Average Response Queue Time
Average Number In Response Queue
Average Ambulance Utility (%)
Average Service Time
3 Ambulances 64.15 41.61 0.37 0.00 12 22.54
2 Ambulances 74.60 47.68 12.19 0.05 15 26.93
1 Ambulances 258.85 233.87 178.70 1.49 46 24.97
A total of 9 calls were being expected for Famona station. The optimal number of ambulances to be allocated is one ambulance. The ambulance will take 7 minutes to respond to a call with a service time of 6 minutes. The queuing time is almost one minute and the ambulance will be 5% busy. The total duration in system is 19 minutes. The performance measures are low as the geographical area being covered by Famona sub-station is small and has several medical service centres within the geographical area such as Mater Dei hospital, St. Joseph’s Medical centre and many other health centres in the central business district. Table 7: Famona station ambulance performance measurement results
Average Time In System
Average Response Time
Average Response Queue Time
Average Number In Response Queue
Average Ambulance Utility (%)
Average Service Time
2 Ambulances 19.00 7.50 0.00 0.00 3 11.50
1 Ambulances 19.37 7.87 0.37 0.00 5 11.50
A total of 10 ambulances were being expected for Northend on this day. An optimal of two ambulances will be allocated and it would take a total duration in system of 49 minutes. A response time of 25 minutes and service time of 20 minutes are expected for every call received. A call is expected on average to queue for only 3 minutes and the two ambulances will be busy 7% of their time.

International Journal of Academic Research in Economics and Management Sciences May 2013, Vol. 2, No. 3
ISSN: 2226-3624
137 www.hrmars.com
Table 8: Northend station ambulance performance measurement results
Average Time In System
Average Response Time
Average Response Queue Time
Average Number In Response Queue
Average Ambulance Utility (%)
Average Service Time
2 Ambulances 43.91 24.90 3.48 0.01 7 20.47
1 Ambulances 68.29 48.85 14.61 0.10 24 19.44
A total of 11 ambulances will have to be availed in order to optimise the FBAS operations while minimising the response time, queuing time, number of calls in queue, ambulance utility and the service time. The same procedure was carried for the remaining months of February to December 2005 (Fig. 3). Fig. 4 is a summary of the total optimal ambulance monthly
requirements for BFBAS. Figure 3: Optimal Monthly Ambulance Allocation per Sub-station for BFBAS.

International Journal of Academic Research in Economics and Management Sciences May 2013, Vol. 2, No. 3
ISSN: 2226-3624
138 www.hrmars.com
Figure 4: Total Monthly Optimal Ambulance Requirements for BFBAS. 4. Conclusion The forecasted values for the year 2005 were a true reflection of ambulance demand trends in Zimbabwe. Demand tends to be high during the festive seasons. It increases from late November up to late January. High demands are expected in April because of Easter and Independence holidays which coincides with the Bulawayo Trade Fair. Simulation models will help to determine optimal number of ambulances to be allocated to each of the sub-stations. This addresses issues of equality and efficiency as ambulances are allocated where they are needed most. This must be done in adherence to minimum measures of performance (response time, queuing time, and service time). Forecasts would help management in planning as part of their ambulance logistics. There are many organisational activities that take place during the course of the year. Among these include staff training, ambulance servicing, scheduling of annual leave days for members of staff and even routine checks on the alertness of the ambulance team. Such activities during planning must be considered taking cognisance of the demand that might occur. Training of staff for example should be targeted for the months of July, August and September as during this time of the year, demand is low. This avoids a situation where ambulances are available but without enough staff to operate them. Forecasts also help management to strategise on when to beef up the number of ambulances on monthly basis. During peak months of December, January, March and April, management should ensure that most if not all-available ambulances are fully operational. Motor vehicle repairing and services must be done well in advance as preparedness measure. This should run concurrently with restocking of essential drugs and equipment. The researcher recommends that besides adopting the forecasting tools, further research must be carried out on how best the FBAS might embrace the use of standard performance targets based on the response time instead of using number of calls attended to as a performance measure. Simulation modelling can be integrated with forecasting methods to optimally allocate ambulances to the respective stations. References [1] Henderson, S; Mason, A. (2004). Ambulance service planning: Simulation and Data
Visualisation, Kluwer Academic Publishers, Boston, 77-102. [2] Anderson, T; Peterson, S; Varbrand, P. (2005). Decision support for efficient ambulance
logistics, Working paper, Linkongping University, Sweden. [3] Kamenetzky, R; Suman, L; Wolfe H. (1982). Estimating the need and demand for pre-hospital
care, Operations Research, Vol. 30, No. 6, 1148-1167. [4] Chatfield, C. (1996). The Analysis Of Time Series: An Introduction, Chapman and Hall,
London. [5] Repede, J; Bernardo, J. (1994) Developing and validating a decision support system for
locating emergency medical vehicles in Louisville, European Journal of Operations Research, Vol. 75.