forecast 2013, issue 1
TRANSCRIPT


Forecast
Tourism Forecasting Committee
2013 Issue 1

ii
Authors
Tourism Research Australia: Tim Quinn, Dr George Chen, Dr Ben Pang and Geoff Bailey
Other Contributors
Tourism Forecasting Committee, Tourism Forecasting Technical Committee and Industry Sources
ISBN 978-1-922106-76-6
Tourism Research Australia
Department of Resources, Energy and Tourism
GPO Box 1564
Canberra ACT 2601
ABN 46 252 861 927
Email: [email protected]
Web: www.tra.gov.au
Lake Argyle, Western Australia
Photographer: Evan Collis
Image courtesy of Tourism Western Australia
Publication date: April 2013
This work is licensed under a Creative Commons Attribution 3.0 Australia licence. To the extent that copyright subsists in third party quotes and diagrams it remains with the original owner and permission may be required to reuse the material.
This work should be attributed as Tourism Forecasting Committee, Forecast 2013 Issue 1, Tourism Research Australia, Canberra.
Enquiries regarding the licence and any use of work by Tourism Research Australia are welcome at [email protected]

iii
ContentsBackground ........................................................................................................................................................................ 1
Methodology ...................................................................................................................................................................... 2
Executive summary ........................................................................................................................................................... 5
Drivers of tourism forecasts ........................................................................................................................................... 10
Australian tourism performance .................................................................................................................................... 14
Domestic and outbound tourism forecasts ................................................................................................................... 16
Inbound tourism forecasts ............................................................................................................................................. 19
Uncertainties and risks ................................................................................................................................................... 21
Asia-Pacific ...................................................................................................................................................................... 35
China ........................................................................................................................................................................ 35
Hong Kong ................................................................................................................................................................ 37
India .......................................................................................................................................................................... 39
Indonesia .................................................................................................................................................................. 41
Japan ........................................................................................................................................................................ 43
Malaysia .................................................................................................................................................................... 45
New Zealand ............................................................................................................................................................. 47
Singapore ................................................................................................................................................................. 49
South Korea .............................................................................................................................................................. 51
Thailand .................................................................................................................................................................... 53
Rest of Asia .............................................................................................................................................................. 54
Europe .............................................................................................................................................................................. 55
France....................................................................................................................................................................... 55
Ireland ....................................................................................................................................................................... 56
Germany ................................................................................................................................................................... 57
United Kingdom ........................................................................................................................................................ 59
Rest of Europe .......................................................................................................................................................... 61
Canada ..................................................................................................................................................................... 62
United States ............................................................................................................................................................ 62
Other Markets .................................................................................................................................................................. 65
Middle East and North Africa .................................................................................................................................... 65
South Africa .......................................................................................................................................................... …66
Rest of the World ...................................................................................................................................................... 67

iv
Tables
Table 1 TFC forecast summary 8
Table 2 Domestic tourism 22
Table 3 Domestic visitor nights in hotels, motels, guesthouses and serviced apartments 23
Table 4 Short-term resident departures by market, financial year 24
Table 5 International visitor arrivals by market, financial year 25
Table 6 International visitor arrivals by purpose of visit, financial year 26
Table 7 International leisure visitor arrivals by market, financial year 27
Table 8 International visitor nights by market, financial year 28
Table 9 International visitor nights in hotels, motels, guesthouses & serviced apartments by market, financial year 29
Table 10 International leisure visitor nights by market, financial year 30
Table 11 International leisure visitor nights in hotels, motels, guesthouses & serviced apartments by market, financial year 31
Table 12 Real Total Inbound Tourism Expenditure by market, financial year 32
Table 13 Inbound leisure tourism expenditure by market, financial year 33
Table 14 International visitor arrivals: China 36
Table 15 International visitor arrivals: Hong Kong 38
Table 16 International visitor arrivals: India 40
Table 17 International visitor arrivals: Indonesia 42
Table 18 International visitor arrivals: Japan 44
Table 19 International visitor arrivals: Malaysia 46
Table 20 International visitor arrivals: New Zealand 48
Table 21 International visitor arrivals: Singapore 50
Table 22 International visitor arrivals: South Korea 52
Table 23 International visitor arrivals: Thailand 53
Table 24 International visitor arrivals: Rest of Asia 54

v
Table 25 International visitor arrivals: France 55
Table 26 International visitor arrivals: Ireland 56
Table 27 International visitor arrivals: Germany 58
Table 28 International visitor arrivals: United Kingdom 60
Table 29 International visitor arrivals: Rest of Europe 61
Table 30 International visitor arrivals: Canada 62
Table 31 International visitor arrivals: United States 64
Table 32 International visitor arrivals: Middle East and North Africa 65
Table 33 International visitor arrivals: South Africa 66
Table 34 International visitor arrivals: Rest of the World 67
Figures
Figure 1 Domestic visitor nights: history and forecast 17
Figure 2 Short term resident departures: history and forecast 18
Figure 3 International visitor arrivals: history and forecast 20

1
Background Tourism Forecasting Committee (TFC)
The TFC was established in 2004 following the implementation of the Tourism White Paper. Like its predecessor, the Tourism Forecasting Council, the TFC is an independent body charged with providing present and potential tourism investors, industry and government with consensus forecasts of activity across international, domestic and outbound tourism sectors. The resources to run the TFC are provided by Tourism Research Australia (TRA).
Chaired by Bernard Salt (KPMG), the TFC's membership draws on the combined expertise of the private and public sectors in the tourism and financial industries. The TFC is supported by a technical committee that also has a mixture of private and public sector representation and relevant experience to inform decision making.
The Tourism Forecasting Committee
Bernard Salt (Chair) KPMG
Andrew McEvoy Tourism Australia
Daniel Gschwind Queensland Tourism Industry Council
Trent Zimmerman (Acting) Tourism & Transport Forum
Ivan Colhoun ANZ Bank
Helen Cox (Acting) Department of Resources, Energy and Tourism
Felicia Mariani Australian Tourism Export Council
Ian Hill Australian Capital Tourism
Tony Webber Webber Quantitative Consulting
Leo Jago Tourism Research Australia
The Tourism Forecasting Committee Technical Committee
Leo Jago (Chair) Tourism Research Australia
Adele Labine-Romain Tourism & Transport Forum
Ernst Krolke Airport Coordination Australia
Jeff Oughton Economic Consultant
Karen Wales Jones Lang LaSalle Hotels
Nell Anderson Tourism Australia
Robert Boyd Virgin Australia
Karen McGuigan Department of Immigration and Citizenship
Tim Quinn Tourism Research Australia
George Chen Tourism Research Australia
Ben Pang Tourism Research Australia

2
Methodology
Forecasting process
The TFC forecasts represent the most likely outcomes given past trends, current information and the impact of policy and industry changes. Therefore, it is important to note that the TFC produces ‘forecasts’ as distinct from ‘targets’ where the latter are developed for business planning purposes and performance management. The TFC forecasts for domestic, outbound and inbound travel volumes and expenditures are developed using an iterative process.
The first iteration involves the TRA Forecasting Unit estimating activity and expenditure using a combination of econometric and time series models. These models provide forecasts based on aviation capacity, price, income and seasonality as well as significant events affecting source markets.
The second iteration involves a sub-committee (the TFC Technical Committee) made up of senior researchers and economists as well as independent advisors reviewing the model-based forecasts and applying qualitative adjustments.
The final iteration involves industry and government experts (the TFC) adjusting the forecasts by consensus.
Methodological changes
TRA undertook a major methodological review of its National Visitor Survey (NVS) and International Visitor Survey (IVS) in 2012. The review resulted in changes to many tourism region boundaries and the reweighting of individual categories (notably education and employment). The revisions led to the re-estimation of historical data on total expenditure (IVS and NVS combined) and changes across inbound expenditure and domestic expenditure (mainly for business). The methodological review also resulted in significant upward revisions to the base of domestic volumes and expenditure. During checking for the December 2012 NVS, TRA identified errors relating to June Quarter 2012 input data for domestic overnight travel supplied by the external NVS contractor. Correction of the error has occurred and led to downward revisions for overnight trip, visitor night, and overnight trip expenditure estimates for the year ending June and September 2012. These revisions (for year-end periods) amount to around 2 per cent lower than originally published (for the June quarter 2012, the revised estimates for the same key metrics are between 8 and 9 per cent lower than previously published). Day trip estimates were not affected. The data revision has also contributed to the updating of domestic tourism forecasts in Forecast 2013, Issue 1.

3
Forecasts purpose classification
The definition of 'holiday' travel for inbound and outbound forecast series was updated in Forecast 2012, Issue 1. Previously, travel reported as 'other', 'transit' or 'not stated' were included as components of holiday. Based on detailed analysis, travel reported as 'other' and 'transit' is now combined with education and employment in a broader 'other' purpose category, while 'not stated' travel is included in inbound and outbound totals only (i.e. it is not categorised to a specific purpose category such as ‘holiday’ or distributed across purpose categories). As a result, inbound and outbound historical estimates and forecasts for 'holiday' (and leisure) in the following editions of the forecasts will appear lower, and equivalent figures for 'other' travel will appear higher than in previous forecast issues.
The definition of 'holiday' travel in the domestic forecast series has also been revised. In this case, it has been extended to include nights spent away on long trips where the purpose of visit to each stopover is not established. Previously, these visitor nights had been classified as 'other' but examination has determined that this is predominantly holiday travel. As a result, historical estimates and forecasts for 'holiday' in this edition of the forecasts will appear slightly higher and those for 'other' slightly lower than in previous forecast issues.
Main data sources
Asia-Pacific Consensus Forecasts, March 2013 Issue, Consensus Economics Inc.
Australian Bureau of Statistics
- Overseas Arrivals and Departures, February 2013 (ABS Cat. No. 3401.0)
- Tourist Accommodation, December 2012 (ABS Cat. No. 8635.0)
Bureau of Infrastructure, Transport and Regional Economics (BITRE)
- Domestic airline activity January 2013
- International airline activity 2011–12
Consensus Economics Inc., Consensus Forecasts, March 2013 Issue
Consensus Economics Inc., Foreign Exchange Consensus Forecasts, March 2013 Issue
Deloitte Access Economics (2012) Tourism and Hotel Market Outlook, Q4, 2012
Department of Resources, Energy and Tourism (2009) National Long-Term Tourism Strategy
Department of Immigration and Citizenship (2013), Overseas Arrivals and Departures
(unpublished)
International Air Transport Association (2013) Air Passenger Market Analysis, January 2013
Tourism Forecasting Committee (TFC), Forecast, various issues, Tourism Research Australia

4
Tourism Research Australia (TRA)
- International Visitors in Australia: December 2012 Quarterly Results of the International
Visitor Survey
- Travel by Australians – December 2012 Quarterly Results of the National Visitor Survey
- State of the Industry, 2012
- Tourism Investment Monitor, 2012

5
Executive summary
Despite the many downside risks to the world economic outlook, growth in the Asia-Pacific economies continues to be faster than those of advanced economies. Adding to the positive note are continuing signs of improvement in the prospects for the US economy, but the Euro zone debt issue continues to cause concern and is driving declines in business and consumer confidence.
Reflecting these mixed prospects, economic growth forecasts have been revised down for many advanced economies for 2013 since the last forecast issue released in October 2012.
The Australian economy provides mixed signals for the forecast horizon. Capital spending in the resources sector is running close to trend but expectations are for this sector to soften and with that, greater opportunity will open up in other parts of the economy. Unemployment is increasing despite rising retail spending; domestic tourism expenditure continues to grow as Australians travel at home more than in recent years.
Along with cautious consumers, rising unemployment, global economic concerns, an associated correction in the Australian share market, and a looming election are likely factors that may limit growth.
After a period of solid growth in recent years in the aviation sector, activity in the global air travel market has accelerated in recent quarters. As a result, inbound capacity to Australia has been revised up for both 2012–13 and 2013–14.
On domestic accommodation, supply has remained relatively flat but as demand has risen, so too have yields which are expected to continue to rise in the medium term.
Against this backdrop, a number of revisions have been made resulting in a more positive story for inbound and domestic tourism. Forecasts for outbound departures have been revised down resulting in Australia’s net arrivals deficit reducing from the previously forecast 3.4 million in 2021–22 to 2.3 million in the current forecast.

6
Key messages (refer Table 1)
Total Domestic Tourism Expenditure (TDTE)1 and Total Inbound Tourism Expenditure (TITE) will grow at different speeds in the short term…
With strong growth in domestic day travel and assumed resilience in overnight travel, Total Domestic Tourism Expenditure (which captures expenditure from each of these segments) is forecast to increase by 2.5 per cent to $71 billion in 2012–13, and by a further 1.4 per cent to $72 billion in 2013–14.
Total Domestic Tourism Expenditure is now expected to grow at an average annual rate of 1.1 per cent to $77 billion by 2021–22.
Total Inbound Tourism Expenditure is expected to increase 5.4 per cent to $29 billion in 2012–13, and then by 5.9 per cent to $30 billion in 2013–14.
Total Inbound Tourism Expenditure is forecast to grow at an average annual rate of 3.8 per cent, to $40 billion by 2021–22.
Total tourism expenditure is forecast to increase by 3.3 per cent to $99 billion in 2012–13, and then by a further 2.7 per cent to $102 billion in 2013–14.
Total tourism expenditure is forecast to grow by an average annual rate of 1.9 per cent to $116 billion by 2021–22.
Domestic visitor nights to grow moderately in the short and medium term…
Domestic visitor nights are forecast to increase by 2.5 per cent to 285 million in 2012–13, and then by a further 1.2 per cent to 289 million in 2013–14.
This represents an upward revision from previously forecast growth of 2.1 per cent for 2012-13, but a slight downward revision from the previously forecast 1.4 per cent for 2013-14. The upward adjustment to the forecast for 2012–13 is associated with the stronger-than-expected growth for the business and holiday segments for the July to December 2012 period.
The long-term growth has also been revised up from 0.8 per cent to 1.0 per cent. Domestic visitor nights are now forecast to reach 307 million by 2021–22.
1 The measures of total tourism expenditure, total domestic expenditure and total inbound expenditure are presented in real terms in this publication. As a result, all historical estimates and forecasts to 2021–22 are shown in December 2012 dollars. To enable comparison of growth rates, forecasts from Forecast 2012, Issue 1 have been adjusted to report on a financial year basis.

7
Outbound resident departures to slow down in the near future…
Australian resident outbound departures are forecast to grow by 4.1 per cent to 8.4 million in 2012–13, and then by a further 4.7 per cent to 8.8 million in 2013–14. These levels are lower than previously forecast, largely due to lower-than-expected historical departures (compared to the previous forecast) and observed changes in the outbound travelling behaviour.
The long-term outlook for outbound travel is for average annual growth of 2.9 per cent with departures reaching 10.7 million by 2021–22.
Inbound arrivals to gain more momentum in coming years…
Inbound visitor arrivals are forecast to increase 4.6 per cent to reach 6.3 million in 2012–13, and then by a further 4.2 per cent to 6.5 million in 2013–14 (up from the 2.3 per cent and 3.7 per cent growth previously expected).
The upward revisions are largely due to an increase in air capacity expected from the Asia-Pacific region, and partly due to higher expectations of economic growth for 2013 and 2014 in some of the Asia-Pacific countries including China.
Markets expected to drive growth in 2012–13 and 2013–14 are China (up 15.9 per cent and 10.4 per cent respectively), Malaysia (up 13.9 per cent and 9.1 per cent), Singapore (up 12.5 per cent and 4.8 per cent) and India (up 7.5 per cent and 7.6 per cent).
Upward revisions in 2012–13, for both the United States (from 1.5 per cent to 4.9 per cent) and New Zealand (from 0.6 per cent to 1.6 per cent) are a result of both the higher-than-expected arrival figures in the first half of 2011–12 and a continuing recovery for both source economies.
By purpose, Visiting Friends and Relatives (VFR), Holiday, Other and Business travel are projected to grow 6.5 per cent, 5.4 per cent, 2.4 per cent and 2.2 per cent respectively in 2012–13, and then by a further 3.9 per cent, 4.5 per cent, 5.0 per cent and 3.9 per cent respectively in 2013-14.
Strong growth from Asia is expected to be particularly important to the performance of the inbound tourism sector in the short and longer term. By 2021–22, Asia's share of inbound arrivals is expected to increase from 42 per cent in 2011–12 to 46 per cent.
The long-term outlook has been upgraded with an average annual growth rate of 3.5 per cent. The forecasts show that 8.4 million arrivals are expected by 2021–22.

8
Table 1 TFC forecast summary
Inbound Change on Domestic Change on Outbound Change on TITEa Change on TDTEb Change on Expenditurec Change onvisitor previous visitor previous depart. previous (real) previous (real) previous (real) previous
arrivals year nights year year year year year '000 per cent million per cent '000 per cent $billion per cent $billion per cent $billion per cent
2000-01 5 031 n.a. 291.6 n.a. 3 577 n.a. 29.1 n.a. 70.4 n.a. 99.5 n.a.
2001-02 4 768 - 5.2 288.7 - 1.0 3 368 - 5.9 28.1 - 3.4 67.4 - 4.2 95.5 - 4.02002-03 4 656 - 2.4 302.3 4.7 3 293 - 2.2 26.3 - 6.5 69.5 3.0 95.7 0.22003-04 5 057 8.6 295.9 - 2.1 3 937 19.5 26.1 - 0.4 66.0 - 5.1 92.1 - 3.8
2004-05 5 408 6.9 289.7 - 2.1 4 591 16.6 26.1 - 0.2 65.2 - 1.2 91.3 - 0.9
2005-06 5 484 1.4 280.4 - 3.2 4 835 5.3 27.1 4.0 66.8 2.6 94.0 3.0
2006-07 5 641 2.9 289.1 3.1 5 127 6.0 27.7 2.1 69.4 3.9 97.1 3.4
2007-08 5 629 - 0.2 285.5 - 1.3 5 699 11.2 29.1 4.9 70.4 1.4 99.5 2.4
2008-09 5 541 - 1.6 263.4 - 7.7 5 843 2.5 29.8 2.4 66.2 - 6.0 95.9 - 3.5
2009-10 5 692 2.7 264.3 0.3 6 770 15.9 27.2 - 8.5 66.8 0.9 94.0 - 2.0
2010-11 5 907 3.8 266.2 0.7 7 443 9.9 27.4 0.8 64.5 - 3.5 91.9 - 2.2
2011-12 5 981 1.2 278.3 4.5 8 037 8.0 27.2 - 0.8 68.7 6.6 95.9 4.4
2012-13 6 257 4.6 285.2 2.5 8 367 4.1 28.7 5.4 70.5 2.5 99.1 3.3
2013-14 6 517 4.2 288.6 1.2 8 760 4.7 30.3 5.8 71.5 1.4 101.8 2.7
2014-15 6 779 4.0 291.4 1.0 9 090 3.8 31.6 4.2 72.2 1.1 103.8 2.0
2015-16 7 032 3.7 293.9 0.8 9 341 2.8 32.8 3.8 72.9 0.9 105.7 1.8
2016-17 7 271 3.4 296.2 0.8 9 569 2.4 34.0 3.5 73.6 0.9 107.5 1.7
2017-18 7 496 3.1 298.4 0.8 9 803 2.4 35.0 3.0 74.2 0.9 109.2 1.5
2018-19 7 725 3.1 300.7 0.8 10 033 2.4 36.1 3.1 74.8 0.9 110.9 1.6
2019-20 7 959 3.0 302.9 0.7 10 265 2.3 37.1 2.8 75.5 0.9 112.6 1.5
2020-21 8 198 3.0 305.2 0.7 10 502 2.3 38.4 3.4 76.1 0.9 114.5 1.7
2021-22 8 441 3.0 307.4 0.8 10 745 2.3 39.5 3.1 76.8 0.9 116.4 1.6
Compound annual growth rate (%)2001/02-2006/07 3.4 - 0.0 - 8.8 - -0.3 - 0.6 - 0.3 -
2006/07-2011/12 1.2 - -0.8 - 9.4 - -0.4 - -0.2 - -0.3 -
2011/12-2016/17 4.0 - 1.3 - 3.6 - 4.6 - 1.4 - 2.3 -
2016/17-2021/22 3.0 - 0.7 - 2.3 - 3.1 - 0.9 - 1.6 -
2001/02-2011/12 2.3 - -0.4 - 9.1 - -0.3 - 0.2 - 0.0 -
2011/12-2021/22 3.5 - 1.0 - 2.9 - 3.8 - 1.1 - 1.9 -Numbers shaded are forecastsa Total Inbound Tourism Expenditure (TITE) including prepaid international airfare and package (real, Base = Q4 2012)b Total Domestic Tourism Expenditure (TDTE) including the expenditure in domestic day trip and overnight trip (real base = Quarter 4 2012)c Expenditure refers to total expenditure made in Australia by international short-term visitor arrivals and Australian resident tourists. It is the sum of real TITE and real TDTE (Q4 2012=100)

9

10
Drivers of tourism forecasts
The global economic outlook
Latest macroeconomic forecasts expect the world economy to grow by 2.5 per cent in 2013 before picking up to 3.2 per cent in 2014, which is slightly lower than previously forecast. World economic growth is being largely driven by emerging economies like China and India and being assisted by the continuing economic recovery in the United States. Sentiment toward these economies has improved, but there is increased downside risk with Europe.
In the Asia-Pacific region, there have been minor upward revisions to the growth expected for China, Malaysia, Indonesia and Thailand for 2013, while downward revisions have been made to India and South Korea. The minor upward revision to China reflects the recent expansionary policy moves by the People’s Bank of China and some measures introduced by the Chinese government to stimulate the slowed economy. The political environment on the Korean Peninsula is likely to impact on travel in the short term.
The Japanese economy is forecast to grow at a rate higher than the long-run average, both in the short and medium term, partly due to recent expansionary policy moves by the Bank of Japan. While the economy appears to have shown signs of recovery following the 2011 earthquake and tsunami, risks continue to surround this market.
Despite the increasing pressure of fiscal consolidation, there continue to be signs of improvement for the United States. Its short-term economic outlook has improved as consumer and business confidence, and job and house markets are now in better shape than six months ago, partly due to the Federal Reserve’s continuing expansionary monetary policy.
In Europe, however, the Euro zone sovereign debt crisis continues to haunt the global financial markets and impacts European economies, including the larger economies—such as Germany and France—resulting in substantial growth markdowns for 2013. The most recent debt crisis in Cyprus indicates that there will not be permanent solutions in the short term. The Euro zone economy is forecast to contract 0.3 per cent in 2013 before a likely pick-up to 1.0 per cent in 2014.
The short-term economic outlook for the United Kingdom has continued to deteriorate, with economic growth forecasts revised down from the previously forecast 1.4 per cent growth to now 0.9 per cent growth in 2013. Continuing weakness in the medium term growth outlook has prompted ratings agencies to downgrade its domestic and foreign-currency government bond ratings and highlights the increasing challenges to the United Kingdom government’s fiscal consolidation efforts. The strengthened fiscal consolidation will tend to have a dampening effect on domestic demand and household incomes, leading to a reduction in consumers’ discretionary expenditure on overseas travel.
Reflecting the above-mentioned world economic outlook, it is expected that most growth in inbound tourism demand to Australia in 2012–13 and 2013–14 will continue to come from the Asia-Pacific region and North America. In contrast, near-term prospects for visitor arrivals from Europe remain pessimistic with a higher degree of risk attached, compared to forecasts contained in Forecast 2012, Issue 2.

11
Australia's economic outlook
The Australian economy is highly exposed to the headwinds of the global economy. Despite this, economic prospects remain solid compared with those of many developed economies. A range of indicators suggest that the Australian economy is running close to trend led by large increases in capital spending in the resources sector. However, with investment in resources assessed as near its peak, the Reserve Bank of Australia anticipates greater opportunity for demand to build in other parts of the economy in the period ahead.
For Australian households (and businesses) there have now been six successive cuts in official interest rates since November 2011. Signs are now emerging that this easing in interest rates has had desired outcomes. Demand for a range of consumer items is improving; house prices are starting to rise; dwelling construction is increasing; and local financial markets are picking up. A marked improvement in consumer sentiment—up 9.9 per cent—in February and March 2013 is a promising sign for domestic tourism, but a rising unemployment rate, global concerns, an associated correction in the share market, and a looming election are likely behind April’s 5.1 per cent fall in consumer sentiment. Of particular note was the fall in ‘time to buy a major household item’ (down 7.6 per cent).
While these forecasts expect modest growth in private consumption, constrained public spending and a continued softening in the labour market are expected in the period ahead. This environment is likely to have a constraining effect on big-ticket tourism expenditure such as outbound, with the domestic tourism sector benefiting.
Australia’s terms of trade remain much higher than their long-term average. The Australian dollar has also remained high, currently trading at US$1.04. This continues to be a factor in the weaker performance of key trade (currency) exposed industries in the Australian economy such as tourism. The Australian dollar is expected to hold at around US$1.04, depreciating to US$0.99 over the period to 2015.
Outlook for aviation demand and capacity
According to the International Air Transport Association (IATA), after a period of solid growth in recent years, growth in global air travel accelerated from late-2012. Between October 2012 and January 2013, revenue passenger kilometres (RPKs), a key indicator of demand, increased 9.0 per cent—well above the 5.0 per cent growth recorded throughout 2012. Around half of this growth was driven by Asia-Pacific airlines with passenger demand up 5.2 per cent in 2012 and up 3.0 per cent in January 2013. In contrast, air passenger demand in Europe remains weak, up 2.1 per cent in January 2013, despite an increase of 5.3 per cent in 2012. Demand for air travel in North America increased 1.9 per cent in 2012 and 1.5 per cent in January 2013.
IATA forecast that global demand will remain strong in 2013 (up 5.4 per cent), underpinned by improving global business confidence, strong economic growth across the Asia-Pacific region, and an improving US economy. IATA has also raised its profit forecasts for the global airline industry, with the combined net post-tax profit margin forecast up 1.6 per cent from the previously forecast 1.3 per cent for 2013. However, ongoing debt issues and subsequent dampening to economic growth are likely to see continued muted growth in the Euro zone aviation capacity.
In line with the continuing improvement in the global air travel market, especially robust passenger travel demand from emerging markets, seat capacity to Australia is expected to grow solidly over the next two years. After increasing 3.6 per cent in 2011–12, total inbound capacity growth is expected to increase 6.7 per cent in 2012–13 and then 6.0 per cent in 2013–14—higher

12
than its trend growth of 5.2 per cent. In the medium and long term, aviation capacity is expected to increase at an average annual rate of 3.9 per cent, which is lower than trend. Contributing to the short and medium-term expansion are new capacities created by airlines in emerging markets. In particular, Chinese airlines are now flying on new routes between Australia and China’s ‘second-tier’ cities such as Chengdu, Nanjing and Hainan. However, these opportunities could be restrained by limited capacities in major capital cities.
Similar to the global pattern, future growth in Australia’s inbound aviation capacity is expected to be primarily sourced from Asia-Pacific markets, while direct capacity from Europe is likely to continue to contract—a trend that has emerged since the middle of the last decade.
Qantas’ restructuring of its international services is also instrumental to this transitional growth pattern. Under the pressure of competition from Asian airlines, especially the low cost carriers (LCC), Qantas is restructuring its European services and adopting an Asia-focused growth strategy. According to this new strategy, Qantas’ European services are delinked from Asian routes and flights are rescheduled with the timing to better suit the needs of Asian travellers in Asian hubs including Singapore, Hong Kong and Bangkok. Furthermore, both Qantas and Virgin Australia are strengthening their Asian links through partnerships with Asian airlines in various forms including joint ventures with Asian airlines and code sharing on international flights.
Under these changed circumstances, seat capacities from Singapore, China, Malaysia and Japan are expected to increase 30 per cent, 22 per cent, 21 per cent and 11.4 per cent respectively in 2012–13, and then 11.1 per cent, 6.1 per cent, 10.1 per cent and 6.1 per cent respectively in 2013–14.
In contrast, as a result of the new strategy, which in turn reflects the likely on-going weak economic growth in Europe, direct inbound seat capacity from Europe to Australia is forecast to decline. The direct air capacities between the United Kingdom and Australia are expected to decrease 30 per cent in 2012–13 with a further decrease of 5.5 per cent in 2013–14.
However, the air traffic between Europe and Australia will be connected through the hubs in the Middle East (Dubai, Abu Dhabi and Doha) and Asia (Hong Kong, Singapore and Bangkok). Qantas and Emirates have formed a comprehensive alliance from April 2013, which included Qantas re-routing some of its London services via Dubai. The alliance also included a code sharing arrangement between Qantas and Emirates on their respective domestic and European services, and reciprocal access to frequent flyer programs and lounges. Meanwhile, Etihad and Virgin Australia’s comprehensive alliance has also improved access between Europe and Australia.
With Qantas’ restructuring and partnership with Emirates Airlines and Virgin Australia’s alliance with Etihad, growth in aviation capacity from the Middle East is expected to increase substantially in the coming two years, up 15.6 per cent in 2012–13, and then 11.0 per cent in 2013–14. On the other hand, growth in direct capacity from New Zealand—which accounted for 20 per cent of total inbound aviation capacity in 2011–12—is likely to slow in 2012–13, partially reflecting the slower domestic economic backdrop in New Zealand combined with the switching of trans-Tasman capacity by Virgin Australia to other regions.
Seat capacity between the United States and Australia is expected to record a solid growth of 5.7 per cent in 2012–13, and then 4.0 per cent in 2013–14. This assumption is driven by the improvement in consumer sentiment and continuing economic recovery, especially in the US job market. Notable recent additions include additional services between Brisbane and Hawaii, largely due to strong demand from outbound visitors from Australia.

13
On the domestic front, available seat kilometres—a key measure for domestic airline capacity—rose by 9.9 per cent to 45 billion during July to December 2012, well above its five-year average growth rate of 5.0 per cent. This growth reflects the ongoing strong competition on inter-city pairs, combined with strong demand for aviation services in regional areas (servicing Fly-In/Fly-Out workers). It is anticipated that this growth will continue through the second half of the financial year, pushing up domestic aviation capacity by 11.2 per cent in 2012–13.
In 2013–14, domestic aviation capacity is expected to increase 6.3 per cent, higher than its long-run average rate. This forecast is largely driven by major airlines competing for a larger share in the domestic air travel market. In the medium to longer term, however, pressure for higher profitability is more likely to force the two major domestic airlines to revert to a long-run average growth rate of about 4.0 per cent.
Performance and outlook for tourist accommodation
Key supply and demand indicators for the year ending December 2012 (compared to the year ending December 2011) showed that the demand for tourist accommodation in Australia increased. The number of room nights occupied was up by 1.8 per cent to 55 million nights, and takings from accommodation were up by 5.1 per cent in nominal terms to $9 billion.
The supply of tourist accommodation in Australia grew in the year ending December 2012 (compared to the same period in 2011) with the number of rooms available up 1.2 per cent (or 2,700 rooms) to 229,300. Combining the results for supply and demand suggests that yields per room night available increased by 2.3 per cent to $108 (in real terms).
Consistent with Deloitte Access Economics and Jones Lang LaSalle Hotels, TRA expects room occupancy rates and room stock to increase by a modest 1.0 per cent per annum to 2016 for the ten major domestic markets.

14
Australian tourism performance
Solid growth in domestic travel
Underpinned by a strong December quarter, there was solid growth in domestic overnight trips, visitor nights and overnight trip expenditure during 2012. In 2012, overnight trips increased 4.0 per cent to 75 million, visitor nights increased 4.0 per cent to 282 million, and overnight trip expenditure rose 3.0 per cent to $50 billion.
In 2012, growth in domestic overnight travel was led by the Visiting Friends and Relatives (VFR) sector while the Holiday and Business sectors also experienced modest increases. Overnight trips for VFR were up 7.0 per cent, while visitor nights and overnight expenditure for this purpose increased by 9.0 per cent and 15.0 per cent respectively over this period. In comparison, Holiday trips were up 3.0 per cent and nights and expenditure grew by 1.0 per cent, while for Business, growth was 1.0 per cent for overnight trips, 7.0 per cent for nights and 3.0 per cent for overnight trip expenditure.
Domestic day travel grew strongly in 2012 with trips up 8.0 per cent to 174 million and day trip expenditure up 11.0 per cent to 18.2 billion. This was despite a soft December quarter in which day trips fell 1.0 per cent to 41 million and day trip expenditure recorded growth of 2.0 per cent (to $4.8 billion).
Growth in domestic day travel for the 2012 calendar year was led by Holiday and VFR travel. The number of trips for Holiday and VFR increased by 10.1 per cent and 8.1 per cent respectively, while day trip expenditure grew by 9.0 per cent (Holiday) and 8.4 per cent (VFR) in real terms. Growth in Business day trips was more modest (3.1 per cent), but expenditure was up 18.9 per cent in 2012 year-on-year in real terms.
Moderate growth in outbound travel
Although there continues to be solid growth in the number of Australians travelling overseas, the rate of increase for the outbound sector has continued to moderate. Overseas Arrival and Departure (OAD) data indicate that Australians took 8.2 million overseas trips (up 4.9 per cent) over the last 12 months ending February 2013—1.8 percentage points lower than its five-year average of 6.7 per cent.
For the year ending September 2012, Australians aged 15 years or more spent 144 million nights travelling overseas (up 5.0 per cent), with expenditure of $42 billion (up 3.0 per cent).

15
Solid growth in international visitors
Short-term international visitor arrivals increased by 5.0 per cent to 6.2 million over the 12 month period ending February 20132, year-on-year. Arrivals from eight of Australia’s top ten inbound markets were higher, led by China (up 18.7 per cent), Malaysia (up 12.2 per cent), Singapore (up 11.3 per cent), Hong Kong (up 7.3 per cent), India (up 6.5 per cent), Japan (up 6.4 per cent), the United States (up 5.8 per cent) and New Zealand (up 2.3 per cent). Visitors from the United Kingdom and South Korea declined 3.0 per cent and 1.8 per cent respectively.
By purpose, over the last 12 months ending February 2013, VFR travel increased 6.3 per cent, Holiday travel increased 6.2 per cent, Business travel increased 2.3 per cent and Employment increased 5.6 per cent, while Education declined 2.5 per cent.
In 2012, visitor nights increased 5.9 per cent to 218 million while expenditure increased 2.2 per cent to $28 billion.
2 The figures are based on the data on “Overseas Arrivals and Departures” (OAD) monthly published by the Australian Bureau of Statistics, which is slightly different from the historical data used in the TFC tourism forecasts. These data are sourced from the Department of Immigration Citizenship unpublished data on overseas arrivals and departures.

16
Domestic and outbound tourism forecasts
Domestic tourism forecasts
Since the Global Financial Crisis, domestic travel has consistently shown signs of resilience in the face of many challenges including the persistently higher Australian dollar, lower consumer discretionary spending, and natural disasters, such as cyclones and floods. Overnight trips for the first half of the 2012–13 financial year grew by 2.5 per cent, a rate stronger than previously expected (with 2012–13 previous forecast set at 2.1 per cent).
Double digit growth in domestic air capacities in 2012–13 provides further support for sustained domestic travel growth. In addition, marketing activities by government and industry, at various levels and various forms, will provide a positive environment for the domestic sector.
It is anticipated that this momentum will continue throughout the rest of 2012–13 and the following year. Domestic visitor nights are now forecast to increase by 2.5 per cent to 285 million in 2012-13, and then by a further 1.2 per cent to 289 million in 2013–143. This compares to the previous forecast of 2.1 per cent for 2012–13 and 1.4 per cent for 2013–14 (refer Figure 1).
Apart from the higher-than-expected historical data, the upward revision of the forecast growth of domestic visitor nights for 2012–13 is also attributed to six consecutive interest rate reductions since late 2011, as well as the continued relatively low unemployment rate. By purpose, a more optimistic short-term outlook for 2012-13 is largely due to stronger growth in business travel and holiday travel than previously expected, and a shift away from outbound travel.
The longer-term outlook for domestic visitor nights is for growth of 1.0 per cent through to 2021-22. Domestic visitor nights are now expected to reach 307 million by 2021–22. This rate of growth is approximates the ABS’ population growth projections.
While overall the short-term and, to a lesser extent, long-term prospects for domestic visitor nights have improved, variability is still expected between different areas of Australia. These differences will be examined in the TFC regional forecasts to be released within four weeks of this publication.
3TRA reissued the previously published NVS publications for June and September 2012, leading to downward revisions for overnight trips, visitor nights, and overnight trips expenditure estimates for the year ending June and September 2012. The data revision has also contributed to the updating of domestic tourism forecasts in this forecasting round.

17
Total Domestic Tourism Expenditure (TDTE)4 is forecast to increase by 2.5 per cent to $70 billion in 2012–13, then by a further 1.4 per cent increase to $71 billion in 2013–14. In the longer term, domestic tourism expenditure is expected to record an average annual growth of 1.1 per cent and reach $77 billion by 2021–22.
Figure 1: Domestic tourism – history and forecast
Source: National Visitor Survey, 2012, Tourism Research Australia; Tourism Forecasting Committee Forecast 2013 Issue 1, Tourism Research Australia
4 The measures of Total Tourism Expenditure, TDTE and TITE are presented in real terms in this publication. All historical estimates and forecasts to 2021–22 for these measures are based on December 2012 dollars.

18
Outbound tourism forecasts
The forecast growth rate of outbound departures has been revised down to 4.1 per cent for 2012-13 and 4.7 per cent for 2013–14, from the previously forecast 6.9 per cent and 5.1 per cent for each year (refer Figure 2). The value of the Australian dollar is expected to remain relatively steady in the short term and continued expansion in aviation capacity to many key leisure outbound markets is expected. However, while sentiment remains rosy, it is expected to weaken as the 2013 Federal Election looms and with a rising unemployment rate, recent solid retail growth is likely to dissipate leaving Australians more likely to consider domestic travel in a more favourable light than compared to recent years.
The downward adjustment to outbound departures is partly attributed to observed changes in outbound travelling behaviour, characterised by the perception that the Australian dollar will continue at its current level. With this perception, Australian travellers tend to plan and spread outbound departures over a longer period of time, with travellers’ choice being likely tilted towards domestic travel in the short term. In the longer term, the average annual growth for outbound resident departures is now expected to be 2.9 per cent with departures reaching 10.8 million by 2021–22.
Figure 2: Short-term resident departures – history and forecast
Source: Australian Bureau of Statistics Overseas Arrivals and Departures, February 2013 (ABS Cat No 3401.0); Tourism Forecasting Committee Forecast 2013, Issue 1, Tourism Research Australia

19
Inbound tourism forecasts Inbound tourism forecast to grow modestly in short and medium term
As a result of higher than expected numbers for the first eight months of 2012–13, forecasts for visitor arrivals have been revised up from the previously forecast growth 2.3 per cent and 3.7 per cent in 2012–13 and 2013-14 to 4.6 per cent and 4.2 per cent (to 6.3 million and 6.5 million, respectively).
In 2012–13, by purpose, VFR is expected to increase 6.5 per cent followed by Holiday, up 5.4 per cent while Other and Business travel are expected to increase 2.4 per cent and 2.2 per cent respectively.
Driving the upward revisions is an improved economic outlook for the Asia-Pacific region (where 42 per cent of Australia’s inbound arrivals are sourced) coupled with increased air capacity. The Northeast Asian markets, North American and New Zealand markets are the major driving forces behind this upward adjustment. Partially offsetting these gains are downward adjustments to markets including the United Kingdom, South Korea and Indonesia.
China, Japan, Singapore and Malaysia have been revised up significantly. Inbound arrivals from Asia are expected to increase by 8.7 per cent to 2.7 million in 2012–13, and by a further 6.5 per cent to 2.9 million in 2013–14. China is expected to provide around one fifth of total growth in Total Tourism Expenditure (international and domestic).
Markets expected to experience strongest gains in visitor volumes in 2012–13 are China (15.9 per cent), Malaysia (13.9 per cent), Singapore (12.5 per cent) and India (7.5 per cent). By 2021–22, Asia's share of inbound arrivals is expected to increase from 42 per cent to 46 per cent. In contrast, combined inbound arrivals from elsewhere in the world are expected to demonstrate modest growth (1.7 per cent in 2012–13 and then 2.3 per cent in 2013-14).
The forecast for arrivals from North America has been upgraded. Inbound arrivals from the United States are forecast to grow 4.9 per cent and 3.1 per cent in 2012-13 and 2013-14 respectively (compared with the previously forecast 1.5 per cent in 2012-13 and 2.5 per cent in 2013-14).
Economic uncertainties in Europe remain the most significant downside risk to the forecast inbound arrivals. The outlook for inbound arrivals from Europe is mixed. Arrivals from the United Kingdom are forecast to decline by 2.0 per cent in 2012–13 before a likely increase to 1.3 per cent in 2013–14. When comparing revisions between forecast rounds, the United Kingdom has been revised down marginally with arrivals not expected to return to 2010–11 levels (632,000) until 2016-17. Arrivals from ‘Other Europe’ are forecast to record growth of 4.8 per cent in 2012–13 and a further 2.8 per cent in 2013–14.
In the longer term, average annual growth of 3.5 per cent in inbound arrivals is expected to reach 8.4 million by 2021–22. Growth is expected to be supported by a recovering global economy,

20
depreciating Australian dollar, softening in outbound demand providing supply opportunities for inbound arrivals, and increased investment in marketing activities by government tourism-promotion agencies.
Total Inbound Tourism Expenditure (TITE)5 is forecast to increase by 5.4 per cent to $29 billion in 2012–13. Longer term, and compared to domestic expenditure, inbound expenditure is forecast to grow at the faster average annual rate of 3.8 per cent to $40 billion in 2021–22 (compared to 1.1 per cent to $77 billion).
Figure 3: International visitor arrivals – history and forecast
Source: Australian Bureau of Statistics Overseas Arrivals and Departures, February 2013 (ABS Cat No 3401.0); Tourism Forecasting Committee Forecast 2013, Issue 1, Tourism Research Australia
5 The measures of Total Tourism Expenditure, TDTE and TITE are presented in real terms in this publication. As a result, all historical estimates and forecasts to 2021–22 for these measures are shown in December 2012 dollars.

21
Uncertainties and risks The Tourism Forecasting Committee Forecast 2013, Issue 1 is based on latest information available to Tourism Research Australia’s Tourism Forecasting Unit (such as macroeconomic, aviation, and accommodation forecasts as well as leading sentiment indices). As with all industries (and forecasts), tourism forecasts are exposed to external shocks, therefore providing risks that may drive both assumptions and tourism forecasts, either upward or downward.
The global economy remains fragile. Upside risks for a range of individual markets and Asia as a region remain. However, the TFC is more optimistic regarding a possible economic recovery in the United States, especially in housing and job markets. This could lift expectations of the US economic growth, and any additional measures by the new Chinese leadership to further spur its domestic economy could constitute a boon to higher world economic growth.
The short-term effects of the monetary easing that is occurring in Japan and the Euro zone could be better and faster than expected, enhancing the chance of a more speedy recovery of the world economy. In such a scenario, monetary policies in these countries or regions would tend to be tightened up earlier than expected, resulting in appreciation of home currencies and a favourable exchange rate of the Australian dollar against these currencies, benefiting Australian inbound tourism. In such a case, upside risks are attached to the forecasts of inbound tourism but caution is encouraged..
If any particular region was to be identified as posing significant risk to these forecasts, it is Europe. The TFC notes that if sustained declines in volumes, or visitors, were to occur, a greater effect on the value may be due to the likelihood of both lower average length of stay and lower expenditure per day.
On the domestic economy, however, the risks centre around a cautious consumer sentiment, which is likely to get worse as the September 2013 Federal Election looms. The possibility of an improved global economy could result in higher demand for commodities, therefore driving up prices and exerting further upward pressure on the Australian dollar. The wider economy should benefit as such demand would trigger increased investment in the resources and energy sectors. However, it is unclear whether household expenditure would increase. Due to the rising unemployment rate the Reserve Bank may have some wriggle room to adjust rates.
With the delivery of the Boeing 787 (Dreamliner) in doubt and in-progress bilateral air agreements being uncertain, downside risks could be attached to the forecasts. In particular, air capacities-both to and from Singapore and Malaysia are downside risks. Providing upside opportunities, arrivals from India (especially travel for the VFR sector) would be significantly boosted if the direct flights between India and Australia are resumed in 2013–14.

22
Table 2 Domestic tourism Business Holiday VFRa Other Visitor nights Total Overnight Trip Day Trip TDTEb TDTE
Total change change change Expenditure Expenditure (real) change('000) per cent ('000) per cent ('000) per cent $million $million $million per cent
2000-01 43 789 148 927 85 003 13 909 291 628 73 820 152 765 52 991 17 444 70 4352001-02 43 182 144 077 87 344 14 139 288 742 -1.0 75 048 1.7 142 304 -6.8 51 959 15 486 67 445 -4.2
2002-03 46 324 143 395 97 820 14 716 302 255 4.7 75 217 0.2 143 261 0.7 53 744 15 739 69 482 3.0
2003-04 41 767 140 202 101 585 12 318 295 872 -2.1 74 357 -1.1 137 899 -3.7 51 001 14 960 65 961 -5.1
2004-05 40 506 139 616 95 910 13 660 289 692 -2.1 72 178 -2.9 131 154 -4.9 50 685 14 481 65 166 -1.2
2005-06 41 356 136 270 88 889 13 879 280 394 -3.2 71 934 -0.3 131 602 0.3 51 607 15 241 66 849 2.6
2006-07 43 517 142 796 89 318 13 502 289 133 3.1 73 766 2.5 139 539 6.0 53 074 16 375 69 449 3.9
2007-08 42 158 143 736 86 582 13 015 285 491 -1.3 73 528 -0.3 140 745 0.9 54 042 16 357 70 398 1.4
2008-09 37 261 134 033 81 362 10 750 263 406 -7.7 68 536 -6.8 144 725 2.8 49 737 16 436 66 173 -6.0
2009-10 37 987 132 594 80 882 12 798 264 261 0.3 68 144 -0.6 155 075 7.2 49 634 17 151 66 786 0.9
2010-11 40 535 132 236 79 687 13 778 266 236 0.7 70 977 4.2 156 286 0.8 48 646 15 815 64 461 -3.5
2011-12 43 140 132 567 88 809 13 832 278 348 4.5 73 368 3.4 168 845 8.0 50 843 17 899 68 742 6.6
2012-13 45 556 135 262 91 029 13 362 285 209 2.5 75 498 2.9 176 928 4.8 51 784 18 671 70 454 2.5
2013-14 46 986 135 883 92 516 13 240 288 626 1.2 76 641 1.5 178 132 0.7 52 623 18 833 71 455 1.4
2014-15 47 872 136 610 93 693 13 266 291 441 1.0 77 629 1.3 179 144 0.6 53 315 18 913 72 228 1.1
2015-16 48 431 137 245 94 761 13 426 293 863 0.8 78 499 1.1 180 089 0.5 53 909 18 994 72 903 0.9
2016-17 48 896 138 063 95 709 13 525 296 192 0.8 79 168 0.9 180 950 0.5 54 494 19 059 73 553 0.9
2017-18 49 316 138 906 96 599 13 595 298 415 0.8 79 796 0.8 181 777 0.5 55 063 19 126 74 189 0.9
2018-19 49 691 139 937 97 391 13 659 300 679 0.8 80 430 0.8 182 609 0.5 55 647 19 187 74 834 0.9
2019-20 50 069 140 917 98 190 13 724 302 900 0.7 81 053 0.8 183 445 0.5 56 224 19 252 75 476 0.9
2020-21 50 449 141 919 98 996 13 789 305 153 0.7 81 653 0.7 184 287 0.5 56 800 19 340 76 141 0.9
2021-22 50 833 142 950 99 808 13 855 307 446 0.8 82 309 0.8 185 135 0.5 57 403 19 429 76 832 0.9
Compound annual
growth rate (%)
2001/02-2006/07 0.2 -0.2 0.4 -0.9 0.0 - -0.3 - -0.4 - 0.4 1.1 0.6 -
2006/07-2011/12 -0.2 -1.5 -0.1 0.5 -0.8 - -0.1 - 3.9 - -0.9 1.8 -0.2 -
2011/12-2016/17 2.5 0.8 1.5 -0.4 1.3 - 1.5 - 1.4 - 1.4 1.3 1.4 -
2016/17-2021/22 0.8 0.7 0.8 0.5 0.7 - 0.8 - 0.5 - 1.0 0.4 0.9 -
2001/02-2011/12 0.0 -0.8 0.2 -0.2 -0.4 - -0.2 - 1.7 - -0.2 1.5 0.2 -
2011/12-2021/22 1.7 0.8 1.2 0.0 1.0 - 1.2 - 0.9 - 1.2 0.8 1.1 -a Visiting friends and relativesb Total Domestic Tourism Expenditure (TDTE) including the expedniture in domestic day trip and overnight trip (real base = Quarter 4 2012)
Overnight Trips Day Trips
23
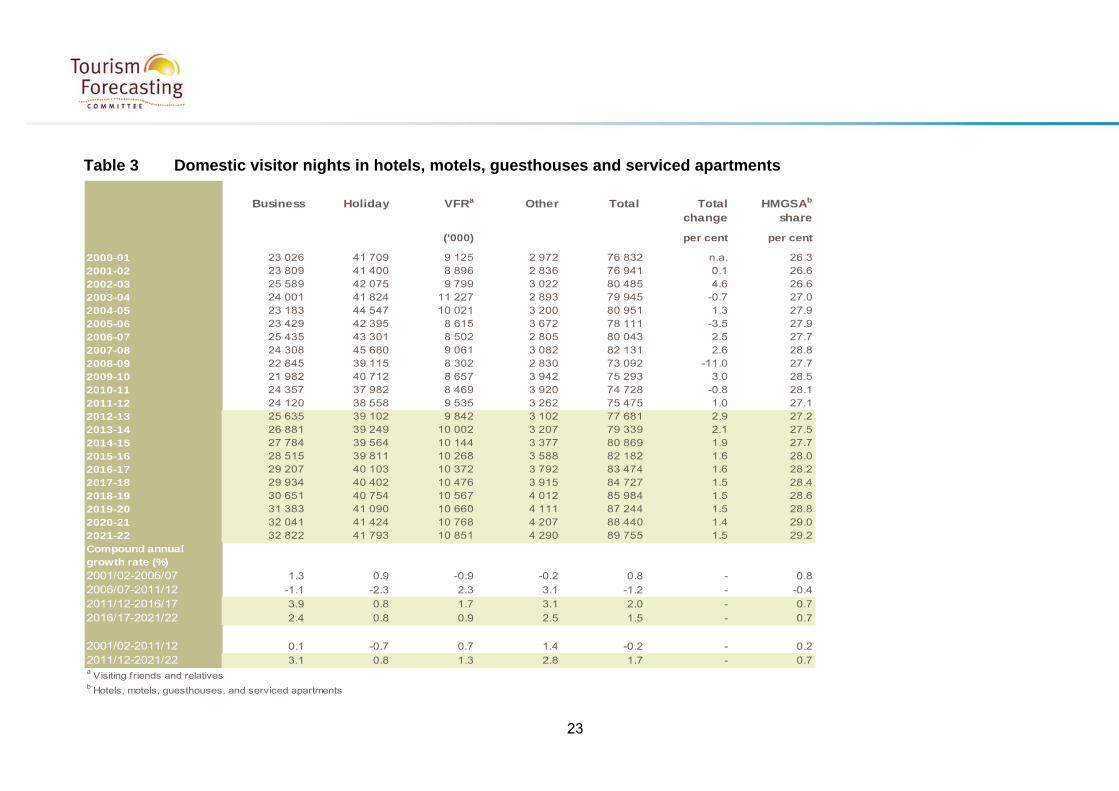
Table 3 Domestic visitor nights in hotels, motels, guesthouses and serviced apartments
Business Holiday VFRa Other Total Total HMGSAb
change share
('000) per cent per cent
2000-01 23 026 41 709 9 125 2 972 76 832 n.a. 26.32001-02 23 809 41 400 8 896 2 836 76 941 0.1 26.62002-03 25 589 42 075 9 799 3 022 80 485 4.6 26.62003-04 24 001 41 824 11 227 2 893 79 945 -0.7 27.02004-05 23 183 44 547 10 021 3 200 80 951 1.3 27.92005-06 23 429 42 395 8 615 3 672 78 111 -3.5 27.92006-07 25 435 43 301 8 502 2 805 80 043 2.5 27.72007-08 24 308 45 680 9 061 3 082 82 131 2.6 28.82008-09 22 845 39 115 8 302 2 830 73 092 -11.0 27.72009-10 21 982 40 712 8 657 3 942 75 293 3.0 28.52010-11 24 357 37 982 8 469 3 920 74 728 -0.8 28.12011-12 24 120 38 558 9 535 3 262 75 475 1.0 27.12012-13 25 635 39 102 9 842 3 102 77 681 2.9 27.22013-14 26 881 39 249 10 002 3 207 79 339 2.1 27.52014-15 27 784 39 564 10 144 3 377 80 869 1.9 27.72015-16 28 515 39 811 10 268 3 588 82 182 1.6 28.02016-17 29 207 40 103 10 372 3 792 83 474 1.6 28.22017-18 29 934 40 402 10 476 3 915 84 727 1.5 28.42018-19 30 651 40 754 10 567 4 012 85 984 1.5 28.62019-20 31 383 41 090 10 660 4 111 87 244 1.5 28.82020-21 32 041 41 424 10 768 4 207 88 440 1.4 29.02021-22 32 822 41 793 10 851 4 290 89 755 1.5 29.2Compound annual growth rate (%)2001/02-2006/07 1.3 0.9 -0.9 -0.2 0.8 - 0.8
2006/07-2011/12 -1.1 -2.3 2.3 3.1 -1.2 - -0.4
2011/12-2016/17 3.9 0.8 1.7 3.1 2.0 - 0.7
2016/17-2021/22 2.4 0.8 0.9 2.5 1.5 - 0.7
2001/02-2011/12 0.1 -0.7 0.7 1.4 -0.2 - 0.2
2011/12-2021/22 3.1 0.8 1.3 2.8 1.7 - 0.7a Visiting friends and relativesb Hotels, motels, guesthouses, and serviced apartments

24
Table 4 Short-term resident departures by market, financial year
New United United Hong Other Other TotalBusiness VFR Holiday Other Total Zealand States Kingdom Indonesia Kong Singapore Thailand Malaysia Fiji China Asia Europe Other Total change
'000 '000 per cent
2000-01 724 919 1 584 228 3 577 575 373 323 295 157 154 158 135 70 101 371 410 456 3 577 n.a.
2001-02 674 827 1 468 214 3 368 592 276 308 271 142 163 163 110 113 121 363 374 371 3 368 -5.9
2002-03 655 861 1 385 214 3 293 615 288 309 194 115 119 150 98 129 118 377 385 396 3 293 -2.2
2003-04 779 1 028 1 744 232 3 937 739 342 351 271 140 148 154 126 161 150 454 436 462 3 937 19.5
2004-05 864 1 170 2 143 245 4 591 843 395 385 344 173 176 187 156 189 214 533 495 502 4 591 16.6
2005-06 907 1 217 2 272 258 4 835 836 438 409 242 191 205 246 164 200 240 566 547 550 4 835 5.3
2006-07 948 1 261 2 470 270 5 127 883 451 415 231 200 208 332 172 194 269 631 562 579 5 127 6.0
2007-08 983 1 344 2 891 283 5 699 913 492 430 328 215 224 403 186 224 287 720 627 650 5 699 11.2
2008-09 880 1 444 3 043 287 5 843 955 501 420 436 200 214 378 205 221 268 754 591 700 5 843 2.5
2009-10 923 1 642 3 721 289 6 770 1 064 635 456 653 211 246 432 239 286 306 853 644 745 6 770 15.9
2010-11 1 013 1 688 4 195 317 7 443 1 058 751 477 806 223 276 487 255 323 356 927 721 783 7 443 9.9
2011-12 1 033 1 816 4 619 328 8 037 1 117 820 487 911 229 287 600 257 339 381 1 022 780 807 8 037 8.0
2012-13 1 047 1 943 4 797 336 8 367 1 108 899 490 921 226 324 637 266 323 385 1 065 818 904 8 367 4.1
2013-14 1 102 2 019 5 044 344 8 760 1 150 936 497 961 234 341 661 285 341 427 1 134 885 909 8 760 4.7
2014-15 1 140 2 109 5 224 356 9 090 1 178 964 521 988 241 353 680 296 352 455 1 196 929 938 9 090 3.8
2015-16 1 177 2 180 5 344 370 9 341 1 201 984 534 1 008 247 364 696 302 359 480 1 250 954 961 9 341 2.8
2016-17 1 215 2 244 5 446 384 9 569 1 221 1 003 537 1 027 253 373 711 309 366 505 1 302 978 984 9 569 2.4
2017-18 1 252 2 309 5 551 399 9 803 1 238 1 020 547 1 044 258 383 726 316 373 531 1 354 1 006 1 007 9 803 2.4
2018-19 1 290 2 374 5 652 414 10 033 1 254 1 035 557 1 060 264 392 739 323 380 556 1 407 1 033 1 031 10 033 2.4
2019-20 1 327 2 435 5 757 431 10 265 1 270 1 051 568 1 076 270 401 753 331 388 581 1 463 1 059 1 056 10 265 2.3
2020-21 1 365 2 496 5 864 449 10 502 1 287 1 067 579 1 092 276 410 766 338 395 606 1 520 1 085 1 081 10 502 2.3
2021-22 1 404 2 558 5 974 467 10 745 1 303 1 083 590 1 109 282 420 780 346 402 631 1 580 1 112 1 107 10 745 2.3
Compound annual growth rate (%)2001/02-2006/07 7.0 8.8 11.0 4.7 8.8 8.3 10.3 6.1 -3.1 7.1 5.0 15.2 9.5 11.3 17.2 11.7 8.5 9.3 8.8 -
2006/07-2011/12 1.7 7.6 13.3 4.0 9.4 4.8 12.7 3.2 31.5 2.7 6.6 12.6 8.3 11.9 7.2 10.1 6.8 6.9 9.4 -
2011/12-2016/17 3.3 4.3 3.3 3.2 3.6 1.8 4.1 2.0 2.4 2.0 5.4 3.5 3.7 1.6 5.8 5.0 4.6 4.0 3.6 -
2016/17-2021/22 2.9 2.7 1.9 4.0 2.3 1.3 1.5 1.9 1.5 2.2 2.4 1.9 2.3 1.9 4.6 4.0 2.6 2.4 2.3 -
2001/02-2011/12 4.4 8.2 12.1 4.4 9.1 6.6 11.5 4.7 12.9 4.9 5.8 13.9 8.9 11.6 12.1 10.9 7.6 8.1 9.1 -
2011/12-2021/22 3.1 3.5 2.6 3.6 2.9 1.6 2.8 1.9 2.0 2.1 3.9 2.7 3.0 1.7 5.2 4.5 3.6 3.2 2.9 -
Numbers shaded are forecastsThe sum of purpose of visit categories does not add to the total as the total includes estimates for those not reporting a purpose of visit to overseas
Purpose of visit

25
Table 5 International visitor arrivals by market, financial year New United United South Hong Middle Other Other South Other Total Total
Zealand Japan Kingdom States China S'pore Korea Malaysia Kong Germany India Indonesia Thailand East Asia France Ireland Europe Canada Africa World change
per cent
2000-01 828 724 605 502 143 293 165 148 154 148 46 98 78 57 206 54 50 356 96 56 223 5 031 n.a.
2001-02 788 659 627 424 172 296 181 154 149 137 47 95 80 56 174 52 51 303 93 56 175 4 768 -5.2
2002-03 793 659 644 424 177 262 196 142 141 134 41 87 76 50 149 46 47 297 87 48 158 4 656 -2.4
2003-04 926 688 686 430 217 253 216 175 132 141 54 91 79 56 180 57 54 306 93 55 167 5 057 8.6
2004-05 1 082 701 699 446 274 267 237 169 149 142 59 82 79 68 185 59 57 323 103 50 176 5 408 6.9
2005-06 1 091 674 709 453 292 252 243 153 159 150 79 82 75 73 190 66 60 333 106 55 190 5 484 1.4
2006-07 1 115 610 733 455 338 263 271 157 153 149 88 85 77 83 200 70 63 348 111 60 210 5 641 2.9
2007-08 1 121 521 686 455 375 267 236 166 147 155 108 93 84 93 207 78 69 358 121 66 224 5 629 -0.2
2008-09 1 106 404 659 452 358 278 193 195 150 159 120 96 77 105 230 89 67 363 121 64 255 5 541 -1.6
2009-10 1 123 364 653 489 394 290 196 214 154 163 130 118 83 111 237 97 59 370 125 61 259 5 692 2.7
2010-11 1 183 364 632 466 500 315 205 244 170 159 144 133 88 114 235 94 53 363 119 62 264 5 907 3.8
2011-12 1 191 344 597 464 583 320 199 243 169 152 152 142 81 114 251 96 62 362 119 63 276 5 981 1.2
2012-13 1 211 351 585 487 676 360 189 277 183 156 164 147 85 114 269 99 62 380 120 57 284 6 257 4.6
2013-14 1 231 365 593 502 746 377 194 302 189 158 176 157 89 119 283 102 64 390 124 60 295 6 517 4.2
2014-15 1 259 374 605 519 801 390 201 314 196 164 191 169 93 127 297 107 67 405 130 63 307 6 779 4.0
2015-16 1 291 380 620 540 847 402 209 324 201 170 205 179 97 136 311 112 69 419 135 66 319 7 032 3.7
2016-17 1 318 386 635 560 890 411 216 334 207 175 220 189 100 145 324 116 71 433 139 69 330 7 271 3.4
2017-18 1 343 391 649 579 927 421 224 344 211 180 236 199 104 155 337 120 73 447 144 72 341 7 496 3.1
2018-19 1 368 395 663 599 965 430 231 354 216 186 252 209 107 165 350 124 75 460 148 75 353 7 725 3.1
2019-20 1 392 400 677 619 1 005 439 238 364 221 191 269 220 111 176 363 129 77 474 153 78 364 7 959 3.0
2020-21 1 417 404 691 639 1 044 449 246 374 226 196 287 231 114 188 377 133 79 489 157 81 376 8 198 3.0
2021-22 1 441 408 706 660 1 085 458 253 384 231 202 306 242 118 200 391 138 81 503 162 84 388 8 441 3.0
2001/02-2006/07 7.2 -1.5 3.2 1.4 14.5 -2.3 8.4 0.4 0.6 1.7 13.2 -2.1 -0.7 8.2 2.9 6.1 4.6 2.8 3.5 1.6 3.7 3.4 -
2006/07-2011/12 1.3 -10.8 -4.0 0.4 11.5 3.9 -5.9 9.1 2.0 0.4 11.6 10.7 1.0 6.6 4.6 6.5 -0.4 0.8 1.5 0.8 5.6 1.2 -
2011/12-2016/17 2.0 2.3 1.2 3.8 8.8 5.2 1.7 6.6 4.1 2.9 7.6 6.0 4.4 5.0 5.2 3.9 2.8 3.6 3.1 1.9 3.7 4.0 -
2016/17-2021/22 1.8 1.1 2.1 3.4 4.1 2.2 3.2 2.8 2.3 2.9 6.8 5.1 3.2 6.6 3.8 3.5 2.5 3.0 3.1 4.0 3.3 3.0 -
2001/02-2011/12 4.2 -6.3 -0.5 0.9 13.0 0.8 1.0 4.7 1.3 1.0 12.4 4.1 0.1 7.4 3.7 6.3 2.1 1.8 2.5 1.2 4.6 2.3 -
2011/12-2021/22 1.9 1.7 1.7 3.6 6.4 3.7 2.4 4.7 3.2 2.9 7.2 5.5 3.8 5.8 4.5 3.7 2.6 3.3 3.1 2.9 3.5 3.5 -
Numbers shaded are forecasts.
'000
Compound annual growth rate (%)

26
Table 6 International visitor arrivals by purpose of visit, financial year
Business VFRa Holiday Otherb Total Total
change
'000 per cent
2000-01 611 1 021 2 693 513 5 031 n.a.
2001-02 564 855 2 296 477 4 768 -5.2
2002-03 556 865 2 361 473 4 656 -2.4
2003-04 636 986 2 603 558 5 057 8.6
2004-05 679 1 098 2 866 528 5 408 6.9
2005-06 766 1 109 2 895 621 5 484 1.4
2006-07 824 1 153 2 896 668 5 641 2.9
2007-08 849 1 201 2 754 714 5 629 -0.2
2008-09 766 1 283 2 604 771 5 541 -1.6
2009-10 785 1 392 2 608 780 5 692 2.7
2010-11 852 1 430 2 657 823 5 907 3.8
2011-12 882 1 467 2 642 841 5 981 1.2
2012-13 901 1 562 2 785 861 6 257 4.6
2013-14 936 1 622 2 911 904 6 517 4.2
2014-15 970 1 683 3 025 955 6 779 4.0
2015-16 1 000 1 742 3 135 1 009 7 032 3.7
2016-17 1 027 1 798 3 239 1 061 7 271 3.4
2017-18 1 054 1 851 3 334 1 111 7 496 3.1
2018-19 1 080 1 905 3 432 1 163 7 725 3.1
2019-20 1 106 1 960 3 531 1 217 7 959 3.0
2020-21 1 132 2 016 3 632 1 273 8 198 3.0
2021-22 1 158 2 073 3 735 1 330 8 441 3.0
Compound annual
growth rate (%)
2001/02-2006/07 7.9 6.2 4.7 7.0 3.4 -
2006/07-2011/12 1.4 4.9 -1.8 4.7 1.2 -
2011/12-2016/17 3.1 4.1 4.2 4.8 4.0 -
2016/17-2021/22 2.4 2.9 2.9 4.6 3.0 -
2001/02-2011/12 4.6 5.6 1.4 5.8 2.3 -
2011/12-2021/22 2.8 3.5 3.5 4.7 3.5 -
Numbers shaded are forecastsa Visiting friends and relativesb Other refers to education and employment visitors who stay in Australia for one year or lessThe sum of purpose of visit categories does not add to the total as the total includes estimates for those not reporting a purpose of visit to Australia.

27
Table 7 International leisure visitor arrivals by market, financial year
New United United South Hong Middle Other Other South Other Total TotalZealand Japan Kingdom States China S'pore Korea Malaysia Kong Germany India Indonesia Thailand East Asia France Ireland Europe Canada Africa World change
per cent
2000-01 608 623 512 331 76 221 120 113 114 118 24 60 51 41 138 34 41 251 73 37 128 3 713 n.a.
2001-02 516 436 496 254 90 186 120 107 100 103 24 52 45 37 106 31 39 207 67 35 100 3 151 -15.1
2002-03 529 534 522 249 93 171 140 100 94 103 20 50 40 33 90 29 37 207 63 30 92 3 226 2.4
2003-04 653 575 566 246 116 170 161 130 93 104 26 54 45 39 122 32 44 211 69 35 99 3 589 11.2
2004-05 774 605 603 288 149 184 183 122 106 110 31 48 43 47 130 40 48 236 79 32 105 3 964 10.4
2005-06 765 581 620 292 166 160 185 109 113 118 38 48 41 51 135 48 51 249 82 37 112 4 004 1.0
2006-07 782 516 642 285 199 161 205 108 104 115 42 49 41 55 134 50 53 259 83 41 125 4 049 1.1
2007-08 770 435 595 275 223 160 176 116 97 119 52 51 45 59 134 56 58 263 91 46 133 3 955 -2.3
2008-09 770 330 570 286 222 173 137 140 103 121 57 56 40 66 149 63 53 263 90 46 149 3 887 -1.7
2009-10 793 296 562 314 232 180 141 155 102 125 67 72 45 66 150 71 47 278 96 45 161 3 999 2.9
2010-11 824 290 533 289 308 191 153 178 115 122 74 81 47 69 142 69 39 268 89 43 164 4 087 2.2
2011-12 828 268 490 284 385 191 147 177 115 115 84 88 44 65 155 70 43 262 88 44 169 4 109 0.6
2012-13 841 271 478 306 465 229 140 209 129 119 94 93 46 64 171 71 42 273 89 41 174 4 347 5.8
2013-14 852 283 483 315 522 241 144 231 133 121 103 101 48 67 181 73 43 280 92 43 179 4 533 4.3
2014-15 870 290 492 327 559 248 149 239 137 125 111 108 50 71 191 77 45 291 96 45 187 4 708 3.9
2015-16 892 295 505 341 589 252 155 246 141 129 119 115 53 77 200 80 47 302 100 48 194 4 877 3.6
2016-17 912 299 517 356 616 256 160 252 144 133 127 121 55 82 209 83 48 312 103 50 201 5 037 3.3
2017-18 930 303 529 370 638 260 165 259 147 137 135 127 57 88 217 86 49 323 107 52 208 5 186 3.0
2018-19 948 307 540 384 661 263 170 265 149 140 144 134 59 94 226 89 51 334 110 55 214 5 337 2.9
2019-20 966 310 552 399 684 267 175 272 152 144 153 140 61 101 235 92 52 345 113 57 221 5 491 2.9
2020-21 985 314 564 414 707 270 181 279 155 148 162 147 63 108 244 95 53 356 117 60 228 5 648 2.9
2021-22 1 003 317 575 429 730 274 186 285 158 152 172 154 66 115 253 98 55 367 120 62 235 5 807 2.8
2001/02-2006/07 8.7 3.4 5.3 2.4 17.2 -2.9 11.3 0.2 0.8 2.3 12.0 -1.2 -1.9 8.0 4.7 10.2 6.2 4.5 4.5 3.1 4.6 5.1 -
2006/07-2011/12 1.1 -12.3 -5.3 -0.1 14.2 3.5 -6.5 10.4 1.9 0.0 14.9 12.4 1.4 3.7 2.9 6.9 -4.3 0.2 1.0 1.2 6.3 0.3 -
2011/12-2016/17 2.0 2.2 1.1 4.7 9.8 6.1 1.7 7.3 4.6 2.9 8.6 6.6 4.6 4.7 6.2 3.5 2.4 3.6 3.3 2.7 3.5 4.2 -
2016/17-2021/22 1.9 1.2 2.2 3.8 3.5 1.4 3.1 2.5 1.9 2.7 6.3 4.9 3.7 6.9 3.9 3.4 2.6 3.3 3.1 4.5 3.2 2.9 -
2001/02-2011/12 4.8 -4.8 -0.1 1.1 15.7 0.2 2.0 5.2 1.4 1.1 13.4 5.4 -0.3 5.8 3.8 8.5 0.8 2.4 2.8 2.2 5.4 2.7 -
2011/12-2021/22 1.9 1.7 1.6 4.2 6.6 3.7 2.4 4.9 3.2 2.8 7.5 5.8 4.1 5.8 5.0 3.5 2.5 3.4 3.2 3.6 3.4 3.5 -
Numbers shaded are forecasts
'000
Compound annual growth rate (%)

28
Table 8 International visitor nights by market, financial year
New Japan United United China Singapore South Malaysia Hong Germany India Indonesia Thailand Middle Other France Ireland Other Canada South Other Total TotalZealand Kingdom States Korea Kong East Asia Europe Africa World change
per cent
2000-01 13.8 8.8 24.7 11.1 4.0 5.5 6.3 3.6 3.7 4.6 2.3 3.7 3.0 2.3 5.7 1.4 3.4 13.2 4.7 1.4 5.5 133 n.a.
2001-02 11.1 8.9 24.3 11.3 5.2 4.9 6.1 3.5 3.9 5.5 1.8 3.0 2.4 2.7 4.8 1.9 3.5 12.2 4.0 1.2 3.9 126 -5.0
2002-03 11.0 8.7 23.7 11.3 7.1 4.7 5.6 3.3 3.4 4.7 1.9 2.7 2.6 1.9 4.3 1.7 2.5 10.9 3.1 1.5 4.1 121 -4.2
2003-04 12.6 10.9 28.1 10.3 9.1 4.6 6.3 4.5 3.7 6.5 1.7 3.8 2.5 2.4 4.5 2.5 2.9 10.8 3.5 1.7 4.0 137 13.4
2004-05 14.0 10.7 23.2 9.6 10.9 4.5 7.2 4.5 3.3 5.7 2.3 2.8 2.9 2.2 5.3 1.9 3.5 11.5 4.1 1.5 4.1 136 -0.9
2005-06 15.8 11.7 23.7 10.4 11.9 4.9 10.2 5.0 4.5 6.7 3.5 2.8 3.0 3.0 6.8 2.3 3.6 12.6 4.1 1.7 5.2 153 12.8
2006-07 15.8 12.0 24.4 10.2 15.3 5.3 12.7 5.3 4.5 6.9 4.4 3.1 3.2 3.4 7.6 3.7 3.7 13.6 4.5 1.7 6.0 167 9.3
2007-08 15.6 10.4 22.2 9.7 15.9 5.3 11.5 5.6 4.5 7.1 5.7 3.3 3.2 4.1 9.7 3.6 3.8 14.4 4.8 1.5 7.4 170 1.4
2008-09 15.3 8.7 23.4 9.6 17.7 5.5 13.8 6.7 4.8 7.5 7.4 3.3 3.8 4.4 12.3 4.7 4.1 14.3 5.3 1.9 9.0 183 8.0
2009-10 14.3 7.9 23.8 10.7 22.5 6.1 14.6 6.6 5.5 7.4 8.0 4.5 3.9 4.8 13.4 5.3 4.1 14.4 4.4 1.8 8.5 192 5.0
2010-11 16.4 8.4 22.6 10.4 25.8 6.1 13.4 7.0 5.3 6.9 9.7 5.2 4.4 5.2 14.0 5.2 3.7 14.5 4.5 1.9 9.3 200 4.0
2011-12 16.7 9.0 21.7 10.8 26.9 6.3 13.3 6.9 5.9 7.3 8.9 4.5 4.2 4.7 17.6 5.8 5.1 16.0 4.6 2.0 9.8 208 3.8
2012-13 17.2 9.2 22.7 11.0 31.0 7.4 12.1 8.0 6.4 7.5 10.0 4.9 4.3 4.7 17.6 5.9 5.1 16.5 4.5 1.8 10.4 218 5.1
2013-14 17.1 9.3 21.6 10.8 34.2 7.8 12.2 9.1 6.0 7.7 10.9 5.4 4.2 5.1 18.4 6.0 5.2 16.5 4.6 1.8 10.5 224 2.7
2014-15 17.9 9.4 21.2 11.0 37.2 8.0 13.0 9.7 6.0 7.9 11.6 5.8 4.4 5.4 19.0 6.2 5.3 17.2 4.8 1.9 11.0 234 4.3
2015-16 17.6 9.4 21.5 11.5 39.6 8.2 13.8 10.2 6.2 8.2 12.2 6.3 4.5 5.9 20.4 6.4 5.3 18.1 5.0 2.0 11.8 244 4.4
2016-17 17.9 9.5 22.1 11.9 42.7 8.4 14.6 10.7 6.5 8.3 13.0 6.7 4.7 6.4 21.6 6.6 5.3 18.8 5.1 2.1 12.4 255 4.5
2017-18 18.2 9.5 22.5 12.4 45.0 8.6 15.4 11.2 6.7 8.4 13.7 7.1 4.9 6.9 22.7 6.8 5.4 19.5 5.3 2.2 13.0 265 3.9
2018-19 18.5 9.5 22.9 12.8 47.5 8.8 16.2 11.7 6.9 8.6 14.5 7.5 5.1 7.4 24.0 7.0 5.4 20.1 5.4 2.3 13.7 276 3.9
2019-20 18.8 9.5 23.4 13.2 49.5 8.9 17.0 12.2 7.2 8.7 15.3 7.9 5.3 8.0 25.3 7.2 5.4 20.8 5.6 2.4 14.3 286 3.7
2020-21 19.1 9.5 23.8 13.7 52.8 9.1 17.9 12.7 7.4 8.8 16.2 8.4 5.5 8.7 26.7 7.3 5.4 21.6 5.7 2.5 15.1 298 4.1
2021-22 19.4 9.5 24.4 14.1 55.5 9.3 18.8 13.3 7.7 9.0 17.1 8.9 5.7 9.3 28.1 7.5 5.4 22.3 5.9 2.6 15.8 309 3.9
2001/02-2006/07 7.4 6.0 0.0 -1.9 23.9 1.8 15.9 8.6 2.9 4.6 19.5 1.1 5.8 4.8 9.7 14.1 1.5 2.2 2.5 6.9 9.0 5.8 -
2006/07-2011/12 1.2 -5.6 -2.3 1.1 12.0 3.7 1.0 5.5 5.6 1.0 15.0 7.3 5.5 6.6 18.2 9.3 6.4 3.2 0.2 2.7 10.2 4.4 -
2011/12-2016/17 1.4 1.1 0.3 2.0 9.7 5.8 1.8 9.0 2.1 2.7 7.9 8.5 2.4 6.5 4.2 2.7 0.9 3.3 2.4 1.4 4.7 4.2 -
2016/17-2021/22 1.6 0.1 2.0 3.4 5.4 1.9 5.3 4.4 3.4 1.5 5.7 5.9 3.8 7.8 5.4 2.6 0.2 3.5 2.7 4.4 5.0 3.9 -
2001/02-2011/12 4.2 0.0 -1.1 -0.4 17.8 2.7 8.2 7.0 4.2 2.8 17.2 4.2 5.7 5.7 13.9 11.7 3.9 2.7 1.4 4.8 9.6 5.1 -
2011/12-2021/22 1.5 0.6 1.2 2.7 7.5 3.9 3.5 6.7 2.7 2.1 6.8 7.2 3.1 7.2 4.8 2.6 0.6 3.4 2.5 2.9 4.9 4.1 -
Numbers shaded are forecastsHistorical estimates for international visitor nights have changed due to a slight change in the methodology
million
Compound annual growth rate (%)
29
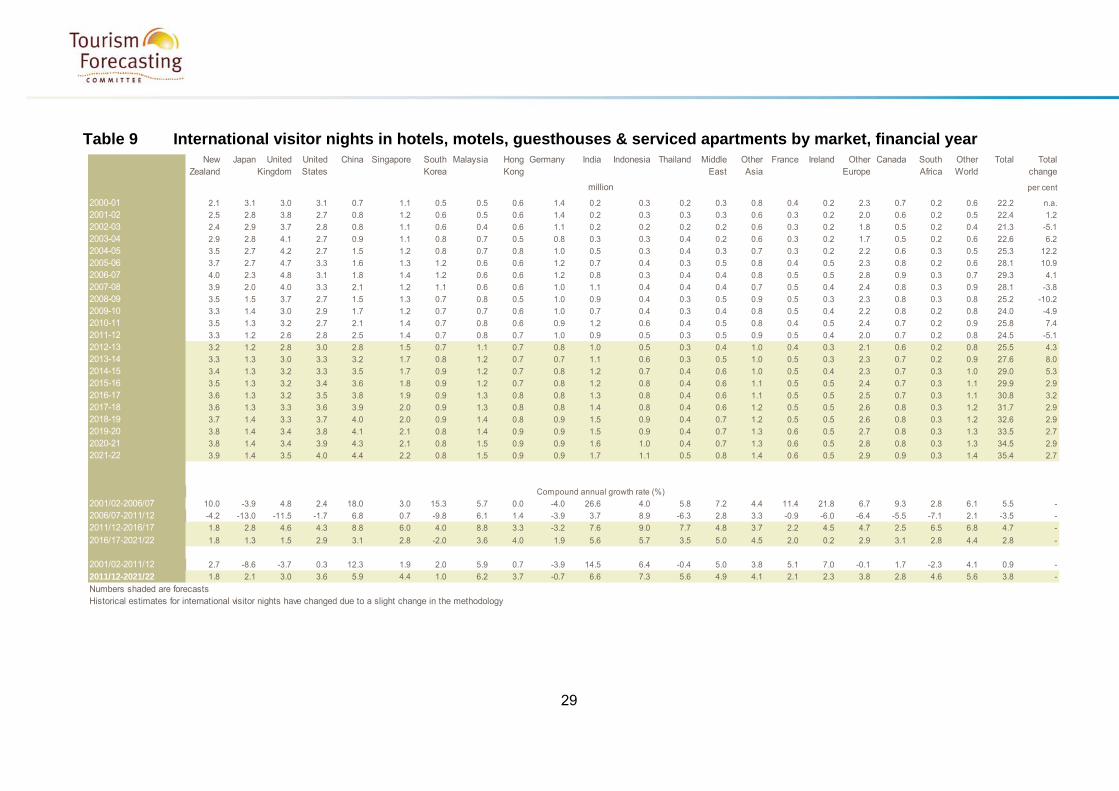
Table 9 International visitor nights in hotels, motels, guesthouses & serviced apartments by market, financial year
New Japan United United China Singapore South Malaysia Hong Germany India Indonesia Thailand Middle Other France Ireland Other Canada South Other Total TotalZealand Kingdom States Korea Kong East Asia Europe Africa World change
per cent
2000-01 2.1 3.1 3.0 3.1 0.7 1.1 0.5 0.5 0.6 1.4 0.2 0.3 0.2 0.3 0.8 0.4 0.2 2.3 0.7 0.2 0.6 22.2 n.a.
2001-02 2.5 2.8 3.8 2.7 0.8 1.2 0.6 0.5 0.6 1.4 0.2 0.3 0.3 0.3 0.6 0.3 0.2 2.0 0.6 0.2 0.5 22.4 1.2
2002-03 2.4 2.9 3.7 2.8 0.8 1.1 0.6 0.4 0.6 1.1 0.2 0.2 0.2 0.2 0.6 0.3 0.2 1.8 0.5 0.2 0.4 21.3 -5.1
2003-04 2.9 2.8 4.1 2.7 0.9 1.1 0.8 0.7 0.5 0.8 0.3 0.3 0.4 0.2 0.6 0.3 0.2 1.7 0.5 0.2 0.6 22.6 6.2
2004-05 3.5 2.7 4.2 2.7 1.5 1.2 0.8 0.7 0.8 1.0 0.5 0.3 0.4 0.3 0.7 0.3 0.2 2.2 0.6 0.3 0.5 25.3 12.2
2005-06 3.7 2.7 4.7 3.3 1.6 1.3 1.2 0.6 0.6 1.2 0.7 0.4 0.3 0.5 0.8 0.4 0.5 2.3 0.8 0.2 0.6 28.1 10.9
2006-07 4.0 2.3 4.8 3.1 1.8 1.4 1.2 0.6 0.6 1.2 0.8 0.3 0.4 0.4 0.8 0.5 0.5 2.8 0.9 0.3 0.7 29.3 4.1
2007-08 3.9 2.0 4.0 3.3 2.1 1.2 1.1 0.6 0.6 1.0 1.1 0.4 0.4 0.4 0.7 0.5 0.4 2.4 0.8 0.3 0.9 28.1 -3.8
2008-09 3.5 1.5 3.7 2.7 1.5 1.3 0.7 0.8 0.5 1.0 0.9 0.4 0.3 0.5 0.9 0.5 0.3 2.3 0.8 0.3 0.8 25.2 -10.22009-10 3.3 1.4 3.0 2.9 1.7 1.2 0.7 0.7 0.6 1.0 0.7 0.4 0.3 0.4 0.8 0.5 0.4 2.2 0.8 0.2 0.8 24.0 -4.9
2010-11 3.5 1.3 3.2 2.7 2.1 1.4 0.7 0.8 0.6 0.9 1.2 0.6 0.4 0.5 0.8 0.4 0.5 2.4 0.7 0.2 0.9 25.8 7.4
2011-12 3.3 1.2 2.6 2.8 2.5 1.4 0.7 0.8 0.7 1.0 0.9 0.5 0.3 0.5 0.9 0.5 0.4 2.0 0.7 0.2 0.8 24.5 -5.1
2012-13 3.2 1.2 2.8 3.0 2.8 1.5 0.7 1.1 0.7 0.8 1.0 0.5 0.3 0.4 1.0 0.4 0.3 2.1 0.6 0.2 0.8 25.5 4.32013-14 3.3 1.3 3.0 3.3 3.2 1.7 0.8 1.2 0.7 0.7 1.1 0.6 0.3 0.5 1.0 0.5 0.3 2.3 0.7 0.2 0.9 27.6 8.0
2014-15 3.4 1.3 3.2 3.3 3.5 1.7 0.9 1.2 0.7 0.8 1.2 0.7 0.4 0.6 1.0 0.5 0.4 2.3 0.7 0.3 1.0 29.0 5.3
2015-16 3.5 1.3 3.2 3.4 3.6 1.8 0.9 1.2 0.7 0.8 1.2 0.8 0.4 0.6 1.1 0.5 0.5 2.4 0.7 0.3 1.1 29.9 2.9
2016-17 3.6 1.3 3.2 3.5 3.8 1.9 0.9 1.3 0.8 0.8 1.3 0.8 0.4 0.6 1.1 0.5 0.5 2.5 0.7 0.3 1.1 30.8 3.22017-18 3.6 1.3 3.3 3.6 3.9 2.0 0.9 1.3 0.8 0.8 1.4 0.8 0.4 0.6 1.2 0.5 0.5 2.6 0.8 0.3 1.2 31.7 2.9
2018-19 3.7 1.4 3.3 3.7 4.0 2.0 0.9 1.4 0.8 0.9 1.5 0.9 0.4 0.7 1.2 0.5 0.5 2.6 0.8 0.3 1.2 32.6 2.9
2019-20 3.8 1.4 3.4 3.8 4.1 2.1 0.8 1.4 0.9 0.9 1.5 0.9 0.4 0.7 1.3 0.6 0.5 2.7 0.8 0.3 1.3 33.5 2.7
2020-21 3.8 1.4 3.4 3.9 4.3 2.1 0.8 1.5 0.9 0.9 1.6 1.0 0.4 0.7 1.3 0.6 0.5 2.8 0.8 0.3 1.3 34.5 2.92021-22 3.9 1.4 3.5 4.0 4.4 2.2 0.8 1.5 0.9 0.9 1.7 1.1 0.5 0.8 1.4 0.6 0.5 2.9 0.9 0.3 1.4 35.4 2.7
2001/02-2006/07 10.0 -3.9 4.8 2.4 18.0 3.0 15.3 5.7 0.0 -4.0 26.6 4.0 5.8 7.2 4.4 11.4 21.8 6.7 9.3 2.8 6.1 5.5 -
2006/07-2011/12 -4.2 -13.0 -11.5 -1.7 6.8 0.7 -9.8 6.1 1.4 -3.9 3.7 8.9 -6.3 2.8 3.3 -0.9 -6.0 -6.4 -5.5 -7.1 2.1 -3.5 -
2011/12-2016/17 1.8 2.8 4.6 4.3 8.8 6.0 4.0 8.8 3.3 -3.2 7.6 9.0 7.7 4.8 3.7 2.2 4.5 4.7 2.5 6.5 6.8 4.7 -
2016/17-2021/22 1.8 1.3 1.5 2.9 3.1 2.8 -2.0 3.6 4.0 1.9 5.6 5.7 3.5 5.0 4.5 2.0 0.2 2.9 3.1 2.8 4.4 2.8 -
2001/02-2011/12 2.7 -8.6 -3.7 0.3 12.3 1.9 2.0 5.9 0.7 -3.9 14.5 6.4 -0.4 5.0 3.8 5.1 7.0 -0.1 1.7 -2.3 4.1 0.9 -
2011/12-2021/22 1.8 2.1 3.0 3.6 5.9 4.4 1.0 6.2 3.7 -0.7 6.6 7.3 5.6 4.9 4.1 2.1 2.3 3.8 2.8 4.6 5.6 3.8 -
Numbers shaded are forecastsHistorical estimates for international visitor nights have changed due to a slight change in the methodology
Compound annual growth rate (%)
million

30
Table 10 International leisure visitor nights by market, financial year
New United United South Hong Middle Other Other South Other Total TotalZealand Japan Kingdom States China S'pore Korea Malaysia Kong Germany India Indonesia Thailand East Asia France Ireland Europe Canada Africa World change
per cent
2000-01 9.6 6.4 21.3 6.7 1.4 2.4 3.4 1.6 1.2 3.5 0.6 1.1 1.0 1.7 2.9 1.0 2.8 8.6 3.1 1.0 3.1 84.5 n.a.
2001-02 6.8 4.6 17.1 5.4 1.7 2.0 2.5 1.5 1.3 3.7 0.6 0.8 0.7 1.7 2.0 0.8 2.4 8.1 2.6 0.9 2.1 69.3 -18.0
2002-03 7.1 5.4 18.4 5.0 1.6 1.9 2.5 1.4 1.3 3.1 0.7 0.7 0.7 1.3 1.8 0.8 1.9 6.9 1.9 1.0 1.8 67.2 -3.0
2003-04 8.2 5.6 20.7 4.3 2.3 1.9 3.1 1.7 1.2 4.3 0.5 1.0 0.6 1.6 1.8 0.8 2.1 6.8 2.1 1.1 2.0 73.9 10.0
2004-05 9.9 6.7 19.7 4.9 3.2 1.9 3.4 1.7 1.4 4.1 0.6 0.8 0.8 1.6 2.2 1.2 2.5 7.8 3.0 1.1 2.1 80.5 8.9
2005-06 9.8 6.5 20.1 5.2 3.5 1.9 4.5 1.5 1.7 4.8 1.2 0.8 0.9 2.0 3.1 1.4 2.5 8.9 2.9 1.0 2.4 86.6 7.6
2006-07 10.3 6.3 20.3 5.2 4.8 2.0 6.3 1.8 1.6 4.7 1.5 1.0 1.0 1.9 3.6 2.5 2.6 9.4 3.2 1.1 2.6 93.7 8.3
2007-08 9.7 5.8 18.5 4.8 3.7 1.7 5.7 1.8 1.7 5.1 1.8 1.0 1.1 2.0 4.5 2.5 2.8 9.9 3.3 1.1 2.9 91.5 -2.4
2008-09 9.7 5.2 19.7 5.2 4.3 1.9 5.8 2.2 1.9 5.5 2.1 1.0 1.0 2.1 6.1 3.1 3.1 9.6 3.5 1.4 3.8 98.0 7.2
2009-10 9.4 4.8 19.7 5.8 5.9 2.1 7.1 2.1 2.2 5.1 2.6 1.5 1.3 2.1 6.2 3.7 2.8 10.0 2.9 1.3 4.0 102.4 4.5
2010-11 10.2 5.1 17.7 5.7 7.7 2.3 7.1 2.5 2.1 5.0 3.3 1.6 1.5 2.3 6.6 3.4 1.9 9.7 3.1 1.3 4.8 104.9 2.4
2011-12 10.6 4.6 16.5 5.7 8.5 2.3 7.1 2.4 2.6 5.1 3.9 1.5 1.7 1.8 7.9 3.9 2.5 10.4 3.0 1.3 5.0 108.3 3.2
2012-13 10.4 4.6 17.1 6.0 10.1 2.7 6.4 3.0 2.5 5.3 4.4 1.8 1.6 2.0 8.8 3.9 2.4 10.7 3.1 1.3 4.9 113.1 4.4
2013-14 10.3 4.7 16.1 5.8 11.5 2.9 6.1 3.5 2.5 5.4 4.8 2.0 1.5 2.0 8.3 3.9 2.4 10.6 3.1 1.2 4.6 113.3 0.1
2014-15 10.4 4.7 15.6 6.0 12.2 3.0 6.4 3.7 2.7 5.6 4.9 2.1 1.6 2.2 8.5 4.0 2.5 11.0 3.3 1.4 4.8 116.6 3.0
2015-16 10.6 4.8 16.1 6.3 13.1 3.0 6.9 3.8 2.8 5.7 5.1 2.3 1.7 2.4 9.0 4.2 2.5 11.5 3.4 1.4 5.0 121.6 4.3
2016-17 10.8 4.8 16.6 6.5 13.9 3.1 7.2 3.9 2.8 5.9 5.3 2.4 1.8 2.5 9.5 4.3 2.5 11.9 3.6 1.5 5.2 126.2 3.7
2017-18 10.9 4.8 16.9 6.7 14.5 3.1 7.6 4.1 2.9 6.0 5.5 2.6 1.9 2.7 10.0 4.5 2.6 12.3 3.7 1.6 5.4 130.2 3.2
2018-19 11.1 4.8 17.1 7.0 15.1 3.2 8.0 4.2 3.0 6.2 5.6 2.7 2.0 2.9 10.6 4.6 2.6 12.8 3.8 1.7 5.6 134.3 3.2
2019-20 11.2 4.9 17.5 7.2 15.6 3.2 8.3 4.3 3.1 6.3 5.8 2.8 2.1 3.0 11.2 4.7 2.6 13.2 3.9 1.7 5.9 138.5 3.1
2020-21 11.3 4.9 17.8 7.5 16.3 3.3 8.8 4.4 3.2 6.5 6.0 3.0 2.2 3.2 11.8 4.8 2.6 13.6 4.0 1.8 6.1 142.9 3.2
2021-22 11.5 4.9 18.2 7.7 16.9 3.3 9.2 4.5 3.3 6.6 6.1 3.2 2.3 3.4 12.5 4.9 2.6 14.1 4.1 1.9 6.3 147.5 3.2
2001/02-2006/07 8.6 6.6 3.5 -0.7 23.1 0.2 20.2 3.6 3.8 4.8 22.0 3.4 6.5 2.1 12.5 26.6 1.5 3.1 3.9 6.0 4.6 6.2 -
2006/07-2011/12 0.6 -5.8 -4.1 2.0 12.1 2.4 2.4 6.5 9.8 1.6 20.5 9.5 11.9 -1.2 16.9 9.7 -0.8 1.9 -1.3 2.7 13.9 2.9 -
2011/12-2016/17 0.4 0.7 0.1 2.5 10.2 6.2 0.4 10.2 2.2 3.0 6.4 10.0 1.0 6.8 3.7 2.0 0.4 2.9 3.5 2.9 0.9 3.1 -
2016/17-2021/22 1.2 0.3 1.9 3.4 4.0 1.5 4.9 2.8 3.0 2.3 3.0 5.4 4.9 6.1 5.6 2.6 0.8 3.4 2.8 4.6 3.9 3.2 -
2001/02-2011/12 4.5 0.2 -0.4 0.6 17.4 1.3 10.9 5.0 6.8 3.2 21.2 6.4 9.2 0.5 14.7 17.8 0.3 2.5 1.3 4.3 9.1 4.6 -
2011/12-2021/22 0.8 0.5 1.0 3.0 7.1 3.8 2.6 6.4 2.6 2.7 4.7 7.7 3.0 6.5 4.6 2.3 0.6 3.1 3.1 3.8 2.4 3.1 -
Numbers shaded are forecasts
Compound annual growth rate (%)
million

31
Table 11 International leisure visitor nights in hotels, motels, guesthouses & serviced apartments by markets, financial year New United United South Hong Middle Other Other South Other Total Total
Zealand Japan Kingdom States China S'pore Korea Malaysia Kong Germany India Indonesia Thailand East Asia France Ireland Europe Canada Africa World change
per cent
2000-01 1.4 2.7 2.4 2.1 0.3 0.8 0.3 0.4 0.5 1.1 0.1 0.2 0.1 0.1 0.5 0.2 0.2 1.6 0.5 0.1 0.4 16.1 n.a.
2001-02 1.4 1.9 2.7 1.6 0.3 0.8 0.4 0.3 0.4 1.1 0.1 0.2 0.2 0.2 0.4 0.2 0.2 1.4 0.4 0.1 0.3 14.5 -9.8
2002-03 1.5 2.4 2.8 1.7 0.4 0.6 0.5 0.3 0.4 0.9 0.1 0.1 0.1 0.1 0.3 0.2 0.2 1.3 0.4 0.1 0.2 14.7 1.1
2003-04 1.9 2.4 3.1 1.4 0.5 0.7 0.5 0.5 0.4 0.6 0.1 0.2 0.2 0.2 0.5 0.1 0.2 1.2 0.3 0.1 0.4 15.5 5.5
2004-05 2.4 2.4 3.5 1.7 0.7 0.8 0.6 0.4 0.4 0.7 0.2 0.2 0.2 0.2 0.5 0.1 0.2 1.5 0.5 0.1 0.3 17.5 12.9
2005-06 2.5 2.3 3.8 1.8 1.0 0.7 0.8 0.4 0.4 0.9 0.1 0.1 0.1 0.4 0.5 0.3 0.3 1.7 0.6 0.1 0.3 19.0 8.8
2006-07 2.8 2.0 4.0 1.7 1.1 0.7 0.7 0.4 0.4 0.9 0.2 0.2 0.1 0.3 0.5 0.3 0.4 1.9 0.6 0.1 0.4 19.5 2.3
2007-08 2.4 1.7 3.3 1.7 1.1 0.6 0.7 0.4 0.4 0.8 0.3 0.2 0.1 0.3 0.4 0.3 0.3 1.7 0.6 0.2 0.5 18.0 -7.6
2008-09 2.2 1.2 3.1 1.5 1.0 0.7 0.6 0.4 0.4 0.8 0.2 0.2 0.1 0.3 0.4 0.4 0.3 1.7 0.5 0.1 0.5 16.4 -8.7
2009-10 2.0 1.1 2.4 1.6 1.0 0.7 0.4 0.4 0.3 0.7 0.2 0.2 0.1 0.2 0.5 0.3 0.2 1.7 0.5 0.1 0.5 15.4 -6.3
2010-11 2.1 1.0 2.5 1.4 1.3 0.7 0.5 0.5 0.4 0.7 0.2 0.3 0.2 0.3 0.3 0.3 0.3 1.7 0.4 0.1 0.5 15.4 0.5
2011-12 1.9 0.9 1.8 1.4 1.6 0.7 0.5 0.5 0.4 0.7 0.2 0.2 0.1 0.2 0.3 0.3 0.2 1.4 0.4 0.1 0.4 14.3 -7.2
2012-13 1.9 0.9 2.0 1.5 2.0 0.9 0.5 0.6 0.4 0.6 0.2 0.2 0.2 0.2 0.4 0.3 0.2 1.5 0.4 0.1 0.4 15.2 6.2
2013-14 1.9 0.9 2.2 1.6 2.3 1.0 0.5 0.7 0.4 0.5 0.2 0.3 0.1 0.3 0.5 0.3 0.2 1.6 0.4 0.1 0.5 16.6 8.9
2014-15 1.9 0.9 2.3 1.6 2.5 0.9 0.6 0.7 0.4 0.5 0.2 0.3 0.1 0.3 0.5 0.3 0.2 1.7 0.4 0.1 0.5 17.4 4.7
2015-16 2.0 0.9 2.4 1.7 2.6 1.0 0.6 0.8 0.5 0.6 0.2 0.3 0.1 0.3 0.5 0.3 0.3 1.7 0.4 0.1 0.6 17.8 2.6
2016-17 2.0 0.9 2.4 1.8 2.7 1.0 0.6 0.8 0.5 0.6 0.3 0.4 0.1 0.3 0.5 0.3 0.3 1.8 0.5 0.1 0.6 18.3 2.8
2017-18 2.1 0.9 2.4 1.8 2.8 1.0 0.5 0.8 0.5 0.6 0.3 0.4 0.1 0.3 0.5 0.3 0.3 1.8 0.5 0.1 0.6 18.8 2.5
2018-19 2.1 1.0 2.4 1.9 2.9 1.0 0.5 0.8 0.5 0.6 0.3 0.4 0.1 0.4 0.5 0.3 0.3 1.9 0.5 0.1 0.6 19.3 2.6
2019-20 2.2 1.0 2.5 1.9 3.0 1.0 0.5 0.8 0.6 0.6 0.3 0.4 0.2 0.4 0.6 0.3 0.3 1.9 0.5 0.2 0.7 19.7 2.4
2020-21 2.2 1.0 2.5 2.0 3.0 1.0 0.5 0.9 0.6 0.6 0.3 0.5 0.2 0.4 0.6 0.4 0.3 2.0 0.5 0.2 0.7 20.2 2.5
2021-22 2.2 1.0 2.5 2.1 3.1 1.0 0.5 0.9 0.6 0.6 0.3 0.5 0.2 0.4 0.6 0.4 0.3 2.1 0.5 0.2 0.7 20.7 2.4
2001/02-2006/07 14.9 0.7 8.3 0.8 25.7 -2.4 9.9 3.2 -2.0 -4.8 5.4 2.3 -3.3 10.8 3.6 15.4 20.2 6.4 7.4 3.1 5.4 6.0 -
2006/07-2011/12 -7.5 -13.7 -15.1 -3.1 8.5 -1.2 -7.2 5.4 1.9 -3.2 2.3 3.9 -3.1 -5.5 -6.8 -0.3 -11.7 -6.0 -5.7 -8.7 3.4 -5.9
2011/12-2016/17 1.8 -0.2 6.0 4.4 10.8 7.3 2.9 10.6 4.1 -4.9 7.2 12.3 3.6 8.5 7.5 -0.7 6.2 4.8 1.8 9.2 6.6 5.0 -
2016/17-2021/22 1.9 0.6 1.2 3.3 2.8 1.5 -2.1 2.7 4.3 2.1 3.2 5.7 4.7 5.2 4.4 1.8 0.8 3.2 2.8 3.3 4.4 2.5 -
2001/02-2011/12 3.1 -6.8 -4.1 -1.2 16.8 -1.8 1.0 4.3 -0.1 -4.0 3.9 3.1 -3.2 2.3 -1.7 7.2 3.1 0.0 0.6 -3.0 4.4 -0.1 -
2011/12-2021/22 1.8 0.2 3.6 3.9 6.7 4.4 0.3 6.6 4.2 -1.5 5.2 9.0 4.1 6.8 6.0 0.5 3.5 4.0 2.3 6.2 5.5 3.7 -
Numbers shaded are forecasts
Compound annual growth rate (%)
million

32
Table 12 Real Total Inbound Tourism Expenditure by market, financial year (real, base = Quarter 4 2012, $million)
New United United South Hong Middle Other Other South Other Total TotalZealand Japan Kingdom States China S'pore Korea Malaysia Kong Germany India Indonesia Thailand East Asia France Ireland Europe Canada Africa World change
per cent
2000-01 1 988 4 140 4 416 3 870 1 031 1 243 1 031 692 874 1 159 464 639 388 345 983 304 537 2 826 792 289 1 056 29 070 n.a.
2001-02 1 877 3 351 4 688 3 970 1 258 1 285 1 000 730 1 016 1 214 351 586 432 412 892 333 433 2 536 737 275 706 28 082 -3.4
2002-03 1 965 3 103 4 743 3 162 1 349 1 195 1 047 663 751 1 094 290 509 433 301 817 322 414 2 523 657 317 597 26 251 -6.5
2003-04 2 055 3 039 4 753 2 885 1 542 912 1 050 802 704 1 152 218 546 437 401 860 362 512 2 325 593 434 561 26 142 -0.4
2004-05 2 324 3 043 4 343 2 737 1 913 912 1 181 720 647 1 057 348 431 426 270 772 317 571 2 245 686 387 768 26 098 -0.2
2005-06 2 447 3 186 4 295 2 924 1 875 910 1 410 721 729 1 039 401 435 381 312 839 366 677 2 209 726 344 902 27 129 4.0
2006-07 2 466 2 405 4 744 2 683 2 050 991 1 693 772 748 1 094 459 418 374 404 878 499 660 2 351 790 374 846 27 700 2.1
2007-08 2 548 2 036 4 287 2 793 2 493 1 165 1 478 939 751 1 170 740 521 426 641 1 049 537 669 2 569 865 440 936 29 052 4.9
2008-09 2 263 1 953 4 067 2 697 2 901 1 107 1 419 967 788 1 204 859 476 491 657 1 304 654 780 2 636 872 481 1 175 29 754 2.4
2009-10 2 164 1 529 3 432 2 308 3 112 1 109 1 271 1 027 767 1 080 804 521 448 582 1 324 622 608 2 352 724 317 1 109 27 211 -8.5
2010-11 2 246 1 474 3 141 2 222 3 610 1 231 1 296 1 048 846 920 960 638 515 445 1 315 565 529 2 200 699 348 1 175 27 423 0.8
2011-12 2 276 1 470 2 867 2 334 3 853 1 218 1 316 1 046 802 901 724 659 405 414 1 420 563 671 2 058 657 362 1 172 27 190 -0.8
2012-13 2 332 1 550 2 975 2 428 4 487 1 234 1 242 1 147 826 920 867 620 434 459 1 472 594 663 2 177 692 343 1 193 28 655 5.4
2013-14 2 463 1 536 3 205 2 462 4 845 1 228 1 268 1 249 843 990 1 000 617 462 512 1 551 678 687 2 376 763 356 1 236 30 327 5.8
2014-15 2 558 1 558 3 233 2 472 5 228 1 287 1 319 1 306 868 1 026 1 092 661 493 560 1 586 732 725 2 462 801 378 1 264 31 608 4.2
2015-16 2 547 1 567 3 245 2 504 5 526 1 336 1 361 1 356 895 1 072 1 196 705 509 607 1 739 775 741 2 577 819 392 1 352 32 822 3.8
2016-17 2 588 1 575 3 284 2 531 5 925 1 366 1 402 1 386 917 1 100 1 313 741 526 657 1 821 806 757 2 640 839 402 1 399 33 978 3.5
2017-18 2 622 1 579 3 314 2 553 6 228 1 392 1 439 1 414 934 1 129 1 434 775 543 712 1 903 838 771 2 702 859 412 1 446 34 999 3.0
2018-19 2 652 1 584 3 346 2 573 6 553 1 417 1 479 1 443 957 1 156 1 567 810 559 772 1 988 871 785 2 767 879 422 1 494 36 073 3.1
2019-20 2 683 1 588 3 373 2 593 6 812 1 444 1 519 1 471 975 1 185 1 710 847 575 839 2 077 904 799 2 831 899 433 1 545 37 099 2.8
2020-21 2 714 1 591 3 403 2 614 7 263 1 469 1 558 1 501 997 1 213 1 864 884 591 913 2 169 938 812 2 898 919 443 1 597 38 350 3.4
2021-22 2 744 1 593 3 430 2 633 7 631 1 494 1 598 1 530 1 017 1 242 2 030 923 608 993 2 265 972 825 2 963 939 454 1 651 39 536 3.1
2001/02-2006/07 5.6 -6.4 0.2 -7.5 10.3 -5.0 11.1 1.1 -6.0 -2.1 5.5 -6.5 -2.8 -0.4 -0.3 8.4 8.8 -1.5 1.4 6.3 3.7 -0.3 -
2006/07-2011/12 -1.6 -9.4 -9.6 -2.7 13.5 4.2 -4.9 6.2 1.4 -3.8 9.5 9.5 1.6 0.5 10.1 2.4 0.3 -2.6 -3.6 -0.6 6.7 -0.4 -
2011/12-2016/17 2.6 1.4 2.8 1.6 9.0 2.3 1.3 5.8 2.7 4.1 12.6 2.4 5.4 9.7 5.1 7.4 2.4 5.1 5.0 2.1 3.6 4.6 -
2016/17-2021/22 1.2 0.2 0.9 0.8 5.2 1.8 2.6 2.0 2.1 2.5 9.1 4.5 2.9 8.6 4.5 3.8 1.7 2.3 2.3 2.4 3.4 3.1 -
2001/02-2011/12 1.9 -7.9 -4.8 -5.2 11.8 -0.5 2.8 3.7 -2.3 -2.9 7.5 1.2 -0.6 0.0 4.8 5.4 4.5 -2.1 -1.1 2.8 5.2 -0.3 -
2011/12-2021/22 1.9 0.8 1.8 1.2 7.1 2.1 2.0 3.9 2.4 3.3 10.9 3.4 4.2 9.2 4.8 5.6 2.1 3.7 3.6 2.3 3.5 3.8 -
Numbers shaded are forecasts `
Compound annual growth rate (%)
$ million

33
Table 13 Inbound leisure tourism expenditure by market, financial year (real, base = Quarter 4 2012, $million) New United United South Hong Middle Other Other South Other Total Total
Zealand Japan Kingdom States China S'pore Korea Malaysia Kong Germany India Indonesia Thailand East Asia France Ireland Europe Canada Africa World change
$ million per cent
2000-01 1 289 3 544 3 767 2 375 394 660 615 359 501 949 144 246 153 187 556 190 478 1 919 573 174 578 19 650 n.a.
2001-02 1 208 2 623 3 718 2 077 550 658 584 369 530 957 132 200 180 313 465 198 336 1 805 533 174 367 17 975 -8.5
2002-03 1 327 2 508 4 013 1 691 499 642 674 320 399 882 96 202 159 202 411 221 359 1 747 452 185 337 17 324 -3.6
2003-04 1 424 2 317 3 864 1 417 487 439 660 365 307 821 70 201 132 227 406 219 409 1 573 400 306 262 16 306 -5.9
2004-05 1 636 2 450 3 763 1 563 655 449 768 345 354 815 119 142 130 205 387 207 488 1 608 503 265 381 17 232 5.7
2005-06 1 652 2 393 3 686 1 582 733 398 826 286 373 811 121 149 129 208 418 253 517 1 547 516 191 420 17 207 -0.1
2006-07 1 662 1 815 4 088 1 532 764 444 1 048 335 347 830 124 142 124 240 417 342 545 1 715 562 228 400 17 705 2.9
2007-08 1 675 1 518 3 606 1 512 877 447 874 362 357 841 194 174 135 329 465 381 574 1 791 602 236 428 17 379 -1.8
2008-09 1 501 1 473 3 421 1 463 1 132 469 690 397 355 928 181 173 136 297 586 438 662 1 780 572 277 515 17 444 0.4
2009-10 1 437 1 076 2 814 1 241 966 460 653 428 329 783 176 186 120 219 511 436 480 1 659 502 200 504 15 179 -13.0
2010-11 1 393 1 008 2 471 1 106 1 180 504 725 458 396 680 203 239 162 171 492 369 326 1 504 451 190 540 14 566 -4.0
2011-12 1 435 984 2 140 1 202 1 471 475 706 431 366 658 229 266 125 145 507 370 387 1 314 418 220 500 14 348 -1.5
2012-13 1 476 997 2 243 1 288 1 736 539 672 489 408 663 261 225 129 154 564 408 385 1 435 444 210 499 15 227 6.1
2013-14 1 632 971 2 451 1 293 1 911 568 691 552 417 705 286 241 129 177 581 462 398 1 570 501 217 525 16 279 6.9
2014-15 1 654 968 2 450 1 299 1 990 594 714 579 422 730 307 259 148 192 605 510 410 1 641 526 230 542 16 771 3.0
2015-16 1 687 974 2 470 1 316 2 064 615 730 593 431 747 331 268 150 199 639 533 421 1 694 535 239 558 17 193 2.5
2016-17 1 711 969 2 492 1 337 2 121 619 745 600 433 760 356 277 155 209 664 555 431 1 732 547 247 570 17 532 2.0
2017-18 1 732 963 2 505 1 353 2 157 622 758 607 434 773 382 285 160 218 687 576 439 1 769 558 255 581 17 815 1.6
2018-19 1 752 956 2 523 1 369 2 194 625 772 613 439 785 410 293 165 228 711 598 446 1 808 569 262 592 18 108 1.6
2019-20 1 772 949 2 534 1 384 2 230 628 785 620 439 798 439 301 170 238 735 620 453 1 844 581 269 603 18 391 1.6
2020-21 1 791 942 2 550 1 398 2 266 631 798 626 444 809 469 309 175 248 760 642 460 1 883 592 277 614 18 684 1.6
2021-22 1 810 935 2 563 1 412 2 298 634 812 632 445 821 502 317 180 258 785 666 466 1 920 603 284 625 18 967 1.5
2001/02-2006/07 6.6 -7.1 1.9 -5.9 6.8 -7.6 12.4 -1.9 -8.2 -2.8 -1.2 -6.6 -7.1 -5.2 -2.1 11.6 10.1 -1.0 1.1 5.6 1.7 -0.3 -
2006/07-2011/12 -2.9 -11.5 -12.1 -4.7 14.0 1.4 -7.6 5.2 1.1 -4.5 13.0 13.3 0.2 -9.5 4.0 1.6 -6.6 -5.2 -5.8 -0.8 4.6 -4.1 -
2011/12-2016/17 3.6 -0.3 3.1 2.1 7.6 5.4 1.1 6.9 3.4 2.9 9.3 0.9 4.4 7.5 5.5 8.4 2.2 5.7 5.5 2.4 2.6 4.1 -
2016/17-2021/22 1.1 -0.7 0.6 1.1 1.6 0.5 1.7 1.0 0.5 1.5 7.1 2.7 3.0 4.3 3.4 3.7 1.6 2.1 2.0 2.8 1.8 1.6 -
2001/02-2011/12 1.7 -9.3 -5.4 -5.3 10.3 -3.2 1.9 1.5 -3.6 -3.7 5.7 2.9 -3.6 -7.4 0.9 6.5 1.4 -3.1 -2.4 2.4 3.1 -2.2 -
2011/12-2021/22 2.3 -0.5 1.8 1.6 4.6 2.9 1.4 3.9 2.0 2.2 8.2 1.8 3.7 5.9 4.5 6.0 1.9 3.9 3.7 2.6 2.2 2.8 -
Numbers shaded are forecasts
Compound annual growth rate (%)

34

35
Asia-Pacific China Economic assumptions
Economic outlook Economic growth is expected to increase 8.2 per cent and 8.0 per cent in 2013 and 2014, respectively – lower than the 10 year long-run average of 10.4 per cent. In the medium to longer term, the Chinese economy is forecast to increase at an average annual rate of 7.1 per cent – lower than the long-run average.
The Chinese Renminbi is expected to appreciate against the Australian dollar making Australia a more attractive destination for visitors from China.
Market outlook Direct air capacity is expected to increase 22 per cent in 2012-13, higher than its 10 year long-run average of 18.2 per cent, and then 11.1 per cent in 2013-14. In the medium to longer term, air capacity is expected to grow at an average annual rate of about 8.2 per cent, lower than the long-run average.
Visitor arrivals from China are now forecast to rise 15.9 per cent and 10.4 per cent to 676,100 in 2012-13 and 746,200 in 2013-14 respectively. This revision represents a difference of 57,000 more visitors. In the longer term to 2021-22, average annual growth of 6.4 per cent to 1.1 million is expected. Visitor nights are now forecast to rise 15.6 per cent and 10.1 per cent to 31 million nights in 2012-13 and 34 million nights in 2013-14 respectively, and to 56 million nights in 2021-22. Visitor expenditure is forecast to rise 16.5 per cent in 2012-13 to $4.5 billion. In the longer term to 2021-22, average annual growth of 7.1 per cent is forecast to reach $7.6 billion representing an upward revision of $197 million.
Market performance In 2012, visitor arrivals increased 15.5 per cent to 626,100 compared with 2011, and visitor nights increased 7.3 per cent to 29 million in the same period. Over the first eight months in 2012-13,
arrivals have increased 16.3 per cent–11.3 percentage points higher than the growth of total inbound arrivals.
In the first eight months of 2012-13, Holiday, Employment, Visiting Friends/Relatives (VFR) and Business increased 26 per cent, 26 per cent, 18.6 per cent and 7.7 per cent respectively, while Education decreased 3.4 per cent.
In the first six months of 2012-13, average length of stay increased 0.5 per cent to 42 nights per trip while total nights in hotels, motels, guesthouses and serviced apartments increased 8.3 per cent to 1.2 million compared with the same period in 2011-12.
In the first six months of 2012-13, expenditure as defined by Total Inbound Tourism Expenditure (TITE) increased 22 per cent to $1,957 million compared with the same period in the previous financial year, while leisure expenditure increased by 17.4 per cent to $761million in the same period.
2006 2007 2008 2009 2010 2011 2012 2013 2014 2015
GDP growth % 12.7 14.2 9.6 9.1 10.3 9.2 7.8 8.2 8.0 7.7Inflation % 1.5 4.8 5.8 -0.7 3.3 5.4 2.6 3.2 3.5 3.2Home currency usd 7.97 7.61 6.95 6.83 6.77 6.46 6.31 6.23 6.15 6.16Home currency aud 6.00 6.37 5.92 5.40 6.22 6.67 6.54 6.42 6.11 6.11Population mill. 1 318 1 326 1 334 1 343 1 352 1 362 1 371 1 380 1 389 1 398
Currencies are year average, based on quarterly data
Sources: IMF IFS; Consensus Forecasts, March 2013

36
Table 14 International visitor arrivals: China
Business VFRa Holiday Otherd Total Total Average Total Share of nights in Nights in TITEc TITE
change nights nights HMGSAb HMGSA Total per visitor
'000 per cent million per cent million $ million $
2000-01 39 18 57 23 143 n.a. 27.8 4.0 16.7 0.7 1 031 7 189
2001-02 36 19 70 31 172 20.1 30.3 5.2 14.9 0.8 1 258 7 300
2002-03 38 19 74 35 177 2.8 40.2 7.1 10.6 0.8 1 349 7 614
2003-04 51 24 91 41 217 22.4 41.7 9.1 10.4 0.9 1 542 7 109
2004-05 62 28 120 50 274 26.5 39.6 10.9 13.9 1.5 1 913 6 970
2005-06 67 34 132 58 292 6.5 40.6 11.9 13.7 1.6 1 875 6 414
2006-07 73 40 158 65 338 15.8 45.1 15.3 11.7 1.8 2 050 6 058
2007-08 71 46 177 78 375 10.9 42.5 15.9 13.0 2.1 2 493 6 645
2008-09 46 52 171 86 358 -4.6 49.5 17.7 8.3 1.5 2 901 8 102
2009-10 53 67 165 104 394 10.0 57.1 22.5 7.6 1.7 3 112 7 899
2010-11 66 82 226 120 500 26.9 51.6 25.8 8.3 2.1 3 610 7 223
2011-12 63 96 290 128 583 16.7 46.1 26.9 9.2 2.5 3 853 6 608
2012-13 70 114 351 136 676 15.9 45.9 31.0 9.1 2.8 4 487 6 637
2013-14 74 128 393 145 746 10.4 45.8 34.2 9.5 3.2 4 845 6 493
2014-15 79 139 420 156 801 7.3 46.4 37.2 9.3 3.5 5 228 6 528
2015-16 84 149 440 169 847 5.8 46.8 39.6 9.1 3.6 5 526 6 522
2016-17 87 158 458 181 890 5.0 47.9 42.7 8.8 3.8 5 925 6 658
2017-18 90 165 473 193 927 4.2 48.5 45.0 8.6 3.9 6 228 6 716
2018-19 93 172 489 205 965 4.1 49.2 47.5 8.4 4.0 6 553 6 788
2019-20 96 179 505 219 1 005 4.0 49.3 49.5 8.3 4.1 6 812 6 781
2020-21 99 186 521 232 1 044 4.0 50.5 52.8 8.1 4.3 7 263 6 953
2021-22 102 194 536 247 1 085 3.9 51.1 55.5 7.9 4.4 7 631 7 030
Compound annual
growth rate (%)
2001/02-2006/07 14.9 15.8 17.6 16.2 14.5 8.3 23.9 -4.8 18.0 10.3 -3.7
2006/07-2011/12 -2.7 18.8 12.8 14.6 11.5 0.4 12.0 -4.7 6.8 13.5 1.8
2011/12-2016/17 6.6 10.6 9.6 7.2 8.8 0.8 9.7 -0.8 8.8 9.0 0.2
2016/17-2021/22 3.2 4.2 3.2 6.4 4.1 1.3 5.4 -2.2 3.1 5.2 1.1
2001/02-2011/12 5.7 17.3 15.2 15.4 13.0 4.3 17.8 -4.7 12.3 11.8 -1.0
2011/12-2021/22 4.9 7.3 6.4 6.8 6.4 1.1 7.5 -1.5 5.9 7.1 0.6
Numbers shaded are forecasts
a Visiting friends and relatives
b Hotels, motels, guesthouses, and serviced apartments
c Total Inbound Tourism Expenditure, real, base = Quarter 4 2012
d Other refers to education and employment visitors w ho stay in Australia for one year or less. On average, these visitors spend more and stay longer than the average tourist.
Historical estimates for international visitor nights have changed due to a slight change in the methodology
The sum of purpose of visit categories does not add to the total as the total includes estimates for those not reporting a purpose of visit to Australia�
020
0400
600
800
1000
120
0
Arrivals (000s)
ArrivalsExpenditure 0
2000
4000
6000
800
0
Expend
iture ($m
)
2000-01 2003-04 2006-07 2009-10 2012-13 2015-16 2018-19 2021-22
China - Arrivals, 000s (LHS) and Expenditure, $m (RHS), 2001-01 to 2021-22

37
Hong Kong Economic assumptions
Economic outlook Economic growth is expected to increase 3.5 per cent
and 4.1 per cent in 2013 and 2014 respectively–lower than its 10-year long-run average of 4.5 per cent. In the medium to longer term, the Hong Kong economy is expected to increase at an average annual rate of
3.5 per cent–lower than its long-run average.
The Hong Kong dollar is expected to appreciate against the Australian dollar making Australia a more attractive destination for visitors from Hong Kong.
Market outlook Direct air capacity is expected to increase 5.0 per cent in 2012-13, higher than its 10 year long-run average of 4.4 per cent and then 2.1 per cent in 2013-14. In the medium to longer term, air capacity is expected to increase at an average annual rate of 1.5 per cent, lower than the long-run average.
Visitor arrivals from Hong Kong are now forecast to rise 8.7 per cent and 3.1 per cent to 183,500 in 2012-13 and 189,200 in 2013-14 respectively. This revision represents a difference of 25,800 more visitors in aggregate. In the longer term to 2021-22, average annual growth of 3.2 per cent to 230,900 visitors is expected. Visitor nights are now forecast to rise 9.4 per cent to 6.4 million in 2012-13 and then decrease 6.0 per cent to 6.0 million nights in 2013-14 and to 7.7 million nights in 2021-22. Visitor expenditure is forecast to rise 3.0 per cent in 2012-13 to $826 million. In the longer term to 2021-22, average annual growth of 2.4 per cent is forecast to $1.0 billion representing a downward revision of $83 million.
Market performance In 2012, visitor arrivals increased 6.2 per cent to 176,800 compared with 2011, and visitor nights increased 0.3 per cent to 5.9 million in the same period. Over the first eight months in 2012-13, arrivals
have increased 9 per cent – 4 percentage points higher than the growth of total inbound arrivals.
In the first eight months of 2012-13, Holiday and VFR increased 17 per cent and 11.5 per cent respectively, while Employment, Education and Business decreased 9.5 per cent, 6.2 per cent and 1.7 per cent respectively.
In the first six months of 2012-13, average length of stay decreased 6.1 per cent to 31 nights per trip while total nights in hotels, motels, guesthouses and serviced apartments increased 17.3 per cent to 0.4 million compared with the same period in 2011-12.
In the first six months of 2012-13, expenditure as defined by Total Inbound Tourism Expenditure (TITE) decreased 2.2 per cent to $382 million in July to December 2012 compared with the same period in the previous financial year, while leisure expenditure increased by 12.4 per cent to $206 million in the same period.
2006 2007 2008 2009 2010 2011 2012 2013 2014 2015
GDP growth % 7.0 6.5 2.1 -2.5 6.8 4.9 1.4 3.5 4.1 4.2Inflation % 2.0 2.0 4.3 0.6 2.3 5.3 4.1 4.0 4.2 3.4Home currency usd 7.77 7.80 7.79 7.75 7.77 7.78 7.76 7.77 7.78 7.78Home currency aud 5.85 6.54 6.63 6.13 7.14 8.04 8.03 8.01 7.73 7.72Population mill. 7.0 7.0 7.0 7.1 7.1 7.1 7.2 7.2 7.2 7.2
Currencies are year average, based on quarterly data
Sources: IMF IFS; Consensus Forecasts, March 2013

38
Table 15 International visitor arrivals: Hong Kong
Business VFRa Holiday Otherd Total Total Average Total Share of nights in Nights in TITEc TITE
change nights nights HMGSAb HMGSA Total per visitor
'000 per cent million per cent million $ million $
2000-01 20 29 85 15 154 n.a. 24.0 3.7 16.4 0.6 874 5 670
2001-02 17 28 72 16 149 -3.6 26.0 3.9 15.8 0.6 1 016 6 840
2002-03 16 29 64 16 141 -5.3 24.2 3.4 18.2 0.6 751 5 342
2003-04 17 32 61 15 132 -6.0 28.1 3.7 14.2 0.5 704 5 322
2004-05 19 37 69 17 149 12.6 21.9 3.3 23.1 0.8 647 4 347
2005-06 21 40 74 20 159 6.6 28.3 4.5 14.2 0.6 729 4 588
2006-07 23 38 67 21 153 -3.6 29.2 4.5 13.7 0.6 748 4 885
2007-08 24 36 62 21 147 -4.2 30.9 4.5 12.3 0.6 751 5 120
2008-09 21 38 64 22 150 2.2 32.1 4.8 11.3 0.5 788 5 260
2009-10 24 38 64 23 154 3.0 35.8 5.5 11.7 0.6 767 4 972
2010-11 26 44 72 22 170 9.9 31.5 5.3 10.8 0.6 846 4 986
2011-12 26 41 74 22 169 -0.4 34.7 5.9 11.2 0.7 802 4 752
2012-13 25 45 85 23 183 8.7 34.9 6.4 10.4 0.7 826 4 505
2013-14 26 46 87 23 189 3.1 31.8 6.0 11.3 0.7 843 4 454
2014-15 27 47 90 25 196 3.3 30.6 6.0 12.1 0.7 868 4 441
2015-16 28 49 92 26 201 2.9 31.0 6.2 11.9 0.7 895 4 446
2016-17 29 50 94 28 207 2.6 31.4 6.5 11.9 0.8 917 4 440
2017-18 30 51 96 29 211 2.3 31.8 6.7 12.0 0.8 934 4 421
2018-19 30 52 98 30 216 2.3 32.1 6.9 12.1 0.8 957 4 427
2019-20 31 53 100 31 221 2.3 32.5 7.2 12.1 0.9 975 4 409
2020-21 32 54 101 33 226 2.2 32.9 7.4 12.2 0.9 997 4 413
2021-22 33 55 103 34 231 2.2 33.2 7.7 12.3 0.9 1 017 4 403
Compound annual
growth rate (%)
2001/02-2006/07 6.2 5.8 -1.4 6.3 0.6 2.3 2.9 -2.8 0.0 -6.0 -6.5
2006/07-2011/12 1.7 1.6 2.1 0.5 2.0 3.5 5.6 -3.9 1.4 1.4 -0.5
2011/12-2016/17 2.5 4.0 4.9 5.0 4.1 -2.0 2.1 1.2 3.3 2.7 -1.3
2016/17-2021/22 2.6 1.9 1.9 4.2 2.3 1.1 3.4 0.6 4.0 2.1 -0.2
2001/02-2011/12 3.9 3.7 0.3 3.3 1.3 2.9 4.2 -3.4 0.7 -2.3 -3.6
2011/12-2021/22 2.5 2.9 3.4 4.6 3.2 -0.4 2.7 0.9 3.7 2.4 -0.8
Numbers shaded are forecasts
a Visiting friends and relatives
b Hotels, motels, guesthouses, and serviced apartments
c Total Inbound Tourism Expenditure, real, base = Quarter 4 2012
d Other refers to education and employment visitors w ho stay in Australia for one year or less. On average, these visitors spend more and stay longer than the average tourist.
Historical estimates for international visitor nights have changed due to a slight change in the methodology.
The sum of purpose of visit categories does not add to the total as the total includes estimates for those not reporting a purpose of visit to Australia�
100
150
200
250
Arrivals (0
00s)
ArrivalsExpenditure 0
500
1000
150
0
Exp
enditure ($
m)
2000-01 2003-04 2006-07 2009-10 2012-13 2015-16 2018-19 2021-22
Hong Kong - Arrivals, 000s (LHS) and Expenditure, $m (RHS), 2001-01 to 2021-22

39
India Economic assumptions
Economic outlook Economic growth is expected to increase 5.2 per cent
and 6.3 per cent in 2013 and 2014 respectively–lower than the 10 year long-run average of 7.8 per cent. In the medium to longer term, the Indian economy is expected
to increase at an average annual rate of 7.3 per cent –lower than the long-run average, placing downside risk to the forecasts.
The Indian Rupee is expected to appreciate against the Australian dollar making Australia a more attractive destination for visitors from India.
Market outlook Currently there are no direct flights between India and Australia. Visitors from India travel to Australia via the Asian hubs including Bangkok, Hong Kong and Singapore. The direct flights are expected to be resumed in the first half of 2013-14.
Visitor arrivals from India are now forecast to rise 7.5 per cent and 7.6 per cent to 163,800 in 2012-13 and 176,300 in 2013-14 respectively. This revision represents a difference of 6500 more visitors in aggregate. In the longer term to 2021-22, average annual growth of 7.2 per cent to 306,100 visitors is expected. Visitor nights are now forecast to rise 13.0 per cent to 10 million in 2012-13 and then increase 9.1 per cent to 10.9 million nights in 2013-14 and to 17.1 million nights in 2021-22. Visitor expenditure is forecast to rise 19.8 per cent in 2012-13 to $867 million. In the longer term to 2021-22, average annual growth of 10.9 per cent is forecast to $2 billion, representing an upward revision of $354 million.
Market performance In 2012, Visitor arrivals increased 7.5 per cent to 159,300 compared with 2011. Visitor nights increased 3.7 per cent to 10.1 million in the same period. Over the first eight months in 2012-13, arrivals
have increased 7.4 per cent–2.5 percentage points higher than the growth of total inbound arrivals.
In the first eight months of 2012-13, VFR, Holiday and Employment increased 16.1 per cent, 13.7 per cent and 8.1 per cent respectively while Education and Business decreased 20 per cent and 0.9 per cent respectively.
Average length of stay increased 20 per cent to 66 nights per trip, while total nights in hotels, motels, guesthouses and serviced apartments increased 17.2 per cent to 0.5 million compared with the same period in 2011/12.
Expenditure as defined by Total Inbound Tourism Expenditure (TITE) increased 21 per cent to $405 million in July to December 2012 compared with the same period in the previous financial year, while leisure expenditure increased by 16.7 per cent to $135 million in the same period.
2006 2007 2008 2009 2010 2011 2012 2013 2014 2015
GDP growth % 9.3 9.7 7.8 6.9 8.6 8.2 5.9 5.2 6.3 7.4Inflation % 4.4 6.7 6.2 9.1 12.4 10.4 8.4 9.6 7.8 6.8Home currency usd 44.2 45.2 40.3 46.3 47.6 45.8 48.3 54.3 53.2 52.4Home currency aud 33.3 34.5 34.9 36.2 40.4 43.2 50.5 56.1 54.4 51.8Population mill. 1 103 1 120 1 136 1 153 1 169 1 185 1 201 1 217 1 232 1 248
Currencies are year average, based on quarterly data.
Sources: IMF IFS; Consensus Forecasts, March 2013

40
Table 16 International visitor arrivals: India
Business VFRa Holiday Otherd Total Total Average Total Share of nights in Nights in TITEc TITE
change nights nights HMGSAb HMGSA Total per visitor
'000 per cent million per cent million $ million $
2000-01 10 9 15 9 46 n.a. 50.8 2.3 8.4 0.2 464 10 166
2001-02 9 7 17 8 47 3.6 38.2 1.8 12.9 0.2 351 7 416
2002-03 9 8 12 8 41 -12.8 45.5 1.9 10.3 0.2 290 7 025
2003-04 12 9 16 13 54 30.5 31.6 1.7 19.0 0.3 218 4 056
2004-05 13 12 19 12 59 10.1 39.4 2.3 19.9 0.5 348 5 871
2005-06 20 15 22 20 79 33.2 43.7 3.5 19.0 0.7 401 5 082
2006-07 22 19 23 23 88 11.5 50.0 4.4 17.2 0.8 459 5 220
2007-08 27 24 27 28 108 22.4 53.1 5.7 19.9 1.1 740 6 875
2008-09 26 32 26 36 120 11.9 61.1 7.4 12.8 0.9 859 7 132
2009-10 26 43 25 36 130 7.8 61.3 8.0 8.9 0.7 804 6 191
2010-11 29 47 27 39 144 11.2 67.4 9.7 12.0 1.2 960 6 647
2011-12 28 54 29 38 152 5.5 58.1 8.9 10.2 0.9 724 4 751
2012-13 28 61 33 40 164 7.5 61.0 10.0 9.9 1.0 867 5 294
2013-14 29 65 37 43 176 7.6 61.9 10.9 9.9 1.1 1 000 5 675
2014-15 30 69 42 47 191 8.1 60.7 11.6 10.0 1.2 1 092 5 728
2015-16 32 73 46 52 205 7.7 59.6 12.2 10.1 1.2 1 196 5 823
2016-17 34 76 51 57 220 7.3 58.8 13.0 10.1 1.3 1 313 5 961
2017-18 36 79 56 62 236 7.0 58.2 13.7 10.1 1.4 1 434 6 090
2018-19 38 83 61 68 252 6.9 57.6 14.5 10.1 1.5 1 567 6 224
2019-20 40 87 66 74 269 6.8 57.0 15.3 10.0 1.5 1 710 6 360
2020-21 42 90 72 81 287 6.7 56.5 16.2 10.0 1.6 1 864 6 496
2021-22 44 94 78 88 306 6.7 56.0 17.1 10.0 1.7 2 030 6 633
Compound annual
growth rate (%)
2001/02-2006/07 20.2 21.8 6.5 24.3 13.2 5.5 19.5 5.9 26.6 5.5 -6.8
2006/07-2011/12 4.6 23.3 5.3 10.4 11.6 3.0 15.0 -9.9 3.7 9.5 -1.9
2011/12-2016/17 4.1 7.0 11.5 8.5 7.6 0.2 7.9 -0.3 7.6 12.6 4.6
2016/17-2021/22 5.2 4.4 8.9 8.9 6.8 -1.0 5.7 -0.2 5.6 9.1 2.2
2001/02-2011/12 12.1 22.5 5.9 17.1 12.4 4.3 17.2 -2.3 14.5 7.5 -4.4
2011/12-2021/22 4.7 5.7 10.2 8.7 7.2 -0.4 6.8 -0.2 6.6 10.9 3.4
Numbers shaded are forecasts
a Visiting friends and relatives
b Hotels, motels, guesthouses, and serviced apartments
c Total Inbound Tourism Expenditure, real, base = Quarter 4 2012
d Other refers to education and employment visitors w ho stay in Australia for one year or less. On average, these visitors spend more and stay longer than the average tourist.
Historical estimates for international visitor nights have changed due to a slight change in the methodology.
The sum of purpose of visit categories does not add to the total as the total includes estimates for those not reporting a purpose of visit to Australia�
050
100
150
200
250
300
350
Arrivals (0
00s)
ArrivalsExpenditure 0
500
100
01500
2000
250
0
Exp
enditure ($
m)
2000-01 2003-04 2006-07 2009-10 2012-13 2015-16 2018-19 2021-22
India - Arrivals, 000s (LHS) and Expenditure, $m (RHS), 2001-01 to 2021-22

41
Indonesia Economic assumptions
Economic outlook Economic growth is expected to increase 6.2 per cent in
2013 and 2014 respectively–higher than the 10-year long-run average of 5.7 per cent. In the medium to longer term, the Indonesian economy is expected to increase at
an average annual rate of 6.1 per cent–higher than the long-run average, placing upside risk to the forecasts.
The Indonesian Rupiah is expected to depreciate against the Australian dollar making Australia a less attractive destination for visitors from Indonesia.
Market outlook Direct air capacity is expected to decrease 3.5 per cent in 2012-13 before picking up by 4.3 per cent in 2013-14, lower than its 10-year long-run average of 10.0 per cent. In the medium to longer term, air capacity is expected to increase at an average annual rate of 4.8 per cent–lower than the long-run average.
Visitor arrivals from Indonesia are now forecast to rise 3.6 per cent and 7.3 per cent to 146,700 in 2012-13 and 157,400 in 2013-14 respectively. This revision represents a difference of 5,700 fewer visitors in aggregate. In the longer term to 2021-22, average annual growth of 5.5 per cent to 242,400 visitors is expected. Visitor nights are now forecast to rise 10.4 per cent and 9.4 per cent to 4.9 million nights in 2012-13 and 5.4 million nights in 2013-14 respectively, and to 8.9 million nights in 2021-22. Visitor expenditure is forecast to decrease 5.8 per cent in 2012-13 to $620 million. In the longer term to 2021-22, average annual growth of 3.4 per cent is forecast to $923 million, representing a downward revision of $215 million.
Market performance In 2012, visitor arrivals increased 3.7 per cent to 145,500 compared with 2011. Visitor nights decreased 1.4 per cent to 4.7 million in the same period. Over the first eight months in 2012-13, arrivals
have increased 3.8 per cent–1.1 percentage points lower than the growth for total inbound arrivals.
In the first eight months of 2012-13, Business, Visiting Friends and Relatives, Holiday and Education increased 11.6 per cent, 9.7 per cent, 3.8 per cent and 2.8 per cent respectively, while Employment decreased 27 per cent.
In the first six months of 2012-13, average length of stay increased 6.9 per cent to 30 nights per trip while the total night in hotels, motels, guesthouses and serviced apartments increased 3.3 per cent to 217,000 in the same period compared with the same period in 2011-12.
In the first six months of 2012-13, expenditure as defined by Total Inbound Tourism Expenditure (TITE) decreased 4.7 per cent to $322 million compared with the same period in the previous financial year, while leisure expenditure decreased 23 per cent to $134 million in the same period.
2006 2007 2008 2009 2010 2011 2012 2013 2014 2015
GDP growth % 5.5 6.3 6.0 4.6 6.2 6.5 6.2 6.2 6.2 6.3Inflation % 13.1 6.4 9.8 4.8 5.1 5.4 4.3 5.1 5.1 5.3Home currency usd 9 171 9 131 9 673 10 417 9 092 8 769 9 364 9 705 9 616 9 515Home currency aud 6 905 7 655 8 157 8 162 8 350 9 050 9 696 9 998 9 547 9 439Population mill. 233 236 239 242 244 247 249 252 255 257
Currencies are year average, based on quarterly data
Sources: IMF IFS; Consensus Forecasts, March 2013

42
Table 17 International visitor arrivals: Indonesia
Business VFRa Holiday Otherd Total Total Average Total Share of nights in Nights in TITEc TITE
change nights nights HMGSAb HMGSA Total per visitor
'000 per cent million per cent million $ million $
2000-01 11 16 44 23 98 n.a. 37.5 3.7 6.9 0.3 639 6 505
2001-02 9 13 39 21 95 -3.7 31.3 3.0 9.4 0.3 586 6 196
2002-03 8 14 36 20 87 -8.2 31.6 2.7 7.1 0.2 509 5 862
2003-04 10 14 39 21 91 5.3 41.3 3.8 7.4 0.3 546 5 968
2004-05 10 14 34 19 82 -10.0 34.4 2.8 12.1 0.3 431 5 234
2005-06 10 15 33 22 82 -0.7 34.1 2.8 12.7 0.4 435 5 322
2006-07 12 14 35 23 85 4.2 36.7 3.1 10.9 0.3 418 4 906
2007-08 14 15 35 26 93 9.3 35.7 3.3 10.8 0.4 521 5 594
2008-09 12 16 39 25 96 2.8 34.2 3.3 13.2 0.4 476 4 972
2009-10 15 21 51 28 118 23.5 38.4 4.5 8.6 0.4 521 4 407
2010-11 17 22 60 30 133 12.5 39.3 5.2 11.9 0.6 638 4 795
2011-12 17 22 66 31 142 6.3 31.5 4.5 11.7 0.5 659 4 653
2012-13 19 25 69 31 147 3.6 33.5 4.9 10.8 0.5 620 4 229
2013-14 20 26 75 32 157 7.3 34.2 5.4 11.5 0.6 617 3 920
2014-15 21 28 80 34 169 7.1 34.5 5.8 11.8 0.7 661 3 922
2015-16 22 30 85 37 179 6.3 35.0 6.3 12.0 0.8 705 3 933
2016-17 23 32 90 40 189 5.7 35.3 6.7 11.9 0.8 741 3 915
2017-18 24 33 94 43 199 5.2 35.6 7.1 11.9 0.8 775 3 890
2018-19 25 35 99 46 209 5.1 35.8 7.5 11.9 0.9 810 3 868
2019-20 26 37 104 49 220 5.1 36.1 7.9 11.9 0.9 847 3 848
2020-21 27 38 108 52 231 5.0 36.4 8.4 11.9 1.0 884 3 827
2021-22 28 40 114 56 242 4.9 36.7 8.9 11.8 1.1 923 3 807
Compound annual
growth rate (%)
2001/02-2006/07 5.7 1.2 -2.1 1.3 -2.1 3.2 1.1 2.9 4.0 -6.5 -4.6
2006/07-2011/12 7.2 9.6 13.4 6.7 10.7 -3.0 7.3 1.4 8.9 9.5 -1.1
2011/12-2016/17 6.3 7.3 6.4 5.2 6.0 2.3 8.5 0.5 9.0 2.4 -3.4
2016/17-2021/22 3.8 5.0 4.8 6.8 5.1 0.8 5.9 -0.2 5.7 4.5 -0.6
2001/02-2011/12 6.4 5.3 5.4 4.0 4.1 0.1 4.2 2.1 6.4 1.2 -2.8
2011/12-2021/22 5.0 6.1 5.6 6.0 5.5 1.6 7.2 0.2 7.3 3.4 -2.0
Numbers shaded are forecasts
a Visiting friends and relatives
b Hotels, motels, guesthouses, and serviced apartments
c Total Inbound Tourism Expenditure, real, base = Quarter 4 2012
d Other refers to education and employment visitors w ho stay in Australia for one year or less. On average, these visitors spend more and stay longer than the average tourist.
Historical estimates for international visitor nights have changed due to a slight change in the methodology.
The sum of purpose of visit categories does not add to the total as the total includes estimates for those not reporting a purpose of visit to Australia�
50
100
150
200
250
Arrivals (00
0s)
ArrivalsExpenditure 2
00400
600
800
1000
Exp
enditu
re ($
m)
2000-01 2003-04 2006-07 2009-10 2012-13 2015-16 2018-19 2021-22
Indonesia - Arrivals, 000s (LHS) and Expenditure, $m (RHS), 2001-01 to 2021-22

43
Japan Economic assumptions
Economic outlook Economic growth is expected to increase 1.2 per cent and 1.2 per cent in 2013 and 2014, respectively, consistent with the 10-year long-run average of 0.8 per cent. In the medium to longer term, the Japanese economy is expected to increase at an average annual
rate of 1.0 per cent – slightly higher than the long-run average.
The Japanese Yen is expected to depreciate against the Australian dollar, making Australia a less attractive destination for visitors from Japan.
Market outlook Direct air capacity is expected to 11.4 per cent and 6.1 per cent in 2012-13 and 2013-14, respectively, much higher than its 10 year long-run average of 6.0 per cent declining. In the medium to longer term, air capacity is expected to increase at an average annual rate of 3.7 per cent, higher than the long-run average.
Visitor arrivals from Japan are now forecast to rise 2.0 per cent and 3.9 per cent to 351,100 in 2012-13 and 364,800 in 2013-14 respectively. This revision represents a difference of 4,700 more visitors in aggregate. In the longer term to 2021-22, average annual growth of 1.7 per cent to 408,200 is expected. Visitor nights are now forecast to rise 2.5 per cent and 0.7 per cent to 9.2 million nights in 2012-13 and 9.3 million nights in 2013-14 respectively, and to 9.5 million nights in 2021-22. Visitor expenditure is forecast to rise 5.4 per cent in 2012-13 to $1.6 billion. In the longer term to 2021-22, average annual growth of 0.8 per cent is forecast to $1.6 billion, representing an upward revision of $1 million.
Market performance In 2012, visitor arrivals increased 6.4 per cent to 353,900 compared with 2011. Visitor nights increased 31 per cent to 10.5 million in the same period. Over the first eight months in 2012-13, arrivals
have increased 2.0 per cent–3 percentage points lower than the growth for the total inbound arrivals.
In the first eight months of 2012-13, Employment, Visiting Friends and Relatives (VFR), Education and Holiday increased 161 per cent, 6.4 per cent, 2.2 per cent and 0.5 per cent, while Business decreased 6.7 per cent.
In the first six months of 2012-13, average length of stay increased 29 per cent to 30 nights per trip, while total nights in hotels, motels, guesthouses and serviced apartments increased 12.6 per cent to 746,000 compared with the same period in 2011-12.
In the first six months of 2012-13, expenditure as defined by Total Inbound Tourism Expenditure (TITE) increased 13.9 per cent to $880 million compared with the same period in the previous financial year, while leisure expenditure increased by 10.6 per cent to $589 million in the same period.
2006 2007 2008 2009 2010 2011 2012 2013 2014 2015
GDP growth % 1.7 2.2 -1.1 -5.5 4.7 -0.5 1.9 1.2 1.2 1.0Inflation % 0.2 0.1 1.4 -1.3 -0.7 -0.3 0.0 0.0 1.8 0.9Home currency usd 116 118 103 94 88 80 80 92 92 92Home currency aud 88 99 88 74 81 82 83 94 92 92Population mill. 127 127 127 127 127 126 126 125 125 124
Currencies are year average, based on quarterly data
Sources: IMF IFS; Consensus Forecasts, March 2013

44
Table 18 International visitor arrivals: Japan
Business VFRa Holiday Otherd Total Total Average Total Share of nights in Nights in TITEc TITE
change nights nights HMGSAb HMGSA Total per visitor
'000 per cent million per cent million $ million $
2000-01 37 26 597 38 724 n.a. 12.1 8.8 35.5 3.1 4 140 5 716
2001-02 34 25 410 44 659 -9.0 13.5 8.9 31.8 2.8 3 351 5 083
2002-03 35 30 504 45 659 -0.1 13.2 8.7 33.2 2.9 3 103 4 712
2003-04 42 34 541 51 688 4.4 15.8 10.9 25.7 2.8 3 039 4 421
2004-05 37 34 571 44 701 1.9 15.3 10.7 25.5 2.7 3 043 4 341
2005-06 43 32 548 48 674 -3.8 17.3 11.7 22.8 2.7 3 186 4 724
2006-07 46 34 482 46 610 -9.5 19.6 12.0 19.4 2.3 2 405 3 941
2007-08 41 32 404 42 521 -14.6 20.0 10.4 19.5 2.0 2 036 3 906
2008-09 36 29 301 34 404 -22.6 21.4 8.7 17.1 1.5 1 953 4 838
2009-10 34 32 264 32 364 -9.9 21.8 7.9 17.3 1.4 1 529 4 203
2010-11 37 33 257 35 364 0.1 23.0 8.4 15.2 1.3 1 474 4 048
2011-12 36 31 237 38 344 -5.4 26.0 9.0 12.9 1.2 1 470 4 269
2012-13 35 33 238 43 351 2.0 26.2 9.2 13.4 1.2 1 550 4 414
2013-14 35 34 249 45 365 3.9 25.4 9.3 13.6 1.3 1 536 4 210
2014-15 37 35 255 45 374 2.4 25.1 9.4 13.8 1.3 1 558 4 170
2015-16 38 36 259 46 380 1.8 24.8 9.4 13.9 1.3 1 567 4 121
2016-17 38 36 263 46 386 1.4 24.5 9.5 14.0 1.3 1 575 4 081
2017-18 39 37 266 47 391 1.2 24.3 9.5 14.2 1.3 1 579 4 043
2018-19 39 37 270 47 395 1.2 24.0 9.5 14.4 1.4 1 584 4 008
2019-20 40 37 273 48 400 1.1 23.8 9.5 14.6 1.4 1 588 3 974
2020-21 40 38 276 48 404 1.1 23.5 9.5 14.8 1.4 1 591 3 938
2021-22 41 38 280 48 408 1.0 23.3 9.5 14.9 1.4 1 593 3 903
Compound annual
growth rate (%)
2001/02-2006/07 5.8 6.2 3.3 1.2 -1.5 7.7 6.0 -9.4 -3.9 -6.4 -5.0
2006/07-2011/12 -4.4 -1.7 -13.3 -3.7 -10.8 5.9 -5.6 -7.8 -13.0 -9.4 1.6
2011/12-2016/17 1.0 3.2 2.1 3.9 2.3 -1.2 1.1 1.7 2.8 1.4 -0.9
2016/17-2021/22 1.2 0.7 1.2 0.8 1.1 -1.0 0.1 1.2 1.3 0.2 -0.9
2001/02-2011/12 0.6 2.2 -5.4 -1.3 -6.3 6.8 0.0 -8.6 -8.6 -7.9 -1.7
2011/12-2021/22 1.1 1.9 1.7 2.4 1.7 -1.1 0.6 1.5 2.1 0.8 -0.9
Numbers shaded are forecasts
a Visiting friends and relatives
b Hotels, motels, guesthouses, and serviced apartments
c Total Inbound Tourism Expenditure, real, base = Quarter 4 2012
d Other refers to education and employment visitors w ho stay in Australia for one year or less. On average, these visitors spend more and stay longer than the average tourist.
Historical estimates for international visitor nights have changed due to a slight change in the methodology.
The sum of purpose of visit categories does not add to the total as the total includes estimates for those not reporting a purpose of visit to Australia�
0500
1000
1500
Arrivals (000s)
ArrivalsExpenditure
1000
2000
3000
4000
5000
Exp
enditu
re ($m)
2000-01 2003-04 2006-07 2009-10 2012-13 2015-16 2018-19 2021-22
Japan - Arrivals, 000s (LHS) and Expenditure, $m (RHS), 2001-01 to 2021-22
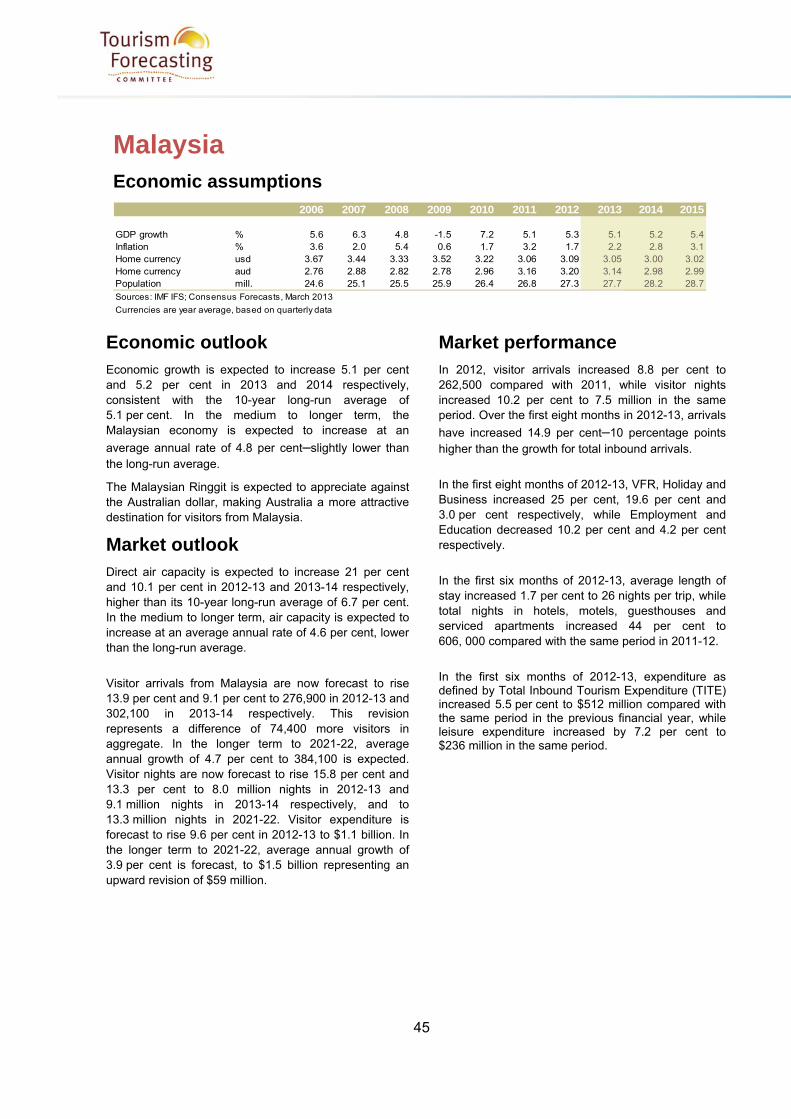
45
Malaysia Economic assumptions
Economic outlook Economic growth is expected to increase 5.1 per cent and 5.2 per cent in 2013 and 2014 respectively, consistent with the 10-year long-run average of 5.1 per cent. In the medium to longer term, the Malaysian economy is expected to increase at an
average annual rate of 4.8 per cent–slightly lower than the long-run average.
The Malaysian Ringgit is expected to appreciate against the Australian dollar, making Australia a more attractive destination for visitors from Malaysia.
Market outlook Direct air capacity is expected to increase 21 per cent and 10.1 per cent in 2012-13 and 2013-14 respectively, higher than its 10-year long-run average of 6.7 per cent. In the medium to longer term, air capacity is expected to increase at an average annual rate of 4.6 per cent, lower than the long-run average.
Visitor arrivals from Malaysia are now forecast to rise 13.9 per cent and 9.1 per cent to 276,900 in 2012-13 and 302,100 in 2013-14 respectively. This revision represents a difference of 74,400 more visitors in aggregate. In the longer term to 2021-22, average annual growth of 4.7 per cent to 384,100 is expected. Visitor nights are now forecast to rise 15.8 per cent and 13.3 per cent to 8.0 million nights in 2012-13 and 9.1 million nights in 2013-14 respectively, and to 13.3 million nights in 2021-22. Visitor expenditure is forecast to rise 9.6 per cent in 2012-13 to $1.1 billion. In the longer term to 2021-22, average annual growth of 3.9 per cent is forecast, to $1.5 billion representing an upward revision of $59 million.
Market performance In 2012, visitor arrivals increased 8.8 per cent to 262,500 compared with 2011, while visitor nights increased 10.2 per cent to 7.5 million in the same period. Over the first eight months in 2012-13, arrivals
have increased 14.9 per cent–10 percentage points higher than the growth for total inbound arrivals.
In the first eight months of 2012-13, VFR, Holiday and Business increased 25 per cent, 19.6 per cent and 3.0 per cent respectively, while Employment and Education decreased 10.2 per cent and 4.2 per cent respectively.
In the first six months of 2012-13, average length of stay increased 1.7 per cent to 26 nights per trip, while total nights in hotels, motels, guesthouses and serviced apartments increased 44 per cent to 606, 000 compared with the same period in 2011-12.
In the first six months of 2012-13, expenditure as defined by Total Inbound Tourism Expenditure (TITE) increased 5.5 per cent to $512 million compared with the same period in the previous financial year, while leisure expenditure increased by 7.2 per cent to $236 million in the same period.
2006 2007 2008 2009 2010 2011 2012 2013 2014 2015
GDP growth % 5.6 6.3 4.8 -1.5 7.2 5.1 5.3 5.1 5.2 5.4Inflation % 3.6 2.0 5.4 0.6 1.7 3.2 1.7 2.2 2.8 3.1Home currency usd 3.67 3.44 3.33 3.52 3.22 3.06 3.09 3.05 3.00 3.02Home currency aud 2.76 2.88 2.82 2.78 2.96 3.16 3.20 3.14 2.98 2.99Population mill. 24.6 25.1 25.5 25.9 26.4 26.8 27.3 27.7 28.2 28.7
Currencies are year average, based on quarterly data
Sources: IMF IFS; Consensus Forecasts, March 2013

46
Table 19 International visitor arrivals: Malaysia
Business VFRa Holiday Otherd Total Total Average Total Share of nights in Nights in TITEc TITE
change nights nights HMGSAb HMGSA Total per visitor
'000 per cent million per cent million $ million $
2000-01 14 27 87 17 148 n.a. 24.5 3.6 15.0 0.5 692 4 664
2001-02 13 24 83 19 154 3.9 22.8 3.5 13.5 0.5 730 4 732
2002-03 13 26 74 18 142 -7.7 23.0 3.3 13.1 0.4 663 4 656
2003-04 15 31 99 21 175 23.1 25.8 4.5 14.5 0.7 802 4 575
2004-05 16 33 90 23 169 -3.6 26.8 4.5 15.9 0.7 720 4 259
2005-06 16 29 80 25 153 -9.8 32.6 5.0 11.1 0.6 721 4 729
2006-07 18 31 77 28 157 3.0 33.9 5.3 11.8 0.6 772 4 918
2007-08 20 34 82 27 166 5.7 33.6 5.6 11.1 0.6 939 5 656
2008-09 18 41 99 33 195 17.5 34.5 6.7 11.2 0.8 967 4 957
2009-10 19 47 107 35 214 9.9 31.0 6.6 10.4 0.7 1 027 4 793
2010-11 21 53 125 37 244 13.8 28.7 7.0 10.8 0.8 1 048 4 299
2011-12 24 52 126 35 243 -0.3 28.5 6.9 12.1 0.8 1 046 4 303
2012-13 24 63 146 37 277 13.9 29.0 8.0 13.1 1.1 1 147 4 140
2013-14 26 69 161 39 302 9.1 30.1 9.1 12.8 1.2 1 249 4 136
2014-15 27 72 167 41 314 3.9 30.9 9.7 12.5 1.2 1 306 4 163
2015-16 28 75 171 44 324 3.3 31.5 10.2 12.1 1.2 1 356 4 181
2016-17 29 77 175 46 334 3.1 31.9 10.7 12.0 1.3 1 386 4 147
2017-18 30 79 180 48 344 2.9 32.5 11.2 11.9 1.3 1 414 4 112
2018-19 31 82 184 51 354 2.9 33.0 11.7 11.8 1.4 1 443 4 078
2019-20 32 84 188 53 364 2.8 33.5 12.2 11.8 1.4 1 471 4 044
2020-21 33 87 192 56 374 2.8 34.0 12.7 11.7 1.5 1 501 4 015
2021-22 34 89 196 58 384 2.7 34.5 13.3 11.6 1.5 1 530 3 985
Compound annual
growth rate (%)
2001/02-2006/07 6.6 5.0 -1.4 8.5 0.4 8.2 8.6 -2.7 5.7 1.1 0.8
2006/07-2011/12 5.5 11.1 10.2 4.5 9.1 -3.4 5.5 0.6 6.1 6.2 -2.6
2011/12-2016/17 4.1 8.3 6.9 5.7 6.6 2.3 9.0 -0.2 8.8 5.8 -0.7
2016/17-2021/22 3.0 3.0 2.3 4.9 2.8 1.6 4.4 -0.8 3.6 2.0 -0.8
2001/02-2011/12 6.0 8.0 4.2 6.5 4.7 2.3 7.0 -1.1 5.9 3.7 -0.9
2011/12-2021/22 3.6 5.6 4.6 5.3 4.7 1.9 6.7 -0.5 6.2 3.9 -0.8
Numbers shaded are forecasts
a Visiting friends and relatives
b Hotels, motels, guesthouses, and serviced apartments
c Total Inbound Tourism Expenditure, real, base = Quarter 4 2012
d Other refers to education and employment visitors w ho stay in Australia for one year or less. On average, these visitors spend more and stay longer than the average tourist.
Historical estimates for international visitor nights have changed due to a slight change in the methodology
The sum of purpose of visit categories does not add to the total as the total includes estimates for those not reporting a purpose of visit to Australia�
100
200
300
400
500
Arrivals (000s)
ArrivalsExpenditure 0
500
1000
1500
2000
Exp
enditu
re ($m)
2000-01 2003-04 2006-07 2009-10 2012-13 2015-16 2018-19 2021-22
Malaysia - Arrivals, 000s (LHS) and Expenditure, $m (RHS), 2001-01 to 2021-22

47
New Zealand Economic assumptions
Economic outlook Economic growth is expected to increase 2.6 per cent and
2.9 per cent in 2013 and 2014 respectively–higher than the 10 year long-run average of 2.1 per cent. In the medium to longer term, the New Zealand economy is expected to
increase at an average annual rate of 2.6 per cent–higher than the long-run average.
The New Zealand dollar is expected to appreciate against the Australian dollar making Australia a more attractive destination for visitors from New Zealand.
.
Market outlook Direct air capacity is expected to remain flat in 2012-13 before picking up to an increase of 1.0 per cent in 2013-14, much lower than its 10-year long-run average of 5.2 per cent. In the medium to longer term, air capacity is expected to increase at an average annual rate of 2.4 per cent, lower than the long-run average.
Visitor arrivals from New Zealand are now forecast to rise 1.6 per cent and 1.7 per cent to 1,210,600 in 2012-13 and 1,231,500 in 2013-14 respectively. This revision represents a difference of 21,400 more visitors in aggregate. In the longer term to 2021-22, average annual growth of 1.9 per cent to 1.4 million is expected. Visitor nights are now forecast to rise 2.8 per cent to 17.2 million nights in 2012-13 and decrease 0.3 per cent to 17.1 million nights in 2013-14respectively, and to increase to 19.4 million nights in 2021-22. Visitor expenditure is forecast to rise 2.4 per cent in 2012-13 to $2.3 billion. In the longer term to 2021-22, average annual growth of 1.9 per cent is forecast to $2.7 billion, representing an upward revision of $194 million.
Market performance In 2012, visitor arrivals increased 2.4 per cent to 1,200,700 compared with 2011. Visitor nights increased 2.0 per cent to 17 million in the same period. Over the first eight months in 2012-13,
arrivals have increased 1.7 per cent– 3.2 percentage points lower than growth for total inbound arrivals during the same period.
For the first eight months of 2012-13, Education and VFR increased 11.5 per cent and 2.7 per cent respectively, while Employment, Business and Holiday decreased 8.7 per cent, 0.4 per cent and 0.4 per cent respectively.
In the first six months of 2012-13, average length of stay increased 1.1 per cent to 14.8 nights per trip while total nights in hotels, motels, guesthouses and serviced apartments decreased 2.0 per cent to 1.9 million compared with the same period in 2011-12.
In the first six months of 2012-13, expenditure as defined by Total Inbound Tourism Expenditure (TITE) increased 1.3 per cent to $1.3 billion compared with the same period in the previous financial year, while leisure expenditure decreased by 3.4 per cent to $800 million in the same period.
2006 2007 2008 2009 2010 2011 2012 2013 2014 2015
GDP growth % 2.9 3.4 -0.8 -1.6 1.7 1.5 2.3 2.6 2.9 2.5Inflation % 3.4 2.4 4.0 2.1 2.3 4.0 1.1 1.4 2.2 2.5Home currency usd 1.54 1.36 1.42 1.60 1.39 1.27 1.24 1.21 1.25 1.24Home currency aud 1.16 1.14 1.19 1.25 1.27 1.31 1.28 1.24 1.24 1.23Population mill. 4.1 4.2 4.2 4.2 4.3 4.3 4.3 4.4 4.4 4.5
Currencies are year average, based on quarterly data
Sources: IMF IFS; Consensus Forecasts, March 2013

48
Table 20 International visitor arrivals: New Zealand
Business VFRa Holiday Otherd Total Total Average Total Share of nights in Nights in TITEc TITE
change nights nights HMGSAb HMGSA Total per visitor
'000 per cent million per cent million $ million $
2000-01 141 253 355 56 828 n.a. 16.7 13.8 15.2 2.1 1 988 2 399
2001-02 150 200 316 44 788 -4.9 14.1 11.1 22.6 2.5 1 877 2 383
2002-03 149 198 331 41 793 0.7 13.8 11.0 22.2 2.4 1 965 2 478
2003-04 170 247 406 48 926 16.8 13.7 12.6 23.2 2.9 2 055 2 219
2004-05 191 285 489 59 1 082 16.8 12.9 14.0 24.9 3.5 2 324 2 148
2005-06 201 281 485 75 1 091 0.8 14.5 15.8 23.2 3.7 2 447 2 243
2006-07 205 289 493 80 1 115 2.2 14.2 15.8 25.5 4.0 2 466 2 211
2007-08 213 302 468 86 1 121 0.6 13.9 15.6 25.3 3.9 2 548 2 273
2008-09 199 330 440 87 1 106 -1.4 13.8 15.3 23.0 3.5 2 263 2 047
2009-10 196 338 456 89 1 123 1.6 12.7 14.3 23.1 3.3 2 164 1 926
2010-11 208 360 464 100 1 183 5.3 13.9 16.4 21.6 3.5 2 246 1 899
2011-12 213 369 459 101 1 191 0.7 14.0 16.7 19.4 3.3 2 276 1 911
2012-13 213 380 461 103 1 211 1.6 14.2 17.2 18.8 3.2 2 332 1 926
2013-14 219 387 465 110 1 231 1.7 13.9 17.1 19.1 3.3 2 463 2 000
2014-15 224 396 474 115 1 259 2.3 14.2 17.9 19.0 3.4 2 558 2 031
2015-16 228 405 487 120 1 291 2.5 13.6 17.6 19.8 3.5 2 547 1 973
2016-17 231 414 498 125 1 318 2.2 13.6 17.9 19.8 3.6 2 588 1 963
2017-18 233 422 508 129 1 343 1.9 13.6 18.2 19.9 3.6 2 622 1 952
2018-19 236 430 518 133 1 368 1.8 13.5 18.5 20.0 3.7 2 652 1 939
2019-20 238 439 528 137 1 392 1.8 13.5 18.8 20.0 3.8 2 683 1 927
2020-21 240 447 537 142 1 417 1.8 13.5 19.1 20.1 3.8 2 714 1 915
2021-22 242 456 547 146 1 441 1.7 13.4 19.4 20.1 3.9 2 744 1 904
Compound annual
growth rate (%)
2001/02-2006/07 6.5 7.6 9.3 12.7 7.2 0.2 7.4 2.4 10.0 5.6 -1.5
2006/07-2011/12 0.8 5.0 -1.4 4.7 1.3 -0.2 1.2 -5.3 -4.2 -1.6 -2.9
2011/12-2016/17 1.6 2.3 1.7 4.4 2.0 -0.7 1.4 0.4 1.8 2.6 0.5
2016/17-2021/22 0.9 2.0 1.9 3.2 1.8 -0.2 1.6 0.3 1.8 1.2 -0.6
2001/02-2011/12 3.6 6.3 3.8 8.6 4.2 0.0 4.2 -1.5 2.7 1.9 -2.2
2011/12-2021/22 1.3 2.1 1.8 3.8 1.9 -0.4 1.5 0.3 1.8 1.9 0.0
Numbers shaded are forecasts
a Visiting friends and relatives
b Hotels, motels, guesthouses, and serviced apartments
c Total Inbound Tourism Expenditure, real, base = Quarter 4 2012
d Other refers to education and employment visitors w ho stay in Australia for one year or less. On average, these visitors spend more and stay longer than the average tourist.
Historical estimates for international visitor nights have changed due to a slight change in the methodology
The sum of purpose of visit categories does not add to the total as the total includes estimates for those not reporting a purpose of visit to Australia�
400
600
800
1000
1200
1400
1600
Arrivals (000s)
ArrivalsExpenditure
1500
2000
2500
3000
Exp
enditu
re ($m)
2000-01 2003-04 2006-07 2009-10 2012-13 2015-16 2018-19 2021-22
New Zealand - Arrivals, 000s (LHS) and Expenditure, $m (RHS), 2001-01 to 2021-22

49
Singapore Economic assumptions
Economic outlook Economic growth is expected to increase 2.7 per cent and
3.9 per cent in 2013 and 2014 respectively–lower than the 10 year long-run average of 6.2 per cent. In the medium to longer term, the Singaporean economy is expected to
increase at an average annual rate of 4.0 per cent–lower than the long-run average.
The Singapore dollar is expected to appreciate against the Australian dollar, making Australia a more attractive destination for visitors from Singapore.
Market outlook Direct air capacity is expected to increase 29.8 per cent and 15.1 per cent in 2012-13 and 2013-14 respectively–much higher than its 10 year long-run average of 4 per cent. In the medium to longer term, air capacity is expected to increase at an average annual rate of 7.0 per cent–higher than the long-run average.
Visitor arrivals from Singapore are now forecast to rise 12.5 per cent and 4.8 per cent to 359,700 in 2012-13 and 376,900 in 2013-14 respectively. This revision represents a difference of 67,300 more visitors in aggregate. In the longer term to 2021-22, average annual growth of 3.7 per cent to 458,000 is expected. Visitor nights are now forecast to rise 17.4 per cent and 4.9 per cent to 7.4 million nights in 2012-13 and 7.8 million nights in 2013-14 respectively, and to 9.3 million nights in 2021-22. Visitor expenditure is forecast to rise 1.3 per cent in 2012-13 to $1.2 billion. In the longer term to 2021-22, average annual growth of 2.1 per cent is forecast to $1.5 billion representing a downward revision of $156 million.
Market performance In 2012, visitor arrivals increased 7.8 per cent to 343,500 compared with 2011. Visitor nights increased 11.8 per cent to 6.8 million in the same period. Over the first eight months in 2012-13, arrivals have
increased 14.4 per cent–9.5 percentage points higher than growth of total inbound arrivals.
For the first eight months of 2012-13, Holiday, VFR and Business increased 27 per cent, 19 per cent and 6.6 per cent respectively, while Education and Employment increased 1.7 per cent and 0.1 per cent respectively.
In the first six months of 2012-13, average length of stay increased 1.6 per cent to 18.8 nights per trip, while the total nights in hotels, motels, guesthouses and serviced apartments decreased 1.0 per cent to 0.75 million compared with the same period in 2011-12.
In the first six months of 2012-13, expenditure as defined by Total Inbound Tourism Expenditure (TITE) increased 1.7 per cent to $613 million compared with the same period in the previous financial year, while leisure expenditure increased by 8.6 per cent to $270 million in the same period.
Singapore2006 2007 2008 2009 2010 2011 2012 2013 2014 2015
GDP growth % 8.6 8.5 1.8 -0.6 14.8 4.9 1.2 2.7 3.9 4.2Inflation % 1.0 2.1 6.5 0.6 2.8 5.2 4.6 3.7 3.3 2.6Home currency usd 1.59 1.51 1.42 1.45 1.36 1.26 1.25 1.22 1.21 1.19Home currency aud 1.20 1.26 1.20 1.15 1.25 1.30 1.29 1.26 1.20 1.18Population mill. 4.5 4.6 4.6 4.7 4.7 4.8 4.8 4.8 4.9 4.9
Currencies are year average, based on quarterly data
Sources: IMF IFS; Consensus Forecasts, March 2013

50
Table 21 International visitor arrivals: Singapore
Business VFRa Holiday Otherd Total Total Average Total Share of nights in Nights in TITEc TITE
change nights nights HMGSAb HMGSA Total per visitor
'000 per cent million per cent million $ million $
2000-01 42 33 188 22 293 n.a. 18.7 5.5 20.4 1.1 1 243 4 238
2001-02 34 32 155 31 296 0.8 16.4 4.9 24.3 1.2 1 285 4 343
2002-03 32 32 139 27 262 -11.5 18.0 4.7 22.9 1.1 1 195 4 567
2003-04 37 32 138 28 253 -3.5 18.2 4.6 22.8 1.1 912 3 611
2004-05 41 35 149 28 267 5.9 16.7 4.5 27.5 1.2 912 3 410
2005-06 52 34 125 33 252 -5.8 19.3 4.9 26.1 1.3 910 3 613
2006-07 59 35 126 34 263 4.6 20.1 5.3 25.9 1.4 991 3 763
2007-08 61 35 125 36 267 1.2 20.0 5.3 22.3 1.2 1 165 4 369
2008-09 58 40 133 37 278 4.5 19.7 5.5 22.9 1.3 1 107 3 978
2009-10 60 44 136 36 290 4.1 21.1 6.1 19.9 1.2 1 109 3 824
2010-11 68 47 144 42 315 8.8 19.5 6.1 22.4 1.4 1 231 3 902
2011-12 71 47 144 40 320 1.3 19.8 6.3 22.4 1.4 1 218 3 812
2012-13 76 55 174 39 360 12.5 20.7 7.4 20.6 1.5 1 234 3 431
2013-14 81 58 183 40 377 4.8 20.7 7.8 22.3 1.7 1 228 3 257
2014-15 85 60 188 42 390 3.6 20.6 8.0 21.7 1.7 1 287 3 297
2015-16 89 61 191 44 402 2.9 20.5 8.2 22.4 1.8 1 336 3 327
2016-17 93 63 194 46 411 2.4 20.5 8.4 22.6 1.9 1 366 3 322
2017-18 97 64 196 48 421 2.3 20.4 8.6 22.8 2.0 1 392 3 308
2018-19 101 65 198 50 430 2.2 20.4 8.8 23.0 2.0 1 417 3 296
2019-20 105 66 201 51 439 2.2 20.3 8.9 23.2 2.1 1 444 3 285
2020-21 109 67 203 53 449 2.1 20.3 9.1 23.4 2.1 1 469 3 274
2021-22 113 69 205 55 458 2.1 20.2 9.3 23.5 2.2 1 494 3 262
Compound annual
growth rate (%)
2001/02-2006/07 11.5 2.0 -4.0 2.0 -2.3 4.1 1.8 1.3 3.0 -5.0 -2.8
2006/07-2011/12 3.8 6.3 2.6 3.2 3.9 -0.3 3.7 -2.9 0.7 4.2 0.3
2011/12-2016/17 5.5 5.8 6.2 2.7 5.2 0.6 5.8 0.2 6.0 2.3 -2.7
2016/17-2021/22 3.9 1.9 1.2 3.6 2.2 -0.2 1.9 0.8 2.8 1.8 -0.4
2001/02-2011/12 7.6 4.1 -0.7 2.6 0.8 1.9 2.7 -0.8 1.9 -0.5 -1.3
2011/12-2021/22 4.7 3.8 3.6 3.1 3.7 0.2 3.9 0.5 4.4 2.1 -1.5
Numbers shaded are forecasts
a Visiting friends and relatives
b Hotels, motels, guesthouses, and serviced apartments
c Total Inbound Tourism Expenditure, real, base = Quarter 4 2012
d Other refers to education and employment visitors w ho stay in Australia for one year or less. On average, these visitors spend more and stay longer than the average tourist.
Historical estimates for international visitor nights have changed due to a slight change in the methodology
The sum of purpose of visit categories does not add to the total as the total includes estimates for those not reporting a purpose of visit to Australia�
200
250
300
350
400
450
500
Arrivals (000s
)
ArrivalsExpenditure 8
0010
00
120
01400
1600
Exp
enditu
re ($m)
2000-01 2003-04 2006-07 2009-10 2012-13 2015-16 2018-19 2021-22
Singapore - Arrivals, 000s (LHS) and Expenditure, $m (RHS), 2001-01 to 2021-22

51
South Korea Economic assumptions
Economic outlook Economic growth is expected to increase 3.0 per cent
and 3.7 per cent in 2013 and 2014–respectively, broadly consistent with the 10-year long-run average of 3.6 per cent. In the medium to longer term, the South Korean economy is expected to increase at an average annual rate of 3.6 per cent, the same as the long-run average.
The South Korean Won is expected to appreciate against the Australian dollar, making Australia a more attractive destination for visitors from South Korea.
Market outlook Direct air capacity is expected to decrease 4 per cent in 2012-13 before a likely pick-up to 2.9 per cent in 2013-14–higher than its 10-year long-run average of 2.6 per cent. In the medium to longer term, air capacity is expected to increase at an average annual rate of 2.3 per cent–lower than the long-run average.
Visitor arrivals from South Korea are now forecast to decrease 4.9 per cent in 2012-13 before picking up to 2.2 per cent in 2013-14 to 189,500 in 2012-13 and 193,600 in 2013-14 respectively. This revision represents a difference of 15,200 fewer visitors in aggregate. In the longer term to 2021-22, average annual growth of 2.4 per cent to 253,400 is expected. Visitor nights are now forecast to decrease 9.6 per cent to 12.1 million nights in 2012-13 and increase 1.1 per cent to 12.2 million in 2013-14, and to 18.8 million nights in 2021-22. Visitor expenditure is forecast to decrease 5.6 per cent in 2012-13 to $1.2 billion. In the longer term to 2021-22, average annual growth of 2.0 per cent is forecast to $1.6 billion, representing a downward revision of $102 million.
Market performance In 2012, visitor arrivals decreased 0.6 per cent to 196,700 compared with 2011. Visitor nights decreased 8.7 per cent to 12.7 million in the same period. Over the first eight months in 2012-13, arrivals
have decreased 4.1 per cent–9.0 percentage points lower than growth for total inbound arrivals.
In the first eight months of 2012-13, VFR increased 1.3 per cent, while Education, Employment, Holiday and Business decreased 14.9 per cent, 6.1 per cent, 4.4 per cent and 0.2 per cent respectively.
In the first six months of 2012-13, average length of stay decreased 7.7 per cent to 59 nights per trip while total nights in hotels, motels, guesthouses and serviced apartments decreased 8.8 per cent to 0.36 million compared with the same period in 2011-12.
In the first six months of 2012-13, expenditure as defined by Total Inbound Tourism Expenditure (TITE) decreased 13.0 per cent to $555 million in July to December 2012 compared with the same period in the previous financial year, while leisure expenditure decreased by 15.6 per cent to $298 million in the same period.
2006 2007 2008 2009 2010 2011 2012 2013 2014 2015
GDP growth % 5.2 5.1 2.3 0.3 6.3 3.6 2.0 3.0 3.7 4.0Inflation % 2.2 2.5 4.6 2.8 2.9 4.0 2.2 2.5 2.8 2.9Home currency usd 955 929 1099 1277 1157 1108 1127 1062 1040 1026Home currency aud 719 778 920 1001 1062 1143 1167 1094 1032 1018Population mill. 48.2 48.3 48.4 48.6 48.7 48.8 48.9 49.0 49.1 49.1
Currencies are year average, based on quarterly data
Sources: IMF IFS; Consensus Forecasts, March 2013

52
Table 22 International visitor arrivals: South Korea
Business VFRa Holiday Otherd Total Total Average Total Share of nights in Nights in TITEc TITE
change nights nights HMGSAb HMGSA Total per visitor
'000 per cent million per cent million $ million $
2000-01 16 23 97 24 165 n.a. 38.3 6.3 7.4 0.5 1 031 6 265
2001-02 14 17 103 26 181 10.0 33.6 6.1 9.8 0.6 1 000 5 525
2002-03 12 19 121 28 196 8.1 28.8 5.6 11.2 0.6 1 047 5 348
2003-04 14 21 140 32 216 10.2 29.0 6.3 12.4 0.8 1 050 4 866
2004-05 14 24 158 33 237 10.0 30.3 7.2 11.3 0.8 1 181 4 979
2005-06 15 23 163 41 243 2.4 42.1 10.2 11.6 1.2 1 410 5 805
2006-07 17 24 181 47 271 11.5 46.9 12.7 9.6 1.2 1 693 6 254
2007-08 17 27 148 43 236 -12.7 48.9 11.5 9.4 1.1 1 478 6 257
2008-09 13 24 113 41 193 -18.2 71.6 13.8 5.4 0.7 1 419 7 347
2009-10 14 25 115 40 196 1.5 74.6 14.6 4.9 0.7 1 271 6 484
2010-11 15 26 127 35 205 4.4 65.6 13.4 5.0 0.7 1 296 6 332
2011-12 16 26 121 35 199 -2.6 67.0 13.3 5.5 0.7 1 316 6 606
2012-13 16 26 114 32 189 -4.9 63.7 12.1 5.8 0.7 1 242 6 556
2013-14 16 27 116 32 194 2.2 63.0 12.2 6.3 0.8 1 268 6 547
2014-15 17 28 121 34 201 4.0 64.7 13.0 7.1 0.9 1 319 6 551
2015-16 17 29 126 35 209 3.8 66.0 13.8 6.5 0.9 1 361 6 515
2016-17 18 30 130 37 216 3.6 67.3 14.6 6.1 0.9 1 402 6 479
2017-18 18 30 135 39 224 3.3 68.7 15.4 5.7 0.9 1 439 6 437
2018-19 19 31 139 40 231 3.3 70.1 16.2 5.3 0.9 1 479 6 405
2019-20 19 32 143 42 238 3.2 71.5 17.0 4.9 0.8 1 519 6 373
2020-21 20 33 148 44 246 3.2 72.9 17.9 4.6 0.8 1 558 6 338
2021-22 20 34 152 46 253 3.1 74.3 18.8 4.3 0.8 1 598 6 304
Compound annual
growth rate (%)
2001/02-2006/07 3.8 7.4 11.9 13.1 8.4 6.9 15.9 -0.4 15.3 11.1 2.5
2006/07-2011/12 -1.3 1.5 -7.8 -5.9 -5.9 7.4 1.0 -10.7 -9.8 -4.9 1.1
2011/12-2016/17 2.4 2.5 1.6 1.1 1.7 0.1 1.8 2.2 4.0 1.3 -0.4
2016/17-2021/22 2.6 2.6 3.2 4.2 3.2 2.0 5.3 -6.9 -2.0 2.6 -0.5
2001/02-2011/12 1.2 4.4 1.6 3.2 1.0 7.1 8.2 -5.7 2.0 2.8 1.8
2011/12-2021/22 2.5 2.5 2.4 2.6 2.4 1.0 3.5 -2.4 1.0 2.0 -0.5
Numbers shaded are forecasts
a Visiting friends and relatives
b Hotels, motels, guesthouses, and serviced apartments
c Total Inbound Tourism Expenditure, real, base = Quarter 4 2012
d Other refers to education and employment visitors w ho stay in Australia for one year or less. On average, these visitors spend more and stay longer than the average tourist.
Historical estimates for international visitor nights have changed due to a slight change in the methodology
The sum of purpose of visit categories does not add to the total as the total includes estimates for those not reporting a purpose of visit to Australia�
100
150
200
250
300
Arrivals (00
0s)
ArrivalsExpenditure 50
0100
015
0020
00
Exp
end
iture ($m
)
2000-01 2003-04 2006-07 2009-10 2012-13 2015-16 2018-19 2021-22
South Korea - Arrivals, 000s (LHS) and Expenditure, $m (RHS), 2001-01 to 2021-22

53
Thailand Table 23 International visitor arrivals: Thailand
Business VFRa Holiday Otherd Total Total Average Total Share of nights in Nights in TITEc TITE
change nights nights HMGSAb HMGSA Total per visitor
'000 per cent million per cent million $ million $
2000-01 9 11 40 14 78 n.a. 39.0 3.0 6.5 0.2 388 4 987
2001-02 9 10 35 13 80 2.7 30.2 2.4 11.6 0.3 432 5 400
2002-03 11 10 31 16 76 -5.6 34.2 2.6 8.8 0.2 433 5 732
2003-04 11 11 35 16 79 4.4 31.9 2.5 14.2 0.4 437 5 544
2004-05 13 12 31 17 79 0.7 36.3 2.9 13.4 0.4 426 5 376
2005-06 14 12 29 18 75 -5.7 39.6 3.0 9.4 0.3 381 5 088
2006-07 14 13 28 19 77 3.0 41.6 3.2 11.6 0.4 374 4 855
2007-08 16 14 31 19 84 9.3 38.5 3.2 11.6 0.4 426 5 055
2008-09 13 14 26 20 77 -8.1 49.6 3.8 7.4 0.3 491 6 343
2009-10 15 16 29 19 83 7.5 46.6 3.9 6.8 0.3 448 5 385
2010-11 16 15 32 19 88 5.4 50.6 4.4 9.8 0.4 515 5 882
2011-12 15 16 27 17 81 -7.5 51.8 4.2 6.4 0.3 405 4 992
2012-13 16 18 28 17 85 4.9 50.2 4.3 7.4 0.3 434 5 108
2013-14 17 19 29 19 89 4.4 47.9 4.2 7.6 0.3 462 5 206
2014-15 17 19 31 20 93 5.0 46.9 4.4 8.3 0.4 493 5 287
2015-16 18 20 32 21 97 4.0 46.8 4.5 8.3 0.4 509 5 254
2016-17 19 21 34 22 100 3.6 47.0 4.7 8.3 0.4 526 5 242
2017-18 19 22 35 22 104 3.3 47.2 4.9 8.3 0.4 543 5 231
2018-19 20 22 36 23 107 3.3 47.5 5.1 8.2 0.4 559 5 214
2019-20 20 23 38 24 111 3.2 47.8 5.3 8.2 0.4 575 5 197
2020-21 21 24 39 25 114 3.2 48.0 5.5 8.2 0.4 591 5 184
2021-22 21 25 41 25 118 3.1 48.3 5.7 8.2 0.5 608 5 169
Compound annual
growth rate (%)
2001/02-2006/07 9.3 5.7 -4.5 7.3 -0.7 6.6 5.8 0.0 5.8 -2.8 -2.1
2006/07-2011/12 1.5 4.7 -0.4 -2.3 1.0 4.5 5.5 -11.2 -6.3 1.6 0.6
2011/12-2016/17 3.9 5.1 4.3 5.1 4.4 -1.9 2.4 5.2 7.7 5.4 1.0
2016/17-2021/22 2.6 3.5 3.8 3.4 3.2 0.6 3.8 -0.3 3.5 2.9 -0.3
2001/02-2011/12 5.3 5.2 -2.5 2.4 0.1 5.5 5.7 -5.8 -0.4 -0.6 -0.8
2011/12-2021/22 3.2 4.3 4.0 4.2 3.8 -0.7 3.1 2.4 5.6 4.2 0.3
Numbers shaded are forecasts
a Visiting friends and relatives
b Hotels, motels, guesthouses, and serviced apartments
c Total Inbound Tourism Expenditure, real, base = Quarter 4 2012
d Other refers to education and employment visitors w ho stay in Australia for one year or less. On average, these visitors spend more and stay longer than the average tourist.
Historical estimates for international visitor nights have changed due to a slight change in the methodology
The sum of purpose of visit categories does not add to the total as the total includes estimates for those not reporting a purpose of visit to Australia�
6070
8090
100
110
120
Arrivals (00
0s)
ArrivalsExpenditure 30
040
0500
600
700
Exp
end
iture ($m
)
2000-01 2003-04 2006-07 2009-10 2012-13 2015-16 2018-19 2021-22
Thailand - Arrivals, 000s (LHS) and Expenditure, $m (RHS), 2001-01 to 2021-22

54
Rest of Asia Table 24 International visitor arrivals: Rest of Asia
Business VFRa Holiday Otherd Total Total Average Total Share of nights in Nights in TITEc TITE
change nights nights HMGSAb HMGSA Total per visitor '000 per cent million per cent million $ million $
2000-01 19 30 108 34 206 n.a. 27.5 5.7 13.6 0.8 983 4 766
2001-02 15 24 83 25 174 -15.6 27.6 4.8 13.3 0.6 892 5 129
2002-03 14 23 66 23 149 -14.6 28.7 4.3 14.2 0.6 817 5 497
2003-04 16 30 92 27 180 20.9 25.0 4.5 14.3 0.6 860 4 787
2004-05 18 33 97 27 185 2.9 28.9 5.3 12.4 0.7 772 4 175
2005-06 20 36 99 32 190 2.9 35.5 6.8 12.1 0.8 839 4 413
2006-07 24 43 91 38 200 5.4 38.0 7.6 10.3 0.8 878 4 378
2007-08 26 49 85 43 207 3.3 46.9 9.7 7.0 0.7 1 049 5 065
2008-09 25 53 96 52 230 10.8 53.4 12.3 7.2 0.9 1 304 5 682
2009-10 27 57 93 55 237 3.4 56.3 13.4 6.0 0.8 1 324 5 577
2010-11 28 56 86 59 235 -1.0 59.7 14.0 5.4 0.8 1 315 5 596
2011-12 28 59 96 63 251 6.9 69.9 17.6 5.3 0.9 1 420 5 655
2012-13 27 66 105 66 269 7.2 65.5 17.6 5.5 1.0 1 472 5 468
2013-14 28 70 111 69 283 5.1 64.9 18.4 5.5 1.0 1 551 5 482
2014-15 29 73 117 72 297 5.0 63.9 19.0 5.2 1.0 1 586 5 339
2015-16 31 76 124 75 311 4.6 65.7 20.4 5.2 1.1 1 739 5 596
2016-17 32 79 130 78 324 4.3 66.6 21.6 5.2 1.1 1 821 5 619
2017-18 34 82 135 81 337 3.9 67.5 22.7 5.1 1.2 1 903 5 648
2018-19 35 85 141 84 350 3.9 68.5 24.0 5.1 1.2 1 988 5 680
2019-20 37 88 147 87 363 3.8 69.6 25.3 5.0 1.3 2 077 5 715
2020-21 38 91 153 90 377 3.8 70.7 26.7 5.0 1.3 2 169 5 750
2021-22 40 94 159 93 391 3.7 71.8 28.1 4.9 1.4 2 265 5 791
Compound annual growth rate (%)2001/02-2006/07 9.3 12.4 2.0 8.7 2.9 6.6 9.7 -4.9 4.4 -0.3 -3.1
2006/07-2011/12 2.8 6.7 0.9 10.9 4.6 13.0 18.2 -12.6 3.3 10.1 5.3
2011/12-2016/17 3.1 6.1 6.2 4.2 5.2 -1.0 4.2 -0.5 3.7 5.1 -0.1
2016/17-2021/22 4.3 3.5 4.2 3.7 3.8 1.5 5.4 -0.9 4.5 4.5 0.6
2001/02-2011/12 6.0 9.5 1.5 9.8 3.7 9.8 13.9 -8.8 3.8 4.8 1.0
2011/12-2021/22 3.7 4.8 5.2 3.9 4.5 0.3 4.8 -0.7 4.1 4.8 0.2
Numbers shaded are forecasts
a Visiting friends and relatives
b Hotels, motels, guesthouses, and serviced apartments
c Total Inbound Tourism Expenditure, real, base = Quarter 4 2012
d Other refers to education and employment visitors w ho stay in Australia for one year or less. On average, these visitors spend more and stay longer than the average tourist
Historical estimates for international visitor nights have changed due to a slight change in the methodology
The sum of purpose of visit categories does not add to the total as the total includes estimates for those not reporting a purpose of visit to Australia�
150
200
250
300
350
400
Arrivals (000s)
ArrivalsExpenditure 5
00
1000
1500
2000
2500
Exp
enditu
re ($m)
2000-01 2003-04 2006-07 2009-10 2012-13 2015-16 2018-19 2021-22
Rest of Asia - Arrivals, 000s (LHS) and Expenditure, $m (RHS), 2001-01 to 2021-22

55
Europe France Table 25 International visitor arrivals: France
Business VFRa Holiday Otherd Total Total Average Total Share of nights in Nights in TITEc TITE
change nights nights HMGSAb HMGSA Total per visitor
('000) per cent million per cent million $ million $
2000-01 10 10 24 8 54 n.a. 26.3 1.4 25.8 0.4 304 5 613
2001-02 8 9 22 8 52 -4.1 37.0 1.9 14.7 0.3 333 6 404
2002-03 6 9 20 7 46 -10.9 35.8 1.7 17.1 0.3 322 6 957
2003-04 8 8 23 14 57 23.8 44.3 2.5 13.4 0.3 362 6 311
2004-05 9 11 29 7 59 3.0 31.9 1.9 13.4 0.3 317 5 366
2005-06 9 11 37 8 66 11.2 35.8 2.3 18.8 0.4 366 5 5812006-07 10 11 39 9 70 6.5 53.3 3.7 13.1 0.5 499 7 141
2007-08 11 13 43 11 78 11.6 46.7 3.6 13.3 0.5 537 6 887
2008-09 10 13 50 15 89 14.6 52.0 4.7 11.3 0.5 654 7 315
2009-10 10 15 56 15 97 9.0 54.3 5.3 8.6 0.5 622 6 377
2010-11 10 15 54 14 94 -3.1 54.6 5.2 7.6 0.4 565 5 982
2011-12 10 16 54 15 96 1.2 60.6 5.8 8.0 0.5 563 5 892
2012-13 10 17 54 16 99 3.1 59.8 5.9 7.1 0.4 594 6 024
2013-14 11 18 55 17 102 3.6 58.9 6.0 7.7 0.5 678 6 640
2014-15 11 19 58 18 107 4.9 58.2 6.2 8.2 0.5 732 6 837
2015-16 12 19 61 19 112 4.3 57.5 6.4 7.9 0.5 775 6 946
2016-17 12 20 63 19 116 3.9 57.0 6.6 7.9 0.5 806 6 950
2017-18 13 21 65 20 120 3.6 56.5 6.8 7.8 0.5 838 6 972
2018-19 13 21 68 21 124 3.5 56.0 7.0 7.8 0.5 871 6 9942019-20 13 22 70 22 129 3.5 55.5 7.2 7.7 0.6 904 7 018
2020-21 14 23 72 23 133 3.4 55.0 7.3 7.7 0.6 938 7 040
2021-22 14 23 75 24 138 3.4 54.5 7.5 7.7 0.6 972 7 060
Compound annual
growth rate (%)
2001/02-2006/07 4.1 3.8 12.6 3.8 6.1 - 7.6 14.1 -2.4 11.4 8.4 2.2
2006/07-2011/12 -0.9 8.0 6.5 9.2 6.5 - 2.6 9.3 -9.3 -0.9 2.4 -3.8
2011/12-2016/17 4.5 4.2 3.3 5.8 3.9 - -1.2 2.7 -0.4 2.2 7.4 3.4
2016/17-2021/22 3.5 3.3 3.5 3.9 3.5 - -0.9 2.6 -0.5 2.0 3.8 0.3
2001/02-2011/12 1.6 5.9 9.5 6.5 6.3 - 5.1 11.7 -5.9 5.1 5.4 -0.8
2011/12-2021/22 4.0 3.7 3.4 4.8 3.7 - -1.1 2.6 -0.5 2.1 5.6 1.8
Numbers shaded are forecasts
a Visiting friends and relatives
b Hotels, motels, guesthouses, and serviced apartments
c Total Inbound Tourism Expenditure, real, base = Quarter 4 2012
d Other refers to education and employment visitors w ho stay in Australia for one year or less. On average, these visitors spend more and stay longer than the average tourist
Historical estimates for international visitor nights have changed due to a slight change in the methodology
The sum of purpose of visit categories does not add to the total as the total includes estimates for those not reporting a purpose of visit to Australia�
050
100
150
Arrivals (000s)
ArrivalsExpenditure
200
400
600
800
1000
Exp
enditu
re ($m)
2000-01 2003-04 2006-07 2009-10 2012-13 2015-16 2018-19 2021-22
France - Arrivals, 000s (LHS) and Expenditure, $m (RHS), 2001-01 to 2021-22

56
Ireland Table 26 International visitor arrivals: Ireland
Business VFRa Holiday Otherd Total Total Average Total Share of nights in Nights in TITEc TITE
change nights nights HMGSAb HMGSA Total per visitor('000) per cent million per cent million $ million $
2000-01 2 12 28 5 50 n.a. 69.1 3.4 5.7 0.2 537 10 8092001-02 2 12 28 5 51 1.7 68.6 3.5 5.6 0.2 433 8 5662002-03 2 11 27 4 47 -6.6 54.0 2.5 8.2 0.2 414 8 7632003-04 2 12 32 6 54 15.1 52.6 2.9 7.4 0.2 512 9 4312004-05 2 14 34 5 57 4.0 61.1 3.5 6.1 0.2 571 10 0962005-06 2 14 37 6 60 5.3 61.2 3.6 12.7 0.5 677 11 3792006-07 2 16 38 7 63 6.3 59.1 3.7 13.9 0.5 660 10 4322007-08 2 17 42 8 69 9.4 54.9 3.8 10.7 0.4 669 9 6652008-09 3 16 37 11 67 -2.9 60.5 4.1 8.0 0.3 780 11 6002009-10 2 17 31 9 59 -12.4 68.9 4.1 8.7 0.4 608 10 3272010-11 2 14 25 11 53 -10.3 70.6 3.7 12.9 0.5 529 10 0172011-12 3 17 26 16 62 17.7 81.9 5.1 7.5 0.4 671 10 8002012-13 3 19 23 17 62 0.0 81.9 5.1 5.7 0.3 663 10 6632013-14 3 20 24 18 64 3.6 80.0 5.2 6.7 0.3 687 10 6552014-15 3 20 25 18 67 3.9 78.7 5.3 7.5 0.4 725 10 8242015-16 3 21 26 19 69 3.3 76.6 5.3 8.9 0.5 741 10 7132016-17 3 21 27 19 71 3.0 74.9 5.3 8.9 0.5 757 10 6312017-18 3 21 28 20 73 2.6 73.2 5.4 8.9 0.5 771 10 5512018-19 3 21 29 20 75 2.6 71.6 5.4 8.9 0.5 785 10 4732019-20 3 22 30 21 77 2.5 70.0 5.4 8.9 0.5 799 10 3962020-21 3 22 31 21 79 2.4 68.5 5.4 8.9 0.5 812 10 3192021-22 3 22 32 22 81 2.4 67.0 5.4 8.9 0.5 825 10 243
Compound annual
growth rate (%)
2001/02-2006/07 8.5 6.2 6.2 9.6 4.6 - -2.9 1.5 19.9 21.8 8.8 4.0
2006/07-2011/12 1.3 1.7 -7.4 17.0 -0.4 - 6.8 6.4 -11.7 -6.0 0.3 0.7
2011/12-2016/17 3.2 4.1 1.2 3.8 2.8 - -1.8 0.9 3.5 4.5 2.4 -0.3
2016/17-2021/22 2.1 1.5 3.4 2.4 2.5 - -2.2 0.2 0.0 0.2 1.7 -0.7
2001/02-2011/12 4.8 3.9 -0.8 13.2 2.1 - 1.8 3.9 2.9 7.0 4.5 2.3
2011/12-2021/22 2.6 2.8 2.3 3.1 2.6 - -2.0 0.6 1.7 2.3 2.1 -0.5
Numbers shaded are forecasts
a Visiting friends and relatives
b Hotels, motels, guesthouses, and serviced apartments
c Total Inbound Tourism Expenditure, real, base = Quarter 4 2012
d Other refers to education and employment visitors w ho stay in Australia for one year or less. On average, these visitors spend more and stay longer than the average tourist.
Historical estimates for international visitor nights have changed due to a slight change in the methodology
The sum of purpose of visit categories does not add to the total as the total includes estimates for those not reporting a purpose of visit to Australia�
40
50
60
70
80
90
Arrivals (000s)
ArrivalsExpenditure 3
00
400
500
600
700
800
900
Exp
enditu
re ($m)
2000-01 2003-04 2006-07 2009-10 2012-13 2015-16 2018-19 2021-22
Ireland - Arrivals, 000s (LHS) and Expenditure, $m (RHS), 2001-01 to 2021-22

57
Germany
Economic assumptions
Economic outlook Economic growth is expected to increase 0.7 per cent
and 1.7 per cent in 2013 and 2014 respectively–lower than the 10-year long-run average of 1.2 per cent. In the medium to longer term, the German economy is expected to increase at an average annual rate of
1.4 per cent–higher than the long-run average.
The Euro is expected to appreciate against the Australian dollar making Australia a more attractive destination for visitors from Germany.
Market outlook Visitor arrivals from Germany are now forecast to rise 2.7 per cent and 1.7 per cent to 155,800 in 2012-13 and 158,500 in 2013-14 respectively. This revision represents a difference of 6,800 more visitors in aggregate. In the longer term to 2021-22, average annual growth of 2.9 per cent to 201,900 is expected. Visitor nights are now forecast to rise 4.0 per cent and 1.5 per cent to 7.5 million nights in 2012-13 and 7.7 million nights in 2013-14 respectively, and to 9.0 million nights in 2021-22. Visitor expenditure is forecast to rise 2.0 per cent in 2012-13 to $920 million. In the longer term to 2021-22, average annual growth of 3.3 per cent is forecast to $1.2 billion, representing an, upward revision of $129 million.
Market performance In 2012, visitor arrivals increased 0.7 per cent to 154,900 compared with 2011. Visitor nights increased 2.3 per cent to 7.7 million in the same period. Over the first eight months in 2012-13, arrivals
have increased 3.3 per cent–1.6 percentage points lower than growth for total inbound arrivals.
In the first eight months of 2012/13, Education, Holiday and Visiting Friends and Relatives increased 8.4 per cent, 4.4 per cent and 1.8 per cent respectively, while Employment and Business decreased 10.2 per cent and 7.5 per cent respectively.
In the first six months of 2012-13, average length of stay increased 7.3 per cent to 52 nights per trip, while total nights in hotels, motels, guesthouses and serviced apartments decreased 25 per cent to 427,000 compared with the same period in 2011-12.
In the first six months of 2012-13, expenditure as defined by Total Inbound Tourism Expenditure (TITE) decreased 6.0 per cent to $477 million compared with the same period in the previous financial year, while leisure expenditure decreased by 7.8 per cent to $348 million in the same period.
2006 2007 2008 2009 2010 2011 2012 2013 2014 2015
GDP growth % 3.9 3.4 0.8 -5.1 3.6 3.1 0.7 0.7 1.7 1.9Inflation % 1.6 2.3 2.6 0.3 1.1 2.3 2.0 1.8 2.0 2.2Home currency usd 0.80 0.73 0.68 0.72 0.75 0.72 0.78 0.76 0.78 0.77Home currency aud 0.60 0.59 0.58 0.57 0.69 0.74 0.81 0.78 0.77 0.76Population mill. 82.4 82.4 82.3 82.3 82.3 82.2 82.1 82.1 82.0 81.9
Currencies are year average, based on quarterly data
Sources: IMF IFS; Consensus Forecasts, March 2013

58
Table 27 International visitor arrivals: Germany
Business VFRa Holiday Otherd Total Total Average Total Share of nights in Nights in TITEc TITE
change nights nights HMGSAb HMGSA Total per visitor
'000 per cent million per cent million $ million $
2000-01 15 21 97 9 148 n.a. 31.1 4.6 31.1 1.4 1 159 7 854
2001-02 11 16 86 11 137 -7.3 40.3 5.5 26.1 1.4 1 214 8 879
2002-03 11 16 87 10 134 -2.0 34.9 4.7 23.6 1.1 1 094 8 160
2003-04 13 18 86 15 141 5.2 46.2 6.5 13.0 0.8 1 152 8 169
2004-05 14 20 90 12 142 1.0 39.7 5.7 17.8 1.0 1 057 7 424
2005-06 17 20 99 15 150 5.6 44.7 6.7 17.7 1.2 1 039 6 909
2006-07 17 20 95 16 149 -1.1 46.4 6.9 17.0 1.2 1 094 7 362
2007-08 18 21 98 18 155 4.4 45.9 7.1 14.6 1.0 1 170 7 540
2008-09 16 21 99 20 159 2.3 47.1 7.5 13.8 1.0 1 204 7 590
2009-10 16 23 103 20 163 2.7 45.6 7.4 13.9 1.0 1 080 6 627
2010-11 17 23 99 18 159 -2.3 43.2 6.9 12.8 0.9 920 5 773
2011-12 17 24 91 18 152 -4.8 47.8 7.3 13.3 1.0 901 5 943
2012-13 16 24 95 18 156 2.7 48.4 7.5 10.3 0.8 920 5 903
2013-14 17 25 96 19 158 1.7 48.3 7.7 9.6 0.7 990 6 249
2014-15 17 26 99 20 164 3.6 48.3 7.9 9.9 0.8 1 026 6 247
2015-16 18 26 103 21 170 3.3 48.1 8.2 9.8 0.8 1 072 6 316
2016-17 18 27 106 22 175 3.2 47.4 8.3 9.9 0.8 1 100 6 287
2017-18 19 28 108 23 180 3.0 46.8 8.4 9.9 0.8 1 129 6 262
2018-19 19 29 111 24 186 2.9 46.1 8.6 10.0 0.9 1 156 6 231
2019-20 20 30 114 25 191 2.9 45.5 8.7 10.0 0.9 1 185 6 204
2020-21 20 31 117 26 196 2.8 44.9 8.8 10.0 0.9 1 213 6 177
2021-22 20 32 120 27 202 2.8 44.3 9.0 10.1 0.9 1 242 6 153
Compound annual
growth rate (%)
2001/02-2006/07 8.1 4.1 2.0 8.9 1.7 2.9 4.6 -8.2 -4.0 -2.1 -3.7
2006/07-2011/12 0.7 3.4 -0.8 1.7 0.4 0.6 1.0 -4.8 -3.9 -3.8 -4.2
2011/12-2016/17 0.9 2.8 2.9 4.7 2.9 -0.2 2.7 -5.8 -3.2 4.1 1.1
2016/17-2021/22 2.5 3.2 2.6 4.4 2.9 -1.3 1.5 0.4 1.9 2.5 -0.4
2001/02-2011/12 4.3 3.8 0.6 5.2 1.0 1.7 2.8 -6.5 -3.9 -2.9 -3.9
2011/12-2021/22 1.7 3.0 2.8 4.5 2.9 -0.7 2.1 -2.7 -0.7 3.3 0.3
Numbers shaded are forecasts
a Visiting friends and relatives
b Hotels, motels, guesthouses, and serviced apartments
c Total Inbound Tourism Expenditure, real, base = Quarter 4 2012
d Other refers to education and employment visitors w ho stay in Australia for one year or less. On average, these visitors spend more and stay longer than the average tourist.
Historical estimates for international visitor nights have changed due to a slight change in the methodology
The sum of purpose of visit categories does not add to the total as the total includes estimates for those not reporting a purpose of visit to Australia�
140
160
180
200
Arrivals (000s)
ArrivalsExpenditure
600
800
1000
1200
1400
Expenditure ($m)
2000-01 2003-04 2006-07 2009-10 2012-13 2015-16 2018-19 2021-22
Germany - Arrivals, 000s (LHS) and Expenditure, $m (RHS), 2001-01 to 2021-22

59
United Kingdom Economic assumptions
Economic outlook Economic growth is expected to increase 0.9 per cent
and 1.6 per cent in 2013 and 2014 respectively–broadly consistent with the 10-year long-run average of 1.3 per cent. In the medium to longer term, the British economy is expected to increase at an average annual
rate of 1.9 per cent–higher than the long-run average.
The British Pound is expected to appreciate against the Australian dollar, making Australia a more attractive destination for visitors from the United Kingdom.
Market outlook Direct air capacity is expected to decrease 30 per cent and 5.5 per cent in 2012-13 and 2013-14 respectively against its 10-year long-run average growth rate of 0.6 per cent. In the medium to longer term, air capacity is expected to increase at an average annual rate of 0.1 per cent, slightly higher than the long-run average.
Visitor arrivals from the United Kingdom are now forecast to decrease 2.0 per cent to 585,300 in 2012-13 and increase 1.3 per cent to 592,700 in 2013-14. This revision represents a difference of 9,900 fewer visitors in aggregate. In the longer term to 2021-22, average annual growth of 1.7 per cent to 705,700 is expected. Visitor nights are now forecast to rise 4.4 per cent to 23 million nights in 2012-13 and decrease 4.8 per cent to 22 million nights in 2013-14 respectively, and to 24 million nights in 2021-22. Visitor expenditure is forecast to rise 3.8 per cent in 2012-13 to $3 billion. In the longer term to 2021-22, average annual growth of 1.8 per cent is forecast to $3.4 billion, representing an upward revision of $94 million.
Market performance In 2012, visitor arrivals decreased 2.4 per cent to 593,700 compared with 2011. Visitor nights increased 6.9 per cent to 24 million in the same period. Over the first eight months in 2012-13, arrivals have decreased 1.9 per cent. This is 6.8 percentage points lower than growth for total inbound arrivals.
In the first eight months of 2012-13, VFR increased 1.8 per cent, while Education, Holiday, Employment and Business decreased 8.1 per cent, 6.4 per cent, 2 per cent and 1.6 per cent respectively.
In the first six months of 2012-13, average length of stay increased 19.7 per cent to 43 nights per trip, while total nights in hotels, motels, guesthouses and serviced apartments increased 21.6 per cent to 1.5 million compared with the same period in 2011-12.
For the first six months of 2012-13, expenditure as defined by Total Inbound Tourism Expenditure (TITE) increased 5.2 per cent to $1.6 billion compared with the same period in the previous financial year, while leisure expenditure increased by 5.4 per cent to $1.2 billion in the same period.
2006 2007 2008 2009 2010 2011 2012 2013 2014 2015
GDP growth % 2.6 3.6 -1.0 -4.0 1.8 0.9 0.0 0.9 1.6 2.2Inflation % 2.3 2.3 3.6 2.2 3.3 4.5 2.8 2.8 2.5 2.5Home currency usd 0.54 0.50 0.54 0.64 0.65 0.62 0.63 0.63 0.64 0.63Home currency aud 0.41 0.42 0.46 0.50 0.59 0.64 0.65 0.65 0.63 0.62Population mill. 60.7 60.9 61.0 61.2 61.4 61.5 61.7 61.9 62.1 62.3
Currencies are year average, based on quarterly data
Sources: IMF IFS; Consensus Forecasts, March 2013

60
Table 28 International visitor arrivals: United Kingdom
Business VFRa Holiday Otherd Total Total Average Total Share of nights in Nights in TITEc TITE
change nights nights HMGSAb HMGSA Total per visitor
'000 per cent million per cent million $ million $
2000-01 46 220 293 31 605 n.a. 40.8 24.7 12.0 3.0 4 416 7 294
2001-02 41 200 296 36 627 3.6 38.8 24.3 15.4 3.8 4 688 7 475
2002-03 44 208 314 34 644 2.7 36.8 23.7 15.8 3.7 4 743 7 362
2003-04 46 229 337 42 686 6.5 40.9 28.1 14.5 4.1 4 753 6 925
2004-05 45 244 359 26 699 1.9 33.2 23.2 17.9 4.2 4 343 6 209
2005-06 52 251 370 33 709 1.4 33.4 23.7 19.7 4.7 4 295 6 055
2006-07 54 252 390 33 733 3.4 33.2 24.4 19.5 4.8 4 744 6 469
2007-08 53 255 340 34 686 -6.4 32.4 22.2 17.9 4.0 4 287 6 246
2008-09 47 253 317 36 659 -4.0 35.5 23.4 15.8 3.7 4 067 6 175
2009-10 49 263 299 34 653 -0.9 36.5 23.8 12.5 3.0 3 432 5 257
2010-11 54 253 280 38 632 -3.1 35.8 22.6 14.3 3.2 3 141 4 967
2011-12 59 252 239 40 597 -5.6 36.4 21.7 11.9 2.6 2 867 4 802
2012-13 60 256 222 39 585 -2.0 38.8 22.7 12.5 2.8 2 975 5 083
2013-14 62 259 224 40 593 1.3 36.4 21.6 13.9 3.0 3 205 5 408
2014-15 64 265 228 41 605 2.0 35.1 21.2 15.2 3.2 3 233 5 346
2015-16 66 272 232 42 620 2.5 34.7 21.5 14.8 3.2 3 245 5 234
2016-17 67 279 239 43 635 2.4 34.8 22.1 14.6 3.2 3 284 5 171
2017-18 69 285 244 44 649 2.2 34.7 22.5 14.6 3.3 3 314 5 106
2018-19 71 291 249 44 663 2.2 34.6 22.9 14.6 3.3 3 346 5 046
2019-20 73 297 255 45 677 2.1 34.6 23.4 14.4 3.4 3 373 4 980
2020-21 75 304 260 45 691 2.1 34.5 23.8 14.4 3.4 3 403 4 922
2021-22 77 310 265 46 706 2.1 34.5 24.4 14.3 3.5 3 430 4 860
Compound annual
growth rate (%)
2001/02-2006/07 5.6 4.7 5.7 -1.8 3.2 -3.0 0.0 4.8 4.8 0.2 -2.8
2006/07-2011/12 1.9 0.0 -9.4 4.2 -4.0 1.8 -2.3 -9.4 -11.5 -9.6 -5.8
2011/12-2016/17 2.5 2.1 0.0 1.2 1.2 -0.9 0.3 4.3 4.6 2.8 1.5
2016/17-2021/22 2.6 2.1 2.2 1.5 2.1 -0.2 2.0 -0.5 1.5 0.9 -1.2
2001/02-2011/12 3.8 2.3 -2.1 1.1 -0.5 -0.6 -1.1 -2.6 -3.7 -4.8 -4.3
2011/12-2021/22 2.6 2.1 1.1 1.3 1.7 -0.5 1.2 1.9 3.0 1.8 0.1
Numbers shaded are forecasts
a Visiting friends and relatives
b Hotels, motels, guesthouses, and serviced apartments
c Total Inbound Tourism Expenditure, real, base = Quarter 4 2012
d Other refers to education and employment visitors w ho stay in Australia for one year or less. On average, these visitors spend more and stay longer than the average tourist.
Historical estimates for international visitor nights have changed due to a slight change in the methodology
The sum of purpose of visit categories does not add to the total as the total includes estimates for those not reporting a purpose of visit to Australia�
500
550
600
650
700
750
800
Arrivals (000s)
ArrivalsExpenditure
2000
2500
3000
3500
4000
4500
5000
Exp
enditure ($m)
2000-01 2003-04 2006-07 2009-10 2012-13 2015-16 2018-19 2021-22
United Kingdom - Arrivals, 000s (LHS) and Expenditure, $m (RHS), 2001-01 to 2021-22

61
Rest of Europe Table 29 International visitor arrivals: Rest of Europe
Business VFRa Holiday Otherd Total Total Average Total Share of nights in Nights in TITEc TITE
change nights nights HMGSAb HMGSA Total per visitor('000) per cent million per cent million $ million $
2000-01 44 72 179 45 356 n.a. 37.1 13.2 17.7 2.3 2 826 7 934
2001-02 34 58 150 34 303 -14.9 40.4 12.2 16.3 2.0 2 536 8 368
2002-03 30 55 152 34 297 -1.9 36.8 10.9 16.7 1.8 2 523 8 489
2003-04 36 61 150 38 306 3.1 35.3 10.8 15.6 1.7 2 325 7 588
2004-05 36 68 168 34 323 5.4 35.6 11.5 18.8 2.2 2 245 6 955
2005-06 44 67 183 37 333 3.1 38.0 12.6 18.0 2.3 2 209 6 640
2006-07 45 70 189 43 348 4.7 39.2 13.6 20.2 2.8 2 351 6 751
2007-08 48 71 193 44 358 2.7 40.2 14.4 16.7 2.4 2 569 7 180
2008-09 44 72 191 52 363 1.4 39.3 14.3 16.1 2.3 2 636 7 262
2009-10 41 81 197 45 370 1.9 38.9 14.4 15.5 2.2 2 352 6 359
2010-11 44 79 189 46 363 -1.8 39.9 14.5 16.6 2.4 2 200 6 052
2011-12 47 82 180 48 362 -0.4 44.1 16.0 12.4 2.0 2 058 5 685
2012-13 50 86 187 51 380 4.8 43.6 16.5 12.5 2.1 2 177 5 735
2013-14 51 88 191 54 390 2.8 42.3 16.5 13.8 2.3 2 376 6 086
2014-15 52 91 200 56 405 3.8 42.4 17.2 13.6 2.3 2 462 6 078
2015-16 53 94 208 58 419 3.5 43.2 18.1 13.3 2.4 2 577 6 147
2016-17 54 96 216 60 433 3.3 43.4 18.8 13.3 2.5 2 640 6 095
2017-18 55 99 224 63 447 3.1 43.6 19.5 13.2 2.6 2 702 6 050
2018-19 56 102 232 65 460 3.1 43.8 20.1 13.1 2.6 2 767 6 012
2019-20 57 104 240 67 474 3.0 43.9 20.8 13.0 2.7 2 831 5 967
2020-21 58 107 249 69 489 3.0 44.1 21.6 13.0 2.8 2 898 5 931
2021-22 59 110 257 71 503 3.0 44.4 22.3 12.9 2.9 2 963 5 891
Compound annual growth rate (%)2001/02-2006/07 6.0 3.8 4.8 5.0 2.8 - -0.6 2.2 4.5 6.7 -1.5 -4.2
2006/07-2011/12 0.9 3.3 -1.0 2.4 0.8 - 2.4 3.2 -9.3 -6.4 -2.6 -3.4
2011/12-2016/17 3.0 3.3 3.8 4.7 3.6 - -0.3 3.3 1.4 4.7 5.1 1.4
2016/17-2021/22 1.7 2.6 3.6 3.3 3.0 - 0.4 3.5 -0.6 2.9 2.3 -0.7
2001/02-2011/12 3.4 3.5 1.9 3.7 1.8 - 0.9 2.7 -2.7 -0.1 -2.1 -3.8
2011/12-2021/22 2.3 3.0 3.7 4.0 3.3 - 0.1 3.4 0.4 3.8 3.7 0.4
Numbers shaded are forecasts
a Visiting friends and relatives
b Hotels, motels, guesthouses, and serviced apartments
c Total Inbound Tourism Expenditure, real, base = Quarter 4 2012
d Other refers to education and employment visitors w ho stay in Australia for one year or less. On average, these visitors spend more and stay longer than the average tourist.
Historical estimates for international visitor nights have changed due to a slight change in the methodology
The sum of purpose of visit categories does not add to the total as the total includes estimates for those not reporting a purpose of visit to Australia�
250
300
350
400
450
500
550
Arrivals (000s)
ArrivalsExpenditure
2000
2200
2400
2600
2800
3000
Exp
enditu
re ($m
)
2000-01 2003-04 2006-07 2009-10 2012-13 2015-16 2018-19 2021-22
Rest of Europe - Arrivals, 000s (LHS) and Expenditure, $m (RHS), 2001-01 to 2021-22
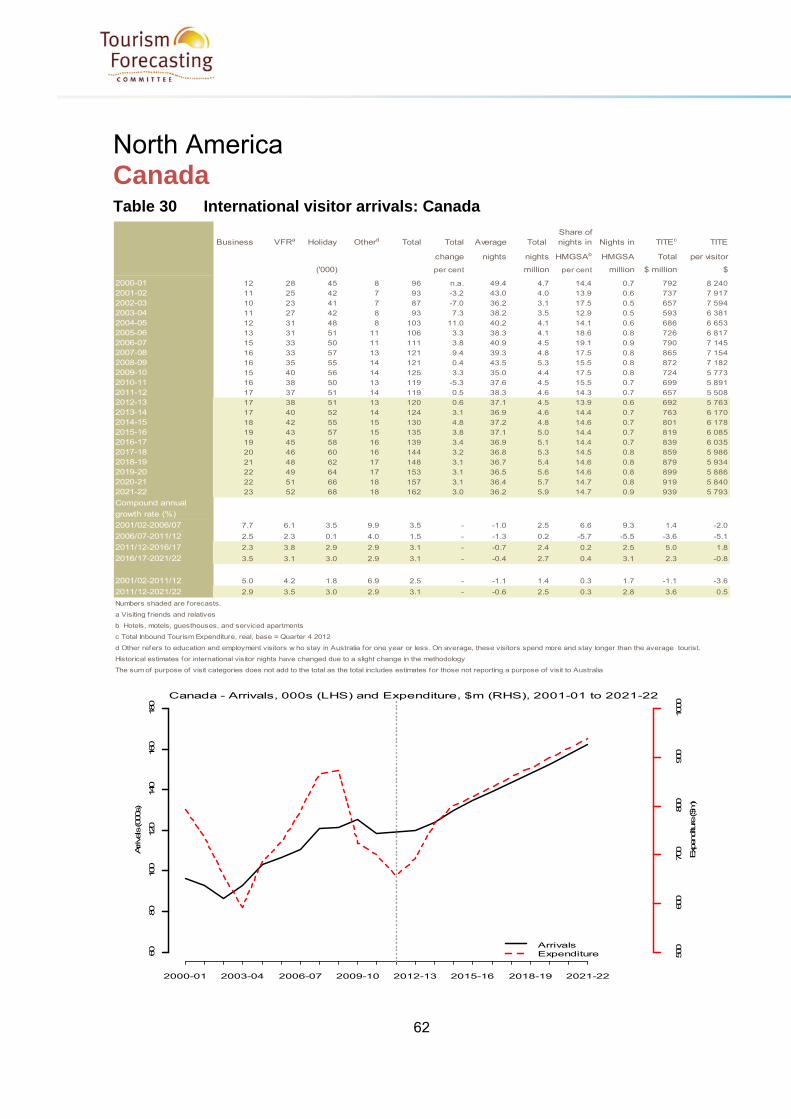
62
North America Canada Table 30 International visitor arrivals: Canada
Business VFRa Holiday Otherd Total Total Average Total Share of nights in Nights in TITEc TITE
change nights nights HMGSAb HMGSA Total per visitor
('000) per cent million per cent million $ million $
2000-01 12 28 45 8 96 n.a. 49.4 4.7 14.4 0.7 792 8 240
2001-02 11 25 42 7 93 -3.2 43.0 4.0 13.9 0.6 737 7 917
2002-03 10 23 41 7 87 -7.0 36.2 3.1 17.5 0.5 657 7 594
2003-04 11 27 42 8 93 7.3 38.2 3.5 12.9 0.5 593 6 381
2004-05 12 31 48 8 103 11.0 40.2 4.1 14.1 0.6 686 6 653
2005-06 13 31 51 11 106 3.3 38.3 4.1 18.6 0.8 726 6 817
2006-07 15 33 50 11 111 3.8 40.9 4.5 19.1 0.9 790 7 145
2007-08 16 33 57 13 121 9.4 39.3 4.8 17.5 0.8 865 7 154
2008-09 16 35 55 14 121 0.4 43.5 5.3 15.5 0.8 872 7 182
2009-10 15 40 56 14 125 3.3 35.0 4.4 17.5 0.8 724 5 773
2010-11 16 38 50 13 119 -5.3 37.6 4.5 15.5 0.7 699 5 891
2011-12 17 37 51 14 119 0.5 38.3 4.6 14.3 0.7 657 5 508
2012-13 17 38 51 13 120 0.6 37.1 4.5 13.9 0.6 692 5 763
2013-14 17 40 52 14 124 3.1 36.9 4.6 14.4 0.7 763 6 170
2014-15 18 42 55 15 130 4.8 37.2 4.8 14.6 0.7 801 6 178
2015-16 19 43 57 15 135 3.8 37.1 5.0 14.4 0.7 819 6 085
2016-17 19 45 58 16 139 3.4 36.9 5.1 14.4 0.7 839 6 035
2017-18 20 46 60 16 144 3.2 36.8 5.3 14.5 0.8 859 5 986
2018-19 21 48 62 17 148 3.1 36.7 5.4 14.6 0.8 879 5 934
2019-20 22 49 64 17 153 3.1 36.5 5.6 14.6 0.8 899 5 886
2020-21 22 51 66 18 157 3.1 36.4 5.7 14.7 0.8 919 5 840
2021-22 23 52 68 18 162 3.0 36.2 5.9 14.7 0.9 939 5 793
Compound annual
growth rate (%)
2001/02-2006/07 7.7 6.1 3.5 9.9 3.5 - -1.0 2.5 6.6 9.3 1.4 -2.0
2006/07-2011/12 2.5 2.3 0.1 4.0 1.5 - -1.3 0.2 -5.7 -5.5 -3.6 -5.1
2011/12-2016/17 2.3 3.8 2.9 2.9 3.1 - -0.7 2.4 0.2 2.5 5.0 1.8
2016/17-2021/22 3.5 3.1 3.0 2.9 3.1 - -0.4 2.7 0.4 3.1 2.3 -0.8
2001/02-2011/12 5.0 4.2 1.8 6.9 2.5 - -1.1 1.4 0.3 1.7 -1.1 -3.6
2011/12-2021/22 2.9 3.5 3.0 2.9 3.1 - -0.6 2.5 0.3 2.8 3.6 0.5
Numbers shaded are forecasts.
a Visiting friends and relatives
b Hotels, motels, guesthouses, and serviced apartments
c Total Inbound Tourism Expenditure, real, base = Quarter 4 2012
d Other refers to education and employment visitors w ho stay in Australia for one year or less. On average, these visitors spend more and stay longer than the average tourist.
Historical estimates for international visitor nights have changed due to a slight change in the methodology
The sum of purpose of visit categories does not add to the total as the total includes estimates for those not reporting a purpose of visit to Australia�
60
80
100
120
140
160
180
Arrivals (000
s)
ArrivalsExpenditure 50
0600
700
800
900
1000
Exp
enditure ($
m)
2000-01 2003-04 2006-07 2009-10 2012-13 2015-16 2018-19 2021-22
Canada - Arrivals, 000s (LHS) and Expenditure, $m (RHS), 2001-01 to 2021-22

63
United States Economic assumptions
Economic outlook Economic growth is expected to increase 1.8 per cent and
2.8 per cent in 2013 and 2014 respectively–higher than the 10 year long-run average of 1.7 per cent. In the medium to longer term, the US economy is expected to increase at an
average annual rate of 2.6 per cent–higher than the long-run average.
The US dollar is expected to appreciate against the Australian dollar, making Australia a more attractive destination for visitors from the United States.
Market outlook Direct air capacity is expected to increase 5.7 per cent and 4.0 per cent in 2012-13 and 2013-14 respectively, higher than its 10 year long-run average of 3.9 per cent. In the medium to longer term, air capacity is expected to increase at an average annual rate of 4.0 per cent, higher than the long-run average.
Visitor arrivals from the United Sates are now forecast to increase 4.9 per cent to 486,900 in 2012-13 and increase 3.1 per cent to 501,900 in 2013-14. This revision represents a difference of 34,400 more visitors in aggregate. In the longer term to 2021-22, average annual growth of 3.6 per cent to 660,100 is expected. Visitor nights are now forecast to rise 1.4 per cent and to 11 million nights in 2012-13, and decrease 1.5 per cent to 10.8 million nights in 2013-14, and to 14.1 million nights in 2021-22. Visitor expenditure is forecast to rise 4.0 per cent in 2012-13 to $2.4 billion. In the longer term to 2021-22, average annual growth of 1.2 per cent is forecast to $2.6 billion,, representing a downward revision of $305 million.
Market performance In 2012, visitor arrivals increased 5.0 per cent to 478,800 compared with 2011. Visitor nights increased 3.4 per cent to 11 million in the same period. Over the first eight months in 2012-13, arrivals have increased
6.4 per cent–1.5 percentage points higher than growth for the total inbound arrivals.
In the first eight months of 2012-13, Holiday, VFR and Business increased 10.3 per cent, 8 per cent and 2.4 per cent respectively, while Employment and Education decreased 8.3 per cent and 6.9 per cent respectively.
In the first six months of 2012-13, average length of stay decreased 2.5 per cent to 22 nights per trip, while total nights in hotels, motels, guesthouses and serviced apartments increased 5.5 per cent to 1.5 million compared with the same period in 2011-12.
In the first six months of 2012-13, expenditure as defined by Total Inbound Tourism Expenditure (TITE) increased 6.6 per cent to $1.2 billion compared with the same period in the previous financial year, while leisure expenditure increased by 10.9 per cent to $640 million in the same period.
2006 2007 2008 2009 2010 2011 2012 2013 2014 2015
GDP growth % 2.7 1.9 -0.3 -3.1 2.4 1.8 2.2 1.8 2.8 2.9Inflation % 3.2 2.9 3.8 -0.4 1.6 3.2 2.1 1.8 2.1 2.1Home currency usd 1.00 1.00 1.00 1.00 1.00 1.00 1.00 1.00 1.00 1.00Home currency aud 0.75 0.84 0.85 0.79 0.92 1.03 1.04 1.03 0.99 0.99Population mill. 300 303 306 309 312 315 318 321 324 327
Currencies are year average, based on quarterly data
Sources: IMF IFS; Consensus Forecasts, March 2013

64
Table 31 International visitor arrivals: United States
Business VFRa Holiday Otherd Total Total Average Total Share of nights in Nights in TITEc TITE
change nights nights HMGSAb HMGSA Total per visitor
'000 per cent million per cent million $ million $
2000-01 80 109 223 72 502 n.a. 22.1 11.1 27.6 3.1 3 870 7 706
2001-02 80 74 179 55 424 -15.5 26.5 11.3 24.2 2.7 3 970 9 355
2002-03 84 78 172 60 424 -0.2 26.8 11.3 24.5 2.8 3 162 7 464
2003-04 89 80 166 75 430 1.6 24.0 10.3 25.7 2.7 2 885 6 706
2004-05 87 95 192 55 446 3.6 21.5 9.6 28.7 2.7 2 737 6 142
2005-06 97 93 199 60 453 1.6 23.0 10.4 31.4 3.3 2 924 6 462
2006-07 108 91 194 58 455 0.6 22.4 10.2 30.1 3.1 2 683 5 890
2007-08 110 90 185 63 455 -0.2 21.4 9.7 34.2 3.3 2 793 6 145
2008-09 97 102 184 64 452 -0.6 21.3 9.6 27.8 2.7 2 697 5 972
2009-10 108 111 202 61 489 8.2 21.9 10.7 27.3 2.9 2 308 4 723
2010-11 112 109 180 59 466 -4.7 22.4 10.4 26.3 2.7 2 222 4 770
2011-12 121 106 178 54 464 -0.3 23.3 10.8 26.1 2.8 2 334 5 027
2012-13 124 114 192 51 487 4.9 22.5 11.0 27.4 3.0 2 428 4 987
2013-14 129 117 198 52 502 3.1 21.5 10.8 30.2 3.3 2 462 4 905
2014-15 133 121 206 54 519 3.5 21.2 11.0 29.8 3.3 2 472 4 760
2015-16 135 126 216 57 540 3.9 21.3 11.5 29.3 3.4 2 504 4 640
2016-17 138 130 226 60 560 3.7 21.3 11.9 29.1 3.5 2 531 4 523
2017-18 141 135 235 62 579 3.4 21.4 12.4 29.0 3.6 2 553 4 410
2018-19 144 140 244 65 599 3.4 21.4 12.8 28.9 3.7 2 573 4 299
2019-20 147 145 254 67 619 3.4 21.4 13.2 28.7 3.8 2 593 4 192
2020-21 150 150 264 70 639 3.3 21.4 13.7 28.6 3.9 2 614 4 089
2021-22 153 155 274 73 660 3.3 21.4 14.1 28.5 4.0 2 633 3 989
Compound annual
growth rate (%)
2001/02-2006/07 6.3 4.2 1.6 0.8 1.4 -3.3 -1.9 4.4 2.4 -7.5 -8.8
2006/07-2011/12 2.3 3.0 -1.7 -1.5 0.4 0.7 1.1 -2.8 -1.7 -2.7 -3.1
2011/12-2016/17 2.7 4.2 4.9 2.2 3.8 -1.7 2.0 2.2 4.3 1.6 -2.1
2016/17-2021/22 2.0 3.5 4.0 4.0 3.4 0.0 3.4 -0.4 2.9 0.8 -2.5
2001/02-2011/12 4.3 3.6 -0.1 -0.3 0.9 -1.3 -0.4 0.8 0.3 -5.2 -6.0
2011/12-2021/22 2.3 3.8 4.5 3.1 3.6 -0.8 2.7 0.9 3.6 1.2 -2.3
Numbers shaded are forecasts
a Visiting friends and relatives
b Hotels, motels, guesthouses, and serviced apartments
c Total Inbound Tourism Expenditure, real, base = Quarter 4 2012
d Other refers to education and employment visitors w ho stay in Australia for one year or less. On average, these visitors spend more and stay longer than the average tourist.
Historical estimates for international visitor nights have changed due to a slight change in the methodology
The sum of purpose of visit categories does not add to the total as the total includes estimates for those not reporting a purpose of visit to Australia�
400
450
500
550
600
650
700
Arrivals (000s)
ArrivalsExpenditure
2000
2500
3000
3500
4000
Exp
enditu
re ($m)
2000-01 2003-04 2006-07 2009-10 2012-13 2015-16 2018-19 2021-22
United States - Arrivals, 000s (LHS) and Expenditure, $m (RHS), 2001-01 to 2021-22

65
Other Markets Middle East and North Africa Table 32 International visitor arrivals: Middle East and North Africa
Business VFRa Holiday Otherd Total Total Average Total Share of nights in Nights in TITEc TITE
change nights nights HMGSAb HMGSA Total per visitor
('000) per cent million per cent million $ million $
2000-01 7 14 26 7 57 n.a. 41.0 2.3 11.2 0.3 345 6 103
2001-02 5 12 25 5 56 -1.5 48.0 2.7 11.1 0.3 412 7 394
2002-03 5 13 21 5 50 -10.1 37.8 1.9 8.2 0.2 301 6 004
2003-04 6 15 23 7 56 12.6 43.2 2.4 10.2 0.2 401 7 111
2004-05 7 17 31 8 68 21.0 32.2 2.2 14.7 0.3 270 3 963
2005-06 10 18 33 10 73 7.6 40.2 3.0 18.1 0.5 312 4 249
2006-07 12 21 34 13 83 12.6 41.0 3.4 12.4 0.4 404 4 887
2007-08 14 23 36 16 93 12.0 44.8 4.1 10.3 0.4 641 6 924
2008-09 14 28 38 20 105 13.8 42.0 4.4 11.4 0.5 657 6 243
2009-10 16 32 34 23 111 5.7 43.4 4.8 9.0 0.4 582 5 228
2010-11 16 32 37 23 114 2.4 45.4 5.2 10.1 0.5 445 3 905
2011-12 18 33 33 23 114 -0.1 40.9 4.7 10.4 0.5 414 3 630
2012-13 22 34 30 21 114 0.3 41.4 4.7 9.3 0.4 459 4 017
2013-14 23 36 31 22 119 4.1 42.5 5.1 10.2 0.5 512 4 308
2014-15 24 38 33 25 127 6.9 42.6 5.4 10.6 0.6 560 4 406
2015-16 24 40 36 28 136 7.2 43.5 5.9 9.8 0.6 607 4 460
2016-17 25 43 40 31 145 6.8 44.0 6.4 9.6 0.6 657 4 521
2017-18 26 45 43 34 155 6.6 44.5 6.9 9.3 0.6 712 4 589
2018-19 26 48 47 38 165 6.6 45.1 7.4 9.1 0.7 772 4 670
2019-20 27 50 50 42 176 6.6 45.6 8.0 8.8 0.7 839 4 762
2020-21 27 53 55 46 188 6.6 46.1 8.7 8.6 0.7 913 4 862
2021-22 28 56 59 50 200 6.5 46.7 9.3 8.4 0.8 993 4 967
Compound annual
growth rate (%)
2001/02-2006/07 18.3 11.9 6.0 19.2 8.2 - -3.1 4.8 2.3 7.2 -0.4 -7.9
2006/07-2011/12 7.4 9.5 -0.6 12.1 6.6 - 0.0 6.6 -3.6 2.8 0.5 -5.8
2011/12-2016/17 7.0 5.4 3.9 6.5 5.0 - 1.5 6.5 -1.6 4.8 9.7 4.5
2016/17-2021/22 2.2 5.6 8.3 9.9 6.6 - 1.2 7.8 -2.7 5.0 8.6 1.9
2001/02-2011/12 12.7 10.7 2.6 15.6 7.4 - -1.6 5.7 -0.7 5.0 0.0 -6.9
2011/12-2021/22 4.6 5.5 6.1 8.2 5.8 - 1.3 7.2 -2.1 4.9 9.2 3.2
Numbers shaded are forecasts
a Visiting friends and relatives
b Hotels, motels, guesthouses, and serviced apartments
c Total Inbound Tourism Expenditure, real, base = Quarter 4 2012
d Other refers to education and employment visitors w ho stay in Australia for one year or less. On average, these visitors spend more and stay longer than the average tourist.
Historical estimates for international visitor nights have changed due to a slight change in the methodology
The sum of purpose of visit categories does not add to the total as the total includes estimates for those not reporting a purpose of visit to Australia.�
50
100
150
200
Arrivals (00
0s)
ArrivalsExpenditure 20
040
0600
800
100
0
Exp
end
iture ($
m)
2000-01 2003-04 2006-07 2009-10 2012-13 2015-16 2018-19 2021-22
Middle East and North Africa - Arrivals, 000s (LHS) and Expenditure, $m (RHS), 2001-01 to 2021-22

66
South Africa Table 33 International visitor arrivals: South Africa
Business VFRa Holiday Otherd Total Total Average Total Share of nights in Nights in TITEc TITE
change nights nights HMGSAb HMGSA Total per visitor
('000) per cent million per cent million $ million $
2000-01 10 17 20 5 56 n.a. 24.4 1.4 14.7 0.2 289 5 184
2001-02 10 17 19 5 56 -0.3 22.4 1.2 19.0 0.2 275 4 941
2002-03 8 15 15 4 48 -14.6 31.4 1.5 12.8 0.2 317 6 671
2003-04 9 17 18 5 55 15.9 31.2 1.7 12.3 0.2 434 7 884
2004-05 10 17 15 4 50 -9.3 30.8 1.5 16.6 0.3 387 7 739
2005-06 11 19 18 5 55 9.5 30.4 1.7 14.2 0.2 344 6 293
2006-07 12 21 20 6 60 10.3 28.9 1.7 15.6 0.3 374 6 204
2007-08 13 23 23 6 66 9.1 23.2 1.5 19.4 0.3 440 6 680
2008-09 12 26 21 6 64 -2.2 29.0 1.9 14.4 0.3 481 7 484
2009-10 10 27 18 5 61 -4.6 28.8 1.8 11.5 0.2 317 5 170
2010-11 12 27 17 5 62 0.5 30.9 1.9 12.2 0.2 348 5 637
2011-12 12 26 18 6 63 1.8 31.6 2.0 9.5 0.2 362 5 769
2012-13 11 26 16 5 57 -8.5 31.9 1.8 9.9 0.2 343 5 975
2013-14 11 27 16 5 60 4.0 30.0 1.8 10.9 0.2 356 5 954
2014-15 12 28 17 5 63 5.5 30.9 1.9 13.0 0.3 378 5 994
2015-16 12 30 18 5 66 4.9 30.7 2.0 12.3 0.3 392 5 921
2016-17 12 31 19 6 69 4.3 30.8 2.1 12.2 0.3 402 5 829
2017-18 13 33 19 6 72 4.1 31.0 2.2 12.0 0.3 412 5 741
2018-19 13 35 20 6 75 4.0 31.1 2.3 11.8 0.3 422 5 653
2019-20 13 36 21 6 78 4.0 31.2 2.4 11.6 0.3 433 5 573
2020-21 14 38 21 6 81 3.9 31.4 2.5 11.4 0.3 443 5 493
2021-22 14 40 22 7 84 3.8 31.5 2.6 11.2 0.3 454 5 414
Compound annual
growth rate (%)
2001/02-2006/07 5.0 4.7 1.7 5.2 1.6 - 5.2 6.9 -3.8 2.8 6.3 4.7
2006/07-2011/12 -0.8 4.3 -2.4 0.2 0.8 - 1.8 2.7 -9.5 -7.1 -0.6 -1.4
2011/12-2016/17 0.6 4.1 0.6 -1.5 1.9 - -0.5 1.4 5.1 6.5 2.1 0.2
2016/17-2021/22 2.4 5.0 3.5 3.5 4.0 - 0.4 4.4 -1.6 2.8 2.4 -1.5
2001/02-2011/12 2.1 4.5 -0.4 2.6 1.2 - 3.5 4.8 -6.7 -2.3 2.8 1.6
2011/12-2021/22 1.5 4.5 2.1 1.0 2.9 - 0.0 2.9 1.7 4.6 2.3 -0.6
Numbers shaded are forecasts
a Visiting friends and relatives
b Hotels, motels, guesthouses, and serviced apartments
c Total Inbound Tourism Expenditure, real, base = Quarter 4 2012
d Other refers to education and employment visitors w ho stay in Australia for one year or less. On average, these visitors spend more and stay longer than the average tourist.
Historical estimates for international visitor nights have changed due to a slight change in the methodology
The sum of purpose of visit categories does not add to the total as the total includes estimates for those not reporting a purpose of visit to Australia�
4050
6070
80
90
Arrivals (00
0s)
ArrivalsExpenditure 2
50300
350
400
450
500
Exp
enditure ($
m)
2000-01 2003-04 2006-07 2009-10 2012-13 2015-16 2018-19 2021-22
South Africa - Arrivals, 000s (LHS) and Expenditure, $m (RHS), 2001-01 to 2021-22

67
Rest of the World Table 34 International visitor arrivals: Rest of the World
Business VFRa Holiday Otherd Total Total Average Total Share of nights in Nights in TITEc TITE
change nights nights HMGSAb HMGSA Total per visitor
('000) per cent million per cent million $ million $
2000-01 28 45 83 47 223 n.a. 24.7 5.5 11.4 0.6 1 056 4 739
2001-02 21 33 67 36 175 -21.4 22.4 3.9 13.6 0.5 706 4 026
2002-03 19 30 62 32 158 -10.1 26.0 4.1 9.6 0.4 597 3 787
2003-04 21 32 66 35 167 6.1 23.9 4.0 14.5 0.6 561 3 353
2004-05 23 34 71 37 176 5.0 23.6 4.1 12.6 0.5 768 4 374
2005-06 31 35 78 43 190 8.3 27.3 5.2 11.1 0.6 902 4 747
2006-07 34 39 85 47 210 10.5 28.8 6.0 11.9 0.7 846 4 029
2007-08 34 41 92 52 224 6.6 33.1 7.4 11.6 0.9 936 4 180
2008-09 39 48 101 62 255 13.7 35.2 9.0 9.0 0.8 1 175 4 617
2009-10 35 54 107 57 259 1.8 32.7 8.5 10.0 0.8 1 109 4 279
2010-11 37 57 107 57 264 1.7 35.4 9.3 9.2 0.9 1 175 4 455
2011-12 40 62 107 60 276 4.6 35.6 9.8 8.1 0.8 1 172 4 247
2012-13 40 62 112 64 284 3.1 36.6 10.4 7.8 0.8 1 193 4 193
2013-14 41 63 116 68 295 3.6 35.6 10.5 8.9 0.9 1 236 4 192
2014-15 42 66 121 72 307 4.3 35.9 11.0 9.2 1.0 1 264 4 114
2015-16 43 69 125 75 319 3.8 36.9 11.8 9.0 1.1 1 352 4 236
2016-17 44 71 130 79 330 3.5 37.5 12.4 8.9 1.1 1 399 4 235
2017-18 45 74 134 82 341 3.3 38.1 13.0 8.9 1.2 1 446 4 236
2018-19 46 77 138 86 353 3.3 38.7 13.7 8.8 1.2 1 494 4 236
2019-20 47 80 142 89 364 3.3 39.4 14.3 8.8 1.3 1 545 4 243
2020-21 48 82 146 93 376 3.2 40.1 15.1 8.8 1.3 1 597 4 249
2021-22 49 85 150 97 388 3.2 40.7 15.8 8.7 1.4 1 651 4 259
Compound annual
growth rate (%)
2001/02-2006/07 10.4 3.6 5.0 5.7 3.7 - 5.1 9.0 -2.6 6.1 3.7 0.0
2006/07-2011/12 3.5 9.3 4.7 5.0 5.6 - 4.4 10.2 -7.4 2.1 6.7 1.1
2011/12-2016/17 1.8 3.0 3.8 5.7 3.7 - 1.0 4.7 1.9 6.8 3.6 -0.1
2016/17-2021/22 2.2 3.6 3.0 4.2 3.3 - 1.7 5.0 -0.5 4.4 3.4 0.1
2001/02-2011/12 6.9 6.4 4.9 5.4 4.6 - 4.8 9.6 -5.0 4.1 5.2 0.5
2011/12-2021/22 2.0 3.3 3.4 4.9 3.5 - 1.4 4.9 0.7 5.6 3.5 0.0
Numbers shaded are forecasts
a Visiting friends and relatives
b Hotels, motels, guesthouses, and serviced apartments
c Total Inbound Tourism Expenditure, real, base = Quarter 4 2012
d Other refers to education and employment visitors w ho stay in Australia for one year or less. On average, these visitors spend more and stay longer than the average tourist.
Historical estimates for international visitor nights have changed due to a slight change in the methodology
The sum of purpose of visit categories does not add to the total as the total includes estimates for those not reporting a purpose of visit to Australia�
100
150
200
250
300
350
400
Arrivals (000s)
ArrivalsExpenditure 5
00
1000
1500
2000
Exp
enditure ($m)
2000-01 2003-04 2006-07 2009-10 2012-13 2015-16 2018-19 2021-22
Rest of the World - Arrivals, 000s (LHS) and Expenditure, $m (RHS), 2001-01 to 2021-22

