forced degradation of tacrolimus and the development of a
TRANSCRIPT

363
Acta Pharm. 69 (2019) 363–380 Original research paperhttps://doi.org/10.2478/acph-2019-0025
Forced degradation of tacrolimus and the development of a UHPLC method for impurities determination
An ultra-high performance liquid chromatography method for simultaneous determination of tacrolimus impurities in phar-maceutical dosage forms has been developed. Appropriate chro-matographic separation was achieved on a BEH C18 column using gradient elution with a total run time of 14 min. The method was applied to analyses of commercial samples and was validated in terms of linearity, precision, accuracy, sensitivity and specificity. It was found to be linear, precise and accurate in the range of 0.05 to 0.6 % of the impurities level in pharmaceutical dosage forms. Stability indicating power of the method was demonstrated by the results of forced degradation studies. The forced degradation study in solution revealed tacrolimus instability under stress alkaline, thermal, light and photolytic conditions and in the presence of a radical initiator or metal ions. The drug was stable at pH 3–5. Solid-state degradation studies conducted on amor-phous tacrolimus demonstrated its sensitivity to light, elevated temperature, humidity and oxidation.
Keywords: tacrolimus, forced degradation, UHPLC, impurities, stability
Tacrolimus (TAC), also known as FK-506, is a natural product originally isolated from the bacterium Streptomyces tsukubaensis (1–3). It is an immunosuppressive drug used in preventing organ and tissue rejection in patients after transplantation and in the treatment of other autoimmune diseases (4–7).
TAC is a complex 23-membered macrolide lactone with incorporated masked tricar-bonyl and l-pipecolic acid moieties (Fig. 1a) (8). Due to its structural characteristics, TAC can undergo different kinds of transformations including dehydration, epimerization, re-arrangement and isomerization of double bonds (8). Several potential degradation prod-ucts are reported in the literature in addition to some closely related process impurities, which may be present in the final drug due to the manufacturing process of the drug substance (8–15). Moreover, two kinds of conformational heterogeneity of TAC are known (16, 17): cis-trans conformational isomerization due to restricted rotation of the amide bond
TANJA ROZMAN PETERKA* TINA TRDAN LUŠIN JURE BERGLES ZORAN HAM ROK GRAHEK UROŠ URLEB
Lek Pharmaceticals d.d. SI-1526 Ljubljana, Slovenia
Accepted December 29, 2018 Published online January 11, 2019
* Correspondence, e-mail: [email protected]
364
T. Rozman Peterka et al.: Forced degradation of tacrolimus and the development of a UHPLC method for impurities determination, Acta Pharm. 69 (2019) 363–380.
in the pipecolic acid moiety (16), and epimerization observed in polar solvents, where TAC undergoes a hydration reaction to a diol, which is then converted into the C-10 epimer, reaching equilibrium with all the three co-existing forms (16, 17) (Fig. 1a). Both TAC equi-librium compounds, herein named TAC compound I and II, are not considered as impuri-ties since both demonstrate equivalent biological activity as TAC (11, 18).
Several methods have been reported for the analysis of TAC-related substances and degradation products (14, 15, 19, 20). In the United States Pharmacopeia (USP) official mono-graph of TAC and TAC-capsules, two high performance liquid chromatography (HPLC) methods are described for the analysis of TAC organic impurities, since not all potential impurities could be measured by one method alone (14). The first USP method is based on normal phase chromatography and demonstrates use of two consecutively connected col-umns for separation of impurities with a total separation time of more than 45 min. The second USP method is a reverse-phase (RP) HPLC method with a total run time of 60 and 85 min for the TAC drug substance and TAC-capsules, resp. In the European Pharmacopoeia (EP) monograph, a gradient method with a run time of 53 min is described and is applied for the TAC drug substance only (15). The most promising pre-existing method applied for pharma-ceutical formulations seemed to be a UHPLC method with a total run time of 25 min deve-loped by Subasranjan et al. (20), where efficient separation of four known impurities from TAC and its equilibrium compounds was demonstrated. In our previous work, we used a fast UHPLC method for evaluation of TAC incompatibility with excipients (13). However, the reported method was not finally optimized with regard to its sensitivity and selectivity with respect to all the relevant TAC impurities that might be present in the final drug product.
Previously described methods are time consuming and have limited ability to detect all important impurities. In this context, the aims of the present study were to develop and validate a fast and sensitive UHPLC method that would make it possible to simultane-ously detect all the relevant TAC impurities and to evaluate the intrinsic stability of TAC through forced degradation studies.
EXPERIMENTAL
Samples, reagents and apparatus
TAC monohydrate drug substance (purity by HPLC 97.1 %) and TAC working standard (purity by HPLC 97.7 %) were available from Lek Pharmaceuticals, Slovenia. Impurities TAC-H1, TAC-RI, TAC-EPI, TAC-diene, TAC-dehydro and ascomycin were available from Lek Pharmaceuticals, Slovenia. Tacrolimus 8-propyl analog was obtained as a USP reference standard (USP, USA). Identity and purity of the used impurities was as follows: TAC-H1 (identity: 1H NMR, 13C NMR, MS, IR; purity by 1H NMR 94 %), TAC-RI (identity: 1H NMR, 13C NMR, MS, IR; purity by 1H NMR 88 %), TAC-EPI (identity: 1H NMR, 13C NMR, MS, IR; purity by 1H NMR 101 %), TAC-diene (identity: 1H NMR, 13C NMR, MS, IR; purity by 1H NMR 94 %), TAC-dehydro (identity: 1H NMR, 13C NMR, MS, IR; purity by 1H NMR 88 %) and ascomycin (identity: 1H NMR; purity by 1H NMR 98 %), Tacrolimus 8-propyl analog (USP RS, 100 % purity). Structures of impurities were originally elucidated and disclosed by dif-ferent groups in earlier works (8–11, 13). Their structural formulae are shown in Figs. 1b,c.
Samples of Advagraf® 0.5 mg and 5 mg capsules (Astellas Pharma, batch No. 0M6041A and batch No. 5M4297A, Canada) were obtained from the Canadian market.

365
T. Rozman Peterka et al.: Forced degradation of tacrolimus and the development of a UHPLC method for impurities determination, Acta Pharm. 69 (2019) 363–380.
Fig. 1. Structural formulae of: a) TAC and its equilibrium compounds I and II in solution, b) TAC-re-lated substances and by-products, c) TAC degradation products.

366
T. Rozman Peterka et al.: Forced degradation of tacrolimus and the development of a UHPLC method for impurities determination, Acta Pharm. 69 (2019) 363–380.
Phosphoric acid (85 %), iron(III) chloride hexahydrate, hydrogen peroxide (30 %), so-dium hydroxide solution Titrisol®, hydrochloric acid solution Titrisol® and buffer solutions Centipur® were supplied by Merck (Germany). 4,4′-Azobis(4-cyanovaleric acid) (ACVA) was obtained from Sigma-Aldrich (USA). Solvents for chromatography, acetonitrile (ACN) and methyl tert-butyl ether (MTBE) were purchased from J. T. Baker (USA) and Merck (Germany), resp. Deionized water was prepared using a Millipore Milli-Q water purifica-tion system (Millipore, USA). The following stability chambers were used for stability studies: Suntest XLS+ from Atlas (USA), thermostatic chamber BF 720 from Binder (Germany) and climate chamber VP 1300 from Weiss Technik (Germany).
Preparation of standard and reference solutions
TAC standard solutions were prepared at a concentration of 15.0 µg mL–1 using ACN-water in a ratio of 70:30 (V/V) as a solvent for forced degradation studies and a mixture of ACN and 5 mmol L–1 ammonium acetate buffer (pH 5) in a ratio of 80:20 (V/V) for the analysis of capsules. Reference solution for impurity identification was prepared by dis-solving TAC and its impurities (ascomycin, TAC-propyl analog, TAC-H1, TAC-RI, TAC-EPI, TAC-diene, TAC-dehydro) in a mixture of ACN and 5 mmol L–1 ammonium acetate buffer (pH 5) in a ratio of 80:20 (V/V) at a concentration of 3000 µg mL–1 and 15.0 µg mL–1 for TAC and the aforementioned impurities, resp.
UHPLC instrumentation and conditions
Chromatographic separations were performed with a Waters ACQUITY UPLC system controlled by the Empower 3 software, using an ACQUITY UPLCTM BEH C18 column, 100 mm × 2.1 mm, 1.7 mm (Waters, USA). Column temperature was 70 °C and the mobile phase was preheated before reaching the column. Mobile phase A was a phosphoric acid solution (0.1 %, V/V). Mobile phase B was prepared by mixing 850 mL of ACN and 80 mL of MTBE. It was filtered through a 0.1-µm PTFE filter (Merck Millipore, USA) prior to use. The following gradient program was employed: mobile phase A:B (V/V)/time (min); 63:37/0 min (initial conditions), 63:37/1.0 min, 52:48/9.0 min, 30:70/11.0 min, 30:70/13.5 min, 63:37/14.0 min; a linear gradient was applied. The flow rate was 0.75 mL min−1. The system returned to the initial conditions after 14.0 min and continued under the same conditions for further 2.0 min. UV detection was carried out at 220 nm using a photodiode array detector (PDA) equipped with a high sensitivity (25 mm) flow cell. Injection volume was 3 mL.
X-ray powder diffraction measurement
X-ray powder diffraction measurement was made with an Xpert PRO MPD instru-ment (PANalytical, The Netherlands) in Bragg-Brentano geometry using CuKα radiation (45 kV, 40 mA) in the range of 2–40 ° 2q, step size of 0.033 ° 2q and step time of 50 s. Auto-matic divergence slits were used to irradiate 10 mm of sample length.
Forced degradation in solid state
Amorphous TAC was obtained by dissolving 5 g of crystalline TAC drug substance in 50 mL of methanol. The solvent was removed under reduced pressure (35 kPa) at 80 °C

367
T. Rozman Peterka et al.: Forced degradation of tacrolimus and the development of a UHPLC method for impurities determination, Acta Pharm. 69 (2019) 363–380.
Table I. Forced degradation study design and storage conditions
Degradation type Experimental conditions Storage conditions Storage time
Forced degradation in solid state
Initial n.a. n.a. n.a.
Thermal/humidity Open dish, stability chamber 50 °C/30 % RH 1 month
Open dish, stability chamber 50 °C/50 % RH 1 month
Open dish, stability chamber 50 °C/75 % RH 1 month
Oxidation Sealed vial, nitrogen headspace 50 °C 1 month
Sealed vial, air in headspace 50 °C 1 month
Sealed vial, oxygen headspace 50 °C 1 month
Photolytic Artificial sunlight SUNTEST XLS+, 300–800 nm, 250 W m–2 16 hours
Dark control (in aluminum foil) SUNTEST XLS+, 300–800 nm, 250 W m–2 16 hours
Artificial light Cool white fluorescent lamp, 2000 lux 22 hours
Dark control (in aluminum foil) Cool white fluorescent lamp, 2000 lux 22 hours
Forced degradation in solution
Initial n.a. n.a. n.a.
Hydrolysis 0.01 mol L–1 HCl Room temperature 24 hours
0.1 mol L–1 HCl Room temperature 24 hours
0.01 mol L–1 NaOH Room temperature 24 hours
0.1 mol L–1 NaOH Room temperature 24 hours
pH: 3, 5, 7, 9, 11 Room temperature 24 hours
Oxidation 3 % H2O2 Room temperature 24 hours
ACVA (1 mg mL–1) 60 °C 24 hours
Metal catalysis FeCl3 (1 mg mL–1) 60 °C 24 hours
Photolytic Artificial sunlight SUNTEST XLS+, 300–800 nm, 250 W m–2 2 hours
Dark control (in aluminum foil) SUNTEST XLS+, 300–800 nm, 250 W m–2 2 hours
Artificial light Cool white fluorescent lamp, 2000 lux 22 hours
Dark control (in aluminum foil) Cool white fluorescent lamp, 2000 lux 22 hours
Thermal Thermostatic chamber 60 °C 24 hours
Heat control Room temperature 24 hours
ACVA – 4,4-azobis(4-cyanovaleric acid), n.a. – not applicable, RH – relative humidity

368
T. Rozman Peterka et al.: Forced degradation of tacrolimus and the development of a UHPLC method for impurities determination, Acta Pharm. 69 (2019) 363–380.
until it reached a very viscous consistence. After evaporation under reduced pressure, the residue was lyophilized overnight to obtain dry amorphous TAC. Samples were exposed to elevated temperature, dry/wet environment and different headspace atmosphere (nitro-gen/air/oxygen), as summarized in Table I. Samples were analyzed before and after storage under the described conditions. In addition, photo stability testing was conducted by ex-posing the material to artificial sunlight or cool white fluorescent light (Table I). Prior to UHPLC analysis, samples were dissolved in a solvent (ACN-water, 70:30, V/V) to give a solution containing approximately 3000 µg mL–1 of TAC.
Forced degradation in solution
TAC monohydrate (750 mg) was dissolved in ACN (25 mL). After transferring 2-mL aliquots of this initial solution into 20-mL flasks, 1 mL of the respective stress medium was added (acid, base, buffer, water, FeCl3 solution, peroxide, ACVA, etc.). Photo-degradation studies were performed with 1 mL of water added to 2 mL of initial solution, followed by exposure to artificial sunlight using SUNTEST XLS+ or cool white fluorescent light. Suit-able controls were kept under the same conditions protected with aluminum foil (dark control). For thermal stress, TAC dissolved in 2 mL of ACN with 1 mL of water was heated at 60 °C. Samples were withdrawn at appropriate time and subjected to UHPLC analysis. Before analysis, samples were further diluted with a solvent consisting of ACN-water (70:30, V/V) to get a concentration of approximately 3000 µg mL–1 of TAC. Details on storage conditions and times are given in Table I.
Analysis of capsules
Applicability of the proposed UHPLC method was evaluated by analyses of commer-cially available capsules (Advagraf®) of two doses: 0.5 mg and 5 mg. Samples in the original packaging configuration were analyzed before being placed under accelerated stability conditions (40 °C/75 % relative humidity) and also after 1, 3 and 6 months of storage under accelerated stability conditions. For the purpose of sample preparation, a mixture of ACN and 5 mmol L–1 ammonium acetate buffer (pH 5) in the ratio of 80:20 (V/V) was used as a solvent.
For UHPLC analysis, capsules were opened and the amount of capsule content cor-responding to 15 mg of TAC was weighed and dissolved in 5 mL of solvent. Samples were then sonicated for 20 min with occasional manual shaking. After centrifugation of samples at 5000 rpm for 10 min, the supernatant was filtered through a 0.2-µm PTFE filter (Merck Millipore) and analyzed via UHPLC.
Method validation
Specificity. – Specificity of the method was investigated for all available impurities, sample solution, placebo solution and blank. Specificity was demonstrated by spiking the drug product (3000 µg mL–1) with an appropriate level of impurities (15.0 µg mL–1).
Linearity. – Linearity of the method was investigated in the range 1.5–18 µg mL–1 using nine points (1.5, 3, 4.5, 6, 7.5, 9, 12, 15, 18 µg mL–1 TAC). TAC concentration ranged from 0.05 to 0.6 % of TAC concentration in the sample solution (3000 µg mL–1).

369
T. Rozman Peterka et al.: Forced degradation of tacrolimus and the development of a UHPLC method for impurities determination, Acta Pharm. 69 (2019) 363–380.
Accuracy (recovery). – For accuracy experiments, samples were spiked with degrada-tion products TAC-H1, TAC-RI, TAC-EPI and TAC-diene at 0.05, 0.5 or 0.6 % of TAC concen-tration in the sample solution (3000 µg mL–1). As small quantities of impurities may al-ready be present in sample solutions, their content was estimated by injecting a sample solution without addition of any impurity stock solution. These results were then sub-tracted from the content of impurities measured after spiking to obtain the determined amount of added impurities for recovery calculations.
Precision. – For precision experiments, an in-house drug product (composed of TAC and excipients hypromellose, ethylcellulose, lactose monohydrate and magnesium stea-rate) was stressed at 60 °C/50 % relative humidity for 7 days or aged under accelerated stability conditions of 40 °C/75 % relative humidity for 3 months, to obtain a sufficient level of degradation products for evaluation. Six replicates of sample solutions were pre-pared and analyzed.
Limit of detection (LOD) and limit of quantitation (LOQ). – LOD and LOQ were evaluated on the basis of the signal-to-noise (S/N) ratio ≥ 3:1 and ≥ 10:1, resp., for six replicate deter-minations containing 0.02 or 0.05 % of the compound of interest, relative to the concentra-tion of TAC in sample solution (3000 µg mL–1).
RESULTS AND DISCUSSION
Optimization of the UHPLC method
A reversed phase UHPLC method was developed to quantitate TAC impurities. Ef-fects of various factors such as mobile phase composition, stationary phase, gradient and temperature were evaluated, and parameters that assure the most robust and fast separa-tion of analytes were selected.
pH does not significantly affect method selectivity and repeatability, since TAC and all known impurities except TAC-H1 are not ionized under conditions normally used for reversed phase liquid chromatography. The only known impurity that could be affected by the selection of the mobile phase pH is TAC-H1. The TAC-H1 impurity is acid; therefore, the polarity of the molecule depends on the pH of the mobile phase. At pH two units below pKa (estimated cca. 4.6, typical pKa for carboxylic acids) the molecule is not ionized and thus less polar; it consequently elutes later in the reverse phase mode. In the case of pH above pKa, TAC-H1 would be poorly retained and difficult to quantify by the liquid chromato-graphy (LC) method. We therefore decided to use 0.1 % phosphoric acid for the mobile phase A preparation to ensure that TAC-H1 will be un-ionized, which improves its peak shape and increases its retention time. TAC-H1 is much more polar than the other impurities and TAC itself; therefore, selectivity of a method for TAC-H1 determination is not critical. Separation of other impurities was more challenging, and it was found that method selectivity was largely dependent on MTBE percentage in the mobile phase and on temperature.
Stationary phase selection was less critical than expected as several tested columns (BEH phenyl, CSH C18, BEH C18, CSH fluoro-phenyl, CSH phenyl-hexyl) could be used for method optimization. However, the elution strength of mobile phases needs to be adjusted according to the selected stationary phase to achieve suitable retention of analytes and the best possible method efficiency. Waters BEH C18 column proved to be most suitable because
370
T. Rozman Peterka et al.: Forced degradation of tacrolimus and the development of a UHPLC method for impurities determination, Acta Pharm. 69 (2019) 363–380.
of its performance at elevated temperature and adequate retention of all analytes. A 100-mm column with 1.7 µm particles was sufficient for fast separation of all structurally similar TAC impurities from the main peak and from each other.
Optimized mobile phase B is a mixture of two organic modifiers, which are crucial for method selectivity. ACN is suitable because of its low viscosity and adequate elution strength and in combination with MTBE analysis time and peak width were markedly reduced. In general, use of MTBE has to be carefully considered as MTBE is not miscible with water but has a low UV cut-off and high elution strength, which is favorable for this analysis. Selection of suitable parameters for separation of TAC and its impurities is challenging due to molecular similarity and high hydrophobicity, and the use of MTBE considerably improves method selectivity and shortens analysis time. However, if the percentage of MTBE is too high, co-elution of TAC-RI and ascomycin is observed, as well as co-elution of TAC-EPI with the TAC-propyl analogue. Other organic modifiers, including methanol, 2-propanol and tetrahydrofuran, were also tested, but resulted in broad peaks, increased back pressure and reduced sensitivity due to the baseline at low wavelengths.
In the case of TAC, selection of suitable temperature is also significant for improving resolution between the known impurities as well as for reducing analysis time. At 30 °C, several co-elutions can be seen under the same chromatographic conditions. At 65 °C, all impurities are separated, but to increase method robustness, 70 °C was selected as the most suitable temperature. Increase in temperature also facilitates rotation of the amide bond, which has a considerable effect on the narrowing of peaks. This is essential for separation of the known impurities TAC-RI and ascomycin from TAC and TAC compound II. Further increase of temperature impairs resolution between TAC-RI and TAC compound II and, in addition, it is not recommended because it could shorten the column lifetime. In general, higher temperature allows optimization of methods with a higher flow rate due to reduced mobile phase viscosity.
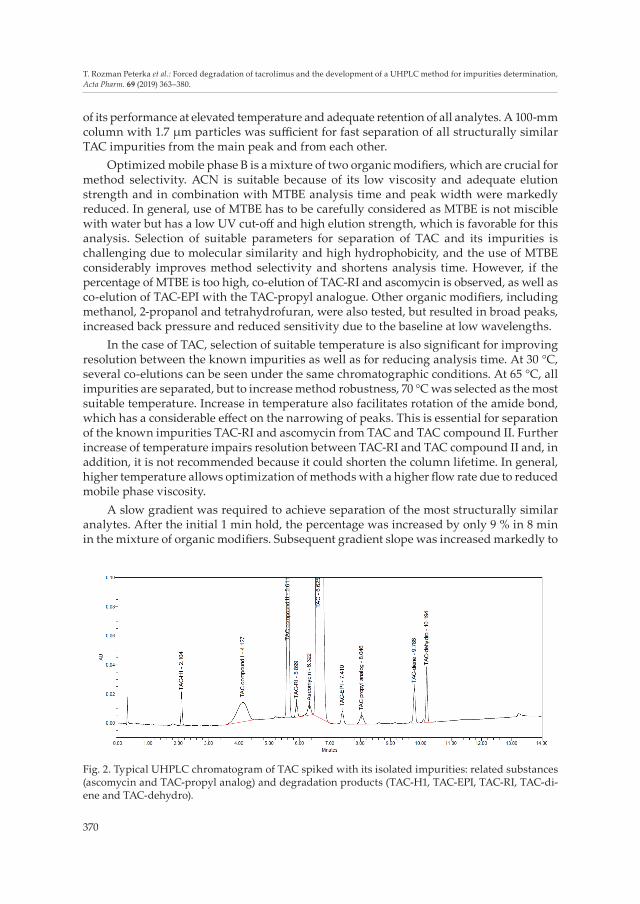
A slow gradient was required to achieve separation of the most structurally similar analytes. After the initial 1 min hold, the percentage was increased by only 9 % in 8 min in the mixture of organic modifiers. Subsequent gradient slope was increased markedly to
Fig. 2. Typical UHPLC chromatogram of TAC spiked with its isolated impurities: related substances (ascomycin and TAC-propyl analog) and degradation products (TAC-H1, TAC-EPI, TAC-RI, TAC-di-ene and TAC-dehydro).

371
T. Rozman Peterka et al.: Forced degradation of tacrolimus and the development of a UHPLC method for impurities determination, Acta Pharm. 69 (2019) 363–380.
speed up elution of the remaining impurities. A representative chromatogram of TAC spiked with its impurities is presented in Fig. 2.
Detection wavelength was selected on the basis of the recorded UV spectra of ana-lytes and in compliance with the USP monograph for TAC (14). At 220 nm, all impurities can be precisely quantified. Lower wavelengths are less appropriate due to increased base-line noise and a high slope in UV spectra, which can impair repeatability when using different detectors. To improve sensitivity, a 25-mm detector flow cell was used instead of the standard 10-mm flow cell, since the LOQ of TAC was expected to be 1.5 µg mL–1 when injecting 3 µL. According to the International Conference on Harmonisation (ICH) guide-lines, the S/N ratio for TAC at LOQ concentration (which corresponds to 0.05 % of the re-porting limit for TAC impurities) needs to be checked in every analysis, and sufficient method sensitivity must be ensured, so that S/N ratio ≥ 10 can be repeatedly achieved on all tested UHPLC systems (21).
Other reported LC methods for TAC impurities determination are not capable of de-tecting and quantitating all relevant TAC impurities in a single run with sufficient accu-racy and LOQ. The existing compendial HPLC methods involve a long analysis time and lack of sensitivity as the method LOQ needs to be the same as the reporting limit for all impurities. In addition, none of the previously published UHPLC methods was demon-strated to be appropriate for determination of various TAC impurities that may be present in the final dosage form. The newly developed method represents a significant advance-ment in the determination of TAC impurities. It has improved selectivity for several iden-tified degradation products (TAC-H1, TAC-RI, TAC-EPI, TAC-diene and TAC-dehydro) and TAC related substances (ascomycin and TAC-propyl analogue) also with respect to un-known impurities found during the degradation study. Moreover, the overall analysis time is only 14 min. Improved S/N ratio, increased selectivity and reduced analysis time are very important factors for the methods used in the pharmaceutical industry.
Appropriate method specificity, accuracy, precision, linearity, LOQ, LOD and range were confirmed according to ICH requirements (21, November 1996). Chromatographic peaks were also found to be spectrally pure in various degradation studies.
Forced degradation in solid state
Forced degradation studies in solid state were performed on amorphous TAC. Com-plete transformation of crystalline TAC to amorphous TAC during the amorphization pro-cess was confirmed by X-ray powder diffraction. X-ray diffraction pattern of amorphous TAC exhibits no characteristic diffraction peaks of crystalline TAC (Fig. 3). An approach using amorphization was used to mimic the stability behavior of TAC in commercially available formulations, where TAC exists in amorphous form obtained by solid dispersion preparation techniques (22). Amorphous material has a higher thermodynamic activity and tends to be chemically and/or physically less stable than the corresponding crystalline material. For stress studies, only degradation products (unknown and known) were taken into consideration, and no production process related impurities were reported as they are not expected to increase during TAC exposure to different stress conditions and are there-fore not relevant for stability evaluation. Results are gathered in Table II. For each tested stress condition, the results of all identified degradation products (TAC-H1, TAC-RI, TAC-EPI, TAC-diene and TAC-dehydro), maximal unknown impurity designated by its relative

372
T. Rozman Peterka et al.: Forced degradation of tacrolimus and the development of a UHPLC method for impurities determination, Acta Pharm. 69 (2019) 363–380.
retention time (RRT) and total impurities are reported. Results suggested the following degradation behavior of TAC in the solid state.
Elevated temperature under different humidity conditions. – Amorphous TAC was prone to degradation at elevated temperature (50 °C). Proportion of impurities in amorphous mate-rial increased with higher moisture content. This can be explained by the fact that amor-phous material is more hygroscopic than crystalline material, and water absorbed on the surface increases the chemical degradation of amorphous material by providing reaction media or acting as a reactant. Thermal degradation was associated with a rise in two known degradation products, TAC-RI and TAC-EPI, along with several minor degradation products, which primarily eluted before the TAC main peak (see Fig. 4b). It was assessed that most of these unknown small peaks were oxidative degradation products (see also Oxygen induced degradation). On the other hand, increase in TAC-RI is mostly associated with high temperature and humidity.
Oxygen induced degradation. – Solid state studies showed that amorphous TAC is sus-ceptible to oxidation. Studies were performed at elevated temperature (50 °C) under air (~21 % oxygen), oxygen, and nitrogen as reference conditions. Degradation under oxygen resulted in a significant increase in total impurities (17.93 %) compared to that under an air atmosphere (3.47 %). A large number of different unidentified degradation products were formed, indicating complex oxidation reactions (see Fig. 4c). When amorphous TAC was exposed to elevated temperature under an inert (nitrogen) atmosphere, almost no decom-position was observed.
Photolytic conditions. – After exposure to artificial sunlight, substantial degradation of TAC resulted in numerous unknown degradation products and an increase in the known
Fig. 3. XRPD patterns of crystalline TAC monohydrate (used as starting material for the preparation of amorphous material) and the prepared amorphous TAC.

373
T. Rozman Peterka et al.: Forced degradation of tacrolimus and the development of a UHPLC method for impurities determination, Acta Pharm. 69 (2019) 363–380.
Table II. Results of forced degradation study
Forced degradation in solid state
TAC
-H1
(%)
TAC
-RI (
%)
TAC
-EPI
(%)
TAC
-die
ne
(%)
TAC
- -d
ehyd
ro (%
)
Max
. un
know
n im
puri
ty (%
)(R
RT)
Sum
(%)
Initial < 0.05 < 0.05 < 0.05 < 0.05 < 0.05 0.13 (RRT 0.93) 0.2550 °C/30 % RH, 1 m < 0.05 0.19 0.28 < 0.05 < 0.05 0.20 (RRT 0.72) 1.3750 °C/50 % RH, 1 m < 0.05 0.29 0.33 < 0.05 < 0.05 0.22 (RRT 0.72) 2.0150 °C/75 % RH, 1 m < 0.05 1.07 0.38 0.06 < 0.05 0.65 (RRT 0.93) 5.8150 °C, nitrogen, 1 m < 0.05 0.12 0.05 < 0.05 < 0.05 0.13 (RRT 0.93) 0.3050 °C, air, 1 m < 0.05 0.28 0.49 < 0.05 < 0.05 0.33 (RRT 0.27) 3.4750 °C, oxygen, 1 m < 0.05 0.74 1.18 0.09 < 0.05 1.49 (RRT 0.27) 17.93SUNTEST, 16 h < 0.05 < 0.05 0.23 < 0.05 < 0.05 3.99 (RRT 0.56) 14.28SUNTEST, 16 h, dc < 0.05 < 0.05 < 0.05 < 0.05 < 0.05 0.13 (RRT 0.93) 0.24Fluor. light, 22 h < 0.05 < 0.05 0.09 < 0.05 < 0.05 0.13 (RRT 0.93) 0.56Fluor. light, 22 h, dc < 0.05 < 0.05 < 0.05 < 0.05 < 0.05 0.13 (RRT 0.93) 0.24Forced degradation in solutionInitial < 0.05 < 0.05 < 0.05 < 0.05 < 0.05 0.10 (RRT 0.93) 0.260.1 mol L–1 HCl, 24 h < 0.05 < 0.05 < 0.05 0.08 < 0.05 0.10 (RRT 0.93) 0.310.01 mol L–1 HCl, 24 h < 0.05 < 0.05 < 0.05 < 0.05 < 0.05 0.10 (RRT 0.93) 0.240.01 mol L–1 NaOH, 24 h < 0.05 < 0.05 < 0.05 < 0.05 < 0.05 11.17 (RRT 0.49) 16.880.1 mol L–1 NaOH, 24 h < 0.05 < 0.05 < 0.05 < 0.05 < 0.05 34.26 (RRT 0.49) 118.52a
pH 3, 24 h < 0.05 < 0.05 < 0.05 < 0.05 < 0.05 0.11 (RRT 0.93) 0.24pH 5, 24 h < 0.05 < 0.05 < 0.05 < 0.05 < 0.05 0.11 (RRT 0.93) 0.24pH 7, 24 h < 0.05 < 0.05 < 0.05 < 0.05 < 0.05 0.09 (RRT 0.93) 0.36pH 9, 24 h < 0.05 < 0.05 0.09 < 0.05 < 0.05 20.24 (RRT 0.49) 31.43pH 11, 24 h < 0.05 < 0.05 0.21 < 0.05 < 0.05 57.30 (RRT 0.49) 91.94Water, RT, 24 h < 0.05 < 0.05 < 0.05 < 0.05 < 0.05 0.08 (RRT 0.93) 0.25Water, 60 °C, 24 h < 0.05 0.48 < 0.05 < 0.05 < 0.05 0.21 (RRT 0.38) 0.933 % H2O2, RT, 24 h < 0.05 < 0.05 < 0.05 < 0.05 < 0.05 0.49 (RRT 0.39) 0.69ACVA, 60 °C, 24 h < 0.05 0.46 0.36 < 0.05 < 0.05 0.72 (RRT 0.10) 4.12FeCl3, 60 °C, 24 h 1.66 0.47 0.25 0.88 < 0.05 0.91 (RRT 1.06) 10.19SUNTEST, 2 h < 0.05 < 0.05 0.30 < 0.05 < 0.05 2.40 (RRT 1.21) 6.79SUNTEST, 2 h, dc < 0.05 < 0.05 < 0.05 < 0.05 < 0.05 0.09 (RRT 0.93) 0.09Fluor. light, 22 h < 0.05 < 0.05 < 0.05 < 0.05 < 0.05 0.09 (RRT 0.93) 0.09Fluor. light, 22 h, dc < 0.05 < 0.05 < 0.05 < 0.05 < 0.05 0.09 (RRT 0.93) 0.09
ACVA – 4,4′-azobis(4-cyanovaleric acid), dc – dark control, m – month, RT - room temperaturea Total degradation in 0.1 mol L–1 NaOH and formation of several secondary/tertiary degradation products result-ing in the sum of impurities > 100 % due to different response factors (UV spectra) of formed degradation products compared to parent TAC.

374
T. Rozman Peterka et al.: Forced degradation of tacrolimus and the development of a UHPLC method for impurities determination, Acta Pharm. 69 (2019) 363–380.
degradation product TAC-EPI. The largest unidentified impurity peaks were observed at RRT 0.29 (1.08 %), RRT 0.43 (2.45 %), RRT 0.56 (3.99 %) and RRT 1.05 (1.20 %). After exposure to cool white fluorescent light, a slight increase in total impurities and TAC-EPI was de-tected. No degradation of dark control was observed under the conditions applied.
Forced degradation in solution
For stress testing of TAC in solution, ACN was used as a co-solvent because TAC is poorly soluble in water. Results of forced degradation studies in solution are gathered in Table II and revealed the following.
Hydrolytic conditions. – TAC was found to be highly labile and prone to degradation under alkaline conditions and relatively stable under neutral or mildly acidic conditions. TAC degradation under basic conditions at pH ≥ 9 and in 0.01 mol L–1 NaOH was associ-ated with a substantial rise in the major degradation product at RRT 0.49 (see Fig. 5a).
Fig. 4. Chromatograms of amorphous TAC samples: a) initial sample, b) thermal/humidity degrada-tion (50 °C/75 % RH, open dish), and c) oxygen induced degradation.
375
T. Rozman Peterka et al.: Forced degradation of tacrolimus and the development of a UHPLC method for impurities determination, Acta Pharm. 69 (2019) 363–380.
Moreover, some other degradation products at RRT 0.36, RRT 0.61 and RRT 1.08 were also increased. Complete degradation of TAC was observed when the drug was exposed to more severe basic conditions in 0.1 mol L–1 NaOH for 24 hours. The amount of total degra-dation products in 0.1 mol L–1 NaOH was calculated to be > 100 %, indicating the formation of several secondary/tertiary degradation products with response factors different from the parent drug (TAC). On the other hand, TAC is stable under acidic conditions at pH 3–5 and in 0.01 mol L–1 HCl, where practically no increase in degradation products was detected. Some minor increase in unknown inpurities under neutral conditions at pH 7 was observed.
Thermal degradation. – Upon heating the TAC aqueous solution at 60 °C for 24 hours, an increase of up to 0.48 % for the impurity TAC-RI was observed, with some minor in-crease in the degradation product at RRT 0.38 (0.21 %) (see Fig. 5b). In contrast, no degrada-tion of TAC was observed in aqueous solution at room temperature (used as reference for evaluation of the influence of elevated temperature).
Oxidation conditions. – Susceptibility of TAC to oxidation in solution was studied using hydrogen peroxide, radical initiator 4,4′-azobis(4-cyanovaleric acid) (ACVA) and metal ion (Fe3+). TAC was not found to be very susceptible to oxidation by hydrogen peroxide in aqueous medium. After treatment with 3 % H2O2 at room temperature, increase in only one degradation product at RRT 0.39 (0.49 %) was detected. In the presence of the radical initiator ACVA (at 60 °C), TAC was degraded to a main degradation product at RRT 0.10 (0.72 %) and TAC-EPI (0.36 %), along with several other minor unidentified degradation products. Decomposition of TAC catalyzed by Fe3+ ions in the solution led to an increase in the known degradation products TAC-H1, TAC-diene and TAC-EPI, together with some other unidentified degradation products at RRT 0.38, RRT 0.41 and RRT 1.06 (see Fig. 5c). Increase in TAC-RI was associated with the elevated temperature of 60 °C and was not due to the impact of radical initiator or Fe3+ ions (TAC-RI levels in water bath at 60 °C and in the presence of ACVA or Fe3+ ions at 60 °C were comparable).
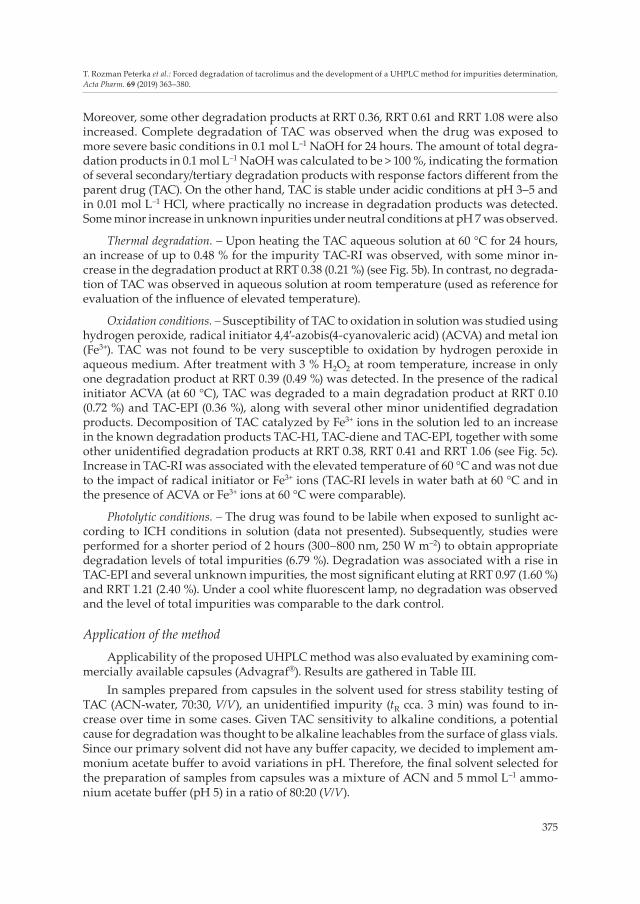
Photolytic conditions. – The drug was found to be labile when exposed to sunlight ac-cording to ICH conditions in solution (data not presented). Subsequently, studies were performed for a shorter period of 2 hours (300–800 nm, 250 W m–2) to obtain appropriate degradation levels of total impurities (6.79 %). Degradation was associated with a rise in TAC-EPI and several unknown impurities, the most significant eluting at RRT 0.97 (1.60 %) and RRT 1.21 (2.40 %). Under a cool white fluorescent lamp, no degradation was observed and the level of total impurities was comparable to the dark control.
Application of the methodApplicability of the proposed UHPLC method was also evaluated by examining com-
mercially available capsules (Advagraf®). Results are gathered in Table III.In samples prepared from capsules in the solvent used for stress stability testing of
TAC (ACN-water, 70:30, V/V), an unidentified impurity (tR cca. 3 min) was found to in-crease over time in some cases. Given TAC sensitivity to alkaline conditions, a potential cause for degradation was thought to be alkaline leachables from the surface of glass vials. Since our primary solvent did not have any buffer capacity, we decided to implement am-monium acetate buffer to avoid variations in pH. Therefore, the final solvent selected for the preparation of samples from capsules was a mixture of ACN and 5 mmol L–1 ammo-nium acetate buffer (pH 5) in a ratio of 80:20 (V/V).

376
T. Rozman Peterka et al.: Forced degradation of tacrolimus and the development of a UHPLC method for impurities determination, Acta Pharm. 69 (2019) 363–380.
Summary of validation studies
The developed method was validated in accordance with ICH guidelines (21, Novem-ber 1996). In line with ICH guidelines, accuracy was evaluated only for the relevant known degradation products formed in forced degradation studies or during accelerated stability studies of capsules (TAC-H1, TAC-RI, TAC-EPI, TAC-diene). Nevertheless, specificity was also checked for other known impurities, including process related impurities originating from the TAC drug substance.
Specificity. – Specificity was demonstrated for all available known impurities. Specificity was also examined relative to the blank and placebo solution (placebo was composed of hypromellose, ethylcellulose, lactose monohydrate and magnesium stearate). Solvent and placebo did not interfere with the determination of TAC impurities in pharmaceutical dosage forms.
Fig. 5. Chromatograms of TAC forced degradation in solution: a) alkali degradation (pH 9), b) thermal degradation, c) metal ion catalyzed degradation (Fe3+).

377
T. Rozman Peterka et al.: Forced degradation of tacrolimus and the development of a UHPLC method for impurities determination, Acta Pharm. 69 (2019) 363–380.
Linearity. – Calibration curve showed good linearity (R2 = 0.9999) over the range of 1.5–18 µg mL–1 for TAC (from LOQ level of 0.05 to 0.6 % of nominal concentration). Regres-sion equation for plotted calibration curve was y = 4039.3047x + 219.5273.
Accuracy. – Recovery results for spiked impurities were obtained within acceptance limits of 70–130 % for impurities at levels of ≤ 0.2 %, 80–120 % for impurities at levels of 0.3–0.5 % and 90–110 % for impurities at levels of 0.6–5 %. Results are presented in Table IV.
Table III. Analyses of commercial pharmaceutical dosage forms (%)
Advagraf® 0.5 mg Advagraf® 5 mg
Initial 1 m 3 m 6 m Initial 1 m 3 m 6 m
40 °C/75 % RH 40 °C/75 % RH
TAC-H1 (%) < 0.05 0.07 0.09 0.08 0.05 0.09 < 0.05 < 0.05TAC-RI (%) 0.06 0.11 0.20 0.31 0.06 0.12 0.19 0.27TAC-EPI (%) 0.05 0.07 0.09 0.14 < 0.05 0.06 0.06 0.10TAC-diene (%) < 0.05 < 0.05 < 0.05 0.06 < 0.05 < 0.05 < 0.05 0.05TAC-dehydro (%) < 0.05 < 0.05 < 0.05 < 0.05 < 0.05 < 0.05 < 0.05 < 0.05Max. unknown impurity (%) 0.08 0.18 0.09 0.09 0.08 0.09 0.09 < 0.05
RRT of max. unknown impurity
RRT 1.23
RRT 1.63
RRT 1.23
RRT 1.23
RRT 1.23
RRT 1.23
RRT 1.24
RRT n.a.
Sum 0.30 % 0.78 % 0.68 % 0.83 % 0.24% 0.41 % 0.39 % 0.42 %
m – month, n.a. – not applicable
Table IV. Results of accuracy studies
Impurity spiked Impurity target (%) Recovery (%) Accuracy range (mg mL–1)
TAC-H1
0.05 99.98
1.4–17.1 0.50 98.45
0.60 97.79
TAC-RI
0.05 85.25
1.3–15.8 0.50 93.68
0.60 93.37
TAC-EPI
0.05 84.19
1.6–18.7 0.50 94.95
0.60 95.66
TAC-diene
0.05 123.52
1.4–17.3 0.50 99.47
0.60 99.93

378
T. Rozman Peterka et al.: Forced degradation of tacrolimus and the development of a UHPLC method for impurities determination, Acta Pharm. 69 (2019) 363–380.
The method was proven to be accurate within the range of 0.05 % (LOQ) to 0.6 % of the indi-vidual impurity level in pharmaceutical formulations.
Precision. – RSD of replicate determinations was found to be < 5 % for the measured content of individual impurities and sum of impurities, which indicates that the method is precise.
Limit of detection (LOD) and limit of quantitation (LOQ). – LOD and LOQ were confirmed to be 0.6 µg mL–1 (0.02 % of the nominal sample concentration) and 1.5 µg mL–1 (0.05 % of the nominal sample concentration), resp.
Range. – Method range was derived from linearity, accuracy and precision experi-ments. The method was confirmed to be linear, accurate and precise in the concentration range from 0.05 to 0.6 % of the nominal value for impurity level.
CONCLUSIONS
Forced degradation study in solution showed that TAC is a labile compound, prone to degradation under basic, thermal, photolytic conditions and in the presence of a radical initiator or metal ions. It is stable under slightly acidic conditions at pH 3–5. Forced degra-dation study in solid-state, conducted on amorphous TAC, revealed that this material is sensitive to light, elevated temperature, humidity and is susceptible to oxidation. This study demonstrated the importance of appropriate design of forced degradation studies, taking into consideration both physiochemical characteristics of the drug substance and the aspects of the developed formulation. The acquired knowledge could be very helpful during development or when solving stability-related problems of commercial formula-tions. In addition, an advanced UHPLC method was developed for simultaneous separa-tion of several TAC impurities. In comparison with the pre-existing TAC methods, the developed method demonstrated excellent specificity and a substantially shorter analysis run time of 14 minutes. The method was successfully applied to the analysis of commercial samples and validated in terms of linearity, precision, accuracy, sensitivity and specificity. The method was found to be suitable for UHPLC determination of degradation products of TAC in the range of 0.05 to 0.6 % of the impurities level in pharmaceutical dosage forms. Furthermore, the stability indicating power of the method was demonstrated by the re-sults of forced degradation studies.
The developed method is fast, simple and cost-effective, and is therefore suitable for the routine analysis of TAC degradation products in pharmaceutical dosage forms.
REFERENCES
1. T. Kino, H. Hatanaka, M. Hashimoto, M. Nishiyama, T. Goto, M. Okuhara, M. Kohsaka, H. Aoki and H. Imanaka, FK-506, a novel immunosuppressant isolated from a Streptomyces. I. Fermenta-tion, isolation, and physico-chemical and biological characteristics, J. Antibiot. 40 (1987) 1249–1255; https://doi.org/10.7164/antibiotics.40.1249
2. T. Kino, H. Hatanaka, S. Miyata, N. Inamura, M. Nishiyama, T. Yajima, T. Goto, M. Okuhara, M. Kohsaka, H. Aoki and T. Ochia, FK-506, a novel immunosuppressant isolated from a Streptomy-ces. II. Immunosuppressive effect of FK-506 in vitro, J. Antibiot. 40 (1987) 1256–1265; https://doi.org/10.7164/antibiotics.40.1256
379
T. Rozman Peterka et al.: Forced degradation of tacrolimus and the development of a UHPLC method for impurities determination, Acta Pharm. 69 (2019) 363–380.
3. T. Goto, T. Kino, H. Hatanaka, M. Nishiyama, M. Okuhara, M. Kohsaka, H. Aoki and H. Imanaka, Discovery of FK-506, a novel immunosuppressant isolated from Streptomyces tsukubaensis, Transplant. Proc. 19 (1987) 4–8.
4. J. J. Fung, Tacrolimus and transplantation: a decade in review, Transplantation 77 (2004) S41-S43; https://doi.org/10.1097/01.TP.0000126926.61434.A5
5. M. R. First, Tacrolimus based immunosuppression, J. Nephrol. 17 (2004) S25–S31. 6. D. Simpson and S. Noble, Tacrolimus ointment – A review of its use in atopic dermatitis and its
clinical potential in other inflammatory skin conditions, Drugs 65 (2005) 827–858; https://doi.org/10.2165/00003495-200565060-00011
7. S. Dutta and Y. Ahmad, The efficacy and safety of tacrolimus in rheumatoid arthritis, Ther. Adv. Musculoskelet. Dis. 3 (2011) 283–291; https://doi.org/10.1177/1759720X11419038
8. D. M. Skytte, J. W. Jaroszewski, K. T. Johansen, S. H. Hansen, L. Hansen, P. G. Nielsen and K. Frydenvang, Some transformations of tacrolimus, an immunosuppressive drug, Eur. J. Pharm. Sci. 48 (2013) 514–522; https://doi.org/10.1016/j.ejps.2012.12.001
9. H. Ok, B. H. Arison, R. G. Ball, T. R. Beattie, M. H. Fisher and M. J. Wyvratt, Thermal rearrange-ment of the immunosuppressant FK-506, Tetrahedron Lett. 31 (1990) 6477–6480; https://doi.org/10.1016/S0040-4039(00)97095-3
10. D. M. Skytte, K. Frydenvang, L. Hansen, P. G. Nielsen and J. W. Jaroszewski, Synthesis and char-acterization of an epimer of tacrolimus, an immunosuppressive drug, J. Nat. Prod. 73 (2010) 776–779; https://doi.org/10.1021/Np9007975
11. P. Ferraboschi, D. Colombo, M. De Mieri and P. Grisenti, Evaluation, synthesis and characteriza-tion of tacrolimus impurities, J. Antibiot. 65 (2012) 349–354; https://doi.org/10.1038/Ja.2012.28
12. C. D. Sommers, E. S. Pang, H. Ghasriani, R. T. Berendt, V. L. Vilker, D. A. Keire and M. T. Boyne, 2nd, Analyses of marketplace tacrolimus drug product quality: bioactivity, NMR and LC-MS, J. Pharm. Biomed. Anal. 85 (2013) 108–117; https://doi.org/10.1016/j.jpba.2013.07.001
13. T. Rozman Peterka, R. Grahek, J. Hren, A. Bastarda, J. Bergles and U. Urleb, Solid state compatibility study and characterization of a novel degradation product of tacrolimus in formulation, J. Pharm. Biomed. Anal. 110 (2015) 67–75; https://doi.org/10.1016/j.jpba.2015.02.047
14. United State Pharmacopeia 41, National Formulary 36, US Pharmacopeial Convention, Rockville 2018, pp. 3906–3914; https://online.uspnf.com/uspnf; last access date December 24, 2018.
15. European Pharmacopoeia 9.3, Council of Europe, Strasbourg 2018, pp. 4997–4999; http://online6.edqm.eu/ep905/; last access date December 24, 2018.
16. T. Akashi, T. Nefuji, M. Yoshida and J. Hosoda, Quantitative determination of tautomeric FK506 by reversed-phase liquid chromatography, J. Pharm. Biomed. Anal. 14 (1996) 339–346; https://doi.org/10.1016/0731-7085(95)01605-8
17. Y. Namiki, N. Kihara, S. Koda, K. Hane and T. Yasuda, Tautomeric phenomenon of a novel potent immunosuppressant (FK506) in solution I. Isolation and structure determination of tautomeric compounds, J. Antibiot. 46 (1993) 1149–1155; https://doi.org/10.7164/antibiotics.46.1149
18. Y. Namiki, A. Fujiwara, N. Kihara, S. Koda, K. Hane and T. Yasuda, Determination of the immu-nosuppressive drug tacrolimus in its dosage forms by high-performance liquid-chromatography, Chromatographia 40 (1995) 253–258; https://doi.org/10.1007/Bf02290354
19. Q. Shi, J. Li and F. Ding, Development and validation of method for the determination of related substances of tacrolimus in tacrolimus capsules and degradation studies, Int. J. ChemTech Res. 4 (2012) 1543–1552.
20. A. Subasranjan, C. Srinivasulu and R. Hemant, An improved validated ultra high pressure liquid chromatography method for separation of tacrolimus impurities and its tautomers, Drug Test. Anal. 2 (2010) 107–112; https://doi.org/10.1002/dta.112

380
T. Rozman Peterka et al.: Forced degradation of tacrolimus and the development of a UHPLC method for impurities determination, Acta Pharm. 69 (2019) 363–380.
21. International Conference on Harmonisation of Technical Requirements for Registration of Phar-maceuticals for Human Use, ICH Harmonized Tripartite Guideline, Validation of Analytical Procedures: Text and Methodology Q2(R1), Current Step 4 version, October 1994 (parent), November 1996 (com-plementary); http://www.ich.org/fileadmin/Public_Web_Site/ICH_Products/Guidelines/Quality/Q2_R1/Step4/Q2_R1__Guideline.pdf; last access date September 19, 2018.
22. N. S. Trasi, H. S. Purohit and L. S. Taylor, Evaluation of the crystallization tendency of commer-cially available amorphous tacrolimus formulations exposed to different stress conditions, Pharm. Res. 34 (2017) 2142–2155; https://doi.org/10.1007/s11095-017-2221-4