forbes usaee lecture lehigh university nov 5 2015
TRANSCRIPT

The Accuracy of Wind and Solar Energy
Forecasts and the Prospects for Improvement
Kevin F. ForbesUSAEE Distinguished Lecturer
Associate Professor of EconomicsThe Catholic University of America
Ernest M. ZampelliProfessor of Economics
The Catholic University of [email protected]
USAEE Distinguished Lecture Lehigh University Student Chapter of the USAEE
Lehigh UniversityBethlehem, Pennsylvania
5 November 2015

The Organization of this Talk
1)Why is Forecasting Important?
2) The Literature on Wind and Solar Energy Forecast Accuracy
3) What is the level of forecast skill ? Specifically, what does the Mean Squared Error Skill Score (MSESS) indicate about the solar and wind energy forecasts? How does this level of accuracy compare to the accuracy of the load forecasts?
4)From the point of view of a system operator, how does wind energy compare with conventional forms of generation?
5)What are the prospects for improving the accuracy of the solar, wind, and load forecasts?

1)Why is Forecasting Important?
• The stability of the power grid is enhanced when forecasts are more accurate. This is important because blackouts have very high societal costs
• Some forms of balancing technologies such as open-cycle gas turbines can be very expensive to deploy and also have above average emissions factors.
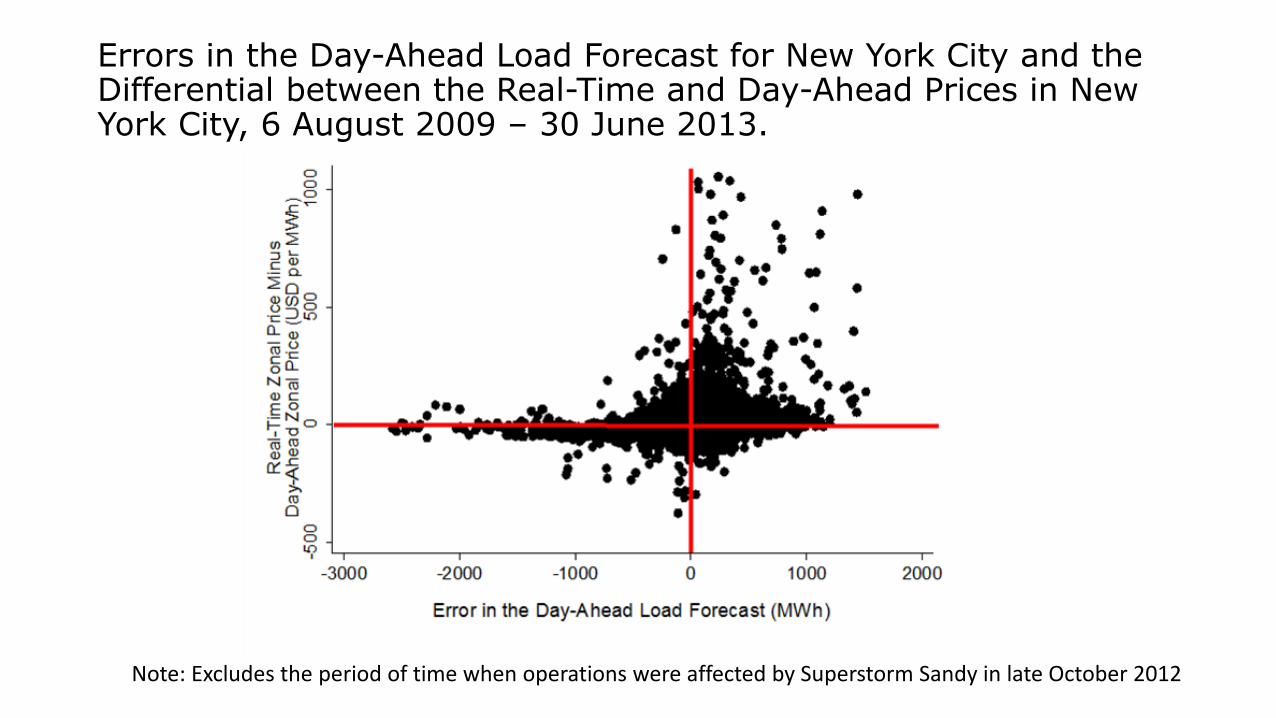
Errors in the Day-Ahead Load Forecast for New York City and the Differential between the Real-Time and Day-Ahead Prices in New York City, 6 August 2009 – 30 June 2013.
Note: Excludes the period of time when operations were affected by Superstorm Sandy in late October 2012
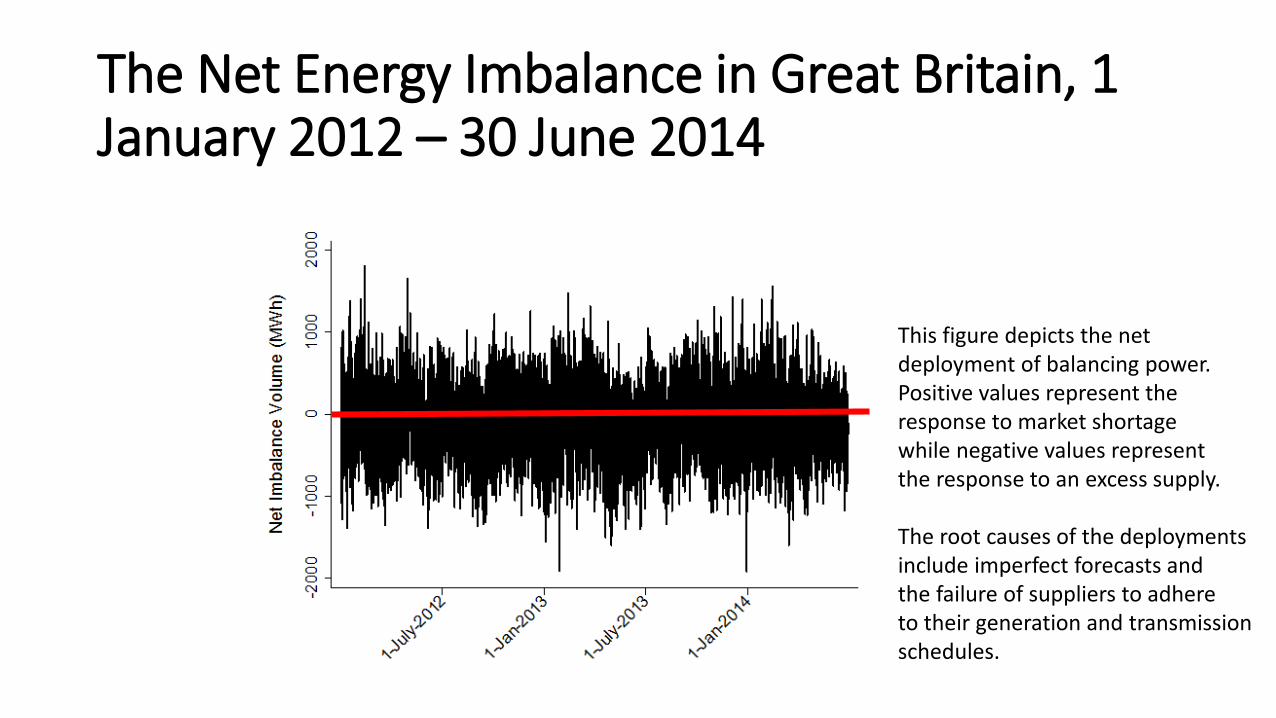
The Net Energy Imbalance in Great Britain, 1 January 2012 – 30 June 2014
This figure depicts the netdeployment of balancing power.Positive values represent the response to market shortagewhile negative values representthe response to an excess supply.
The root causes of the deployments include imperfect forecasts andthe failure of suppliers to adhere to their generation and transmission schedules.

System Frequency in Great Britain, 1 December – 31 December 2013
System frequency in Great Britain varies around the
target of 50 Hz with National Grid being obligated to keep
system frequency within one percent of the 50 Hz target,
i.e. +/- 50 mHz In Great Britain, deviations within
the band +/- 20 mHz are considered normal.
Deviations outside the band +/- 20 mHz do occur.
Specifically, there were 152 cases in December 2013
in which the operational limits were violated.
This appears to be a higher rate of violations than previously.
For example, there was only one violation in December 2012.

2) The Literature on Forecast Accuracy Some researchers calculate a root-mean-squared error of the forecasts and then weight it by the capacity of the equipment used to produce the energy. The reported capacity weighted root mean squared errors (CWRMSE) are usually less than 10 percent. Adherents of this approach include Lange, et al. (2006, 2007), Cali et al. (2006), Krauss, et al. (2006), Holttinen, et al. (2006), Kariniotakis, et al. (2006), and even NERC (2010, p. 9).
In a publication entitled, “Wind Power Myths Debunked,” Milligan, et al. (2009) draw on research from Germany to argue that it is a fiction that wind energy is difficult to forecast. In their words: “In other research conducted in Germany, typical wind forecast errors for a single wind project are 10% to 15% root mean-squared error (RMSE) of installed wind capacity (emphasis added) but drop to 5% to 7% for all of Germany.” (Milligan, et al. 2009, p. 93)
The UK’s Royal Academy of Engineering (2014, p. 33) has noted that wind energy’s capacity weighted forecast error of about five percent is evidence that that the wind energy forecasts are highly accurate.
A report by the IPCC ( 2012 p, 623) on renewable energy indicates that wind energy is moderately predictable as evidenced by a capacity weighted RMS forecast error that is less than 10%. Solar energy is reported to be even more accurate.

The Literature on Forecast Accuracy (Continued)NREL (2013) implicitly endorses capacity weighted RMSEs for wind energy but makes use of energy weighted RMSEs when discussing the accuracy of load forecasts.
In contrast, Forbes et. al. (2012) calculate a root-mean-squared forecast error for wind energy in nine electricity control areas. The RMSEs are normalized by the mean level of wind energy that is actually produced. The reported energy weighted root mean squared errors (EWRMSE) are in excess of 20 %.

CapacityInstalled
T
ForecastActual
CWRMSE
T
t
tt
)(
1
2
ProducedEnergyMean
T
ForecastActual
EWRMSE
T
t
tt
)(
1
2
CWRMSE vs EWRMSE
CWRMSE will be substantially less than EWRMSE when capacity factors are low.
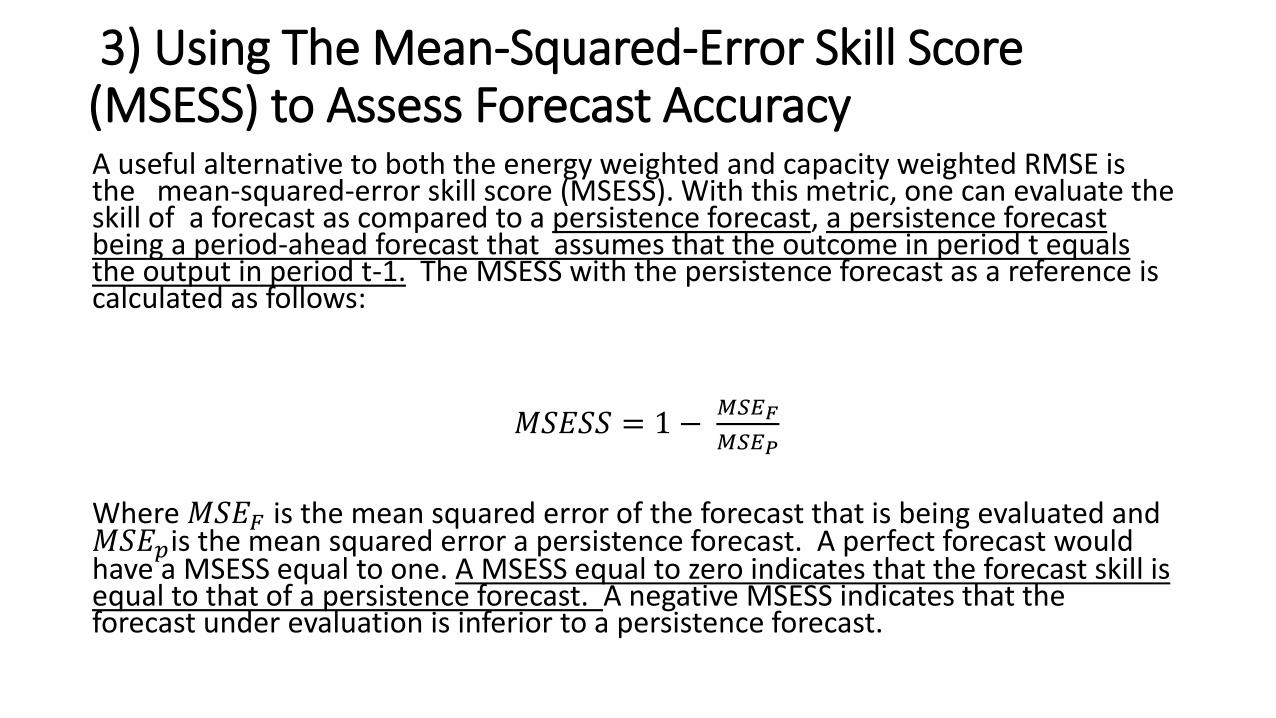
3) Using The Mean-Squared-Error Skill Score (MSESS) to Assess Forecast AccuracyA useful alternative to both the energy weighted and capacity weighted RMSE is the mean-squared-error skill score (MSESS). With this metric, one can evaluate the skill of a forecast as compared to a persistence forecast, a persistence forecast being a period-ahead forecast that assumes that the outcome in period t equals the output in period t-1. The MSESS with the persistence forecast as a reference is calculated as follows:
𝑀𝑆𝐸𝑆𝑆 = 1 −𝑀𝑆𝐸𝐹
𝑀𝑆𝐸𝑃
Where 𝑀𝑆𝐸𝐹 is the mean squared error of the forecast that is being evaluated and 𝑀𝑆𝐸𝑝is the mean squared error a persistence forecast. A perfect forecast would have a MSESS equal to one. A MSESS equal to zero indicates that the forecast skill is equal to that of a persistence forecast. A negative MSESS indicates that the forecast under evaluation is inferior to a persistence forecast.

How accurate are the forecasts?• MSESS were computed for the following zones and/or control areas:
• Bonneville Power Administration• CAISO: SP15 and NP15• MISO• PJM• 50Hertz in Germany• Amprion in Germany• Elia in Belgium• RTE in France• National Grid in Great Britain• Finland• Sweden• Norway• Eastern Denmark• Western Denmark
• When possible the MSESS are reported for Wind, Solar, and Load

Mean Squared Error Skill Scores (MSESS) with a Persistence Forecast as Reference
Control
Area/Zone Forecast Type Sample Period Observations GranularityMSESS
50Hertz
(Germany) Day-Ahead Load
1Jan2011 –
31Dec2013104,590
Quarter-Hour -62.7486
Day-Ahead
Wind
1Jan2011 –
31Dec2013104,590
Quarter-Hour -31.3501
Day-Ahead Solar
1Jan2011 –
31Dec201354,545
Quarter-Hour -5.26831
Amprion
(Germany) Day-Ahead Load
1Jan2011 –
31Dec2013103,326 Quarter-Hour
-12.3308
Day-Ahead
Wind
1Jan2011 –
31Dec2013103,326 Quarter-Hour
-14.5887
Day-Ahead Solar1Jan2011 –
31Dec201355,498 Quarter-Hour
-11.20691
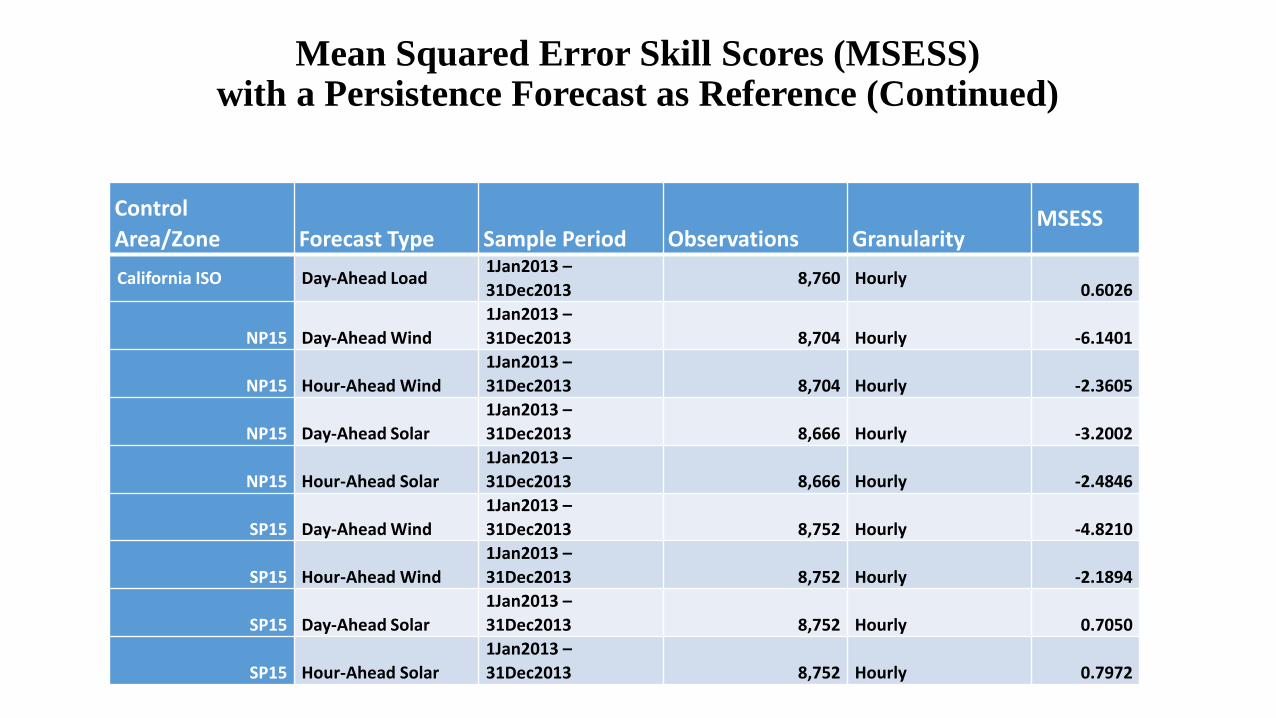
Mean Squared Error Skill Scores (MSESS) with a Persistence Forecast as Reference (Continued)
Control
Area/Zone Forecast Type Sample Period Observations GranularityMSESS
California ISO Day-Ahead Load1Jan2013 –
31Dec20138,760 Hourly
0.6026
NP15 Day-Ahead Wind
1Jan2013 –
31Dec2013 8,704 Hourly -6.1401
NP15 Hour-Ahead Wind
1Jan2013 –
31Dec2013 8,704 Hourly -2.3605
NP15 Day-Ahead Solar
1Jan2013 –
31Dec2013 8,666 Hourly -3.2002
NP15 Hour-Ahead Solar
1Jan2013 –
31Dec2013 8,666 Hourly -2.4846
SP15 Day-Ahead Wind
1Jan2013 –
31Dec2013 8,752 Hourly -4.8210
SP15 Hour-Ahead Wind
1Jan2013 –
31Dec2013 8,752 Hourly -2.1894
SP15 Day-Ahead Solar
1Jan2013 –
31Dec2013 8,752 Hourly 0.7050
SP15 Hour-Ahead Solar
1Jan2013 –
31Dec2013 8,752 Hourly 0.7972

Mean Squared Error Skill Scores (MSESS) with a Persistence Forecast as Reference (Continued)
Control Area/Zone Forecast Type Sample Period Observations Granularity MSESS
Belgium
Day-Ahead Solar 1Jan2013 – 31Dec2013 17,921 Quarter-Hour -12.2621
Intra-Day Solar 1Jan2013 – 31Dec2013 11,278 Quarter-Hour -9.7931
France Day-Ahead Load 1Jan2012 – 31Dec2013 35,088 Half-Hourly0.3842
Day-Ahead Wind 1Jan2012 – 31Dec2013 17,349 Hourly-5.7375
Hour 1 Same Day, Wind1Jan2012 – 31Dec2013
15,109 Hourly -5.2889
Norway Day-Ahead Load 1Jan2011 – 31Dec2013 26,160 Hourly 0.1870
Sweden Day-Ahead Load 1Jan2011 – 31Dec2013 26,160 Hourly 0.2008
Finland Day-Ahead Load 1Jan2011 – 31Dec2013 26,159 Hourly 0.0486
Eastern Denmark Day-Ahead Load 1Jan2011 – 31Dec2013 26,160 Hourly 0.3953
Day-Ahead Wind 1Jan2011 – 31Dec2013 26,107 Hourly -2.7507
Western Denmark Day-Ahead Load 1Jan2011 – 31Dec2013 26,160 Hourly 0.6560
Day-Ahead Wind1Jan2011 – 31Dec2013
26,105 Hourly-3.6749
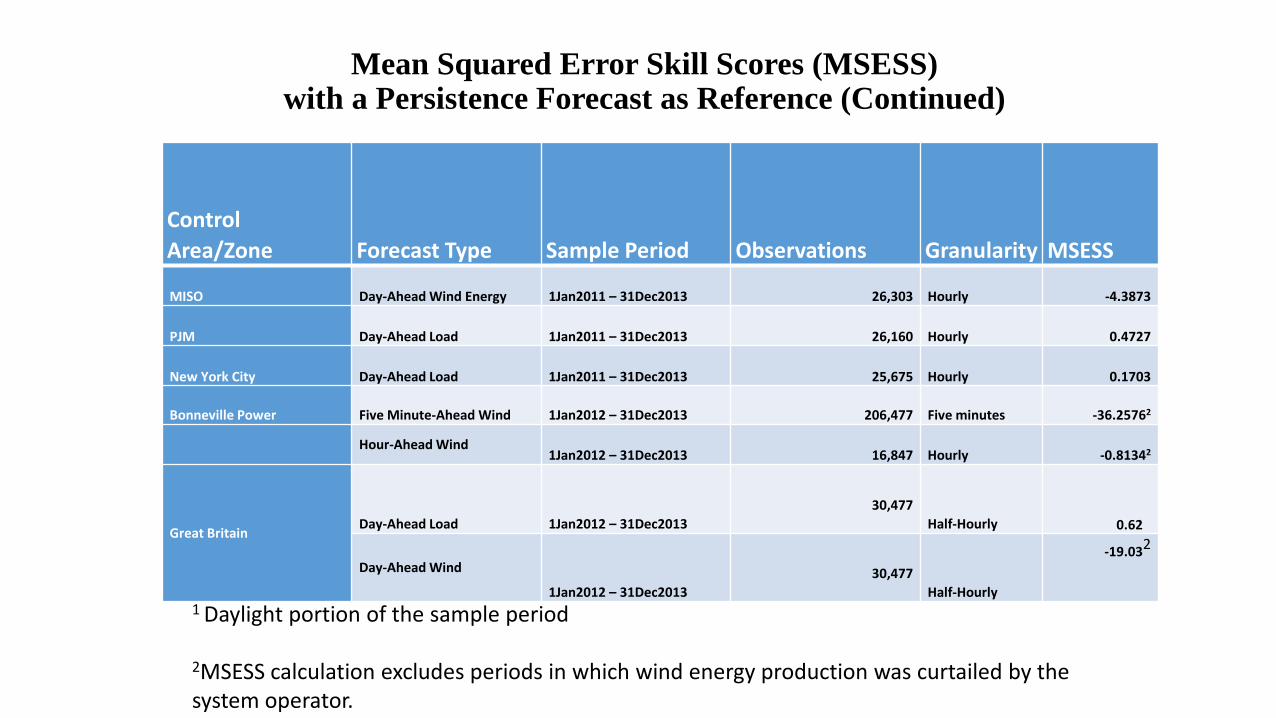
Mean Squared Error Skill Scores (MSESS) with a Persistence Forecast as Reference (Continued)
Control
Area/Zone Forecast Type Sample Period Observations Granularity MSESS
MISO Day-Ahead Wind Energy 1Jan2011 – 31Dec2013 26,303 Hourly -4.3873
PJM Day-Ahead Load 1Jan2011 – 31Dec2013 26,160 Hourly 0.4727
New York City Day-Ahead Load 1Jan2011 – 31Dec2013 25,675 Hourly 0.1703
Bonneville Power Five Minute-Ahead Wind 1Jan2012 – 31Dec2013 206,477 Five minutes -36.25762
Hour-Ahead Wind1Jan2012 – 31Dec2013 16,847 Hourly -0.81342
Great BritainDay-Ahead Load 1Jan2012 – 31Dec2013
30,477
Half-Hourly 0.62
Day-Ahead Wind
1Jan2012 – 31Dec2013
30,477
Half-Hourly
-19.032
1 Daylight portion of the sample period
2MSESS calculation excludes periods in which wind energy production was curtailed by the system operator.
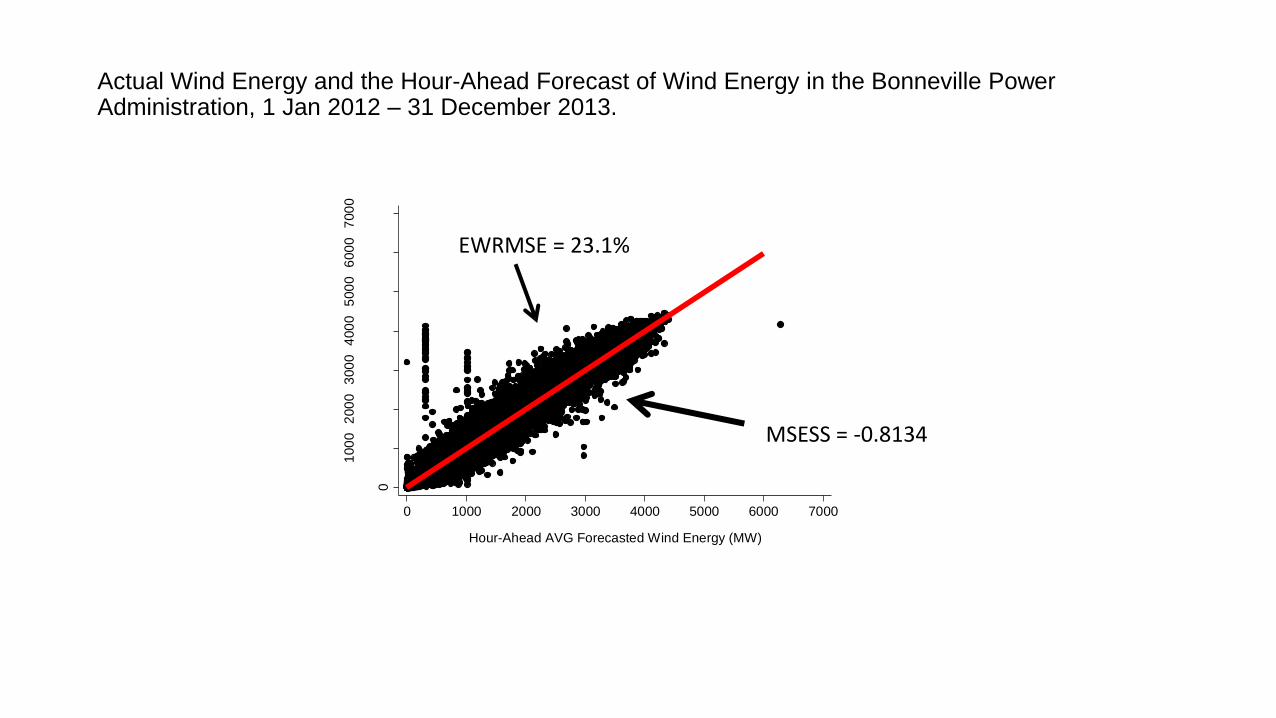
Actual Wind Energy and the Hour-Ahead Forecast of Wind Energy in the Bonneville Power Administration, 1 Jan 2012 – 31 December 2013.
0
100
02
00
03
00
04
00
05
00
06
00
07
00
0
Actu
al W
ind
En
erg
y (
MW
)
0 1000 2000 3000 4000 5000 6000 7000
Hour-Ahead AVG Forecasted Wind Energy (MW)
MSESS = -0.8134
EWRMSE = 23.1%

Day-Ahead Forecasted Wind Energy in Great Britain and Actual Wind Energy Outturn, 1 January 2012 – 31 December 2013
The EWRMSEof the day-ahead forecastis about 25 percent. The CWRMSE is about 6.8 percent.
0
200
04
00
06
00
0
Win
d E
nerg
y O
utt
urn
(M
W)
0 2000 4000 6000
Day-Ahead Forecasted Wind Energy (MW)

Day-Ahead Forecasted Load vs. Actual Load in Great Britain, 1 January 2012 – 31 December 2013 The EWRMSE of the day-ahead load
forecast is about 1.8 percent. The
CWRMSE is about 0.45 percent based
on a proxy of the installed capacity of
the equipment that consumes electricity.
The point of this slide and the previous
slide is that day-ahead wind energy
forecasts in Great Britain are
substantially less accurate than day-
ahead load forecasts regardless of
whether one measures forecast accuracy
using EWRMSE or CWRMSE
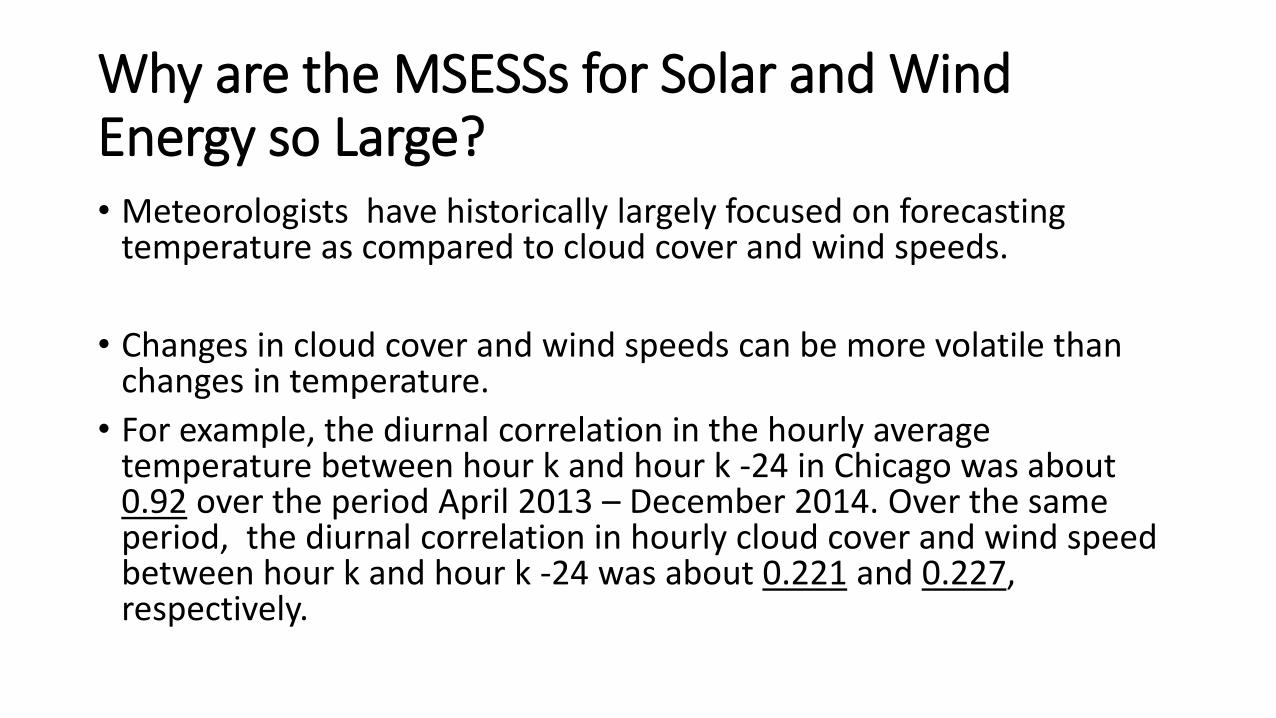
Why are the MSESSs for Solar and Wind Energy so Large?• Meteorologists have historically largely focused on forecasting
temperature as compared to cloud cover and wind speeds.
• Changes in cloud cover and wind speeds can be more volatile than changes in temperature.
• For example, the diurnal correlation in the hourly average temperature between hour k and hour k -24 in Chicago was about 0.92 over the period April 2013 – December 2014. Over the same period, the diurnal correlation in hourly cloud cover and wind speed between hour k and hour k -24 was about 0.221 and 0.227, respectively.

4)From the point of view of a system operator, how does wind energy compare with conventional forms of generation? Evidence from Great Britain
• In Great Britain, each generating station informs the system operator of its intended level of generation one hour prior to real-time. This value is known as the final physical notification (FPN).
• Generators also submit bids (a proposal to reduce generation) and offers (a proposal in increase generation) to provide balancing services
• During real-time, the system operator accepts the bids and offers based on system conditions.
• In short, the revised generation schedule equals the FPN plus the level of balancing services volume requested by the system operator.
• Failure to follow the revised generation schedule gives rise to an electricity market imbalance that needs to be resolved by other generators.

The Revised Generation Schedules vs Actual Generation: The Case of Coal in Great Britain
0
200
04
00
06
00
08
00
01
00
00
120
00
Mete
red G
ene
ration
(M
Wh)
0 2000 4000 6000 8000 10000 12000
Scheduled Generation including Balancing Actions (MWh)
EWRMSE = 2.5 %

The Revised Generation Schedules vs Actual Generation: The Case of Combined Cycle Gas Turbines in Great Britain
0
250
05
00
07
50
01
00
00
125
00
Mete
red G
ene
ration
(M
Wh)
0 2500 5000 7500 10000 12500
Scheduled Generation including Balancing Actions (MWh)
EWRMSE = 5.6%

Actual vs. Scheduled Generation: The Case of Nuclear Energy in Great Britain
0
100
02
00
03
00
04
00
05
00
0
Mete
red G
ene
ration
(M
Wh)
0 1000 2000 3000 4000 5000
Scheduled Generation (MWh)
EWRMSE = 7.4 %

The Revised Generation Schedules vs Actual Generation: The Case of Wind Energy in Great Britain, 1 Jan 2012 – 31 2013
0
500
100
01
50
02
00
02
50
03
00
0
Mete
red G
ene
ration
(M
Wh)
0 500 1000 1500 2000 2500 3000
Scheduled Generation including Balancing Actions (MWh)
EWRMSE= 18 %

Average Imbalances by Fuel in Great Britain, 1 Jan 2012- 31 December 2013

A Closer look at the Wind Energy Imbalances, 1 Jan 2012 – 30 June 2014

5) The Prospects for Improving the Forecasts
• Significant improvements in day-ahead forecasts will probably require major advances in meteorological research. One obvious place to begin is to note that the heat trapping properties of Greenhouse gases most likely have implications for wind speeds.
• Significant improvements in very short run forecasts (e.g. one or two hours ahead) are possible by exploiting the systematic nature of the existing forecast errors.

The Systematic Nature of the Existing Day-Ahead Forecast Errors for Wind Energy: Evidence from Great Britain
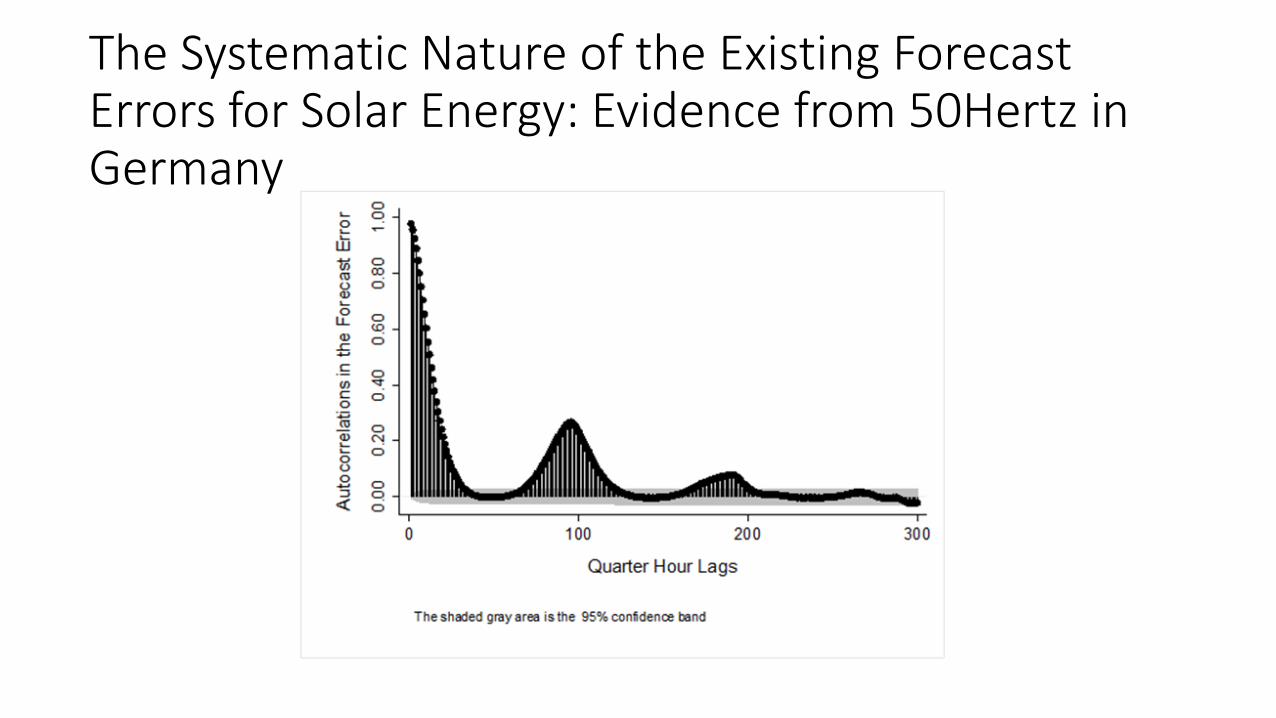
The Systematic Nature of the Existing Forecast Errors for Solar Energy: Evidence from 50Hertz in Germany

The Systematic Nature of the Existing Forecast Errors for Solar Energy: Evidence from SP15 in California over the time period 1 Jan 2013- 31 December 2014

Actual Solar Energy in 50Hertz and an Out-of-Sample Econometrically Modified Solar Energy Forecast, 1 July 2013 – 3 March 2014
For the daylight period:
EWRMSE = 4.8 %
MSESS = 0.768
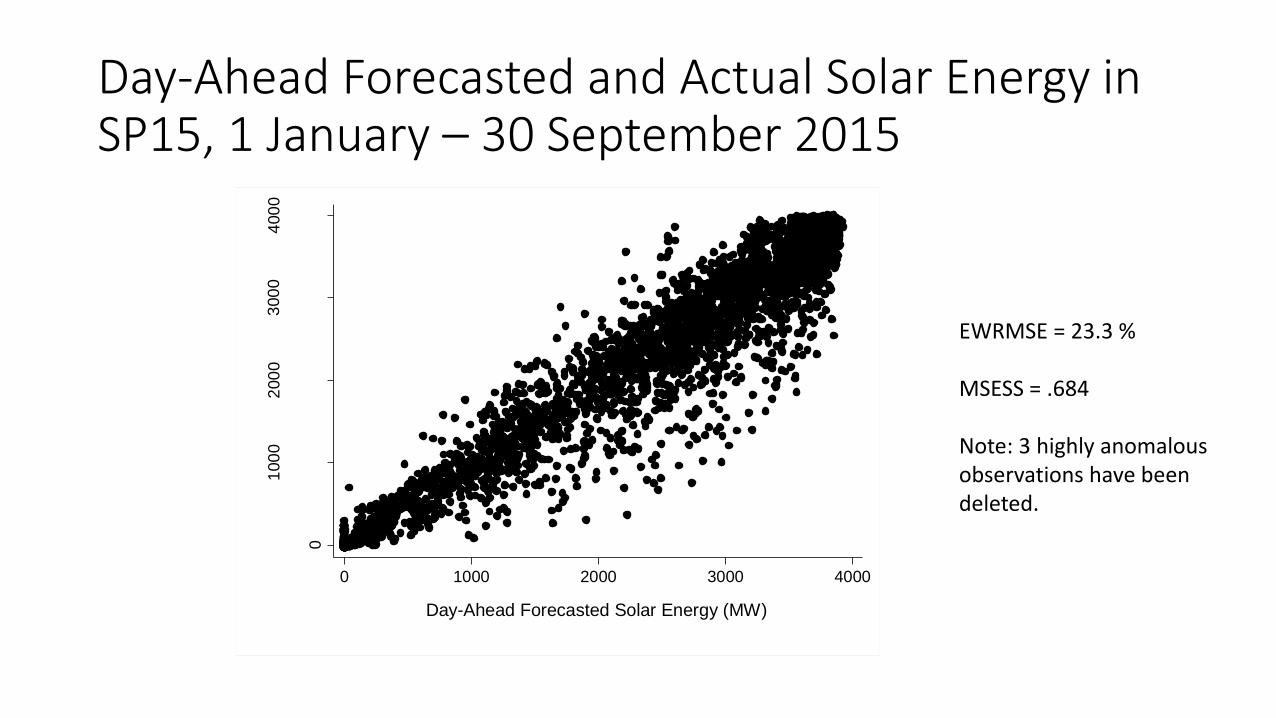
Day-Ahead Forecasted and Actual Solar Energy in SP15, 1 January – 30 September 2015
EWRMSE = 23.3 %
MSESS = .684
Note: 3 highly anomalous observations have beendeleted.
0
100
02
00
03
00
04
00
0
Actu
al G
ene
ratio
n o
f S
ola
r E
ne
rgy (
MW
)
0 1000 2000 3000 4000
Day-Ahead Forecasted Solar Energy (MW)

Hour-Ahead Forecasted and Actual Solar Energy in SP15, 1 January – 30 September 2015
EWRMSE = 17.9 %
MSESS = 0.813
Note: 3 highly anomalous observations have beendeleted.
0
100
02
00
03
00
04
00
0
Actu
al S
ola
r E
ne
rgy G
en
era
tion
(M
W)
0 1000 2000 3000 4000
Hour-Ahead Forecasted Solar Energy (MW)
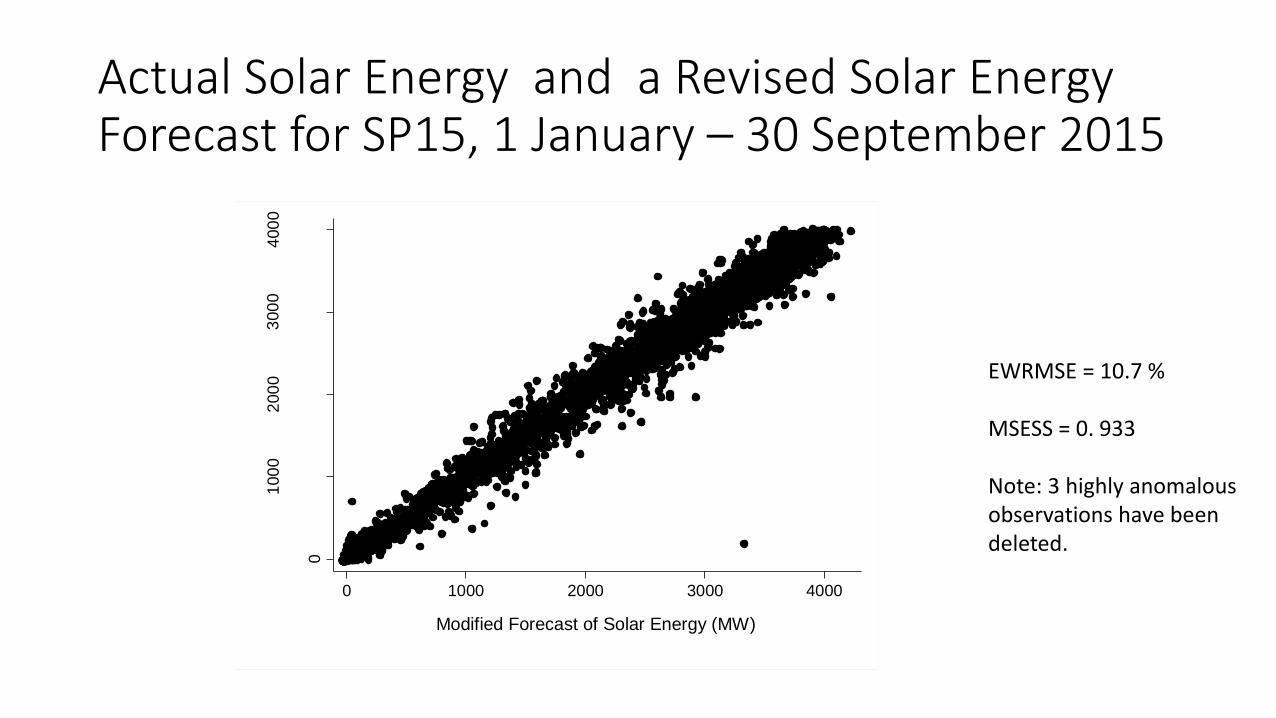
Actual Solar Energy and a Revised Solar Energy Forecast for SP15, 1 January – 30 September 2015
EWRMSE = 10.7 %
MSESS = 0. 933
Note: 3 highly anomalous observations have beendeleted.
0
100
02
00
03
00
04
00
0
Actu
al G
ene
ratio
n o
f S
ola
r E
ne
rgy (
MW
)
0 1000 2000 3000 4000
Modified Forecast of Solar Energy (MW)

Day-Ahead Forecasted and Actual Wind Energy in SP15, 1 January – 30 September 2015
EWRMSE = 49.4 % MSESS = -5.43
0
500
100
01
50
02
00
02
50
0
Actu
al G
ene
ratio
n o
f W
ind
En
erg
y (
MW
)
0 500 1000 1500 2000 2500
CAISO's Day-Ahead Wind Energy Forecast (MW)

Hour-Ahead Forecasted and Actual Wind Energy in SP15, 1 January – 30 September 2015
EWRMSE = 37.1 % MSESS = -2.62
0
500
100
01
50
02
00
02
50
0
Actu
al G
ene
ratio
n o
f W
ind
En
erg
y (
MW
)
0 500 1000 1500 2000 2500
CAISO's Hour-Ahead Wind Energy Forecast (MW)
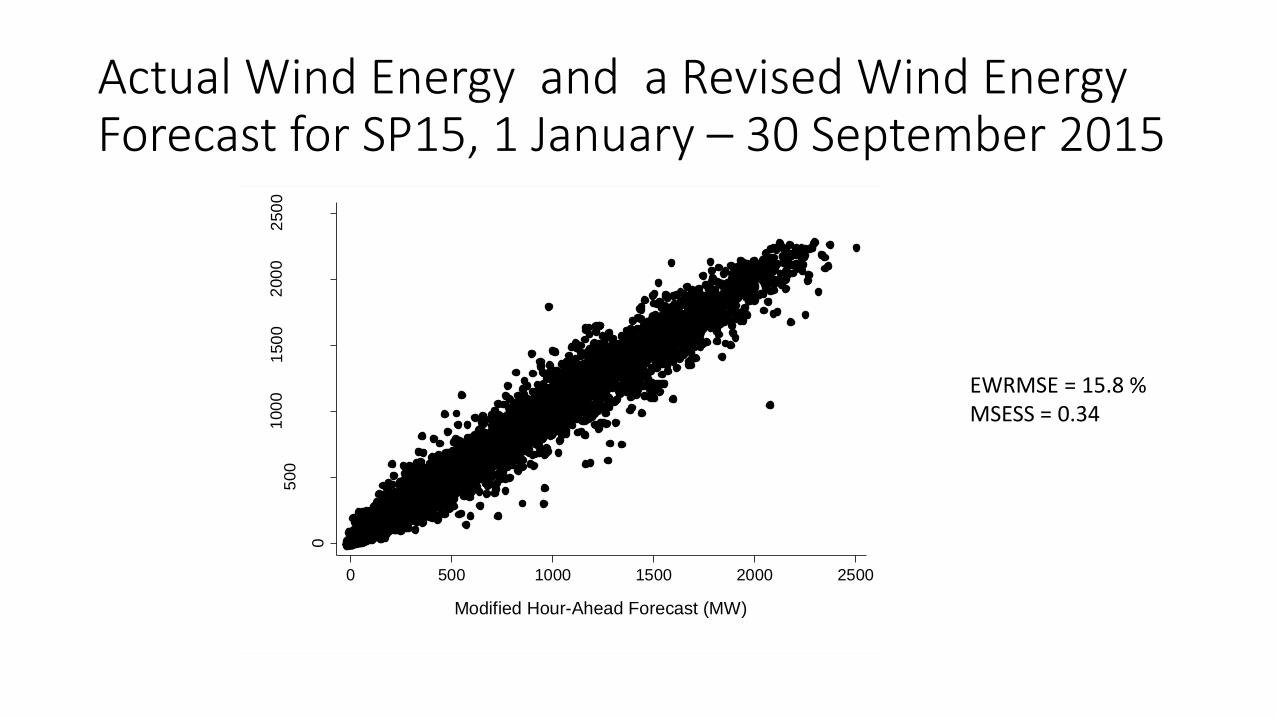
Actual Wind Energy and a Revised Wind Energy Forecast for SP15, 1 January – 30 September 2015
EWRMSE = 15.8 % MSESS = 0.34
0
500
100
01
50
02
00
02
50
0
Actu
al G
ene
ration
of W
ind
Ene
rgy (
MW
)
0 500 1000 1500 2000 2500
Modified Hour-Ahead Forecast (MW)

Out of Sample Results for Solar Energy in NP15 in California, 1 Jan 2015 – 30 September 2015
Forecast Type Number of Observations MSESS EWRMSE
CAISO’s Day-Ahead Solar Energy Forecast
6,541 -1.45 64.1
CAISO’s Hour-Ahead Solar Energy Forecast
6,541 0.18 37.0
Modified Hour-AheadSolar Energy Forecast
6,541 0.84 16.4
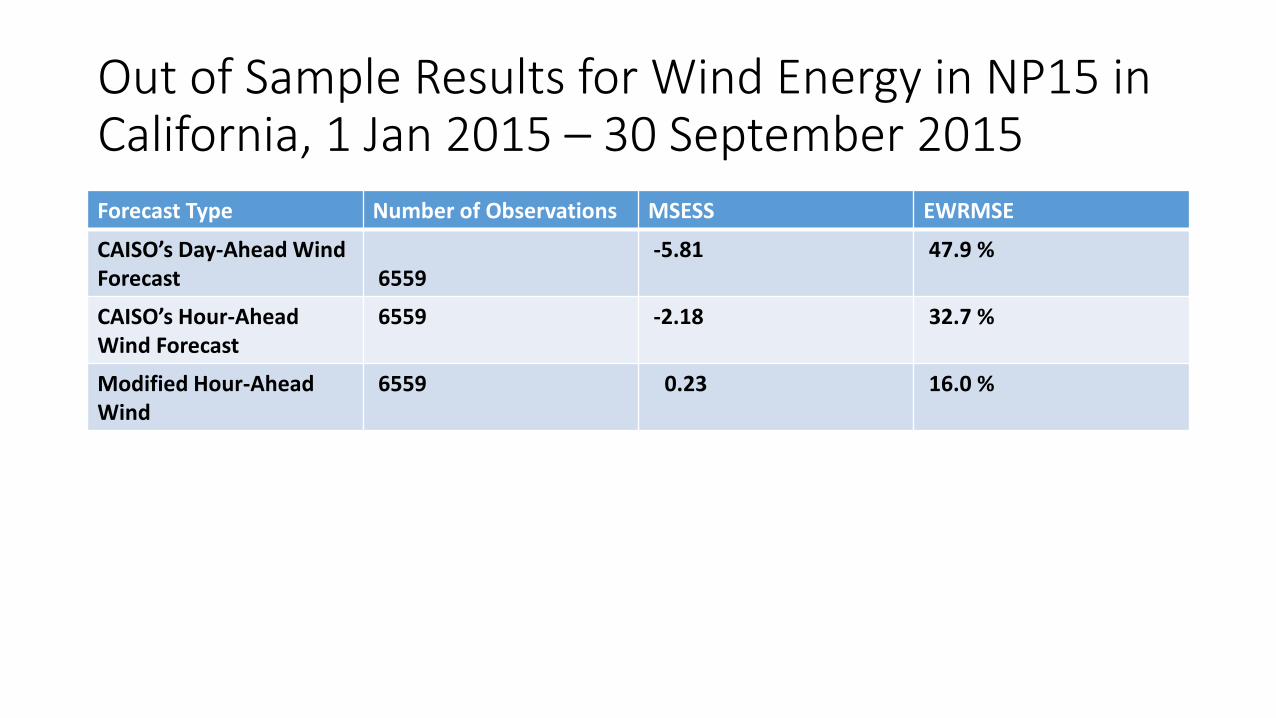
Out of Sample Results for Wind Energy in NP15 in California, 1 Jan 2015 – 30 September 2015
Forecast Type Number of Observations MSESS EWRMSE
CAISO’s Day-Ahead Wind Forecast 6559
-5.81 47.9 %
CAISO’s Hour-Ahead Wind Forecast
6559 -2.18 32.7 %
Modified Hour-AheadWind
6559 0.23 16.0 %

Out of Sample Results for Wind Energy in Great Britain, 1 Jan 2014 – 30 June 2014Forecast Type Number of Observations MSESS EWRMSE
Day-Ahead Wind Forecast 8,571 -35.05 31.9 %
Forecast equal to the levels of generation declared by operators one hour prior to real-time
8,571 -19.71 24.2 %
Modified Forecast: available to system operator 30 min prior to real-time
8,571 -1.95 9.1 %
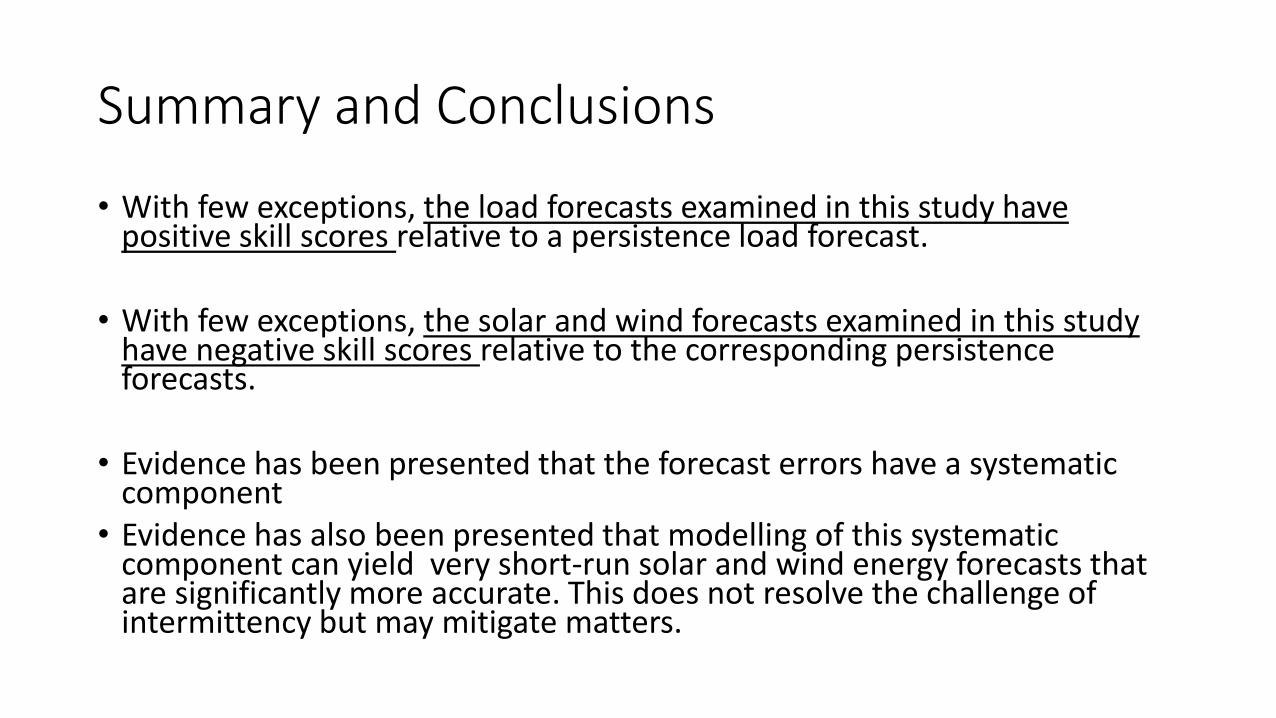
Summary and Conclusions
• With few exceptions, the load forecasts examined in this study have positive skill scores relative to a persistence load forecast.
• With few exceptions, the solar and wind forecasts examined in this study have negative skill scores relative to the corresponding persistence forecasts.
• Evidence has been presented that the forecast errors have a systematic component
• Evidence has also been presented that modelling of this systematic component can yield very short-run solar and wind energy forecasts that are significantly more accurate. This does not resolve the challenge of intermittency but may mitigate matters.

ReferencesGodfrey Boyle, 2010. Renewable energy technologies for electricity generation, in Harnessing Renewable Energy in Electric Power Systems,Boaz Moselle, Jorge Padilla, and Richard Schmalenese (eds.), RFF Press, Washington, DC, 2010, at 7-29.
California Independent System Operator, ISO New England, Midwest Independent Transmission System Operator, New York Independent System Operator , PJM Interconnection, and Southwest Power Pool, 2010. 2010 ISO/RTO Metrics Report. At http://www.isorto.org/atf/cf/%7B5B4E85C6-7EAC-40A0-8DC3-003829518EBD%7D/2010%20ISO-RTO%20Metrics%20Report.pdf <last accessed 15 feb 2012>
Ümit Cali, Bernhard Lange, Rene Jursa, Kai Biermann, 2006. Short-term prediction of distributed generation – Recent advances and future challenges, Elftes Kasseler Symposium Energie-Systemtechnik. At http://www.iset.uni-kassel.de/public/kss2006/KSES_2006.pdf<last accessed 15 feb 2012>
Mark A. Delucchi and Mark Z. Jacobson, 2011. Providing all global energy with wind, water, and solar power, Part II: Reliability, system and transmission costs, and policies. Energy Policy, 39, at 1170-1190.
European Wind Energy Association, 2007. Debunking the Myths. At http://www.ewea.org/fileadmin/ewea_documents/documents/publications/wind_benefits/Windpower_is_unreliable.pdf <last accessed 15 feb2012>
Kevin Forbes, Marco Stampini, and Ernest M. Zampelli, 2012a. Are Policies to Encourage Wind Energy Predicated on a Misleading Statistic?, The Electricity Journal, Volume 25, Issue 3, pp. 42-54
Kevin Forbes, Marco Stampini, and Ernest M. Zampelli, 2012b. Do Policies to Encourage Wind Energy Inadvertently Pose Challenges to Electric Power Reliability? Evidence from the 50Hertz Control Area in Germany, The Electricity Journal, November 2012, Volume 25, Issue 9, pp. 37-42
GE Energy, 2010. Western Wind and Solar Integration Study, NREL/SR-550-47434, National Renewable Energy Laboratory, Golden, Colorado, May. At http://www.nrel.gov/wind/systemsintegration/pdfs/2010/wwsis_final_report.pdf <last accessed 15 feb 2012>
Gregor Giebel, Richard Brownsword, George Kariniotakis, Michael Denhard, and Caroline Draxl, 2011. The State-Of-The-Art in Short-Term Prediction of Wind Power A Literature Overview, 2nd Edition. Project report for the Anemos.plus and SafeWind projects. 109 pp. Risø, Roskilde, Denmark. Available at http://130.226.56.153/zephyr/publ/GGiebelEtAl-StateOfTheArtInShortTermPrediction_ANEMOSplus_2011.pdf <last accessed 15 feb 2012>
Hannale Holttinen, Peter Meibom, Antje Orths, Frans van Hulle, Bernhard Lange, Mark O’Malley, Jan Pierik, Bart Ummels, John Olav Tande,Ana Estanqueiro, Manuel Matos, Emilio Gomez, Lennart Söder, Goran Strbac, Anser Shakoor, Joao Ricardo, J. Charles Smith, Michael Milligan, and Erik Ela, 2009. IEA WIND Task 25: Design and operation of power systems with large amounts of wind power. At http://www.vtt.fi/inf/pdf/tiedotteet/2009/T2493.pdf <last accessed 15 feb 2012>
References (Continued)
Hannale Holttinen, Pirkko Saarikivi, Sami Repo, Jussi Ikäheimo, Goran Koreneff, 2006. Prediction Errors and Balancing Costs for Wind Power Production in Finland. Global Wind Power Conference, Adelaide
Intergovernmental Panel on Climate Change, 2012, Renewable Energy Sources and Climate Change Mitigation Special Report of the Intergovernmental Panel on Climate Change. At http://srren.ipcc-wg3.de/report/IPCC_SRREN_Full_Report.pdf
George Kariniotakis, 2006. State of the art in wind power forecasting, 2nd International Conference on Integration of Renewable Energies and Distributed Energy Resources, Napa, California/USA, 4-8 December.
Mattias Lange and Ulrich Focken, 2005. State-of-the-Art in Wind Power Prediction in Germany and International Developments. Prediction of Wind Power and Reducing the Uncertainty for Grid Operators, Second Workshop of International Feed-In Cooperation, Berlin (DE) http://www.energymeteo.de/media/fic_eeg_article.pdf <last accessed 15 feb 2012>
Bernhard Lange, Kurt Rohrig, Bernhard Ernst, Florian Schlögl, Umit Cali, Rene Jursa, and Javad Moradi, 2006. Wind power prediction in Germany – Recent advances and future challenges. European Wind Energy Conference and Exhibition, Athens (GR).
Bernhard Lange, Kurt Rohrig, Florian Schlögl, Umit Cali, and Rene Jursa,2006. Wind Power Forecasting. in: Boyle, G.(Ed.), Renewable Electricity and the Grid. Earthscan, London, England, at 95-120.
Bernhard Lange, Arne Wessel, Jan Dobschinski, and Kurt Rohrig, 2009. Role of Wind Power Forecasts in Grid Integration KasselerSymposium Energie-Systemtechnik, at 118-130 http://www.iset.uni-kassel.de/public/kss2009/2009_KSES_Tagungsband.pdf <last accessed 15 feb 2012>
Bernhard Lange, Kurt Rohrig, Bernhard Ernst, Florian Schlögl, Umit Cali, Rene Jursa, and Javad Moradi, 2006. Wind power prediction in Germany – Recent advances and future challenges, Zeitschrift für Energiewirtschaft, vol. 30, no 2, at115-120. At http://www.iset.uni-kassel.de/abt/FB-I/publication/Lange-et-al_2006_EWEC_paper.pdf <last accessed 15 feb 2012>

References (Continued)
Bernhard Lange, Kurt Rohrig, Florian Schlögl, Umit Cali,and Rene Jursa, 2007. Wind Power Forecasting, in Renewable Electricity and the Grid, Godfrey Boyle, Ed. Sterling,VA: Earthscan, London, at 95-120.
David Milborrow, 2007. Wind Power on the Grid, in Renewable Electricity and the Grid, Godfrey Boyle, Ed. Sterling,VA: Earthscan, London, at 31-54
Michael Milligan,Kevin Porter, Edgar DeMeo, Paul Denholm, Hannele Holttinen, Brendan Kirby, Nicholas Miller, Andrew Mills, Mark O’Malley, Matthew Schuerger, and Lennart Soder , 2009. Wind Power Myths Debunked, IEEE Power and Energy, November/December vol 7 no 6, at 89-99.
National Grid, 2009. Operating the Electricity Transmission Networks in 2020: Initial Consultation. At http://www.nationalgrid.com/NR/rdonlyres/32879A26-D6F2-4D82-9441-40FB2B0E2E0C/39517/Operatingin2020Consulation1.pdf <last accessed 15 feb 2012>
North American Electric Reliability Corporation, 2009b. Accommodating High Levels of Variable Generation, April. At http://www.nerc.com/files/IVGTF_Report_041609.pdf <last accessed 15 feb 2012>
NERC, 2010. IVGTF Task 2.1 Report: Variable Generation Power Forecasting for Operations. At http://www.nerc.com/files/Varialbe%20Generationn%20Power%20Forecasting%20for%20Operations.pdf <last accessed 15 feb 2012>
Jennifer Rodgers and Kevin Porter, 2009. Central Wind Power Forecasting Programs in North America by Regional Transmission Organizations and Electric Utilities, NREL/SR-550-46763. Available at http://www.nrel.gov/docs/fy10osti/46763.pdf <last accessed 15 feb 2012>

References (Continued)
National Grid, 2009. Operating the Electricity Transmission Networks in 2020: Initial Consultation. At http://www.nationalgrid.com/NR/rdonlyres/32879A26-D6F2-4D82-9441-40FB2B0E2E0C/39517/Operatingin2020Consulation1.pdf <last accessed 15 feb 2012>
North American Electric Reliability Corporation, 2009b. Accommodating High Levels of Variable Generation, April. At http://www.nerc.com/files/IVGTF_Report_041609.pdf <last accessed 15 feb 2012>
NERC, 2010. IVGTF Task 2.1 Report: Variable Generation Power Forecasting for Operations. At http://www.nerc.com/files/Varialbe%20Generationn%20Power%20Forecasting%20for%20Operations.pdf <last accessed 15 feb 2012>
Jennifer Rodgers and Kevin Porter, 2009. Central Wind Power Forecasting Programs in North America by Regional Transmission Organizations and Electric Utilities.
Royal Academy of Engineering, 2014, Wind Energy : Implications of Large-Scale Deployment on the GB Electricity System http://www.raeng.org.uk/publications/reports/wind-energy-implications-of-large-scale-deployment