forage quality - sustainicum...forage quality • forage quality can be defined as the relative...
TRANSCRIPT

Forage Quality
Part 1

Forage Quality
• Forage quality can be defined as the relative performance of animals when fed herbage ad libitum, i.e., their consumption when fed excess forage.
• Quality of forage is a function of nutrient concentration of the forage, its intake or rate of consumption, digestibility of the forage consumed, and partitioning of metabolized products within the animal

Nutrient Requirements of Livestock
NRCNational Research Council
Nutrient Requirements of Domestic Animals

300 0.5 7.8 9.6 54.0 0.31 1.0 8.4 11.4 58.5 0.45 1.5 8.7 13.2 63.0 0.58
600 0.5 13.2 8.2 54.0 0.23 1.0 14.1 9.0 58.5 0.28 1.5 14.7 9.8 63.0 0.35
800 0.5 16.4 7.7 54.0 0.22 1.0 17.5 8.3 58.5 0.24 1.5 18.2 8.8 63.0 0.28
Nutrient Requirements of Livestock
Weight Daily Gain DM Intake Protein TDN Ca(lb) (lb) (%) (%) (%) (%)
Medium-frame steer calves (partial example information from resource)

• 36% NDF (cell wall) is ideal for a forage• Greater than 36% increasing limits intake due to Rumen
Fill• Less than 36% results in insufficient fiber for rumen
scratch factor and proper rumen function• A hay with 77% NDF is not good and indicates a large
amount of cell wall.• NDF is used as an indicator of Intake• A legume can pass through an animal more quickly than a
grass, even at the same NDF content.
Forage QualityA few forage Quality facts:

Forage Quality
• Forage quality varies among plant species and plant parts and is influenced by herbage age and maturity, soil fertility, and the environment in which forages are grown.

Forage Quality
• Forage cell walls provide fiber to livestock, which is required for normal rumen function.
• Fiber stimulates the cardial region of the reticulum to induce regurgitaion, rumination, and ruminal motility.

Forage Quality
• Non-Ruminant – single stomach– Horses
• Ruminant – multi-compartment stomach– Cattle, sheep, goats


Rumination
• Rumination consists of regurgitation of a portion, or bolus, of previously consumed feed, swallowing excess liquid regurgitated with the bolus, chewing the bolus for a few seconds to a minute, and swallowing the bolus again.
• Rumination results in the mechanical fragmentation creating sites of attack for rumen microorganisms.

Rumen
• Rumen – largest of the stomach compartments (150 L).
• Functions as a fermentation vat with bacteria (primary), protozoa, and fungi active in the fermentation.
• Rumen fluid pH is normally 6.5-6.8.

Rumen
• Many species of microbes have been identified in the rumen.– Often a species ferments a single substrate such as cellulose or
starch. This affects the type of microbial population and rates of digestion.
• If the diet is high in starch, starch digestion will occur rapidly, but digestion of cellulose will occur even more slowly than it would with a diet high in structural carbohydrates.
Reticulum
• The processes of mechanical and microbial degradation reduce the size of the forage particles gradually until they settle to the bottom of the rumen and are transferred by ruminal contractions to the reticulum.

Reticulum
• Sometimes referred to as the “hardware stomach”.• Controls the movement of feed particles.
– Forms boli prior to regurgitation and rumination.
– Opening between reticulum and omasum controls the size of forage particles passing through to the omasum.
– Retained particles pass back and forth between the reticulum and the rumen and may be ruminated.

Omasum
• Sometimes referred to as “manyplies”, due to the internal folds.– This creates a high internal surface area compared to its volume.
• Dehydrates the digesta passing through from the reticulum to the abomasum.

Abomasum
• Sometimes referred to as the “true stomach” because it secretes hydrochloric acid and the protein-digesting enzyme pepsin (digests protein with no effect on structural carbohydrates).
• Only stomach compartment in domestic ruminants to synthesize a digestive enzyme.


Intake
• Gut fill (distension) can limit intake before animals consume quantities of feed large enough to meet energy demands.
• Chemostatic - The energy feedback that occurs when diets with large amounts of soluble carbohydrates (starch, and sugar) are fed such that dietary digestible energy concentrations may limit dry matter intake.
Intake is controlled by:
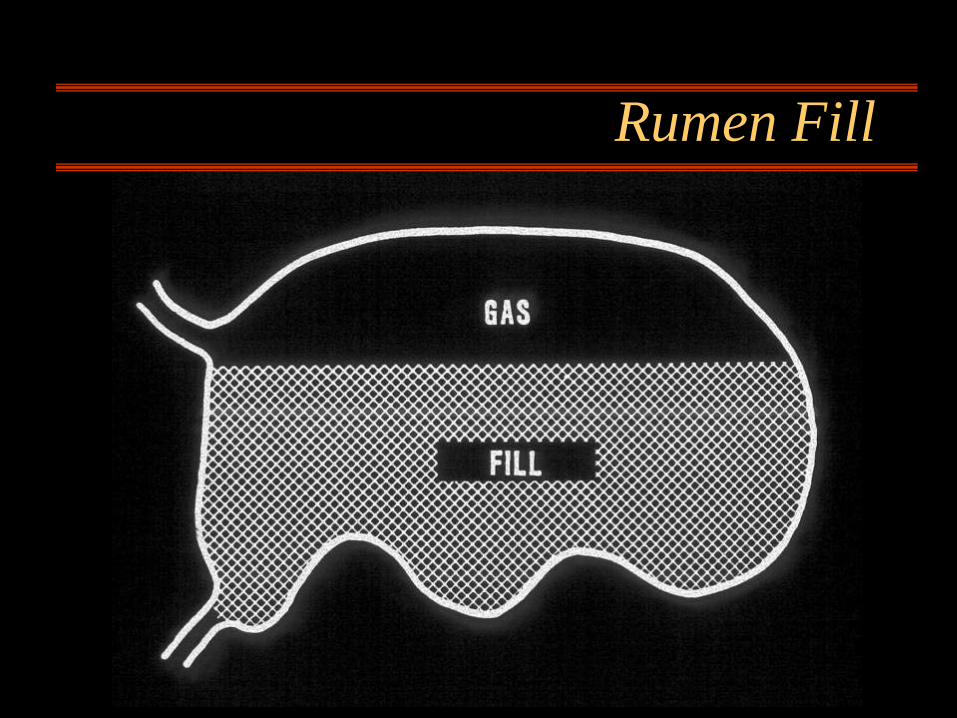
Rumen Fill

Chemostatic

Level and Rate of Intake
• Level:– Refers to the amount of forage or feed consumed.
• kg, lbs., % of Body Weight (2.5-3%). Normally a mature beef cow can consume 25-30 lb of dry matter/day of forage.
• Cow 18 lbs for maintenance (1.6%)28 lbs when nursing (2.5%)
% BodyWeightIntake = Consumption

Herbage Intake

Level and Rate of Intake
– Rate:Amount of feed consumed per unit of Time.
• Rate is influenced by : Rate of Passage• In ruminants, rate of passage is limited by rate of
particle size reduction and rate of flow from the rumen.
• Hence, non-ruminant herbivores typically have a higher rate of passage and reduced digestion of cell walls than do ruminants.
Intake
• Intake is the product of the following variables:– Bite size– Bite rate– Grazing time
• Energy in forages is usually NOT the limiting factor to intake.

Palatability vs Intake
• Intake and palatability should not be considered as being the same.
– Palatability= “Choice” between two or more feeds.
– Intake= Units of forage consumed per:• Unit of time• Per animal• Per unit of metabolic weight

• Rumen fill – Gut distension
• Bite Size– Canopy height
• Affects animal bite size– Canopy density
• Ability of animal to reach unrestricted into canopy and select quality components
• Selective grazing– If inadequate choice animal can take too long resulting
in limited intake
Forage Quality and Animal Intake
Factors affecting animal intake

• Selective grazing– Ability of animal to selectively graze specific
components of forage that are of high quality.– If animal does not have adequate forage then the animal
could take too much time being selective resulting in reduced intake.
Forage Quality and Animal Intake

Forage Quality and Animal Intake
Intake = Bite Size X Bite Rate X Grazing Time
•Bite size on cool season grass in general is affected byplant height
•Bite size on warm season grass in general is affected bycanopy density and also on cool season if plant is flowering

Forage Quality and Animal Intake
Southern Spotted Bur clover presents allLeaf to animal with veryLittle stem and is of Extremely high quality.
However, must be careful of bloat.

Forage Quality and Animal Intake
Selectivity of leaf from alfalfa is veryhigh quality, but requires significanttime on the part of the animal to select out this high quality component.

Caucasian bluestem later inseason puts up stem and canopy density and animal selectivity become moreimportant to intake.
Forage Quality and Animal Intake

Caucasian bluestemwhich has been selectively grazedby removing theleaf material and leaving the stem.Also, by grazingwill encouragemore vegetativegrowth.
Forage Quality and Animal Intake

• Canopy Density– Very important in warm season grasses such as
sorghums and can result in limitations to intake due to animal reaching in for leaf and avoiding the stem. Canopy height is not a restriction on intake in this case.
Forage Quality and Animal Intake

Forage Quality and Animal Intake
Selective grazingis the ability toselect high qualitycomponents suchas leaves, howevercanopy density canlimit intake.

Forage Quality and Animal IntakeAt certain timesof year Orchardgrass(cool season) puts up seed heads and canopy density can become a problem.

Forage Quality and Animal Intake
Tall fescue after flowering like Orchardgrass willthen become leafyand vegetative remaining so the restof the year.
At this point canopyheight begins to takeover.

• Canopy Height– Becomes a factor when plant height restricts bite size of
animal, thereby limiting intake.
Forage Quality and Animal Intake

Forage Quality and Animal Intake
Bluegrass/Whiteclover mixture,forage height to short for adequate bitesize, results in limited intake.

Forage Quality and Animal Intake
Caucasian bluestemforage height sufficient for goodanimal bite size andno longer affectsintake.

Forage Quality and Animal Intake
Bermudagrassis a warm seasongrass with a lowergrowth habit.
Adequate heightexists for goodbite size, but couldquickly becomelimiting.

Factors Influencing Palatability
• The “Senses”– Taste, touch, smell, sight
• Species of animal (sheep vs cattle)– Sheep and goats have narrower muzzles and split upper lip that
permits greater selectivity.
• Previous experience of the animal– An animal that has been on one type of forage is likely to prefer
something different if available.
• Individual variation among animals• Physiological condition
– How hungry, previous nutrition
Animal factors:

Factors Influencing Palatability
• Plant species (grass vs legume)• Plant morphology (pubescent, spines)• Chemical composition ( alkaloids, tannins)• Succulence and maturity (mature less palatable)• Leaf:Stem ratio important (leafy plants more palatable)• Amount of forage available for grazing (less selective
when feed supply is low)• Form of processed forage (silage, chopped hay, pellets,
cubes etc.)
Plant factors:

Factors affecting Palatability
• Plant diseases• Insect residues• Dung and urine contamination• Soil fertilty
– N may increase succulence– K may increase sugar content
• Climatic variations– High temperature hastens maturity– High temperature may reduce sugar content
Other Factors:

Efficiency of Utilization of Specific Nutrients
• The products of fermentation:
– Gasses• Methane• Heat• Carbon dioxide
– Volatile Fatty Acids (VFA) (short chain type)• Acetic• Propionic• Butyric• Valeric

How Nutrients are Utilized by Animal
• Maintenance of body weight
• Performance above maintenance– Weight gain– Milk production– Wool production– Calf production

Rate and Extent of Digestion
• Rate: How rapidly the feed is digested. Low quality forage requires more time to digest than high quality forage.
• Extent: How much of the feed is digested.
• Generally, high quality forage has the highest rate and highest amount of digestibility, but not always.

Animal Performance
• Average daily gain (ADG) of cattle on pasture.• Weaning weight of calves where cows are on a forage diet.• Milk production of lactating cows• Wool and lamb production of sheep
Animal PerformanceIndicators

Many times are poor predictors of animal performance under grazing.
WHY?
Chemical and Laboratory Tests vs Animal Performance

• Many times what we find in lab is not a good indication of how the actual animal will perform in the field.– Remember steer on endophyte-infected tall fescue, lab quality
showed forage to be of good quality, but steer did not perform well due to the presence of the endophyte.
– What the animal grazes and what we sample is difficult to simulate and may be totally unrelated in quality.
Animal Performance

Animal Performance
• Behavior has an impact on the quantity and nutritive value of their diet.– Selection of landscape to graze– Plant community within landscape selected– Specific portion of the plant community grazed– Actual bite within plant canopy


Animal Performance
“Animal performance is the ultimate test of Forage Quality”.

Estimates of Forage Quality
• Accurate estimates of forage quality are essential.
• However, most of the available assays of nutritive value and voluntary intake are expensive, difficult to obtain, or of limited use in predicting the biological response of the animal.

• Animal feeding and grazing experiments are:– Expensive
• Can not afford to test all forages and management possibilities under grazing.
– Require considerable time to complete, especially in grazing trials.
How do we measure Forage Quality?

• Forage Analysis:– Is used in the laboratory as a tool to evaluate many forage samples
as a measure of their forage quality as related to plant composition and dry matter digestibility.
How do we measure Forage Quality?

Laboratory Methods of Evaluating Forage Quality
• Chemical Methods• Physical Methods• IN VITRO• IN SITU• IN VIVO

Chemical Methods
• Analyze for crude protein, minerals, carbohydrates, fiber components, chemical compounds (such as tannin, alkolids, etc.)

Physical Methods
• Electrical energy required to grind a given amount of forage sample
• Histological techniques to study the morphological and structural configuration of plant tissue
• Leaf-Stem ratio of plants

IN VITRO Method
• IN VITRO means “in glass, in test tubes, outside the organism”.
• Attempts to simulate the digestion (fermentation) process that occurs in situ (i.e. in the animal) but the process is conducted in laboratory.
• Results are expressed as in vitro dry matter digestibility or disappearance (IVDMD).

IN VITRO Method
• There are several in vitro methods but one is used world wide:– Tilley-Terry Two Stage Rumen Fermentation Method.
• First stage is 48 hours fermentation with rumen fluid.• Second stage is 24 or 48 hours in duration and is the
solubilization of the dry matter residue (from stage 1) by acid pepsin or neutral detergent.
• In Vitro Dry Matter Digestibility (IVDMD) results are Highly correlated with results from in situ digestion trials.

IN SITU Method
• IN SITU means “in position” such as in the animal.
• This method utilizes forage digested within a container which is suspended in the rumen of an animal.
• Attempts to simulate more of what happens in the animal

IN SITU Method
• Must have a fistulated animal, but this technique requires very little laboratory equipment.
• Technique measures the digestibility of forage dry matter (dry matter disappearance).

IN SITU Method

IN SITU Method

IN SITU Method
• Most commonly used Techniques:– Nylon Bag– Dacron Bag
• Both of these bags have pore sizes in the fabric small enough to let rumen microorganisms enter but not allow any of the ground forage to escape.

• Previous tests have been estimates
• Best answer comes from animal evaluation(IN VIVO)
IN VIVO Method
IN VIVO is through the living organism.
This method allows complete digestion of material throughthe animal with as little intrusive techniques to the animal aspossible.

IN VIVO Method

IN VIVO Method

IN VIVO Method

Forage Quality
Part 2

Forage QualityEnergy
• Nutrients in plants that provide most of the energy for animals are:– Carbohydrates (provide up to 80 % of the energy from herbage)– Proteins– Lipids (less than 5 %)

Forage Quality
• The most common deficient nutrients of forages are:
– Digestible Energy– Protein– Phosphorus– NaCl (salt)– Vitamin A

Forage Quality
• Of these the most common deficiency of forages is
“Digestible Energy”

Energy ValueExpression
• Digestible dry matter (DDM) = DM Intake – DM Feces
• Total Digestible Nutrients (TDN) = %CP+CF+NFE+Fat
• Digestible Energy (DE) = Energy Intake - Energy in feces
• Metabolizable Energy (ME) = Energy Intake – Energy in feces/urine – Energy lost as methane from rumen.
DM Intake
Energy Intake
** All are very closely related **

Forage QualityEnergy
• The main division of plant DM into energy-yielding components for animals is between cell walls and cell contents.
• Plant cell contents are almost completely available to livestock.
• Availability of plant cell walls varies greatly depending on composition and structure of herbage.
• Available Energy is inversely related to cell wall, or NDF concentration in herbage.

Forage Quality

Forage QualityEnergy
• Digestibility, expressed as DM, organic matter, energy, or total digestible nutrients (TDN), is the most commonly used term of energy availability.

Forage QualityDigestibility
• Digestibility is equated as the amount of feed ingested minus matter lost in the feces.
• Feeds and forages with low digestibility will have low energy value. (What component is most limiting in forages?)
• Digestibility decreases with increasing plant maturity.

Forage QualityEnergy
• Stems have a greater concentration of cell walls than leaves, thus, stems are generally lower in digestibility than leaves.
• Stem digestibility declines more rapidly with plant maturity than do leaves.


Forage QualityDigestibility
• Chemical constituents sometimes used to estimate digestibility are:– ADF– Lignin– Cellulose
• AFGC has proposed for hay grading that ADF be used to estimate digestibility and NDF be used to estimate intake potential of a hay.

Forage QualityNutritive Evaluation
• Nutritive Value – refers to aspects of forage composition affecting nutrition independent of voluntary intake.
• Constituents of forage can be divided into two main categories:
– Those that make up the structural components of the cell wall.– Those existing in the cell contents.


Nutritive Constituents of Forage
Cellular contents
Soluble Carbohydrates 100 % Intake
Starch >90% Intake and Rate of Passage
Organic acids 100% Intake and toxicity
Protein >90% Fermentation and loss as ammonia
Pectin >98% Intake and rate of passage
Triglycerides and Glycolipids >90% Intake and rate of passage
Plant cell wall
Cellulose Variable Lignification, cutinization, and silicification
Hemicellulose Variable Lignification, cutinization, and silicification
Lignin, cutin, and silica Indigestible Not degradable
Tannins and polyphenols Possibly limited
Generally not degraded
Component Availability Factors limiting utilization

Nutritive Evaluation
• Chemical constituents of forages are not distributed uniformly among different plant organs and tissues, and wide differences exist among forages in both composition and physical structure. (C3 vs C4)
• Several schemes of analysis have been developed to describe and predict nutritive value and intake.

Forage QualityNutritive Evaluation
• Proximate Analysis– Used since the mid-1800s– Does not always adequately characterize the nutritive value of
forage carbohydrates.
• Van Soest Analysis– Developed by Peter J. Van Soest as an alternative to the proximate
analysis while working at the USDA laboratories in Beltsville, Maryland, during the 1960s.
– This method recognizes the distinction between cell walls and cell contents.
Two major systems for the analysis of forage

Proximate Analysis
• Ash is the residue remaining after burning at 6000C• Crude protein is determined by analyzing for nitrogen by
Kjeldahl x 6.25.• Ether extract is the total of all compounds that can be
extracted with hot diethyl ether.• Crude fiber is the organic matter insoluble in weak acid
and weak alkali.• Nitrogen-free extract is calculated by subtracting from 100
the sum of the other four components. • Water can be determined by drying at 1050C

Van Soest AnalysisNDF
• Neutral detergent fiber (NDF) extract with a neutral detergent solution:– Solubles – cell contents– Insolubles – residue left over or NDF
• NDF is a good estimation of total structural or cell wall contents (cellulose, hemicellulose, and lignin).
• NDF varies from roughly 10% in corn grain (90% digestible) to 80% in straws and tropical grassess (20-50% digestibility).

Van Soest AnalysisNDF
• Neutral detergent fiber (NDF) is most important because it estimates that fraction of forage that must be degraded before it can be metabolized by the animal.
• It is a better measure of forage “fiber” than crude fiber.
• Digestibility of energy is often related to the digestibility of NDF in many forages, especially grasses.
• NDF is best related to feed intake because it represents the total insoluble fiber matrix.

Van Soest AnalysisADF
• Acid detergent fiber (ADF) extract with a detergent solution acidified with sulfuric acid:– Results in an insoluble residue like NDF, but does not include all cell wall
constituents because Hemicellulose is soluble in the acid detergent solution.
• ADF varies from roughly 3% in corn to 40% in mature forages and 50% in straws.
• ADF has been correlated with digestibility, but the intended purpose is as a preparative residue for determination of cellulose, lignin, maillard products, silica, acid insoluble ash and acid detergent insoluble N (ADIN).

Van Soest Analysis
• This method may also be used to predict digestibility by means of a Summative Equation.– Estimation of materials soluble in NDF (100-NDF), assumed to be
98% digestible. Plus, Estimation of the fraction of NDF that will be digested (based on emperical regression relationship between NDF digestibility and lignin to ADF ratio).
• Summative Equation is not as accurate and precise as some bioassays, but eliminates the need to maintain animals.


Forage AnalysisMoisture
• Forage moisture determination is important in all types of forage analysis.
– Drying method and moisture concentration affect nutrient availability and composition.
– All other analyses are expressed on a Dry Matter (DM) basis.

Forage AnalysisMoisture
• Microwave oven• Koster tester• Electronic moisture meters for silage• Delmhorst moisture meter for hay• Laboratory drying at 1050C in conventional forced air oven• NIRS – Near Infrared Spectrophotometry

Forage QualityComponents
• Crude Protein (CP)• Neutral detergent fiber (NDF)• Acid detergent fiber (ADF)• Acid detergent lignin (ADL)• Cellulose• Hemicellulose• Minerals• Digestibility (in vivo and in vitro)

Forage QualityProtein
• Nitrogen in forage can be divided into true protein and non-protein N (NPN).
• True Protein comprises 60-80% of the herbage N
• Most of the NPN is in nucleic acids, free amino acids, amides, and nitrate.
• More than 90% of N in most cool-season forages is in cell solubles and is readily digestible.

Forage QualityProtein
• Protein requirements for ruminants usually are expressed as crude protein (CP), which is the sum of true protein and NPN expressed as CP equivalents (N X 6.25).
• Requirements range from 70 g CP kg-1 DM for mature beef cows to 190 g CP kg-1 DM for high-producing, lactating Dairy cows. (NRC 1984,1989)

Forage QualityProtein
• Crude Protein concentration of grass herbage is strongly influenced by available soil N level.
• Altering CP concentration by N fertilization represents the most important effect of fertilization on forage quality.

Forage QualityCrude Protein
• Apparent digestibility of crude protein varies widely among forages.
• Grasses 35-80 %• Alfalfa 52-80%
• Crude protein includes both soluble and insoluble non-protein nitrogen (NPN).
• Heavy applications of nitrogen fertilizer or manure tend toincrease NPN levels in grasses.

Forage QualityNDF
• Neutral Detergent Fiber (NDF) is a measure of the plants total cell wall.
• 100-NDF=Cell Content• Cell solubles include:
– Total non-structural carbohydrates– Lipids– Organic acids– Protein– Pectin
• NDF increases with increasing plant maturity.

Forage QualityADF
• Acid Detergent Fiber (ADF) is a measure of the cellulose and lignin.
• Lignin reduces cell wall digestibility.
• NDF-ADF=Hemicellulose
• ADF increases with increasing plant maturity.

Forage QualityCellulose
• Cellulose is the major skeletal material in the cell walls of plants.
• Cellulose increases with increasing plant maturity.

Forage QualityHemicellulose
• Hemicellulose is found in cell walls
• Generally hemicellulose has similar characteristics as cellulose.
• Hemicellulose increases with plant maturity.

Forage QualityADL
• Acid Detergent Lignin (ADL) is an estimate of the Lignin content of the forage.
• This fraction is very undigestible.
• ADL increases with plant maturity.


Forage QualityNDF/ADF Summary
• NDF is a measure of plants total structural cell wall (cellulose, lignin, hemicellulose). NDF=Residue remaining (Structural Cell wall).
• 100-NDF=Cell content
• ADF is a measure of cell wall, but Hemicellulose is soluble in acid.
• ADF=Residue remaining (lignin, cellulose).• NDF-ADF=Hemicellulose.

Forage QualityLignin/Cellulose Summary
• Treat ADF residue (lignin, cellulose) with either 72% Sulfuric acid or Permanganate.
• Allow permanganate to stand 90 minutes and filter off solution. Dry at 100-105 C overnight = Permanganate Residue
• Lignin = ADF residue – Permanganate Residue.
• Cellulose content = loss in weight from Permanganate residue after Ashing at 475 C for 3 hours in muffle furnace.

Forage QualityGrass vs Legume
• Grasses and legumes may have about the same relative digestibility.
• Grass compared to legumes, generally contain less lignin and much more hemicellulose.– Grasses with a greater hemicellulose results in a greater cell wall
content (NDF).– Higher NDF can result in lower intake values for grass than for a
legume with equal digestibility.– Legumes which have the same digestibility as a grass may still
give greater animal performance because of higher intake of the legumes by the animal.

Forage Analysis and Why?
• Reliable “estimates” of forage quality are necessary to determine whether, or to what degree the nutrient requirements and intake potential of specific animals can be supplied by a particular forage.

Forage QualityTesting
Part 3

Forage QualityForage Testing
• Forage testing is not just a research tool, but is extremely valuable to farmers, ranchers and cattle feeders.
– Can determine whether a particular forage is deficient in:• Crude protein• Minerals• Energy
– Can determine whether a particular forage has adequate or excessive amounts of some nutrients .

Forage QualityTesting
• Farmers request analysis of forages primarily:– Marketing of forages– Assessment of forage quality for ration formulations
• Therefore, accurate predictions of forage quality is needed.

Forage Quality Testing
• Formulating nutritionally balanced rations.• Developing and allocating forage inventories.• Evaluating forage management practices (growing,
harvesting and storage).• Marketing and pricing forages.
Reasons for Testing

Forage QualityTests and Interpretation
• Dry Matter (DM)• Crude Protein (CP)• Acid Detergent Fiber (ADF)• Neutral Detergent Fiber (NDF)• Calcium (Ca) and Phosphorus (P)• Energy values (TDN or Net energy)• Relative Feed Values (RFV)• Macro and Micro Mineral analysis• Available protein analysis on heat damaged forage
Recommended Tests for Determining Forage Quality

Forage Quality Tests and Interpretation
• Species– Compositional differences between species – Legumes are higher in CP but lower in NDF than grasses– Species with low NDF contents have higher potential intake and
are generally higher in quality than high NDF species.– Weed content may or may not change forage quality
• Maturity– As plants mature they increase in fiber and lignin content– Increasing fiber (ADF and NDF) reduces digestibility and intake
potential . – Lignin is essentially indigestible, therefore, increasing lignin
reduces digestibility. For each percent increase in lignin, digestible dry matter (DDM) decreases three to four percentage units.
Factors affecting forage quality

Forage Quality Tests and Interpretation
• Environment– Climatic conditions during growth and harvest
• Temperature– Forage plants at same maturity will be higher in fiber and CP
when growth occurs during high temperatures as compared to forages grown at cool or normal temperatures.
– Forages grown in hot climates will have lower digestibility than forages grown in cooler climates at identical CP contents.
• Light– Plants grown in bright sunlight generally have a higher
digestibility than plants grown in shade. Cloudy weather may increase CP content.
• Rainfall– Moisture stress reduces plant growth but generally increases
plant Leaf:Stem Ratios– Moisture stress results in higher digestibility (lower fiber) and
higher in anti-quality factors (alkaloids, nitrates and prussic acid) than plants grown normally.
Factors affecting forage quality (cont.)

Forage Quality Tests and Interpretation
• Insect and disease damage– Results in leaf loss which decrease CP and increase fiber content
of plant.
• Soil fertility– Fertilization of grasses with nitrogen (N) will increase CP content.
• Harvesting and storage– Leaf losses during harvesting result in CP losses and decreases in
DDM.– Rainfall on cut forage causes leaching of highly digestible
nutrients– Storage conditions allowing for molding and heating can result in
reduced nutrient content and animal acceptability.
Factors affecting forage quality (cont.)

Forage Quality Tests and Interpretation
• AS-fed, Wet or Fresh Weight Basis-– Nutrients expressed on these bases represent the nutrient content of
the feed as it is fed.– Nutrient values expressed on these bases are lower than when
expressed on a DM basis as the water dilutes out the nutrient content.
• Air Dry Basis-– Feeds are assumed to contain 10 percent moisture or 90% DM.
• Dry Matter (DM)-– Moisture free or 100 percent dry matter. All moisture has been
removed.
Analysis Presentation Basis

Forage Quality Tests and Interpretation
• Dry Matter conversion
Nutrient (DM Basis) = Nutrient (as fed or wet basis) x 100DM %

Forage Quality Tests and Interpretation
• DM is the percentage of forage that is not water.
DM% = 100 - % moisture

Forage Quality Tests and Interpretation
• Ration formulation– Animal intake is regulated more by DM intake than volume of feed
consumed.
• Comparison of forages
• Predictor or indicator of storage problems.– Forages ensiled too dry or hay baled too wet can heat, reducing
protein availability, and/or become moldy.
Importance of Dry Matter (DM)

Forage Quality Tests and Interpretation
• Crude Protein (CP)– Consists of true proteins and non-protein nitrogen (N X 6.25)
• Adjusted Crude Protein (ACP)– Adjusted CP is the amount of CP available to an animal for
utilization after being corrected for unavailable protein.
Crude Protein and Adjusted Crude Protein

Forage Quality Tests and Interpretation
• Fiber– Forage feeding values are negatively associated with fiber since
the less digestible portions of plants are contained in the fiber fraction.
– Fiber contents are used to calculate:• Energy content• Digestibility• Potential intake
• NDF and ADF analysis separates forages into two parts.– Cell contents (sugars, starches proteins non-protein nitrogen, fats
and other highly digestible compounds).– Cell wall (hemicellulose, lignin, cellulose)

Forage Quality Tests and Interpretation
• Neutral Detergent Fiber (NDF) – Total fiber content– Cellulose, hemicellulose, lignin, and heat-damaged protein– Closely related to feed intake and rumen fill in cows– Digestibility ranges from 20 to 80% depending on maturity– Cell contents are 100% digestible (100-NDF= cell contents)

Forage Quality Tests and Interpretation
• Acid Detergent Fiber (ADF)– Contains cellulose, lignin and heat-damaged protein– NDF - ADF = Hemicellulose
• Lignin– Measured by ADL or permanganate lignin procedure (PML).– Almost completely indigestible– As lignin increases in forages digestibility decreases

Forage Quality Tests and Interpretation

Forage Quality Tests and Interpretation

Forage Quality Tests and Interpretation
• Total mineral content of feedstuffs is called ash.• Forages normally contain 3-12% ash on a DM basis.• Organic matter is determined by 100-Ash.• Minerals can be divided into two groups for animals
– Macro – those required in large amounts• Ca, P, K, Mg, S, NaCl
– Micro – those required in small amounts• Fe, I, Co, Cu, Mn, Zn, Se
• Forages should be routinely tested for Ca, and P and tested once or twice per year for other macro and micro minerals.
Minerals

Forage Quality Tests and Interpretation

Forage Quality Tests and Interpretation
• Calculating Energy Values
– TDN – Total Digestible Nutrients
TDN is a measure of energy and is defined as:
TDN% = Digestible CP + Digestible CF + Digestible Nitrogen Free Extract + (Digestible Fat X 2.25)

Forage QualityRelative Feed Value
• An index that reflects relative differences in forage quality across a wide spectrum of forages would simplify hay pricing.
• Moore (1994) defines an index of forage quality as a single number that represents the combination of a forage’s potential for voluntary intake and nutritive value and allows for relative comparisons among forages differing in genotype, season of growth, and maturity.
• Relative feed value (RFV) is an index that is intended to achieve this objective.

Forage QualityRelative Feed Value
• The RFV index is based on predictions of intake from assays of forage NDF and digestibility from assays of forage ADF concentrations.
• Combines potential intake and digestibility into one number for a quick method of evaluating feeding value or quality.

Forage Quality Tests and Interpretation
• Digestible Dry matter (DDM)– ADF is highly related to the digestibility of a forage– Factors which increase ADF content and decrease
digestibility:• Increasing plant maturity• Weathering• Rain damage• Weeds
• Digestible Dry matter (DDM)
DDM% = 88.9 – (.779 X ADF%)

Forage Quality Tests and Interpretation
• Dry Matter Intake (DMI)– The amount of feed DM an animal will consume.
DMI (% of body weight)=
• Factors affecting DMI– Rate of passage
• NDF is most closely related to DMI.
Forage NDF (% of DM)120

Forage Quality Tests and Interpretation
• Relative Feed Value Index (RFV)
RFV = DDM x DMI
• Relative Feed Value Index does not include CP because CP is influenced by factors unrelated to those affecting RFV, but CP should be considered in pricing forages.
1.29

Forage Quality Tests and Interpretation
• ADF is not always negatively correlated with digestibility, thereby, not reflecting true forage quality for late-season cuttings.
• RFV assumes that NDF of grass and legume has similar intake potential, which may not be true.
Limitations of RFV

Forage Quality Tests and Interpretation
• Summary– Both visual appraisal and forage testing are needed to determine
Forage Quality.– Forages should be inspected for absence of mold and good green
color.– Recommended forage tests include:
• DM, CP, ADF, NDF, Ca and P.– Descriptions of forage quality should include RFV
Optimum animal performance at lowest feed costs will be achieved when forage quality is related to animal performance and rations are balanced using forage test results.

Instrumentation used in Forage Quality
Forage Quality Tests and Interpretation

Forage QualityTesting
• Near Infrared Reflectance Spectroscopy (NIRS) is a technique that can estimate major chemical constituents in forages rapidly and reproducibly.
• Main Advantages:– Speed– Ease of sample preparation– Performance of multiple analyses with one operation– Reduced cost– Selection of wavelengths and mathematical treatments for equation
calibration

NIR Technology
•NIR – Near Infrared Spectrophotometer
•Extensive use in food industry•Found useful in forages
•ADF•NDF•Crude Protein•DM•Carbohydrates

Forage Quality

Forage Quality

Forage Quality

Forage Quality

• Atypical uses– Predict live tissue vs dead– Leaf vs stem
NIR Technology

• Calibration set requires 60 to 100 samples but all must be unique and represent the population to be analyzed.
• May have 100 samples to scan but after running Center and Select may find only have 50 useful samples because redundant and outlier spectra are removed from the final calibration set.
NIR Technology

• Calibration is only as good as laboratory chemistry or other method of establishing your reference data.
NIR Technology
GARBAGE IN GARBAGE OUT!

• Only need to scan samples once.
• Use same spectra to predict any calibrations developed.
NIR Technology

• Different Modules available– Spinning sample cup
• Small area of detection and scanning– Sample transport
• Larger surface area to scan• Can run whole unground sample
NIR Technology

Forage Quality Testing
• Accuracy of NIRS methods depends on:
– Sampling errors– Accuracy of wet chemistry analyses used to calibrate the
instrument– Calibration samples that reflect the population being tested– Technician competency

Forage QualityTesting
• Atomic absorption• Emission spectroscopy• NIRS
Forage Mineral Concentrations

Mineral Analysis
• Flame AA
• Graphite furnace AA
• ICP-AES (Inductively Coupled Plasma Atomic Emission Spectrometry)
We will discuss three trace metal elemental analysis techniques:

• Flame AA– Initial instrument cost much lower– Simplicity of operation
• Graphite furnace– Greater sensitivity (lower detection limits)– Can analyze very small amounts of sample
• ICP-AES (main advantages over AA)– Multi element capability– Longer linear dynamic range– Fewer interferences– Elements such as I, P, and S and refractory compound forming
elements are detected with more sensitivity.
Mineral Analysis

• Chemical interferences are largely eliminated by the high temperature of the plasma (up to 10,000 K).
• The use of high resolution specs and advanced background correction techniques, coupled with flexibility to choose from many possible emission lines allows for interference free analysis of the majority of samples.
Mineral Analysis

• Simultaneous– Analyze all elements at same time– Rapid– Uses very small amounts of sample– Must decide up front what element will be analyzed
(slits set at factory)– If decide to add element, appropriate wavelength slit
must be added.
Mineral Analysis

• Sequential– Analyze elements sequentially– Faster than AA (AA run each element separately)– Greater flexibility (can use many wavelengths)– All analyzable elements available for analysis
Mineral Analysis

Mineral Analysis

Mineral Analysis

• Digestion tubes• Perchloric hood• Water purification• Pump windings• Chemicals• Standards• Pipetters• Equipment repairs
Mineral Analysis
Costs involved in running ICP for mineral analysis

• Must use extra care in keeping samples clean and free of contamination.– Use of acid water baths– Use of Ultra pure water supply
• Dangers in use of Perchloric acid and precautions
• Other methods of digestion or extractions available for use
Mineral Analysis

Forage QualityTesting
• Results if applied, result in:– More efficient livestock production– More economical livestock production
• Producers who regularly test their forages generally become better managers of the forages.

Forage QualityTesting
• Forages fed year-round should be tested throughout the year.
• In Texas forage testing may be obtained at:– Texas A&M University, College Station– Commercial Laboratories
• Proper sampling of forage is essential for reliable test results.