for the week ending june 23, the ocean freight rate for ... 06...the amendment requires containers...
TRANSCRIPT

A weekly publication of the Agricultural Marketing Service
www.ams.usda.gov/GTR
June 30, 2016
Contents
Article/
Calendar
Grain
Transportation
Indicators
Rail
Barge
Truck
Exports
Ocean
Brazil
Mexico
Grain Truck/Ocean
Rate Advisory
Data Links
Specialists
Subscription
Information
--------------
The next
release is July 7, 2016
Preferred citation: U.S. Dept. of Agriculture, Agricultural Marketing Service. Grain Transportation Report. June 30, 2016.
Web: http://dx.doi.org/10.9752/TS056.06-30-2016
Grain Transportation Report
WEEKLY HIGHLIGHTS
Expanded Panama Canal Opens and Celebrates Successful First Passage
The new set of expanded locks at the Panama Canal were opened on Sunday, June 26, and a Chinese-owned container ship, COSCO
Shipping Panama made the inaugural successful commercial transit through the newly expanded locks. About 70 heads of State were
invited to witness the historical passage of the COSCO Shipping Panama through the Canal’s 6 massive locks—3 on either side of the
Atlantic and Pacific shores. The expanded Canal will allow the passage of larger Neopanamax vessels, increase efficiency, and
provide greater economies of scale to global commerce.
Railroads: Recent Grain Surge Helps Offset Drop in Coal and Crude Grain carloads originating with U.S. Class I railroads have been above their prior 3-year average every week since May 21. With
22,711 cars for the week ending June 18, grain carloads were up 12 percent from the previous week and 24 percent higher compared
to last year. Strong carload numbers for grain have helped offset substantial losses in coal and petroleum, which fell 21 percent and
25 percent, respectively, from the previous week. Year-to-date total traffic (carload plus intermodal) for U.S. Class I railroads is down
8 percent from last year, with coal down 32 percent, petroleum down 22 percent, and grain down only 2 percent.
Corn Inspections Remain Strong For the week ending June 23, total inspections of corn reached 1.43 million metric tons (mmt), up 18 percent from the previous week,
up 14 percent from last year, and 89 percent above the 3-year average. Shipments of corn increased primarily to Asia and Latin
America. Wheat and soybean inspections decreased 10 and 14 percent from the past week. Total inspections of grain (corn, wheat,
soybeans) for export reached 2.25 mmt, up 5 percent from the past week, up 33 percent from last year, and 64 percent above the 3-
year average. Pacific Northwest (PNW) grain inspections dropped 8 percent from the previous week and Mississippi Gulf inspections
increased 2 percent. Outstanding export sales (unshipped) of wheat and corn are down, but soybean export sales increased.
Snapshots by Sector
Export Sales
During the week ending June 16, unshipped balances of wheat, corn, and soybeans totaled 26.1 mmt, up 47 percent from the same
time last year. Net weekly wheat export sales were .463 mmt, down 39 percent from the previous week. Net corn export sales were
.871 mmt, down 4 percent from the previous week, and net soybean export sales were .661 mmt, down 19 percent from the past
week.
Rail
U.S. Class I railroads originated 22,711 grain carloads for the week ending June 18, up 12 percent from the previous week, up 24
percent from last year, and up 28 percent from the 3-year average.
Average July shuttle secondary railcar bids/offers per car were $25 below tariff for the week ending June 23, up $38 from last week,
and $174 higher than last year. Average secondary non-shuttle secondary railcar bids/offers were $6 below tariff, unchanged from last
week, and $19 higher than last year.
Barge For the week ending June 25, barge grain movements totaled 995,820 tons, 12 percent higher than last week, and up 38 percent from
the same period last year.
For the week ending June 25, 642 grain barges moved down river, up 13 percent from last week; 548 grain barges were unloaded in
New Orleans, down 24 percent from the previous week.
Ocean
For the week ending June 23, 37 ocean-going grain vessels were loaded in the Gulf, 12 percent more than the same period last year.
Forty-nine vessels are expected to be loaded within the next 10 days, 4 percent less than the same period last year.
For the week ending June 23, the ocean freight rate for shipping bulk grain from the Gulf to Japan was $28.75 per metric ton, up 2
percent from the previous week. The cost of shipping from the PNW to Japan was $16. per metric ton, up 3 percent from the previous
week.
Fuel
During the week ending June 27, U.S. average diesel fuel prices remained unchanged from the previous week at $2.43 per gallon,
down $0.42 from the same week last year.
Contact Us

June 30, 2016
Grain Transportation Report 2
Feature Article/Calendar
Industry Works Together to Find Solution for New International Container Weight Requirement
On July 1, new international regulations will require shippers to report a verified gross mass (VGM)
weight of containers to shipping lines prior to being loaded on the vessel. The regulations are the result of
the 2014 Safety of Life at Sea (SOLAS) amendments (see discussion in the next section). U.S.
agricultural exporters have been working with ocean container carriers, the Coast Guard (the legal
enforcement agency of the new regulations), the Federal Maritime Commission, and Congress for months
to ensure these regulations do not disrupt their ability to efficiently move products overseas. The road has
been arduous, but within just a couple of weeks of implementation, a solution for both exporters and
carriers was reached. Ocean carriers have agreed to accept the gate weight recorded at the port terminals
as the official shipment VGM. As the deadline approaches, exporters are encouraging all U.S. container
ports to agree to this solution and carriers and ports are working out the final procedural details and
methods of the data transmission.
What is the new SOLAS requirement?
The new regulations come from an amendment to the International Maritime Organization’s (IMO)
International Convention for the SOLAS. The IMO is “a specialized agency of the United Nations that is
the global standard-setting authority for the safety, security, and environmental performance of
international shipping. IMO’s main role is to create a regulatory framework for the shipping industry that
is fair and effective, universally adopted, and universally implemented.” According to the IMO, the key
objective of the SOLAS Convention is to identify and specify the minimum standards for the
construction, equipment, and operation of merchant ships to ensure their safety (IMO 2016). The new
regulation is an amendment to Chapter VI of SOLAS, which covers the safety requirements for all types
of cargo. The amendment requires containers to have a verified gross mass as a condition for loading
aboard a vessel. This information will allow vessel planners to more accurately determine the weight
aboard the ship and reduce the risk of overloading the vessel.
Original interpretations of the rule required the exporter to be responsible for providing the VGM to the
ocean carrier prior to the container arriving at the terminal or the container would be turned away.
Carriers also required exporters to accurately report the weight of the container itself which they do not
own or operate. The export community agreed this would cause additional costs, time, and delays and
jeopardize the export transaction.
What is the current solution?
After the Port of Charleston’s announcement in February that it would provide terminal gate weights to
satisfy the new SOLAS requirements, many East and Gulf Coast ports have announced they also are
willing to provide, at no additional cost, weights already collected at the entry gates to the ocean carriers
to satisfy the VGM requirement. This is a normal practice at the terminals and will not require an
additional lift of the container. The U.S. Coast Guard confirmed that terminal gate weights are compliant
with the SOLAS mandate. On June 17, ocean carriers announced through the Ocean Carrier Equipment
Management Association (OCEMA), which represents 19 ocean container carriers, that they strongly
support the use of on-terminal scales to obtain the VGM of containers. Carrier alliances have also made
announcements about how they will accept VGM information from the terminals.
U.S. ports are operated uniquely, so each port will have to determine the best weighing practices and data
transmission method for its particular circumstance. To help ensure a consistent practice for the export
community, on June 27 the Federal Maritime Commission1 approved a discussion agreement between the
19 OCEMA members and a group of East and Gulf Coast ports (Massachusetts, North Carolina, South
Carolina, Virginia, Georgia, and Houston).
1 http://www.fmc.gov/NR16-10/

June 30, 2016
Grain Transportation Report 3
For cargo arriving by on-dock rail service, the G6 Alliance has announced it will accept the shippers'
certification of cargo weights tendered to the railroad, as required by the Intermodal Safe Container
Transportation Act. The carriers will marry these shippers' weights with the associated container tare
weights pulled from the carriers' own equipment fleet registers to arrive at the VGM, which will be
electronically transmitted to the terminal by the ocean carrier.
The IMO has granted a 3-month grace period for compliance with the new VGM requirements. This will
allow some flexibility as ports, terminals, exporters, railroads, and ocean carriers implement uniform
procedures to prevent disruption to U.S. export traffic. ([email protected])
June 30, 2016
Grain Transportation Report 4
Grain Transportation Indicators
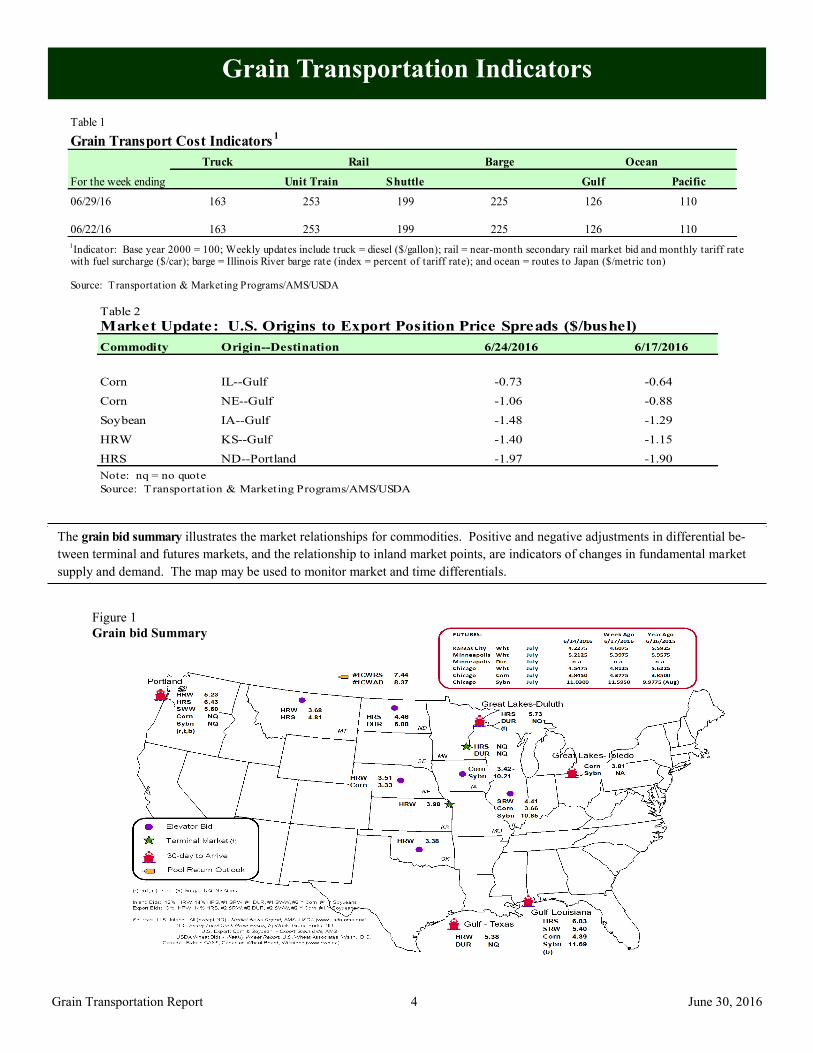
The grain bid summary illustrates the market relationships for commodities. Positive and negative adjustments in differential be-
tween terminal and futures markets, and the relationship to inland market points, are indicators of changes in fundamental market
supply and demand. The map may be used to monitor market and time differentials.
Table 2
Market Update: U.S. Origins to Export Position Price Spreads ($/bushel)
Commodity Origin--Destination 6/24/2016 6/17/2016
Corn IL--Gulf -0.73 -0.64
Corn NE--Gulf -1.06 -0.88
Soybean IA--Gulf -1.48 -1.29
HRW KS--Gulf -1.40 -1.15
HRS ND--Portland -1.97 -1.90
Note: nq = no quote
Source: Transportation & Marketing Programs/AMS/USDA
Table 1
Grain Transport Cost Indicators1
Truck Barge Ocean
For the week ending Unit Train Shuttle Gulf Pacific
06/29/16 163 253 199 225 126 1100 % 0 % - 1% 2 % 3 %
06/22/16 163 253 199 225 126 110
1Indicator: Base year 2000 = 100; Weekly updates include truck = diesel ($/gallon); rail = near-month secondary rail market bid and monthly tariff rate
with fuel surcharge ($/car); barge = Illinois River barge rate (index = percent of tariff rate); and ocean = routes to Japan ($/metric ton)
Source: Transportation & Marketing Programs/AMS/USDA
Rail
Figure 1
Grain bid Summary

June 30, 2016
Grain Transportation Report 5
Rail Transportation
Railroads originate approximately 24 percent of U.S. grain shipments. Trends in these loadings are indicative of
market conditions and expectations.
Figure 2
Rail Deliveries to Port
0
1,000
2,000
3,000
4,000
5,000
6,000
7,000
8,000
9,000
10,000
07/0
3/1
3
08/2
8/1
3
10/2
3/1
3
12/1
8/1
3
02/1
2/1
4
04/0
9/1
4
06/0
4/1
4
07/3
0/1
4
09/2
4/1
4
11/1
9/1
4
01/1
4/1
5
03/1
1/1
5
05/0
6/1
5
07/0
1/1
5
08/2
6/1
5
10/2
1/1
5
12/1
6/1
5
02/1
0/1
6
04/0
6/1
6
06/0
1/1
6
07/2
7/1
6
09/2
1/1
6
11/1
6/1
6
Carl
oa
ds
-4-w
ee
k r
un
nin
g a
vera
ge
Pacific Northwest: 4 wks. ending 6/22- -up 56% from same period last year; up 59% from 4-year average
Texas Gulf: 4 wks. ending 6/22--up 44% from same period last year; up 12% from 4-year average
Miss. River : 4 wks. ending 6/22--down 5% from same period last year; down 12% from 4-year average
Cross-border: 4 wks. ending 6/18--up 2% from same per iod last year; up 9% from 4-year average
Source: Transportation & Marketing Programs/AMS/USDA
Table 3
Rail Deliveries to Port (carloads)1
Mississippi Pacific Atlantic & Cross-Border
For the Week Ending Gulf Texas Gulf Northwest East Gulf Total Week ending Mexico3
6/22/2016p
109 1,186 4,989 197 6,481 6/18/2016 1,832
6/15/2016r
222 1,584 4,877 68 6,751 6/11/2016 1,926
2016 YTDr
6,163 36,250 123,654 9,461 175,528 2016 YTD 50,890
2015 YTDr
11,026 34,113 111,366 13,113 169,618 2015 YTD 43,438
2016 YTD as % of 2015 YTD 56 106 111 72 103 % change YTD 117
Last 4 weeks as % of 20152
95 144 156 43 146 Last 4wks % 2015 102
Last 4 weeks as % of 4-year avg.2
112 112 159 62 133 Last 4wks % 4 yr 109
Total 2015 29,054 60,819 239,029 26,730 355,632 Total 2015 97,736
Total 2014 44,617 83,674 256,670 32,107 417,068 Total 2014 98,4221 Data is incomplete as it is voluntarily provided2 Compared with same 4-weeks in 2015 and prior 4-year average.
3 Cross-border weekly data is approximately 15 percent below the Association of American Railroads' reported weekly carloads received by Mexican railroads
to reflect switching between KCSM and FerroMex.
YTD = year-to-date; p = preliminary data; r = revised data; n/a = not available
Source: Transportation & Marketing Programs/AMS/USDA

June 30, 2016
Grain Transportation Report 6
Figure 3
Total Weekly U.S. Class I Railroad Grain Car Loadings
15,000
17,000
19,000
21,000
23,000
25,000
27,000
29,000
Car
load
s
3-year, 4-week average 4-week average
Source: Association of American Railroads
For the 4 weeks ending June 18, grain carloadings were up 5 percent from the previous week, up 8 percent from last year, and up 14 percent from the 3-year average.
Table 4
Class I Rail Carrier Grain Car Bulletin (grain carloads originated)
For the week ending:
6/18/2016 CSXT NS BNSF KCS UP CN CP
This week 1,930 2,776 12,393 909 4,703 22,711 2,871 4,295
This week last year 1,721 2,918 7,620 994 5,018 18,271 4,597 4,548
2016 YTD 43,881 66,589 242,826 20,741 124,247 498,284 76,852 102,587
2015 YTD 49,417 73,568 238,478 21,207 124,248 506,918 99,741 104,997
2016 YTD as % of 2015 YTD 89 91 102 98 100 98 77 98
Last 4 weeks as % of 2015* 90 97 123 83 102 108 59 80
Last 4 weeks as % of 3-yr avg.** 96 104 126 114 105 114 65 76
Total 2015 104,039 149,043 536,173 45,445 267,720 1,102,420 211,868 236,263
*The past 4 weeks of this year as a percent of the same 4 weeks last year.
**The past 4 weeks as a percent of the same period from the prior 3-year average. YTD = year-to-date.
Source: Association of American Railroads (www.aar.org)
East West CanadaU.S. total
Table 5
Railcar Auction Offerings1
($/car)2
Jul-16 Jul-15 Aug-16 Aug-15 Sep-16 Sep-15 Oct-16 Oct-15
CO T grain units 7 0 0 no bids 1 no bids 1 18
CO T grain single-car5 0 . . 11 0 . . 3 21 . . 71 no bids 0 . . 8 0 2 . . 15 1
GCAS/Region 1 no bids no bids no bids no bids no bids no bids n/a n/a
GCAS/Region 2 no bids no bids no bids no bids 10 no bids n/a n/a
1Auctio n o fferings a re fo r s ingle-car and unit tra in s hipments o nly.2Average premium/dis co unt to ta riff, las t auc tio n
3BNSF - COT = Certifica te o f Trans po rta tio n; no rth gra in and s o uth gra in bids were co mbined effec tive the week ending 6/24/06.
4UP - GCAS = Grain Car Allo ca tio n Sys tem
Regio n 1 inc ludes : AR, IL, LA, MO, NM, OK, TX, WI, and Duluth, MN.
Regio n 2 inc ludes : CO, IA, KS, MN, NE, WY, and Kans as City and St. J o s eph, MO.
5Range is s ho wn becaus e average is no t ava ilable . No t ava ilable = n/a .
So urce : Trans po rta tio n & Marketing P ro grams /AMS/USDA.
UP4
Delivery period
BNSF3
For the week ending:
6/23/2016

June 30, 2016
Grain Transportation Report 7
The secondary rail market information reflects trade values for service that was originally purchased from the railroad carrier as
some form of guaranteed freight. The auction and secondary rail values are indicators of rail service quality and demand/
supply.
Figure 4
Bids/Offers for Railcars to be Delivered in July 2016, Secondary Market
-400
-300
-200
-100
0
100
200
300
400
500
600
700
12/3
/20
15
12/1
7/2
015
12/3
1/2
015
1/1
4/20
16
1/2
8/20
16
2/1
1/20
16
2/2
5/20
16
3/1
0/20
16
3/2
4/20
16
4/7
/201
6
4/2
1/20
16
5/5
/201
6
5/1
9/20
16
6/2
/201
6
6/1
6/20
16
6/3
0/20
16
7/1
4/20
16
Aver
age
pre
miu
m/d
isco
unt
to t
arif
f
($/c
ar)
Shuttle Non-Shuttle
Shuttle prior 3-yr avg. (same week) Non-Shuttle prior 3-yr avg. (same week)6/23/2016
Non-shuttle bids include unit-train and single-car bids. n/a = not available.Source: Transportation & Marketing Programs/AMS/USDA
$0
UPBNSF
$0
-$13
-$50Shuttle
Non-Shuttle
Average Non-shuttle bids/offers are unchanged this week, and are $6 below the peak.
Average Shuttle bids/offers rose $38 this week and are at the peak.
Figure 5
Bids/Offers for Railcars to be Delivered in August 2016, Secondary Market
-400
-200
0
200
400
600
800
12/3
1/2
015
1/1
4/20
16
1/2
8/20
16
2/1
1/20
16
2/2
5/20
16
3/1
0/20
16
3/2
4/20
16
4/7
/201
6
4/2
1/20
16
5/5
/201
6
5/1
9/20
16
6/2
/201
6
6/1
6/20
16
6/3
0/20
16
7/1
4/20
16
7/2
8/20
16
8/1
1/20
16
Aver
age
pre
miu
m/d
isco
unt
to t
arif
f
($/c
ar)
Shuttle Non-Shuttle
Shuttle prior 3-yr avg. (same week) Non-Shuttle prior 3-yr avg. (same week)6/23/2016
Non-shuttle bids include unit-train and single-car bids. n/a = not available.Source: Transportation & Marketing Programs/AMS/USDA
n/a
UPBNSF
n/a
-$38
$0Shuttle
Non-Shuttle
There were no Non-Shuttle bids/offers last week. Average Non-Shuttle bids/offers this week are at the peak. Average Shuttle bids/offers are unchanged this week and are at the peak.

June 30, 2016
Grain Transportation Report 8
Figure 6
Bids/Offers for Railcars to be Delivered in September 2016, Secondary Market
-400
-200
0
200
400
600
800
1000
1200
1400
16001/
28/
2016
2/1
1/20
16
2/2
5/20
16
3/1
0/20
16
3/2
4/20
16
4/7
/201
6
4/2
1/20
16
5/5
/201
6
5/1
9/20
16
6/2
/201
6
6/1
6/20
16
6/3
0/20
16
7/1
4/20
16
7/2
8/20
16
8/1
1/20
16
8/2
5/20
16
9/8
/201
6
Aver
age
pre
miu
m/d
isco
unt
to t
arif
f
($/c
ar)
Shuttle Non-Shuttle
Shuttle prior 3-yr avg. (same week) Non-Shuttle prior 3-yr avg. (same week)6/23/2016
Non-shuttle bids include unit-train and single-car bids. n/a = not available.Source: Transportation & Marketing Programs/AMS/USDA
n/a
UPBNSF
$233
n/a
$100Shuttle
Non-Shuttle
There were no Non-Shuttle bids/offers this week.Average Shuttle bids/offers rose $142 this week and are $233 below the peak.
Table 6
Weekly Secondary Railcar Market ($/car)1
Jul-16 Aug-16 Sep-16 Oct-16 Nov-16 Dec-16
BNSF-GF 0 n/a n/a n/a n/a n/a
Change from last week (50) n/a n/a n/a n/a n/a
Change from same week 2015 0 n/a n/a n/a n/a n/a
UP-Pool (13) (38) n/a n/a n/a n/a
Change from last week 50 n/a n/a n/a n/a n/a
Change from same week 2015 38 n/a n/a n/a n/a n/a
BNSF-GF 0 n/a 233 1067 800 (25)
Change from last week n/a n/a 233 267 n/a 25
Change from same week 2015 197 n/a 133 267 n/a n/a
UP-Pool (50) 0 100 475 n/a n/a
Change from last week 13 0 50 (25) n/a n/a
Change from same week 2015 150 100 300 n/a n/a n/a
1Average premium/dis co unt to ta riff, $ /car-las t week
No te : Bids lis ted are market INDICATORS o nly & are NOT guaranteed prices ,
n/a = no t ava ilable ; GF = guaranteed fre ight; P o o l = guaranteed po o l
So urces : Trans po rta tio n and Marketing P ro grams /AMS/USDA
Data fro m J ames B. J o iner Co ., Tradewes t Bro kerage Co .
No
n-s
hu
ttle
For the week ending:
6/23/2016
Sh
utt
le
Delivery period

June 30, 2016
Grain Transportation Report 9
Table 7
Tariff Rail Rates for Unit and Shuttle Train Shipments1
Effective date: Percent
Tariff change
6/1/2016 Origin region* Destination region* rate/car metric ton bushel2
Y/Y3
Unit train
Wheat Wichita, KS St. Louis, MO $3,605 $0 $35.80 $0.97 -2
Grand Forks, ND Duluth-Superior, MN $3,463 -$24 $34.15 $0.93 -17
Wichita, KS Los Angeles, CA $6,950 -$122 $67.80 $1.85 -3
Wichita, KS New Orleans, LA $4,243 $0 $42.14 $1.15 -3
Sioux Falls, SD Galveston-Houston, TX $6,486 -$100 $63.41 $1.73 -3
Northwest KS Galveston-Houston, TX $4,511 $0 $44.80 $1.22 -3
Amarillo, TX Los Angeles, CA $4,710 $0 $46.77 $1.27 -4
Corn Champaign-Urbana, IL New Orleans, LA $3,681 $0 $36.55 $0.93 6
Toledo, OH Raleigh, NC $6,061 $0 $60.19 $1.53 9
Des Moines, IA Davenport, IA $2,168 $0 $21.53 $0.55 -1
Indianapolis, IN Atlanta, GA $5,004 $0 $49.69 $1.26 5
Indianapolis, IN Knoxville, TN $4,311 $0 $42.81 $1.09 5
Des Moines, IA Little Rock, AR $3,444 $0 $34.20 $0.87 1
Des Moines, IA Los Angeles, CA $5,052 $0 $50.17 $1.27 -1
Soybeans Minneapolis, MN New Orleans, LA $3,699 $0 $36.73 $1.00 -3
Toledo, OH Huntsville, AL $5,051 $0 $50.16 $1.37 8
Indianapolis, IN Raleigh, NC $6,178 $0 $61.35 $1.67 10
Indianapolis, IN Huntsville, AL $4,529 $0 $44.98 $1.22 4
Champaign-Urbana, IL New Orleans, LA $4,395 $0 $43.64 $1.19 7
Shuttle Train
Wheat Great Falls, MT Portland, OR $3,853 -$70 $37.56 $1.02 -6
Wichita, KS Galveston-Houston, TX $3,871 -$55 $37.90 $1.03 -4
Chicago, IL Albany, NY $5,492 $0 $54.54 $1.48 16
Grand Forks, ND Portland, OR $5,511 -$122 $53.52 $1.46 -6
Grand Forks, ND Galveston-Houston, TX $5,831 -$127 $56.65 $1.54 -14
Northwest KS Portland, OR $5,478 $0 $54.40 $1.48 -4
Corn Minneapolis, MN Portland, OR $5,000 -$148 $48.18 $1.22 -9
Sioux Falls, SD Tacoma, WA $4,960 -$136 $47.91 $1.22 -8
Champaign-Urbana, IL New Orleans, LA $3,481 $0 $34.57 $0.88 6
Lincoln, NE Galveston-Houston, TX $3,600 -$79 $34.96 $0.89 -5
Des Moines, IA Amarillo, TX $3,795 $0 $37.69 $0.96 0
Minneapolis, MN Tacoma, WA $5,000 -$147 $48.19 $1.22 -9
Council Bluffs, IA Stockton, CA $4,640 -$152 $44.57 $1.13 -6
Soybeans Sioux Falls, SD Tacoma, WA $5,490 -$136 $53.17 $1.45 -8
Minneapolis, MN Portland, OR $5,510 -$148 $53.25 $1.45 -8
Fargo, ND Tacoma, WA $5,380 -$121 $52.23 $1.42 -8
Council Bluffs, IA New Orleans, LA $4,425 $0 $43.94 $1.20 -4
Toledo, OH Huntsville, AL $4,226 $0 $41.97 $1.14 10
Grand Island, NE Portland, OR $5,360 $0 $53.23 $1.45 -4
1A unit train refers to shipments of at least 25 cars. Shuttle train rates are available for qualified shipments of
75-120 cars that meet railroad efficiency requirements.
2Approximate load per car = 111 short tons (100.7 metric tons): corn 56 lbs./bu., wheat & soybeans 60 lbs./bu.
3Percentage change year over year calculated using tariff rate plus fuel surchage
Sources: www.bnsf.com, www.cpr.ca, www.csx.com, www.uprr.com
*Regional economic areas defined by the Bureau of Economic Analysis (BEA)
Tariff plus surcharge per:Fuel
surcharge
per car
The tariff rail rate is the base price of freight rail service, and together with fuel surcharges and any auction and secondary rail
values constitute the full cost of shipping by rail. Typically, auction and secondary rail values are a small fraction of the full
cost of shipping by rail relative to the tariff rate. High auction and secondary rail values, during times of high rail demand or
short supply, can exceed the cost of the tariff rate plus fuel surcharge.

June 30, 2016
Grain Transportation Report 10
Table 8
Tariff Rail Rates for U.S. Bulk Grain Shipments to MexicoEffective date: 6/1/2016 Percent
Tariff change4
Commodity Destination region rate/car1
metric ton3 bushel
3Y/Y
Wheat MT Chihuahua, CI $7,459 $0 $76.21 $2.07 -3
OK Cuautitlan, EM $6,514 $0 $66.55 $1.81 -5
KS Guadalajara, JA $6,995 $70 $72.19 $1.96 -4
TX Salinas Victoria, NL $4,142 $0 $42.32 $1.15 -1
Corn IA Guadalajara, JA $8,137 $49 $83.64 $2.12 -5
SD Celaya, GJ $7,480 $0 $76.43 $1.94 -6
NE Queretaro, QA $7,879 $0 $80.50 $2.04 0
SD Salinas Victoria, NL $6,545 $0 $66.87 $1.70 6
MO Tlalnepantla, EM $7,238 $0 $73.96 $1.88 0
SD Torreon, CU $7,080 $0 $72.34 $1.84 -2
Soybeans MO Bojay (Tula), HG $8,652 $54 $88.95 $2.42 1
NE Guadalajara, JA $9,142 $52 $93.93 $2.55 0
IA El Castillo, JA $9,470 $0 $96.76 $2.63 0
KS Torreon, CU $7,439 $30 $76.31 $2.07 1
Sorghum NE Celaya, GJ $7,344 $41 $75.45 $1.91 -3
KS Queretaro, QA $7,563 $0 $77.27 $1.96 2
NE Salinas Victoria, NL $6,168 $0 $63.02 $1.60 2
NE Torreon, CU $6,672 $25 $68.42 $1.74 -21Rates are based upon published tariff rates for high-capacity shuttle trains. Shuttle trains are available for qualified
shipments of 75--110 cars that meet railroad efficiency requirements.2Fuel surcharge adjusted to reflect the change in Ferrocarril Mexicano, S.A. de C.V railroad fuel surcharge policy as of 10/01/2009
3Approximate load per car = 97.87 metric tons: Corn & Sorghum 56 lbs/bu, Wheat & Soybeans 60 lbs/bu4Percentage change calculated using tariff rate plus fuel surchage
Sources: www.bnsf.com, www.uprr.com, www.kcsouthern.com
Fuel
surcharge
per car2
Tariff plus surcharge per:Origin
state
Figure 7
Railroad Fuel Surcharges, North American Weighted Average1
-$0.10
$0.00
$0.10
$0.20
$0.30
$0.40
$0.50
$0.60
$0.70
Dollar
s p
er r
ailc
ar m
ile 3-year Monthly Average
Fuel Surcharge* ($/mile/railcar)
June 2016: $-0.03, unchanged from last month's surcharge of $-0.03/mile; down 12 cents from the June 2015 surcharge of $0.09/mile; and down 28 cents from the June prior 3-year average of $0.25/mile.
1 Weighted by each Class I railroad's proportion of grain traffic for the prior year. * Beginning January 2009, the Canadian Pacific fuel surcharge is computed by a monthly average of the bi -weekly fuel surcharge.**CSX strike price changed from $2.00/gal. to $3.75/gal. starting January 1, 2015.
Sources: www.bnsf.com, www.cn.ca, www.cpr.ca, www.csx.com, www.kcsi.com, www.nscorp.com, www.uprr.com

June 30, 2016
Grain Transportation Report 11
Barge Transportation
Figure 8
Illinois River Barge Freight Rate1,2
1Rate = percent of 1976 tariff benchmark index (1976 = 100 percent);
24-week moving average of the 3-year average.
Source: Transportation & Marketing Programs/AMS/USDA
0
200
400
600
800
1000
1200
06/3
0/15
07/1
4/15
07/2
8/15
08/1
1/15
08/2
5/15
09/0
8/15
09/2
2/15
10/0
6/15
10/2
0/15
11/0
3/15
11/1
7/15
12/0
1/15
12/1
5/15
12/2
9/15
01/1
2/16
01/2
6/16
02/0
9/16
02/2
3/16
03/0
8/16
03/2
2/16
04/0
5/16
04/1
9/16
05/0
3/16
05/1
7/16
05/3
1/16
06/1
4/16
06/2
8/16
Per
cen
t of
tar
iff
Weekly rate
3-year avg. for
the week
For the week ending June 28: 1 percent lower than last week and 25 percent higher than the 3-year average (no data from last year due to flooding).
Table 9
Weekly Barge Freight Rates: Southbound Only
Twin
Cities
Mid-
Mississippi
Lower
Illinois
River St. Louis Cincinnati
Lower
Ohio
Cairo-
Memphis
Rate1
6/28/2016 470 408 400 275 273 273 248
6/21/2016 463 413 405 300 295 295 243
$/ton 6/28/2016 29.09 21.71 18.56 10.97 12.80 11.03 7.79
6/21/2016 28.66 21.97 18.79 11.97 13.84 11.92 7.63
Current week % change from the same week:
Last year -15 -11 - -17 -23 -23 -5
3-year avg. 2
9 20 25 4 9 9 13-2 6 6
Rate1
July 488 435 430 308 295 295 278
September 563 578 550 480 563 563 473
Source: Transportation & Marketing Programs/AMS/USDA
1Rate = percent of 1976 tariff benchmark index (1976 = 100 percent); 24-week moving average; ton = 2,000 pounds;
Figure 9
Benchmark tariff rates
Calculating barge rate per ton:
(Rate * 1976 tariff benchmark rate per ton)/100
Select applicable index from market quotes included in
tables on this page. The 1976 benchmark rates per ton
are provided in map.
Twin Cities 6.19
Mid-Mississippi 5.32
St. Louis 3.99
Cairo-Memphis 3.14
Illinois 4.64 Cincinnati 4.69
Lower Ohio 4.04

June 30, 2016
Grain Transportation Report 12
Figure 10
Barge Movements on the Mississippi River1 (Locks 27 - Granite City, IL)
1 The 3-year average is a 4-week moving average.
Source: U.S. Army Corps of Engineers
0
100
200
300
400
500
600
700
800
900
1,000
01
/10/1
5
01
/24/1
5
02
/07/1
5
02
/21/1
5
03
/07/1
5
03
/21/1
5
04
/04/1
5
04
/18/1
5
05
/02/1
5
05
/16/1
5
05
/30/1
5
06
/13/1
5
06
/27/1
5
07
/11/1
5
07
/25/1
5
08
/08/1
5
08
/22/1
5
09
/05/1
5
09
/19/1
5
10
/03/1
5
10
/17/1
5
10
/31/1
5
11
/14/1
5
11
/28/1
5
12
/12/1
5
12
/26/1
5
01
/09/1
6
01
/23/1
6
02
/06/1
6
02
/20/1
6
03
/05/1
6
03
/19/1
6
04
/02/1
6
04
/16/1
6
04
/30/1
6
05
/14/1
6
05
/28/1
6
06
/11/1
6
06
/25/1
6
07
/09/1
6
07
/23/1
6
1,0
00
to
ns
Soybeans
Wheat
Corn
3-Year Average
For the week ending June 25: up 67 percent fromlast year and up 83 percent from the 3-yravg.
Table 10
Barge Grain Movements (1,000 tons)
For the week ending 6/25/2016 Corn Wheat Soybeans Other Total
Mississippi River
Rock Island, IL (L15) 287 0 69 0 356
Winfield, MO (L25) 510 2 101 16 629
Alton, IL (L26) 733 3 144 16 896
Granite City, IL (L27) 719 8 150 16 893
Illinois River (L8) 192 2 39 0 233
Ohio River (L52) 9 23 18 0 50
Arkansas River (L1) 1 44 8 0 54
Weekly total - 2016 729 75 176 16 996
Weekly total - 2015 450 75 184 14 723
2016 YTD1
11,670 936 4,953 162 17,720
2015 YTD 10,314 684 5,208 121 16,327
2016 as % of 2015 YTD 113 137 95 134 109
Last 4 weeks as % of 20152
107 189 107 155 110
Total 2015 19,215 1,686 14,191 359 35,451
2 As a percent of same period in 2015.
Source: U.S. Army Corps of Engineers
Note: Total may not add exactly, due to rounding
1 Weekly total, YTD (year-to-date) and calendar year total includes Miss/27, Ohio/52, and Ark/1; "Other" refers to oats, barley,
sorghum, and rye.

June 30, 2016
Grain Transportation Report 13
Figure 11
Source: U.S. Army Corps of Engineers
Upbound Empty Barges Transiting Mississippi River Locks 27, Arkansas River
Lock and Dam 1, and Ohio River Locks and Dam 52
0
100
200
300
400
500
600
7008
/22
/15
8/2
9/1
5
9/5
/15
9/1
2/1
5
9/1
9/1
5
9/2
6/1
5
10/
3/1
5
10/
10/
15
10/
17/
15
10/
24/
15
10/
31/
15
11/
7/1
5
11/
14/
15
11/
21/
15
11/
28/
15
12/
5/1
5
12/
12/
15
12/
19/
15
12/
26/
15
1/2
/16
1/9
/16
1/1
6/1
6
1/2
3/1
6
1/3
0/1
6
2/6
/16
2/1
3/1
6
2/2
0/1
6
2/2
7/1
6
3/5
/16
3/1
2/1
6
3/1
9/1
6
3/2
6/1
6
4/2
/16
4/9
/16
4/1
6/1
6
4/2
3/1
6
4/3
0/1
6
5/7
/16
5/1
4/1
6
5/2
1/1
6
5/2
8/1
6
6/4
/16
6/1
1/1
6
6/1
8/1
6
6/2
5/1
6
Nu
mb
er o
f Ba
rges
Miss. Locks 27 Ark Lock 1 Ohio Lock2 52
For the week ending June 25: 871 total barges,
up 230 from the previous week, and 45 percent
higher than the 3-year avg.
Figure 12
Grain Barges for Export in New Orleans Region
Source: U.S. Army Corps of Engineers and GIPSA
0
200
400
600
800
1000
1200
3/7
/15
3/2
1/1
5
4/4
/15
4/1
8/1
5
5/2
/15
5/1
6/1
5
5/3
0/1
5
6/1
3/1
5
6/2
7/1
5
7/1
1/1
5
7/2
5/1
5
8/8
/15
8/2
2/1
5
9/5
/15
9/1
9/1
5
10/3
/15
10
/17
/15
10
/31
/15
11
/14
/15
11
/28
/15
12
/12
/15
12
/26
/15
1/9
/16
1/2
3/1
6
2/6
/16
2/2
0/1
6
3/5
/16
3/1
9/1
6
4/2
/16
4/1
6/1
6
4/3
0/1
6
5/1
4/1
6
5/2
8/1
6
6/1
1/1
6
6/2
5/1
6
Downbound Grain Barges Locks 27, 1, and 52
Grain Barges Unloaded in New Orleans
Nu
mb
er o
f b
arges
For the week ending June 25: 642 grain barges moved down river, up 13 percent from last week, 548 grain barges were unloaded in New Orleans, down 24 percent from the
previous week.

June 30, 2016
Grain Transportation Report 14
The weekly diesel price provides a proxy for trends in U.S. truck rates as diesel fuel is a significant expense for truck grain move-
ments.
Truck Transportation
Figure 13
Weekly Diesel Fuel Prices, U.S. Average
Source: Retail On-Highway Diesel Prices, Energy Information Administration, Dept. of Energy
1.5
2.0
2.5
3.0
3.5
4.0
4.5
12/2
8/1
5
01/0
4/1
6
01/1
1/1
6
01/1
8/1
6
01/2
5/1
6
02/0
1/1
6
02/0
8/1
6
02/1
5/1
6
02/2
2/1
6
02/2
9/1
6
03/0
7/1
6
03/1
4/1
6
03/2
1/1
6
03/2
8/1
6
04/0
4/1
6
04/1
1/1
6
04/1
8/1
6
04/2
5/1
6
05/0
2/1
6
05/0
9/1
6
05/1
6/1
6
05/2
3/1
6
05/3
0/1
6
06/0
6/1
6
06/1
3/1
6
06/2
0/1
6
06/2
7/1
6
Last year Current Year
$ p
er
gall
on
For the week ending June 27: fuel prices remainedunchanged from the previous week but are $0.42 lower than the same week last year.
Table 11
Change from
Region Location Price Week ago Year ago
I East Coast 2.442 -0.001 -0.512
New England 2.491 -0.003 -0.580
Central Atlantic 2.535 -0.007 -0.559
Lower Atlantic 2.361 0.003 -0.462
II Midwest2 2.389 0.003 -0.342
III Gulf Coast3
2.285 -0.011 -0.445
IV Rocky Mountain 2.429 0.016 -0.347
V West Coast 2.713 0.007 -0.355
West Coast less California 2.600 -0.006 -0.378
California 2.803 0.017 -0.338
Total U.S. 2.426 0.000 -0.4171Diesel fuel prices include all taxes. Prices represent an average of all types of diesel fuel.
2Same as North Central 3Same as South Central
Source: Energy Information Administration/U.S. Department of Energy (www.eia.doe.gov)
Retail on-Highway Diesel Prices1, Week Ending 06/27/2016 (US $/gallon)

June 30, 2016
Grain Transportation Report 15
Grain Exports
Table 12
U.S. Export Balances and Cumulative Exports (1,000 metric tons)
Wheat Corn Soybeans Total
For the week ending HRW SRW HRS SWW DUR All wheat
Export Balances1
6/16/2016 1,890 705 2,154 1,049 141 5,939 13,740 6,393 26,072
This week year ago 1,376 939 1,406 820 176 4,717 9,889 3,147 17,753
Cumulative exports-marketing year 2
2015/16 YTD 462 66 274 238 11 1,052 32,674 43,538 77,264
2014/15 YTD 287 122 175 123 58 765 35,191 47,342 83,298
YTD 2015/16 as % of 2014/15 161 54 157 194 19 137 93 92 93
Last 4 wks as % of same period 2014/15 111 57 124 108 66 102 144 178 139
2014/15 Total 7,009 3,654 7,250 3,758 665 22,336 45,205 49,614 117,155
2013/14 Total 11,465 7,307 6,338 4,367 486 29,963 46,868 44,478 121,3091 Current unshipped (outstanding) export sales to date2 Shipped export sales to date; new marketing year now in effect for wheat
Note: YTD = year-to-date. Marketing Year: wheat = 6/01-5/31, corn & soybeans = 9/01-8/31
Source: Foreign Agricultural Service/USDA (www.fas.usda.gov)
Table 13
Top 5 Importers 1 of U.S. Corn
For the week ending 6/16/2016 % change
Exports3
2016/17 2015/16 2014/15 current MY 3-year avg
Next MY Current MY Last MY from last MY 2012-2014 - 1,000 mt -
Japan 839 10,008 10,985 (9) 9,244
Mexico 1,678 12,272 10,361 18 7,448
Korea 0 2,324 3,408 (32) 2,630
Colombia 93 4,468 4,067 10 1,727
Taiwan 87 1,829 1,975 (7) 1,224
Top 5 Importers 2,696 30,901 30,796 0 22,273
Total US corn export sales 4,507 46,414 45,080 3 34,445
% of Projected 9% 100% 95%
Change from prior week 550 871 497
Top 5 importers' share of U.S. corn
export sales 60% 67% 68% 65%
USDA forecast, June 2016 48,346 46,438 47,430 (2)
Corn Use for Ethanol USDA
forecast, June 2016 134,620 133,350 132,080 1
1Based on FAS Marketing Year Ranking Reports - www.fas.usda.gov; Marketing year (MY) = Sep 1 - Aug 31.
Total Commitments2
- 1,000 mt -
3FAS Marketing Year Ranking Reports - http://apps.fas.usda.gov/export-sales/myrkaug.htm; 3-yr average
2Cumulative Exports (shipped) + Outstanding Sales (unshipped), FAS Weekly Export Sales Report, or Export Sales Query--
http://www.fas.usda.gov/esrquery/. Total commitments change from prior week could include revisions from previous week's outastanding sales or
(n) indicates negative number.
Cumulative Exports (shipped) + Outstanding Sales (unshipped), FAS Weekly Export Sales Report, or Export Sales Query--
http://www.fas.usda.gov/esrquery/

June 30, 2016
Grain Transportation Report 16
Table 14
Top 5 Importers1 of U.S. Soybeans
For the week ending 6/16/2016 % change
Exports3
2016/17 2015/16 2014/15 current MY 3-yr avg.
Next MY Current MY Last MY from last MY 2012-2014
- 1,000 mt -
China 2,620 27,569 30,049 (8) 24,211
Mexico 643 3,229 3,341 (3) 2,971
Indonesia 30 1,769 1,706 4 1,895
Japan 139 2,238 2,041 10 1,750
Taiwan 123 1,250 1,256 (0) 1,055
Top 5 importers 3,555 36,056 38,393 (6) 31,882
Total US soybean export sales 6,215 49,931 50,489 (1) 39,169
% of Projected 12% 104% 101%
Change from prior week 662 661 119
Top 5 importers' share of U.S.
soybean export sales 57% 72% 76% 81%
USDA forecast, June 2016 51,771 47,956 50,218 (5)
1Based on FAS Marketing Year Ranking Reports - www.fas.usda.gov; Marketing year (MY) = Sep 1 - Aug 31.
Total Commitments2
- 1,000 mt -
3 FAS Marketing Year Final Reports - www.fas.usda.gov/export-sales/myfi_rpt.htm. (Carryover plus Accumulated Exports)
(n) indicates negative number.
2Cumulative Exports (shipped) + Outstanding Sales (unshipped), FAS Weekly Export Sales Report, or Export Sales Query--http://www.fas.usda.gov/esrquery/
.Total commitments cahnge from prior week could include reivisions from previous week's outstanding sales and/or accumulated sales
Table 15
Top 10 Importers1 of All U.S. Wheat
For the week ending 6/16/2016 % change Exports3
2016/17 2015/16 current MY 3-yr avg
Current MY Last MY from last MY 2013-2015
- 1,000 mt -
Japan 428 349 23 2,743
Mexico 685 540 27 2,660
Nigeria 321 597 (46) 1,978
Philippines 679 349 95 2,156
Brazil 167 143 17 2,273
Korea 344 376 (9) 1,156
Taiwan 147 288 (49) 923
Indonesia 97 46 112 790
Colombia 172 107 60 664
Thailand 167 84 99 685
Top 10 importers 3,040 2,794 9 16,028
Total US wheat export sales 6,990 5,482 28 24,059
% of Projected 29% 26%
Change from prior week 463 434
Top 10 importers' share of U.S.
wheat export sales 43% 51% 67%
USDA forecast, June 2016 24,523 21,117 16
1 Based on FAS Marketing Year Ranking Reports - www.fas.usda.gov; Marketing year = Jun 1 - May 31.
outstanding and/or accumulated sales
Total Commitments2
3 FAS Marketing Year Final Reports - www.fas.usda.gov/export-sales/myfi_rpt.htm.
(n) indicates negative number.
2 Cumulative Exports (shipped) + Outstanding Sales (unshipped), FAS Weekly Export Sales Report, or Export Sales Query--
http://www.fas.usda.gov/esrquery/. Total commitments change from prior week could include revisions from the previous week's
- 1,000 mt -

June 30, 2016
Grain Transportation Report 17
The United States exports approximately one-quarter of the grain it produces. On average, this includes nearly 45 percent of U.S.-grown
wheat, 35 percent of U.S.-grown soybeans, and 20 percent of the U.S.-grown corn. Approximately 59 percent of the U.S. export grain ship-
ments departed through the U.S. Gulf region in 2015.
Table 16
Grain Inspections for Export by U.S. Port Region (1,000 metric tons)
For the Week Ending Previous Current Week 2016 YTD as
06/23/16 Week* as % of Previous 2015 YTD* % of 2015 YTD Last Year Prior 3-yr. avg.
Pacific Northwest
Wheat 209 380 55 5,876 5,419 108 158 134 10,985
Corn 366 255 144 4,743 4,725 100 149 208 7,232
Soybeans 10 0 n/a 4,435 4,054 109 90 116 11,809
Total 586 635 92 15,054 14,198 106 152 166 30,027
Mississippi Gulf
Wheat 44 42 104 1,682 1,952 86 97 61 4,504
Corn 879 767 115 15,161 14,992 101 139 178 26,701
Soybeans 169 260 65 9,849 10,694 92 77 126 29,593
Total 1,092 1,069 102 26,691 27,638 97 123 153 60,797
Texas Gulf
Wheat 237 139 171 1,752 2,026 86 165 101 3,724
Corn 31 34 89 471 301 156 102 174 596
Soybeans 0 0 n/a 92 210 44 n/a n/a 864
Total 268 173 155 2,315 2,537 91 153 107 5,184
Interior
Wheat 12 21 55 599 661 91 73 95 1,388
Corn 149 135 111 3,370 2,992 113 113 151 6,201
Soybeans 99 60 164 1,887 1,722 110 141 173 3,518
Total 260 217 120 5,856 5,375 109 114 148 11,106
Great Lakes
Wheat 36 20 184 228 241 95 156 110 997
Corn 0 21 0 126 137 92 226 679 485
Soybeans 0 0 n/a 23 66 35 n/a 0 733
Total 36 40 90 377 444 85 184 155 2,216
Atlantic
Wheat 1 0 n/a 183 330 55 1 2 520
Corn 0 0 n/a 14 77 18 0 0 277
Soybeans 8 12 66 888 940 94 121 197 2,053
Total 8 12 71 1,084 1,347 80 27 38 2,850
U.S. total from ports**
Wheat 539 602 90 10,320 10,629 97 134 104 22,118
Corn 1,425 1,212 118 23,883 23,223 103 137 180 41,492
Soybeans 286 332 86 17,174 17,686 97 92 137 48,570
Total 2,250 2,146 105 51,377 51,538 100 129 149 112,180
* Data includes revisions from prior weeks; some regional totals may not add exactly due to rounding.
**Total only includes regions shown above
Source: Grain Inspection, Packers and Stockyards Administration/USDA (www.gipsa.usda.gov); YTD= year-to-date; n/a = not applicable
Last 4-weeks as % of:
Port Regions 2015 Total*2016 YTD*

June 30, 2016
Grain Transportation Report 18
Figure 14
U.S. grain inspected for export (wheat, corn, and soybeans)
Source: Grain Inspection, Packers and Stockyards Administration/USDA (www.gipsa.usda.gov)
Note: 3-year average consists of 4-week running average
0
20
40
60
80
100
120
140
160
180
200
11/6
/20
14
12/4
/20
14
1/1
/201
5
1/2
9/20
15
2/2
6/20
15
3/2
6/20
15
4/2
3/20
15
5/2
1/20
15
6/1
8/20
15
7/1
6/20
15
8/1
3/20
15
9/1
0/20
15
10/8
/20
15
11/5
/20
15
12/3
/20
15
12
/31/2
015
1/2
8/20
16
2/2
5/20
16
3/2
4/20
16
4/2
1/20
16
5/1
9/20
16
6/1
6/20
16
7/1
4/20
16
8/1
1/20
16
9/8
/201
6
10/6
/20
16
Mil
lion
bu
shels
(m
bu
)
Current week 3-year average
For the week ending Jun. 23: 86.4 mbu, up 5 percent from the previous week, up 33 percent from same week last year, and up 64 percent from the 3-year average.
Figure 15
U.S. Grain Inspections: U.S. Gulf and PNW1 (wheat, corn, and soybeans)
-
20
40
60
80
100
120
11/6
/14
12/6
/14
1/6
/15
2/6
/15
3/6
/15
4/6
/15
5/6
/15
6/6
/15
7/6
/15
8/6
/15
9/6
/15
10/6
/15
11/6
/15
12/6
/15
1/6
/16
2/6
/16
3/6
/16
4/6
/16
5/6
/16
6/6
/16
7/6
/16
8/6
/16
9/6
/16
10/6
/16
Mil
lion
bu
shel
s (m
bu
)
Miss. Gulf 3-Year avg - Miss. Gulf
PNW 3-Year avg - PNW
Texas Gulf 3-Year avg - TX Gulf
Source: Grain Inspection, Packers and Stockyards Administration/USDA (www.gipsa.usda.gov)
Last Week:
Last Year (same week):
3-yr avg. (4-wk. mov. Avg):
MS Gulf TX Gulf U.S. Gulf PNW
up 3
up 7
up 62
up 54
up 102
up 67
up 10
up 17
up 62
down 6
up 119
up 78
Percent change from:Week ending 06/23/16 inspections (mbu):
Mississippi Gulf:
PNW:
Texas Gulf:
42.4
22.5
9.9

June 30, 2016
Grain Transportation Report 19
Ocean Transportation
Table 17
Weekly Port Region Grain Ocean Vessel Activity (number of vessels)
Pacific Vancouver
Gulf Northwest B.C.
Loaded Due next
Date In port 7-days 10-days In port In port
6/23/2016 29 37 49 12 n/a
6/16/2016 32 38 50 12 n/a
2015 range (25..54) (28..54) (36..80) (3..26) n/a
2015 avg. 42 38 56 11 n/a
Source: Transportation & Marketing Programs/AMS/USDA
Figure 16
U.S. Gulf1 Vessel Loading Activity
0
10
20
30
40
50
60
70
2/0
4/2
01
6
2/1
1/2
016
2/1
8/2
016
2/2
5/2
01
6
3/0
3/2
01
6
3/1
0/2
01
6
3/1
7/2
01
6
3/2
4/2
016
3/3
1/2
01
6
4/0
7/2
01
6
4/1
4/2
01
6
4/2
1/2
01
6
4/2
8/2
016
5/0
5/2
01
6
5/1
2/2
01
6
5/1
9/2
01
6
5/2
6/2
01
6
6/0
2/2
016
6/0
9/2
01
6
6/1
6/2
01
6
6/2
3/2
01
6
Nu
mb
er
of
ve
ssel
s
Loaded Last 7 Days Due Next 10 days Loaded 4 Year Average
Source:Transportation & Marketing Programs/AMS/USDA1U.S. Gulf includes Mississippi, Texas, and East Gulf.
For the week ending June 23 Loaded Due Change from last year 12.1% 4.3%
Change from 4-year avg. 38.3% 11.4%

June 30, 2016
Grain Transportation Report 20
Figure 17
Grain Vessel Rates, U.S. to Japan
Data Source: O'Neil Commodity Consulting
0
5
10
15
20
25
30
35
40
45
50
May
14
July
14
Sep
t. 1
4
Nov
. 14
Jan.
15
Mar
. 15
May
15
July
15
Sep
t. 1
5
Nov
. 15
Jan.
16
Mar
. 16
May
16
US
$/m
etri
c to
n
Spread Gulf vs. PNW to Japan Rate Gulf to Japan Rate PNW to Japan
Gulf PNW Spread Ocean rates for May '16 $26.06 $15.75 $10.31 Change from May '15 -13.7% -4.5% -24.7%
Change from 4-year avg. -39.6% -32.2% -48.2%
Table 18
Ocean Freight Rates For Selected Shipments, Week Ending 06/25/2016
Export Import Grain Loading Volume loads Freight rate
region region types date (metric tons) (US$/metric ton)
U.S. Gulf China Heavy Grain Jun 7/17 66,000 17.50
U.S. Gulf China Heavy Grain May 20/30 60,000 18.25
U.S. Gulf Tanzania Wheat1
June 20/29 13,000 35.67
U.S. Gulf Djibouti or Pt Sudan Wheat1
Jul 1/10 51,000 47.25 op 46.00
PNW Japan Heavy Grain Jul 5/15 60,000 15.10
PNW Japan Heavy Grain Jun 20/Jul 1 60,000 15.90
PNW Japan Heavy Grain Jun 20/Jul 1 60,000 15.00
PNW Japan Heavy Grain May 17/26 59,800 15.45
Albany Me Gulf Grain Jun 17/25 53,000 13.85
Brazil China Heavy Grain Jun 28/Jul 4 60,000 18.00
Brazil China Heavy Grain June 20/30 60,000 19.00
Brazil China Heavy Grain May 20/30 60,000 18.25
Brazil China Heavy Grain May 1/20 60,000 15.50
EC S America China Heavy Grain May/June 60,000 14.75
River Plate China Heavy Grain Jun 23/30 60,000 22.60
Ukraine Spain Heavy Grain May 22/26 60,000 10.50
Rates shown are for metric ton (2,204.62 lbs. = 1 metric ton), F.O.B., except where otherwise indicates; op = option
150 percent of food aid from the United States is required to be shipped on U.S.-flag vessels.
Source: Maritime Research Inc. (www.maritime-research.com)

June 30, 2016
Grain Transportation Report 21
In 2014, containers were used to transport 7 percent of total U.S. waterborne grain exports. Approximately 63 percent of U.S. wa-
terborne grain exports in 2014 went to Asia, of which 11 percent were moved in containers. Approximately 95 percent of U.S. wa-
terborne containerized grain exports were destined for Asia.
Figure 18
Top 10 Destination Markets for U.S. Containerized Grain Exports, January-December 2015
Source: USDA/Agricultural Marketing Service/Transportation Services Division analysis of Port Import Export Reporting
Service (PIERS) data
Note: The following Harmonized Tariff Codes are used to calculate containerized grains movements: 100190, 100200,
100300, 100400, 100590, 100700, 110100, 230310, 110220, 110290, 120100, 230210, 230990, 230330, and 120810.
China34%
Taiwan
11%
Indonesia11% Vietnam
9%
Thailand7%
Korea6%
Japan
5%
Malaysia2%
Philippines2%Saudi Arabia
1%
Other12%
Figure 19
Monthly Shipments of Containerized Grain to Asia
Source: USDA/Agricultural Marketing Service/Transportation Services Division analysis of Port Import Export Reporting Service
(PIERS) data.
Note: The following Harmonized Tariff Codes are used to calculate containerized grains movements: 100190, 100200, 100300,
100400, 100590, 100700, 110100, 230310, 110220, 110290, 120100, 230210, 230990, 230330, and 120810.
05
101520253035404550556065707580
Jan
.
Feb
.
Mar
.
Ap
r.
May
Jun.
Jul.
Aug
.
Sep
.
Oct
.
No
v
.
Dec
.
Th
ou
san
d
20
-ft
equ
ivale
nt
un
its
2014
2015
5-year avg
Dec 2015: Up 0.02% from last year but 3% lower
than the 5-year average

June 30, 2016
Grain Transportation Report 22
Coordinators
Surajudeen (Deen) Olowolayemo [email protected] (202) 720 - 0119
Pierre Bahizi [email protected] (202) 690 - 0992
Weekly Highlight Editors
Surajudeen (Deen) Olowolayemo [email protected] (202) 720 - 0119
April Taylor [email protected] (202) 720 - 7880
Nicholas Marathon [email protected] (202) 690 - 4430
Grain Transportation Indicators
Surajudeen (Deen) Olowolayemo [email protected] (202) 720 - 0119
Rail Transportation
Johnny Hill [email protected] (202) 690 - 3295
Jesse Gastelle [email protected] (202) 690 - 1144
Peter Caffarelli [email protected] (202) 690 - 3244
Barge Transportation
Nicholas Marathon [email protected] (202) 690 - 4430
April Taylor [email protected] (202) 720 - 7880
Matt Chang [email protected] (202) 720 - 0299
Truck Transportation
April Taylor [email protected] (202) 720 - 7880
Grain Exports
Johnny Hill [email protected] (202) 690 - 3295
Ocean Transportation
Surajudeen (Deen) Olowolayemo [email protected] (202) 720 - 0119
(Freight rates and vessels)
April Taylor [email protected] (202) 720 - 7880
(Container movements)
Contributing Analysts
Sergio Sotelo [email protected] (202) 756 - 2577
Subscription Information: Send relevant information to [email protected] for an electronic copy
(printed copies are also available upon request).
Preferred citation: U.S. Dept. of Agriculture, Agricultural Marketing Service. Grain Transportation Report.
June 30, 2016. Web: http://dx.doi.org/10.9752/TS056.06-30-2016
Contacts and Links
In accordance with Federal civil rights law and U.S. Department of Agriculture (USDA) civil rights regulations and policies, the USDA, its
Agencies, offices, and employees, and institutions participating in or administering USDA programs are prohibited from discriminating based on
race, color, national origin, religion, sex, gender identity (including gender expression), sexual orientation, disability, age, marital status, family/
parental status, income derived from a public assistance program, political beliefs, or reprisal or retaliation for prior civil rights activity, in any
program or activity conducted or funded by USDA (not all bases apply to all programs). Remedies and complaint filing deadlines vary by pro-
gram or incident.
Persons with disabilities who require alternative means of communication for program information (e.g., Braille, large print, audiotape, American
Sign Language, etc.) should contact the responsible Agency or USDA's TARGET Center at (202) 720-2600 (voice and TTY) or contact USDA
through the Federal Relay Service at (800) 877-8339. Additionally, program information may be made available in languages other than English.
To file a program discrimination complaint, complete the USDA Program Discrimination Complaint Form, AD-3027, found online at How to
File a Program Discrimination Complaint and at any USDA office or write a letter addressed to USDA and provide in the letter all of the infor-
mation requested in the form. To request a copy of the complaint form, call (866) 632-9992. Submit your completed form or letter to USDA by:
(1) mail: U.S. Department of Agriculture, Office of the Assistant Secretary for Civil Rights, 1400 Independence Avenue, SW, Washington, D.C.
20250-9410; (2) fax: (202) 690-7442; or (3) email: [email protected].
USDA is an equal opportunity provider, employer, and lender.