for the six months ended september 30, 2004 - mazda.com€¦ · for the six months ended september...
TRANSCRIPT

FY2004 First Half Consolidated Financial Results For the Six Months Ended September 30, 2004 English Translation from the Original Japanese-Language Document
November 9, 2004
Company Name : Mazda Motor Corporation (Headquartered in Hiroshima, Japan / Tokyo Stock Exchange / Code No. 7261)URL : http://www.mazda.co.jpRepresentative Person : Hisakazu Imaki, Representative Director, President and CEOContact Person : Nobuyoshi Tochio, Deputy General Manager, Financial Services Division, Phone (082) 282-1111BOD Meeting : Meeting of the board of directors for consolidated account settlement held on November 9, 2004US GAAP Adoption : The United States generally accepted accounting principles not adopted
1. Consolidated Financial Highlights (April 1, 2004 through September 30, 2004)(1) Consolidated Financial Results
(in Japanese yen rounded to millions, except amounts per share)Net Sales Operating Income/(Loss) Ordinary Income/(Loss)
million yen % million yen % million yen %
FY2004 1st. Half 1,320,559 9.2 43,521 53.1 36,945 94.4FY2003 1st. Half 1,209,497 4.3 28,432 93.7 19,007 106.7FY2003 2,916,130 70,174 58,029
Net Income/(Loss) Net Income/(Loss) Per Share Net Income/(Loss) Per Share, Dilutedmillion yen % yen yen
FY2004 1st. Half 18,732 68.0 15.39 13.26FY2003 1st. Half 11,150 100.0 9.15 7.88FY2003 33,901 27.84 23.98Notes: ① Equity in net income of unconsolidated subsidiaries and affiliates FY2004 1st. Half 4,789 million yen accounted for by the equity method: FY2003 1st. Half 4,138 million yen
FY2003 9,199 million yen ② Average no. of shares of common stock outstanding (on a consolidated basis): FY2004 1st. Half 1,217,005,425 shares
FY2003 1st. Half 1,218,285,348 sharesFY2003 1,217,692,196 shares
③ Accounting changes: None ④ Changes in net sales, operating income, ordinary income, and net income from the prior periods are shown in percentage.
(2) Consolidated Financial PositionTotal Assets Shareholders' Equity Equity Ratio Equity Per Share
million yen million yen % Yen
FY2004 1st. Half 1,813,982 13.3 197.96FY2003 1st. Half 1,781,923 11.5 168.91FY2003 1,795,573 12.4 182.91Notes: No. of shares of common stock outstanding as of period end FY2004 1st. half 1,217,004,552 shares (on a consolidated basis): FY2003 1st. half 1,216,888,456 shares
FY2003 1,217,013,683 shares
(3) Consolidated Cash FlowsCash Flows from Cash Flows from Cash Flows from Ending Cash &
Operating Activities Investing Activities Financing Activities Cash Equivalentsmillion yen million yen million yen million yen
FY2004 1st. Half 43,941 14,381 274,684FY2003 1st. Half (11,762) 1,957 258,913FY2003 92,379 (52,794) 272,231
(4) Scope of Consolidation and Equity Method Consolidated subsidiaries 53 companies Non-consolidated subsidiaries accounted for Affiliates accounted for by the equity method 11 companies by the equity method None
(5) Changes in Scope of Consolidation and Equity Method Consolidation (Addition) 0 companies Equity method (Addition) 0 companies (Exclusion) 2 companies (Exclusion) 1 company
2. FY2004 Consolidated Financial Forecast (April 1, 2004 through March 31, 2005)Net Sales Ordinary Income/(Loss) Net Income/(Loss)
million yen million yen million yen
Full YearReference: Net income per share for the full year 30.40 yen
The financial projection is the judgment of our management based on the information presently available. By nature, such financial projection is subject to uncertainty and a risk. Therefore, we advise against making an investment decision by solely relying on this projection. Variables that couldaffect the actual financial results include, but are not limited to, economic environments related to our business areas and fluctuations in yen-to-dollar and other exchange rates. For further information on the above financial projection, please refer to page 6 of Supplementary Information.
2,710,000 74,000 37,000
240,923205,543222,605
(57,916)(10,027)(43,251)

1. Mazda Group of CompaniesMazda group of companies consists of Mazda Motor Corporation, 53 consolidated subsidiaries and 11 equity method-appliedcompanies and is mainly engaged in the manufacturing and sales of automobiles and automotive parts as well as in otherautomobile-related businesses.
In Japan, Mazda Motor Corporation manufactures automobiles. Mazda Motor Corporation, Kurashiki Kako Co., Ltdand other companies manufacture automotive parts. In overseas, AutoAlliance International, Inc. and other companiesmanufacture automobiles and automotive parts. The automobiles and automotive parts manufactured by our group of companies are sold to customers by our sales companies. In Japan, Mazda Autozam, Inc., Kanto Mazda Co., Ltd.and other companies sell our automobiles and automotive parts to customers. To certain corporate customers, Mazda Motor Corporation directly sells our automobiles. In overseas, Mazda Motor of America, Inc., Mazda Motors (Deutschland) GmbH and other companies sell our automobiles and automotive parts to customers.
In addition, Mazda Motor Corporation, having an equity relationship with Ford Motor Company, has expanded its relationshipwith Ford to a strategic cooperative relationship on a global scale.
The following diagram approximately illustrates the roles of Mazda Motor Corporation and its main related companies in conducting the group's business:
Customers
Other Related Companies Overseas Sales Companies○ Mazda Autozam, Inc. ○ Mazda Motor of America, Inc.○ Kanto Mazda Co., Ltd. ○ Mazda Canada, Inc.○ Tokai Mazda Hanbai Co., Ltd. ○ Mazda Motors (Deutschland) GmbH○ Kansai Mazda Co., Ltd. ○ Mazda Motor Logistics Europe N.V.○ Kyusyu Mazda Co., Ltd. ○ Mazda Australia Pty. Ltd. and others and others
Mazda Motor Corporation
Other Automobile-Related Business Overseas Automobile Manufacturers Companies ☆ AutoAlliance International, Inc.○ MALOX Co., Ltd. ☆ AutoAlliance (Thailand) Co., Ltd.○ Mazda Butsuryu Co., Ltd. ○ Compania Colombiana Automotriz S.A.○ Mazda Engineering and Technology Co., Ltd. and others
Domestic Automotive Parts Manufacturers○ Kurashiki Kako Co., Ltd.○ Microtechno Corp.☆ Japan Climate Systems Corp. and others ○ Consolidated subsidiaries ☆ Companies accounted for Flows of automobiles and automotive parts
by equity method Flows of services
Note: None of the consolidated subsidiaries is listed at a stock exchange in Japan.
Domestic Sales Companies
Supplementary Information
Ford Motor Company
- 1 -
- 2 -
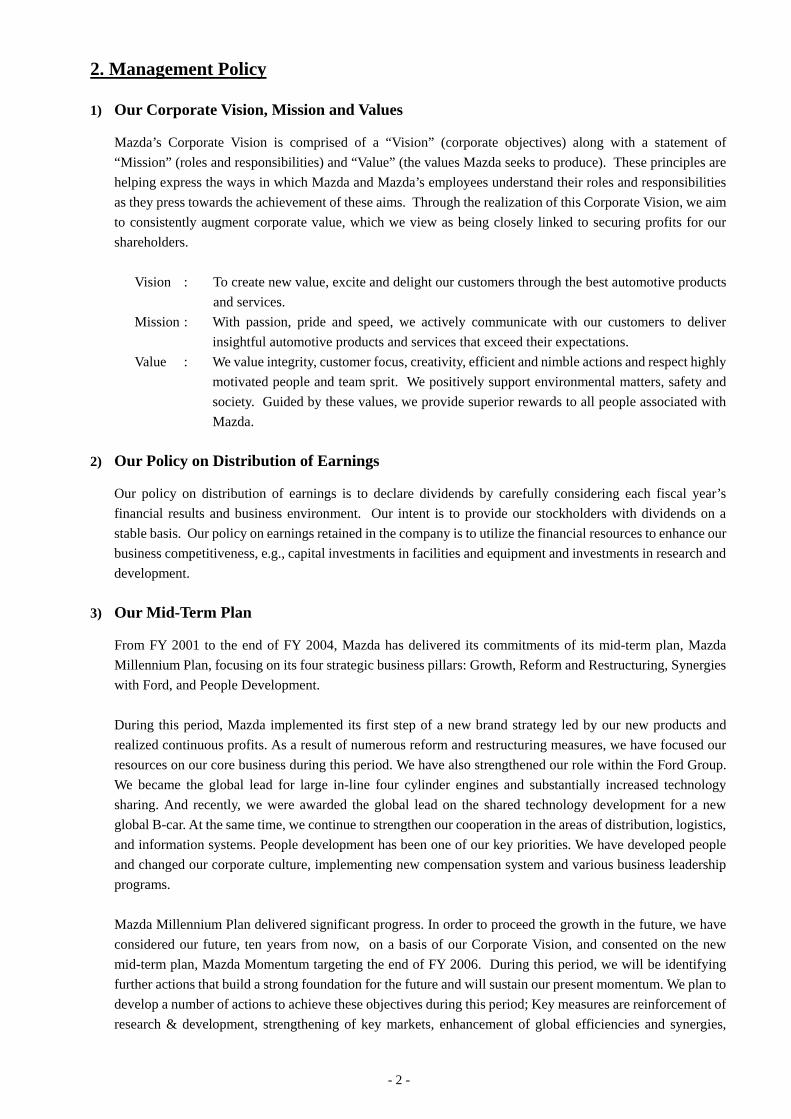
2. Management Policy 1) Our Corporate Vision, Mission and Values
Mazda’s Corporate Vision is comprised of a “Vision” (corporate objectives) along with a statement of “Mission” (roles and responsibilities) and “Value” (the values Mazda seeks to produce). These principles are helping express the ways in which Mazda and Mazda’s employees understand their roles and responsibilities as they press towards the achievement of these aims. Through the realization of this Corporate Vision, we aim to consistently augment corporate value, which we view as being closely linked to securing profits for our shareholders. Vision : To create new value, excite and delight our customers through the best automotive products
and services. Mission : With passion, pride and speed, we actively communicate with our customers to deliver
insightful automotive products and services that exceed their expectations. Value : We value integrity, customer focus, creativity, efficient and nimble actions and respect highly
motivated people and team sprit. We positively support environmental matters, safety and society. Guided by these values, we provide superior rewards to all people associated with Mazda.
2) Our Policy on Distribution of Earnings
Our policy on distribution of earnings is to declare dividends by carefully considering each fiscal year’s financial results and business environment. Our intent is to provide our stockholders with dividends on a stable basis. Our policy on earnings retained in the company is to utilize the financial resources to enhance our business competitiveness, e.g., capital investments in facilities and equipment and investments in research and development.
3) Our Mid-Term Plan
From FY 2001 to the end of FY 2004, Mazda has delivered its commitments of its mid-term plan, Mazda Millennium Plan, focusing on its four strategic business pillars: Growth, Reform and Restructuring, Synergies with Ford, and People Development. During this period, Mazda implemented its first step of a new brand strategy led by our new products and realized continuous profits. As a result of numerous reform and restructuring measures, we have focused our resources on our core business during this period. We have also strengthened our role within the Ford Group. We became the global lead for large in-line four cylinder engines and substantially increased technology sharing. And recently, we were awarded the global lead on the shared technology development for a new global B-car. At the same time, we continue to strengthen our cooperation in the areas of distribution, logistics, and information systems. People development has been one of our key priorities. We have developed people and changed our corporate culture, implementing new compensation system and various business leadership programs. Mazda Millennium Plan delivered significant progress. In order to proceed the growth in the future, we have considered our future, ten years from now, on a basis of our Corporate Vision, and consented on the new mid-term plan, Mazda Momentum targeting the end of FY 2006. During this period, we will be identifying further actions that build a strong foundation for the future and will sustain our present momentum. We plan to develop a number of actions to achieve these objectives during this period; Key measures are reinforcement of research & development, strengthening of key markets, enhancement of global efficiencies and synergies,

- 3 -
and leverage of human resources. Mazda has enjoyed a unique heritage as a company with strong engineering prowess. We want to build on that strength by increasing our investment in research and development spending in key areas such as environmental preservation, safety, and information technology. We will provide the funding necessary to continue the expansion of our product line-up. In order to strengthen key markets, we will launch market-focused models and strengthen distribution networks globally. And will work to exceed customer expectations with our products and services in each market. Our objective in the area of global efficiencies is to build our R&D, manufacturing, purchasing, and logistics activities globally competitive on quality and cost. We will improve efficiencies globally through enhancement of global sourcing, enhancement of cost innovation by implementation of ABC Phase 2, focused on commodity cycle plans and an enhancement of supply chain management. The ongoing development of our employees will continue to be a key enabler for success. We plan to strengthen our management capability, develop people globally, and provide an environment that values individuals and fosters creativity. All of this will allow us to maximize the contribution of our Human Resources and create an energetic Mazda. The financial objectives during Mazda Momentum, which targeted by the end of FY 2006 are as follows. Consolidated wholesales 1.25 million units Operating Profit Over 100 Billion Yen Net Debt/Equity Ratio Below 100%
4) Our Challenges
The near-term external environment is expected to remain difficult in Japan and globally. Although the global economic outlook is starting to improve, it faces many worries; rapid fluctuation of currency and price increase of oil price, for example, will make it difficult for export-oriented countries and companies to recover. The -automotive industry is likely to remain intensely competitive, as the major manufacturers continue to offer various marketing incentives and introduce a variety of new models. Operating in a tough environment against world-class competitors, Mazda remains confident in its ability to drive the company forward with sustained profitable growth by executing the measures of Mazda Momentum.
5) Basic Philosophy of Corporate Governance and Implementation of Related Measures
Mazda is aware that the enrichment of corporate governance is one of the most important tasks for management and is actively implementing various measures to this end. In addition to bodies prescribed by law such as the general meeting of stockholders, the board of directors and the board of corporate auditors, an executive committee has been established. Executive committee meetings are held to propose and debate important company-wide policies and measures and to report on information necessary for business management. Other advisory bodies that assist the president with decision-making have also been established. The company has introduced the executive officer system. By promoting the separation of execution and management, the effectiveness of the board of directors as a supervisory body has been enhanced. Debate by

- 4 -
the board has been enhanced, and by delegating authority to the executive officer level, decision-making has been speeded up. In these ways we are working to further improve management efficiency. The company has also established a Management Advisory Committee composed of outside notable figures and Mazda’s directors. The committee meets four times a year. The company gets a wide range of opinions from a broad, global perspective from the committee members, who possess unsurpassed specialized knowledge and insight in their fields of expertise. Their opinions will be reflected in Mazda’s management and enhance transparency. With regard to a risk management system, in January 2002 the company established the Risk Management Office as a company-wide administrative department. Under the action guideline “Each officer and employee shall take initiative,” the company has established a Risk Management Committee and risk management regulations and phased in company-wide risk management activities. By appropriately managing various internal and external risks, including enhancing information management and disaster-prevention measures such as those for large-scale earthquakes, the company is ensuring its continued stable growth. The company has made compliance with laws and regulations an important policy. In addition to the Mazda Corporate Ethics Code of Conduct, a compliance manual has been distributed to all officers and employees. The company informs all officers and employees of the importance of and need for compliance with laws and corporate ethics by holding annual seminars on topics such as corporate ethics and human rights. By avoiding holding the general meeting of shareholders on the same day as other companies, and by making timely disclosures to shareholders and investors, and by engaging in IR activities such as enhancing the IR website, Mazda will continue to actively implement various measures to enhance corporate governance. At present, two of the company’s five auditors are outside auditors. There are no business dealings or other interests between the company and these auditors.
3. Financial Results, Position and Projection
1) Financial Results and Position
During the first half of FY2004, private consumption continued to grow and showed signs of recovery mildly with the expansion of export and production, and improvement in corporate profitability in Japanese economy although employment situation remained severe and future economy is ambiguous due to political uncertainty and sharp increase in oil price. In the U.S., we cannot be optimistic about the economy, however, economic index such as private consumption, housing investment and capital investment have all remained favorable. In Europe and other major markets, the economy began showing signs of recovery. However, Chinese economy started to slow down due to the effect of recent financial restraints. Automotive sales in Japan, including micro vehicles, totaled to 2.70 million units, down 1.5% from the prior year. Although micro vehicle market expanded substantially, it was offset by substantial decrease in registered vehicle. In the U.S., industry sales were 8.82 million units (April to September, 2004), up 0.3% from the previous year, while sales in Europe were 8.94 million units, up 2.1% (April to September, 2004). Under such circumstances, Mazda made solid results thanks to the product-led growth strategy continued from previous fiscal year. Mazda Axela (Mazda3), launched in last autumn, won many international automotive prizes including 2nd

- 5 -
place of European Car of the Year and continues to deliver great results in European and North American markets. Hofu Plant, where Axela is produced, has run at full production capacity in response to high market demand, and more than 300,000 units/year production by one carline is expected. In June, Mazda Verisa was launched in Japan. The product responds to the needs of wide range of customers who have various values and lifestyles. It is available only in Japanese market, and the sales after launch has been favorable. Mazda launched new “Titan”, commercial vehicle, in June and new “Carol” in September. Also, MPV was upgraded, and limited edition models on RX-8, Demio and Atenza were introduced. In addition to the above, the RENESIS engine, equipped on RX-8 as was voted a category winner in the “International Engine of the Year 2004” by a panel of 56 senior motoring journalists from 24 countries. In 2003, RENESIS won the top prize in the annual competition. As a part of production enhancement to support our product-led growth, in May 2004 Mazda re-opened Ujina Plant No.2, which had been closed for 2 years and 8 months. The production line was renewed for significant increase in production capacity based on the following concepts: “Environmentally and People Friendly Production Line”, “High Quality Concurrent Production Line” and “Flexible Production Line”, and it will be the symbol of a state-of-the-art, highly-efficient, flexible concurrent production site. Together with this re-opening, production of BU vehicles at paint shop and final assembly line of Hiroshima Plant No.1 was finished in April 2004. As for activity for sales side, Mazda is promoting enforcement of sales network. In the U.S., Mazda is proceeding to increase exclusive dealers and strengthening dealer sales. The dealer exclusivity at the end of 1st half of this fiscal year was 29%, which is on track to achieve the target. We will target the exclusivity of 50% by the end of 2006. In Europe, Mazda established new direct distribution points in Sweden and Norway. For cost reduction initiative, Mazda continues to execute its strategic initiative called "Achieve Best Cost" known as "ABC", which is a commodity-focused process for achieving 25 percent cost reductions by the end of FY2004.
Turning to Mazda’s performance in the first half of this fiscal year, retail volume in the Japanese market totaled 135,000 units, up 0.7% compared with the same period of the prior fiscal year. Total share, including micro-mini vehicles, was 5.0%, up 0.1 points from the same period of the last year. Mazda’s retail volumes and market shares in the major overseas markets were as follows. In the U.S., Mazda’s retail volume totaled 140,000 units, down 2.9% from the first half of the last year. Market share was 1.6%, unchanged. In Europe, retail volume was up 20.0% to 143,000 units, and market share was up 0.2 points to 1.6%. Consolidated wholesales in the first half of this fiscal year totaled 530,000 units, an increase of 4,000 units or 0.7% from the same period a year ago. Turning to financial results, on a consolidated basis, sales revenue was ¥1,320.6 billion, an increase of ¥111.1 billion or 9.2% year-over-year. Operating income was ¥43.5 billion, up ¥15.1 billion or 53.1%. This significantly improved performance reflected higher sales revenue primarily due to the impacts of the Mazda3/Axela and other new models, as well as cost reductions in various areas of Mazda’s business. Ordinary income was ¥36.9 billion, up ¥17.9 billion or 94.4%. Net income was ¥18.7 billion, up ¥7.5 billion or 68.0%.

- 6 -
Consolidated cash flow (operating and investing activities) was negative ¥14.0 billion. Though net cash provided by operating activities was ¥43.9 billion, net cash used in investing activities amounted to ¥57.9 billion due to the termination of the real estate trust contract concluded in 1999 in addition to investments in production facilities and equipment. Also, financing cash flow was ¥14.4 billion. Net debt (gross debt less cash and cash equivalents) was ¥363.3 billion, ¥5.2 billion higher than at March 31, 2004. Gross debt was ¥638.0 billion, up ¥7.6 billion from the prior year-end. Mazda’s financing activities in this first half included ¥80 billion long-term syndicated bank borrowing, ¥40 billion each in July and August of 2004. No interim dividends will be declared for the first half of FY2004. We offer sincere apologies to our shareholders, and we ask for their understanding in this matter.
2) Financial Projection
Our projection for fiscal year 2004 (the year to end March 31, 2005) is as follows:
Consolidated
Wholesales 1,130 thousand units (up 5.0% by 12-month comparison)
Sales revenue 2,710.0 billion yen (up 5.3% by 12-month comparison)
Ordinary income 74.0 billion yen (up 27.5% compared to the prior year)
Net income 37.0 billion yen (up 9.1% compared to the prior year)
Unconsolidated Wholesales 1,030 thousand units (up 15.3% compared to the prior year)
Sales revenue 1,930.0 billion yen (up 16.1% compared to the prior year)
Ordinary income 24.0 billion yen (up 100.7% compared to the prior year)
Net income 8.0 billion yen (up 162.2% compared to the prior year)
Cautionary Statement with Respect to Forward-Looking Statements
Information included in this material with respect to Mazda’s current plans, estimates, strategies and beliefs and other statements that are not historical facts are forward-looking statements about the future performance of Mazda. Mazda cautions you that a number of important risks and uncertainties could cause actual results to differ materially from those discussed in the forward-looking statements. Therefore, you should not place undue reliance on them. Also, you should not rely on any obligation of Mazda to update or revise any forward-looking statements, whether as a result of new information, future events or otherwise. Mazda disclaims any such obligation. Risks and uncertainties that might affect Mazda include, but are not limited to:
1) the global economic environment related to Mazda’s business; 2) exchange rates, particularly between the yen and the U.S. dollar and euro; 3) the success of Mazda’s joint ventures and alliances; 4) environmental and other public regulations; and 5) reliance on certain raw materials and suppliers.

4. Consolidated Financial Statements
(1) Consolidated Statement of Income
Six months ended September 30, 2004 With comparative figures for the six months ended September 30, 2003 and for the fiscal year ended March 31, 2004
(in millions of yen)FY2004 1st. Half FY2003 1st. Half Increase/ FY2003
(Apr. 2004 - Sep. 2004) (Apr. 2003 - Sep. 2003) (Decrease) (Apr. 2003 - Mar. 2004)
Net sales 1 1,320,559 1,209,497 111,062 2,916,130
Costs of sales 2 963,438 888,651 74,787 2,165,160
Gross profit on sales 3 357,121 320,846 36,275 750,970
Selling, general and administrative expenses 4 313,600 292,414 21,186 680,796
Operating income 5 43,521 28,432 15,089 70,174Non-operating income
Interest and dividend income 6 1,437 882 555 2,517Equity in net income of unconsolidated subsidiaries and affiliates 7 4,789 4,138 651 9,199Other 8 2,581 2,737 (156) 4,887
Total 9 8,807 7,757 1,050 16,603
Non-operating expenses
Interest expense 10 7,394 8,641 (1,247) 18,299Other 11 7,989 8,541 (552) 10,449
Total 12 15,383 17,182 (1,799) 28,748
Ordinary income 13 36,945 19,007 17,938 58,029
Extraordinary profitsProfit on sale of tangible fixed assets 14 212 892 (680) 3,682Profit on sale of investment securities 15 1 608 (607) 672Compensation received for the exercise of eminent domain 16 1,415 - 1,415 -Other 17 - 4 (4) 248
Total 18 1,628 1,504 124 4,602Extraordinary losses
Loss on retirement and sale of tangible fixed assets 19 2,328 1,815 513 4,672Loss on sale of investment securities 20 414 55 359 780Valuation loss on investment securities 21 - 42 (42) 44Valuation loss on investments 22 - 2,788 (2,788) 2,788Loss on liquidation of a Tokumei Kumiai 23 2,242 - 2,242 -Other 24 40 411 (371) 275
Total 25 5,024 5,111 (87) 8,559
Income before income taxes 26 33,549 15,400 18,149 54,072
Income taxesCurrent 27 5,159 5,277 (118) 13,105Deferred 28 8,670 (2,741) 11,411 4,563
Minority interests of consolidated subsidiaries 29 988 1,714 (726) 2,503
Net income 30 18,732 11,150 7,582 33,901
- 7 -

(2) Consolidated Balance Sheet
September 30, 2004 With comparative figures for March 31, 2004 and for September 30, 2003
(in millions of yen)FY2004 1st. Half FY2003 Increase/ FY2003 1st. Half(September 30, 2004) (March 31, 2004) (Decrease) (September 30, 2003)
ASSETS
Current Assets:
Cash and time deposits 1 274,775 282,333 (7,558) 257,311Trade notes and accounts receivable 2 136,474 145,829 (9,355) 133,883Inventories 3 273,419 268,317 5,102 274,997Deferred taxes 4 72,778 74,412 (1,634) 82,355Other 5 62,800 57,026 5,774 66,931Allowance for doubtful receivables 6 (6,542) (8,190) 1,648 (6,558)
Total current assets 7 813,704 819,727 (6,023) 808,919
Fixed Assets:
Tangible fixed assets:Buildings and structures 8 147,482 144,533 2,949 145,282Machinery and vehicles 9 154,042 151,939 2,103 152,912Land 10 454,004 432,278 21,726 435,683Construction in progress 11 27,318 19,180 8,138 15,196Other 12 29,636 37,989 (8,353) 36,966
Total tangible fixed assets 13 812,482 785,919 26,563 786,039
Intangible fixed assets: 14 22,177 21,099 1,078 19,485
Investments and other fixed assets:Investment securities 15 58,297 50,933 7,364 46,460Long-term loans receivable 16 9,802 15,937 (6,135) 18,848Deferred taxes 17 87,716 93,953 (6,237) 96,285Other 18 22,394 21,113 1,281 23,840Allowance for doubtful receivables 19 (11,798) (12,380) 582 (17,181)Investment valuation allowance 20 (793) (731) (62) (776)
Total investments and other fixed assets 21 165,618 168,825 (3,207) 167,476
Total fixed assets 22 1,000,277 975,843 24,434 973,000
Deferred assets 23 1 3 (2) 4
Total Assets 24 1,813,982 1,795,573 18,409 1,781,923
- 8 -

(in millions of yen)FY2004 1st. Half FY2003 Increase/ FY2003 1st. Half(September 30, 2004) (March 31, 2004) (Decrease) (September 30, 2003)
LIABILITIES
Current Liabilities:
Trade notes and accounts payable 1 292,102 284,536 7,566 265,773Short-term loans payable 2 143,578 186,880 (43,302) 222,365Long-term loans payable due within one year 3 87,002 52,422 34,580 73,906Bonds due within one year 4 80,400 67,600 12,800 20,100Other accounts payable 5 83,485 107,747 (24,262) 103,883Accrued expenses 6 167,384 155,022 12,362 141,946Reserve for warranty expenses 7 23,229 22,507 722 20,824Reserve for loss on business restructuring 8 - 2,329 (2,329) 2,310Other 9 60,201 59,573 628 54,224
Total current liabilities 10 937,381 938,616 (1,235) 905,331
Fixed Liabilities:
Bonds 11 40,500 70,200 (29,700) 100,400Bonds with stock acquisition rights 12 59,996 60,000 (4) 60,000Long-term loans payable 13 226,536 193,258 33,278 210,237Deferred tax liability related to land revaluation 14 90,896 91,113 (217) 91,396Employees' and executive officers' severance and retirement benefits 15 197,663 198,253 (590) 190,652Directors' and corporate auditors' retirement benefits 16 1,369 1,397 (28) 1,302Other 17 11,735 11,799 (64) 9,011
Total fixed liabilities 18 628,695 626,020 2,675 662,998
Total Liabilities 19 1,566,076 1,564,636 1,440 1,568,329
Minority Interests in Consolidated Subsidiaries 20 6,983 8,332 (1,349) 8,051
SHAREHOLDERS' EQUITYCommon stock 21 120,080 120,078 2 120,078Capital surplus 22 104,219 104,217 2 104,217
Retained earnings/(deficit) 23 (61,634) (78,220) 16,586 (100,958)Land revaluation 24 131,151 131,470 (319) 131,865
Net unrealized gain/(loss) on available-for-sale securities 25 314 428 (114) 112
Foreign currency translation adjustments 26 (51,743) (53,913) 2,170 (48,276)
Treasury stock 27 (1,464) (1,455) (9) (1,495)
Total shareholders' equity 28 240,923 222,605 18,318 205,543
Total Liabilities, Minority Interests and Shareholders' Equity 29 1,813,982 1,795,573 18,409 1,781,923
- 9 -

(3) Consolidated Statement of Capital Surplus and Retained Earnings
Six months ended September 30, 2004 With comparative figures for the six months ended September 30, 2003 and for the fiscal year ended March 31, 2004
(in millions of yen)FY2004 1st. Half FY2003 1st. Half FY2003
(Apr. 2004 - Sep. 2004) (Apr. 2003 - Sep. 2003) (Apr. 2003 - Mar. 2004)
CAPITAL SURPLUS
Balance at the beginning of the period 1 104,217 104,217 104,217
Increases due to:
Issuance of new stocks by the exercise of stock acquisition rights 2 2 - -
Decreases 3 - - -
Balance at the end of the period 4 104,219 104,217 104,217
RETAINED EARNINGSBalance at the beginning of the period 5 (78,220) (107,742) (107,742)Increases due to:
Net income 6 18,732 11,150 33,901Reversal of land revaluation 7 319 - -
Decreases due to:Dividends 8 2,434 2,438 2,438Reversal of land revaluation 9 - 1,928 1,533Exclusion of consolidated subsidiaries and
companies accounted for by the equity method 10 31 - 408Balance at the end of the period 11 (61,634) (100,958) (78,220)
- 10 -

(4) Consolidated Statement of Cash Flows Six months ended September 30, 2004 With comparative figures for the six months ended September 30, 2003 and for the fiscal year ended March 31, 2004
(in millions of yen)FY2004 1st. Half FY2003 1st. Half FY2003
(Apr. 2004 - Sep. 2004) (Apr. 2003 - Sep. 2003) (Apr. 2003 - Mar. 2004)Cash flows from operating activities:
Income before income taxes 1 33,549 15,400 54,072Adjustments to reconcile income before income taxes to net cash provided by/(used in) operating activities:
Depreciation and amortization 2 18,739 18,020 37,900Allowance for doubtful receivables 3 (406) (312) 1,620Investment valuation allowance 4 95 (36) (81)Reserve for warranty expenses 5 695 2,347 4,077Employees' and executive officers' severance and retirement benefits 6 (590) 7,752 15,353Interest and dividend income 7 (1,437) (882) (2,517)Interest expense 8 7,394 8,641 18,299Equity in net income of unconsolidated subsidiaries and affiliates 9 (4,789) (4,138) (9,199)Loss/(gain) on sale of fixed assets 10 703 923 990Loss/(gain) on sale of investment securities 11 413 (553) 108Changes in trade notes and accounts receivable 12 11,613 4,683 (10,616)Changes in inventories 13 5,372 (25,523) (37,113)Changes in trade notes and accounts payable 14 (1,110) 15,949 50,766Changes in other current liabilities 15 (13,089) (35,507) (10,560)Other 16 615 (5,072) 1,658 Subtotal 17 57,767 1,692 114,757
Interest and dividends received 18 1,806 1,266 2,862Interest paid 19 (7,338) (8,847) (18,216)Income taxes paid 20 (8,294) (5,873) (7,024)
Net cash provided by/(used in) operating activities 21 43,941 (11,762) 92,379
Cash flows from investing activities:Purchase of investment securities 22 (5,351) (657) (1,527)Sale of investment securities 23 134 421 1,174Acquisition of investment in subsidiaries affecting scope of consolidation 24 - (760) (760)Sale of investment in subsidiaries affecting scope of consolidation 25 (595) - -Acquisition of tangible fixed assets 26 (61,019) (16,728) (41,130)Proceeds from sale of tangible fixed assets 27 2,940 4,810 14,730Changes in short-term loans receivable 28 672 (140) (871)Long-term loans made 29 (63) (48) (821)Collections of long-term loans receivable 30 2,869 610 750Other 31 2,497 2,465 (14,796)
Net cash used in investing activities 32 (57,916) (10,027) (43,251)
Cash flows from financing activities:Changes in short-term loans payable 33 (13,717) 4,522 (29,002)Proceeds from long-term loans payable 34 84,051 53,503 79,743Repayment of long-term loans payable 35 (36,311) (37,521) (102,171)Proceeds from issuance of bonds 36 600 20,000 40,000Redemption of bonds 37 (17,500) (34,946) (37,646)Cash dividends paid 38 (2,434) (2,438) (2,438)Other 39 (308) (1,163) (1,280)
Net cash provided by/(used in) financing activities 40 14,381 1,957 (52,794)
Effect of exchange rate fluctuations on cash and cash equivalents 41 2,047 4,023 1,175Net increase/(decrease) in cash and cash equivalents 42 2,453 (15,809) (2,491)Cash and cash equivalents at beginning of the period 43 272,231 274,722 274,722
Cash and cash equivalents at end of the period 44 274,684 258,913 272,231
- 11 -

- 12 -
Notes to Consolidated Financial Statements 1. Consolidation Scope and Application of Equity Method
1) Consolidated Subsidiaries 53 Overseas 16 Mazda Motor of America, Inc., Mazda Motors (Deutchland) GmbH and 14 others Domestic 37 18 dealers and 19 others 2) Equity Method-Applied Companies 11 Overseas 2 AutoAlliance International, Inc., and AutoAlliance (Thailand) Co., Ltd. Domestic 9 2 dealers, 3 automotive parts sales companies and 4 others
2. Changes in Consolidation Scope and Application of Equity Method 1) Consolidated Subsidiaries
Excluded: 2 Domestic 2 Mazda Car Rental Corporation (sold) and Auto Atelier Corporation (Liquidated) 2) Equity Method-Applied Companies Excluded: 1
Domestic 1 Enfini Hiroshima Co., Ltd. (sold)
3. Accounting Periods of Consolidated Subsidiaries The first-half consolidated balance sheet date is September 30. Among the consolidated subsidiaries, 3 companies, i.e., Compania Colombiana Automotriz S.A., Mazda Motors of New Zealand Limited, and Mazda Sales (Thailand) Co., Ltd., have a first-half balance sheet date different from the first-half consolidated balance sheet date, all of which are June 30.
In preparing the first half consolidated financial statements, the financial statements of each of these companies were used. However, adjustments necessary in consolidation were made for material transactions that occurred between the first-half balance sheet dates of the above subsidiaries and the first-half consolidated balance sheet date.
4. Accounting Policies 1) Valuation Standards and Methods of Significant Assets
a) Securities Available-for-sale securities With available fair value: Recorded at fair value estimated based on quoted market prices on the
balance sheet date, with unrealized gains and losses excluded from income and reported in a separate component of shareholders’ equity net of tax. The bases of cost are on a historical cost basis mainly based on a moving average method.
Without available fair value: Recorded at cost on a historical cost basis mainly on a moving average method
b) Derivative instruments: Fair value method c) Inventories Mainly a historical cost basis based on an average method
2) Depreciation and Amortization Methods of Significant Fixed Assets
a) Tangible Fixed Assets Mainly straight-line method. Useful lives and residual values are estimated by a method equivalent to the provisions of the Japanese income tax law.
b) Intangible Fixed Assets Straight-line method with periods of useful life estimated by a method equivalent to the provisions of the Japanese income tax law. Software for internal use is amortized on a straight-line basis over the period of internal use, i.e., 5 years.

- 13 -
3) Standards for Recognition of Reserves a) Reserve for warranty expenses
Reserve for warranty expenses provides for after-sales expenses of products (vehicles). The amount is estimated per product warranty provisions and actual costs incurred in the past, taking future prospects into consideration.
b) Reserve for loss on business restructuring
Reserve for loss on business restructuring provides for losses related to the closure of a plant in accordance with Mazda’s business restructuring plan. An amount rationally estimated for such losses is recognized.
c) Employees’ and executive officers’ severance and retirement benefits
Employees’ and executive officers’ severance and retirement benefits provide for the costs of severance and retirement benefits to employees and executive officers. For employees’ severance and retirement benefits, the amount estimated to have been incurred as of the end of the current first half is recognized based on the estimated amount of liabilities for severance and retirement benefits and the estimated fair value of the pension plan assets at the end of the current fiscal year. The recognition of prior service cost is deferred on a straight-line basis over a period equal to or less than the average remaining service period of employees at the time such cost is incurred (mainly 12 years). The recognition of actuarial differences is also deferred on a straight-line basis over a period equal to or less than the average remaining service period of employees at the time such gains or losses are realized (mainly 13 years). The amortization of net gains or losses starts from the fiscal year immediately following the year in which such gains or losses are realized. For executive officers’ retirement benefits, the liability is provided for the amount that would be required by the internal corporate policy if all the eligible executive officers retired at the balance sheet date. (Additional Information) In connection with the enactment of the Japanese Welfare Pension Insurance Law, Mazda Motor Corporation (“the Company”) and certain domestic consolidated subsidiaries obtained the approval of exemption from the benefits related to future employee service under the substitutional portion from the Ministry of Health, Labor and Welfare on March 26, 2004. Estimated plan assets to be returned to the government at September 30, 2004 were 140,587 million yen. If the estimated plan assets had been returned to the government on September 30, 2004 and the transitional measurement of accounting standard for employees’ retirement benefits as stipulated in the Accounting Committee Report No. 13, Article 44-2 (the Japanese Institute of Certified Public Accountants) had been adopted, the effect of the adoption on the consolidated statement of income for the six months ended September 30, 2004 would have been to increase the extraordinary profits by 54,297 million yen.
d) Directors’ and corporate auditors’ retirement benefits Directors’ and corporate auditors’ retirement benefits provide for the payment of retirement benefits to directors and corporate auditors. The equivalent of the amount that would be required by the internal corporate policy if all the directors and corporate auditors retired at the end of this half-year period is recognized.
e) Allowance for doubtful receivables Allowance for doubtful receivables provides for the losses from bad debt. The amount estimated to be uncollectible is recognized. For receivables at an ordinary risk, the amount is estimated based on the past default ratio. For receivables at a high risk and receivables from debtors under bankruptcy proceedings, the amount is estimated based on the financial standing of the debtor.
f) Investment valuation allowance
Investment valuation allowance provides for losses from investments. The amount is estimated in light of the financial standings of the investee companies.
4) Accounting policies of foreign consolidated subsidiaries Among the foreign consolidated subsidiaries, Compania Colombiana Automotriz S.A. prepares its financial statements based on the accounting principles generally accepted in Colombia to reflect adjustments for the country’s inflationary economy and changing prices.

- 14 -
5) Foreign currency translation
Receivables and payables denominated in foreign currencies are translated into Japanese yen at the exchange rate on the half-year end; gains and losses in foreign currency translation are included in the income of the current period. Balance sheets of consolidated overseas subsidiaries are translated into Japanese yen at the rates on the half-year ends of the subsidiaries’ accounting periods except for shareholders’ equity accounts, which are translated at the historical rates. Income statements of consolidated overseas subsidiaries are translated at average rates of the subsidiaries’ half-year periods, with the translation differences prorated and included in the shareholders’ equity as foreign currency translation adjustments and minority interests.
6) Accounting for Leases
Lease transactions other than those finance leases with an unconditional title transfer clause are accounted for by the method equivalent to rental transactions.
7) Accounting for Hedging Activities
Full-deferral hedge accounting is mainly applied. Also, for certain interest swap contracts that are used as hedges and meet certain hedging criteria, the net amount to be paid or received under the interest swap contract is added to or deducted from the interest on the assets or liabilities for which the swap contract was executed.
8) Accounting for Consumption Taxes Tax-excluding method
5. Cash and Cash Equivalents in the Consolidated Statement of Cash Flows
Cash and cash equivalents consist of cash on hand, bank deposits that can be readily withdrawn, and short-term, highly liquid investments with maturities of three months or less at the time of acquisition that present insignificant risk of changes in value.
Additional Information
Synchronization of Fiscal Year-End of Overseas Consolidated Subsidiaries with Consolidated Fiscal Year-End
Through the year ended March 31, 2003, in consolidating the overseas subsidiaries, which had a year-end different from the consolidated year-end of March 31, the financial statements of each of these subsidiaries were used with adjustments necessary in consolidation for material transactions that occurred between the year-end of the above subsidiaries and the consolidated year-end. Commencing in the year ended March 31, 2004, however, in order to better administer and disclose consolidated financial results, the fiscal year-end of 13 consolidated overseas subsidiaries, including Mazda Motor of America, Inc., Mazda Canada, Inc., Mazda Motors (Deutschland) GmbH, and Mazda Australia Pty. Ltd., was changed to match the consolidated fiscal year-end of March 31. Accordingly, for those consolidated overseas subsidiaries that changed the fiscal year-end, the consolidated operating results for the six months ended September 30, 2003 consisted of six months of operations from January 1, 2003 to June 30, 2003, and the consolidated operating results for the six months ended September 30, 2004 consisted of six months of operations from April 1, 2004 to September 30, 2004.
Real Estate Trust Contract
In September of 1999, the Company entered into a real estate trust contract. The beneficial ownership of property was transferred to a Tokumei Kumiai, and the real estate was leased back to the Company. The real estate includes an educational facility, a research and development facility, distribution centers, and stores of domestic dealers. In September of 2004, however, the Company terminated the real estate trust contract and the lease contract of the real estate.
The loss expected to be incurred on the termination of the Tokumei Kumiai agreement, amounting to 2,242 million yen, was included in the extraordinary losses as the loss on liquidation of a Tokumei Kumiai in the statement of income for the six months ended September 30, 2004.
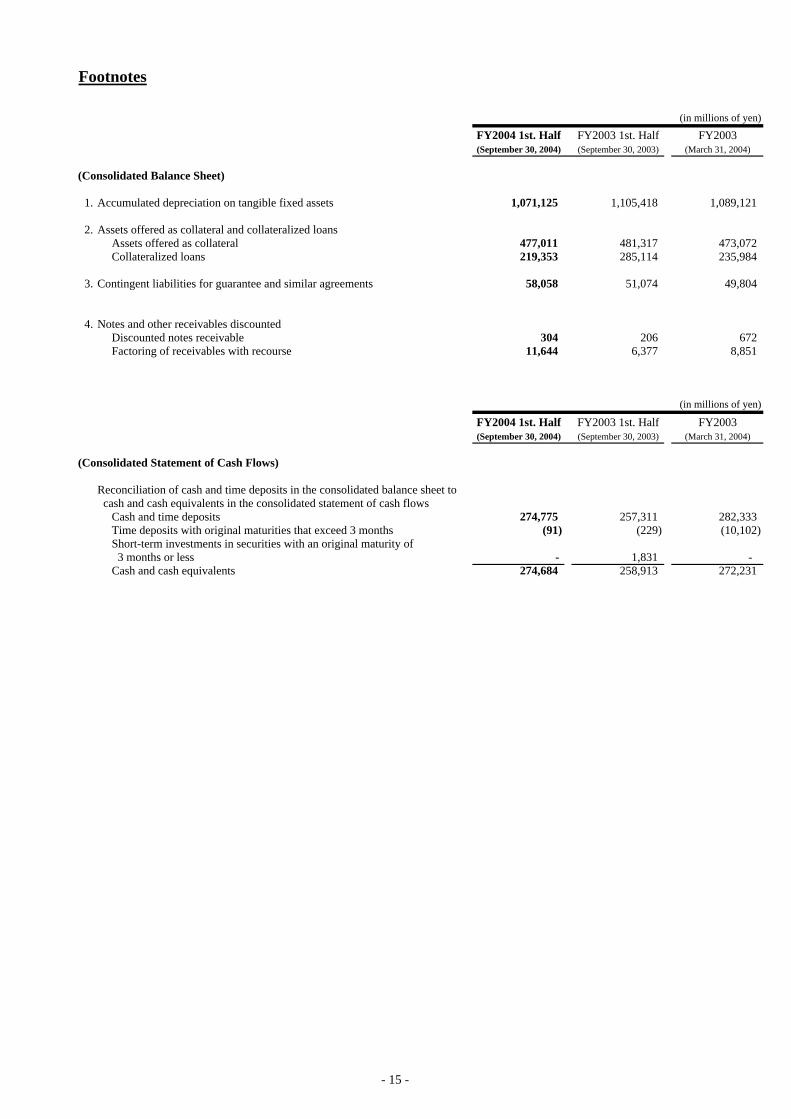
Footnotes
(in millions of yen)
FY2004 1st. Half FY2003 1st. Half FY2003(September 30, 2004) (September 30, 2003) (March 31, 2004)
(Consolidated Balance Sheet)
1. Accumulated depreciation on tangible fixed assets 1,071,125 1,105,418 1,089,121
2. Assets offered as collateral and collateralized loansAssets offered as collateral 477,011 481,317 473,072Collateralized loans 219,353 285,114 235,984
3. Contingent liabilities for guarantee and similar agreements 58,058 51,074 49,804
4. Notes and other receivables discountedDiscounted notes receivable 304 206 672Factoring of receivables with recourse 11,644 6,377 8,851
(in millions of yen)
FY2004 1st. Half FY2003 1st. Half FY2003(September 30, 2004) (September 30, 2003) (March 31, 2004)
(Consolidated Statement of Cash Flows)
Reconciliation of cash and time deposits in the consolidated balance sheet to cash and cash equivalents in the consolidated statement of cash flows
Cash and time deposits 274,775 257,311 282,333Time deposits with original maturities that exceed 3 months (91) (229) (10,102)Short-term investments in securities with an original maturity of 3 months or less - 1,831 - Cash and cash equivalents 274,684 258,913 272,231
- 15 -

Leases
(in millions of yen)
FY2004 1st. Half FY2003 1st. Half FY2003(Apr. 2004 - Sep. 2004) (Apr. 2003 - Sep. 2003) (Apr. 2003 - Mar. 2004)
1. Finance lease transactions other than those with an unconditional title transfer clause to lessee
(Lessees)1) Equivalent of acquisition costs 103,615 139,870 141,043 Equivalent of accumulated depreciation 58,745 81,561 87,191
Equivalent of net book value as of balance sheet date 44,870 58,309 53,852
2) Future minimum lease payments as of balance sheet date 46,803 61,968 56,392 (due within 1 year) (15,890) (23,071) (22,046)
3) Lease fees paid for this fiscal period 10,154 11,185 22,486 Equivalent of depreciation 8,802 9,309 18,505 Equivalent of interest 933 1,193 2,281
4) Depreciation of leased assets is calculated at 100% of acquisition costs or up to the contracted residual value for the assets, using the straight-line method over the lease term.
5) Interest included in lease fees is computed as a difference between total lease fees and acquisition costs of the leased assets. This amount is allocated to each fiscal period by interest method.
2. Operating lease transactions
(Lessees)Future minimum lease payments as of balance sheet date 22,477 61,254 47,437(due within 1 year) (7,583) (10,146) (31,115)
(Lessors)Future minimum lease payments to be received as of balance sheet date 22 39 33(due within 1 year) (10) (12) (11)
- 16 -

Fair Value Information of Securities
FY2004 First Half (As of September 30, 2004)
1. Available-for-sale securities that have a market value(in millions of yen)
Balance sheet UnrealizedAcquisition cost amount gain/loss
1) Equity securities 552 1,317 7652) Debt securities
Corporate bonds - - - Other 10 12 2
3) Other 173 173 - Total 735 1,502 767
2. Securities that are not valued at fair value(in millions of yen)
Balance sheet amountAvailable-for-sale securities Unlisted stocks (excluding those traded over-the-counter) 12,119
FY2003 First Half (As of September 30, 2003)
1. Available-for-sale securities that have a market value(in millions of yen)
Balance sheet UnrealizedAcquisition cost amount gain/loss
1) Equity securities 581 1,038 4572) Debt securities
Corporate bonds - - - Other 11 13 2
3) Other 1,956 1,956 - Total 2,548 3,007 459
2. Securities that are not valued at fair value(in millions of yen)
Balance sheet amountAvailable-for-sale securities Unlisted stocks (excluding those traded over-the-counter) 4,782
FY2003 (As of March 31, 2004)
1. Available-for-sale securities that have a market value(in millions of yen)
Balance sheet UnrealizedAcquisition cost amount gain/loss
1) Equity securities 563 1,562 9992) Debt securities
Corporate bonds - - - Other 10 11 1
3) Other 117 117 - Total 690 1,690 1,000
2. Securities that are not valued at fair value(in millions of yen)
Balance sheet amountAvailable-for-sale securities Unlisted stocks (excluding those traded over-the-counter) 8,959
- 17 -

Derivative Transactions
The following table summarizes fair value information of derivative transactions for which hedge accounting has not been applied:
1. Currency-related transactions(in millions of yen)
FY2004 First Half FY2003 First Half FY2003(September 30, 2004) (September 30, 2003) (March 31, 2004)
Forward foreign Contract Estimated Unrealized Contract Estimated Unrealized Contract Estimated Unrealized exchange contracts: amount fair value gain/(loss) amount fair value gain/(loss) amount fair value gain/(loss)Sell: U.S. dollar - - - 9,231 8,812 419 73 70 3 Canadian dollar 1,298 1,434 (136) 1,116 1,119 (3) 3,135 3,102 33 Australian dollar 1,531 1,552 (21) 1,904 1,956 (52) 355 375 (20) Euro 4,032 4,171 (139) 36,366 34,850 1,516 13,317 13,370 (53) British pound 4,674 4,749 (75) 5,329 5,174 155 8,662 9,080 (418) Swiss franc 439 460 (21) 3,309 3,141 168 764 773 (9)Buy: Thai Baht 3,161 3,183 22 2,766 2,771 5 2,788 2,785 (3) U.S. dollar 1,159 1,104 (55) - - - - - - Australian dollar - - - 2,215 2,311 96 - - -
Total 16,294 16,653 (425) 62,236 60,134 2,304 29,094 29,555 (467)
Notes: 1) Fair values at the end of each accounting period are estimated based on prevailing forward exchange rates at that date.2) Derivative contracts that are accounted for by hedge accounting are excluded.
- 18 -

Segment Information
1. Information by Industry Segment
The company and its consolidated subsidiaries are primarily engaged in the manufacture and sale of passenger and commercial vehicles. Net sales and operating income (loss) related to this industryhave exceeded 90% of the respective consolidated amounts. Accordingly, information by industrysegment is not shown.
2. Information by Geographic Area
(in millions of yen)FY2004 1st. Half North Other Elimination(Period ended Sep. 30, 2004) Japan America Europe areas Total or corporate ConsolidatedNet sales:
Outside Customers 560,048 361,594 314,617 84,300 1,320,559 - 1,320,559Inter-areas 485,587 6,071 8,757 7 500,422 (500,422) -
Total 1,045,635 367,665 323,374 84,307 1,820,981 (500,422) 1,320,559Operating expenses 1,012,468 365,353 318,910 80,954 1,777,685 (500,647) 1,277,038Operating income (loss) 33,167 2,312 4,464 3,353 43,296 225 43,521
(in millions of yen)FY2003 1st. Half North Other Elimination(Period ended Sep. 30, 2003) Japan America Europe areas Total or corporate ConsolidatedNet sales:
Outside Customers 557,923 356,594 221,874 73,106 1,209,497 - 1,209,497Inter-areas 360,214 2,954 3,905 17 367,090 (367,090) -
Total 918,137 359,548 225,779 73,123 1,576,587 (367,090) 1,209,497Operating expenses 883,647 368,012 220,457 70,480 1,542,596 (361,531) 1,181,065Operating income (loss) 34,490 (8,464) 5,322 2,643 33,991 (5,559) 28,432
(in millions of yen)FY2003 North Other Elimination(Year ended March 31, 2004) Japan America Europe areas Total or corporate ConsolidatedNet sales:
Outside Customers 1,156,939 922,672 651,462 185,057 2,916,130 - 2,916,130Inter-areas 758,096 10,387 15,635 284 784,402 (784,402) -
Total 1,915,035 933,059 667,097 185,341 3,700,532 (784,402) 2,916,130Operating expenses 1,867,697 933,652 656,648 178,034 3,636,031 (790,075) 2,845,956Operating income (loss) 47,338 (593) 10,449 7,307 64,501 5,673 70,174
Notes:1) Method of segmentation and principal countries or regions belonging to each segment
a) Method: Segmentation by geographic adjacencyb) Principal countries or regions belonging to each segment North America: U.S.A. and Canada Europe: Germany, Belgium, and England Other areas: Australia and Colombia
- 19 -
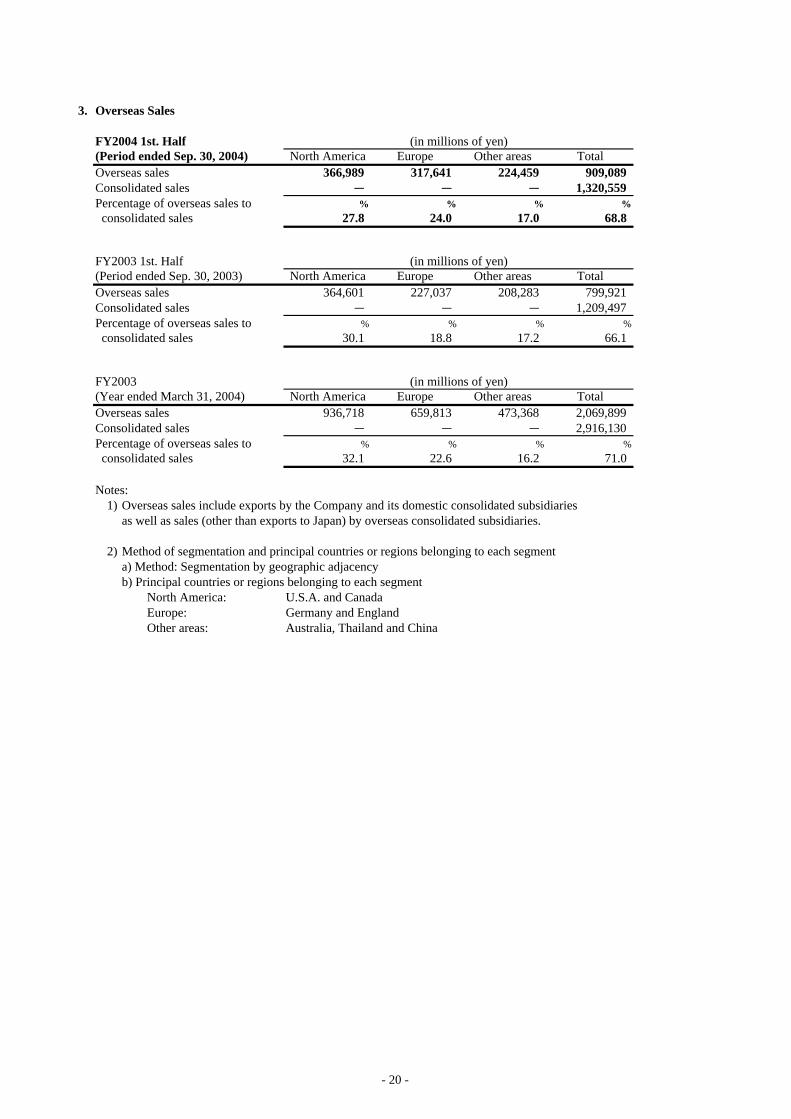
3. Overseas Sales
FY2004 1st. Half(Period ended Sep. 30, 2004) North America Europe Other areas TotalOverseas sales 366,989 317,641 224,459 909,089Consolidated sales - - - 1,320,559Percentage of overseas sales to % % % % consolidated sales 27.8 24.0 17.0 68.8
FY2003 1st. Half(Period ended Sep. 30, 2003) North America Europe Other areas TotalOverseas sales 364,601 227,037 208,283 799,921Consolidated sales - - - 1,209,497Percentage of overseas sales to % % % % consolidated sales 30.1 18.8 17.2 66.1
FY2003(Year ended March 31, 2004) North America Europe Other areas TotalOverseas sales 936,718 659,813 473,368 2,069,899Consolidated sales - - - 2,916,130Percentage of overseas sales to % % % % consolidated sales 32.1 22.6 16.2 71.0
Notes:1) Overseas sales include exports by the Company and its domestic consolidated subsidiaries
as well as sales (other than exports to Japan) by overseas consolidated subsidiaries.
2) Method of segmentation and principal countries or regions belonging to each segmenta) Method: Segmentation by geographic adjacencyb) Principal countries or regions belonging to each segment North America: U.S.A. and Canada Europe: Germany and England Other areas: Australia, Thailand and China
(in millions of yen)
(in millions of yen)
(in millions of yen)
- 20 -

5. Production and Sales Information
1. Production Volume
Type
units units units unitsPassenger cars 362,362 354,925 7,437 742,773
Trucks 28,627 35,071 (6,444) 68,560
Vehicles Total 390,989 389,996 993 811,333
Note: Production volume figures do not include those Mazda-brand vehicles produced by the following joint venture assembly plants with Ford (that are accounted for by the equity method):
Increase/ FY 2004 1st. Half FY 2003 1st. Half (Decrease) FY 2003
AutoAlliance International, Inc. 44,069 units 44,986 units (917) units 83,314 unitsAutoAlliance (Thailand) Co., Ltd. 16,754 13,949 2,805 30,652
2. Sales Volume and Revenue
TypeVolume Revenue Volume Revenue Volume Revenue Volume Revenue
units million yen units million yen units million yen units million yen 529,836 956,939 525,989 868,483 3,847 88,456 1,224,642 2,159,136
- 70,395 - 59,648 - 10,747 - 127,488
- 94,049 - 86,723 - 7,326 - 209,821
- 199,176 - 194,643 - 4,533 - 419,685 Total - 1,320,559 - 1,209,497 - 111,062 - 2,916,130
<Sales Volume by Market> Type
units units units unitsJapan 140,837 141,031 (194) 291,401
North America 156,948 160,844 (3,896) 406,956
Europe 143,099 123,967 19,132 311,090
Other 88,952 100,147 (11,195) 215,195
Overseas Total 388,999 384,958 4,041 933,241 Total 529,836 525,989 3,847 1,224,642
Parts
Other
FY 2004 1st. Half(Apr. 2004 to Sep. 2004)
FY 2004 1st. Half(Apr. 2004 to Sep. 2004)
Knockdown Parts (Overseas)
Vehicles
FY 2004 1st. Half FY 2003 1st. Half(Apr. 2004 to Sep. 2004)
FY 2003 1st. Half(Apr. 2003 to Sep. 2003)
(Apr. 2003 to Sep. 2003)
FY 2003 1st. Half(Apr. 2003 to Sep. 2003)
Increase/(Decrease)
Increase/(Decrease)
FY 2003(Apr. 2003 to Mar. 2004)
Increase/(Decrease)
FY 2003(Apr. 2003 to Mar. 2004)
FY 2003(Apr. 2003 to Mar. 2004)
- 21 -

FY2004 First Half Financial Summary (Consolidated) November 9, 2004Mazda Motor Corporation
(in 100 millions of yen) FY2003 1st. HF FY2003(in thousands of units) (Apr.03-Mar.04)
(upper left: ratio on sales)% % % % %
Domestic 1 4,096 0.8 4,115 0.5 8,462 3.4 8,600 1.6 8,500 0.4
Overseas 2 7,999 6.2 9,091 13.6 17,285 11.8 18,500 7.0 18,100 4.7
Subtotal 3 12,095 4.3 13,206 9.2 25,747 8.9 27,100 5.3 26,600 3.3
15 months effect of overseas 4 - - 3,414 - -
Net sales 5 12,095 4.3 13,206 9.2 29,161 23.3 27,100 (7.1) 26,600 (8.8)
2.4% 3.3% 2.4% 2.9% 2.6%Operating income 6 284 93.7 435 53.1 702 38.5 780 11.2 700 (0.2)
1.6% 2.8% 2.0% 2.7% 2.4%Ordinary income 7 190 106.7 369 94.4 580 42.5 740 27.5 650 12.0
1.3% 2.5% 1.9% 2.4% 2.1%Income before income taxes 8 154 116.0 335 117.9 541 92.2 660 22.1 550 1.7
0.9% 1.4% 1.2% 1.4% 1.3%Net income 9 112 100.0 187 68.0 339 40.5 370 9.1 340 0.3
Japan 10 345 332 473North America 11 (85) 23 (6)Europe 12 53 45 105Other 13 26 33 73
Operating profit changeVolume & mix 14 182 216 248Exchange rate 15 (26) (131) (285)Product enrichment 16 (218) (291) (291)Cost reduction 17 263 447 451Marketing expense 18 2 35 40Other 19 (52) (198) (165)
Total 20 151 78 (2)
Capital investment 23 157 278 456 670 600Depreciation and amortization 24 180 187 379 410 410R & D cost 25 420 491 878 950 950Total assets 26 17,819 18,140 17,956Net worth 27 2,055 2,409 2,226Financial debt 28 6,870 6,380 6,304Net financial debt 29 4,281 3,633 3,581Cash flow 30 (218) (140) 491
Sales increased Sales to increase by aProfits increased 12-month comparison at all levels Operating profit to be
record-high
Domestic 32 141 (1.0) 141 (0.1) 291 (0.8) 305 4.7 310 6.4
North America 33 161 (10.1) 157 (2.4) 327 (6.0) 345 5.5 385 17.7
Europe 34 124 36.2 143 15.4 258 28.3 290 12.5 287 11.4
Other 35 100 16.5 89 (11.2) 200 14.5 190 (5.0) 198 (1.0)
Overseas 36 385 8.1 389 1.0 785 8.5 825 5.1 870 10.9
subtotal 37 526 5.5 530 0.7 1,076 5.8 1,130 5.0 1,180 9.7
15 months effect of overseas 38 - - 149 - -
Wholesales 39 526 5.5 530 0.7 1,225 20.4 1,130 (7.7) 1,180 (3.6)
Number of Employees(full time employees) 40 36,167 35,827 35,627Note: FY2003 results include 15-month operations of major overseas subsidiaries that changed their fiscal year.
113 Yen/US$133 Yen/EUR117 Yen/US$131 Yen/EUR
FY2004
Projection (Apr.04-Mar.05)
107 Yen/US$
107 Yen/US$132 Yen/EUR
(Apr.03-Sep.03)
131 Yen/EUR118 Yen/US$
FY2004 1st. HF (Apr.04-Sep.04)
107 Yen/US$132 Yen/EUR
110 Yen/US$133 Yen/EUR
118 Yen/US$
Performance of operation 31
125 円/EUR
Operating income/(loss)by geographic area
134 Yen/EUR
Transaction rate
Average rate for the period 21
22132 Yen/EUR
FY2004
106 円/US$128 円/EUR
(Apr.04-Mar.05)Prior Projection
105 円/US$