for the quarter ended march 31, 2015
TRANSCRIPT

Investor Presentation
For the Quarter ended March 31, 2015
1

• Total operating income at Rs 19,864.2 mn
• Closing AUM at Rs 95.93 bn up 17.5% q-q.
• Net profit up by 20.1 % y-y at Rs 2713.2 mn
• ROA at 2.42% and Spread at 12.49%.
• EPS of Rs 3.22 per share
• NAV per share Rs 31.30
• High capital adequacy of 25.64%
2

CONSOLIDATED FINANCIAL HIGHLIGHTSRs in Million FY15 FY14 Y-Y
Closing AUM 95,935 81,631 17.5%
Interest income 19,682.5 20,759.6 -5.2%
Other Operating Income 181.8 245.1 -25.8%
Income from Operations 19,864.2 21,004.6 -5.4%
Finance expenses 8,774.1 10,266.0 -14.5%
Net interest income 11,090.1 10,738.6 3.3%
Employee expenses 3,145.4 3,235.5 -2.8%
Other operating expenses 3,596.8 3,717.9 -3.3%
Pre provision profit 4,347.9 3,785.3 14.9%
Provisions/Bad debts 281.2 468.7 -40.0%
Other Income 70.1 113.7 -38.4%
Profit before Tax 4,136.7 3,430.3 20.6%
Tax 1,422.0 1,170.4 21.5%
PAT before Minority Interest 2,714.8 2,259.8 20.1%
Minority Interest 1.6 0.0 100.0%
PAT for the year 2,713.2 2,259.8 20.1%3

Rs in Million FY 15 FY 14 Y-Y
Cash and Bank Balances 7,926.3 8,444.7 -6.1%
Investments 2,168.7 7,956.1 -72.7%
Loans and Advances 96,221.4 82,419.7 16.7%
Fixed Assets 1,736.5 2,018.6 -14.0%
Other Assets 8,109.8 7,545.6 7.5%
Total 116,162.7 108,384.6 7.2%
Capital 1,682.4 1,682.4 0.0%
Reserves & Surplus 24,645.6 23,235.0 6.1%
Borrowings 86,319.6 77,954.2 4.1%
Other Liabilities & Provisions 3,311.3 5,513.0 20.4%
Minority Interest 153.9 0.0 100.0%
Pref. Share Capital of Minority Interest 50.0 0.0 100.0%
Total 116,162.7 108,384.6 7.2%
CONSOLIDATED STATEMENT OF ASSETS & LIABILITIES
4

PAT & NET WORTH
324
440
764 806 696
Q4FY14 Q1FY15 Q2FY15 Q3FY15 Q4FY15
PAT (Rs mn)
24,918
25,358
25,679
26,031
26,328
Q4FY14 Q1FY15 Q2FY15 Q3FY15 Q4FY15
Net Worth (Rs mn)
• Net Profit up by 20.1% Y-Y at Rs 2713.2 mn
• Company is well capitalized with high net worth of Rs 26.32 bn
5

YIELD AND SPREAD
21.58%
22.16%
24.07%
23.43%
22.34%
Q4FY14 Q1FY15 Q2FY15 Q3FY15 Q4FY15
Net Yield (%)
• Gold Loan Net Yield at 22.34% in Q4 FY15 and up by 75 bps Y-Y
• Spreads are amongst the highest in the industry at 12.49%
6
11.11%11.98%
14.00% 13.38%12.49%
Q4FY14 Q1FY15 Q2FY15 Q3FY15 Q4FY15
Spread (%)

COST OF FUNDS AND OPEX
12.70% 12.60%12.39% 12.20% 11.96%
Q4FY14 Q1FY15 Q2FY15 Q3FY15 Q4FY15
Cost of Funds (%)
• Cost of funds declined further 24 bps q-q due to raising of lower cost funds from banks and mutual funds.
• Opex as a percentage of AUM decreased marginally to 7.64 %
7
8.55%8.45%
7.88%
7.69% 7.64%
Q4FY14 Q1FY15 Q2FY15 Q3FY15 Q4FY15
OPEX to AUM (%)

NPA9
96
1,3
54
1,7
09
87
0
1,0
70
82
2
1,1
45
1,4
57
70
2
88
6
Q4FY14 Q1FY15 Q2FY15 Q3FY15 Q4FY15
Gross NPA Net NPA
Gross NPA & Net NPA- GOLD (mn)
1.2
%
1.7
%
2.0
%
1.0
%
1.2
%
1.0
%
1.4
%
1.7
%
0.8
%
1.0
%
Q4FY14 Q1FY15 Q2FY15 Q3FY15 Q4FY15
Gross NPA % Net NPA %
Gross & Net NPA %
• Gross NPAs marginally increased to 1.2% of AUM in Q4 FY15
• Most of Gross NPA are from regular customers who have serviced over half ofinterest due
• NPAs on account of theft, spurious collateral etc. are only 0.08% of AUM
8

EPS & BOOK VALUE PER SHARE
• Annualized EPS for the quarter is at Rs 3.22
• Company’s book value per share is up to Rs 31.30
9
29.62 30.14 30.53 30.95 31.30
Q4FY14 Q1FY15 Q2FY15 Q3FY15 Q4FY15
Book Value per Share (Rs)
1.54
2.09
3.63 3.83
3.22
Q4FY14 Q1FY15 Q2FY15 Q3FY15 Q4FY15
Annualized EPS (Rs)

BRANCHES AND CUSTOMERS
• Number of Employees increased to 15,863
• Number of live Gold Loan customers is 1.70 million – up by 4% q-q.
• Total Number of Gold Loan branches stable at 3,293
10
16,794 16,047 14,902 14,889
15,863
Q4FY14 Q1FY15 Q2FY15 Q3FY15 Q4FY15
Employees (Nos) No of Customers (mn)
1.51 1.53 1.61
1.68 1.75
Q4FY14 Q1FY15 Q2FY15 Q3FY15 Q4FY15

GOLD HOLDING & AUM
• Disbursements in Q4 FY15 increasedto Rs 71.63 bn
• Total AUM of Rs 92,693 mn – up 5.1%q-q
• The gold holdings increased to 53.13tonnes – an increase of 5.8% q-q
11
45.57 45.89
47.82 50.23
53.13
Q4FY14 Q1FY15 Q2FY15 Q3FY15 Q4FY15
Gold Holding (tonnes)
81,631 82,060 85,301 88,236 92,693
Q4FY14 Q1FY15 Q2FY15 Q3FY15 Q4FY15
AUM (mn)
58,230 55,800 58,353 59,658 71,629
Q4FY14 Q1FY15 Q2FY15 Q3FY15 Q4FY15
Disbursement (mn)
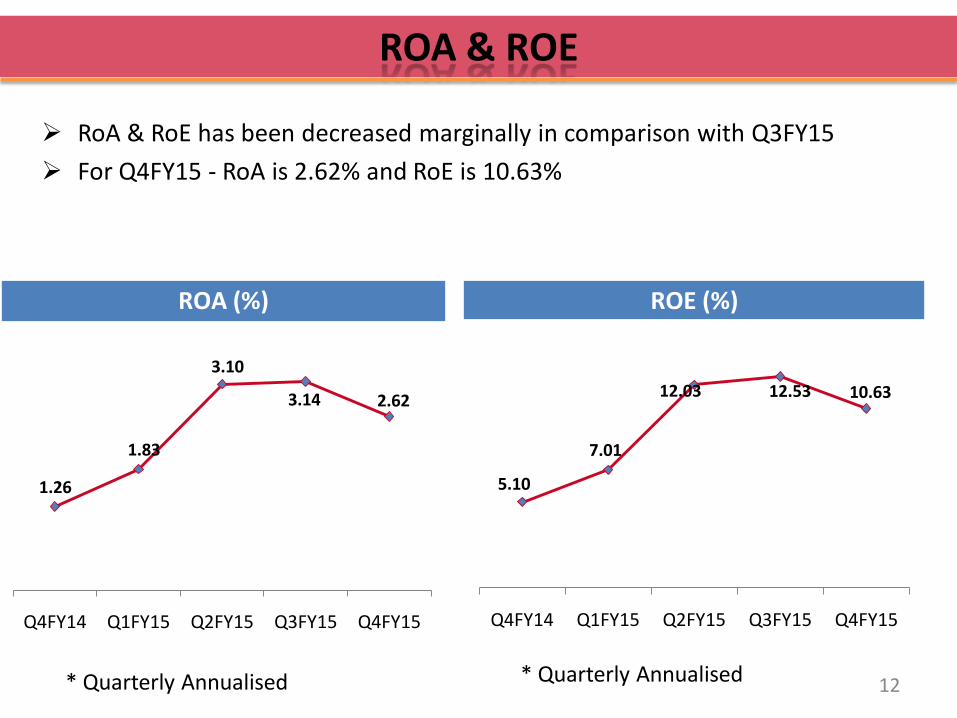
ROA & ROE
RoA & RoE has been decreased marginally in comparison with Q3FY15
For Q4FY15 - RoA is 2.62% and RoE is 10.63%
12
1.26
1.83
3.10
3.14 2.62
Q4FY14 Q1FY15 Q2FY15 Q3FY15 Q4FY15
ROA (%)
5.10
7.01
12.03 12.53 10.63
Q4FY14 Q1FY15 Q2FY15 Q3FY15 Q4FY15
ROE (%)
* Quarterly Annualised * Quarterly Annualised

CAPITAL ADEQUACY
25.64%27.68% 27.48% 27.61% 27.05%
Q4FY14 Q1FY15 Q2FY15 Q3FY15 Q4FY15Tier II Tier I
Capital Adequacy Tier I & Tier IICapital Adequacy Tier I & Tier II
3.13
2.80
2.90 2.94
3.19
Q4FY14 Q1FY15 Q2FY15 Q3FY15 Q4FY15
NetDebt Equity Ratio (x)
• The total capital adequacy is healthy at 25.64% compared to the minimum15% stipulate by RBI for gold loan companies
• The gearing levels are also comfortable at 3.19x leaving ample scope forincrease in leverage.
13

NEW BUSINESSES
• Completed acquisition of Asirvad Microfinance Pvt. Ltd-
closing AUM of Rs 322 Cr
• Mortgage and Commercial Vehicle finance businessesgrowing steadily - closing AUM of Rs 27.2 cr and Rs15.4cr respectively
• Each new business has dedicated and operating teamswith extensive and relevant industry experience
• New businesses expected to contribute upto 25% oftotal AUM in three years.
14

7%
6%
82%
1% 4%0%
NCDs Listed NCDs Unlisted
Bank Finance Commercial Paper
Subordinated Bond Others
LIABILITY MIX
Borrowings as on March 31, 2015 was Rs.86,320 million.
Particulars Amount (mn)
NCDs Listed 6,330
NCDs Unlisted 4,954
Bank Finance 70,754
Commercial Paper 906
Subordinated Bond 3,300
Others 75
TOTAL 86,320
15

SHARE HOLDING PATTERN
Total Outstanding Share Capital as on 31st March, 2015 is Rs 1,682.4 Million (841.2 Million
shares of Rs 2 each)
32%
32%
14%
4%
11%
8%
FII`s (32%)
Indian Promoters (32.16%)
Public (13.5%)
Mutual Funds (3.79%)
Corporates (10.67%)
Others (7.88%)
16

Gold loan outstanding as of March 31, 2014 was Rs. 92,244 million.
As on 31.03.14GL OS – Rs. 81,552 million
68%13%
8%
11%
75%
11%
6%
8%
South West East North
As on 31.03.15GL OS – Rs. 92,244 million
As on 31.03.13GL OS – Rs. 99,300 million
Loan Portfolio Zone wise
70%13%
7%
10%
17

Mr. V. P. NandakumarManaging Director & CEO
Chief Promoter of the Manappuram Group of Companies
Holds a masters degree in science from Calicut University and is also a Certified Associate ofIndian Institute of Bankers
Has been associated with the banking industry in various capacities. He is the Chairman of theEquipment Leasing Association (India) and the Kerala Non-Banking Finance Companies WelfareAssociation
Mr. B.N. Raveendra BabuExecutive Director
Holds masters degree in commerce from Calicut University and completed Inter from Instituteof Certified Management Accountants
Has worked in a senior position in the Finance and Accounts Department of Blue MarineInternational at the U.A.E
He has been the Director of Manappuram since July 15, 1992
SENIOR MANAGEMENT TEAM
Experience of over 24 years in finance.
Worked with leading Indian and multinational organizations such as CRISIL, HSBC, StandardChartered Bank, Hewitt Associates and India Infoline.
Experienced in all CFO functions including debt and equity markets, treasurymanagement, investor relations, ERP implementation etc.
Mr. Kapil KrishanChief Financial Officer
18

Mr. Mohan VizhakatChief Technology officer
Holds a masters degree in Information Technology
Has been associated with the Govt. of India and leading business groups and companies in Indiaand Middle East in the field of Information Technology.
SENIOR MANAGEMENT TEAM
19
Mr. Somasajeevan TKEVP - HR
Industry experience of over 25 years
Worked with leading Indian and multinational organizations such as Polaris, Mcdonalds.
Mr. Arun RamanEVP – Head Operations
Industry experience of over 21years
Holds Bachelor of Engineering in Computer Science and MBA from IIM
Worked with AHLI Bank, ICICI Bank, HSBC, CITI Bank, SBI Capital Markets and Emirates Bankgroup

SENIOR MANAGEMENT TEAM
Experience of over 19 years in the area of Business Development, Credit & Risk and ProfitCentre operations
Worked with leading organizations such as Fullerton, HDFC, Indiabulls, and Citicorp Finance.
Mr. K Senthil KumarNational Head –Commercial
Vehicle finance
20
Industry Experience of over 27 years reputed Banks and Corporations in the functional area ofRetail banking, Trade Finance, working Capital funding and Micro Credit lending
Worked with leading organizations such as SMILE Microfinance, Belstar, SIDBI, HSBC and UBI.
Mr. R Raghavender AnandNational Head –Micro
finance
Mr. Aloke GhosalCEO – Housing Finance
Holds masters degree in commerce
Has 23 years of experience with leading finance companies such as LIC Housing FinanceLtd., TATA Home Finance Ltd., IDBI Home Finance, etc.

Decades of experience provide a competitive advantage in terms of ability to evaluate the gold
Only household used jewellery encouraged as security (emotional factor is key)
Employees are regularly trained in gold appraisal methods
Several tests for checking spurious gold including touchstone test, nitric acid test, sound test and checking for hallmark
Three level appraisal of gold
Asset Evaluation & Appraisal Risk
Post verification gold transferred to highly secured Vaults which have RCC structures or Burglary proof safes of reputed brands
Gold stored under joint custody (Dual Custody) Premises located above ground floor, with 24x7 CCTV camera
and burglar alarm system Insurance of gold against burglary
Gold Security & Custodial Risk
Strict KYC compliance Employee profiling, Employee tracking and
regular rotation of staff across departments and branches
Prevention of Fraud
Stringent collateral approval process Pledges frequently checked by an internal
audit team at 45 day to confirm quality and quantity of gold, KYC and other documents
Strong Internal Controls / Audit
Availability of accurate and real-time information aids in faster decision making and reduced turnaround time resulting in improved loan disbursement facility
Significant automation at front end reducing human intervention
Centralized technology for offsite surveillance of all branches (efficient monitoring and controlling)
Scalability enables rapid branch roll-out State of art Disaster Recovery Centre
In-house IT Infrastructure
STRONG INTERNAL PROCESS
21
Alert Verifications
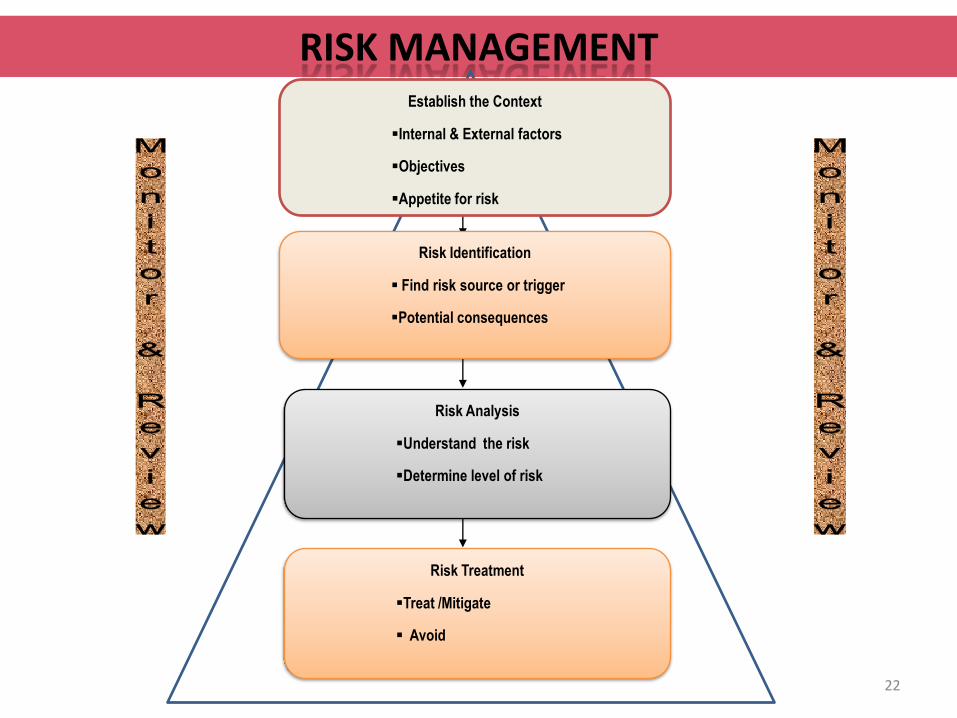
RISK MANAGEMENT
22
Establish the Context
Internal & External factors
Objectives
Appetite for risk
Risk Identification
Find risk source or trigger
Potential consequences
Risk Analysis
Understand the risk
Determine level of risk
Risk Treatment
Treat /Mitigate
Avoid

Post Sanction drilldown – Risk prone loans are identified under different parameters and alerting for early detection.
Risk based classification of loans and customers- Customers and Loans are classified in different risk buckets considering risk factors like
profession, track record, lending rate, nature of collateral, current performance etc.
Regulatory Risk – KYC & AML - Continuous check of regulatory guidelines, system controls, spreading awareness etc.
Loan Policy (Customer Profiling; Credit Check) – High Value customers are profiled to confirm address, profession, reference check, credit
worthiness etc.
Portfolio Monitoring – Periodical analysis of portfolio performance in respect of interest servicing, collateral coverage, credit
concentration, possible delinquencies etc.
Periodic Audit and Inspection – Inspection for entire gold inventory at 45 day interval to confirm quality and quantity of gold, KYC and other
documents etc.
Security – Robust physical and electronic securities are put in place after factoring risk perception viz., branch location, business
level, instances of uncertain events etc.
Appraisal Alert Verifications Routine Inspections Vigilance
RISK MANAGEMENT
23

Share of Organized Market(%)
Better Operating Cost Structures vis-à-vis Banks
Quick approvals and disbursals
Presence of expert valuers
Robust control systems
High Comfort Level: Transparency & Trust
Flexibility in Terms of Loans
Easy Access due to Greater Penetration
GOLD LOANS: NBFCS RETAIN NICHE POSITIONING
Targeting Non-bankable customers
Source: IMaCS
45.6%
14.8%
32.8%
6.8%
FY 2012
NBFCs
Pvt Sector Banks
Public Sector Banks
Co operative Banks
24

DISCLAIMER :This presentation and the contents therein are for information purposes only and does not and should not construedto be any investment or legal advice. Any action taken or transaction pursued based on the basis of the informationcontained herein is at your sole risk and responsibility and Manappuram Finance or its employees ordirectors, associates will not be liable in any manner for the consequences of any such reliance placed on thecontents of this presentation. We have exercised reasonable care in checking the correctness and authenticity of theinformation contained herein, but do not represent that it is true, accurate or complete. Manappuram Finance orassociates or employees shall not be in anyway responsible for any loss or damage that may arise to any person fromany inadvertent error or omission in the information contained in this presentation. The recipients of thispresentation should make their own verifications and investigations to check the authenticity of the said informationif they wish. Manappuram Finance and/or directors, employees or associates may be deemed to haveinterests, financial or otherwise in the equity shares of Manappuram Finance.
Regd. Off, Manappuram House, P.O Valapad, Thrissur,
Kerala – 680 567
www.manappuram.com
Make Life Easy
25