for the fiscal year - greenville city schools csd fy 2012...greenville city school district...
TRANSCRIPT

The Greenville City School District
in the City of Greenville, Ohio -County of Darke
“Honoring the Past and
Building for the Future”
COMPREHENSIVE ANNUAL FINANCIAL REPORT FOR THE FISCAL YEAR JULY 1, 201 1- JUNE 30, 2012


GREENVILLE CITY SCHOOL DISTRICT
Greenville, Ohio
Comprehensive Annual Financial Report
For the Fiscal Year Ended June 30, 2012
Issued by:
Treasurer’s Office
Carla G. Surber, C.P.A Treasurer, C.F.O


Greenville City School District Comprehensive Annual Financial Report For the Fiscal Year Ended June 30, 2012
Table of Contents
INTRODUCTORY SECTION Letter of Transmittal ...................................................................................................................................... i GFOA Certificate of Achievement .............................................................................................................. xi ASBO Certificate of Excellence ................................................................................................................. xii List of Principal Officials ........................................................................................................................... xiii Organizational Chart .................................................................................................................................. xiv FINANCIAL SECTION Independent Accountants’ Report ................................................................................................................ 1 Management’s Discussion and Analysis ....................................................................................................... 3 Basic Financial Statements:
Government-wide Financial Statements:
Statement of Net Assets ....................................................................................................... 16
Statement of Activities ......................................................................................................... 17
Fund Financial Statements:
Balance Sheet – Governmental Funds ................................................................................. 18 Reconciliation of Total Governmental Fund Balances to Net Assets of Governmental Activities ............................................................................. 19
Statement of Revenues, Expenditures and Changes in Fund Balances – Governmental Funds .............................................................................. 20
Reconciliation of the Statement of Revenues, Expenditures and Changes in Fund Balances of Governmental Funds to the Statement of Activities ...................................... 21
Statement of Revenues, Expenditures and Changes in Fund Balance – Budget (Non-GAAP Basis) and Actual – General Fund ...................................................................................................................... 22
Statement of Fiduciary Net Assets – Fiduciary Funds ......................................................... 23 Statement of Changes in Fiduciary Net Assets – Fiduciary Funds ...................................... 24
Notes to the Basic Financial Statements ................................................................................... 25

Combining Financial Statements: Nonmajor Governmental Funds: Fund Descriptions ............................................................................................................................. 55 Combining Balance Sheet – Nonmajor Governmental Funds .......................................................... 58 Combining Statement of Revenues, Expenditures and Changes in Fund Balances – Nonmajor Governmental Funds .......................................................................... 59 Combining Balance Sheet – Nonmajor Special Revenue Funds ...................................................... 60 Combining Statement of Revenues, Expenditures and Changes in Fund Balances – Nonmajor Special Revenue Funds ...................................................................... 64 Fiduciary Funds: Fund Descriptions ............................................................................................................................. 68 Combining Statement of Fiduciary Net Assets – Private Purpose Trust Funds ................................ 69 Combining Statement of Changes in Fiduciary Net Assets – Private Purpose Trust Funds ............. 70 Statement of Changes in Assets and Liabilities – Agency Fund ....................................................... 71 Individual Fund Schedules of Revenues, Expenditures and Changes in Fund Balances – Budget (Non-GAAP Basis) and Actual:
Major Funds: General Fund ....................................................................................................................................... 72 Permanent Improvement Fund ............................................................................................................ 76 Nonmajor Funds: Food Service Fund .............................................................................................................................. 77 Other Local Grants Fund .................................................................................................................... 78 Educational Foundation Fund ............................................................................................................. 79 Athletic Fund ...................................................................................................................................... 81 Auxiliary Fund .................................................................................................................................... 82 EMIS Fund .......................................................................................................................................... 83 Entry Year Teachers Fund .................................................................................................................. 84 Data Communications Fund ................................................................................................................ 85 Summer Intervention Fund ................................................................................................................. 86 Vocational Enhancement Fund ........................................................................................................... 87 Other State Grants Fund ...................................................................................................................... 88 Adult Basic Education Fund ............................................................................................................... 90 Education Jobs Fund ........................................................................................................................... 91 Title VI-B Fund ................................................................................................................................... 92 Vocational Education Carl Perkins Fund ............................................................................................ 94 Stimulus Title II Technology Fund ..................................................................................................... 95 Title I School Improvement Fund ....................................................................................................... 96 Title III LEP Fund ............................................................................................................................... 97 Title I Fund ......................................................................................................................................... 98 Preschool Grant Fund ....................................................................................................................... 100 Title IIA Fund ................................................................................................................................... 101 Miscellaneous Federal Grants Fund .................................................................................................. 102

STATISTICAL SECTION Statistical Tables Descriptions ................................................................................................................ 103 Net Assets by Component – Governmental Activities – Last Ten Fiscal Years ..................................... 104 Changes in Net Assets – Governmental Activities – Last Ten Fiscal Years .......................................... 106 Fund Balances – Governmental Funds – Last Ten Fiscal Years .......................................................... 108 Changes in Fund Balances – Governmental Funds – Last Ten Fiscal Years .......................................... 110 Assessed Value and Estimated Actual Value of Taxable Property – Last Ten Years ............................ 112 Principal Property Taxpayers – Real Estate Property Tax – 2012 and 2003 .......................................... 114 Principal Property Taxpayers – Public Utility Personal Property Tax – 2012 and 2003 ........................ 115 Property Tax Rates (Per $1,000 of Assessed Value) – Last Ten Years .................................................. 116 Property Tax Levies and Collections – Last Ten Years .......................................................................... 118 Computation of Direct and Overlapping Governmental Activities Debt – December 31, 2011 ............ 120 Computation of Legal Debt Margin – Last Ten Fiscal Years ................................................................. 121 Demographic and Economic Statistics – Last Ten Fiscal Years ............................................................. 123 Principal Employers – 2012 and 2003 .................................................................................................... 124 Per Pupil Cost – Last Ten Fiscal Years ................................................................................................... 125 School District Employees by Function – Last Ten Fiscal Years ........................................................... 126 Building Statistics – Last Ten Fiscal Years ............................................................................................ 128 Full-Time Equivalent Teachers by Education – Last Ten Fiscal Years .................................................. 130 Teacher to Student Ratio – Last Ten Fiscal Years .................................................................................. 131 Property Value, Financial Institution Deposits and Building Permits – Last Ten Years ........................ 132 Success Indicators – Last Ten Fiscal Years ............................................................................................ 134 Historical Data Indicators – Last Ten Fiscal Years ................................................................................ 138 Percentage of Students Who Receive Free and Reduced Lunches – Last Ten Fiscal Years .................. 140

This Page Intentionally Left Blank


Honoring the past and building for the future.
i
Greenville City School District St. Clair Memorial Hall 215 W. Fourth Street Greenville, Ohio 45331 (937) 548-3185 Fax (937) 548-6943
Administration Douglas W. Fries Superintendent Carla Surber, CPA Treasurer Jon McGreevey Director of Administrative Services David Peltz Director of Curriculum & Career Technology Laura Bemus Director of Curriculum Board of Education Sue Bowman President Cindy Scott Vice President Fred Matix James Sommer Ben Studabaker
December 21, 2012 Citizens of the Greenville City School District Members of Greenville City Board of Education We are very pleased to present our fiscal year 2012 Comprehensive Annual Financial Report (CAFR) for the Greenville City School District. This report, for the fiscal year ended June 30, 2012, has been prepared using generally accepted accounting principles for governments. It contains financial statements and other financial and statistical data that provide complete and full disclosure of all material financial aspects of the Greenville City School District (to be hereinafter referred to as the “School District”). This report enables the School District to comply with Ohio Administrative Code Section 117-2-03(B), which requires reporting on a GAAP (Generally Accepted Accounting Principles) basis, and Ohio Revised Code Section 117.38, which requires that school districts reporting on a GAAP basis file an unaudited annual report with the Auditor of State within 150 days of fiscal year-end. Management assumes full responsibility for the completeness and reliability of the information contained in this report, based upon a comprehensive framework of internal control that has been established for this purpose. Because the cost of internal control should not exceed anticipated benefits, the objective is to provide reasonable, rather than absolute, assurance that the financial statements are free of any material misstatements. The Auditor of State of Ohio has issued an unqualified ("clean") opinion on the Greenville City School District’s financial statements for the fiscal year ended June 30, 2012. The Independent Accountants’ Report is located at the front of the financial section of this report. Management's discussion and analysis (MD&A) immediately follows the Independent Accountants’ Report and provides a narrative introduction, overview, and analysis of the basic financial statements. MD&A complements this letter of transmittal and should be read in conjunction with it. SCHOOL DISTRICT OVERVIEW The School District known as Greenville City School District is located in the west central area of Ohio, within Darke County, and encompasses 127 square miles. The School District, which includes the City of Greenville, Gettysburg Village, Wayne Lakes Village, and 13 townships, was the site of the famous Fort Greene Ville. The School District’s dedication to education has been longstanding. In 1840, Darke County’s first brick school house was constructed outside of Greenville City on what is now known as State Route 49. It is presently listed on the National Historic Register and was constructed and donated by Abraham Studabaker, a Darke County Pioneer who strongly believed in education for all and is a direct ancestor of a school board member.

ii
City of Greenville’s first known school was located along the east side of Walnut Street between Third and Fourth Streets during the 1840’s. The log building also served at times as a grand jury room and courtroom. This school, known as the Walnut Street School, had the Dayton and Union Railroad running in front of its doors. It continued as a school until about 1867 when the West School opened. In the years following the Land Ordinances of 1785 and 1787, one-room schools were scattered across the countryside, which is evidenced in records relating to the School District. According to the 1875 township reports, there were a total of 184 schoolhouses in Darke County, many of which were contained within the present Greenville City School District. Countywide, there were over 12,000 students attending school out of the 35,000 residents of the county. At that time, schools were only open three months through the winter. By 1900, there were more than 210 schoolhouses within Darke County. By the 1950’s almost all of these school buildings had been converted to other uses such as homes, barns and storage buildings. Greenville City School District improved its educational buildings in the nineteenth century. In 1883, East Building was constructed at a cost of $75,000. It was a large brick building, which housed the high school for many years. It was later converted into a grade school and was replaced with the present structure in 1950, where third and fourth-graders play today along East Fifth Street. This building is now known as “Greenville Intermediate School” after the consolidation of the elementaries in the School District in 2008. The next building to accommodate education in the School District was the North School, built in 1900 at a cost of $25,000. The original school had four classrooms, a large central hallway and a basement. It was a part of the former North Middle School, which ceased to operate in 2008 as a result of consolidation. Except for a brief closure in the 1980’s, the facility functioned daily as a learning center until that time. An addition was made to North Middle School in 1953 to accommodate an increasing number of students. The School District sold the North Middle School in June 2009. Today, it functions as a private church school. Eleven years later, in 1911, South School was built at the corner of Sater and Washington Streets. This “modern” facility contained eight classrooms with a basement and two large playrooms. With some updates and additions, the school continues today serving grades five and six from Greenville City and the adjacent townships and villages and is now known as “Greenville Middle School”. The West Building was located where Memorial Hall stands today. It stood three stories high, and was moved in 1910 adjacent to its location to accommodate the construction of Memorial Hall. The school served the community until 1923, when a new high school building was constructed. The former high school building now functions as the Junior High Building where the School District instructs grades seven and eight. Engraved over the entrance to the building is “Education is the Best Safeguard of Liberty”. Nearly one million dollars was spent on the structure to ensure safety for our children in late 2008. A collapse of the parapet wall left the structure uninhabitable after March 31, 2008, according to city standards. However, due to quick administrative efforts, it was again ready for operation at the beginning of fiscal year 2009 with construction complete. Memorial Hall was built in 1910 and grew from the dream of Henry St. Clair, who moved to Greenville from Cincinnati in 1872. He created Darke County’s most successful wholesale grocery business, having sales in excess of $200,000 in 1878. He fulfilled his dream by designating $100,000 in his will to be used for construction of the Memorial Hall building. Upon his death in 1908, the School District began to act on his vision. The building was constructed of Bedford stone and gray pressed block. Marble pillars adorned the vestibule and lobby. A mosaic tile floor and emblematic stained glass windows added to the décor. The total cost of the project, $135,000, was an investment in a community whose appreciation of the arts flourishes today. The hall remains the center of culture for the community with plays, concerts and art shows along with regular events. This rich heritage of music contributes to the excellence of

iii
School District music programs which have represented us well, not only statewide, but nationwide. This support comes from our residents, whose children we educate. In 2011, the Greenville High School Vocal Music Boosters received the Most Outstanding Support Group for exemplary leadership, service and commitment to excellence in Music Education by the Ohio Music Education Association. Memorial Hall also houses the administrative staff of the Greenville City School District and provides classrooms for vocal and instrumental music at the junior high school level. In early 2009, a renovation project of the stained glass windows, costing in excess of $200,000, revived the look of the vestibule. Woodland Heights Elementary was built in 1956 to serve the City of Greenville and adjacent township by replacing many one-room schools. Today, with an addition in 1968, the school serves as our northernmost center of education. The biggest change to the School District in many years resulted from the reconfiguring of the School District. Formerly, the Woodland Heights Elementary building served grades kindergarten through fifth grade as one of four elementaries. It now serves as “Greenville Primary School” for grades kindergarten through second grade, serving approximately 700 students within the boundaries of 127 square miles. In 1962, City of Greenville built a new high school on a 17 acre site surrounded by the beautiful Greenville City Park. This building serves the School District well, hosting numerous student activities and community events. Additionally, vocational facilities are located adjacent to the high school measuring over 17,000 square-feet. The School District today serves a student population of 3,101 within its five schools. The School District not only serves its regular education population daily, but has a large population of special needs children from kindergarten through twelfth grade within the School District. These students are served in Greenville Primary School, formerly known as Woodland Heights Elementary as the center for kindergarten through second grade education. Greenville Intermediate, formerly known as East Elementary serves the third and fourth grade population. Greenville Middle School services the fifth and sixth grade population. The Greenville Junior High Building, which houses the seventh and eighth grades, and a ninth through twelfth grade comprehensive high school, known as Greenville Senior High Building, continue in the same manner as before. These aforementioned buildings replaced the four elementary buildings and the North Middle Building. The high school has many distinct offerings from its in-house vocational school to its Junior Naval Reserve Officers Training program, being the only military program offered within the County. The Greenville City School District sold its former Gettysburg Elementary in June 2009. This building was vacated at the beginning of fiscal year 2009 in order to recognize efficiencies within the School District. The 1924 building had served the School District since 1972 when the consolidation of Gettysburg with Greenville City Schools became a reality. Gettysburg served as an elementary site for years and was replaced through consolidation during a time of lowering enrollment. BOARD OF EDUCATION The legislative powers of the School District are vested in a five-member Board of Education (“the Board”). The Superintendent (aka the Chief Executive Officer) recommends all those for employment, with the exception of the Treasurer, with the Board of Education making the final approval. The Board directly hires the Superintendent who performs the educational and hiring functions of the School District. The Board also is responsible for hiring the Treasurer who serves as the Chief Financial Officer of the School District, along with many business related duties.

iv
SCHOOL DISTRICT REPORTING ENTITY A reporting entity is comprised of the primary government, component units and other organizations that are included to ensure that the financial statements of the School District are not misleading. The primary government of the School District consists of all funds and departments which comprise the legal entity of the School District and which provide various services including regular instruction, special education, adult education and the various support services and administration necessary for these educational services. Component units are legally separate organizations for which the School District is financially accountable. The School District is financially accountable for an organization if the School District appoints a voting majority of the organization's governing board and (1) the School District is able to significantly influence the programs or services performed or provided by the organization; or (2) the School District is legally entitled to or can otherwise access the organization's resources; the School District is legally obligated or has otherwise assumed the responsibility to finance the deficits of, or provide financial support to, the organization; or the School District is obligated for the debt of the organization. Component units may also include organizations that are fiscally dependent on the School District in that the School District approves their budget, the issuance of their debt, or the levying of their taxes. The School District does not have any component units included in its reporting entity. The School District has representation on the boards of seven entities. The Metropolitan Dayton Educational Cooperative Association, the Southwestern Ohio Educational Purchasing Council and the Southwestern Ohio Instructional Technology Association are jointly governed organizations. The Southwestern Ohio Educational Purchasing Council Workers’ Compensation Group Rating Plan and the Southwestern Ohio Educational Purchasing Council Property, Fleet, and Liability Program are insurance purchasing pools. The Southwestern Ohio Educational Purchasing Council Benefit Plan Trust is a public entity shared risk pool. The Greenville Public Library is a related organization. Information regarding these entities may be found in the notes to the basic financial statements. The School Board is required to adopt a budget no later than the close of the preceding fiscal year. This budget serves as the foundation of the School District’s financial planning and control. The objective of budgetary controls is to ensure compliance with legal provisions embodied in the annual appropriation resolution. The legal level of budgetary control (the level at which expenditures cannot legally exceed the appropriated amount) is established by the Board of Education at the object level within each fund and function. Any modifications at this level may only be made by resolution of the Board of Education. ECONOMIC CONDITIONS AND OUTLOOK Situated in Darke County, the School District has both the flavor of a rural area along with some urbanization, creating the best of both worlds. Located 40 miles northwest of Dayton, Greenville is best known historically for the signing of the Treaty of Greene Ville in 1795, and its ties to Annie Oakley and Lowell Thomas, which have been kept alive by the (rather ostentatious) local museum with its impressive displays of these celebrities. This museum was showcased, during fiscal year 2008, with a nationally respected “Crossroads of Destiny” exhibit depicting the entire scope of the Indian Wars and the subsequent Treaty of Greene Ville. The current displays center on Annie Oakley and have brought thousands into the Greenville area while providing a resource of knowledge for children in our School District through field trips. Greenville City School District had a period in which the growth of personal property was most advantageous to the School District’s financial situation. However, it began to slow with the diminishment of manufacturing business during the early 2000’s. Having exploded (erupted) in the 1950’s with an industrial base, which was significant in a town of this size; good jobs were plentiful throughout the area. During fiscal year 2002, the School District’s largest manufacturer, Corning

v
Glassworks, chose to close its doors. The need for an increase in available jobs has been recognized by the City of Greenville and an aggressive movement towards continued solicitation of businesses is a constant goal of the City. The City of Greenville and the Greenville City School District continue to partner in tax abatements with the interest of the community at the heart of their decisions. A facility, The Andersons, Inc. and Marathon Petroleum Company, LLC, brought nearly 40 jobs to the School District and a value of over 200 million in property. Andersons Marathon Ethanol has built a 110 million gallon ethanol plant; it’s the first in the State. The plant is a product of a joint venture between The Andersons, Inc. and Marathon Petroleum Company, LLC, a wholly owned subsidiary of Marathon Oil Corporation. In addition to ethanol, its manufacturing also will produce dried distiller grains. The School District cooperated in the giving of one-hundred percent abatement in order to help the economy by increased infrastructure. Additionally, Continental Carbonics, a new liquid CO2 and dry ice production plant, which began operation in May 2011, has created additional jobs and recognition in the area. The work with the Darke County Economic Development Team in Partnering for Progress has lead the School District into opportunities for manufacturing readiness which could turn the present vocational site into a center for job readiness. This is a new concept in Ohio and provides to be an innovative way to bring employment to our graduates. FINANCIAL TRENDS During fiscal year 2012, the School District experienced a 2.3 percent decrease in the net unrestricted grants-in-aid (primarily state foundation revenue) on the cash basis of accounting. This is predominately due to a reduction in student enrollment and in the hold harmless component of personal property provided to schools under house bill 66. American Reinvestment and Recovery Act served to provide Greenville City School District with the State Foundation Stabilization Fund. That fund no longer existed in the 2011-2012 school year. There is a reduction in real estate tax revenue in contrast to the prior year due to decreases in valuation. The School District previously had seen a significant increase due to the passage of an emergency levy in which the entire increased collections were realized in fiscal year 2011. Assessed values were previously stable except for losses in public utility property. Personal property losses are fully phased-in due to legislative changes of House Bill 66. These dollars will be replaced with money from the Commercial Activities Tax through 2011, by the State continuation of a committed, hold-harmless period, from this change in law. However, due to Senate Bill 3 changes, personal property hold harmless amounts were greatly reduced. The School District had $29,935,937 in expense; only $5,469,268 of these expenses were offset by program specific charges for services, grants, interest, or contributions. General revenues (primarily taxes and grants and entitlements) and beginning net assets were adequate to cover these programs. Expenses increased three point seven (3.7) percent from the prior period’s Statement of Activities. FINANCIAL PLANNING AND POLICIES The School District has been experiencing a loss of enrollment over the past few fiscal years and an increase in open enrollment to other school districts. A factor influencing this trend is the loss of manufacturing base which decreased discretionary income for many families within our School District. This caused movement to more rural areas which were less impacted by the economic shifts in manufacturing. Even though the School District anticipates fairly stable funding as a result of a ten year renewal of the emergency levy, the School District continues to adjust levels of employment to better match student population as part of sound management practices. The School District constantly monitors this situation and is sensitive to the economic conditions within the community in order to maintain a fiscally stable environment. In January 2009, aggressive scheduling of various public meetings, coffee gatherings, etc., was done to explain to the constituency the need for more local funding. The Superintendent meets publicly with School District residents at least weekly.

vi
The School District voters successfully passed a renewal of a 5.5 mill levy which would maintain the flow of levy dollars, concurrently visiting the need for new monies in order to effectively stabilize balances. In May of 2009, the School District voters passed an emergency levy which will assure $1.64 million, annually, for the next three fiscal years which was subsequently renewed in March of 2012 for a period of ten years. The School District is performing at excellent levels educationally and is working to strengthen its educational prowess even further as we move from a ratings system to a ranking system. An educational aspect of the School District and realigning the buildings have been the prime focuses. Enough time has passed for stabilization of consolidation to move the School District into excellent status. Another issue the School District continues to face is House Bill 66. In June, 2005, House Bill 66 was signed and put into law creating a major change in the tax structure for school districts. This bill phased out the tangible personal property tax, creating a loss of over six percent of Greenville City School District’s General Fund revenue. In 2011, the reimbursement from the State will begin its phase out to school districts. Recent legislation has increased the need to maintain more local sources of revenue. With the State of Ohio experiencing budget deficits, more local funding is expected as a necessity in order to maintain the same levels of service. With the loss of personal property taxes, the argument for continued payment in lieu of tax situations has greatly diminished. However, fiscal year 2012 received very little of these dollars. The amount remaining is nominal compared to past receivables. In the 2011 fiscal year, the School District had a warehouse relocate into our area in conjunction with a large manufacturing plant, stabilizing our tax base. This is represented in the tax values as our number one real estate holding within the School District. On the expenditure side of the equation, the Board has a desire to minimize staffing wherever efficiencies can be found without impacting educational opportunities. In the current fiscal year, the Board continues to reduce staff to reflect our loss in student population. Fringe benefits such as health insurance plans and other significant costs to the School District continued to increase on a reduced salary base. Further reductions will be accomplished by the replacement of experienced, more highly compensated teachers with newer, less experienced teachers. Our residents have been strong supporters of our efforts in the aforementioned tasks. We have a huge responsibility to educate our constituency in the many issues faced today. We have increased reliance on their continued support. The 2012 valuation of the School District includes $393,420,050 of agricultural, residential, and other real estate, $13,649,380 of public utility personal property, and no general business personal property with a total valuation for 2012 of $407,069,430. Within this number is $2,174,730 of value of new construction, which has been predominantly commercial construction. The exempt value of real estate within the School District is $64,197,440. We have also been very aggressive in negotiating abatements with new business in the area. We presently have two agreements in Enterprise Zones and the Community Reinvestment Act and the School District received $42,418 during the fiscal year 2012 from school compensation agreements.

Statewide, the School District, based on their valuation per student is considered to be wealthier than 57 percent of other school districts in the State. Income Taxes: The School District experienced nearly a four point six percent increase in its cash income tax revenues during fiscal year 2012. This increase was doubled in 2011 by a settlement with a large company in the amount of $44,000 of collections. These numbers are reflective of the improved economic indicators for the area. Currently, the School District has a one-half percent income tax for General Fund operations levied on a continuous basis. MAJOR INITIATIVES FOR THE FISCAL YEAR The Board of Education, Superintendent, Treasurer, Administrative team, and all staff of Greenville City School District remain focused on providing engaging, relevant, and rigorous instructional opportunities and experiences to all students. Our aims are to prepare students for citizenship, workforce success, and higher and continuing education in a 21st Century global economy. Within limited budgetary resources, the Superintendent and staff have focused on using multiple sources of student achievement and school climate data to make informed decisions about the allocation of resources and implementation of educational initiatives to scale-up the educational programming for all students, and to set high expectations for teaching and support staff. For example, the School District continues to invest in building the capacity of its teaching staff through ongoing, high-quality professional development activities. With the implementation of school wide buildings in all buildings, resources have been allocated for more professional development. In this and coming fiscal years, the School District will focus much of its professional development activities toward integrating revised academic content standards into the curriculum. Next, the School District continues to upgrade equipment and infrastructure to infuse technology into the curriculum to provide 21st Century learning opportunities. During this fiscal year and in ones to follow, the School District will be implementing and piloting technology initiatives to improve student achievement. Next, at all levels of K-12 educational programming within the School District, administration and staff are committed to infusing inquiry, collaboration, higher level thinking, differentiation, and individualization to prepare students to be college and/or career ready upon graduation. Finally, the School District has implemented policies, such as “Credit Flexibility”, to break through obstacles to students moving on toward higher levels of achievement at the high school level. We are engaged in an initiative for manufacturing readiness which may prove to be a state model and a gateway for others to enter our school system. The School District has also implemented programs at all grade levels focused on providing individualized supports and interventions for academic success and the social well-being of students. During this fiscal year and beyond, the School District will be guided by the Ohio Improvement Process (OIP) to increase the adequate yearly progress (AYP) of students in the core areas of English/Language Arts and Mathematics, and to improve the overall educational climate of the School District by ensuring that all teaching staff are “ready” to meet the educational needs of all students.
vii

viii
The School District continues to examine its policies and practices to ensure that we are leveraging all potential resources for the best interests of students and to ensure that we are utilizing precious taxpayer dollars in the most efficient and effective manner. This continuous examination and re-examination of policies and practices has led cost savings and innovative, child-centered solutions that have strengthened the institutional capacity of the School District. This has resulted in the School District finally earning the rating of “Excellent” from the Ohio Department of Education for the past two fiscal years after a movement to “Effective” for the three years prior to 2011. Central to the progress and innovations of our School District over the past three fiscal years was the commitment of our former Superintendent, Susan Riegle, to “Honoring the Past and Building for the Future.” Ms. Riegle retired at the end of July, 2012. This commitment has been incorporated into her goal and priority setting, executive leadership and management challenges, and interactions with all School District stakeholders. In practice, the pledge to honor the past and build for the future has led to an engagement of School District stakeholders, which has netted partnerships, relationships, and networks of support for the goals and mission of the School District. The Superintendent’s promise set the tone for the School District to remain a vital economic, social, and cultural engine for prosperity and positive change within Greenville City School District and the Miami Valley region. During the last fiscal year, the Superintendent modified her commitment to quality instructional leadership at the grades five through eight levels by reverting to Principals at Grades 5 – 6 and grades 7 – 8. She increased curriculum coverage by adding a new position for that purpose. The Superintendent has also doubled efforts to develop building principals as instructional leaders by encouraging “walk-throughs” and focusing principals on instructional improvement based on student achievement data. In addition to regular K-12 educational programming, Greenville City School District is designated as its own "career technical planning district," which means that it provides high-quality career-technical education to its own students at no additional cost to taxpayers. The School District delivers career technical education through the Greenville High School Career Technical Center, which is focused on preparing students for career success in a global economy. The Greenville High School Career Technical Center operates 12 workforce development programs such as automotive technology, agricultural business, engineering, and interactive media. All career technical education programs provide students with the opportunity to improve their communication, problem solving, citizenship, and leadership skills. Students who choose a career technical program spend their junior and senior year learning theory and hands on skills while participating in program related trips, job shadowing, early placement/co-op, and competitions through organizations such as Business Professionals of America, SkillsUSA, and Distributive Education Clubs of America. Many of our students compete at both the State and national level. Most notably, Greenville City School District's automotive technology program has earned the gold medal at the SkillsUSA national competition in Kansas City seven of the last ten years. Our engineering and computer students were highlighted at the Ohio School Boards Conferences during the year. Career technical students are encouraged to pursue further training and/or college; and many programs provide students with the opportunity to earn a Tech Prep Scholarship to help finance education beyond high school. The Greenville High School Career Technical Center is a key workforce and economic development engine in Ohio's Miami Valley. The School District has continued to update its website, located at www.greenville.k12.oh.us, during the fiscal year toward making it a viable medium of communication for all School District stakeholders. The site features the School District’s annual reports, school closings, information about the schools, library connections, federal grant compliance information, athletics and various other items of use to the general public. The Comprehensive Annual Financial Report is available through the website.

ix
With an ever-changing educational and educational financing landscape, the students and taxpayers of Greenville City School District continue to be served well by thoughtful, innovative, and transformative initiatives that aim at serving the educational needs of all students, which aim toward meeting the high expectations and demands for fiscal responsibility from the Greenville City School District community. FOR THE FUTURE The Ohio Department of Education awarded the School District a number of grants to finance various projects involved with the increase of education throughout the School District. Maintenance of the federal title programs has allowed for continuous employment of staff in specialized areas. Annually, Greenville City School District receives over three million dollars in federal funding, which is used to help those with learning disabilities, reading deficiencies, professional development for teachers, Type A lunches and innovative educational programs throughout the School District. The School District receives funds through, and in conjunction with, the State of Ohio. The funds have very specific purposes, such as subsidizing the lunch programs at the schools, providing additional resources for the targeted populations in remedial education and special education, aiding in adult education for GED, providing technology in the schools and purchasing specialized vocational education equipment. On the horizon, Greenville City School District is actively pursuing the renovation and/or building of new facilities throughout the School District. On March 31, 2008, a portion of the façade fell from the Greenville Junior High Building and required a major overhaul to ensure the safety of children and staff. In light of this anomaly within the structure, attention from the State of Ohio placed us in the Exceptional Needs Building Program, offering us immediate access to matching funds upon passage of a levy. The Ohio Schools Facility Program assessed a need for a new fifth through eighth grade middle school in order to eliminate the Greenville Middle School and the Greenville Junior High School. The School District has partnered with the new Economic Development Director of Darke County to explain reasons that a new school could contribute to the local economy. Schools are recognized as being a vital part of the environment that helps to draw a business to locate to our area. Seven years after the failed attempt for a new elementary, the School District was on the ballot for an exceptional needs project in February, May and August of 2010. The results of these initiatives were unsuccessful due to the economy and the current increased unemployment rate within the area. A new round of money came forth for the School District to participate in the Construction Facilities Assistance Program with a 40 percent allocation to be offered by the State of Ohio. This levy was for a kindergarten through eighth grade building with the amount to be bonded set at $45 million and was defeated in November, 2011. In anticipation of future building needs, the Board started a reserve fund in 1998, with the intent of retaining dollars for future land acquisition or facility construction. It was determined that approximately five percent of General Fund revenues were to be placed into the Building Capital Projects Fund for the purpose of the construction of these facilities. It was the desire of the School District to create a down payment on the facilities to the extent of the School District’s accumulated dollars. The original plan was a budgeting tool to allow the Board the ability to go for less millage when considering a bond levy and to affirm the Board commitment to the residents of Greenville City School District. Land was purchased adjacent to property already owned by the School District. The fund balance of the Building Capital Projects Fund at June 30, 2008, was $2,264,462. Many of these dollars were spent on the renovation of the Junior High and the modulars at South School so that it was operable for the school opening in the fall of 2008. The remaining funding was returned to the General Fund for operations, once all encumbrances had been closed. This was done as a request of the Board based on a resolution in August 2008.

OTHER INFORMATION Independent Audit An audit team from the Auditor of State Dave Yost’ office has performed this fiscal year's audit. The results of the audit are presented in the Independent Accountants’ Report. Awards The Government Finance Officers Association of the United States and Canada (GFOA) awarded a Certificate of Achievement for Excellence in Financial Reporting to Greenville City School District for its Comprehensive Annual Financial Report (CAFR) for the fiscal year ended June 30, 2011. This was the tenth year that Greenville City School District has achieved this prestigious award. In order to be awarded a Certificate of Achievement, a government must publish an easily readable and efficiently organized CAFR. This report must satisfy both generally accepted accounting principles and applicable legal requirements. A Certificate of Achievement is valid for a period of one year only. We believe that our current CAFR continues to meet the Certificate of Achievement Program’s requirements and we are submitting it to the GFOA to determine its eligibility for another certificate. The Association of School Business Officials International (ASBO) awarded a Certificate of Excellence in Financial Reporting to the Greenville City School District for its CAFR for the fiscal year ended June 30, 2011. This is the eighth award given to the district. A Certificate of Excellence is awarded to those school districts who have voluntarily submitted their system’s CAFR for review by an ASBO Panel of Review. Upon completion of a vigorous technical review, the panel members conclude whether the school system’s financial report has met the criteria for excellence in financial reporting. Acknowledgements Appreciation is extended to the Board of Education of the Greenville City School District and the school employees responsible for contributing to the sound financial position of the Greenville City School District. Special acknowledgment is extended to the Local Government Services Section of the Auditor of State for their continued guidance in the preparation of this report.
Carla G. Surber, C.P.A. Susan E. Riegle Treasurer, C.F.O. Retired Superintendent
x

xi

Association of School Business Officials International
The Certificate of Excellence in Financial Reporting Award is presented to
Greenville City School District For Its Comprehensive Annual Financial Report (CAFR)
For the Fiscal Year Ended June 30, 2011
The CAFR has been reviewed and met or exceeded ASBO International’s Certificate of Excellence standards
Brian L. Mee, SFO, RSBA John D. Musso, CAE, RSBA President Executive Director
xii

Greenville City School District List of Principal Officials
June 30, 2012
Board of Education
President Sue Bowman
Vice President Cynthia S. Scott
Member Fred Matix
Member Ben Studabaker
Member James Sommer
Administration
Superintendent Douglas W. Fries
Curriculum and Instruction David Peltz
Director of Administrative Services Jon McGreevey
Treasurer
Carla G. Surber, C.P.A.
xiii

Peop
le of
the D
istric
t
Gree
nville
Boa
rd o
f Edu
catio
n
Supe
rinte
nden
t
Trea
sure
r Sec/C
lerks
Cler
k Cus
todi
an
Secr
etar
y
Dire
ctor
of A
dmin
Ser
vices
Tech
nolo
gy
Spec
ial E
d Su
perv
isor
Psyc
holo
gist
Spee
ch P
atho
logi
st
Main
tena
nce S
uper
visor
Nu
rses
Secr
etar
y Ma
inte
nanc
e Pe
rson
nel
Para
Pof
essio
nal
Asst
. Sup
erin
tend
ent
Secr
etar
y
Gifte
d Co
ordi
nato
r
TAG
Teac
hers
Ca
reer
Coo
rdin
ator
Title
I Coo
rdin
ator
ABLE
Coo
rdin
ator
Prin
cipals
K-1
2
Athl
etic
Dire
ctor
Vo
c Coo
rdin
ator
Tran
spor
tatio
n Su
perv
isor
Mech
anic
Bus D
river
s
Secr
etar
y
Asst
. Prin
cipal
Secr
etar
y
Coac
hes
Depa
rtmen
t Cha
ir
Teac
hers
Para
Pro
fess
iona
ls Cu
stod
ians
Secr
etar
y Se
cret
ary
PUPI
LS
Gre
envi
lle C
ity S
choo
ls
ORGA
NIZA
TION
AL C
HART
[Ado
ptio
n da
te:
Aug
ust 1
8, 1
987]
[R
evis
ion
date
: A
pril
18, 1
989]
[R
evis
ion
date
: M
arch
15,
199
4]
[Rev
isio
n da
te:
Janu
ary
11, 1
995]
[R
evis
ion
date
: Ju
ly 9
, 199
7]
Gre
envi
lle C
ity S
choo
l Dis
tric
t G
reen
ville
, Ohi
o
xiv


OneFirstNationalPlaza,130W.SecondSt.,Suite2040,Dayton,Ohio45402Phone:937‐285‐6677or800‐443‐9274Fax:937‐285‐6688
www.ohioauditor.gov
1
INDEPENDENT ACCOUNTANTS’ REPORT
Greenville City School District Darke County 215 West Fourth Street Greenville, Ohio 45331 To the Board of Education: We have audited the accompanying financial statements of the governmental activities, each major fund, and the aggregate remaining fund information of Greenville City School District, Darke County, Ohio (the School District), as of and for the year ended June 30, 2012, which collectively comprise the School District’s basic financial statements as listed in the table of contents. These financial statements are the responsibility of the School District’s management. Our responsibility is to express opinions on these financial statements based on our audit. We conducted our audit in accordance with auditing standards generally accepted in the United States of America and the standards applicable to financial audits contained in the Comptroller General of the United States’ Government Auditing Standards. Those standards require that we plan and perform the audit to reasonably assure whether the financial statements are free of material misstatement. An audit includes examining, on a test basis, evidence supporting the amounts and disclosures in the financial statements. An audit also includes assessing the accounting principles used and significant estimates made by management, as well as evaluating the overall financial statement presentation. We believe our audit provides a reasonable basis for our opinions. In our opinion, the financial statements referred to above present fairly, in all material respects, the respective financial position of the governmental activities, each major fund, and the aggregate remaining fund information of Greenville City School District, Darke County, Ohio, as of June 30, 2012, and the respective changes in financial position thereof and the budgetary comparison for the General fund for the year then ended in conformity with accounting principles generally accepted in the United States of America. In accordance with Government Auditing Standards, we have also issued our report dated December 21, 2012, on our consideration of the School District’s internal control over financial reporting and our tests of its compliance with certain provisions of laws, regulations, contracts and grant agreements and other matters. While we did not opine on the internal control over financial reporting or on compliance, that report describes the scope of our testing of internal control over financial reporting and compliance and the results of that testing. That report is an integral part of an audit performed in accordance with Government Auditing Standards. You should read it in conjunction with this report in assessing the results of our audit.

Greenville City School District Darke County Independent Accountants’ Report Page 2
2
Accounting principles generally accepted in the United States of America require this presentation to include Management’s discussion and analysis, as listed in the table of contents, to supplement the basic financial statements. Although this information is not part of the basic financial statements, the Governmental Accounting Standards Board considers it essential for placing the basic financial statements in an appropriate operational, economic, or historical context. We have applied certain limited procedures to the required supplementary information in accordance with auditing standards generally accepted in the United States of America, which consisted of inquiries of management about the methods of preparing the information and comparing the information for consistency with management’s responses to our inquiries, the basic financial statements, and other knowledge we obtained during our audit of the basic financial statements. We do not express an opinion or provide any assurance on the information because the limited procedures do not provide us with sufficient evidence to express an opinion or provide any other assurance. We conducted our audit to opine on the financial statements that collectively comprise the School District’s basic financial statements taken as a whole. The introductory section, the financial section’s combining statements, individual fund statements and schedules, and the statistical section information provide additional analysis and are not a required part of the basic financial statements. The financial section’s combining statements, individual fund statements and schedules are management’s responsibility, and were derived from and relate directly to the underlying accounting and other records used to prepare the basic financial statements. These statements and schedules were subject to the auditing procedures we applied to the basic financial statements. We also applied certain additional procedures, including comparing and reconciling this information directly to the underlying accounting and other records used to prepare the basic financial statements or to the basic financial statements themselves, in accordance with auditing standards generally accepted in the United States of America. In our opinion, this information is fairly stated in all material respects in relation to the basic financial statements taken as a whole. We did not subject the introductory section and statistical section information to the auditing procedures applied in the audit of the basic financial statements and, accordingly, we express no opinion or any other assurance on them. Dave Yost Auditor of State December 21, 2012

Greenville City School District Management’s Discussion and Analysis
For the Fiscal Year Ended June 30, 2012 Unaudited
3
The discussion and analysis of Greenville City School District’s financial performance provides an overall review of the School District’s financial activities for the fiscal year ended June 30, 2012. The intent of this discussion and analysis is to explain the School District’s financial performance as a whole; readers should also review the transmittal letter, basic financial statements and the notes to enhance their understanding of the School District’s financial performance. Financial Highlights Key financial highlights for fiscal year 2012 are as follows:
• In total, net assets decreased $947,504, a 4.7 percent decrease from fiscal year 2011.
• General revenues accounted for $23,519,165. Program specific revenues in the form of charges for
services, operating grants, capital grants, interest, and contributions accounted for $5,469,268 of total revenues of $28,988,433. With personal property taxes, other than public utility taxes being eliminated due to legislative phase-outs and restructuring of Ohio’s tax system, a need for another funding source was necessary. A 3.90 Mill emergency levy, renewed in March of 2012, and currently being collected at 4.15 mills, will provide a funding source for the next ten years. A reduction in valuation of property resulted in a lower collection of property taxes. With the ending of a significant flow of the American Reinvestment and Recovery Act dollars, Grants and Entitlements were lower by $1,240,461. Interest earnings and collection from fees continues to diminish due to more regulatory reductions, along with lower interest rates.
• The School District had $29,935,937 in expenses; only $5,469,268 of these expenses were offset by
program specific charges for services, grants, interest, or contributions. General revenues (primarily taxes and grants and entitlements) and beginning net assets covered these programs. However, a decline in net assets of $947,504 occurred during the year. Expenses increased more than three percent from the prior period’s Statement of Activities.
• For the General Fund, expenditures of $25,933,586 exceeded revenues of $25,123,194 by
$810,392. This reduction in fund balance was predominantly created by reduced property taxes of six percent due to a valuation adjustment, coupled with the use of American Reinvestment and Recovery Act to pay for utilities in the prior year for school district operations. This understated the utilities within the General Fund by 63 percent. School district income taxes were up by nearly 7 percent. Payment in lieu of taxes will gradually decrease in the future as the agreements end. Intergovernmental funds were at 97.5 percent of the prior year revenues. Charges for services increased 89 percent although the dollar impact of the increase had little impact on financial standings. Other changes to items of revenue and expense had immaterial impact by contrast. During the 2012 fiscal year, the Board of Education instituted a raise of 1.25 percent with all steps

Greenville City School District Management’s Discussion and Analysis
For the Fiscal Year Ended June 30, 2012 Unaudited
4
and scales implemented for regular employees. Positions were maintained with the use of federal ARRA money where legally possible. The American Reinvestment and Recovery Act money is in its final phases and all dollars will be exhausted by August of 2012. Increases to every category of expense were experienced with the exception of business, centralized costs and student intervention services which were funded with federal dollars. Administrative costs were higher by 13.5 percent due to an additional position and a full year of benefit changes, whereas fiscal suffered increases due to the auditor’s fees escalating more than 11 percent. Pupil transportation costs increased nearly 35 percent due to increased fuel costs and purchases of capital assets. The expenditures increase overall in excess of 7 percent in fiscal year 2012.
• The expenses that did increase in direct instruction costs were regular instruction, special education, vocational expenses and adult education. Pupil support services, instructional staff expense, board of education costs, administrative costs, fiscal costs, operation and maintenance of plant, pupil transportation and extracurricular activities also increased. Changes with regard to other expenses were not significant within the scope of the financial statements.
Using this General Accepted Accounting Principles (GAAP) Report This annual report consists of a series of financial statements and notes to those statements. These statements are organized so the reader can understand Greenville City School District as a financial whole, an entire operating entity. The statements then proceed to provide an increasingly detailed look at specific financial activities. The statement of net assets and the statement of activities provide information about the activities of the whole School District, presenting both an aggregate view of the School District’s finances and a longer-term view of those finances. Fund financial statements provide the next level of detail. For governmental funds, these statements tell how services were financed in the short-term as well as what remains for future spending. The fund financial statements also look at the School District’s most significant funds with all other nonmajor funds presented in total in one column. The major funds of Greenville City School District are the General Fund and the Permanent Improvement Capital Projects Fund. Reporting the School District as a Whole Statement of Net assets and the Statement of Activities While this document contains the large number of funds used by the School District to provide programs and activities, the view of the School District as a whole looks at all financial transactions and asks the question, “How did we do financially during fiscal year 2012?” The statement of net assets and the statement of activities answer this question. These statements include all assets and liabilities using the accrual basis of accounting similar to the accounting used by most private-sector companies. The basis of accounting recognizes all of the current fiscal year’s revenues and expenses regardless of when cash is received or paid. These two statements report the School District’s net assets and changes in those assets. This change in net assets is important because it tells the reader that, for the School District as a whole, the financial position of the School District has improved or diminished. The causes of this change may be the result of many factors, some financial, and some not. Non-financial factors include the School District’s property tax base, current property tax laws in Ohio restricting revenue growth, facility condition, required educational programs and other factors.

Greenville City School District Management’s Discussion and Analysis
For the Fiscal Year Ended June 30, 2012 Unaudited
5
In the statement of net assets and the statement of activities, the School District reports only governmental activities. Governmental activities are the activities where all of the School District’s programs and services are reported including, but not limited to, instruction, support services, operation of non-instructional services, and extracurricular activities. The School District does not have any business-type activities. Reporting the School District’s Most Significant Funds Fund Financial Statements The analysis of the School District’s major funds begins on page 10. Fund financial statements provide detailed information about the School District’s major funds. The School District uses many funds to account for a multitude of financial transactions. However, these fund financial statements focus on the School District’s most significant funds. Governmental Funds Most of the School District’s activities are reported in governmental funds, which focus on how money flows into and out of those funds and the balances left at fiscal year-end available for spending in future periods. These funds are reported using an accounting method called modified accrual accounting, which measures cash and all other financial assets that can readily be converted to cash. The governmental fund statements provide a detailed short-term view of the School District’s general government operations and the basic services it provides. Governmental fund information helps you determine whether there are more or fewer financial resources that can be spent in the near future to finance educational programs. The relationship (or differences) between governmental activities (reported in the statement of net assets and the statement of activities) and governmental funds is reconciled in the financial statements. Fiduciary Funds The School District’s only fiduciary funds are private purpose trust funds and agency funds. The School District’s fiduciary activities are reported in separate statements of fiduciary net assets and changes in fiduciary net assets. We exclude these activities from the School District’s other financial statements because the School District cannot use these assets to finance its operations. The School District is responsible for ensuring that the assets reported in these funds are used for their intended purposes. Agency funds are custodial in nature (assets equal liabilities) and do not involve measurement of results of operations. Fiduciary funds use the accrual basis of accounting. The School District as a Whole Recall that the statement of net assets provides the perspective of the School District as a whole. Table 1 provides a summary of the School District’s net assets for fiscal year 2012 compared to fiscal year 2011:

Greenville City School District Management’s Discussion and Analysis
For the Fiscal Year Ended June 30, 2012 Unaudited
6
2012 2011 ChangeAssets:Current Assets $23,646,247 $24,403,885 ($757,638)Capital Assets, Net 8,846,891 8,534,682 312,209Total Assets 32,493,138 32,938,567 (445,429)
Liabilities:Other Liabilities 12,255,700 11,586,702 668,998Long-Term Liabilities 976,654 1,143,577 (166,923)Total Liabilities 13,232,354 12,730,279 502,075
Net Assets:Invested in Capital Assets 8,846,891 8,534,682 312,209Restricted 3,582,337 4,220,815 (638,478)Unrestricted 6,831,556 7,452,791 (621,235)Total Net Assets $19,260,784 $20,208,288 ($947,504)
Table 1Net Assets
Current assets decreased $757,638, which consisted of cash and cash equivalents as cash balances decreased due to various factors of necessary spending without additional revenues to offset the needs. Also, the School District’s intergovernmental receivables decreased due to the slowing of monies received from the federal stimulus dollars which are concluding in the summer of 2012 shortly after the closing period of these financial statements. The short term impact of the stimulus dollars will no longer provide goods and services. The decreased valuation of property within the School District reduced revenues and consequently cash balances, which is a major factor in lower current assets. Intergovernmental receivables are decreasing as the School District nears the end of ARRA funds. The stimulus money provided by the federal government was used, particularly in special education, offsetting costs normally born by the General Fund. Dollars were used in accordance with supplement versus supplant to the extent of legal allowances. These dollars have aided the transitional period in anticipation of reduced revenues in the future. Capital assets, net, increased due to the purchase of busses and the beginnings of a project on Memorial Hall and completion of a construction project at the Greenville Senior High School. Current liabilities increased $668,998 from 2011 to 2012. Deferred Revenue increased $386,113, intergovernmental payable increased $161,329, matured compensated absences payable increased $127,041, while other liabilities impacted the net change insignificantly in aggregate. Deferred revenue represents the amount of property tax revenue expected for collection during fiscal year 2012. Long-term liabilities, which are predominantly tied to staffing concerns, will continue to decline as the age of the staff is younger. Over the last few years, the demographics of staff age are lowering as the School District’s mature staff is choosing to retire. Unrestricted net assets, the part of net assets that can be used to finance day-to-day activities without constraints established by grants or legal requirements, of the School District decreased $621,235. This is due to a number of factors. Lower revenue from property taxes, lower intergovernmental revenues as a result of lowering of American Reinvestment and Recovery Act revenues were contributing factors. Additional factors on the expense side were increased costs of operations experienced by higher health care

Greenville City School District Management’s Discussion and Analysis
For the Fiscal Year Ended June 30, 2012 Unaudited
7
costs, additional administrative costs due to mandates, implementation of higher fees from outside agencies, increased utility cost which was previously paid from American Reinvestment and Recovery monies and increased cost from fuels and capital outlay in the pupil transportation area. Restricted net assets decreased $638,478. The manner in which the State of Ohio gave Fiscal Stabilization Money somewhat skewed short term operating results since that money is not inclusive of the general fund. It was given in lieu of General Fund dollars. The use of the grant known as Education Jobs money in the current year to fund sixth grade classroom teachers will have the same impact on the budgeted dollars and will make comparative numbers in the General Fund appear differently than would have otherwise shown. Had items not changed legislatively, the impact to general fund would have been relatively unchanged.
Table 2 shows the changes in net assets for fiscal years 2012 and 2011.
Table 2 Changes in Net Assets
2012 2011 ChangeRevenuesProgram Revenues: Charges for Services $1,239,929 $1,213,071 $26,858 Operating Grants, Interest and Contributions 4,094,683 4,789,176 (694,493) Capital Grants and Contributions 134,656 161,334 (26,678)Total Program Revenues 5,469,268 6,163,581 (694,313)
General Revenues: Property Taxes 9,487,265 10,169,023 (681,758) Income Taxes 1,925,876 1,773,036 152,840 Grants and Entitlements Not Restricted to Specific Programs 11,955,233 13,195,694 (1,240,461) All Other 150,791 164,143 (13,352)Total General Revenues 23,519,165 25,301,896 (1,782,731)Total Revenues $28,988,433 $31,465,477 ($2,477,044)
(continued)

Greenville City School District Management’s Discussion and Analysis
For the Fiscal Year Ended June 30, 2012 Unaudited
8
Table 2 Changes in Net Assets
(continued)
2012 2011 ChangeProgram Expenses:Instruction $19,087,866 $18,668,330 $419,536Support Services: Pupils 1,257,990 1,236,567 21,423 Instructional Staff 1,544,944 1,509,927 35,017 Board of Education 89,084 112,354 (23,270) Administration 2,288,739 2,056,567 232,172 Fiscal 743,794 752,997 (9,203) Business 10,458 16,853 (6,395) Operation and Maintenance of Plant 1,870,294 1,652,231 218,063 Pupil Transportation 1,071,134 1,002,126 69,008 Central 222,022 225,422 (3,400)Operation of Non-Instructional Services 1,113,664 1,042,525 71,139Extracurricular Activities 635,948 597,686 38,262Total Expenses 29,935,937 28,873,585 1,062,352
Change in Net Assets (947,504) 2,591,892Net Assets at Beginning of Year 20,208,288 17,616,396Net Assets at End of Year $19,260,784 $20,208,288
Total program revenues decreased $694,313 from fiscal year 2011, which was mainly the result of a decrease in State and federal funding in the form of grants and entitlements. As explained previously, there was some loss in real property valuation which further eroded collections for taxes. Those two factors strongly played into the losses currently experienced. For general revenues, the overall decrease was $1,782,731 which was mainly due to reduced funding previously received from the American Recovery and Reinvestment Act. Overall, total revenues decreased $2,477,044, or 7.9 percent. Expenditures increased $1,062,352. Much of the expenditure increase came from increased wages paid due to more tutors in the system and a 1.25 percent increase in wages plus scheduled steps, increased health insurance costs. Instructional equipment was purchased which impacted the expenditure 67 percent, but the dollar amount of change was not significant in the overall scope of expenditures.

Greenville City School District Management’s Discussion and Analysis
For the Fiscal Year Ended June 30, 2012 Unaudited
9
02468101214161820
Inst
ruct
ion
Pupi
l Sup
port
Inst
ruct
iona
l Sta
ff
Boa
rd o
f Edu
catio
n
Adm
inis
trat
ion
Fisc
al, I
nter
gov
Bus
ines
s
Mai
nten
ance
of P
lant
Pupi
l Tra
nspo
rtat
ion
Cen
tral
Ser
vice
s
Non
-Inst
ruct
iona
l
Extr
acur
ricul
arA
ctiv
ities
MIL
LIO
NS
2011 VS 2012 ALLOCATION OF EXPENSEChanges in Net Assets - Table 2
2011 2012

Greenville City School District Management’s Discussion and Analysis
For the Fiscal Year Ended June 30, 2012 Unaudited
10
Governmental Activities The unique nature of property taxes in Ohio creates the need to routinely seek voter approval for School District operation. Property and income taxes made up 33 percent and 7 percent, respectively, of revenues for governmental activities for the Greenville City School District for fiscal year 2012. The School District constituency renewed a 3.9 mill emergency levy originally voted upon in May of 2009, and placed on the ballot again for renewal in March of 2012. The levy is currently bringing in taxes at the rate of 4.15 mills due to the type and nature of the levy. This levy will not expire for ten years. Other levies that are currently in place included a 5.50 mill levy which was passed in 1996 and renewed again in 2011. The levy is collecting millage at 3.9615 mills on agricultural and residential property and 5.3355 mills on commercial and industrial property. This is attributed to the rollback factors under House Bill 920, which literally eliminates inflation from real property valuations. The 5.5 mill levy no longer generates additional revenue for agricultural and residential property due to this same legislation, regardless of the aforementioned millage. The levy no longer generates any personal property tax due to the elimination of the tax due to House Bill 66. Voters also renewed a 2.0 mill permanent improvement levy in November of 2008, which generates over $500,000 in property tax and state replacement revenues per fiscal year. In fiscal year 2012, permanent improvement levy monies funded a rehabilitation project to the high school gymnasium. Also multiple pieces of equipment and technology were purchased and an upgrade of the façade on the Memorial Hall Building was begun with a federal grant providing match monies to improve the building. In past fiscal years, these funds enabled the School District to build a new vocational career technical building as an addition to the high school facilities. This Permanent Improvement Levy will expire in fiscal year 2015 but has been renewed every five years since its inception in 1989. Expenditures for 2012 were $832,409 from this fund, whereas in 2011, they were $382,786. Instruction comprises 64 percent of the School District’s expenses. Support Services make up 30 percent of the expenses. The dependence upon tax revenues is apparent from both property and income taxes. The community, as a whole, is the primary support for the Greenville City School District. Without the support of levies, Greenville School District would not be eligible for the state foundation monies that it receives. The School District’s Funds The School District’s major funds are the General and the Permanent Improvement Funds. These funds are accounted for by the modified accrual basis of accounting. All governmental funds had total revenues of $29,167,048 and expenditures of $30,415,069. The major funds make up 88 percent of total revenues and 87 percent of total expenditures. Fund balance for the fiscal year in the General Fund decreased $810,392. The School District continues to make reductions over the last few years in order to build cash balances while the funding situation in Ohio goes through changes. We believe the intended change will minimize income from the state level. In spite of measures to conserve a carryover balance for future needs, a continued process of reviewing ways to generate additional revenues is necessary. Income must be maintained in order to avoid the reduction of services to students. The aid from ARRA monies created an additional cash flow which allowed for additional equipment and intervention services. These will more than likely be missing in the future. The plan to infuse carryover cash for transition has been effective to date as evidenced in these financial statements.

Greenville City School District Management’s Discussion and Analysis
For the Fiscal Year Ended June 30, 2012 Unaudited
11
The primary changes contributing to this decreased fund balance are the loss of stimulus money from the budget. The emergency levy which resulted in additional taxes will help strengthen our position. However, reductions must continue to be made where possible. A proactive stance on reduction of force must occur in response to declining enrollment. Elimination of positions and shifting positions into grants where legally permissible during the time of American Reinvestment and Recovery Act money is not possible in the future. Many of these measures will no longer be available to the district. The Permanent Improvement Fund decreased $292,821. This is predominantly from the project at the high school which served as an improvement to the gymnasium. This fund accounts for revenues resulting from a property tax levy. The fund balance in this fund can fluctuate during fiscal years depending on what capital improvements are purchased during the period. The revenue in this fund is restricted and cannot be used for any other purpose other than the purchase of capital assets or capital improvement projects. As of fiscal year-end, this fund has accumulated $1,829,961 for future improvements. General Fund Budgeting Highlights The School District’s budget is prepared according to Ohio law and is based on accounting for certain transactions on a basis of cash receipts, disbursements, and encumbrances. The most significant budgeted fund is the General Fund. During the course of fiscal year 2012, the School District amended its General Fund budget nine times, which resulted in final appropriations increasing $638,152 to $27,400,700 from original appropriations of $26,762,548. Actual expenditures were less by $1,515,630 from final budgeted amounts. The variance in appropriations versus expenditures was expected, giving authority to a greater range of appropriations, knowing that other internal controls will only allow those expenditures, when entirely necessary, coupled with legislative authority by consent of the Board. The Administration and Board of Education have made additional dollars available in many categories in order to facilitate the educational needs of the School District as they arise. With the School District’s tight internal controls, additional monies are appropriated in order to allow those individuals in charge to be creative in meeting their students’ educational needs. The School District believes that appropriations should be prepared to operate in the best manner to meet the needs of those being educated. In order to do so, appropriations are made in excess of the minimum required funds. This compensates for immediate needs, such as students moving into the School District requiring educational or support workforce, be it teaching staff, aid or support staff. It is the School District’s goal to allow funds to fully supplement the educational structure doing so in an effective and efficient manner. In times where there is difficulty in maintaining cash balances for two to four months of operation, it is incumbent upon the School District to make necessary resources available so education is not sacrificed. Judgment must be used to value, educationally, the cash outlay for the benefit given. For the General Fund, final budgeted revenue was decreased by $22,013 from the original budgeted estimates. Actual revenues were $1,053,662 more than final budget basis revenue, primarily due to Intergovernmental Receivable . Almost all payment in lieu of taxes have agreements which are expiring so that flow of money will diminish with time. The district does continue to lose enrollment as does the State of Ohio.

Greenville City School District Management’s Discussion and Analysis
For the Fiscal Year Ended June 30, 2012 Unaudited
12
Capital Assets At the end of fiscal year 2012, the School District had $8,846,891 invested in land, land improvements, buildings and improvements, machinery, equipment and fixtures, and vehicles. Table 3 shows fiscal year 2012 balances compared to fiscal year 2011.
Table 3
Capital Assets (Net of Depreciation) at June 30,
2012 2011Land $1,163,162 $1,163,162Construction in Progress 156,471 95,317Land Improvements 392,654 418,918Buildings and Improvements 5,175,062 4,921,375Machinery, Equipment and Fixtures 1,146,159 1,252,800Vehicles 813,383 683,110Totals $8,846,891 $8,534,682
Overall capital assets increased $312,209 from fiscal year 2011. A conscious effort occurred to reserve spending for absolutely necessary projects until the results of a bond levy held in February, May and August of 2010, were known. Another levy was attempted in November 2011 to build a kindergarten through Eighth grade building without success. The district has begun using the permanent improvement fund to enhance the high school building. The Board of Education has tentatively decided that the high school building has enough potential that it should continue to be used for education. Planning for a bond issue in the future will continue to be in the forefront of desires for the current board of education members. The Junior High School was renovated in the 2009 school year due to a catastrophic event occurring on March 31, 2008, that closed the building. A major capital project was completed on the rehabilitation of the high school gymnasium. The entire project was a significant improvement and cost more than $600,000 at completion. Additionally, the district began a construction project with the desire to complete renovation of the top parapet wall and adjoining structures of the Memorial Hall building which houses the central office and additional Junior High School classrooms. The project will address possible issues with the building which may over time be viewed as a significant deterioration of the structure. Construction in progress of $156,471 is being recognized on the statement of net assets relating to this project. For more information on capital assets, refer to Note 9 of the basic financial statements.

Greenville City School District Management’s Discussion and Analysis
For the Fiscal Year Ended June 30, 2012 Unaudited
13
Debt Administration At June 30, 2012, the School District had no outstanding debt. The School District's overall legal debt margin was $36,636,249 and the unvoted debt margin was $407,069 at June 30, 2012. Current Financial Issues and Concerns The School District is proud of its community support of public schools. The School District’s constituency has approved several operating and permanent improvement levies by large margins. The School District has continued to host career technical programs to add diversity to the high school curriculum while opening opportunities for technical skills accessible by the entire student body. Greenville City Schools is a comprehensive model of career technical education. It is the goal of the School District to graduate every student with specialized knowledge. Every child should be prepared in a discipline enabling specialized skills, e.g., technical degrees in a post secondary setting. The continuous improvement plan for the School District is expanding the way that the School District is operating educationally. This is being reflected by use of professional development dollars primarily driven by the School District’s ability to acquire grants to fund its cost. The School District has expanded educational facilities at the High School with a career-technical building addition to enhance the success of their programs. The administration is actively engaged in a statewide initiative to provide a manufacturing readiness program to increase the ability for students to become employable for local industries. Additionally, the School District operates special education units, also known as MD (multiple disabilities) and ED (emotionally disturbed) units, throughout the School District to provide services to its own growing special education population. Several years ago, the administration implemented a program for emotionally disturbed students as an educational opportunity within the confines of the School District. The transportation of these students is no longer contracted to other districts, creating a need for additional special education busing. Also, an alternative education program to target high school students with deficient credits has been placed into service. This should eventually expand the population of the High School and create an environment for a different type of learning.
2011
2012
LAND
CON
STRU
CTIO
N IN
PROG
RES
S
LAND
IMPR
OVEM
ENTS
BUIL
DING
&IM
PRO
VEM
ENTS
MAC
HIN
ERY,
EQU
IPM
ENT
&FI
XTUR
ES
VEHI
CLES
CAPITAL ASSETSNET OF DEPRECIATION - TABLE 3

Greenville City School District Management’s Discussion and Analysis
For the Fiscal Year Ended June 30, 2012 Unaudited
14
A mentoring program at the High School has been successful in encouraging self-esteem for those children who are suffering educationally. The program has been embraced by the business community who has supported it efforts. In the past, Greenville has experienced some significant losses of business based on the closing of a local manufacturing concern in late 2002. The impact of the closing, with little promise of new manufacturing and industrial base, is a concern for local government and school officials. The School District’s financial position has been impacted by these losses. Due to a continuation of this trend, the School District decreased spending in many areas during fiscal years 2005 through 2012. Realignment of buildings occurred successfully having made reductions more feasible without harming education. Equipment purchasing continues to be at low levels, as are expenditures in many other areas. However, the trend seems to be changing and pockets of growth are emerging within the City and in close proximity. A new industrial building in the City of Greenville, with a value of $11,964,200, was constructed in 2009. This gives promise of area job security, since the company who built this warehouse currently has a large manufacturing plant located within the School District. This new construction helped maintain the value of the School District in spite of the economic downturn and tax appeals at the Board of Revision locally. Economic Development has been aggressively pursued locally and our strong economic council continues to aggressively go after new industries. New legislation was passed a few years ago that changed the business tax structure in the State of Ohio, promoting a need for prudent management of School District resources with realignment and creativity. The impact of these changes will continue to unfold with the passage of time. Positive news creates a renewed interest in developments in the area. The downside to the School District is that many of the new businesses are given abatements and tax increment financing, which eliminates any immediate gain by the School District. New jobs are being created as industries are again building in Greenville and surrounding communities. The new ethanol plant brought much wealth to the School District, which will be available for taxation once the abatement granted by the City of Greenville expires. The $220 million plant will help the City be recognized as a leader in economic development for small cities across the country. A new 50,000 square foot dry ice manufacturing facility has been built adjacent to the ethanol plant. Unemployment continues to drop in the School District. Externally, the State of Ohio was found, by the Ohio Supreme Court in March 1997, to be operating an unconstitutional system of school funding, one that was neither “adequate” nor “equitable.” Since 1997, the State has directed its tax revenue growth toward school districts with little property tax wealth. The legislators and government officials continue to negotiate the plan for improvement of the financing of public schools in the State of Ohio. In comparison to other school districts in the State, the Greenville City School District would not be considered a School District suffering from low wealth. However, when this formula is calculated, the loss of enrollment in the School District will create an illusion of an increase in wealth, since the assessed value of the School District is divided by the number of students. This factor, also known as the valuation per pupil, drives many funding calculations used in support from the State of Ohio. Generally speaking, a lower wealth creates more State support. The School District’s declining enrollment is having an effect on the collection of revenues from the State of Ohio. This declining student population coupled with the legislated loss of personal property tax is planned for as part of the budget. The School District has secured a voted funding stream as it works dynamically managing its budget in a proactive manner.

Greenville City School District Management’s Discussion and Analysis
For the Fiscal Year Ended June 30, 2012 Unaudited
15
The School District must plan carefully and prudently to provide the resources to meet student needs, but to better serve the public, over the next several fiscal years. Contacting the School District’s Financial Management This financial report is designed to provide our citizens, taxpayers, investors and creditors with a general overview of the School District’s finances and to show the School District’s accountability for the money it receives. If you have questions about this report, or need additional financial information, contact Carla G. Surber, CPA, Treasurer/CFO, at Greenville City School District, St Clair Memorial Hall – 215 West Fourth Street, Greenville, Ohio 45331 or email at [email protected].

Greenville City School DistrictStatement of Net Assets
June 30, 2012
GovernmentalActivities
Assets: Equity in Pooled Cash and Cash Equivalents $11,749,085 Cash and Cash Equivalents with Fiscal Agent 703 Accounts Receivable 126,470 Accrued Interest Receivable 8,460 Income Taxes Receivable 801,766 Intergovernmental Receivable 759,940 Prepaid Items 26,033 Inventory Held for Resale 9,930 Materials and Supplies Inventory 36,720 Payment in Lieu of Taxes Receivable 20,278 Property Taxes Receivable 10,093,317 Cash and Cash Equivalents with Escrow Agent 13,545 Nondepreciable Capital Assets 1,319,633 Depreciable Capital Assets, Net 7,527,258Total Assets 32,493,138
Liabilities: Accounts Payable 35,405 Accrued Wages and Benefits Payable 2,549,513 Contracts Payable 141,148 Matured Compensated Absences Payable 127,041 Retainage Payable 15,323 Intergovernmental Payable 625,574 Deferred Revenue 8,761,696 Long-Term Liabilities: Due Within One Year 123,695 Due in More Than One Year 852,959Total Liabilities 13,232,354
Net Assets: Invested in Capital Assets 8,846,891 Restricted for: Debt Service 2,076 Capital Outlay 1,844,740 Food Service 958,235 Athletics 107,359 Title VI-B Program 23,284 Title I Program 397,683 Education Jobs Fund 60,901 Auxilliary Services 32,751 Other Purposes 155,308 Unrestricted 6,831,556Total Net Assets $19,260,784
See Accompanying Notes to the Basic Financial Statements
16

Net (Expense) Revenue
Program Revenues and Changes in Net Assets
Operating Grants, TotalCharges for Interest and Capital Grants Governmental
Expenses Services Contributions and Contributions ActivitiesGovernmental Activities:Instruction: Regular $13,324,886 $507,232 $149,009 $80,152 ($12,588,493) Special 3,608,635 948 1,760,576 0 (1,847,111) Vocational 1,827,279 31,181 316,240 3,635 (1,476,223) Adult/Continuing 48,987 0 40,386 0 (8,601) Student Intervention Services 278,079 350 146,294 0 (131,435)Support Services: Pupils 1,257,990 782 88,577 767 (1,167,864) Instructional Staff 1,544,944 34,696 572,300 0 (937,948) Board of Education 89,084 0 0 0 (89,084) Administration 2,288,739 87,190 80,470 7,337 (2,113,742) Fiscal 743,794 0 0 13,698 (730,096) Business 10,458 0 185 0 (10,273) Operation and Maintenance of Plant 1,870,294 13,688 44,277 9,811 (1,802,518) Pupil Transportation 1,071,134 0 18,786 1,811 (1,050,537) Central 222,022 0 950 17,445 (203,627)Operation of Non-Instructional Services 1,113,664 306,896 845,588 0 38,820Extracurricular Activities 635,948 256,966 31,045 0 (347,937)Total Governmental Activities $29,935,937 $1,239,929 $4,094,683 $134,656 (24,466,669)
General Revenues: Property Taxes Levied for:
Greenville City School DistrictStatement of Activities
For the Fiscal Year Ended June 30, 2012
Property Taxes Levied for: General Purposes 9,082,283 Capital Outlay 404,982 Income Taxes for General Purposes 1,925,876 Grants and Entitlements not Restricted to Specific Programs 11,955,233 Payment in Lieu of Taxes 41,414 Investment Earnings 32,409 Gifts and Donations 5,433 Miscellaneous 71,535Total General Revenues 23,519,165
Change in Net Assets (947,504)
Net Assets at Beginning of Year 20,208,288Net Assets at End of Year $19,260,784
See Accompanying Notes to the Basic Financial Statements
17

Nonmajor TotalPermanent Governmental Governmental
General Improvement Funds Funds
Assets:Equity in Pooled Cash and Cash Equivalents $7,634,432 $1,926,547 $2,180,078 $11,741,057Cash and Cash Equivalents with Fiscal Agent 0 0 703 703Cash and Cash Equivalents with Escrow Agent 0 0 13,545 13,545Receivables: Property Taxes 9,658,989 434,328 0 10,093,317 Income Taxes 801,766 0 0 801,766 Payment in Lieu of Taxes 20,278 0 0 20,278 Accounts 123,323 0 3,147 126,470 Intergovernmental 11,095 0 748,845 759,940 Interfund 900,495 0 0 900,495 Accrued Interest 8,460 0 0 8,460Inventory Held for Resale 0 0 9,930 9,930Materials and Supplies Inventory 34,752 0 1,968 36,720Prepaid Items 24,011 0 2,022 26,033Restricted Assets: Equity in Pooled Cash and Cash Equivalents 8,028 0 0 8,028Total Assets $19,225,629 $2,360,875 $2,960,238 $24,546,742
Liabilities and Fund Balances:Liabilities:Accounts Payable $28,680 $1,334 $5,391 $35,405Accrued Wages and Benefits Payable 2,330,133 0 219,380 2,549,513Contracts Payable 0 128,267 12,881 141,148Interfund Payable 0 0 900,495 900,495Intergovernmental Payable 560,597 0 64,977 625,574Matured Compensated Absences Payable 127,041 0 0 127,041Retainage Payable 0 9,225 6,098 15,323Deferred Revenue 9,011,864 392,088 733,917 10,137,869Total Liabilities 12,058,315 530,914 1,943,139 14,532,368
Fund Balances:Nonspendable 66,791 0 3,990 70,781Restricted 0 1,829,961 1,200,767 3,030,728Committed 407,469 0 0 407,469Assigned 2,595,837 0 2,076 2,597,913Unassigned (Deficit) 4,097,217 0 (189,734) 3,907,483Total Fund Balances 7,167,314 1,829,961 1,017,099 10,014,374Total Liabilities and Fund Balances $19,225,629 $2,360,875 $2,960,238 $24,546,742
See Accompanying Notes to the Basic Financial Statements
Greenville City School DistrictBalance Sheet
Governmental FundsJune 30, 2012
18

Total Governmental Fund Balances $10,014,374
Amounts reported for governmental activities in the statement of net assets are different because:
Capital assets used in governmental activities are not financial resources and therefore are not reported in the funds. These assets consist of:
Land 1,163,162Construction in Progress 156,471Land Improvements 811,979Buildings and Improvements 11,158,961Machinery, Equipment and Fixtures 5,222,123Vehicles 1,893,456Accumulated Depreciation (11,559,261)
8,846,891
Long-term assets are not available to pay for the current-period expenditures and therefore are deferred in the funds:
Property Taxes 335,921Income Taxes 164,125Payment in Lieu of Taxes 20,278Tuition and Fees 114,480Extracurricular Activities 3,559Investment Earnings 8,460Intergovernmental Grants 721,885Charges for Services 1,609Rent 3,304Miscellaneous 2,552
1,376,173
Compensated absences are not due and payable in the current period and therefore are not reported in the funds. (976,654)
Net Assets of Governmental Activities $19,260,784
See Accompanying Notes to the Basic Financial Statements
Greenville City School DistrictReconciliation of Total Governmental Fund Balances to
Net Assets of Governmental ActivitiesJune 30, 2012
19

Greenville City School DistrictStatement of Revenues, Expenditures and Changes in Fund Balances
Governmental FundsFor the Fiscal Year Ended June 30, 2012
Nonmajor TotalPermanent Governmental Governmental
General Improvement Funds FundsRevenues: Property Taxes $9,081,292 $404,932 $0 $9,486,224 Income Taxes 1,889,147 0 0 1,889,147 Payment in Lieu of Taxes 42,418 0 0 42,418 Tuition and Fees 506,688 0 0 506,688 Extracurricular Activities 113,861 0 231,841 345,702 Investment Earnings 24,966 0 928 25,894 Intergovernmental 13,326,067 134,656 2,900,612 16,361,335 Charges for Services 55,991 0 307,647 363,638 Rent 13,296 0 410 13,706 Gifts and Donations 14,522 0 46,986 61,508 Miscellaneous 54,946 0 15,842 70,788Total Revenues 25,123,194 539,588 3,504,266 29,167,048
Expenditures: Current: Instruction: Regular 12,265,279 66,953 651,891 12,984,123 Special 3,047,714 0 584,897 3,632,611 Vocational 1,790,848 3,036 24,801 1,818,685 Adult/Continuing 0 0 48,271 48,271 Student Intervention Services 91,411 0 186,668 278,079 Support Services: Pupils 1,159,269 641 116,631 1,276,541 Instructional Staff 882,980 0 670,763 1,553,743 Board of Education 89,002 0 0 89,002 Administration 2,178,767 6,129 80,065 2,264,961 Fiscal 791,812 11,442 0 803,254 Business 10,185 0 273 10,458 Operation and Maintenance of Plant 1,766,067 8,195 55,191 1,829,453 Pupil Transportation 1,195,502 1,513 25,979 1,222,994 Central 117,700 14,572 78,060 210,332 Operation of Non-Instructional Services 6,394 0 997,394 1,003,788 Extracurricular Activities 347,101 0 259,765 606,866 Capital Outlay 0 719,928 61,980 781,908Total Expenditures 25,740,031 832,409 3,842,629 30,415,069
Excess of Revenues Under Expenditures (616,837) (292,821) (338,363) (1,248,021)
Other Financing Sources (Uses): Transfers In 0 0 193,555 193,555 Transfers Out (193,555) 0 0 (193,555)Total Other Financing Sources (Uses) (193,555) 0 193,555 0
Net Change in Fund Balances (810,392) (292,821) (144,808) (1,248,021)
Fund Balances at Beginning of Year 7,977,706 2,122,782 1,161,907 11,262,395Fund Balances at End of Year $7,167,314 $1,829,961 $1,017,099 $10,014,374
See Accompanying Notes to the Basic Financial Statements
20

Greenville City School DistrictReconciliation of the Statement of Revenues, Expenditures and Changesin Fund Balances of Governmental Funds to the Statement of Activities
For the Fiscal Year Ended June 30, 2012
Net Change in Fund Balances - Total Governmental Funds ($1,248,021)
Amounts reported for governmental activities in the statement of activities are different because:
Governmental funds report capital outlays as expenditures. However, in the statement of activities, the cost of those assets is allocated over their estimated useful lives as depreciation expense. In the current period, these amounts are:
Capital Outlay 1,188,528 Current Year Depreciation Expense (814,662) Excess of Capital Outlay Expense over Depreciation 373,866
Governmental funds only report the disposal of capital assets to the extent proceeds are received from the sale. In the statement of activities, a gain or loss is reported for each disposal.
Loss on Disposal of Capital Assets (61,657)
Some revenues that will not be collected for several months after the School District's fiscal year-end are not considered "available" revenues and are deferred in the governmental funds.
Property Taxes 1,041 Income Taxes 36,729 Payment in Lieu of Taxes (1,004) Tuition and Fees 9,481 Extracurricular Activities 173 Investment Earnings 7,443 Intergovernmental (233,766) Charges for Services 356 Rent 185 Miscellaneous 747 Total Deferred (178,615)
Some items reported in the statement of activities do not require the use of current financial resources and therefore are not reported as expenditures in governmental funds. These activities consist of: Decrease in Compensated Absences 166,923
Change in Net Assets of Governmental Activities ($947,504)
See Accompanying Notes to the Basic Financial Statements
21

Greenville City School DistrictStatement of Revenues, Expenditures and Changes
In Fund Balance - Budget (Non-GAAP Basis) and ActualGeneral Fund
For the Fiscal Year Ended June 30, 2012
Variance WithBudgeted Amounts Final Budget
PositiveOriginal Final Actual (Negative)
Revenues: Property Taxes $9,034,783 $9,034,783 $9,402,304 $367,521 Income Taxes 1,795,344 1,795,344 1,858,478 63,134 Payment in Lieu of Taxes 30,000 30,000 42,418 12,418 Tuition and Fees 556,958 556,958 506,688 (50,270) Extracurricular Activities 105,544 105,544 113,790 8,246 Investment Earnings 18,797 18,797 15,946 (2,851) Intergovernmental 12,720,246 12,720,246 13,368,532 648,286 Charges for Services 74,620 51,991 55,991 4,000 Rent 10,337 10,337 13,250 2,913 Gifts and Donations 20,452 20,452 14,522 (5,930) Miscellaneous 46,558 47,174 53,369 6,195Total Revenues 24,413,639 24,391,626 25,445,288 1,053,662
Expenditures: Current: Instruction: Regular 12,641,828 12,658,901 12,189,342 469,559 Special 3,258,258 3,280,695 3,143,334 137,361 Vocational 1,836,881 1,879,029 1,805,153 73,876 Adult/Continuing 836 337 0 337 Student Intervention Services 99,007 99,007 88,669 10,338 Other 100,995 106,994 106,994 0 Support Services: Pupils Pupils 1,151,9081,151,908 1,204,2941,204,294 1,162,4421,162,442 41,85241,852 Instructional Staff 1,141,402 1,145,489 851,959 293,530 Board of Education 151,548 140,022 105,678 34,344 Administration 2,231,928 2,306,253 2,171,229 135,024 Fiscal 859,010 850,183 783,784 66,399 Business 13,098 17,708 14,983 2,725 Operation and Maintenance of Plant 1,804,738 1,877,285 1,794,733 82,552 Pupil Transportation 960,467 1,264,621 1,193,329 71,292 Central 138,094 170,798 122,277 48,521 Operation of Non-Instructional Services 10,444 13,690 6,394 7,296 Extracurricular Activities 362,106 385,196 344,770 40,426 Capital Outlay 0 198 0 198Total Expenditures 26,762,548 27,400,700 25,885,070 1,515,630
Excess of Revenues Over (Under) Expenditures (2,348,909) (3,009,074) (439,782) 2,569,292
Other Financing Sources (Uses):Insurance Recoveries 2,120 2,120 0 (2,120)Proceeds from Sale of Capital Assets 3,350 3,350 0 (3,350)Refund of Prior Year Expenditures 23,747 23,747 1,577 (22,170)Refund of Prior Year Receipts (100) (600) (418) 182Advances In 0 0 995,386 995,386Advances Out 0 0 (1,221,844) (1,221,844)Transfers In 0 25,000 0 (25,000)Transfers Out (205,000) (194,976) (193,555) 1,421Total Other Financing Sources (Uses) (175,883) (141,359) (418,854) (277,495)
Net Change in Fund Balance (2,524,792) (3,150,433) (858,636) 2,291,797
Fund Balance at Beginning of Year 8,044,022 8,044,022 8,044,022 0Prior Year Encumbrances Appropriated 113,285 113,285 113,285 0Fund Balance at End of Year $5,632,515 $5,006,874 $7,298,671 $2,291,797
See Accompanying Notes to the Basic Financial Statements 22

Greenville City School DistrictStatement of Fiduciary Net Assets
Fiduciary FundsJune 30, 2012
Private PurposeTrust Agency
Assets: Equity in Pooled Cash and Cash Equivalents $232,618 $49,914 Notes Receivable 25,280 0Total Assets 257,898 $49,914
Liabilities: Due to Students 0 $49,914
Net Assets: Endowment 19,933 Held in Trust for Scholarships 204,761 Held in Trust for Other Governments 33,204Total Net Assets $257,898
See Accompanying Notes to the Basic Financial Statements
23

Greenville City School DistrictStatement of Changes in Fiduciary Net Assets
Fiduciary FundsFor the Fiscal Year Ended June 30, 2012
Private PurposeTrust
Additions:Investment Earnings ($85)Gifts and Donations 3,905Miscellaneous 6,522
Total Additions 10,342
Deductions:Payments in Accordance with Trust Agreements 7,000
Change in Net Assets 3,342
Net Assets at Beginning of Year 254,556Net Assets at End of Year $257,898
See Accompanying Notes to the Basic Financial Statements
24

Greenville City School District Notes to the Basic Financial Statements
For the Fiscal Year Ended June 30, 2012
25
NOTE 1 - DESCRIPTION OF THE SCHOOL DISTRICT AND REPORTING ENTITY Greenville City School District (the "School District") is organized under Article VI, Sections 2 and 3 of the Constitution of the State of Ohio. The School District operates under a locally-elected Board form of government consisting of five members elected at-large for staggered four year terms. The School District provides educational services as authorized by State statute and federal guidelines. The School District was established through the consolidation of existing land areas and school districts. The School District serves an area of approximately 127 square miles. It is located in Darke County, and includes all of the City of Greenville and portions of surrounding townships. It is staffed by 117.5 non-certificated employees, 202.5 certificated full-time equivalent teaching personnel and 21 administrative employees as well as five elected officials who provide services to 3,101 students and other community members. The School District currently operates five instructional buildings exclusive of a separate vocational technical center, an administrative building and a bus maintenance garage. Reporting Entity: A reporting entity is comprised of the primary government, component units, and other organizations that are included to ensure that the financial statements are not misleading. The primary government of the School District consists of all funds, departments, boards, and agencies that are not legally separate from the School District. For Greenville City School District, this includes general operations, food service, and student related activities of the School District. The following activities are also included within the reporting entity: Private and Parochial Schools - Within the School District’s boundaries, one school is operated
as a private and one as a parochial school. Current State legislation provides funding to these parochial and private schools. These monies are received and disbursed on behalf of these schools by the Treasurer of the School District, as directed by the parochial and private schools. This program is reflected as a governmental activity for financial reporting purposes.
Component units are legally separate organizations for which the School District is financially accountable. The School District is financially accountable for an organization if the School District appoints a voting majority of the organization’s governing board and (1) the School District is able to significantly influence the programs or services performed or provided by the organization; or (2) the School District is legally entitled to or can otherwise access the organization’s resources; the School District is legally obligated or has otherwise assumed the responsibility to finance the deficits of, or provide financial support to, the organization; or the School District is obligated for the debt of the organization. Component units may also include organizations that are fiscally dependent on the School District in that the School District approves the budget, the issuance of debt, or the levying of taxes. The School District has no component units. The School District participates in three jointly governed organizations, two insurance purchasing pools, one public entity shared risk pool, and one related organization. These organizations are discussed in Note 16 to the basic financial statements. These organizations are:
Jointly Governed Organizations: Metropolitan Dayton Educational Cooperative Association Southwestern Ohio Educational Purchasing Council Southwestern Ohio Instructional Technology Association

Greenville City School District Notes to the Basic Financial Statements
For the Fiscal Year Ended June 30, 2012
26
NOTE 1 - DESCRIPTION OF THE SCHOOL DISTRICT AND REPORTING ENTITY (continued)
Insurance Purchasing Pools: Southwestern Ohio Educational Purchasing Council Workers’
Compensation Group Rating Plan Southwestern Ohio Educational Purchasing Council Property, Fleet, and Liability Program
Public Entity Shared Risk Pool: Southwestern Ohio Educational Purchasing Council Benefit Plan Trust Related Organization:
Greenville Public Library
NOTE 2 - SUMMARY OF SIGNIFICANT ACCOUNTING POLICIES The financial statements of Greenville City School District have been prepared in conformity with generally accepted accounting principles (GAAP) as applied to governmental units. The Governmental Accounting Standards Board (GASB) is the accepted standard-setting body for establishing governmental accounting and financial reporting principles. The School District also applies Financial Accounting Standards Board (FASB) Statements and Interpretations issued on or before November 30, 1989, to its governmental activities provided they do not conflict with or contradict GASB pronouncements. The more significant of the School District’s accounting policies are described below. Basis of Presentation The School District’s basic financial statements consist of government-wide statements, including a statement of net assets and a statement of activities, and fund financial statements, which provide a more detailed level of financial information. Government-wide Financial Statements: The statement of net assets and the statement of activities display information about the School District as a whole. These statements include the financial activities of the primary government, except for fiduciary funds. The statements usually distinguish between those activities of the School District that are governmental and those that are considered business-type activities. The School District, however, has no activities which are reported as business-type. The statement of net assets presents the financial condition of the governmental activities of the School District at fiscal year-end. The statement of activities presents a comparison between direct expenses and program revenues for each program or function of the School District’s governmental activities. Direct expenses are those that are specifically associated with a service, program or department and are therefore clearly identifiable to a particular function. Program revenues include charges paid by the recipient of the goods or services offered by the program, grants and contributions that are restricted to meeting the operational or capital requirements of a particular program and interest earned on grants that is required to be used to support a particular program. Revenues which are not classified as program revenues are presented as general revenues of the School District, with certain limited exceptions. The comparison of direct expenses with program revenues identifies the extent to which each governmental function is self-financing or draws from the general revenues of the School District.

Greenville City School District Notes to the Basic Financial Statements
For the Fiscal Year Ended June 30, 2012
27
NOTE 2 - SUMMARY OF SIGNIFICANT ACCOUNTING POLICIES (continued) Fund Financial Statements: During the fiscal year, the School District segregates transactions related to certain School District functions or activities into separate funds in order to aid financial management and to demonstrate legal compliance. Fund financial statements are designed to present financial information of the School District at this more detailed level. The focus of governmental fund financial statements is on major funds rather than reporting by type. Each major fund is presented in a separate column. Nonmajor funds are aggregated and presented in a single column. Fiduciary funds are reported by type. Fund Accounting The School District uses funds to maintain its financial records during the fiscal year. A fund is defined as a fiscal and accounting entity with a self-balancing set of accounts. The School District divides its funds into two categories: governmental and fiduciary. Governmental Funds: Governmental funds are those through which most governmental functions of the School District typically are financed. Governmental fund reporting focuses on the sources, uses and balances of current financial resources. Expendable assets are assigned to the various governmental funds according to the purposes for which they may or must be used. Current liabilities are assigned to the fund from which they will be paid. The difference between governmental fund assets and liabilities is reported as fund balance. The following are the School District's major governmental funds: General Fund - The General Fund is the operating fund of the School District and is used to
account for and report all financial resources except those required to be accounted for in another fund. The General Fund balance is available to the School District for any purpose provided it is expended or transferred according to the general laws of Ohio.
Permanent Improvement Fund - The Permanent Improvement Capital Projects Fund accounts for
and report restricted property taxes and associated intergovernmental revenues levied to be used for various capital improvements within the School District.
The nonmajor governmental funds of the School District account for grants and other resources whose use is restricted to a particular purpose.
Greenville City School District Notes to the Basic Financial Statements
For the Fiscal Year Ended June 30, 2012
28
NOTE 2 - SUMMARY OF SIGNIFICANT ACCOUNTING POLICIES (continued) Fiduciary Funds: Fiduciary fund reporting focuses on net assets and changes in net assets. The fiduciary fund category is split into four classifications: pension trust funds, investment trust funds, private purpose trust funds and agency funds. Private purpose trust funds are used to account for assets held by the School District under a trust agreement for individuals, private organizations, or other governments and are therefore not available to support the School District’s own programs. The School District’s two trust funds are private purpose trusts which account for college scholarship programs for students and money which benefits other governments. The agency funds are custodial in nature (assets equal liabilities) and do not involve measurement of results of operations. The School District’s agency funds accounts for those student activities which consist of a student body, student president, student treasurer, and faculty advisor, and COBRA benefits. Measurement Focus Government-wide Financial Statements: The government-wide financial statements are prepared using the economic resources measurement focus. All assets and liabilities associated with the operation of the School District are included on the statement of net assets. The statement of activities presents increases (e.g., revenues) and decreases (e.g., expenses) in total net assets. Fund Financial Statements: All governmental funds are accounted for using a flow of current financial resources measurement focus. With this measurement focus, only current assets and current liabilities generally are included on the balance sheet. The statement of revenues, expenditures and changes in fund balances reports on the sources (i.e., revenues and other financing sources) and uses (i.e., expenditures and other financing uses) of current financial resources. This approach differs from the manner in which the governmental activities of the government-wide financial statements are prepared. Governmental fund financial statements therefore include a reconciliation with brief explanations to better identify the relationship between the government-wide statements and the statements for governmental funds. The private purpose trust funds are reported using the economic resources measurement focus. Basis of Accounting The basis of accounting determines when transactions are recorded in the financial records and reported on the financial statements. Government-wide financial statements and the financial statements of the fiduciary funds are prepared using the accrual basis of accounting. Governmental funds use the modified accrual basis of accounting. Differences in the accrual and the modified accrual basis of accounting arise in the recognition of revenue, the recording of deferred revenue, and in the presentation of expenses versus expenditures.

Greenville City School District Notes to the Basic Financial Statements
For the Fiscal Year Ended June 30, 2012
29
NOTE 2 - SUMMARY OF SIGNIFICANT ACCOUNTING POLICIES (continued) Revenues - Exchange and Non-exchange Transactions: Revenue resulting from exchange transactions, in which each party gives and receives essentially equal value, is recorded on the accrual basis when the exchange takes place. On a modified accrual basis, revenue is recorded in the fiscal year in which the resources are measurable and become available. “Measurable” means that the amount of the transaction can be determined and “available” means that the resources are collectible within the current fiscal year, or are expected to be collected soon enough thereafter to be used to pay liabilities of the current fiscal year. For the School District, available means expected to be received within 60 days of fiscal year-end. Non-exchange transactions, in which the School District receives value without directly giving equal value in return, include property taxes and payment in lieu of taxes, income taxes, grants, entitlements and donations. On an accrual basis, revenue from income taxes is recognized in the fiscal year in which the exchange on which the tax is imposed takes place and revenue from property taxes is recognized in the fiscal year for which the taxes are levied (See Note 6). Revenue from grants, entitlements and donations is recognized in the fiscal year in which all eligibility requirements have been satisfied. Eligibility requirements include timing requirements, which specify the fiscal year when the resources are required to be used or the fiscal year when use is first permitted; matching requirements, in which the School District must provide local resources to be used for a specified purpose; and expenditure requirements, in which the resources are provided to the School District on a reimbursement basis. On a modified accrual basis, revenue from non-exchange transactions must also be available before it can be recognized. Under the modified accrual basis, the following revenue sources are considered to be both measurable and available at fiscal year-end: property taxes available as an advance, income taxes, tuition, student fees, grants, and interest. Deferred Revenue: Deferred revenue arises when assets are recognized before revenue recognition criteria have been satisfied. Property taxes for which there is an enforceable legal claim as of June 30, 2012, but which were levied to finance fiscal year 2013 operations, have been recorded as deferred revenue. Grants and entitlements received before the eligibility requirements are met are also recorded as deferred revenue. On governmental fund financial statements, receivables that will not be collected within the available period have also been reported as deferred revenue. Expenses/Expenditures: On the accrual basis of accounting, expenses are recognized at the time they are incurred. The measurement focus of governmental fund accounting is on decreases in net financial resources (expenditures) rather than expenses. Expenditures are generally recognized in the accounting period in which the related fund liability is incurred, if measurable. Allocation of costs, such as depreciation and amortization, are not recognized in governmental funds.

Greenville City School District Notes to the Basic Financial Statements
For the Fiscal Year Ended June 30, 2012
30
NOTE 2 - SUMMARY OF SIGNIFICANT ACCOUNTING POLICIES (continued) Cash and Cash Equivalents To improve cash management, all cash received by the School District is pooled with the exception of the monies held in a mutual fund for maintenance of the athletic track and appurtenances, which are invested separately. Monies for all funds are maintained in this pool. Individual fund integrity is maintained through School District records. Interest in the pool is presented as “Equity in Pooled Cash and Cash Equivalents”. The balance of grant activity administered and held by a fiscal agent is presented on the balance sheet as “Cash and Cash Equivalents with Fiscal Agent” and represents deposits of the Darke County Educational Service Center. In the past, the School District utilized a financial institution to service bonded debt as principal and interest payments were due. The balance in this account is presented on the financial statements as “Cash and Cash Equivalents with Fiscal Agent.” Employee advance insurance premium payments collected by the School District are presented on the balance sheet as “Cash and Cash Equivalents with Escrow Agent.” During fiscal year 2012, the School District invested in the State Treasury Asset Reserve of Ohio (STAROhio), negotiable certificates of deposit, and mutual funds. Investments are reported at fair value which is based on quoted market prices, except for mutual funds which are based on current share price. STAROhio is an investment pool managed by the State Treasurer’s Office which allows governments within the State to pool their funds for investment purposes. STAROhio is not registered with the SEC as an investment company, but does operate in a manner consistent with Rule 2a7 of the Investment Company Act of 1940. Investments in STAROhio are valued at STAROhio’s net asset value per share which is the price the investment could be sold for on June 30, 2012. Following Ohio Statutes, the Board of Education has, by resolution, specified the funds to receive an allocation of interest earnings. Investment earnings revenue credited to the General Fund during fiscal year 2012 amounted to $24,966, which includes $7,459 assigned from other School District funds. Investments of the cash management pool and investments with an original maturity of three months or less at the time they are purchased by the School District are presented on the financial statements as cash equivalents. Interfund Balances On fund financial statements, receivables and payables resulting from short-term interfund loans are classified as “Interfund Receivable” and “Interfund Payable”. These amounts are eliminated in the governmental activities column of the statement of net assets. Inventory Inventories are presented at cost on a first-in, first-out basis and are expended/expensed when used. Inventory consists of expendable supplies held for consumption and purchased food held for resale.

Greenville City School District Notes to the Basic Financial Statements
For the Fiscal Year Ended June 30, 2012
31
NOTE 2 - SUMMARY OF SIGNIFICANT ACCOUNTING POLICIES (continued) Prepaid Items Payments made to vendors for services that will benefit periods beyond June 30, 2012, are recorded as prepaid items using the consumption method. A current asset for the prepaid amount is recorded at the time of the purchase and an expenditure/expense is reported in the fiscal year in which services are consumed. Restricted Assets Assets are reported as restricted when limitations on their use change the nature or normal understanding of the availability of the asset. Such constraints are either externally imposed by creditors, contributors, grantors, or laws of other governments, or imposed by law through constitutional provisions or enabling legislation. Capital Assets The School District’s only capital assets are general capital assets. General capital assets are those assets specifically related to governmental activities. General capital assets usually result from expenditures in the governmental funds. These assets are reported in the governmental activities column of the government-wide statement of net assets but are not reported in the fund financial statements. All capital assets are capitalized at cost (or estimated historical cost, which is determined by indexing the current replacement costs back to the year of acquisition) and updated for additions and retirements during the fiscal year. Donated capital assets are recorded at their fair market values as of the date received. The School District maintains a capitalization threshold of $1,000. The School District does not possess any infrastructure. Improvements are capitalized; the costs of normal maintenance and repairs that do not add to the value of the asset or materially extend an asset’s life are not capitalized. All reported capital assets, except land and construction in progress, are depreciated. Improvements are depreciated over the remaining useful lives of the related capital assets. Depreciation is computed using the straight-line method over the following useful lives:
Description
Estimated Lives
Land Improvements 20 years
Buildings and Improvements 20-99 years
Machinery, Equipment and Fixtures 5-20 years
Vehicles 7-12 years
Accrued Liabilities and Long-Term Obligations All payables, accrued liabilities and long-term obligations are reported in the government-wide financial statements.

Greenville City School District Notes to the Basic Financial Statements
For the Fiscal Year Ended June 30, 2012
32
NOTE 2 - SUMMARY OF SIGNIFICANT ACCOUNTING POLICIES (continued) In general, governmental fund payables and accrued liabilities that, once incurred, are paid in a timely manner and in full from current financial resources, are reported as obligations of the funds. However, compensated absences that will be paid from governmental funds are reported as a liability in the fund financial statements only to the extent that they are due for payment during the current fiscal year. Compensated Absences Vacation benefits are accrued as a liability as the benefits are earned if the employees’ rights to receive compensation are attributable to services already rendered and it is probable that the School District will compensate the employees for the benefits through paid time off or some other means. The School District records a liability for accumulated unused vacation time when earned for all employees with more than one year of service. Sick leave benefits are accrued as a liability using the vesting method. The liability includes the employees who are currently eligible to receive termination benefits and those the School District has identified as probable of receiving payment in the future. The amount is based on accumulated sick leave and employees’ wage rates at fiscal year-end, taking into consideration any limits specified in the School District's termination policy. The School District records a liability for accumulated unused sick leave for all employees after 14 years of current service with the School District. The entire compensated absences liability is reported on the government-wide financial statements. On governmental fund financial statements, compensated absences are reported as liabilities and expenditures to the extent payments come due each period upon the occurrence of employee resignations and retirements. These amounts are recorded in the account “Matured Compensated Absences Payable” in the fund from which the employees are paid. Net Assets Net assets represent the difference between assets and liabilities. Net assets, invested in capital assets, consists of capital assets, net of accumulated depreciation. The School District has no debt. Net assets are reported as restricted when there are limitations imposed on their use either through the enabling legislation adopted by the School District or through external restrictions imposed by creditors, grantors or laws or regulations of other governments. Net assets restricted for other purposes include federal and State grants restricted to expenditures for specified purposes. The School District applies restricted resources when an expense is incurred for purposes for which both restricted and unrestricted net assets are available.

Greenville City School District Notes to the Basic Financial Statements
For the Fiscal Year Ended June 30, 2012
33
NOTE 2 - SUMMARY OF SIGNIFICANT ACCOUNTING POLICIES (continued) Fund Balance Fund balance is divided into five classifications based primarily on the extent to which the School District is bound to observe constraints imposed upon the use of the resources in the governmental funds. The classifications are as follows: Nonspendable The nonspendable fund balance category includes amounts that cannot be spent because they are not in spendable form, or are legally or contractually required to be maintained intact. The “not in spendable form” criterion includes items that are not expected to be converted to cash. Restricted Fund balance is reported as restricted when constraints placed on the use of resources are either externally imposed by creditors (such as through debt covenants), grantors, contributors, or laws or regulations of other governments or is imposed by law through constitutional provisions. Committed The committed fund balance classification includes amounts that can be used only for the specific purposes imposed by a formal action (resolution) of the School District. Those committed amounts cannot be used for any other purpose unless the Board removes or changes the specified use by taking the same type of action (resolution) it employed to previously commit those amounts. Committed fund balance also incorporates contractual obligations to the extent that existing resources in the fund have been specifically committed for use in satisfying those contractual requirements. Assigned Amounts in the assigned fund balance classification are intended to be used by the School District for specific purposes but do not meet the criteria to be classified as restricted or committed. In governmental funds other than the General Fund, assigned fund balance represents the remaining amount that is not restricted or committed. In the General Fund, assigned amounts represent fiscal year 2013 appropriations exceeding estimated resources and encumbered amounts for outstanding obligations. The Treasurer has been given authority to assign amounts for these purposes by the School District Board of Education. Unassigned Unassigned fund balance is the residual classification for the General Fund and includes all spendable amounts not contained in the other classifications. In nonmajor governmental funds, the unassigned classification is used only to report a deficit balance resulting from overspending for specific purposes for which amounts had been restricted, committed, or assigned.

Greenville City School District Notes to the Basic Financial Statements
For the Fiscal Year Ended June 30, 2012
34
NOTE 2 - SUMMARY OF SIGNIFICANT ACCOUNTING POLICIES (continued) The School District applies restricted resources first when expenditures are incurred for purposes for which either restricted or unrestricted (committed, assigned, and unassigned) amounts are available. Similarly, within unrestricted fund balance, committed amounts are reduced first followed by assigned, and then unassigned amounts when expenditures are incurred for purposes for which amounts in any of the unrestricted fund balance classifications could be used. Internal Activity Transfers within governmental activities are eliminated on the government-wide financial statements. Internal allocations of overhead expenses from one function to another or within the same function are eliminated on the statement of activities. Payments for interfund services provided and used are not eliminated. Exchange transactions between funds are reported as revenues in the seller funds and as expenditures/expenses in the purchaser funds. Flows of cash or goods from one fund to another without a requirement for repayment are reported as interfund transfers. Interfund transfers are reported as other financing sources/uses in governmental funds. Repayments from funds responsible for particular expenditures/expenses to the funds that initially paid for them are not presented on the financial statements. Estimates The preparation of the financial statements in conformity with generally accepted accounting principles requires management to make estimates and assumptions that affect the amounts reported in the financial statements and accompanying notes. Actual results may differ from those estimates. Budgetary Process All funds, other than the agency fund, are legally required to be budgeted and appropriated. The Bond Retirement Debt Service Fund was not budgeted because the School District did not receive or expend any money from this fund during fiscal year 2012. The major documents prepared are the tax budget, the appropriation resolution, and the certificate of estimated resources, all of which are prepared on the budgetary basis of accounting. The tax budget demonstrates a need for existing or increased tax rates. The certificate of estimated resources establishes a limit on the amounts that the Board of Education may appropriate. The appropriation resolution is the Board’s authorization to spend resources and sets annual limits on expenditures plus encumbrances at a level of control selected by the Board. The legal level of budgetary control has been established by the Board of Education at the object level within each fund and function. Any budgetary modifications at this level may only be made by resolution of the Board of Education. Advances-in and advances-out are not required to be budgeted since they represent a cash flow resource and are intended to be repaid.

Greenville City School District Notes to the Basic Financial Statements
For the Fiscal Year Ended June 30, 2012
35
NOTE 2 - SUMMARY OF SIGNIFICANT ACCOUNTING POLICIES (continued) The certificate of estimated resources may be amended during the fiscal year if projected increases or decreases in revenue are identified by the School District Treasurer. The amounts reported as the original budgeted amounts in the budgetary statements reflect the amounts in the certificate when the original appropriations were adopted. The amounts reported as the final budgeted amounts in the budgetary statements reflect the amounts in the certificate that was in effect at the time the final appropriations were passed by the Board of Education. The appropriation resolution is subject to amendment by the Board throughout the fiscal year with the restriction that appropriations may not exceed estimated revenues. The amounts reported as the original budgeted amounts reflect the first appropriation for that fund that covered the entire fiscal year, including amounts automatically carried over from prior fiscal years. The amounts reported as the final budgeted amounts represent the final appropriation amounts passed by the Board during the fiscal year, including all supplemental appropriations. NOTE 3 - ACCOUNTABILITY At June 30, 2012, Education Jobs, Title VI-B, Title I School Improvement, Title II-A, and Miscellaneous Federal Grants Special Revenue Funds had deficit fund balances of $58,931, $67,024, $23,592, $21,502, and $18,354, respectively. The General Fund provides transfers to cover deficit balances; however, this is done when cash is needed rather than when accruals occur. NOTE 4 - BUDGETARY BASIS OF ACCOUNTING While the School District is reporting financial position, results of operations and changes in fund balances on the basis of generally accepted accounting principles (GAAP), the budgetary basis as provided by law is based upon accounting for certain transactions on a basis of cash receipts, disbursements and encumbrances. The statement of revenues, expenditures and changes in fund balance - budget (non-GAAP basis) and actual for the General Fund is presented on the budgetary basis to provide a meaningful comparison of actual results with the budget. The major differences between the budget basis and GAAP basis are as follows:
1. Revenues are recorded when received in cash (budget) as opposed to when susceptible to accrual (GAAP).
2. Expenditures are recorded when paid in cash (budget) as opposed to when the liability is
incurred (GAAP).
3. Encumbrances are treated as expenditures (budget) rather than restricted, committed, or assigned fund balance (GAAP).
4. Advances are operating transactions (budget) as opposed to balance sheet transactions
(GAAP).

Greenville City School District Notes to the Basic Financial Statements
For the Fiscal Year Ended June 30, 2012
36
NOTE 4 - BUDGETARY BASIS OF ACCOUNTING (continued) 5. The change in the fair value of investments is not included on the budget basis operating
statement. This amount is included as revenue on the GAAP basis operating statement. The following table summarizes the adjustments necessary to reconcile the GAAP basis statements to the budgetary basis statements for the General Fund.
Net Change in Fund Balance General
GAAP Basis ($810,392) Revenue Accruals 332,691 Expenditure Accruals 183,986 Encumbrances (329,443) Advances (226,458) Change in Fair Value of Investment - FY11 5,326 Change in Fair Value of Investment - FY12 (14,346)Budget Basis ($858,636)
NOTE 5 - DEPOSITS AND INVESTMENTS Monies held by the School District are classified by State statute into three categories. Active monies are public monies determined to be necessary to meet current demands upon the School District treasury. Active monies must be maintained either as cash in the School District treasury, in commercial accounts payable or withdrawable on demand, including negotiable order of withdrawal (NOW) accounts, or in money market deposit accounts. Inactive deposits are public deposits that the Board of Education has identified as not required for use within the current five year period of designation of depositories. Inactive deposits must either be evidenced by certificates of deposit maturing not later than the end of the current period of designation of depositories, or by savings or deposit accounts including, but not limited to, passbook accounts.
Interim deposits are deposits of interim monies. Interim monies are those monies which are not needed for immediate use but which will be needed before the end of the current period of designation of depositories. Interim deposits must be evidenced by time certificates of deposit maturing not more than one year from the date of deposit, or by savings or deposit accounts, including passbook accounts. Interim monies held by the School District may be deposited or invested in the following securities:
1. United States Treasury notes, bills, bonds, or any other obligation or security issued by the United States Treasury or any other obligation guaranteed as to principal and interest by the United States;

Greenville City School District Notes to the Basic Financial Statements
For the Fiscal Year Ended June 30, 2012
37
NOTE 5 - DEPOSITS AND INVESTMENTS (continued) 2. Bonds, notes, debentures, or any other obligations or securities issued by any federal
government agency or instrumentality, including but not limited to, the Federal National Mortgage Association, Federal Home Loan Bank, Federal Farm Credit Bank, Federal Home Loan Mortgage Corporation, Government National Mortgage Association, and Student Loan Marketing Association. All federal agency securities shall be direct issuances of federal government agencies or instrumentalities;
3. Written repurchase agreements in the securities listed above;
4. Bonds and other obligations of the State of Ohio;
5. Time certificates of deposit or savings or deposit accounts including, but not limited to,
passbook accounts;
6. No-load money market mutual funds consisting exclusively of obligations described in division (1) or (2) above;
7. The State Treasurer’s investment pool (STAROhio); and
8. Commercial paper and bankers acceptances if training requirements have been met.
Investments in stripped principal or interest obligations, reverse repurchase agreements and derivatives are prohibited. The issuance of taxable notes for the purpose of arbitrage, the use of leverage and short selling are also prohibited. Investments may only be made through specified dealers and institutions. Investments As of June 30, 2012, the School District had the following investments. Except for the investment in the Washington Mutual Investors Mutual Fund, all investments are in an internal investment pool.
Fair Value Less than 1 1-3STAROhio $1,800,675 $1,800,675 $0Negotiable Certificates of Deposit 2,093,296 1,993,611 99,685Mutual Funds 20,123 20,123 0Totals $3,914,094 $3,814,409 $99,685
Maturities (in Years)Investment
Interest Rate Risk – The School District has no investment policy that addresses interest rate risk. State statute requires that an investment mature within five years from the date of purchase, unless matched to a specific obligation or debt of the School District, and that an investment must be purchased with the expectation that it will be held to maturity.

Greenville City School District Notes to the Basic Financial Statements
For the Fiscal Year Ended June 30, 2012
38
NOTE 5 - DEPOSITS AND INVESTMENTS (continued) Credit Risk – The mutual funds is unrated. A portion of the investment in the mutual funds is an investment of the endowment fund. The terms of the trust agreement require that the School District retain the investment in this mutual fund even though the School District could not properly purchase the fund as a trust investment and its retention might violate principals of investment diversification. STAROhio carries a rating of AAAm by Standard and Poor’s. Ohio law requires that STAROhio maintain the highest rating provided by at least one nationally recognized standard rating service and that the money market mutual fund be rated in the highest category at the time of purchase by at least one nationally recognized standard rating service. The negotiable certificates of deposit are in denominations of under $250,000 each, in separate banks, and are insured by the Federal Deposit Insurance Corporations (FDIC). The School District’s investment policy limits investments to those authorized by State statute. NOTE 6 - PROPERTY TAXES Property taxes are levied and assessed on a calendar year basis while the School District’s fiscal year runs from July through June. First half tax collections are received by the School District in the second half of the fiscal year. Second half tax distributions occur in the first half of the following fiscal year. Property taxes include amounts levied against all real and public utility property located in the School District. Real property tax revenue received in calendar year 2012 represents collections of calendar year 2011 taxes. Real property taxes received in calendar year 2012 were levied after April 1, 2011, on the assessed value listed as of January 1, 2011, the lien date. Assessed values for real property taxes are established by State statute at 35 percent of appraised market value. Real property taxes are payable annually or semi-annually. If paid annually, payment is due December 31; if paid semi-annually, the first payment is due December 31 with the remainder payable by June 20. Under certain circumstances, State statute permits alternate payment dates to be established. Public utility property tax revenue received in calendar year 2012 represents collections of calendar year 2011 taxes. Public utility real and tangible personal property taxes received in calendar year 2012 became a lien December 31, 2010, were levied after April 1, 2011, and are collected with real property taxes. Public utility real property is assessed at 35 percent of true value; public utility tangible personal property currently is assessed at varying percentages of true value. The School District receives property taxes from Darke County. The County Auditor periodically advances to the School District its portion of the taxes collected. Second-half real property tax payments collected by the County by June 30, 2012, are available to finance fiscal year 2012 operations. The amount available to be advanced can vary based on the date the tax bills are sent. Accrued property taxes receivable includes real property and public utility property taxes which were measurable as of June 30, 2012 and for which there is an enforceable legal claim. Although total property tax collections for the next fiscal year are measurable, only the amount of real property taxes available as an advance at June 30 was levied to finance current fiscal year operations and is reflected as revenue at fiscal year-end. The portion of the receivable not levied to finance current fiscal year operations is offset by a credit to deferred revenue.

Greenville City School District Notes to the Basic Financial Statements
For the Fiscal Year Ended June 30, 2012
39
NOTE 6 - PROPERTY TAXES (continued) The amount available as an advance at June 30, 2012, was $1,004,961 and is recognized as revenue: $962,721 in the General Fund and $42,240 in the Permanent Improvement Fund. The amount available as an advance at June 30, 2011, was $1,283,733 in the General Fund and $57,075 in the Permanent Improvement Fund. On an accrual basis, collectible delinquent property taxes have been recorded as a receivable and revenue, while on a modified accrual basis the revenue has been deferred. The assessed values upon which the fiscal year 2012 taxes were collected are:
2011 Second -
Half Collections
2012 First -
Half Collections
Amount
Percent
Amount
Percent Real Estate
$405,064,690
96.81%
$393,420,050
96.65%
Public Utility Personal
13,357,170
3.19
13,649,380
3.35
Total
$418,421,860
100.00%
$407,069,430
100.00%
Voted Tax Rate per $1,000 of Assessed Valuation
$37.45
$37.55
NOTE 7 - INCOME TAX The School District levies a voted tax of one-half percent for general operations on the income of residents and of estates. The tax was effective on January 1, 1990, and is a continuing tax. Employers of residents are required to withhold income tax on compensation and remit the tax to the State. Taxpayers are required to file an annual return. The State makes quarterly distributions to the School District after withholding amounts for administrative fees and estimated refunds. Income tax revenue is credited to the General Fund. NOTE 8 - RECEIVABLES Receivables at June 30, 2012, consisted of property taxes, income taxes, payment in lieu of taxes, accounts (tuition and student fees), intergovernmental grants, interfund, and accrued interest. All receivables are considered collectible in full due to the ability to foreclose for the nonpayment of taxes, the stable condition of State programs, and the current fiscal year guarantee of federal funds. All receivables, except property taxes are expected to be received within one year. Property taxes, although ultimately collectible, include some portion of delinquents that will not be collected within one year.

Greenville City School District Notes to the Basic Financial Statements
For the Fiscal Year Ended June 30, 2012
40
NOTE 8 – RECEIVABLES (continued) The School District receives payment in lieu of taxes from multiple Tax Increment Financing Agreements that were entered into between the School District and corporations. These payments will be received based on each individual agreement over the next seven years. A summary of the principal items of intergovernmental receivables follows:
AmountsGovernmental Activities: CAFS $1,834 Vocational Enhancement 8,000 Adult Basic Education 7,683 Title VI-B 103,090 Stimulus Title II Technology 5,602 Title I 387,371 Title I School Improvement A 84,324 Vocational Education 5,075 Title II-A 27,868 Education Jobs 119,832 Tax Increment Income Tax 9,261Total $759,940

Greenville City School District Notes to the Basic Financial Statements
For the Fiscal Year Ended June 30, 2012
41
NOTE 9 - CAPITAL ASSETS Capital assets activity for the fiscal year ended June 30, 2012, was as follows:
Balance At Balance At6/30/2011 Additions Deletions 6/30/2012
Governmental Activities:Capital Assets, Not Being Depreciated: Land $1,163,162 $0 $0 $1,163,162 Construction in Progress 95,317 722,636 (661,482) 156,471Total Capital Assets, Not Being Depreciated 1,258,479 722,636 (661,482) 1,319,633Depreciable Capital Assets: Land Improvements 795,319 16,660 0 811,979 Buildings and Improvements 10,448,636 710,325 0 11,158,961 Machinery, Equipment and Fixtures 5,263,312 117,979 (159,168) 5,222,123 Vehicles 1,850,585 282,410 (239,539) 1,893,456Total Depreciable Capital Assets 18,357,852 1,127,374 (398,707) 19,086,519Less Accumulated Depreciation: Land Improvements (376,401) (42,924) 0 (419,325) Buildings and Improvements (5,535,386) (448,513) 0 (5,983,899) Machinery, Equipment and Fixtures (4,020,487) (199,721) 144,244 (4,075,964) Vehicles (1,149,375) (123,504) 192,806 (1,080,073)Total Accumulated Depreciation (11,081,649) (814,662) * 337,050 (11,559,261)Depreciable Capital Assets, Net 7,276,203 312,712 (61,657) 7,527,258Governmental Activities Capital Assets, Net $8,534,682 $1,035,348 ($723,139) $8,846,891
* Depreciation expense was charged to governmental functions as follows:
Instruction: Regular $362,960 Special 32,870 Vocational 61,712 Adult/Continuing 716Support Services: Pupils 2,172 Instructional Staff 9,548 Board of Education 82 Administration 25,838 Fiscal 6,508 Operation and Maintenance of Plant 41,045 Pupil Transportation 126,348 Central 11,209Operation of Non-Instructional Services 104,572Extracurricular Activities 29,082Total Depreciation Expense $814,662

Greenville City School District Notes to the Basic Financial Statements
For the Fiscal Year Ended June 30, 2012
42
NOTE 10 - RISK MANAGEMENT Property and Liability The School District is exposed to various risks of loss related to torts; theft of, damage to, and destruction of assets; errors and omissions; injuries to employees; and natural disasters. During fiscal year 2012, the School District contracted with the Southwestern Ohio Educational Purchasing Council Property, Fleet and Liability Program (Note 16) for general liability, property, and fleet insurance. Settled claims have not exceeded this commercial coverage in the past three fiscal years. There have been no significant reductions in insurance coverage from the last fiscal year. Medical Benefits For fiscal year 2012, the School District participated in the Southwestern Ohio Educational Purchasing Council Benefit Plan Trust (Trust), a public entity shared risk pool consisting of 55 school districts (Note 16). The School District pays monthly premiums to the Trust for employee medical/surgical, vision, dental, life, and accidental death and dismemberment insurance benefits. The Trust is responsible for the management and operations of the program. Upon withdrawal from the Trust, a participant is responsible for the payment of all Trust liabilities to its employees, dependents, and designated beneficiaries accruing as a result of withdrawal. Workers’ Compensation For fiscal year 2012, the School District participated in the Southwestern Ohio Educational Purchasing Council Workers’ Compensation Group Rating Plan (GRP), an insurance purchasing pool (Note 16). The intent of the GRP is to achieve the benefit of a reduced premium for the School District by virtue of its grouping and representation with other participants in the GRP. The workers’ compensation experience of the participating school districts is calculated as one experience and a common premium rate is applied to all school districts in the GRP. Each participant pays its workers’ compensation premium to the State based on the rate for the GRP rather than its individual rate. Participation in the GRP is limited to school districts that can meet the GRP’s selection criteria. The firm of Corvel Corporation provides administrative, cost control, and actuarial services to the GRP. NOTE 11 - DEFINED BENEFIT PENSION PLANS School Employees Retirement System Plan Description – The School District participates in the School Employees Retirement System (SERS), a cost-sharing multiple-employer defined benefit pension plan. SERS provides retirement, disability and survivor benefits, annual cost-of-living adjustments, and death benefits to plan members and beneficiaries. Authority to establish and amend benefits is provided by Ohio Revised Code Chapter 3309. SERS issues a publicly available, stand-alone financial report that includes financial statements and required supplementary information. That report can be obtained by visiting the SERS website at www.ohsers.org under Employers/Audit Resources.

Greenville City School District Notes to the Basic Financial Statements
For the Fiscal Year Ended June 30, 2012
43
NOTE 11 - DEFINED BENEFIT PENSION PLANS (continued) Funding Policy – Plan members are required to contribute 10 percent of their annual covered salary and the School District is required to contribute 14 percent of annual covered payroll. The contribution requirements of plan members and employers are established and may be amended by the SERS’ Retirement Board up to statutory maximum amounts of 10 percent for plan members and 14 percent for employers. The Retirement Board, acting with the advice of the actuary, allocates the employer contribution rate among four of the System’s funds (Pension Trust Fund, Death Benefit Fund, Medicare B Fund, and Health Care Fund). For the fiscal year ended June 30, 2012, the allocation to pension and death benefits was 12.70 percent. The remaining 1.30 percent of the 14 percent employer contribution rate is allocated to the Medicare B and Health Care funds. The School District’s required contributions for pension obligations to SERS for the fiscal years ended June 30, 2012, 2011, and 2010 were $360,044, $332,906 and $211,454, respectively. The full amount has been contributed for fiscal years 2012, 2011 and 2010. State Teachers Retirement System of Ohio Plan Description – The School District participates in the State Teachers Retirement System of Ohio (STRS Ohio), a cost-sharing multiple-employer public employee retirement system. STRS Ohio provides retirement and disability benefits to members and death and survivor benefits to beneficiaries. STRS Ohio issues a stand-alone financial report that can be obtained by writing to STRS Ohio, 275 E. Broad St., Columbus, OH 43215-3771, by calling (888) 227-7877, or by visiting the STRS Ohio Web site at www.strsoh.org. New members have a choice of three retirement plans; a Defined Benefit (DB) Plan, a Defined Contribution (DC) Plan and a Combined Plan. The DB plan offers an annual retirement allowance based on final average salary multiplied by a percentage that varies based on years of service, or an allowance based on a member’s lifetime contributions and earned interest matched by STRS Ohio funds divided by an actuarially determined annuity factor. The DC Plan allows members to place all their member contributions and employer contributions equal to 10.5 percent of earned compensation into an investment account. Investment decisions are made by the member. A member is eligible to receive a retirement benefit at age 50 and termination of employment. The member may elect to receive a lifetime monthly annuity or a lump sum withdrawal. The Combined Plan offers features of both the DB Plan and the DC Plan. In the Combined Plan, member contributions are invested by the member, and employer contributions are used to fund the defined benefit payment at a reduced level from the regular DB Plan. The DB portion of the Combined Plan payment is payable to a member on or after age 60; the DC portion of the account may be taken as a lump sum payment or converted to a lifetime monthly annuity at age 50. Benefits are established by Ohio Revised Code Chapter 3307. A DB or Combined Plan member with five or more years of credited service who becomes disabled may qualify for a disability benefit. Eligible spouses and dependents of these active members who die before retirement may qualify for survivor benefits. Members in the DC Plan who become disabled are entitled only to their account balance. If a member of the DC Plan dies before retirement benefits begin, the member’s designated beneficiary is entitled to receive the member’s account balance.

Greenville City School District Notes to the Basic Financial Statements
For the Fiscal Year Ended June 30, 2012
44
NOTE 11 - DEFINED BENEFIT PENSION PLANS (continued) Funding Policy - Chapter 3307 of the Ohio Revised Code provides statutory authority for member and employer contributions. Contribution rates are established by the State Teachers Retirement Board, upon the recommendation of its consulting actuary, not to exceed statutory maximum rates of 10 percent for members and 14 percent for employers. For the fiscal year ended June 30, 2012, plan members were required to contribute 10 percent of their annual covered salary. The School District was required to contribute 14 percent; 13 percent was the portion used to fund pension obligations. The School District’s required contributions for pension obligations to STRS Ohio for the fiscal years ended June 30, 2012, 2011, and 2010 were $1,747,275, $1,658,175, and $1,614,977, respectively. For fiscal year 2012, 79.26 percent has been contributed, with the balance being reported as an intergovernmental payable. The full amount has been contributed for fiscal years 2011 and 2010. Contributions made to STRS Ohio for the DC Plan and for fiscal year 2012 were $11,432 made by the School District and $8,165 made by the plan members. In addition, member contributions of $33,580 were made for fiscal year 2012 for the defined contribution portion of the Combined Plan. NOTE 12 - POSTEMPLOYMENT BENEFITS School Employees Retirement System Plan Description – The School District participates in two cost-sharing multiple-employer defined benefit other postemployment benefit (OPEB) plans administrated by the School Employees Retirement System for non-certificated retirees and their beneficiaries, a Health Care Plan and a Medicare Part B Plan. The Health Care Plan includes hospitalization and physicians’ fees through several types of plans including HMO’s, PPO’s, Medicare Advantage, and traditional indemnity plans as well as a prescription drug program. The Medicare Part B Plan reimburses Medicare Part B premiums paid by eligible retirees and beneficiaries up to a statutory limit. Benefit provisions and the obligation to contribute are established by SERS based on authority granted by State statute. The financial reports of both Plans are included in the SERS Comprehensive Annual Financial Report which can be obtained on SERS’ website at www.ohsers.org under Employers/Audit Resources. Funding Policy - State statute permits SERS to fund the health care benefits through employer contributions. Each year, after the allocation for statutorily required benefits, the Retirement Board allocates the remainder of the employer contribution of 14 percent of covered payroll to the Health Care Fund. The Health Care Fund was established and is administered in accordance with Internal Revenue Code Section 105(e). For fiscal year 2012, 0.55 percent of covered payroll was allocated to health care. In addition, employers pay a surcharge for employees earning less than an actuarially determined amount; for fiscal year 2012, this amount was $35,800. During fiscal year 2012, the School District paid $42,150 in surcharge. Active employee members do not contribute to the Health Care Plan. Retirees and their beneficiaries are required to pay a health care premium that varies depending on the plan selected, the number of qualified years of service, Medicare eligibility and retirement status.

Greenville City School District Notes to the Basic Financial Statements
For the Fiscal Year Ended June 30, 2012
45
NOTE 12 - POSTEMPLOYMENT BENEFITS (continued) The School District’s contributions for health care for the fiscal years ended June 30, 2012, 2011, and 2010 were $57,742, $82,278, and $50,901, respectively. The full amount has been contributed for fiscal years 2012, 2011 and 2010. The Retirement Board, acting with advice of the actuary, allocates a portion of the employer contribution to the Medicare B Fund. For fiscal year 2012, this actuarially required allocation was 0.75 percent of covered payroll. The School District’s contributions for Medicare Part B for the fiscal years ended June 30, 2012, 2011, and 2010, were $21,262 $21,423, and $12,575 respectively. The full amount has been contributed for fiscal years 2012, 2011 and 2010. State Teachers Retirement System of Ohio Plan Description – The School District participates in the cost-sharing multiple-employer defined benefit Health Plan administered by the State Teachers Retirement System of Ohio (STRS Ohio) for eligible retirees who participated in the defined benefit or combined pension plans offered by STRS Ohio. Ohio law authorizes STRS to offer this plan. Benefits include hospitalization, physicians’ fees, prescription drugs and reimbursement of monthly Medicare Part B premiums. The Plan is included in the report of STRS Ohio which can be obtained by visiting www.strsoh.org or by calling (888) 227-7877. Funding Policy – Ohio Revised Code Chapter 3307 authorizes STRS Ohio to offer the Plan and gives the Retirement Board authority over how much, if any, of the health care costs will be absorbed by STRS Ohio. Active employee members do not contribute to the Health Care Plan. All benefit recipients, for the most recent year, pay a monthly premium. Under Ohio law, funding for post-employment health care may be deducted from employer contributions. For fiscal year 2012, STRS Ohio allocated employer contributions equal to one percent of covered payroll to post-employment health care. The School District’s contributions for health care for the fiscal years ended June 30, 2012, 2011, and 2010 were $134,406, $127,552, and $124,229 respectively. For fiscal year 2012, 79.26 percent has been contributed, with the balance being reported as an intergovernmental payable. The full amount has been contributed for fiscal years 2011 and 2010. NOTE 13 - OTHER EMPLOYEE BENEFITS Compensated Absences The criteria for determining vacation and sick leave benefits are derived from negotiated agreements and State laws. Eligible classified twelve-month employees and administrators earn 10 to 20 days of vacation per fiscal year, depending upon length of service. Teachers do not earn vacation time. Accumulated, unused vacation time is paid to classified employees and administrators upon termination of employment.

Greenville City School District Notes to the Basic Financial Statements
For the Fiscal Year Ended June 30, 2012
46
NOTE 13 - OTHER EMPLOYEE BENEFITS (continued) Teachers, administrators, and classified employees earn sick leave at the rate of one and one-fourth days per month. Sick leave may be accumulated up to a maximum of 215-250 days, depending on the number of months in the employee’s contract and the classification of the employee. Upon retirement, all employees, except administrators, who have worked continuously with the School District for at least 10 years, receive payment for one day of severance for every four days of accrued, but unused sick leave accrued to a maximum of 40 days. Administrators receive payment on the basis of 1.1 days of severance for every four days of sick leave accrued up to a maximum of 60 days. The Superintendent and Treasurer’s accruals are defined by their own individual contracts. All certified employees, other than administrators, with a minimum of 10 years of continuous full-time service in the School District, who elect to retire effective the end of the work year that the employee first becomes eligible to retire, receive a super-severance payment of 50 percent of the employee’s accumulated but unused sick leave to a maximum of 80 days. Payment of such severance is at the employee’s daily rate of pay at the time of retirement, excluding supplemental contracts. Any employee who elects not to retire at the end of the work year that the employee first becomes eligible to retire, forfeits the right to any payment and is only entitled to regular severance pay. Payment is made in two equal installments. The first payment is made within 15 days of receipt of confirmation from the retirement system that the employee is retired and receiving benefits. The second payment is made within 12 months of the first payment. In order to be eligible to receive super-severance, the employee must tender resignation for retirement purposes, effective at the end of the school year, no later than April 1 of the year the employee first becomes eligible to retire. If an employee retires beyond the end of the first work year that the employee first becomes eligible to retire, the employee will be eligible to receive 10 additional days of severance pay, providing the employee retires with service credit equal to 30 years, but less than 31 years. To qualify for the additional 10 days of pay, the employee must have a minimum of 15 years of continuous full-time service with the School District and meet all other requirements for super-severance. Under no circumstances will any employee be eligible to receive both super-severance and the additional 10 days. Administrators who have 10 years of continuous full-time service with the School District who resign for retirement purposes effective the end of the work year that the administrator first becomes eligible to retire, receive a bonus of nine percent of accumulated but unused sick leave to a maximum of 20 days. Payment of severance will be at the employee’s daily rate at the time of retirement, excluding supplemental contracts. Any employee who elects not to resign at the end of the work year the employee first becomes eligible to retire will forfeit the right to any payment, but will be entitled to severance pay. Payment will be made in two equal installments with the first being made within 15 days of the receipt of verification of retirement. The second payment will be made and received by the employee within 12 months of the first payment. Eligibility is contingent upon the tender of resignation by May 1 of the year prior to the issuance of a new contract. Insurance Benefits The School District provides medical/surgical, vision, dental, life, and accidental death and dismemberment insurance to most employees through the Southwestern Ohio Educational Purchasing Council Benefit Plan Trust (Note 16).

Greenville City School District Notes to the Basic Financial Statements
For the Fiscal Year Ended June 30, 2012
47
NOTE 14 - LONG-TERM OBLIGATIONS The changes in the School District’s long-term obligations during fiscal year 2012 were as follows:
Amount Amount AmountsOutstanding Outstanding Due Within6/30/2011 Additions Deductions 6/30/2012 One Year
Governmental Activities:Compensated Absences $1,143,577 $646,010 $812,933 $976,654 $123,695
Compensated absences will be paid from the General Fund and the Food Service, EMIS, Title VI-B, and Miscellaneous Federal Grants Special Revenue Funds. The School District's overall legal debt margin was $36,636,249 and the unvoted debt margin was $407,069 at June 30, 2012. NOTE 15 - INTERFUND ASSETS/LIABILITIES AND TRANSFERS The General Fund had an interfund receivable at June 30, 2012, of $900,495, while the Nonmajor governmental funds had interfund payables of $900,495. General Fund advances are made to move unrestricted balances to support programs and projects accounted for in other funds. Restricted monies are used to reimburse the General Fund for advancing monies to other funds due to timing differences in the receiving of grant monies. When the monies are finally received, the grant fund reimburses the General Fund for the initial advance. All interfund payables are expected to be repaid within one year. The General Fund had transfers out to the Nonmajor governmental funds of $193,555. Transfers are used to move General Fund revenues that are used to subsidize various programs in other funds. For fiscal year 2012, these programs included State and federal grants. NOTE 16 - JOINTLY GOVERNED ORGANIZATIONS, INSURANCE PURCHASING POOLS, PUBLIC ENTITY SHARED RISK POOL, AND RELATED ORGANIZATION Jointly Governed Organizations Metropolitan Dayton Educational Cooperative Association - The School District is a participant in the Metropolitan Dayton Educational Cooperative Association (MDECA) which is a computer consortium. MDECA is an association of public school districts within the boundaries of Montgomery, Miami and Darke Counties and the Cities of Dayton, Troy, and Greenville. The organization was formed for the purpose of applying modern technology with the aid of computers and other electronic equipment to administrative and instructional functions among member school districts. The governing board of MDECA consists of seven Superintendents of member school districts, with six of the Superintendents elected by majority vote of all member school districts except the Montgomery County Educational Service Center. The seventh Superintendent is from the Montgomery County Educational Service Center. Payments to MDECA are made from the General Fund. The School District paid MDECA $26,208 for services provided during the fiscal year. Financial information can be obtained from Dean Reineke, who serves as Executive Director, at 225 Linwood Street, Dayton, Ohio 45405.

Greenville City School District Notes to the Basic Financial Statements
For the Fiscal Year Ended June 30, 2012
48
NOTE 16 - JOINTLY GOVERNED ORGANIZATIONS, INSURANCE PURCHASING POOLS, PUBLIC ENTITY SHARED RISK POOL, AND RELATED ORGANIZATION (continued) Southwestern Ohio Educational Purchasing Council - The School District participates in the Southwestern Ohio Educational Purchasing Council (SOEPC), a purchasing council made up of nearly 100 school districts and educational service centers in 12 counties. The purpose of SOEPC is to obtain prices for quality merchandise and services commonly used by schools. All member districts are obligated to pay all fees, charges, or other assessments as established by the SOEPC. Each member district has one voting representative. Any district withdrawing from the SOEPC forfeits its claim to any and all SOEPC assets. One year prior notice is necessary for withdrawal from the group. During this time, the withdrawing member is liable for all member obligations during the one year period. Payments to SOEPC are made from the General Fund. During fiscal year 2012, the School District paid $1,574 to SOEPC. To obtain financial information, write to the Southwestern Ohio Educational Purchasing Council, Ken Swink, who serves as Director, at 303 Corporate Center Drive, Suite 208, Vandalia, OH 45377. Southwestern Ohio Instructional Technology Association - The Southwestern Ohio Instructional Technology Association (SOITA) is a not-for-profit corporation formed under Chapter 1702 of the Ohio Revised Code. The purpose of the corporation is to serve the educational needs of the area through television programming for the advancement of educational programs. The Board of Trustees is comprised of 21 representatives of SOITA member schools or institutions. Nineteen representatives are elected from within the counties by the qualified members within the counties, i.e., Auglaize, Butler, Champaign, Clark, Clinton, Darke, Fayette, Greene, Hamilton, Logan, Mercer, Miami, Montgomery, Preble, Shelby, and Warren. Montgomery, Greene and Butler Counties elect two representatives per area. All others elect one representative per area. One at-large non-public representative is elected by the non-public school SOITA members. One at-large higher education representative is elected by higher education SOITA members from within the State-assigned SOITA service area. All member districts are obligated to pay all fees, charges, or other assessments as established by the SOITA. Upon dissolution, the net assets shall be distributed to the federal government, or to a state or local government, for a public purpose. Payments to SOITA are made from the General Fund. During fiscal year 2012, the School District paid $1,648 to SOITA. To obtain financial information, write to the Southwestern Ohio Instructional Technology Association, Larry Pogue, who serves as Executive Director, at 150 East Sixth Street, Franklin, Ohio 45005. Insurance Purchasing Pools Southwestern Ohio Educational Purchasing Council Workers’ Compensation Group Rating Plan - The School District participates in the Southwestern Ohio Educational Purchasing Council Workers’ Compensation Group Rating Plan (GRP), an insurance purchasing pool. The GRP’s business and affairs are conducted by an 11 member Executive Committee consisting of the Chairperson, the Vice-Chairperson, a representative from the Montgomery County Educational Service Center and eight other members elected by majority vote of all member school districts. The Chief Administrator of GRP serves as the coordinator of the program. Each fiscal year, the participating school districts pay an enrollment fee to the GRP to cover the costs of administering the program.

Greenville City School District Notes to the Basic Financial Statements
For the Fiscal Year Ended June 30, 2012
49
NOTE 16 - JOINTLY GOVERNED ORGANIZATIONS, INSURANCE PURCHASING POOLS, PUBLIC ENTITY SHARED RISK POOL, AND RELATED ORGANIZATION (continued) Southwestern Ohio Educational Purchasing Council Property, Fleet, and Liability Program - The School District participates in the Southwestern Ohio Educational Purchasing Council Property, Fleet and Liability Program (PFL). The PFL’s business and affairs are conducted by a six member committee consisting of various PFL representatives that are elected by the general assembly. The purpose of the PFL of the SOEPC is to jointly provide or obtain casualty, property, employer liability, general liability, risk management, professional liability, group coverage and other protections for participants. Public Entity Shared Risk Pool Southwestern Ohio Educational Purchasing Council Benefit Plan Trust - The Southwestern Ohio Educational Purchasing Council Benefit Plan Trust (Trust) is a public entity shared risk pool consisting of 55 school districts. The Trust is organized as a Voluntary Employee Benefit Association under Section 501(c)(9) of the Internal Revenue Code and provides medical/surgical, dental, vision, life and accidental death and dismemberment insurance benefits to the employees of the participants. The Trust is governed by the Southwestern Ohio Educational Purchasing Council and its participating members. Each participant decides which plans offered by the Trust that will be extended to its employees. Participation in the Trust is by written application subject to acceptance by the Trust and payment of the monthly premiums. Financial information can be obtained from the Southwestern Ohio Educational Purchasing Council, 303 Corporate Center Drive, Suite 208, Vandalia, Ohio 45377. Related Organization Greenville Public Library - The Greenville Public Library is a distinct political subdivision of the State of Ohio created under Chapter 3375 of the Ohio Revised Code. The Library is governed by a Board of Trustees appointed by the Greenville City School District Board of Education. The Board of Trustees possesses its own contracting and budgeting authority, hires and fires personnel and does not depend on the School District for operational subsidies. Although the School District does serve as the taxing authority and may issue tax related debt on behalf of the Library, its role is limited to a ministerial function. The determination to request approval of a tax, the rate and the purpose are discretionary decisions made solely by the Board of Trustees. Financial information can be obtained from the Greenville Public Library, Dianna Wagner, Clerk/Treasurer, at 520 Sycamore Street, Greenville, Ohio 45331. NOTE 17 - SET-ASIDES The School District is required by State statute to annually set aside, in the General Fund, an amount based on a statutory formula for the acquisition and construction of capital improvements. Amounts not spent by fiscal year-end or offset by similarly restricted resources received during the fiscal year must be held in cash at fiscal year-end and carried forward to be used for the same purposes in future fiscal years.

Greenville City School District Notes to the Basic Financial Statements
For the Fiscal Year Ended June 30, 2012
50
NOTE 17 - SET-ASIDES (continued) The following cash basis information describes the change in the fiscal year-end set-aside amounts for capital acquisition. Disclosure of this information is required by State statute.
CapitalAcquisition
Set-aside Balance as of June 30, 2011 $0Current Fiscal Year Set-aside Requirement 472,078Qualifying Disbursements 0Current Fiscal Year Offsets (503,476)Set-aside Balance as of June 30, 2012 ($31,398)Set-aside Balance Carried Forward to Future Fiscal Years $0
Amounts of offsets and qualifying expenditures presented in the table for the capital acquisition set-asides were limited to those necessary to reduce the year-end balance to zero. Although the School District may have had additional offsets and qualifying expenditures for capital acquisitions, these amounts may not be used to reduce the set-aside requirements of future fiscal years and therefore is not presented as being carried forward to the next fiscal year. In previous fiscal years, the School District was required to have a textbook requirement. Effective July 1, 2011, House Bill 30 of the 129th General Assembly repealed the textbook requirement. NOTE 18 - DONOR-RESTRICTED ENDOWMENTS The School District’s Endowment Fund Private Purpose Trust Fund includes donor-restricted endowments. The Net Assets: Endowment amount of $19,933 represents the principal portion of the endowment. The amount of net appreciation in donor-restricted investments that is available for expenditures by the governing body is $33,204 and is included as net assets held in trust for other governments. State law permits the governing board to appropriate, for purposes consistent with the endowment’s intent, net appreciation, realized and unrealized, unless the endowment terms specify otherwise. The endowment indicates that the interest should be used to maintain a running track at one of the City of Greenville’s parks. NOTE 19 - CONTINGENCIES Grants The Auditor of State is currently performing a statewide review of supporting documentation for student attendance data reported to the Ohio Department of Education. The results of this review are still pending and will be reported separately to the Ohio Department of Education at a later date. The School District received financial assistance from federal and State agencies in the form of grants. The expenditure of funds received under these programs generally requires compliance with terms and conditions specified in the grant agreements and is subject to audit by the grantor agencies.

Greenville City School District Notes to the Basic Financial Statements
For the Fiscal Year Ended June 30, 2012
51
NOTE 19 – CONTINGENCIES (continued) Any disallowed claims resulting from such audits could become a liability of the General Fund or other applicable funds. This also encompasses the Auditor of State’s ongoing review of student attendance data. However, the effect of any such disallowed claims on the overall financial position of the School District at June 30, 2012, if applicable, cannot be determined at this time. Litigation The School District is not currently a party to any legal proceedings.
NOTE 20 –CHANGES IN ACCOUNTING PRINCIPLES For fiscal year 2012, the School District has implemented Governmental Accounting Standard Board (GASB) Statement No. 64, “Derivative Instruments: Application of Hedge Accounting Termination Provisions – an amendment of GASB Statement No. 53.” GASB Statement No. 64 clarifies whether an effective hedging relationship continues after the replacement of a swap counterparty or a swap counterparty's credit support provider. This Statement sets forth criteria that establish when the effective hedging relationship continues and hedge accounting should continue to be applied. The implementation of this Statement did not result in any change in the School District’s financial statements. NOTE 21 – CONTRACTUAL COMMITMENTS The following table provides a summary of the outstanding contractual commitments for gymnasium renovations as of June 30, 2012:
ContractorContractAmount
AmountExpended
AmountRemaining
Fryuman-Kuck Gen Contractor $415,277 $43,001 $372,276Mote & Associates 46,200 34,839 11,361
$461,477 $77,840 $383,637

Greenville City School District Notes to the Basic Financial Statements
For the Fiscal Year Ended June 30, 2012
52
NOTE 22 – FUND BALANCE Fund balance is classified as nonspendable, restricted, committed, assigned and/or unassigned based primarily on the extent to which the School District is bound to observe constraints imposed upon the use of the resources in the governmental funds. The constraints placed on fund balance for the major governmental funds and nonmajor governmental funds are presented below:
Permanent GovernmentalFund Balances General Improvement Funds Total
NonspendableInventory $34,752 $0 $1,968 $36,720Prepaid Items 24,011 0 2,022 26,033Unclaimed Monies 8,028 0 0 8,028Total Nonspendable 66,791 0 3,990 70,781
Restricted forPermanent Improvements 0 1,829,961 0 1,829,961Food Services 0 0 979,114 979,114Other Local Grants 0 0 2,517 2,517Education Foundation 0 0 25,701 25,701Athletics 0 0 105,705 105,705Auxillary Services 0 0 32,751 32,751Summer Intervention 0 0 7,151 7,151Vocational Enhancement 0 0 6,528 6,528Miscellaneous State Grants 0 0 10,548 10,548Adult Basic Education 0 0 4,626 4,626Vocational Education 0 0 13,650 13,650Title II Technology 0 0 25 25Title I 0 0 11,736 11,736Title III LEP 0 0 250 250Preschool Grant 0 0 465 465Total Restricted $0 $1,829,961 $1,200,767 $3,030,728
(continued)

Greenville City School District Notes to the Basic Financial Statements
For the Fiscal Year Ended June 30, 2012
53
NOTE 22 – FUND BALANCE (continued)
OtherPermanent Governmental
Fund Balances General Improvement Funds TotalCommitted toTermination Benefits $407,469 $0 $0 $407,469
Assigned toFuture Appropriations 2,350,611 0 0 2,350,611Debt Service 0 0 2,076 2,076Unpaid Obligations 245,226 0 0 245,226Total Assigned 2,595,837 0 2,076 2,597,913
Unassigned (Deficit) 4,097,217 0 (189,734) 3,907,483
Total Fund Balances $7,167,314 $1,829,961 $1,017,099 $10,014,374

Combining Financial Statements And
Individual Fund Schedules
54

55
Fund Descriptions – Nonmajor Governmental Funds
Nonmajor Special Revenue Funds
The Special Revenue Funds are used to account for and report the proceeds of specific revenue sources that are restricted or committed to expenditure for specified purposes other than debt service or capital projects. Following is a description of the School District’s nonmajor special revenue funds: Food Service Fund – This fund accounts for and reports restricted financial transactions related to the food service operations of the School District. Other Local Grants Fund – This fund accounts for and reports restricted proceeds of specific revenue sources. Not included are State and federal grants that are legally restricted to expenditures for specified purposes. These are often received from local government agencies in a competitive manner. Educational Foundation Fund – This fund accounts for and reports restricted proceeds of any bequest, gift, or endowment given to the School District, given without conditions or limitations; or, for the proceeds of a transfer from the General Fund of up to one-half of one percent of the total estimated appropriations included in the School District’s tax budget. Athletic Fund – This fund accounts for and reports restricted gate receipts and other revenues from athletic events and costs (except supplemental coaching contracts) of the athletic program, including transportation.
Auxiliary Fund – This fund accounts for and reports restricted revenues which provide services and materials to pupils attending non-public schools within the School District. EMIS Fund – This fund accounts for and reports restricted State monies which support the development of hardware and software or other costs associated with the requirements of the management information system. Entry Year Teachers Fund – This fund accounts for and reports restricted State monies which support implementing entry year programs pursuant to division (T) of Section 3317.024 of the Ohio Revised Code. Data Communications Fund – This fund accounts for and reports restricted money appropriated for Ohio Educational Computer Network Connections. Summer Intervention Fund – This fund accounts for and reports restricted State monies used for the Summer School program. Vocational Enhancement Fund – This fund accounts for and reports restricted State monies which support vocational education enhancements that expand the number of students enrolled in tech programs, and also enables students to develop career plans, to identify initial educational and career goals, and to develop a career passport which provides a clear understanding of the student’s knowledge, skills and credentials to present to future employers, universities, and other training institutes. This fund is also used to replace or update equipment essential for the instruction of students in job skills taught as part of a vocational program or programs approved for such instruction by the State Board of Education.
(continued)

56
Fund Descriptions – Nonmajor Governmental Funds (continued) Other State Grants Fund – This fund accounts and reports for various restricted grants received from the State of Ohio, which are not classified in a separate fund. Adult Basic Education Fund – This fund accounts for and reports restricted federal monies which supports persons 16 years of age and older who are not enrolled in school and who have less than a twelfth grade level education or its equivalent. The fund is used to develop basic education skills and to increase the opportunity of employment. Education Jobs Fund – This fund accounts for and reports restricted federal monies which provides compensation and benefits and other expenses, such as support services, necessary to retain existing employees, to recall or rehire former employees, and to hire new employees, in order to provide early childhood, elementary or secondary educational and related services. Title VI-B Fund – This fund accounts for and reports restricted federal monies used to educate the handicapped, to assist in the identification of handicapped students, the development of procedural safeguards, the implementation of least restrictive alternative service patterns, and the provision of full educational opportunities to handicapped children at the preschool, elementary and secondary levels. Vocational Education Carl Perkins Fund – This fund accounts for and reports restricted monies provided to the School District as established by the Carl D. Perkins Vocational Education Act of 1984. Fiscal Stabilization Fund – This fund accounts for and reports restricted federal monies from the American Recovery and Reinvestment Act in State Fiscal Stabilization Funds (SFSF) to help stabilize state and local budgets in order to minimize and avoid reductions in education and other essential services. Stimulus Title II Technology Fund – This fund accounts for and reports restricted federal monies for the focus of professional development and student learning through sustained, collaborative, job-embedded professional development and the use of research-based methods. Title I School Improvement Fund – This fund accounts for and reports restricted federal monies for economically disadvantaged school districts and some of their eligible schools for improving educational outcomes for students who are failing or at risk of failing to meet state standards. Title III LEP Fund – This fund accounts for and reports restricted federal monies which provide programs to meet the educational needs of children with limited English proficiency. Title I Fund – This fund accounts and reports for restricted federal monies used to provide financial assistance to meet the special needs of educationally deprived children. Drug Free Schools Fund – This fund accounts for and reports restricted federal monies which support the implementation of programs for drug abuse education and prevention. Preschool Grant Fund – This fund accounts for and reports restricted federal monies to assist schools in the identification of handicapped children, the development of procedural safeguards, the implementation of least restrictive alternative service patterns, and the provision of full educational opportunities to handicapped children at the preschool levels. A portion of this fund’s grant activity that is administered by a fiscal agent is not budgeted by the School District.
(continued)

57
Fund Descriptions – Nonmajor Governmental Funds (continued)
Title II-A Fund – This fund accounts and reports for restricted federal monies used to hire additional classroom teachers in grades one through three, so that the number of students per teacher will be reduced. Miscellaneous Federal Grants Fund – This fund accounts for and reports various restricted monies received through State agencies from the federal government, or directly from the federal government, which are not classified elsewhere.
Nonmajor Debt Service Fund To account for the accumulation of resources for, and the payment of, general long-term debt principal and interest.
Bond Retirement Fund – In the past, this fund was used to account for and report transfers of General Fund property tax revenue to assigned to pay general obligation bonded debt. No budgetary schedule is included because no budget was adopted for this fund and the School District did not receive or expend any money from the fund during the current fiscal year. The budgetary fund balance was $2,076 at June 30, 2012.

Greenville City School DistrictCombining Balance Sheet
Nonmajor Governmental FundsJune 30, 2012
Nonmajor Nonmajor TotalSpecial Debt NonmajorRevenue Service GovernmentalFunds Fund Funds
Assets:Equity in Pooled Cash and Cash Equivalents $2,178,240 $1,838 $2,180,078Cash and Cash Equivalents with Fiscal Agent 465 238 703Cash and Cash Equivalents with Escrow Agent 13,545 0 13,545Receivables: Accounts 3,147 0 3,147 Intergovernmental 748,845 0 748,845Inventory Held for Resale 9,930 0 9,930Materials and Supplies Inventory 1,968 0 1,968Prepaid Items 2,022 0 2,022Total Assets $2,958,162 $2,076 $2,960,238
Liabilities and Fund Balances:Liabilities:Accounts Payable $5,391 $0 $5,391Accrued Wages and Benefits Payable 219,380 0 219,380Contracts Payable 12,881 0 12,881Interfund Payable 900,495 0 900,495Intergovernmental Payable 64,977 0 64,977Retainage Payable 6,098 0 6,098Deferred Revenue 733,917 0 733,917Total Liabilities 1,943,139 0 1,943,139
Fund Balances:Nonspendable 3,990 0 3,990Restricted 1,200,767 0 1,200,767Assigned 0 2,076 2,076Unassigned (Deficit) (189,734) 0 (189,734)Total Fund Balances 1,015,023 2,076 1,017,099Total Liabilities and Fund Balances $2,958,162 $2,076 $2,960,238
58

Greenville City School DistrictCombining Statement of Revenues, Expenditures and Changes in Fund Balances
Nonmajor Governmental FundsFor the Fiscal Year Ended June 30, 2012
Nonmajor Nonmajor TotalSpecial Debt Nonmajor
Revenue Service GovernmentalFunds Fund Funds
Revenues:Extracurricular Activities $231,841 $0 $231,841Investment Earnings 928 0 928Intergovernmental 2,900,612 0 2,900,612Charges for Services 307,647 0 307,647Rent 410 0 410Gifts and Donations 46,986 0 46,986Miscellaneous 15,842 0 15,842Total Revenues 3,504,266 0 3,504,266
Expenditures:Current: Instruction: Regular 651,891 0 651,891 Special 584,897 0 584,897 Vocational 24,801 0 24,801 Adult/Continuing 48,271 0 48,271 Student Intervention Services 186,668 0 186,668 Support Services: Pupils 116,631 0 116,631 Instructional Staff 670,763 0 670,763 Administration 80,065 0 80,065 Business 273 0 273 Operation and Maintenance of Plant 55,191 0 55,191 Pupil Transportation 25,979 0 25,979 Central 78,060 0 78,060Operation of Non-Instructional Services 997,394 0 997,394Extracurricular Activities 259,765 0 259,765Capital Outlay 61,980 0 61,980Total Expenditures 3,842,629 0 3,842,629
Excess of Revenues Under Expenditures (338,363) 0 (338,363)
Other Financing Sources:Transfers In 193,555 0 193,555
Net Change in Fund Balances (144,808) 0 (144,808)
Fund Balances at Beginning of Year 1,159,831 2,076 1,161,907Fund Balances at End of Year $1,015,023 $2,076 $1,017,099
59

OtherFood Local Educational
Service Grants Foundation Athletic Auxiliary
Assets:Equity in Pooled Cash and Cash Equivalents $991,462 $2,517 $28,401 $92,247 $39,550Cash and Cash Equivalents with Fiscal Agent 0 0 0 0 0Cash and Cash Equivalents with Escrow Agent 0 0 0 13,545 0Receivables: Accounts 1,057 0 436 1,654 0 Intergovernmental 0 0 0 0 0Inventory Held for Resale 9,930 0 0 0 0Materials and Supplies Inventory 1,968 0 0 0 0Prepaid Items 0 0 0 0 0Total Assets $1,004,417 $2,517 $28,837 $107,446 $39,550
Liabilities and Fund Balances:Liabilities:Accounts Payable $220 $0 $2,700 $87 $1,025Accrued Wages and Benefits Payable 10,790 0 0 0 4,890Contracts Payable 0 0 0 0 0Interfund Payable 0 0 0 0 0Intergovernmental Payable 11,268 0 0 0 884Retainage Payable 0 0 0 0 0Deferred Revenue 1,057 0 436 1,654 0Total Liabilities 23,335 0 3,136 1,741 6,799
Fund Balances:Nonspendable 1,968 0 0 0 0Restricted 979,114 2,517 25,701 105,705 32,751Unassigned (Deficit) 0 0 0 0 0Total Fund Balances (Deficit) 981,082 2,517 25,701 105,705 32,751Total Liabilities and Fund Balances $1,004,417 $2,517 $28,837 $107,446 $39,550
Greenville City School DistrictCombining Balance Sheet
Nonmajor Special Revenue FundsJune 30, 2012
60

Other AdultSummer Vocational State Basic Education
EMIS Intervention Enhancement Grants Education Jobs Title VI-B
$2,530 $7,151 $6,579 $10,548 $9,932 $143,037 $122,849
0 0 0 0 0 0 0
0 0 0 0 0 0 0
0 0 0 0 0 0 00 0 8,000 0 7,683 119,832 103,0900 0 0 0 0 0 00 0 0 0 0 0 0
2,022 0 0 0 0 0 0$4,552 $7,151 $14,579 $10,548 $17,615 $262,869 $225,939
$0 $0 $0 $0 $0 $0 $01,584 0 0 0 1,349 63,939 70,696
0 0 0 0 0 0 00 0 8,000 0 7,683 119,832 103,090
1,277 0 51 0 1,274 18,197 16,0870 0 0 0 0 0 00 0 0 0 2,683 119,832 103,090
2,861 0 8,051 0 12,989 321,800 292,963
2,022 0 0 0 0 0 00 7,151 6,528 10,548 4,626 0 0
(331) 0 0 0 0 (58,931) (67,024)1,691 7,151 6,528 10,548 4,626 (58,931) (67,024)
$4,552 $7,151 $14,579 $10,548 $17,615 $262,869 $225,939(continued)
61

Vocational Stimulus Title IEducation Title II School
Carl Perkins Technology Improvement Title III LEP Title I
Assets:Equity in Pooled Cash and Cash Equivalents $15,053 $5,277 $5,732 $250 $446,165Cash and Cash Equivalents with Fiscal Agent 0 0 0 0 0Cash and Cash Equivalents with Escrow Agent 0 0 0 0 0Receivables: Accounts 0 0 0 0 0 Intergovernmental 5,075 5,602 84,324 0 387,371Invetory Held for Resale 0 0 0 0 0Materials and Supplies Inventory 0 0 0 0 0Prepaid Items 0 0 0 0 0Total Assets $20,128 $10,879 $90,056 $250 $833,536
Liabilities and Fund Balances:Liabilities:Accounts Payable $140 $0 $0 $0 $1,219Accrued Wages and Benefits Payable 1,005 0 0 0 37,632Contracts Payable 0 0 0 0 0Interfund Payable 5,076 5,252 29,324 0 387,371Intergovernmental Payable 257 0 0 0 8,207Retainage Payable 0 0 0 0 0Deferred Revenue 0 5,602 84,324 0 387,371Total Liabilities 6,478 10,854 113,648 0 821,800
Fund Balances:Nonspendable 0 0 0 0 0Restricted 13,650 25 0 250 11,736Unassigned (Deficit) 0 0 (23,592) 0 0Total Fund Balances (Deficit) 13,650 25 (23,592) 250 11,736Total Liabilities and Fund Balances $20,128 $10,879 $90,056 $250 $833,536
Greenville City School DistrictCombining Balance Sheet
Nonmajor Special Revenue Funds (continued)June 30, 2012
62

TotalNonmajor
Miscellaneous SpecialPreschool Federal Revenue
Grant Title II-A Grants Funds
$0 $30,874 $218,086 $2,178,240
465 0 0 465
0 0 0 13,545
0 0 0 3,1470 27,868 0 748,8450 0 0 9,9300 0 0 1,9680 0 0 2,022
$465 $58,742 $218,086 $2,958,162
$0 $0 $0 $5,3910 20,961 6,534 219,3800 0 12,881 12,8810 27,868 206,999 900,4950 3,547 3,928 64,9770 0 6,098 6,0980 27,868 0 733,9170 80,244 236,440 1,943,139
0 0 0 3,990465 0 0 1,200,767
0 (21,502) (18,354) (189,734)465 (21,502) (18,354) 1,015,023
$465 $58,742 $218,086 $2,958,162
63

OtherFood Local Educational
Service Grants Foundation Athletic AuxiliaryRevenues:Extracurricular Activities $0 $0 $479 $231,362 $0Investment Earnings 894 0 0 0 34Intergovernmental 715,909 0 0 0 87,541Charges for Services 301,722 0 5,925 0 0Rent 0 0 410 0 0Gifts and Donations 47 762 15,132 31,045 0Miscellaneous 2,753 0 230 12,809 50Total Revenues 1,021,325 762 22,176 275,216 87,625
Expenditures:Current: Instruction: Regular 0 0 12,216 0 0 Special 0 0 2,289 0 0 Vocational 0 0 0 0 0 Adult/Continuing 0 0 0 0 0 Student Intervention Services 0 0 846 0 0 Support Services: Pupils 0 0 1,887 0 0 Instructional Staff 0 0 0 0 0 Administration 0 0 0 0 0 Business 0 0 0 0 0
Greenville City School DistrictCombining Statement of Revenues, Expenditures and Changes in Fund Balances
Nonmajor Special Revenue FundsFor the Fiscal Year Ended June 30, 2012
Operation and Maintenance of Plant 0 0 0 0 0 Pupil Transportation 0 0 0 0 0 Central 0 0 0 0 0Operation of Non-Instructional Services 882,852 762 0 0 75,391Extracurricular Activities 0 0 0 259,765 0Capital Outlay 0 0 0 0 0Total Expenditures 882,852 762 17,238 259,765 75,391
Excess of Revenues Over (Under) Expenditures 138,473 0 4,938 15,451 12,234
Other Financing Sources:Transfers In 0 0 0 0 0
Net Change in Fund Balances 138,473 0 4,938 15,451 12,234
Fund Balances (Deficit) at Beginning of Year 842,609 2,517 20,763 90,254 20,517Fund Balances (Deficit) at End of Year $981,082 $2,517 $25,701 $105,705 $32,751
64

Other Adult Entry Year Data Summer Vocational State Basic Education
EMIS Teachers Communications Intervention Enhancement Grants Education Jobs
$0 $0 $0 $0 $0 $0 $0 $00 0 0 0 0 0 0 00 2,100 9,000 0 8,000 19,893 72,640 402,2820 0 0 0 0 0 0 00 0 0 0 0 0 0 00 0 0 0 0 0 0 00 0 0 0 0 0 0 00 2,100 9,000 0 8,000 19,893 72,640 402,282
0 0 9,000 0 0 3,197 0 393,9740 0 0 0 0 0 0 20,8280 0 0 0 8,004 0 0 00 0 0 0 0 0 48,271 00 0 0 0 0 0 0 14,845
0 0 0 0 378 1,881 0 31,566675 2,210 0 0 0 890 25,875 0
0 0 0 0 0 0 0 00 0 0 0 0 273 0 00 0 0 0 0 0 1,000 00 0 0 0 0 23,093 0 0
77,253 0 0 0 0 9 0 01,277 0 0 0 0 0 466 0
0 0 0 0 0 0 0 00 0 0 0 0 0 0 0
79,205 2,210 9,000 0 8,382 29,343 75,612 461,213
(79,205) (110) 0 0 (382) (9,450) (2,972) (58,931)
75,000 0 0 0 0 8,555 0 0
(4,205) (110) 0 0 (382) (895) (2,972) (58,931)
5,896 110 0 7,151 6,910 11,443 7,598 0$1,691 $0 $0 $7,151 $6,528 $10,548 $4,626 ($58,931)
(continued)
65

Vocational Stimulus Title IEducation Fiscal Title II School
Title VI-B Carl Perkins Stabilization Technology ImprovementRevenues:Extracurricular Activities $0 $0 $0 $0 $0Investment Earnings 0 0 0 0 0Intergovernmental 584,395 50,959 0 584 25,676Charges for Services 0 0 0 0 0Rent 0 0 0 0 0Gifts and Donations 0 0 0 0 0Miscellaneous 0 0 0 0 0Total Revenues 584,395 50,959 0 584 25,676
Expenditures:Current: Instruction: Regular 0 0 0 0 1,307 Special 126,763 0 0 0 0 Vocational 0 16,797 0 0 0 Adult/Continuing 0 0 0 0 0 Student Intervention Services 0 1,850 0 0 47,961 Support Services: Pupils 1,938 9,344 0 897 0 Instructional Staff 518,682 13,596 0 0 0 Administration 47,458 2,513 0 0 0 Business 0 0 0 0 0
Greenville City School DistrictCombining Statement of Revenues, Expenditures and Changes in Fund Balances
Nonmajor Special Revenue Funds (continued)For the Fiscal Year Ended June 30, 2012
Operation and Maintenance of Plant 0 0 54,191 0 0 Pupil Transportation 0 2,886 0 0 0 Central 0 0 0 0 0Operation of Non-Instructional Services 7,551 0 0 14 0Extracurricular Activities 0 0 0 0 0Capital Outlay 0 0 0 0 0Total Expenditures 702,392 46,986 54,191 911 49,268
Excess of Revenues Over (Under) Expenditures (117,997) 3,973 (54,191) (327) (23,592)
Other Financing Sources (Uses):Transfers In 0 0 0 0 0
Net Change in Fund Balances (117,997) 3,973 (54,191) (327) (23,592)
Fund Balances (Deficit) at Beginning of Year 50,973 9,677 54,191 352 0Fund Balances (Deficit) at End of Year ($67,024) $13,650 $0 $25 ($23,592)
66

TotalNonmajor
Miscellaneous SpecialDrug Free Preschool Federal Revenue
Title III LEP Title I Schools Grant Title II-A Grants Funds
$0 $0 $0 $0 $0 $0 $231,8410 0 0 0 0 0 928
2,548 605,215 75,000 23,096 115,301 100,473 2,900,6120 0 0 0 0 0 307,6470 0 0 0 0 0 4100 0 0 0 0 0 46,9860 0 0 0 0 0 15,842
2,548 605,215 75,000 23,096 115,301 100,473 3,504,266
0 0 0 0 66,542 165,655 651,8912,298 359,750 0 883 72,086 0 584,897
0 0 0 0 0 0 24,8010 0 0 0 0 0 48,2710 121,166 0 0 0 0 186,668
0 2,341 66,150 0 0 249 116,6310 73,429 5,100 23,058 6,673 575 670,7630 26,344 3,750 0 0 0 80,0650 0 0 0 0 0 2730 0 0 0 0 0 55,1910 0 0 0 0 0 25,9790 798 0 0 0 0 78,0600 28,831 0 0 250 0 997,3940 0 0 0 0 0 259,7650 0 0 0 0 61,980 61,980
2,298 612,659 75,000 23,941 145,551 228,459 3,842,629
250 (7,444) 0 (845) (30,250) (127,986) (338,363)
0 0 0 0 0 110,000 193,555
250 (7,444) 0 (845) (30,250) (17,986) (144,808)
0 19,180 0 1,310 8,748 (368) 1,159,831$250 $11,736 $0 $465 ($21,502) ($18,354) $1,015,023
67


68
Fund Descriptions – Fiduciary Funds
Fiduciary Funds
Fiduciary fund reporting focuses on net assets and changes in net assets. The fiduciary fund category is split into four classifications: pension trust funds, investment trust funds, private purpose trust funds and agency funds. Trust funds are used to account for assets held by the School District under a trust agreement for individuals, private organizations, or other governments and are therefore not available to support the School District’s own programs. The School District has two private purpose trust funds. Agency fund is purely custodial (assets equal liabilities) and thus do not involve measurement of results of operations.
Private Purpose Trust Funds
College Scholarship Fund – This fund accounts for monies donated to the School District to be used to award college scholarships to eligible high school seniors. Endowment Fund – This fund accounts for monies donated to the School District to be used to maintain a running track at one of the City of Greenville’s parks.
Agency Fund
Student Activities Fund – This fund accounts for those student activity programs which have student participation in the activity but do not have student management of the programs.

Greenville City School DistrictCombining Statement of Fiduciary Net Assets
Private Purpose Trust FundsJune 30, 2012
CollegeScholarship Endowment Total
Assets: Equity in Pooled Cash and Cash Equivalents $179,481 $53,137 $232,618 Notes Receivable 25,280 0 25,280Total Assets 204,761 53,137 257,898
Net Assets: Endowment 0 19,933 19,933 Held in Trust for Scholarships 204,761 0 204,761 Held in Trust for Other Governments 0 33,204 33,204Total Net Assets $204,761 $53,137 $257,898
69

Greenville City School DistrictCombining Statement of Changes in Fiduciary Net Assets
Private Purpose Trust FundsFor the Fiscal Year Ended June 30, 2012
CollegeScholarship Endowment Total
Additions:Investment Earnings ($164) $79 ($85)Gifts and Donations 3,905 0 3,905Miscellaneous 6,522 0 6,522Total Additions 10,263 79 10,342
Deductions:Payments in Accordance with Trust Agreements 7,000 0 7,000
Change in Net Assets 3,263 79 3,342
Net Assets at Beginning of Year 201,498 53,058 254,556Net Assets at End of Year $204,761 $53,137 $257,898
70

Greenville City School DistrictStatement of Changes in Assets and Liabilities
Agency FundFor the Fiscal Year Ended June 30, 2012
Beginning EndingBalance Balance
July 1, 2011 Additions Reductions June 30, 2012
Student Activities
Assets:Equity in Pooled Cash and Cash Equivalents $56,773 $154,162 $161,021 $49,914
Liabilities:Due to Students $56,773 $154,162 $161,021 $49,914
71

Greenville City School DistrictSchedule of Revenues, Expenditures and Changes
In Fund Balance - Budget (Non-GAAP Basis) and ActualGeneral Fund
For the Fiscal Year Ended June 30, 2012
Variance WithBudgeted Amounts Final Budget
PositiveOriginal Final Actual (Negative)
Revenues:Property Taxes $9,034,783 $9,034,783 $9,402,304 $367,521Income Taxes 1,795,344 1,795,344 1,858,478 63,134Payment in Lieu of Taxes 30,000 30,000 42,418 12,418Tuition and Fees 556,958 556,958 506,688 (50,270)Extracurricular Activities 105,544 105,544 113,790 8,246Investment Earnings 18,797 18,797 15,946 (2,851)Intergovernmental 12,720,246 12,720,246 13,368,532 648,286Charges for Services 74,620 51,991 55,991 4,000Rent 10,337 10,337 13,250 2,913Gifts and Donations 20,452 20,452 14,522 (5,930)Miscellaneous 46,558 47,174 53,369 6,195Total Revenues 24,413,639 24,391,626 25,445,288 1,053,662
Expenditures:Current: Instruction: Regular: Salaries and Wages 6,771,556 6,771,556 6,574,837 196,719 Fringe Benefits 2,459,138 2,461,537 2,316,274 145,263 Purchased Services 3,089,029 3,086,484 3,039,555 46,929 Materials and Supplies 270,532 287,855 221,495 66,360 Capital Outlay 46,178 46,126 33,280 12,846 Other 5,395 5,343 3,901 1,442 Total Regular 12,641,828 12,658,901 12,189,342 469,559
Special: Salaries and Wages 2,071,328 2,071,326 2,032,589 38,737 Fringe Benefits 748,211 744,208 726,824 17,384 Purchased Services 388,658 388,407 308,437 79,970 Materials and Supplies 4,861 9,477 8,458 1,019 Capital Outlay 200 750 499 251 Other 45,000 66,527 66,527 0 Total Special 3,258,258 3,280,695 3,143,334 137,361
Vocational: Salaries and Wages 1,218,912 1,245,127 1,243,242 1,885 Fringe Benefits 435,246 446,030 440,877 5,153 Purchased Services 58,564 38,911 31,483 7,428 Materials and Supplies 100,426 120,488 71,766 48,722 Capital Outlay 21,105 25,345 15,941 9,404 Other 2,628 3,128 1,844 1,284 Total Vocational 1,836,881 1,879,029 1,805,153 73,876
Adult/Continuing: Materials and Supplies 836 337 0 337
Student Intervention Services: Salaries and Wages 74,854 74,854 65,033 9,821 Fringe Benefits 24,153 24,153 23,636 517 Total Student Intervention Services $99,007 $99,007 $88,669 $10,338
(continued)
72

Greenville City School DistrictSchedule of Revenues, Expenditures and Changes
In Fund Balance - Budget (Non-GAAP Basis) and ActualGeneral Fund (continued)
For the Fiscal Year Ended June 30, 2012
Variance WithBudgeted Amounts Final Budget
PositiveOriginal Final Actual (Negative)
Other: Purchased Services $100,995 $106,994 $106,994 $0 Total Instruction 17,937,805 18,024,963 17,333,492 691,471
Support Services: Pupils: Salaries and Wages 728,500 729,100 727,219 1,881 Fringe Benefits 265,626 274,990 254,480 20,510 Purchased Services 146,678 178,088 159,462 18,626 Materials and Supplies 10,389 20,822 20,103 719 Capital Outlay 715 1,294 1,178 116 Total Pupils 1,151,908 1,204,294 1,162,442 41,852
Instructional Staff: Salaries and Wages 540,079 541,179 504,644 36,535 Fringe Benefits 402,112 402,557 303,515 99,042 Purchased Services 181,781 179,660 24,252 155,408 Materials and Supplies 17,430 21,594 19,049 2,545 Capital Outlay 0 499 499 0 Total Instructional Staff 1,141,402 1,145,489 851,959 293,530
Board of Education: Salaries and Wages 12,125 12,125 10,495 1,630 Fringe Benefits 1,798 2,065 1,872 193 Purchased Services 95,837 95,737 70,220 25,517 Materials and Supplies 1,000 1,307 1,207 100 Other 40,788 28,788 21,884 6,904 Total Board of Education 151,548 140,022 105,678 34,344
Administration: Salaries and Wages 1,409,390 1,409,390 1,357,334 52,056 Fringe Benefits 667,999 667,998 616,574 51,424 Purchased Services 57,444 63,383 60,403 2,980 Materials and Supplies 71,997 128,922 107,483 21,439 Capital Outlay 12,248 17,910 15,314 2,596 Other 12,850 18,650 14,121 4,529 Total Administration 2,231,928 2,306,253 2,171,229 135,024
Fiscal: Salaries and Wages 253,073 253,073 248,179 4,894 Fringe Benefits 151,630 159,630 138,588 21,042 Purchased Services 38,207 28,392 27,007 1,385 Materials and Supplies 3,500 3,515 3,503 12 Capital Outlay 3,850 3,850 744 3,106 Other 408,750 401,723 365,763 35,960 Total Fiscal 859,010 850,183 783,784 66,399
Business: Purchased Services 12,148 15,758 13,921 1,837 Materials and Supplies 950 1,950 1,062 888 Total Business $13,098 $17,708 $14,983 $2,725
(continued)
73

Greenville City School DistrictSchedule of Revenues, Expenditures and Changes
In Fund Balance - Budget (Non-GAAP Basis) and ActualGeneral Fund (continued)
For the Fiscal Year Ended June 30, 2012
Variance WithBudgeted Amounts Final Budget
PositiveOriginal Final Actual (Negative)
Operation and Maintenance of Plant: Salaries and Wages $513,819 $513,819 $503,613 $10,206 Fringe Benefits 280,605 280,659 244,238 36,421 Purchased Services 903,023 951,660 921,878 29,782 Materials and Supplies 103,791 118,048 114,386 3,662 Capital Outlay 3,500 3,899 9,200 (5,301) Other 0 9,200 1,418 7,782 Total Operation and Maintenance of Plant 1,804,738 1,877,285 1,794,733 82,552
Pupil Transportation: Salaries and Wages 506,061 506,062 483,362 22,700 Fringe Benefits 199,065 199,219 162,493 36,726 Purchased Services 40,352 43,842 37,162 6,680 Materials and Supplies 209,964 246,006 241,477 4,529 Capital Outlay 5,000 269,467 268,835 632 Other 25 25 0 25 Total Pupil Transportation 960,467 1,264,621 1,193,329 71,292
Central: Salaries and Wages 71,508 74,787 55,010 19,777 Fringe Benefits 23,646 27,478 15,472 12,006 Purchased Services 42,940 47,940 31,202 16,738 Capital Outlay 0 20,593 20,593 0 Total Central 138,094 170,798 122,277 48,521
Total Support Services 8,452,193 8,976,653 8,200,414 776,239
Operation of Non-Instructional Services: Community Services: Purchased Services 4,500 3,914 0 3,914 Materials and Supplies 3,540 6,690 4,848 1,842 Other 2,404 3,086 1,546 1,540 Total Non-Instructional Services 10,444 13,690 6,394 7,296
Extracurricular Activities: Salaries and Wages 289,421 304,115 288,179 15,936 Fringe Benefits 66,635 75,031 51,166 23,865 Purchased Services 6,000 6,000 5,425 575 Materials and Supplies 50 50 0 50 Total Extracurricular Activities 362,106 385,196 344,770 40,426
Capital Outlay: Other 0 198 0 198Total Expenditures 26,762,548 27,400,700 25,885,070 1,515,630
Excess of Revenues Under Expenditures ($2,348,909) ($3,009,074) ($439,782) $2,569,292
(continued)
74

Greenville City School DistrictSchedule of Revenues, Expenditures and Changes
In Fund Balance - Budget (Non-GAAP Basis) and ActualGeneral Fund (continued)
For the Fiscal Year Ended June 30, 2012
Variance WithBudgeted Amounts Final Budget
PositiveOriginal Final Actual (Negative)
Other Financing Sources (Uses):Insurance Recoveries $2,120 $2,120 $0 ($2,120)Proceeds from Sale of Capital Assets 3,350 3,350 0 (3,350)Refund of Prior Year Expenditures 23,747 23,747 1,577 (22,170)Refund of Prior Year Receipts (100) (600) (418) 182Advances In 0 0 995,386 995,386Advances Out 0 0 (1,221,844) (1,221,844)Transfers In 0 25,000 0 (25,000)Transfers Out (205,000) (194,976) (193,555) 1,421Total Other Financing Sources (Uses) (175,883) (141,359) (418,854) (277,495)
Net Change in Fund Balance (2,524,792) (3,150,433) (858,636) 2,291,797
Fund Balance at Beginning of Year 8,044,022 8,044,022 8,044,022 0Prior Year Encumbrances Appropriated 113,285 113,285 113,285 0Fund Balance at End of Year $5,632,515 $5,006,874 $7,298,671 $2,291,797
75

Greenville City School DistrictSchedule of Revenues, Expenditures and Changes
In Fund Balance - Budget (Non-GAAP Basis) and ActualPermanent Improvement Fund
For the Fiscal Year Ended June 30, 2012
Variance WithBudgeted Amounts Final Budget
PositiveOriginal Final Actual (Negative)
Revenues:Property Taxes $415,825 $415,825 $419,767 $3,942Intergovernmental 91,704 91,704 134,656 42,952Miscellaneous 100 100 0 (100)Total Revenues 507,629 507,629 554,423 46,794
Expenditures:Current: Instruction: Regular: Purchased Services 4,156 0 0 0 Capital Outlay 24,625 67,502 66,953 549 Total Regular 28,781 67,502 66,953 549
Vocational: Capital Outlay 5,500 7,500 3,036 4,464 Total Instruction 34,281 75,002 69,989 5,013
Support Services: Pupils: Capital Outlay 0 1,000 641 359
Administration: Purchased Services 4,324 0 0 0 Purchased Services 4,324 0 0 0 Capital Outlay 33,360 24,794 15,137 9,657 Total Administration 37,684 24,794 15,137 9,657
Fiscal: Other 11,087 12,237 11,442 795
Operation and Maintenance of Plant: Capital Outlay 13,800 15,800 8,261 7,539
Pupil Transportation: Capital Outlay 4,300 4,300 1,513 2,787
Central: Purchased Services 3,038 0 0 0 Capital Outlay 34,850 25,472 14,572 10,900 Total Central 37,888 25,472 14,572 10,900 Total Support Services 104,759 83,603 51,566 32,037
Capital Outlay: Building Improvement Services: Purchased Services 610,760 0 0 0 Capital Outlay 482,892 1,093,652 916,203 177,449Total Capital Outlay 1,093,652 1,093,652 916,203 177,449Total Expenditures 1,232,692 1,252,257 1,037,758 214,499
Net Change in Fund Balance (725,063) (744,628) (483,335) 261,293
Fund Balance at Beginning of Year 1,557,268 1,557,268 1,557,268 0Prior Year Encumbrances Appropriated 622,278 622,278 622,278 0Fund Balance at End of Year $1,454,483 $1,434,918 $1,696,211 $261,293
76

Greenville City School DistrictSchedule of Revenues, Expenditures and Changes
In Fund Balance - Budget (Non-GAAP Basis) and ActualFood Service Fund
For the Fiscal Year Ended June 30, 2012
Variance WithBudgeted Amounts Final Budget
PositiveOriginal Final Actual (Negative)
Revenues:Investment Earnings $499 $499 $894 $395Intergovernmental 540,370 540,370 604,645 64,275Charges for Services 312,739 312,739 301,722 (11,017)Gifts and Donations 159 159 47 (112)Miscellaneous 2,731 2,731 2,753 22Total Revenues 856,498 856,498 910,061 53,563
Expenditures:Current: Operation of Non-Instructional Services: Food Service Operations: Salaries and Wages 321,266 292,915 285,511 7,404 Fringe Benefits 153,325 170,183 140,723 29,460 Purchased Services 22,019 23,087 16,281 6,806 Materials and Supplies 261,934 305,934 297,808 8,126 Capital Outlay 18,979 13,979 9,181 4,798 Capital Outlay 18,979 13,979 9,181 4,798 Other 1,215 2,415 1,235 1,180 Total Food Service Operations 778,738 808,513 750,739 57,774
Community Services: Materials and Supplies 0 50 50 0Total Expenditures 778,738 808,563 750,789 57,774
Excess of Revenues Over Expenditures 77,760 47,935 159,272 111,337
Other Financing Uses: Refund of Prior Year Receipts (10) (10) 0 10
Net Change in Fund Balance 77,750 47,925 159,272 111,347
Fund Balance at Beginning of Year 830,434 830,434 830,434 0Prior Year Encumbrances Appropriated 150 150 150 0Fund Balance at End of Year $908,334 $878,509 $989,856 $111,347
77

Greenville City School DistrictSchedule of Revenues, Expenditures and Changes
In Fund Balance - Budget (Non-GAAP Basis) and ActualOther Local Grants Fund
For the Fiscal Year Ended June 30, 2012
Variance WithBudgeted Amounts Final Budget
PositiveOriginal Final Actual (Negative)
Revenues:Intergovernmental $0 $762 $762 $0
Expenditures:Current: Support Services: Pupils: Materials and Supplies 1,967 1,967 0 1,967
Operation of Non-Instructional Services: Community Services: Materials and Supplies 550 550 0 550 Other 0 762 762 0 Total Operation of Non-Instructional Services 550 1,312 762 550Total Expenditures 2,517 3,279 762 2,517
Net Change in Fund Balance (2,517) (2,517) 0 2,517g ( ) ( )
Fund Balance at Beginning of Year 2,517 2,517 2,517 0Fund Balance at End of Year $0 $0 $2,517 $2,517
78

Greenville City School DistrictSchedule of Revenues, Expenditures and Changes
In Fund Balance - Budget (Non-GAAP Basis) and ActualEducational Foundation Fund
For the Fiscal Year Ended June 30, 2012
Variance WithBudgeted Amounts Final Budget
PositiveOriginal Final Actual (Negative)
Revenues:Extracurricular Activities $0 $479 $479 $0Charges for Services 0 5,925 5,925 0Rent 0 410 410 0Gifts and Donations 4,232 15,132 15,132 0Miscellaneous 0 115 230 115Total Revenues 4,232 22,061 22,176 115
Expenditures:Current: Instruction: Regular: Salaries and Wages 90 90 0 90 Fringe Benefits 13 13 0 13 Purchased Services 1,958 2,155 196 1,959 Materials and Supplies 13,127 16,931 6,128 10,803 Capital Outlay 313 5,804 4,892 912 Other 0 500 500 0 Total Regular 15,501 25,493 11,716 13,777
Special: Materials and Supplies 1,700 1,700 0 1,700 Other 0 2,333 2,289 44 Total Special 1,700 4,033 2,289 1,744 Total Special 1,700 4,033 2,289 1,744
Vocational: Materials and Supplies 417 417 0 417
Student Intervention Services: Materials and Supplies 5,288 5,288 846 4,442
Other: Materials and Supplies 0 500 500 0 Total Instruction 22,906 35,731 15,351 20,380
Support Services: Pupils: Purchased Services 0 920 423 497 Materials and Supplies 796 3,025 1,464 1,561 Total Pupils 796 3,945 1,887 2,058
Instructional Staff: Materials and Supplies 6 6 0 6 Total Support Services 802 3,951 1,887 2,064
(continued)
79

Greenville City School DistrictSchedule of Revenues, Expenditures and Changes
In Fund Balance - Budget (Non-GAAP Basis) and ActualEducational Foundation Fund (continued)For the Fiscal Year Ended June 30, 2012
Variance WithBudgeted Amounts Final Budget
PositiveOriginal Final Actual (Negative)
Operation of Non-Instructional Services: Community Services: Materials and Supplies 435 435 0 435
Extracurricular Activities: Materials and Supplies 200 700 0 700 Other 653 653 0 653 Total Extracurricular Activities 853 1,353 0 1,353Total Expenditures 24,996 41,470 17,238 24,232
Net Change in Fund Balance (20,764) (19,409) 4,938 24,347
Fund Balance at Beginning of Year 20,764 20,764 20,764 0Fund Balance at End of Year $0 $1,355 $25,702 $24,347
80

Greenville City School DistrictSchedule of Revenues, Expenditures and Changes
In Fund Balance - Budget (Non-GAAP Basis) and ActualAthletic Fund
For the Fiscal Year Ended June 30, 2012
Variance WithBudgeted Amounts Final Budget
PositiveOriginal Final Actual (Negative)
Revenues:Extracurricular Activities $213,415 $222,437 $231,362 $8,925Gifts and Donations 12,386 27,474 31,045 3,571Miscellaneous 13,034 15,247 12,809 (2,438)Total Revenues 238,835 265,158 275,216 10,058
Expenditures:Extracurricular Activities: Salaries and Wages 1,300 5,410 5,410 0 Purchased Services 138,533 192,850 192,850 0 Materials and Supplies 27,836 58,092 57,502 590 Capital Outlay 3,120 2,500 2,024 476 Other 17,555 18,637 18,637 0Total Expenditures 188,344 277,489 276,423 1,066
Excess of Revenues Over (Under) Expenditures 50,491 (12,331) (1,207) 11,124
Other Financing Sources (Uses):Transfer In 80,700 53,700 0 (53,700)Transfer Out 0 (53,700) 0 53,700Total Other Financing Sources (Uses) 80,700 0 0 0
Net Change in Fund Balance 131,191 (12,331) (1,207) 11,124
Fund Balance at Beginning of Year 81,650 81,650 81,650 0Prior Year Encumbrances Appropriated 5,365 5,365 5,365 0Fund Balance at End of Year $218,206 $74,684 $85,808 $11,124
81

Greenville City School DistrictSchedule of Revenues, Expenditures and Changes
In Fund Balance - Budget (Non-GAAP Basis) and ActualAuxiliary Fund
For the Fiscal Year Ended June 30, 2012
Variance WithBudgeted Amounts Final Budget
PositiveOriginal Final Actual (Negative)
Revenues:Investment Earnings $35 $34 $34 $0Intergovernmental 70,000 87,541 87,541 0Miscellaneous 0 50 50 0Total Revenues 70,035 87,625 87,625 0
Expenditures:Current: Community Services: Salaries and Wages 35,531 30,630 25,788 4,842 Fringe Benefits 7,432 6,429 5,586 843 Purchased Services 32,812 10,000 9,103 897 Materials and Supplies 14,937 63,927 40,702 23,225 Capital Outlay 0 5,312 5,312 0Total Expenditures 90,712 116,298 86,491 29,807
Net Change in Fund Balance (20,677) (28,673) 1,134 29,807
Fund Balance at Beginning of Year 5,724 5,724 5,724 0Prior Year Encumbrances Appropriated 24,036 24,036 24,036 0Fund Balance at End of Year $9,083 $1,087 $30,894 $29,807
82

Greenville City School DistrictSchedule of Revenues, Expenditures and Changes
In Fund Balance - Budget (Non-GAAP Basis) and ActualEMIS Fund
For the Fiscal Year Ended June 30, 2012
Variance WithBudgeted Amounts Final Budget
PositiveOriginal Final Actual (Negative)
Revenues:Intergovernmental $0 $0 $0 $0
Expenditures: Current: Support Services: Instructional Staff: Purchased Services 700 808 675 133
Central: Salaries and Wages 33,249 33,299 33,290 9 Fringe Benefits 21,753 20,953 19,814 1,139 Purchased Services 15,999 22,351 21,901 450 Total Central 71,001 76,603 75,005 1,598Total Expenditures 71,701 77,411 75,680 1,731
Excess of Revenues Under Expenditures (71,701) (77,411) (75,680) 1,731
Other Financing Sources (Uses):Transfers In 75,631 75,631 75,000 (631)Transfers Out (631) (631) 0 631Total Other Financing Sources (Uses) 75,000 75,000 75,000 0
Net Change in Fund Balance 3,299 (2,411) (680) 1,731
Fund Balance at Beginning of Year 3,210 3,210 3,210 0Fund Balance at End of Year $6,509 $799 $2,530 $1,731
83

Greenville City School DistrictSchedule of Revenues, Expenditures and Changes
In Fund Balance - Budget (Non-GAAP Basis) and ActualEntry Year Teachers Fund
For the Fiscal Year Ended June 30, 2012
Variance WithBudgeted Amounts Final Budget
PositiveOriginal Final Actual (Negative)
Revenues:Intergovernmental $0 $2,100 $2,100 $0
Expenditures: Current: Support Services: Instructional Staff: Salaries and Wages 0 1,800 1,800 0 Fringe Benefits 0 300 300 0 Purchased Services 110 110 110 0Total Expenditures 110 2,210 2,210 0
Net Change in Fund Balance (110) (110) (110) 0
Fund Balance at Beginning of Year 110 110 110 0g gFund Balance at End of Year $0 $0 $0 $0
84

Greenville City School DistrictSchedule of Revenues, Expenditures and Changes
In Fund Balance - Budget (Non-GAAP Basis) and ActualData Communications Fund
For the Fiscal Year Ended June 30, 2012
Variance WithBudgeted Amounts Final Budget
PositiveOriginal Final Actual (Negative)
Revenues:Intergovernmental $9,000 $9,000 $9,000 $0
Expenditures: Current: Instruction: Regular: Purchased Services 9,000 9,000 9,000 0
Excess of Revenues Over Expenditures 0 0 0 0
Other Financing Sources (Uses):Advances In 0 0 4,500 4,500Advances Out 0 0 (4,500) (4,500)Total Other Financing Sources (Uses) 0 0 0 0g ( )
Net Change in Fund Balance 0 0 0 0
Fund Balance at Beginning of Year 0 0 0 0Fund Balance at End of Year $0 $0 $0 $0
85

Greenville City School DistrictSchedule of Revenues, Expenditures and Changes
In Fund Balance - Budget (Non-GAAP Basis) and ActualSummer Intervention Fund
For the Fiscal Year Ended June 30, 2012
Variance WithBudgeted Amounts Final Budget
PositiveOriginal Final Actual (Negative)
Revenues:Intergovernmental $0 $0 $0 $0
Expenditures: Current: Instruction: Other: Salaries and Wages 6,200 6,200 0 6,200 Fringe Benefits 951 951 0 951Total Expenditures 7,151 7,151 0 7,151
Net Change in Fund Balance (7,151) (7,151) 0 7,151
Fund Balance at Beginning of Year 7,151 7,151 7,151 0Fund Balance at End of Year $0 $0 $7,151 $7,151
86

Greenville City School DistrictSchedule of Revenues, Expenditures and Changes
In Fund Balance - Budget (Non-GAAP Basis) and ActualVocational Enhancement Fund
For the Fiscal Year Ended June 30, 2012
Variance WithBudgeted Amounts Final Budget
PositiveOriginal Final Actual (Negative)
Revenues:Intergovernmental $8,000 $8,000 $0 ($8,000)
Expenditures:Current: Instruction: Vocational: Salaries and Wages 6,900 6,900 6,900 0 Fringe Benefits 1,100 1,100 1,100 0 Purchased Services 500 500 0 500 Total Instruction 8,500 8,500 8,000 500
Support Services: Pupils: Fringe Benefits 0 123 123 0 Materials and Supplies 581 457 380 77 Total Support Services 581 580 503 77ppTotal Expenditures 9,081 9,080 8,503 577
Excess of Revenues Under Expenditures (1,081) (1,080) (8,503) (7,423)
Other Financing Sources:Advances In 0 0 8,000 8,000
Net Change in Fund Balance (1,081) (1,080) (503) 577
Fund Balance at Beginning of Year 7,080 7,080 7,080 0Fund Balance at End of Year $5,999 $6,000 $6,577 $577
87

Greenville City School DistrictSchedule of Revenues, Expenditures and Changes
In Fund Balance - Budget (Non-GAAP Basis) and ActualOther State Grants Fund
For the Fiscal Year Ended June 30, 2012
Variance WithBudgeted Amounts Final Budget
PositiveOriginal Final Actual (Negative)
Revenues:Intergovernmental $20,110 $19,893 $19,893 $0
Expenditures: Current: Instruction: Regular: Salaries and Wages 100 100 0 100 Fringe Benefits 67 67 0 67 Materials and Supplies 724 885 161 724 Capital Outlay 0 3,036 3,036 0 Total Regular 891 4,088 3,197 891
Adult Continuing: Materials and Supplies 656 606 0 606
Student Intervention Services: Material and Supplies 5,135 5,135 0 5,135 Total Instruction 6,682 9,829 3,197 6,632
Support Services: Support Services: Pupils: Salaries and Wages 1,000 1,619 1,619 0 Fringe Benefits 169 264 262 2 Total Pupils 1,169 1,883 1,881 2
Instructional Staff: Salaries and Wages 600 600 0 600 Fringe Benefits 100 100 0 100 Purchased Services 5,443 2,238 1,764 474 Total Instructional Staff 6,143 2,938 1,764 1,174
Business: Purchased Services 0 273 273 0
Pupil Transportation: Capital Outlay 25,665 20,521 17,948 2,573 Other 0 5,145 5,145 0 Total Pupil Transportation 25,665 25,666 23,093 2,573
Central: Fringe Benefits 0 9 9 0
Total Support Services 32,977 30,769 27,020 3,749Total Expenditures 39,659 40,598 30,217 10,381
Excess of Revenues Under Expenditures (19,549) (20,705) (10,324) 10,381
(continued)
88

Variance WithBudgeted Amounts Final Budget
PositiveOriginal Final Actual (Negative)
Other Financing Sources:Transfers In $8,555 $8,555 $8,555 $0
Net Change in Fund Balance (10,994) (12,150) (1,769) 10,381
Fund Balance at Beginning of Year 10,130 10,130 10,130 0Prior Year Encumbrances Appropriated 2,186 2,186 2,186 0Fund Balance at End of Year $1,322 $166 $10,547 $10,381
Schedule of Revenues, Expenditures and ChangesIn Fund Balance - Budget (Non-GAAP Basis) and Actual
Other State Grants Fund (continued)For the Fiscal Year Ended June 30, 2012
Greenville City School District
89

Greenville City School DistrictSchedule of Revenues, Expenditures and Changes
In Fund Balance - Budget (Non-GAAP Basis) and ActualAdult Basic Education Fund
For the Fiscal Year Ended June 30, 2012
Variance WithBudgeted Amounts Final Budget
PositiveOriginal Final Actual (Negative)
Revenues:Intergovernmental $87,735 $87,736 $80,053 ($7,683)
Expenditures: Current: Instruction: Adult/Continuing: Salaries and Wages 32,557 38,940 38,901 39 Fringe Benefits 5,471 6,556 6,010 546 Purchased Services 386 0 0 0 Materials and Supplies 2,327 3,429 2,797 632 Capital Outlay 25 25 0 25 Total Instruction 40,766 48,950 47,708 1,242
Support Services: Instructional Staff: Salaries and Wages 21,302 24,556 20,016 4,540 Fringe Benefits 3,615 4,167 3,926 241 Purchased Services 4,913 4,655 1,766 2,889 Materials and Supplies 238 264 214 50
C it l O tl 432 432 0 432 Capital Outlay 432 432 0 432 Total Instructional Staff 30,500 34,074 25,922 8,152
Operation and Maintenance of Plant: Purchased Services 1,000 1,000 1,000 0
Pupil Transportation: Purchased Services 25 16 0 16 Total Support Services 31,525 35,090 26,922 8,168
Operation of Non-Instructional Services: Materials and Supplies 300 490 466 24Total Expenditures 72,591 84,530 75,096 9,434
Excess of Revenues Over Expenditures 15,144 3,206 4,957 1,751
Other Financing Sources (Uses):Advances In 0 0 17,683 17,683Transfers In 11,938 0 0 0Advances Out 0 0 (31,902) (31,902)Transfers Out (11,938) 0 0 0Total Other Financing Sources (Uses) 0 0 (14,219) (14,219)
Net Change in Fund Balance 15,144 3,206 (9,262) (12,468)
Fund Balance at Beginning of Year 17,542 17,542 17,542 0Prior Year Encumbrances Appropriated 1,153 1,153 1,153 0Fund Balance at End of Year $33,839 $21,901 $9,433 ($12,468)
90

Greenville City School DistrictSchedule of Revenues, Expenditures and Changes
In Fund Balance - Budget (Non-GAAP Basis) and ActualEducation Jobs Fund
For the Fiscal Year Ended June 30, 2012
Variance WithBudgeted Amounts Final Budget
PositiveOriginal Final Actual (Negative)
Revenues:Intergovernmental $508,466 $522,114 $402,282 ($119,832)
Expenditures: Current: Instruction: Regular: Salaries and Wages 0 277,805 224,382 53,423 Fringe Benefits 0 132,647 93,332 39,315 Total Regular 0 410,452 317,714 92,738
Special: Salaries and Wages 18,000 18,000 14,238 3,762 Fringe Benefits 3,072 3,072 2,534 538 Total Special 21,072 21,072 16,772 4,300
Student Intervention Services: Salaries and Wages 332,000 23,194 12,721 10,473 Fringe Benefits 100,394 12,396 2,067 10,329 Total Student Intervention Services 432,394 35,590 14,788 20,802 Total Instruction 453,466 467,114 349,274 117,840
Support Services: Pupils: Salaries and Wages 45,000 45,000 25,815 19,185 Fringe Benefits 10,000 10,000 3,988 6,012 Total Pupils 55,000 55,000 29,803 25,197 Total Support Services $55,000 $55,000 $29,803 $25,197
Total Expenditures 508,466 522,114 379,077 143,037
Excess of Revenues Over Expenditures 0 0 23,205 23,205
Other Financing Sources (Uses):Advances In 0 0 229,832 229,832Advances Out 0 0 (110,000) (110,000)Total Other Financing Sources (Uses) 0 0 119,832 119,832
Net Change in Fund Balance 0 0 143,037 143,037
Fund Balance at Beginning of Year 0 0 0 0Fund Balance at End of Year $0 $0 $143,037 $143,037
91

Greenville City School DistrictSchedule of Revenues, Expenditures and Changes
In Fund Balance - Budget (Non-GAAP Basis) and ActualTitle VI-B Fund
For the Fiscal Year Ended June 30, 2012
Variance WithBudgeted Amounts Final Budget
PositiveOriginal Final Actual (Negative)
Revenues:Intergovernmental $848,115 $848,115 $745,025 ($103,090)
Expenditures: Current: Instruction: Special: Purchased Services 129,663 129,124 115,124 14,000 Materials and Supplies 4,529 4,718 1,317 3,401 Capital Outlay 10,210 10,560 10,560 0 Total Instruction 144,402 144,402 127,001 17,401
Support Services: Pupils: Salaries and Wages 3,000 3,000 1,500 1,500 Fringe Benefits 253 253 32 221 Purchased Services 10,000 10,000 0 10,000 Capital Outlay 830 830 830 0 Total Pupils 14,083 14,083 2,362 11,721
Instructional Staff: Salaries and Wages 371,366 371,366 307,990 63,376 Fringe Benefits 239,133 239,132 218,142 20,990 Purchased Services 400 400 353 47 Total Instructional Staff 610,899 610,898 526,485 84,413
Administration: Salaries and Wages 32,830 32,830 27,581 5,249 Fringe Benefits 22,308 22,308 19,010 3,298 Total Administration 55,138 55,138 46,591 8,547 Total Support Services 680,120 680,119 575,438 104,681
Operation of Non-Instructional Services: Community Services: Salaries and Wages 6,500 6,500 6,500 0 Fringe Benefits 1,799 1,799 1,031 768 Total Operation of Non-Instructional Services 8,299 8,299 7,531 768Total Expenditures 832,821 832,820 709,970 122,850
Excess of Revenues Over Expenditures 15,294 15,295 35,055 19,760
(continued)
92

Variance WithBudgeted Amounts Final Budget
PositiveOriginal Final Actual (Negative)
Other Financing Sources (Uses):Advances In $0 $0 $103,090 $103,090Advances Out 0 0 (268,359) (268,359)Total Other Financing Sources (Uses) 0 0 (165,269) (165,269)
Net Change in Fund Balance 15,294 15,295 (130,214) (145,509)
Fund Balance at Beginning of Year 252,527 252,527 252,527 0Prior Year Encumbrances Appropriated 539 539 539 0Fund Balance at End of Year $268,360 $268,361 $122,852 ($145,509)
Schedule of Revenues, Expenditures and ChangesIn Fund Balance - Budget (Non-GAAP Basis) and Actual
Title VI-B Fund (continued)For the Fiscal Year Ended June 30, 2012
Greenville City School District
93

Greenville City School DistrictSchedule of Revenues, Expenditures and Changes
In Fund Balance - Budget (Non-GAAP Basis) and ActualVocational Education Carl Perkins FundFor the Fiscal Year Ended June 30, 2012
Variance WithBudgeted Amounts Final Budget
PositiveOriginal Final Actual (Negative)
Revenues:Intergovernmental $62,497 $63,239 $58,164 ($5,075)
Expenditures: Current: Instruction: Vocational: Salaries and Wages 6,200 5,161 5,161 0 Fringe Benefits 1,100 832 832 0 Purchased Services 12,609 8,883 8,883 0 Materials and Supplies 528 668 640 28 Capital Outlay 7,000 10,114 10,114 0 Total Vocational 27,437 25,658 25,630 28
Student Intervention Services: Salaries and Wages 0 811 811 0 Fringe Benefits 0 134 134 0 Total Student Intervention Services 0 945 945 0 Total Instruction 27,437 26,603 26,575 28
Support Services: Pupils: Salaries and Wages 11,805 7,949 7,949 0 Fringe Benefits 1,930 1,419 1,419 0
Total Pupils 13 735 9 368 9 368 0 Total Pupils 13,735 9,368 9,368 0
Instructional Staff: Salaries and Wages 1,177 4,698 4,698 0 Fringe Benefits 182 705 705 0 Purchased Services 8,850 9,124 9,124 0 Other 0 392 392 0 Total Instructional Staff 10,209 14,919 14,919 0
Administration: Salaries and Wages 1,994 1,994 1,994 0 Fringe Benefits 517 517 517 0 Total Administration 2,511 2,511 2,511 0
Pupil Transportation: Purchased Services 1,651 2,886 2,886 0 Total Support Services 28,106 29,684 29,684 0Total Expenditures 55,543 56,287 56,259 28
Excess of Revenues Over Expenditures 6,954 6,952 1,905 (5,047)
Other Financing Sources (Uses):Advances In 0 0 13,076 13,076Advances Out 0 0 (20,280) (20,280)Total Other Financing Sources (Uses) 0 0 (7,204) (7,204)
Net Change in Fund Balance 6,954 6,952 (5,299) (12,251)
Fund Balance at Beginning of Year 8,866 8,866 8,866 0Prior Year Encumbrances Appropriated 4,459 4,459 4,459 0Fund Balance at End of Year $20,279 $20,277 $8,026 ($12,251)
94

Greenville City School DistrictSchedule of Revenues, Expenditures and Changes
In Fund Balance - Budget (Non-GAAP Basis) and ActualStimulus Title II Technology Fund
For the Fiscal Year Ended June 30, 2012
Variance WithBudgeted Amounts Final Budget
PositiveOriginal Final Actual (Negative)
Revenues:Intergovernmental $1,044 $6,297 $1,045 ($5,252)
Expenditures: Current: Instruction: Regular: Capital Outlay 0 4,990 0 4,990
Support Services: Pupils: Purchased Services 0 897 897 0
Administration: Salaries and Wages 0 200 0 200 Fringe Benefits 0 62 0 62 Total Administration 0 262 0 262 Total Support Services 0 1,159 897 262ota Suppo t Se v ces 0 , 59 897 6
Operation of Non-Instructional Services: Community Services: Purchased Services 0 37 14 23Total Expenditures 0 6,186 911 5,275
Excess of Revenues Over Expenditures 1,044 111 134 23
Other Financing Sources (Uses):Advances In 0 0 6,052 6,052Transfers In 934 0 0 0Advances Out 0 0 (1,845) (1,845)Transfers Out (934) 0 0 0Total Other Financing Sources (Uses) 0 0 4,207 4,207
Net Change in Fund Balance 1,044 111 4,341 4,230
Fund Balance at Beginning of Year 936 936 936 0Fund Balance at End of Year $1,980 $1,047 $5,277 $4,230
95

Greenville City School DistrictSchedule of Revenues, Expenditures and Changes
In Fund Balance - Budget (Non-GAAP Basis) and ActualTitle I School Improvement Fund
For the Fiscal Year Ended June 30, 2012
Variance WithBudgeted Amounts Final Budget
PositiveOriginal Final Actual (Negative)
Revenues:Intergovernmental $55,000 $55,000 $25,676 ($29,324)
Expenditures: Current: Instruction: Regular: Salaries and Wages 2,000 240 240 0 Fringe Benefits 500 39 39 0 Materials and Supplies 3,000 3,000 2,500 500 Capital Outlay 3,000 3,000 2,997 3 Total Regular 8,500 6,279 5,776 503
Special: Salaries and Wages 36,000 41,543 41,543 0 Fringe Benefits 9,000 7,178 6,418 760 Total Special 45,000 48,721 47,961 760 Total Instruction 53,500 55,000 53,737 1,263
Support Services: Instructional Staff: Purchased Services 1,500 0 0 0
Total Expenditures 55,000 55,000 53,737 1,263
Excess of Revenues Under Expenditures 0 0 (28,061) (28,061)
Other Financing Sources (Uses):Advances In 0 0 39,324 39,324Advances Out 0 0 (10,000) (10,000)Total Other Financing Sources (Uses) 0 0 29,324 29,324
Net Change in Fund Balance 0 0 1,263 1,263
Fund Balance at Beginning of Year 0 0 0 0Fund Balance at End of Year $0 $0 $1,263 $1,263
96

Greenville City School DistrictSchedule of Revenues, Expenditures and Changes
In Fund Balance - Budget (Non-GAAP Basis) and ActualTitle III LEP Fund
For the Fiscal Year Ended June 30, 2012
Variance WithBudgeted Amounts Final Budget
PositiveOriginal Final Actual (Negative)
Revenues:Intergovernmental $0 $2,548 $2,548 $0
Expenditures: Current: Instruction: Special: Salaries and Wages 0 2,039 1,989 50 Fringe Benefits 0 509 309 200Total Expenditures 0 2,548 2,298 250
Excess of Revenues Over Expenditures 0 0 250 250
Other Financing Sources (Uses):Advances In 0 0 2,548 2,548Advances Out 0 0 (2,548) (2,548)Total Other Financing Sources (Uses) 0 0 0 0Total Other Financing Sources (Uses) 0 0 0 0
Net Change in Fund Balance 0 0 250 250
Fund Balance at Beginning of Year 0 0 0 0Fund Balance at End of Year $0 $0 $250 $250
97

Greenville City School DistrictSchedule of Revenues, Expenditures and Changes
In Fund Balance - Budget (Non-GAAP Basis) and ActualTitle I Fund
For the Fiscal Year Ended June 30, 2012
Variance WithBudgeted Amounts Final Budget
PositiveOriginal Final Actual (Negative)
Revenues:Intergovernmental $1,063,208 $1,057,665 $670,294 ($387,371)
Expenditures: Current: Instruction: Special: Salaries and Wages 272,934 323,486 256,322 67,164 Fringe Benefits 125,774 153,866 86,622 67,244 Purchased Services 155,250 153,096 6,130 146,966 Materials and Supplies 12,295 38,114 22,394 15,720 Capital Outlay 1,778 76,557 1,267 75,290 Total Special 568,031 745,119 372,735 372,384
Student Intervention Services: Salaries and Wages 76,737 128,728 103,409 25,319 Fringe Benefits 11,808 21,643 16,556 5,087
P h d S i 159 0 0 0 Purchased Services 159 0 0 0 Materials and Supplies 1,941 2,100 1,134 966 Total Student Intervention Services 90,645 152,471 121,099 31,372
Total Instruction 658,676 897,590 493,834 403,756
Support Services: Pupils: Purchased Services 0 2,101 2,101 0
Instructional Staff: Salaries and Wages 7,797 9,997 7,164 2,833 Fringe Benefits 2,399 4,184 1,146 3,038 Purchased Services 30,372 35,599 32,070 3,529 Materials and Supplies 9,628 8,100 5,856 2,244 Capital Outlay 32,800 29,023 28,975 48 Total Instructional Staff 82,996 86,903 75,211 11,692
Administration: Salaries and Wages 34,158 34,158 21,753 12,405 Fringe Benefits 8,906 8,907 7,573 1,334 Total Administration 43,064 43,065 29,326 13,739
(continued)
98

Variance WithBudgeted Amounts Final Budget
PositiveOriginal Final Actual (Negative)
Central: Salaries and Wages $0 $2,500 $691 $1,809 Fringe Benefits 0 756 107 649 Total Central 0 3,256 798 2,458 Total Support Services 126,060 135,325 107,436 27,889
Operation of Non-Instructional Services: Community Services: Salaries and Wages 16,875 16,875 14,717 2,158 Fringe Benefits 9,066 9,066 3,363 5,703 Purchased Services 4,824 70 0 70 Materials and Supplies 7,130 7,443 5,112 2,331 Capital Outlay (57) 4,384 4,384 0 Total Operation of Non-Instructional Services 37,838 37,838 27,576 10,262Total Expenditures 822,574 1,070,753 628,846 441,907
Excess of Revenues Over (Under) Expenditures 240,634 (13,088) 41,448 54,536
Other Financing Sources (Uses):
Greenville City School DistrictSchedule of Revenues, Expenditures and Changes
In Fund Balance - Budget (Non-GAAP Basis) and ActualTitle I Fund (continued)
For the Fiscal Year Ended June 30, 2012
Other Financing Sources (Uses):Advances In 0 0 437,371 437,371Transfers In 253,724 0 0 0Advances Out 0 0 (367,874) (367,874)Transfers Out (253,724) 0 0 0Total Other Financing Sources (Uses) 0 0 69,497 69,497
Net Change in Fund Balance 240,634 (13,088) 110,945 124,033
Fund Balance at Beginning of Year 324,237 324,237 324,237 0Prior Year Encumbrances Appropriated 6,720 6,720 6,720 0Fund Balance at End of Year $571,591 $317,869 $441,902 $124,033
99

Greenville City School DistrictSchedule of Revenues, Expenditures and Changes
In Fund Balance - Budget (Non-GAAP Basis) and ActualPreschool Grant Fund
For the Fiscal Year Ended June 30, 2012
Variance WithBudgeted Amounts Final Budget
PositiveOriginal Final Actual (Negative)
Revenues:Intergovernmental $0 $23,941 $23,941 $0
Expenditures:Current: Instruction: Special: Purchased Services 0 883 883 0
Support Services: Instructional Staff: Purchased Services 0 23,058 23,058 0Total Expenditures 0 23,941 23,941 0
Net Change in Fund Balance 0 0 0 0g
Fund Balance at Beginning of Year 0 0 0 0Fund Balance at End of Year $0 $0 $0 $0
100

Greenville City School DistrictSchedule of Revenues, Expenditures and Changes
In Fund Balance - Budget (Non-GAAP Basis) and ActualTitle IIA Fund
For the Fiscal Year Ended June 30, 2012
Variance WithBudgeted Amounts Final Budget
PositiveOriginal Final Actual (Negative)
Revenues:Intergovernmental $174,859 $174,669 $146,801 ($27,868)
Expenditures:Current: Instruction: Regular: Salaries and Wages 53,354 51,954 44,219 7,735 Fringe Benefits 13,089 25,827 21,180 4,647 Total Regular 66,443 77,781 65,399 12,382
Special: Salaries and Wages 67,635 68,559 53,161 15,398 Fringe Benefits 14,659 21,623 18,557 3,066 Total Special 82,294 90,182 71,718 18,464 Total Instruction 148,737 167,963 137,117 30,846
Support Services: Instructional Staff: Instructional Staff: Salaries and Wages 26 26 26 0 Fringe Benefits 4 4 4 0 Purchased Services 6,678 56 56 0 Materials and Supplies 0 507 507 0 Capital Outlay 0 6,116 6,116 0 Total Support Services 6,708 6,709 6,709 0
Operation of Non-Instructional Services: Community Services: Materials and Supplies 0 282 250 32Total Expenditures 155,445 174,954 144,076 30,878
Excess of Revenues Over (Under) Expenditures 19,414 (285) 2,725 3,010
Other Financing Sources (Uses):Advances In 0 0 42,868 42,868Transfers In 21,590 0 0 0Advances Out 0 0 (67,577) (67,577)Transfers Out (21,590) 0 0 0Total Other Financing Sources (Uses) 0 0 (24,709) (24,709)
Net Change in Fund Balance 19,414 (285) (21,984) (21,699)
Fund Balance at Beginning of Year 46,075 46,075 46,075 0Prior Year Encumbrances Appropriated 6,786 6,786 6,786 0Fund Balance at End of Year $72,275 $52,576 $30,877 ($21,699)
101

Greenville City School DistrictSchedule of Revenues, Expenditures and Changes
In Fund Balance - Budget (Non-GAAP Basis) and ActualMiscellaneous Federal Grants Fund
For the Fiscal Year Ended June 30, 2012
Variance WithBudgeted Amounts Final Budget
PositiveOriginal Final Actual (Negative)
Revenues:Intergovernmental $305,300 $305,300 $100,473 ($204,827)Gifts and Donations 20,000 20,000 0 (20,000)Total Revenues 325,300 325,300 100,473 (224,827)
Expenditures:Current: Instruction: Regular: Salaries and Wages 120,400 120,400 120,220 180 Fringe Benefits 43,454 43,456 41,311 2,145 Purchased Services 1,871 2,437 2,308 129 Materials and Supplies 3,000 3,263 2,291 972 Total Instruction 168,725 169,556 166,130 3,426
Support Services: Pupils: Salaries and Wages 400 400 400 0 Fringe Benefits 8 9 9 0 Fringe Benefits 8 9 9 0 Total Pupils 408 409 409 0
Instructional Staff: Purchased Services 415 576 576 0
Board of Education Purchased Services 576 0 0 0 Total Support Services 1,399 985 985 0
Building Improvement Services: Capital Outlay 0 250,000 250,000 0Total Expenditures 170,124 420,541 417,115 3,426
Excess of Revenues Over (Under) Expenditures 155,176 (95,241) (316,642) (221,401)
Other Financing Sources (Uses):Advances In 0 0 250,000 250,000Advances Out 0 0 (43,001) (43,001)Transfers In 110,000 110,000 110,000 0Total Other Financing Sources (Uses) 110,000 110,000 316,999 206,999
Net Change in Fund Balance 265,176 14,759 357 (14,402)
Fund Balance at Beginning of Year 9,650 9,650 9,650 0Prior Year Encumbrances Appropriated 621 621 621 0Fund Balance at End of Year $275,447 $25,030 $10,628 ($14,402)
102


103
STATISTICAL TABLES
This part of Greenville City School District’s comprehensive annual financial report presents detailed information as a context for understanding what the information in the financial statements, note disclosures, and required supplementary information says about the School District’s overall financial health. CONTENTS PAGES Financial Trends 104-111
These schedules contain trend information to help the reader understand how the School District’s financial performance and well-being have changed over time.
Revenue Capacity 112-119
These schedules contain information to help the reader assess the School District’s most significant local revenue source, the property tax.
Debt Capacity 120-122
These schedules present information to help the reader assess the affordability of the School District’s current levels of outstanding debt and the School District’s ability to issue additional debt in the future.
Demographic and Economic Information 123-125
These schedules offer demographic and economic indicators to help the reader understand the environment within which the School District’s financial activities take place.
Operating Information 126-140
These schedules contain service and infrastructure data to help the reader understand how the information in the School District’s financial report relates to the services the School District provides and the activities it performs.
Sources: Unless otherwise noted, the information in these schedules is derived from the comprehensive annual financial report for the relevant year. The School District implemented GAAP and GASB Statement No. 34 in fiscal year 2001. Prior to fiscal year 2001, the School District reported on the cash basis of accounting.

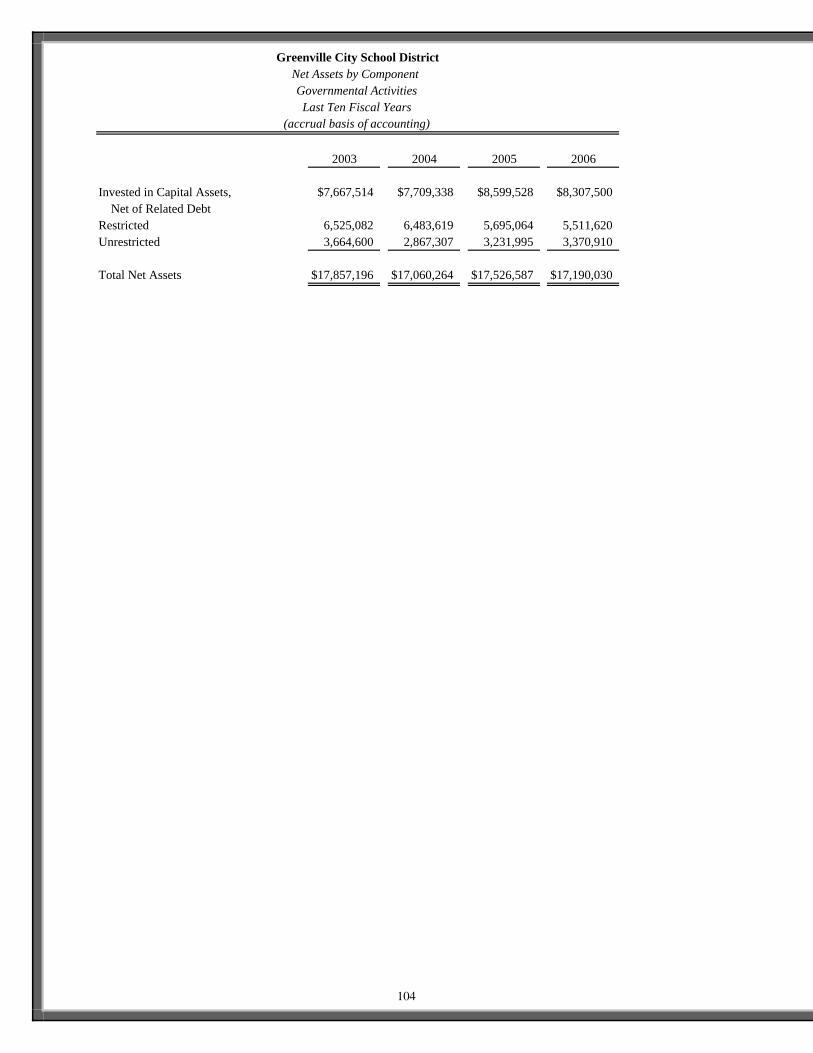
2003 2004 2005 2006
Invested in Capital Assets, $7,667,514 $7,709,338 $8,599,528 $8,307,500 Net of Related DebtRestricted 6,525,082 6,483,619 5,695,064 5,511,620Unrestricted 3,664,600 2,867,307 3,231,995 3,370,910
Total Net Assets $17,857,196 $17,060,264 $17,526,587 $17,190,030
Greenville City School DistrictNet Assets by Component Governmental ActivitiesLast Ten Fiscal Years
(accrual basis of accounting)
104

2007 2008 2009 2010 2011 2012
$8,171,218 $8,516,634 $9,022,960 $8,770,583 $8,534,682 $8,846,891
2,639,435 2,858,406 2,963,353 3,420,846 4,220,815 3,582,3376,494,390 6,317,289 4,142,312 5,424,967 7,452,791 6,831,556
$17,305,043 $17,692,329 $16,128,625 $17,616,396 $20,208,288 $19,260,784
105

2003 2004 2005 2006Program Revenues:
Charges for Services: Regular $174,684 $742,490 $800,389 $641,716 Special 576,147 1,922 0 0 Vocational 91,793 91,084 34,997 35,518 Student Intervention Services 0 0 0 0 Support Services: Pupils 2,045 0 0 0 Instructional Staff 0 92,471 0 0 Administration 9,148 0 0 98,021 Operation and Maintenance of Plant 17,212 21,504 0 34,969 Operation of Non-Instructional Services 611,244 429,571 430,169 427,445 Extracurricular Activites 292,224 268,212 285,776 256,951Operating Grants, Interest and Contributions 2,361,934 3,425,265 3,546,933 3,536,865Capital Grants and Contributions 288,447 70,286 49,048 207,054
Total Program Revenues 4,424,878 5,142,805 5,147,312 5,238,539
Expenses:Instruction: Regular 11,883,738 12,645,092 12,526,807 12,455,158 Special 2,878,228 2,959,202 3,039,156 3,194,259 Vocational 2,142,017 2,205,816 1,943,560 2,098,293 Adult/Continuing 54,162 67,869 49,695 50,486 Student Intervention Services 0 0 0 0Support Services: Pupils 1,311,750 1,305,710 1,314,884 1,381,441 Instructional Staff 1,545,155 1,843,966 1,675,355 1,871,785 Board of Education 88,026 117,591 2,252 99,409 Administration 2,655,241 2,493,331 2,527,629 2,539,784 Fiscal 618,585 649,546 640,694 673,503 Business 1,674 10,225 7,322 4,274 Operation and Maintenance of Plant 1,392,998 1,608,236 1,661,817 1,766,376 Pupil Transportation 870,835 949,851 983,334 945,453 Central 176,768 182,044 270,323 253,485Operation of Non-Instructional Services 1,055,510 1,077,056 1,177,013 1,128,785Extracurricular Activities 631,391 644,137 675,604 641,052Interest and Fiscal Charges 0 0 0 0
Intergovernmental 0 0 0 0Total Expenses 27,306,078 28,759,672 28,495,445 29,103,543
Net Expense (22,881,200) (23,616,867) (23,348,133) (23,865,004)
General Revenues:Property Taxes Levied for: General Purposes 8,772,961 9,213,233 9,035,051 9,110,575 Capital Outlay 513,170 530,739 536,050 500,598Income Taxes for General Purposes 1,637,104 1,671,952 1,686,873 1,737,837Grants and Entitlements not Restricted
to Specific Programs 11,107,642 11,000,894 11,853,214 11,475,430Payment in Lieu of Taxes 233,997 197,564 220,516 208,135Investment Earnings 220,613 111,625 257,772 370,535Gifts and Donations 0 0 4,361 18,492Miscellaneous 387,209 93,928 220,619 106,845
Total General Revenues 22,872,696 22,819,935 23,814,456 23,528,447
Prior Year Restatement 0 0 0 0
Change in Net Assets ($8,504) ($796,932) $466,323 ($336,557)
Greenville City School DistrictChanges in Net Assets
Governmental ActivitiesLast Ten Fiscal Years
(accrual basis of accounting)
106

2007 2008 2009 2010 2011 2012
$585,431 $579,799 $485,647 $501,011 $520,845 $507,2320 0 0 0 90 948
34,956 42,358 45,500 38,010 35,981 31,1810 0 0 0 65 350
0 0 0 0 102 7820 0 0 0 6,274 34,696
91,502 73,306 76,675 65,269 73,929 87,19026,000 24,288 27,344 25,020 14,158 13,688
455,091 430,538 431,410 350,565 318,899 306,896237,166 230,934 282,734 252,473 242,728 256,966
3,390,008 3,465,458 3,292,468 3,951,460 4,789,176 4,094,683107,183 130,802 183,418 167,578 161,334 134,656
4,927,337 4,977,483 4,825,196 5,351,386 6,163,581 5,469,268
12,866,635 12,451,147 12,621,913 12,178,399 12,971,990 13,324,8863,305,778 3,170,462 3,233,302 3,496,302 3,565,586 3,608,6352,189,576 2,169,910 2,146,596 1,825,015 1,878,080 1,827,279
51,456 67,106 60,108 37,540 41,382 48,98797,863 99,369 98,918 241,392 211,292 278,079
1,347,593 1,309,921 1,273,343 1,140,310 1,236,567 1,257,9901,814,840 1,837,670 1,606,158 1,671,127 1,509,927 1,544,944
90,319 66,676 124,349 153,825 112,354 89,0842,458,586 2,077,360 2,153,032 2,035,213 2,056,567 2,288,739
677,236 730,840 741,851 828,405 752,997 743,7947,470 7,849 4,376 14,113 16,853 10,458
1,577,589 1,608,257 1,680,686 1,514,502 1,652,231 1,870,294930,001 1,128,664 1,097,119 905,528 1,002,126 1,071,134216,861 240,962 257,895 247,333 225,422 222,022
1,123,205 1,043,496 1,136,032 1,144,998 1,042,525 1,113,664649,852 619,360 670,381 624,474 597,686 635,948
0 0 0 0 0 00 15,563 0 0 0 0
29,404,860 28,644,612 28,906,059 28,058,476 28,873,585 29,935,937
(24,477,523) (23,667,129) (24,080,863) (22,707,090) (22,710,004) (24,466,669)
8,704,426 8,642,312 7,936,572 8,395,361 9,736,329 9,082,283489,367 479,540 421,352 395,086 432,694 404,982
1,879,296 1,964,530 1,783,724 1,709,928 1,773,036 1,925,876
12,111,539 12,327,239 12,261,496 13,562,824 13,195,694 11,955,233201,015 120,000 184,920 22,301 40,687 41,414473,161 424,570 122,190 31,849 17,338 32,409
31,752 0 5,198 4,343 16,611 5,433128,103 96,224 90,191 73,169 89,507 71,535
24,018,659 24,054,415 22,805,643 24,194,861 25,301,896 23,519,165
573,877 0 (288,484) 0 0 0
$115,013 $387,286 ($1,563,704) $1,487,771 $2,591,892 ($947,504)
107

2003 2004 2005 2006
General FundNonspendable $0 $0 $0 $0Committed 0 0 0 0Assigned 0 0 0 0Unassigned 0 0 0 0Reserved 1,269,195 1,445,247 1,423,975 1,653,330Unreserved 2,768,292 2,143,366 1,977,498 1,869,467
Total General Fund 4,037,487 3,588,613 3,401,473 3,522,797
Other Governmental FundsNonspendable $0 $0 $0 $0Restricted 0 0 0 0Committed 0 0 0 0Assigned 0 0 0 0Unassigned (Deficit) 0 0 0 0Reserved 355,618 390,457 249,940 502,140Unreserved, Reported in:
Special Revenue Funds 1,325,213 1,330,538 1,254,580 1,229,721Debt Service Fund 2,076 2,076 2,076 2,076Capital Projects Funds 4,670,741 4,728,771 4,009,578 3,876,867
Total All Other Governmental Funds 6,353,648 6,451,842 5,516,174 5,610,804
Total Governmental Funds $10,391,135 $10,040,455 $8,917,647 $9,133,601
The School District implemented GASB 54 in fiscal year 2011.
Greenville City School DistrictFund Balances - Governmental Funds
Last Ten Fiscal Years(modified accrual basis of accounting)
108

2007 2008 2009 2010 2011 2012
$0 $0 $0 $35,419 $57,164 $66,7910 0 0 407,469 407,469 407,4690 0 0 65,097 2,537,982 2,595,8370 0 0 5,672,319 4,975,091 4,097,217
1,570,241 1,492,170 1,153,920 0 0 01,231,528 1,971,132 2,414,004 0 0 02,801,769 3,463,302 3,567,930 6,180,304 7,977,706 7,167,314
$0 $0 $0 1,936 8,942 3,9900 0 0 2,723,572 3,274,039 3,030,7280 0 0 2,076 0 00 0 0 0 2,076 2,0760 0 0 0 (368) (189,734)
318,650 386,915 637,782 0 0 0
1,395,069 1,413,945 832,533 0 0 02,076 2,076 2,076 0 0 0
3,973,106 3,387,716 1,422,266 0 0 05,688,901 5,190,652 2,894,657 2,727,584 3,284,689 2,847,060
$8,490,670 $8,653,954 $6,462,587 $8,907,888 $11,262,395 $10,014,374
109

2003 2004 2005 2006
Revenues:Property Taxes $9,168,938 $9,991,075 $9,539,830 $9,729,992Income Taxes 8,516,634 1,655,317 1,685,817 1,742,347Payment in Lieu of Taxes 48,518 383,043 220,516 208,135Tuition and Fees 2,858,406 730,146 635,954 752,387Extracurricular Activities 5,812,507 368,159 284,101 393,967Investment Earnings 227,201 103,919 276,824 400,178Intergovernmental 13,569,904 14,471,521 15,372,184 15,052,373Charges for Services 477,675 497,906 451,382 456,556Rent 24,789 33,422 23,921 36,091Gifts and Donations 44,557 62,060 79,487 35,037Miscellaneous 426,437 102,287 216,805 108,367
Total Revenues 41,175,566 28,398,855 28,786,821 28,915,430
Expenditures:Instruction: Regular 11,715,390 12,587,454 12,524,574 12,086,781 Special 2,890,709 2,991,799 3,098,585 3,198,553 Vocational 2,116,980 2,126,535 1,923,875 1,993,280 Adult/Continuing 52,046 66,502 47,733 55,179 Student Intervention Services 0 0 0 0Support Services: Pupils 1,303,737 1,302,437 1,327,027 1,374,195 Instructional Staff 1,540,898 1,887,241 1,744,867 1,858,621 Board of Education 87,902 117,507 2,168 99,325 Administration 2,609,501 2,464,427 2,571,339 2,527,137 Fiscal 613,291 638,512 647,916 666,230 Business 1,458 10,009 7,106 4,058 Operation and Maintenance of Plant 1,418,793 1,582,055 1,668,946 1,716,548 Pupil Transportation 924,635 833,668 996,943 895,004 Central 173,293 183,287 274,313 279,803Operation of Non-Instructional Services 985,897 1,000,023 1,087,385 1,012,313E trac rric lar Acti ities 619 882 632 863 685 589 611 102
Greenville City School DistrictChanges in Fund Balances - Governmental Funds
Last Ten Fiscal Years(modified accrual basis of accounting)
Extracurricular Activities 619,882 632,863 685,589 611,102Intergovernmental 0 0 0 0Capital Outlay 285,676 325,216 1,301,288 325,006Debt Service: Principal Retirement 0 0 0 0 Interest and Fiscal Charges 0 0 0 0
Total Expenditures 27,340,088 28,749,535 29,909,654 28,703,135
Excess of Revenues Over (Under) Expenditures 13,835,478 (350,680) (1,122,833) 212,295
Other Financing Sources (Uses):Proceeds from Sale of Capital Assets 175 0 25 3,659Insurance Recoveries 0 0 0 0Transfers In 1,277,154 121,500 113,615 130,000Transfers Out (1,277,154) (121,500) (113,615) (130,000)Total Other Financing Sources (Uses) 175 0 25 3,659
Net Change in Fund Balances $13,835,653 ($350,680) ($1,122,808) $215,954
Debt Service as a Percentage of Noncapital Expenditures 0.0% 0.0% 0.0% 0.0%
110

2007 2008 2009 2010 2011 2012
$9,123,197 $9,128,505 $8,232,928 $9,120,696 $10,090,074 $9,486,2241,881,325 1,952,303 1,778,504 1,726,504 1,767,661 1,889,147
201,015 189,095 210,067 182,071 41,706 42,418529,376 528,449 500,442 529,425 556,958 506,688370,411 343,805 355,296 319,580 320,282 345,702473,161 438,472 126,608 32,151 18,194 25,894
15,579,403 15,917,663 15,555,796 17,701,639 17,511,009 16,361,335474,793 455,941 459,027 370,973 342,313 363,63827,146 23,200 28,128 24,300 13,846 13,70632,152 38,424 33,834 47,829 39,514 61,508
128,336 95,487 89,420 71,181 93,156 70,78828,820,315 29,111,344 27,370,050 30,126,349 30,794,713 29,167,048
12,684,616 12,195,284 12,406,876 11,898,288 12,511,692 12,984,1233,297,393 3,161,781 3,253,258 3,512,114 3,598,317 3,632,6112,133,605 2,092,471 2,091,356 1,770,248 1,825,116 1,818,685
50,124 65,774 58,776 36,590 40,608 48,27197,863 99,369 98,918 241,392 211,292 278,079
1,346,523 1,305,368 1,290,937 1,147,696 1,253,922 1,276,5411,833,892 1,837,980 1,586,609 1,657,076 1,542,821 1,553,743
90,235 66,592 124,265 153,743 112,272 89,0022,473,911 2,036,596 2,103,601 2,005,717 2,034,764 2,264,961
672,454 746,642 735,038 737,985 732,952 803,2547,254 7,849 4,376 14,113 16,853 10,458
1,532,491 1,573,597 1,658,912 1,519,675 1,642,432 1,829,453847,942 1,004,038 1,190,245 1,044,809 892,584 1,222,994217,545 235,368 319,953 234,664 233,840 210,332
1,040,448 914,047 917,116 1,003,027 971,577 1,003,788614,505 643,364 659,352 595,277 580,282 606,866
0 15,563 0 0 0 0522,445 946,377 1,211,985 130,648 246,421 781,908
0 0 0 0 0 00 0 0 0 0 0
29,463,246 28,948,060 29,711,573 27,703,062 28,447,745 30,415,069
(642,931) 163,284 (2,341,523) 2,423,287 2,346,968 (1,248,021)
0 0 86,850 22,000 7,539 00 0 63,320 0 0 0
130,000 136,115 1,351,826 189,739 203,000 193,555(130,000) (136,115) (1,351,826) (189,739) (203,000) (193,555)
0 0 150,170 22,000 7,539 0
($642,931) $163,284 ($2,191,353) $2,445,287 $2,354,507 ($1,248,021)
0.0% 0.0% 0.0% 0.0% 0.0% 0.0%
111

Residential/ Commercial/ Estimated Assessed Estimated Assessed EstimatedYear Agricultural Industrial/PU Actual Value Value Actual Value Value Actual Value
2012 $305,735,010 $87,685,040 $1,124,057,286 $13,649,380 $15,510,659 $0 $0
2011 317,369,480 87,695,210 1,157,327,686 13,357,170 15,178,602 0 0
2010 316,279,540 85,655,240 1,148,385,086 18,385,890 20,893,057 783,940 15,678,800
2009 315,009,060 86,738,130 1,147,849,114 19,320,480 21,955,091 15,017,500 1,501,750,000
2008 293,679,460 85,426,990 1,083,161,286 15,185,800 17,256,591 29,446,214 471,139,424
2007 292,055,850 82,481,740 1,070,107,400 19,670,320 22,352,636 43,798,868 350,390,944
2006 289,896,490 80,433,420 1,058,085,457 19,660,520 22,341,500 59,129,160 315,355,520
2005 273,590,070 73,357,260 991,278,086 20,062,880 22,798,727 62,261,810 264,943,872
2004 270,738,710 73,482,970 983,490,514 21,310,390 24,216,352 62,474,710 265,849,830
2003 266,266,460 73,220,260 969,962,057 19,754,990 22,448,852 71,765,548 292,920,604
Real property is reappraised every six years with a State mandated update of the current marketvalue in the third year following each reappraisal.
The assessed value of real property (including public utility real property) is 35 percent of estimated true value. The assessed valueof public utility personal property ranges from 25 percent of true value for railroad property to 88 percent for electric transmissiontransmission and distribution property. General business tangible property was assessed in previous years at 25 percent for machinery and equipment and 23 percent for inventories. General business tangible personal property tax has been phased out. Theassessment percent was 18.75 percent for 2006, 12.5 percent for 2007, 6.25 percent for 2008, and zero for 2009. Beginning in 2007,House Bill 66 switched telephone companies from being public utilities to general business taxpayers and began a four year phase outof the tangible personal property tax on local and inter-exchange telephone companies. No tangible personal property taxes were levied or collected in 2009 from general business taxpayers, except telephone companies whose last year to pay tangible personalproperty tax is 2010. The percentages for telecommunications are 10.0 percent for 2009, 5.0 percent for 2010 and zero for 2011.
The tangible personal property values associated with each year are the values that, when multiplied by the applicable rates,generated the property tax revenue billed in that year. For real property, the amounts generated by multiplying the assessed valuesby the applicable rates would be reduced by the 10 percent rollback, 2 1/2 percent rollback, and homestead exemptions before beingbilled. The 10 percent rollback for commercial/industrial property was eliminated in 2006.
Source: Ohio Department of Taxation and Darke County Auditor
Greenville City School DistrictAssessed Value and Estimated Actual Value of Taxable Property
Last Ten Years
Assessed ValuePublic Utility
Real PropertyGeneral Business
Tangible Personal Property
112

Weighted AverageProperty Tax Rate
Assessed Estimated (per $1,000 ofValue Actual Value Ratio assessed value)
$407,069,430 $1,139,567,945 35.72% $0.00
418,421,860 1,172,506,288 35.69% 26.43
421,104,610 1,184,956,943 35.54% 25.98
436,085,170 2,671,554,205 16.32% 21.40
423,738,464 1,571,557,301 26.96% 22.94
438,006,778 1,442,850,980 30.36% 23.38
449,119,590 1,395,782,477 32.18% 23.70
429,272,020 1,279,020,685 33.56% 24.16
428,006,780 1,273,556,696 33.61% 24.18
431,007,258 1,285,331,513 33.53% 24.32
Totals
113

Percent of Total Percent of TotalReal Estate Real Estate
Assessed Property Assessed PropertyTaxpayer Value Rank Tax Assessed Value Value Rank Tax Assessed Value
Greenkap, LLC (Whirlpool) $4,032,840 1 1.03% N/A N/A 0.00%
Harvey A. Tolson, aka E&G Properties, LLC. 3,360,010 2 0.85% $2,306,250 5 0.68%
Brethren's Home Retirement Community 3,055,450 3 0.78% 3,027,440 2 0.89%
Whirlpool Corpoaration 2,979,380 4 0.76% N/A N/A 0.00%
BASF Corporation 2,730,460 5 0.69% 2,747,680 4 0.81%
Greenville Technology, Inc. 2,415,590 6 0.61% 2,925,770 3 0.86%
Richard C. Lavy 2,226,360 7 0.57% N/A N/A 0.00%
Lowe's Home Centers, Inc 1,863,480 8 0.47% N/A N/A 0.00%
Kroger's Limited Partnership 1,432,500 9 0.36% 1,468,290 7 0.43%
Nationwide Health Prop, aka Cornwall Dev Ltd 1,295,870 10 0.33% 613,210 10 0.18%
Wal-Mart Real Estate N/A N/A 0.00% 3,176,120 1 0.94%
Framson Realty N/A N/A 0.00% 1,862,140 6 0.55%
Greenville Manor Limited N/A N/A 0.00% 1,012,720 8 0.30%
Wayne K. Detling N/A N/A 0.00% 801,440 9 0.24%
Total 25,391,940 6.45% 19,941,060 5.88%
All Others 368,028,110 93.55% 319,545,660 94.12%
Total Real Estate Property Tax Assessed Value $393,420,050 100.00% $339,486,720 100.00%
Source: Darke County Auditor
N/A - Information not available.
2003
Greenville City School DistrictPrincipal Property Taxpayers
Real Estate Property Tax2012 and 2003
2012
114

Percent of Public Percent of PublicAssessed Utility Personal Property Assessed Utility Personal Property
Taxpayer Value Rank Assessed Value Value Rank Assessed Value
Dayton Power and Light $11,627,550 1 85.19% $9,618,580 1 48.69%
Darke Rural Electric 1,027,190 2 7.53% 522,200 5 2.64%
Vectren Energy Delivery 515,610 3 3.78% 0 N/A 0.00%
Panhandle Eastern Pipe Line Company 282,100 4 2.07% 3,261,440 3 16.51%
Buckeye Power, Inc. 182,790 5 1.34% 0 N/A 0.00%
DPL Energy, Inc. 0 N/A 0.00% 1,816,390 4 9.19%
United Telephone Company 0 N/A 0.00% 3,517,700 2 17.81%
Total 13,635,240 99.91% 18,736,310 94.84%
All Others 14,140 0.09% 1,018,680 5.16%
Total Public Utility Personal Property Tax Assessed Valuation $13,649,380 100.00% $19,754,990 100.00%
Source: Darke County Auditor
N/A - Information not available
2012 and 2003
Greenville City School DistrictPrincipal Property Taxpayers
Public Utility Personal Property Tax
20032012
115

2003 2004 2005
Unvoted MillageOperating $3.70 $3.70 $3.70
Voted Millage - By Levy1976 Current Expense - (continuing) Residential/Agricultural Real 9.066 9.07 9.07 Commercial/Industrial and Public Utility Real 10.81 10.93 11.03 General Business and Public Utility Personal 16.30 16.30 16.30
1977 Current Expense - (continuing) Residential/Agricultural Real 3.28 3.29 3.29 Commercial/Industrial and Public Utility Real 3.92 3.96 3.99 General Business and Public Utility Personal 5.90 5.90 5.90
1989 Permanent Improvement Levy - (5 year levy - renewed in 2008) Residential/Agricultural Real 1.04 1.04 1.04 Commercial/Industrial and Public Utility Real 1.55 1.57 1.58 General Business and Public Utility Personal 2.00 2.00 2.00
1996 Current Expense - (5 year levy - renewed in 2006) Residential/Agricultural Real 3.95 3.95 3.96 Commercial/Industrial and Public Utility Real 4.96 5.02 5.06 General Business and Public Utility Personal 5.50 5.50 5.50
2009 Emergency Levy Residential/Agricultural Real 0.00 0.00 0.00 Commercial/Industrial and Public Utility Real 0.00 0.00 0.00 General Business and Public Utility Personal 0.00 0.00 0.00
Total Voted Millage By Type of Property Residential/Agricultural Real 17.34 17.35 17.36 Commercial/Industrial and Public Utility Real 21.24 21.48 21.66 General Business and Public Utility Personal 29.70 29.70 29.70
Total Millage by Type of Property Residential/Agricultural Real 21.04 21.05 21.06 Commercial/Industrial and Public Utility Real 24.94 25.18 25.36 General Business and Public Utility Personal 33.40 33.40 33.40
Overlapping Rates By Taxing District Townships Residential/Agricultural Real 0.10-2.81 0.10-2.10 0.10-2.82 Commercial/Industrial and Public Utility Real 0.10-3.00 0.10-2.27 0.10-3.00 General Business and Public Utility Personal 0.10-3.00 0.10-3.00 0.10-3.00
Corporations Residential/Agricultural Real 0.30-5.39 0.30-5.20 0.30-7.00 Commercial/Industrial and Public Utility Real 0.30-5.39 0.30-5.20 0.30-7.00 General Business and Public Utility Personal 0.30-5.39 0.30-5.20 0.30-7.00
County Residential/Agricultural Real 6.54 6.54 6.54 Commercial/Industrial and Public Utility Real 6.74 6.74 6.75 General Business and Public Utility Personal 6.80 6.80 6.80
Source: Ohio Department of Taxation - Darke County Auditor
The rates presented for a particular calendar year are the rates that, when applied to the assessed values presented in the Assessed Value Table, generated the property tax revenue for that year.
Rates may only be raised by obtaining the approval of a majority of the voters at a public election.
Real property tax rates are reduced so that inflationary increases in value do not generate additional taxes. Realproperty is reappraised every six years and property values are updated in the third year following each reappraisal.
Greenville City School DistrictProperty Tax Rates
(Per $1,000 of Assessed Value)Last Ten Years
116

2006 2007 2008 2009 2010 2011 2012
$3.70 $3.70 $3.70 $3.70 $3.70 $3.70 3.70
9.12 9.13 9.14 9.18 9.20 9.22 9.5910.30 10.35 10.37 10.40 11.16 11.21 11.6216.30 16.30 16.30 16.30 16.30 16.30 16.30
3.30 3.31 3.31 3.33 3.33 3.34 3.473.73 3.75 3.76 3.77 4.05 4.06 4.215.90 5.90 5.90 5.90 5.90 5.90 5.90
0.99 0.99 0.99 0.93 0.93 0.93 0.971.48 1.49 1.49 1.49 1.60 1.61 1.662.00 2.00 2.00 2.00 2.00 2.00 2.00
3.88 3.88 3.88 3.79 3.80 3.80 3.964.73 4.75 4.76 4.77 5.12 5.14 5.335.50 5.50 5.50 5.50 5.50 5.50 5.50
0.00 0.00 0.00 0.00 3.91 4.05 4.150.00 0.00 0.00 0.00 3.91 4.05 4.150.00 0.00 0.00 0.00 3.91 4.05 4.15
17.29 17.31 17.32 17.23 21.17 21.34 22.1420.24 20.34 20.38 20.43 25.84 26.07 26.9729.70 29.70 29.70 29.70 33.61 33.75 33.85
20.99 21.01 21.02 20.93 24.87 25.04 25.8423.94 24.04 24.08 24.13 29.54 29.77 30.6733.40 33.40 33.40 33.40 37.31 37.45 37.55
0.10-1.64 0.10-2.69 0.10-2.61 0.10-2.55 0.10-2.55 0.10-3.00 0.09-2.770.10-2.17 0.10-2.81 0.10-2.86 0.10-2.82 0.10-3.00 0.10-3.00 0.10-3.000.10-3.00 0.10-3.00 0.10-3.00 0.10-3.00 0.10-3.00 0.10-3.00 0.10-3.00
0.30-6.17 0.30-6.20 0.30-6.62 0.30-6.44 0.30-6.61 0.15-6.62 0.30-6.310.30-6.75 0.30-6.75 0.30-6.80 0.30-6.80 0.30-6.75 0.15-7.00 0.30-7.000.30-7.00 0.30-7.00 0.30-7.00 0.30-7.00 0.30-7.00 0.15-7.00 0.30-7.00
6.38 6.38 6.38 6.11 5.80 6.12 6.056.55 6.57 6.57 6.58 6.30 6.75 6.776.80 6.80 6.80 6.80 6.30 6.30 6.30
117

Current Percent of Delinquent
Collection Current Delinquent Total Tax Current Levy TaxYear (2) Tax Levy Levy Levy Collections Collections Collections (3)
2011 $11,108,010 $335,921 $11,443,931 $10,877,377 97.92% $304,284
2010 11,056,980 334,880 11,391,860 10,835,713 98.00% 262,157
2009 11,084,260 255,931 11,340,191 9,886,932 89.20% 474,316
2008 9,330,860 586,180 9,917,040 9,287,634 99.54% 299,147
2007 9,526,505 461,184 9,987,689 9,587,535 100.64% 288,797
2006 9,917,290 467,837 10,385,127 9,879,977 99.62% 292,053
2005 10,288,980 397,241 10,686,221 9,749,409 94.76% 227,510
2004 10,244,470 484,789 10,729,259 10,127,654 98.86% 565,311
2003 10,483,230 731,892 11,215,122 9,650,746 92.06% 511,127
2002 10,269,650 614,698 10,884,348 9,987,166 97.25% 200,621
Source: Darke County Auditor
(1) Current taxes levied and current tax collections do not include rollback and homestead amounts.
(2) The 2012 information cannot be presented because all collections have not been made by June 30, 2012.
(3) The County does not identify delinquent tax collections by tax year.
Last Ten Years
Greenville City School DistrictProperty Tax Levies and Collections (1)
118

Percent of Total
Total Tax Tax collections toCollections Total Levy
$11,181,661 97.71%
11,097,870 97.42%
10,361,248 91.37%
9,586,781 96.67%
9,876,332 98.89%
10,172,030 97.95%
9,976,919 93.36%
10,692,965 99.66%
10,161,873 90.61%
10,187,787 93.60%
119

Governmental
Activities Percentage Applicable Amount ApplicableJurisdiction Debt to School District (1) to School District
Direct:Greenville City School District $0 100.00% $0
Overlapping:Darke County
Notes Payable 243,656 41.63 101,434General Obligation Bonds 5,870,000 41.63 2,443,681
Total Overlapping 6,113,656 2,545,115
Total $6,113,656 $2,545,115
Source: Darke County Auditor - Data is presented on a calendar year basis (including the School District) because that is the manner in which information is maintained by the County Auditor.
(1) Percentages were determined by dividing the assessed valuation of the political subdivision located within the boundaries of the School District by the total assessed valuation of the subdivision. The valuations used were for the 2011 collection year.
Overlapping governments are those that coincide, at least in part, with the geographic boundaries of the SchoolDistrict. This schedule estimates the portion of the outstanding debt of those overlapping governments thatis borne by the residents and businesses of the School District. This process recognizes that, when considering the School District's ability to issue and repay long-term debt, the entire debt burden borne by the residentsand businesses should be taken into account.
Greenville City School DistrictComputation of Direct and Overlapping Governmental Activities Debt
December 31, 2011
120


2003 2004 2005
Assessed Value $431,007,258 $428,006,780 $429,272,020 Less Railroad and Telephone Property Valuation 0 0 0 Less General Business Tangible Personal Property Valuation 0 0 0
Total Assessed Valuation used to Calculate Legal Debt Margin (1) $431,007,258 $428,006,780 $429,272,020
Overall Debt Margin $38,790,653 $38,520,610 $38,634,482
Unvoted Debt Limit - 0.10% of Assessed Value (2) $431,007 $428,007 $429,272
Source: Darke County Auditor and School District Financial Records
(1) The definition of tax valuation for the purpose of calculating the debt margin was modified by H.B. 530, effective 3/30/06, to exclude tangible personal property used in business, telephone or telegraph property,interexchange telecommunications company property, or personal property owned or leased by a railroad company and used in railroad operations.
(2) Ohio Bond Law sets a limit of nine percent for overall debt and 1/10 of one percent for unvoted debt.
Last Ten Fiscal YearsComputation of Legal Debt Margin
Greenville City School District
121

2006 2007 2008 2009 2010 2011 2012
$449,119,590 $438,006,778 $423,738,464 $436,085,170 $421,104,610 $418,421,860 $407,069,430(3,327,270) (2,840,590) (1,895,060) (1,288,610) (391,835) (33,420) 0
(59,129,160) (43,798,868) (29,446,214) (15,017,500) (783,940) 0 0
$386,663,160 $391,367,320 $392,397,190 $419,779,060 $419,928,835 $418,388,440 $407,069,430
$34,799,684 $35,223,059 $35,315,747 $37,780,115 $37,793,595 $37,654,960 $36,636,249
$386,663 $391,367 $392,397 $419,779 $419,929 $418,388 $407,069
122

(1) (1) (2) (1) (4)
Darke School Total (2) Median (1) (3) Darke County (5)County District Personal Per Capita Household Median School Unemployment Total Assessed
Year Population Population Income Income Income Age Enrollment Rate Value
2012 52,939 22,536 406,780,560 $26,795 $41,758 44 3,101 6.8% $407,069,430
2011 52,939 22,109 351,914,506 25,959 40,456 44 3,122 9.4% 418,421,860
2010 53,260 22,620 381,619,566 26,791 41,128 40 3,185 10.4% 421,104,610
2009 53,260 22,620 363,193,556 27,145 41,671 40 3,215 11.7% 436,085,170
2008 53,260 22,620 393,850,680 26,863 41,238 40 3,277 6.3% 423,738,464
2007 53,260 22,620 424,449,500 26,501 40,683 40 3,374 6.2% 438,006,778
2006 53,260 22,620 436,571,164 26,610 40,850 40 3,472 5.3% 449,119,590
2005 53,260 22,620 421,071,369 26,101 38,792 40 3,513 6.5% 429,272,020
2004 53,260 22,620 407,201,637 26,263 39,033 40 3,590 5.4% 428,006,780
2003 53,079 22,620 397,033,001 26,285 39,065 40 3,557 6.2% 431,007,258
Source: (1) US Bureau of Census(2) State of Ohio Department of Taxation. For 2004 and 2008, actual information was not available; therefore, a computation of per capita personal income by population was used.(3) School Foundation Total Headcount (Formula ADM)(4) Ohio Department of Job and Family Services(5) Darke County Auditor
Greenville City School DistrictDemographic and Economic Statistics
Last Ten Fiscal Years
123

Percentage PercentageNumber of of Total Number of of Total
Employer Employees Rank Employment Employees Rank Employment
Greenville Technology, Inc. 1,004 1 8.26% 946 2 5.95%
Kelly Services 946 2 7.78% N/A N/A 0.00%
Whirlpool Corporation - Greenville 697 3 5.73% 850 3 5.35%
Greenville City School Board of Education 624 4 5.13% 634 7 3.99%
Wayne Hospital 621 5 5.11% 661 4 4.16%
Brethren Retirement Community 441 6 3.63% 457 8 2.87%
Wal-Mart Stores East LP 401 7 3.30% 644 6 4.05%
Darke County 310 8 2.55% 436 10 2.74%
Fram Group Operations, LLC 280 9 2.30% 656 5 4.13%
Scott M & A Corporation 205 10 1.68% N/A N/A 0.00%
Adecco Services, Inc. of Ohio N/A N/A 0.00% 975 1 6.13%
Corning, Inc. N/A N/A 0.00% 437 9 2.75%
Total Employees 5,529 45.47% 6,696 42.12%
All Other Employers 6,632 54.53% 9,200 57.88%
Total Employment within the School District 12,161 100.00% 15,896 100.00%
Source: Greenville City Income Tax Department
Greenville City School DistrictPrincipal Employers
2012 and 2003
2012 2003
124

General Average Daily
Fund Student Per PupilYear Expenditures (1) Enrollment (2) Cost
2012 $25,933,586 3,101 $8,363
2011 24,167,688 3,122 7,741
2010 23,614,022 3,185 7,414
2009 25,326,435 3,215 7,878
2008 24,765,832 3,277 7,557
2007 25,685,081 3,374 7,613
2006 25,012,785 3,472 7,204
2005 25,013,987 3,513 7,120
2004 24,817,647 3,590 6,913
2003 25,097,354 3,557 7,056
Source: School District Financial Records.
(1) Includes other financing uses.(2) School Foundation Total Headcount
Greenville City School DistrictPer Pupil Cost
Last Ten Fiscal Years
125


Function/Program 2003 2004 2005 2006
Regular InstructionElementary Classroom Teachers 96.50 94.00 87.50 84.50Junior High Classroom Teachers 25.00 25.00 23.50 23.50High School Classroom Teachers 47.50 45.50 45.50 45.50
Special InstructionGifted Education Teachers 3.00 3.00 3.00 3.00Special Needs Teachers 38.00 39.00 37.00 38.50
Vocational Instruction 31.00 31.00 30.00 30.00Adult/Continuing 1.00 1.00 1.00 1.00Support Services
Pupils and Instructional Staff 46.00 58.00 63.00 63.00Board of Education 5.00 5.00 5.00 5.00Administration 29.00 30.00 30.00 29.50Fiscal 6.00 6.00 6.00 6.00Operation and Maintenance of Plant 18.00 18.00 16.00 16.00Central 6.00 6.00 6.00 6.00Transportation 23.00 22.00 22.00 22.00
Operation of Non-Instructional Services 41.00 33.00 29.00 29.00
Total Number of Employees 416.00 416.50 404.50 402.50
Method: Using 1.0 for each full-time employee and 0.50 for each part-time and seasonal employee.
Source: District Personnel Directory (Approximately October each fiscal year)
Greenville City School DistrictSchool District Employees by Function
Last Ten Fiscal Years
126

2007 2008 2009 2010 2011 2012
89.50 82.50 85.00 74.00 65.00 76.0020.00 19.50 20.00 23.00 28.50 26.5037.50 35.00 35.50 34.00 34.50 32.50
3.00 2.00 2.50 2.00 2.00 2.0045.50 41.00 47.00 45.50 43.50 39.5025.50 25.50 21.00 19.00 19.50 17.50
1.00 1.00 1.00 1.00 1.00 1.00
62.00 58.50 52.00 48.00 47.50 55.005.00 5.00 5.00 5.00 5.00 5.00
28.00 24.00 27.00 26.00 24.50 24.006.00 6.00 6.00 6.00 6.00 5.00
16.00 13.50 15.50 13.50 12.50 11.506.00 6.00 4.00 4.00 4.00 6.00
24.00 26.00 29.00 26.00 28.00 24.0031.00 26.00 30.00 27.00 24.50 20.50
400.00 371.50 380.50 354.00 346.00 346.00
127

2003 2004 2005 2006 2007 2008 2009 2010 2011 2012
Greenville Intermediate School Constructed in 1950 with addition in 1953 Total Building Square Footage 38,611 38,611 38,611 38,611 38,611 38,611 38,611 38,611 38,611 38,611 Acreage 2.70 2.70 2.70 2.70 2.70 2.70 2.70 2.70 2.70 2.70 Enrollment Grades K-5- 2007-08 3-4 341 333 360 360 393 457 497 431 425 390 Student Capacity 309 309 309 309 309 309 309 309 309 309 Regular Instructional Classrooms 24 24 24 24 24 24 21 21 21 21 Regular Instructional Teachers 20 21 20 21 21 21 21 20 23 23 Special Instructional Classrooms 1 1 1 1 1 1 4 4 4 4 Special Instructional Teachers 9 9 9 10 10 10 7 6 6 6 Extracurricular Space - Gymnasium Square Footage 2,345 2,345 2,345 2,345 2,345 2,345 2,345 2,345 2,345 2,345 Cafeteria facilities square footage 914 914 914 914 914 914 914 914 914 914 Library/Media Center square footage 1,790 1,790 1,790 1,790 1,790 1,790 1,790 1,790 1,790 1,790
Greenville Middle School Constructed in 1911 with additions in 1950,1953 and two modulars in 2008 Total Building Square Footage 38,110 38,110 38,110 38,110 38,110 38,110 41,310 41,310 41,310 41,310 Acreage 2.40 2.40 2.40 2.40 2.40 2.40 2.40 2.40 2.40 2.40 Enrollment Grades 5-6 419 377 349 349 334 461 456 418 400 413 Student Capacity 307 307 307 307 307 307 407 407 407 407 Regular and Special Instructional Classrooms 19 19 19 19 19 19 23 23 23 23 Regular Instructional Teachers 22 22 19 19 19 19 22 18 23 20 Special Instructional Teachers 5 6 6 5 5 5 6 7 7 6 Extracurricular Space - Gymnasium Square Footage 3,376 3,376 3,376 3,376 3,376 3,376 3,376 3,376 3,376 3,376 Cafeteria facilities square footage 754 754 754 754 754 754 754 754 754 754 Library/Media Center square footage 1,538 1,538 1,538 1,538 1,538 1,538 1,538 1,538 1,538 1,538
Greenville Primary School, Woodland Heights Elementary School Constructed in 1956 with addition in 1968, modulars in 2008 Total Building Square Footage 36,145 36,145 36,145 36,145 36,145 44,065 44,065 44,065 44,065 44,065 Acreage 20.00 20.00 20.00 20.00 20.00 20.00 20.00 20.00 20.00 20.00 Enrollment Grades K-5; 2007-08 K-2 437 404 392 392 406 736 634 634 606 602 Student Capacity 297 297 297 297 297 547 547 547 547 547 Regular and Special Instructional Classrooms 22 22 22 18 18 28 28 28 28 28 Regular Instructional Teachers 24 24 22 22 22 22 31 26 27 35 Special Instructional Teachers 4 5 3 3 12 12 12 12 14 6 Extracurricular Space - Gymnasium Square Footage 4,221 4,221 4,221 4,221 4,221 4,221 4,221 4,221 4,221 4,221 Cafeteria facilities square footage 2,274 2,274 2,274 2,274 2,274 2,274 2,274 2,274 2,274 2,274 Library/Media Center square footage 855 855 855 855 855 855 855 855 855 855
Gettysburg Elementary School (closed at the end of 2007) Constructed in 1925 with addition in 1951 Total Building Square Footage 41,773 41,773 41,773 41,773 41,773 41,773 N/A N/A N/A N/A Acreage 5.30 5.30 5.30 5.30 5.30 5.30 N/A N/A N/A N/A Enrollment Grades K-5 302 288 275 275 304 0 N/A N/A N/A N/A Student Capacity 334 334 334 334 334 334 N/A N/A N/A N/A Regular Instructional Classrooms 19 19 19 19 19 0 N/A N/A N/A N/A Regular Instructional Teachers 18 17 16 15 15 0 N/A N/A N/A N/A Special Instructional Classrooms 1 1 1 1 1 0 N/A N/A N/A N/A Special Instructional Teachers 6 6 4 5 5 0 N/A N/A N/A N/A Extracurricular Space - Gymnasium Square Footage 6,125 6,125 6,125 6,125 6,125 6,125 N/A N/A N/A N/A Cafeteria facilities square footage 2,278 2,278 2,278 2,278 2,278 2,278 N/A N/A N/A N/A Library/Media Center square footage 1,445 1,445 1,445 1,445 1,445 1,445 N/A N/A N/A N/A
(continued)
Building StatisticsGreenville City School District
Last Ten Fiscal Years
128

2003 2004 2005 2006 2007 2008 2009 2010 2011 2012
North Middle School (closed at the end of 2007) Constructed in 1900 with addition in 1953 Total Building Square Footage 27,549 27,549 27,549 27,549 27,549 27,549 N/A N/A N/A N/A Acreage 1.60 1.60 1.60 1.60 1.60 1.60 N/A N/A N/A N/A Enrollment Grade 6 261 277 205 205 264 0 N/A N/A N/A N/A Student Capacity 221 221 221 221 221 221 N/A N/A N/A N/A Regular and Special Instructional Classrooms 13 13 13 11 11 0 N/A N/A N/A N/A Regular Instructional Teachers 13 13 13 2 2 0 N/A N/A N/A N/A Special Instructional Teachers 3 3 4 4 4 0 N/A N/A N/A N/A Extracurricular Space - Gymnasium Square Footage 3,360 3,360 3,360 3,360 3,360 3,360 N/A N/A N/A N/A Cafeteria facilities square footage 1,246 1,246 1,246 1,246 1,246 1,246 N/A N/A N/A N/A Library/Media Center square footage 1,483 1,483 1,483 1,483 1,483 1,483 N/A N/A N/A N/A
Greenville Junior High School Constructed in 1924 Total Building Square Footage 112,495 112,495 112,495 112,495 112,495 112,495 112,495 112,495 112,495 112,495 Acreage 2.60 2.60 2.60 2.60 2.60 2.60 2.60 2.60 2.60 2.60 Enrollment Grades 7-8 535 548 573 573 517 488 523 435 415 523 Teaching Stations 40 40 40 40 40 40 40 40 40 40 Student Capacity 868 868 868 868 868 868 868 868 868 868 Regular Instructional Classrooms 25 25 25 25 25 25 23 23 28 23 Regular Instructional Teachers 26 26 25 25 25 24 25 27 28 25 Special Instructional Teachers 7 7 7 9 9 9 7 7 4 7 Special Instructional Classrooms 2 2 2 2 2 2 4 4 6 4 Vocational Instructional Square Footage 4,725 4,725 4,725 4,725 4,725 4,725 0 0 0 0 Vocational Instuctional Teachers 3 3 3 3 3 3 0 0 0 0 Extracurricular Space - Gymnasium Square Footage 8,267 8,267 8,267 8,267 8,267 8,267 8,267 8,267 8,267 8,267 Cafeteria facilities square footage 4,043 4,043 4,043 4,043 4,043 4,043 4,043 4,043 4,043 4,043 Library/Media Center square footage 2,230 2,230 2,230 2,230 2,230 2,230 2,230 2,230 2,230 2,230
Greenville Senior High School Constructed in 1962 with additions in 1971, 1978, and 2002 Total Building Square Footage 170,493 170,493 170,493 170,493 170,493 170,493 170,493 170,493 170,493 170,493 Acreage 19.67 19.67 19.67 19.67 19.67 19.67 19.67 19.67 19.67 19.67 Enrollment Grades 9-12 1,110 1,069 1,083 1,083 1,156 1,135 1,105 957 944 957 Student Capacity 829 829 829 829 829 829 829 829 829 829 Regular Instructional Classrooms 48 48 48 48 48 48 45 45 51 45 Regular Instructional Teachers 48 46 46 47 47 47 43 40 38 40 Special Instructional Classrooms 1 1 1 1 1 1 4 4 9 4 Special Instructional Teachers 8 8 8 11 11 11 12 13 11 13 Vocational Square Footage 34,453 34,453 34,453 34,453 34,453 34,453 34,453 34,453 34,453 34,453 Vocational Instuctional Teachers 27 29 25 25 25 25 21 19 20 19 Extracurricular Space - Gymnasium Square Footage 22,541 22,541 22,541 22,541 22,541 22,541 22,541 22,541 22,541 22,541 Cafeteria facilities square footage 6,512 6,512 6,512 6,512 6,512 6,512 6,512 6,512 6,512 6,512 Library/Media Center square footage 3,691 3,691 3,691 3,691 3,691 3,691 3,691 3,691 3,691 3,691
Memorial Hall Central Office Constructed in 1910 with addition in 1953 Total Building Square Footage 45,200 45,200 45,200 45,200 45,200 45,200 45,200 45,200 45,200 45,200 Acreage 2.00 2.00 2.00 2.00 2.00 2.00 1.10 1.10 1.10 1.10
Transportation Building Purchased in 1973 Total Building Square Footage 7,200 7,200 7,200 7,200 7,200 7,200 7,200 7,200 7,200 7,200 Acreage 1.50 1.50 1.50 1.50 1.50 1.50 1.50 1.50 1.50 1.50
Note: Student enrollment includes physical head counts by building, rather than total pupils residing in public school system
Source: School District Building Secretaries and Capital Asset Records
(continued)Last Ten Fiscal Years
Building StatisticsGreenville City School District
129

Degree 2003 2004 2005 2006 2007 2008 2009 2010 2011 2012
Non-Degreed Vocational 4.0 4.0 6.0 6.0 5.0 6.0 6.0 5.0 4.5 3.5
Associate's Degree 0.0 0.0 0.0 0.0 0.0 0.0 0.0 0.0 0.0 1.0
Bachelor's Degree 11.0 9.0 5.0 6.0 5.0 8.0 10.0 4.0 7.0 5.0
Bachelor + 15 27.0 21.0 24.0 18.0 17.0 10.0 8.0 10.0 8.5 9.5
Bachelor + 30 68.0 71.0 58.0 61.0 58.0 50.0 46.0 36.0 38.0 41.0
Master's Degree 67.0 65.0 72.0 56.0 63.0 67.0 69.0 69.0 60.0 61.5
Master + 15 77.0 83.0 81.0 78.0 85.0 76.0 78.0 75.0 77.0 79.0
Doctorate 1.0 1.0 1.0 1.0 2.0 2.0 2.0 2.0 2.0 2.0
Total 255.0 254.0 247.0 226.0 235.0 219.0 219.0 201.0 197.0 202.5
Source: District EMIS Reports
Last Ten Fiscal YearsFull-Time Equivalent Teachers by Education
Greenville City School District
130

Teacher to
Year Student Ratio (1)
2012 1:16.4
2011 1:18.2
2010 1:16.6
2009 1:14.4
2008 1:19.2
2007 1:18.4
2006 1:18.5
2005 1.17.4
2004 1:18.0
2003 1:18.0
(1) Only classroom teachers are included in calculation
Source: District EMIS Reports
Greenville City School DistrictTeacher to Student Ratio
Last Ten Fiscal Years
131

Property Financial Value of Value of Value of Value ofValue Institution Value of Permits Issued Permits Issued Permits Issued Permits Issued
(Real Estate Bank Permits Issued Adams Greenville Greenville GettysburgYear Only) (1) Deposits Darke County Township Township City Village
2012 $393,420,050 $838,720,000 $2,174,790 $332,980 $407,000 $937,920 $9,790
2011 405,064,690 593,261,000 2,277,690 317,340 525,900 958,330 2,140
2010 401,934,780 722,029,000 6,993,740 226,800 814,980 5,332,320 18,380
2009 401,747,190 666,756,000 3,648,790 321,350 672,420 2,033,990 27,020
2008 379,106,450 688,727,000 4,922,080 633,980 582,500 3,341,120 0
2007 374,537,590 666,277,000 5,139,180 512,490 602,810 2,919,150 8,330
2006 370,329,910 647,282,000 4,772,820 675,680 765,810 2,651,300 31,000
2005 346,947,330 644,127,000 3,332,840 559,240 684,160 1,326,010 129,870
2004 344,221,680 673,036,000 5,656,160 691,150 1,868,620 2,323,830 34,740
2003 339,486,720 649,146,000 5,106,930 594,240 843,340 3,183,540 110,380
Sources: Darke County Auditor, Building Department reports and Federal Reserve Bank of Cleveland and FDIC Insurance Sources.
(1) Represents assessed value.
Greenville City School DistrictProperty Value,
Financial Institution Deposits and Building PermitsLast Ten Years
132

Value of Value of Value of Value of Value of Value of Permits Issued Permits Issued Permits Issued Permits Issued Permits Issued Permits Issued
Neave Wayne Lakes Richland Van Buren Washington WayneTownship Village Township Township Township Township
$241,640 $25,570 $60,430 $35,000 $124,460 $0
129,270 9,030 96,710 12,530 221,010 5,430
220,500 47,880 127,020 2,480 203,380 0
272,240 19,320 103,330 4,300 194,820 0
73,030 9,370 101,260 390 147,070 33,360
581,300 62,870 75,930 53,160 323,140 0
128,980 102,430 154,360 40,610 222,650 0
92,110 22,440 102,410 54,390 362,210 0
369,820 41,470 38,690 23,000 264,840 0
189,890 0 19,490 0 166,050 0
133

Indicator - District Testing 2003 2004 2005 2006
Third Grade Achievement Test Reading N/A 69.70% 73.20% 82.80% Mathematics N/A N/A 70.30% 86.70%Fourth Grade Achievement Test Writing N/A N/A 78.00% 85.50% Reading N/A N/A 74.00% 74.50% Mathematics N/A N/A N/A 78.60%Fourth Grade Proficiency Test Writing 73.70% 69.30% N/A N/A Reading 64.80% 63.90% N/A N/A Mathematics 53.30% 58.50% 55.80% N/A Citizenship 56.60% 54.60% 54.60% N/A Science 63.10% 63.40% 64.70% N/AFifth Grade Achievement Test Reading N/A N/A 81.40% 75.50% Mathematics N/A N/A N/A 56.50% Science N/A N/A N/A N/A Social Studies N/A N/A N/A N/ASixth Grade Proficiency Test Writing 78.10% 92.90% 70.60% N/A Reading 69.90% 59.60% 88.20% 86.40% Mathematics 52.00% 61.60% 56.60% N/A Citizenship 77.00% 69.00% 77.20% N/A Science 77.70% 71.80% 75.00% N/ASeventh Grade Achievement Test Mathematics N/A N/A 50.60% 44.60% Reading N/A N/A N/A 74.30% Writing N/A N/A N/A N/AEighth Grade Achievement Test Reading N/A N/A 80.80% 70.10% Mathematics N/A N/A 57.30% 49.10% Science N/A N/A N/A N/A Social Studies N/A N/A N/A N/ANinth Grade Proficiency Test (End of Year) Writing 83.60% N/A N/A N/A Reading 87.50% N/A N/A N/A Math 74.70% N/A N/A N/A Citizenship 84.30% N/A N/A N/A Science 77.50% N/A N/A N/ANinth Grade Proficiency Test (End of Tenth Grade) Writing 96.00% 92.30% N/A N/A Reading 96.00% 94.80% N/A N/A Mathematics 85.90% 83.40% N/A N/A Citizenship 89.10% 93.00% N/A N/A Science 88.80% 87.80% N/A N/ATenth Grade Ohio Graduation Test Writing N/A N/A N/A 88.40% Reading N/A N/A N/A 84.30% Mathematics N/A N/A N/A 83.20% Social Studies N/A N/A N/A 77.80% Science N/A N/A N/A 70.10%Eleventh Grade Ohio Graduation Test Writing N/A N/A N/A 90.30% Reading N/A N/A N/A 93.90% Mathematics N/A N/A N/A 87.10% Social Studies N/A N/A N/A 86.70% Science N/A N/A N/A 79.50%Twelfth Grade Ohio Graduation Test Writing N/A N/A N/A N/A Reading N/A N/A N/A N/A Mathematics N/A N/A N/A N/A Social Studies N/A N/A N/A N/A Science N/A N/A N/A N/A
Greenville City School DistrictSuccess Indicators
Last Ten Fiscal Years
134

2007 2008 2009 2010 2011 2012
78.60% 79.90% 76.80% 81.50% 84.20% 82.00%91.30% 84.00% 85.30% 74.80% 83.70% 81.40%
81.50% 77.90% 86.80% N/A N/A N/A80.90% 82.30% 88.40% 80.30% 86.50% 83.10%80.90% 73.50% 75.30% 72.50% 80.20% 72.10%
N/A N/A N/A N/A N/A N/AN/A N/A N/A N/A N/A N/AN/A N/A N/A N/A N/A N/AN/A N/A N/A N/A N/A N/AN/A N/A N/A N/A N/A N/A
85.30% 70.50% 72.80% 71.40% 76.30% 82.40%72.20% 74.00% 68.50% 68.40% 66.20% 75.90%78.60% 65.30% 76.50% 78.60% 74.70% 81.90%65.20% 58.90% 58.10% N/A N/A N/A
N/A N/A N/A N/A N/A N/A74.10% 77.40% N/A 85.20% 89.90% 84.80%66.10% 79.20% N/A 76.70% 71.40% 79.70%
N/A N/A N/A N/A N/A N/AN/A N/A N/A N/A N/A N/A
69.70% 63.50% 68.60% 68.20% 68.90% 74.70%80.90% 76.80% 73.10% 79.50% 74.80% 84.30%86.10% 85.00% 76.70% N/A N/A N/A
74.00% 86.80% 70.90% 81.20% 89.80% 84.20%53.60% 77.20% 58.70% 64.60% 81.10% 81.80%55.20% 63.50% 59.60% 64.20% 66.80% 78.30%39.60% 52.40% 38.00% N/A N/A N/A
N/A N/A N/A N/A N/A N/AN/A N/A N/A N/A N/A N/AN/A N/A N/A N/A N/A N/AN/A N/A N/A N/A N/A N/AN/A N/A N/A N/A N/A N/A
N/A N/A N/A N/A N/A N/AN/A N/A N/A N/A N/A N/AN/A N/A N/A N/A N/A N/AN/A N/A N/A N/A N/A N/AN/A N/A N/A N/A N/A N/A
83.50% 76.90% 83.40% 82.40% 86.90% 75.30%85.70% 81.30% 71.80% 86.80% 84.30% 79.00%80.90% 77.90% 76.70% 80.00% 73.80% 78.20%70.60% 75.50% 73.50% 80.00% 75.50% 71.10%66.90% 70.10% 68.40% 69.80% 67.20% 68.20%
93.70% 91.50% 94.40% 90.70% 90.70% 90.60%93.70% 92.70% 93.60% 83.80% 83.80% 91.00%93.70% 88.80% 89.60% 85.40% 85.40% 89.70%85.00% 85.80% 87.60% 80.60% 80.60% 83.40%81.50% 81.90% 83.30% 79.80% 79.80% 84.80%
N/A N/A N/A >95.0% >95.0% 66.00%N/A N/A N/A >95.0% >95.0% 66.00%N/A N/A N/A 93.00% 93.00% 66.00%N/A N/A N/A 93.40% 93.40% 60.00%N/A N/A N/A 92.60% 92.60% 25.00%
(continued)
135

Indicator - District Testing 2003 2004 2005 2006
National Merit Recognized Scholars 1 4 5 0Presidential Award for Educational Excellence
Achieved by 10% of twelfth grade students 13.00% 14.30% 22.00% 11.00%Achieved by 15% of eighth grade students 4.00% 3.50% 9.30% 24.00%Achieved by 15% of sixth grade students 25.00% 23.00% 25.00% 27.00%Achieved by 15% of fifth grade students 24.00% 22.00% 31.00% 26.00%
Diploma with Honors per State criteriaAchieved by 15% of all seniors 16.90% 19.80% 26.00% 17.00%
Award of Merit Curriculum per State criteriaAchieved by 15% of all seniors 24.80% 26.40% 31.00% 24.69%
Percent of Students Awarded Scholarships 23.00% 33.00% 55.00% 29.00%
Source: School District Internal Reports
N/A - Information not available
Greenville City School DistrictSuccess Indicators
Last Ten Fiscal Years (continued)
136

2007 2008 2009 2010 2011 2012
2 1 0 0 0 2
21.00% 11.50% 15.00% 10.00% 11.00% 13.40%32.00% 28.00% 38.00% 27.00% 20.20% N/A24.00% 16.00% N/A 19.20% N/A N/A34.00% 18.00% N/A 25.40% N/A N/A
18.90% 16.00% 18.00% 15.00% 10.00% N/A
26.00% 27.50% 23.00% 22.00% 22.00% N/A34.00% 56.50% 25.00% 29.00% 22.00% N/A
137

GREENVILLE CITY SCHOOL DISTRICT 2003 2004 2005
Formula ADM $3,557 $3,590 $3,513 Valuation Per Pupil 121,159 119,176 122,183 Total Property Tax Per Pupil 1,964 1,946 1,989 Total Revenue Per Pupil 7,401 7,909 8,408 State Revenue Per Pupil 3,437 3,695 4,032 State Revenue as Percent of Total 46.40% 46.70% 48.00% Local Revenue Per Pupil 3,553 3,677 3,794 Local Revenue as Percent of Total 48.00% 46.50% 45.10% Federal Revenue Per Pupil 411 537 581 Federal Revenue as Percent of Total 5.50% 6.80% 6.90% State SF3 Funding Per Pupil 2,824 2,908 2,937 Total Expenditure Per Pupil 7,355 8,016 8,236 Instructional Expenditure Per Pupil 4,522 4,968 5,038 Pupil Support Expenditure Per Pupil 620 643 662 Staff Support Expenditure Per Pupil 333 426 441 Administrative Expenditure Per Pupil 987 1,009 1,045 Building Operation Expenditure Per Pupil 893 970 1,049 Current Operating Voted Millage 31.40 31.40 31.40 Effective Class 1 Millage 21.04 21.05 21.06 Effective Class 2 Millage 24.94 25.18 25.36
STATEWIDE AVERAGES 2003 2004 2005
Formula ADM $2,970 $2,984 $2,973 Valuation Per Pupil 122,664 126,275 129,497 Total Property Tax Per Pupil 3,917 4,041 4,154 Total Revenue Per Pupil 8,223 8,559 9,079 State Revenue Per Pupil 3,712 3,835 3,935 State Revenue as Percent of Total 45.14% 44.81% 43.34% Local Revenue Per Pupil 3,965 4,080 4,407 Local Revenue as Percent of Total 48.22% 47.66% 48.54% Federal Revenue Per Pupil 546 645 737 Federal Revenue as Percent of Total 6.64% 7.53% 8.12% State SF3 Funding Per Pupil 3,151 3,195 3,227 Total Expenditure Per Pupil 8,418 8,756 9,018 Instructional Expenditure Per Pupil 4,702 4,892 5,048 Pupil Support Expenditure Per Pupil 866 905 930 Staff Support Expenditure Per Pupil 230 252 272 Administrative Expenditure Per Pupil 1,009 1,043 1,067 Building Operation Expenditure Per Pupil 1,611 1,664 1,702 Current Operating Millage 50.08 50.18 50.70 Effective Class 1 Millage 26.84 26.51 26.59 Effective Class 2 Millage 30.63 30.27 30.50
Source: Ohio Department of Education
N/A - Information not available from the Ohio Department of Education until January 2013.
Greenville City School DistrictHistorical Data Indicators
Last Ten Fiscal Years(cash basis of accounting)
138

2006 2007 2008 2009 2010 2011 2012
$3,472 $3,374 $3,277 $3,106 $3,185 $3,122 $3,101129,366 129,822 129,314 135,647 130,460 134,139 130,604
2,013 2,616 2,811 3,086 3,341 3,397 3,5088,541 8,789 9,167 8,962 9,736 9,595 10,9824,089 4,262 4,553 4,571 4,876 4,586 4,940
47.90% 48.50% 49.70% 51.00% 50.10% 47.80% 45.35%3,909 3,925 4,003 3,787 4,041 4,207 4,836
45.80% 44.60% 43.70% 42.30% 41.50% 43.80% 44.40%543 602 611 604 819 802 1,116
6.40% 6.90% 6.70% 6.70% 8.40% 8.40% 10.25%3,035 3,092 2,994 3,015 3,648 3,477 3,5088,357 8,717 8,754 8,939 9,020 8,772 9,3825,068 5,401 5,353 5,426 5,482 5,421 5,652
690 725 775 742 665 694 720449 456 444 414 533 424 430
1,093 1,083 1,011 1,077 1,104 1,075 1,1941,058 1,052 1,171 1,280 1,236 1,158 1,38631.40 31.40 31.40 31.40 35.31 35.45 35.5520.99 21.01 20.03 20.03 23.94 24.11 24.8923.94 24.04 22.58 22.58 27.94 28.16 29.02
2006 2007 2008 2009 2010 2011 2012
$2,968 $2,929 $2,925 $2,739 $2,886 $2,867 $2,819138,475 143,575 144,032 144,239 138,142 141,110 153,210
4,413 4,662 4,727 5,217 4,767 4,872 5,0639,470 10,296 10,565 10,706 10,756 11,232 N/A3,963 4,412 4,601 4,861 4,738 5,109 N/A
41.85% 42.85% 43.60% 45.40% 44.10% 45.50% N/A4,742 5,059 5,100 4,966 4,918 5,011 N/A
50.07% 49.14% 48.30% 46.40% 45.70% 44.60% N/A770 825 864 879 1,100 1,112 N/A
8.13% 8.01% 8.20% 8.20% 10.20% 9.90% N/A3,277 3,312 3,249 3,951 3,707 3,563 3,6289,343 9,586 9,939 10,184 10,512 10,571 N/A5,206 5,334 5,502 5,624 5,831 5,862 N/A
954 957 978 1,015 1,051 1,050 N/A292 290 306 330 363 390 N/A
1,088 1,181 1,220 1,260 1,287 1,297 N/A1,802 1,824 1,933 1,955 1,980 1,972 N/A51.66 52.06 51.77 51.31 45.36 49.10 49.6027.19 29.68 28.88 29.07 26.34 30.20 31.1431.08 33.46 32.51 32.62 29.76 33.77 35.03
139

District Buildings (1) 2003 2004 2005 2006 2007 2008 2009 2010 2011 2012
East Elementary School 63.21% 62.97% 58.38% 60.79% 54.57% N/A N/A N/A N/A N/A Gettysburg Elementary School 43.09% 38.83% 46.19% 45.02% 53.45% N/A N/A N/A N/A N/A Greenville Intermediate School N/A N/A N/A N/A N/A 48.32% 66.96% 64.51% 63.14% 61.07%
Greenville Junior High School 48.81% 40.46% 40.80% 43.90% 42.13% 43.56% 60.24% 66.47% 62.43% 63.21%
Greenville Middle School N/A N/A N/A N/A N/A 44.62% 66.07% 68.97% 68.28% 63.41%
Greenville Primary School N/A N/A N/A N/A N/A 52.67% 74.67% 46.70% 65.98% 68.11% Greenville Senior High School 32.47% 45.33% 42.63% 41.22% 38.32% 42.31% 55.08% 49.57% 40.62% 37.43% North Middle School 49.39% 42.62% 41.75% 31.30% 47.40% N/A N/A N/A N/A N/A South Elementary School 52.40% 53.16% 48.03% 47.35% 51.56% N/A N/A N/A N/A N/A Woodland Heights Elementary School 28.54% 30.23% 34.29% 32.58% 35.14% N/A N/A N/A N/A N/A
District-wide 43.64% 45.05% 44.72% 42.49% 44.89% 45.93% 70.87% 63.60% 65.40% 63.71%
Source: Food Service Director Records - Office of Child Nutrition Services ODE
N/A - Information not available
Greenville City School District
(1) The East Elementary, Woodland Heights Elementary and South Elementary Schools were reconfigured into different grade levels, therefore no longer functioning as comparable schools. The Gettysburg Elementary School and the North Middle School were closed in fiscal year 2008. Additionally, an on-line system for accounting for free and reduced lunches was introduced mid-term in fiscal year 2009 which appears to have increased accuracy of students who were eligible and receiving free and reduced lunches.
Last Ten Fiscal YearsPercentage of Students Who Receive Free and Reduced Lunches
140


Greenville City Schools
Henry St. Clair Memorial Hall
215 West 4th Street
Greenville, Ohio 45331-1423
Carla G. Surber, CPA
CFO, Treasurer
Phone 937 548-3185— Extension 725
Fax 937 548-6943
Statements are
available at
www.greenville.k12.oh.us