for the fiscal year ended - zonebourse.com€¦ · annual report form 10-k for the fiscal year...
TRANSCRIPT

Annual Report Form 10-K
for the fiscal year ended
December 31, 2014
INTERNATIONAL FLAVORS & FRAGRANCES INC. >>
IFF GLOBAL HEADQUARTERS521 West 57th Street, New York, NY 10019212.765.5500 www.iff.com

UNITED STATES SECURITIES AND EXCHANGE COMMISSIONWashington, D.C. 20549
FORM 10-KÍ ANNUAL REPORT PURSUANT TO SECTION 13 OR 15(d)
OF THE SECURITIES EXCHANGE ACT OF 1934For the fiscal year ended December 31, 2014
OR‘ TRANSITION REPORT PURSUANT TO SECTION 13 OR 15(d)
OF THE SECURITIES EXCHANGE ACT OF 1934For the transition period from to
Commission File Number 1-4858
INTERNATIONALFLAVORS&FRAGRANCESINC.(Exact name of registrant as specified in its charter)
NEW YORK 13-1432060(State or other jurisdiction
of incorporation or organization)(I.R.S. Employer Identification No.)
521 WEST 57TH STREET, NEW YORK, N.Y. 10019(Address of principal executive offices) (Zip Code)
Registrant’s telephone number, including area code (212) 765-5500SECURITIES REGISTERED PURSUANT TO SECTION 12(b) OF THE ACT:Title of Each Class Name of Each Exchange on Which Registered
Common Stock, par value New York Stock Exchange121⁄2¢ per shareSECURITIES REGISTERED PURSUANT TO SECTION 12(g) OF THE ACT:
NoneIndicate by check mark if the registrant is a well-known seasoned issuer, as defined in Rule 405 of the Securities
Act. Yes Í No ‘Indicate by check mark if the registrant is not required to file reports pursuant to Section 13 or Section 15(d) of the
Act. Yes ‘ No ÍIndicate by check mark whether the registrant (1) has filed all reports required to be filed by Section 13 or 15(d) of the Securities
Exchange Act of 1934 during the preceding 12 months (or for such shorter period that the registrant was required to file such reports),and (2) has been subject to such filing requirements for the past 90 days. Yes Í No ‘
Indicate by check mark whether the registrant has submitted electronically and posted on its corporate Website, if any, everyInteractive Data File required to be submitted and posted pursuant to Rule 405 of Regulation S-T (§232.405 of this chapter) during thepreceding 12 months (or for such shorter period that the registrant was required to submit and post such files). Yes Í No ‘
Indicate by check mark if disclosure of delinquent filers pursuant to Item 405 of Regulation S-K (§229.405 of this chapter) is notcontained herein, and will not be contained, to the best of registrant’s knowledge, in definitive proxy or information statementsincorporated by reference in Part III of this Form 10-K or any amendments to this Form 10-K. ‘
Indicate by check mark whether the registrant is a large accelerated filer, an accelerated filer, a non-accelerated filer, or a smallerreporting company. See the definitions of “large accelerated filer,” “accelerated filer” and “smaller reporting company” in Rule 12b-2of the Exchange Act.
Large accelerated filer Í Accelerated filer ‘ Non-accelerated filer ‘ Smaller reporting company ‘Indicate by check mark whether the registrant is a shell company (as defined in Rule 12b-2 of the Exchange
Act). Yes ‘ No ÍFor the purpose of reporting the following market value of registrant’s outstanding common stock, the term “affiliate” refers to
persons, entities or groups which directly or indirectly control, are controlled by, or are under common control with the registrant anddoes not include individual executive officers, directors or less than 10% shareholders. The aggregate market value of registrant’scommon stock not held by affiliates as of June 30, 2014 was $8,472,499,224.
As of February 12, 2015, there were 80,742,973 shares of the registrant’s common stock, par value 121⁄2¢ per share, outstanding.
DOCUMENTS INCORPORATED BY REFERENCEPortions of the registrant’s proxy statement for the 2015 Annual Meeting of Shareholders (the “IFF 2015 Proxy Statement”) are
incorporated by reference in Part III of this Form 10-K.

INTERNATIONAL FLAVORS & FRAGRANCES INC.
TABLE OF CONTENTS
PAGE
PART I
ITEM 1. Business . . . . . . . . . . . . . . . . . . . . . . . . . . . . . . . . . . . . . . . . . . . . . . . . . . . . . . . . . . . . . . . . . . . 3
ITEM 1A. Risk Factors . . . . . . . . . . . . . . . . . . . . . . . . . . . . . . . . . . . . . . . . . . . . . . . . . . . . . . . . . . . . . . . . 12
ITEM 1B. Unresolved Staff Comments . . . . . . . . . . . . . . . . . . . . . . . . . . . . . . . . . . . . . . . . . . . . . . . . . . . 20
ITEM 2. Properties . . . . . . . . . . . . . . . . . . . . . . . . . . . . . . . . . . . . . . . . . . . . . . . . . . . . . . . . . . . . . . . . . . 20
ITEM 3. Legal Proceedings . . . . . . . . . . . . . . . . . . . . . . . . . . . . . . . . . . . . . . . . . . . . . . . . . . . . . . . . . . . 22
ITEM 4. Mine Safety Disclosures . . . . . . . . . . . . . . . . . . . . . . . . . . . . . . . . . . . . . . . . . . . . . . . . . . . . . . 23
PART II
ITEM 5. Market for Registrant’s Common Equity, Related Stockholder Matters and Issuer Purchasesof Equity Securities . . . . . . . . . . . . . . . . . . . . . . . . . . . . . . . . . . . . . . . . . . . . . . . . . . . . . . . . . . 24
ITEM 6. Selected Financial Data . . . . . . . . . . . . . . . . . . . . . . . . . . . . . . . . . . . . . . . . . . . . . . . . . . . . . . . 26
ITEM 7. Management’s Discussion and Analysis of Financial Condition and Results ofOperations . . . . . . . . . . . . . . . . . . . . . . . . . . . . . . . . . . . . . . . . . . . . . . . . . . . . . . . . . . . . . . . . . 29
ITEM 7A. Quantitative and Qualitative Disclosures About Market Risk . . . . . . . . . . . . . . . . . . . . . . . . . 51
ITEM 8. Financial Statements and Supplementary Data . . . . . . . . . . . . . . . . . . . . . . . . . . . . . . . . . . . . . 52
ITEM 9. Changes in and Disagreements with Accountants on Accounting and FinancialDisclosure . . . . . . . . . . . . . . . . . . . . . . . . . . . . . . . . . . . . . . . . . . . . . . . . . . . . . . . . . . . . . . . . . 52
ITEM 9A. Controls and Procedures . . . . . . . . . . . . . . . . . . . . . . . . . . . . . . . . . . . . . . . . . . . . . . . . . . . . . . 52
ITEM 9B. Other Information . . . . . . . . . . . . . . . . . . . . . . . . . . . . . . . . . . . . . . . . . . . . . . . . . . . . . . . . . . . 52
PART III
ITEM 10. Directors, Executive Officers and Corporate Governance . . . . . . . . . . . . . . . . . . . . . . . . . . . . 53
ITEM 11. Executive Compensation . . . . . . . . . . . . . . . . . . . . . . . . . . . . . . . . . . . . . . . . . . . . . . . . . . . . . . 53
ITEM 12. Security Ownership of Certain Beneficial Owners and Management and RelatedStockholder Matters . . . . . . . . . . . . . . . . . . . . . . . . . . . . . . . . . . . . . . . . . . . . . . . . . . . . . . . . . . 53
ITEM 13. Certain Relationships and Related Transactions and Director Independence . . . . . . . . . . . . . . 53
ITEM 14. Principal Accountant Fees and Services . . . . . . . . . . . . . . . . . . . . . . . . . . . . . . . . . . . . . . . . . . 53
PART IV
ITEM 15. Exhibits and Financial Statement Schedules . . . . . . . . . . . . . . . . . . . . . . . . . . . . . . . . . . . . . . . 54
SIGNATURES . . . . . . . . . . . . . . . . . . . . . . . . . . . . . . . . . . . . . . . . . . . . . . . . . . . . . . . . . . . . . . . . . . . . . . . . 98
2

PART I
When used in this report, the terms “IFF,” “the Company,” “we,” “us” and “our” mean InternationalFlavors & Fragrances Inc., and its subsidiaries.
ITEM 1. BUSINESS.
We create, manufacture and supply flavors and fragrances for the food, beverage, personal care andhousehold products industries either in the form of compounds or individual ingredients. Our flavors andfragrances compounds combine a large number of ingredients that are blended, mixed or reacted together toproduce proprietary formulas created by our perfumers and flavorists. Utilizing our capabilities in consumerinsight, research and product development (“R&D”) and creative expertise, we collaborate with our customers todrive consumer preference for our customers’ brands. This collaboration in turn helps bolster our customers’market share and grow equity in their brand portfolio.
The global market for flavors and fragrances has expanded consistently, primarily as a result of an increasein demand for, as well as an increase in the variety of, consumer products containing flavors and fragrances. Theflavors and fragrances market is part of a larger market which supplies a variety of ingredients and componentsthat consumer products companies utilize in their products. The broader market includes large multinationalcompanies and smaller regional and local participants which supply products such as seasonings, texturizers,spices, enzymes, certain food related commodities, fortified products and cosmetic ingredients. In 2014, weachieved sales of approximately $3.1 billion, making us one of the top four companies in the global flavors andfragrances sub-segment of the broader ingredients and compounds market. Within the flavors and fragrances sub-segment of this broader market, the top four companies comprise approximately two-thirds of the total estimatedsales. We believe that our diversified business platform consisting of expansive geographic coverage, a broadproduct portfolio and a global and regional customer base, positions us to achieve long-term growth as theflavors and fragrances markets expand.
With operations in 32 different countries worldwide and approximately 6,200 employees, we collaboratewith our customers to serve consumers in more than 100 countries. We operate in two business segments, Flavorsand Fragrances, with sales to customers in the four regions set forth below:
Region % of 2014 Sales
Europe, Africa, Middle East . . . . . . . . . . . . . . . . . . . . . . . . . . . . . . . . . . . . . . . . . . . . . . . . . . . . . . . 34%Greater Asia . . . . . . . . . . . . . . . . . . . . . . . . . . . . . . . . . . . . . . . . . . . . . . . . . . . . . . . . . . . . . . . . . . . . 28%North America . . . . . . . . . . . . . . . . . . . . . . . . . . . . . . . . . . . . . . . . . . . . . . . . . . . . . . . . . . . . . . . . . . 22%Latin America . . . . . . . . . . . . . . . . . . . . . . . . . . . . . . . . . . . . . . . . . . . . . . . . . . . . . . . . . . . . . . . . . . 16%
We have a strong commitment to emerging markets. We believe that significant future growth potential forthe flavors and fragrances industry, and for our business, exists in the emerging markets (all markets exceptNorth America, Japan, Australia, and Western, Southern and Northern Europe). Over the past five years our localcurrency growth rate in emerging markets has significantly outpaced that of developed markets. We expect thistrend to continue for the foreseeable future. The emerging market local currency growth rate in 2014 was 6%.We have had operations in some of the largest emerging markets for multiple decades. As a result of theseestablished operations, sales in emerging markets represented 50% of 2014 sales, up from 49% in 2013. As ourcustomers in emerging markets grow their businesses, they will have the ability to leverage our long-standingpresence and our extensive market knowledge to help drive their brands.
We believe we have a diversified product and customer portfolio that provides us with greater stability andgrowth potential across a variety of economic environments. In 2014, our Flavors business represented 47% ofour sales, while our Fragrances business represented 53% of sales. During 2014, our 25 largest customersaccounted for 53% of our sales. Sales to our largest customer accounted for 12%, 12% and 11% of our sales in2014, 2013 and 2012, respectively. Such sales were largely in our Fragrances business.
3

For financial information about our operating segments and the geographic areas in which we do business,please see Note 12 of our Consolidated Financial Statements included in this Form 10-K.
Strategic Priorities
We are focused on generating sustainable profitable growth across our business. We believe that we cancontinue to deliver returns above cost of capital on a long-term basis and increase shareholder value byleveraging our geographic reach, strengthening our innovation platform and maximizing our portfolio. We are inthe process of refreshing the key elements of our strategic priorities, which are the following:
‰ Leverage geographic reach: Our strong geographic reach allows us to capture the benefits of attractivepopulation growth and wealth creation in emerging markets, representing a key component of our growthplan. In emerging markets, strong GDP growth and a significant expansion of the middle-class consumerare increasing the demand for better-flavored and fragranced consumer products. To support this trend,we have made significant investments in emerging markets. Since 2008, we have opened eight state-of-the-art creative centers in Shanghai, Sao Paulo, Moscow, Singapore, Mumbai, Delhi, Chengdu, andBeijing. We continue to invest in the fast growing region of Greater Asia. In 2013, we opened a newflavors manufacturing facility in Guangzhou, China, which followed the 2012 opening of our new flavorand fragrance facility in Singapore, both of which are part of a more than $100 million investment inGreater Asia. We also announced a $50 million investment to fund our expansion in Indonesia, bringingour total investment in Greater Asia to more than $150 million. We also continued toward the completionof our more than $50 million expansion in Turkey, expected to be completed in 2015. We expect that theemerging markets will represent more than half of our annual sales in 2015, as we estimate that growthpotential in these markets will outpace the expected growth in the developed markets.
‰ Strengthen innovation platform: We continue to focus on creating innovative and distinctive productsthat meet consumer needs and drive consumer preference for our customers’ brands. We have beenstrengthening our platforms by leveraging our knowledge of consumer trends to direct ten key researchplatforms that address current and expected future needs of consumers. We in turn use our customer-centric knowledge and research platforms to drive technological development and create a cost-effectiveproduct portfolio. We anticipate that this focus on innovation will be instrumental in meeting futureconsumer needs, thereby driving our customers’ growth and in turn market share gains for both IFF andour customers. To capture these opportunities in Flavors, we are focusing on key flavor systemstechnologies to provide consumers with healthier solutions and an enhanced taste experience. InFragrances, we are focusing on ingredients, including our naturals portfolio, as well as our deliverysystems. In 2014, we acquired Aromor Flavors and Fragrances Ltd. (“Aromor”), a manufacturer andmarketer of complex specialty ingredients that are used in fragrances and flavors, to provide us with cost-effective, quality ingredients to use in our compounds creations.
‰ Maximize portfolio: We believe in a disciplined, analytical approach toward value creation to maximizeour portfolio and drive sustained profitable growth. We continuously look for and identify opportunitiesto strengthen and grow the business through internal improvements, disciplined allocation of resourcestowards advantaged categories, customers and/or markets, working capital management and return-basedcapital investments.
Our Product Offerings
Flavors
Flavors are the key building blocks that impart taste in processed food and beverage products and, as such,play a significant role in determining consumer preference of the end products in which they are used. While weare a global leader, our Flavors business is regional in nature, with different formulas that reflect local taste andingredients. As a leading creator of flavor compounds, we help our customers deliver on the promise of deliciousand healthy foods and drinks that appeal to consumers. Our Flavors compounds are ultimately used by ourcustomers in four end-use categories: (1) Savory, (2) Beverages, (3) Sweet, pharmaceutical and oral care
4

(“Sweet”), and (4) Dairy. We create our flavors in our regional creative and technical centers that allow us tosatisfy local taste preferences, while also helping to ensure regulatory compliance and production standards. Wealso manufacture a limited amount of flavor ingredients for our use in developing flavor compounds.
‰ Savory —We produce flavors which are used in soups, sauces, condiments, prepared meals, meat andpoultry, and potato chips and other savory snacks.
‰ Beverages —We create flavors for juice drinks, carbonated beverages, flavored waters and spirits andhave creative expertise dedicated to beverage flavor systems.
‰ Sweet —We create innovative flavor concepts and heat-stable flavors for bakery products, as well ascandy, chewing gum and cereal, which each have distinctive sweet tastes. For pharmaceutical and oralcare products, we produce flavors for products such as toothpaste and mouthwash.
‰ Dairy —We offer a complete range of value-added compounded flavors for all dairy applications,including yogurt, ice cream, cheese, cream and butter flavor. We also offer a wide range of quality vanillaextracts and a variety of flavor solutions that build on our understanding of vanilla.
We develop thousands of different flavors and taste offerings for our customers, most of which are tailor-made. We continuously develop new formulas in order to meet changing consumer preferences and customerneeds. Consumers, especially those in developed markets such as the United States and Western Europe, areincreasingly seeking to focus on products which promote health and wellness. They want food and beverageproducts that are both good for them and taste good. Our objective is to capture a significant share of this shift inconsumer demand by capitalizing on the ability of our naturals and proprietary ingredients and flavor systemstechnologies to provide consumers with healthier solutions without changing the taste experience of the food orbeverage.
Fragrances
We are a global leader in the creation of fragrances. Our fragrances are a key component in the world’sfinest perfumes and best-known consumer brands, including fabric care, home care, personal wash, hair care andtoiletries. Our Fragrances business consists of Fragrance Compounds and Fragrance Ingredients.
‰ Fragrance Compounds— In 2014, we realigned our creative and commercial teams within FragranceCompounds into two broad market categories: Fine Fragrances and Consumer Fragrances. FragranceCompounds refers to our fragrance compounds that are ultimately used by our customers in these twomarket categories.
• Fine Fragrances —We have created some of the industry-leading fine fragrance classics as wellas cutting-edge niche fragrances, as evidenced by our number of top sellers and the success of ournew launches.
• Consumer Fragrances —Our consumer fragrances include five end-use categories of products:(1) Fabric Care, including laundry detergents, fabric softeners and specialty laundry products;(2) Home Care, including household cleaners, dishwashing detergents and air fresheners;(3) Personal Wash, including bar soap and shower gel; (4) Hair Care; and (5) Toiletries.
‰ Fragrance Ingredients —We create, develop and manufacture a broad portfolio of innovative, high-quality and cost-effective fragrance, and to a much smaller extent flavor, ingredients, for internal use inour compound businesses and for external use in preparation of compounds by our customers and otherthird parties, including our competitors. With over 1,200 separate fragrance ingredients, we believe thatwe lead the industry with the breadth of our product portfolio. We manufacture our ingredients throughour global network of production facilities and continue to work to optimize our manufacturing processes,as we have done during the year through the closure of our Augusta facility. We believe that this networkgives us the flexibility to make products in different locations while maintaining the same high andconsistent standards of product quality. We will continue to look for opportunities to strengthen this
5

component of our portfolio, particularly in the specialty chemicals area, as evidenced by our 2014acquisition of Aromor, while at the same time ensuring we maintain a cost-effective portfolio, particularlyin the price sensitive commodities component.
We believe that our in-house naturals operations, led by Laboratoire Monique Rémy (“LMR”) in Grasse,France, are industry leading in the processing quality materials and offer decades of experience understandingnatural products and perfecting the process of transforming naturals, such as narcissus, jasmine and blackcurrantbud, into pure absolutes that retain the unique fragrance of their origin.
Our perfumers have access to our large portfolio of innovative, high-quality and cost-effective ingredients tosupport their creativity, which in turn provides our customers with a unique identity for their brands. We alsocreate innovative delivery systems, including (i) our proprietary encapsulation technology, which consists ofindividual fragrance droplets coated with a protective polymetric shell to deliver superior fragrance performancethroughout a product’s lifecycle and (ii) our exclusive polymer delivery system, PolyIFF, which is a “solidfragrance” technology that allows us to add scent to functional or molded plastic.
We also collaborate with some of the world’s leading art and fashion schools to tap into the creative mindsof the future leaders of fashion and design. We collaborate with scientists, writers, artists, musicians and film-makers to expose our perfumers to new and constantly evolving creative territories and approaches.
Core Competencies
We focus on five core competencies that we believe enable us to (i) successfully provide our customers withsuperior products, (ii) drive productivity and efficiency gains and (iii) improve our margins and our cash flow. Inthat regard, we strive to:
‰ Develop a deep understanding of consumers’ preferences, values and branding. Through our ConsumerInsights program, we have dedicated professionals working to understand consumer trends all around theglobe. Our consumer and marketing teams interpret consumer trends, monitor product launches, analyzequantitative market data and conduct several hundred thousand consumer interviews annually. Oursensory experts explore flavor and fragrance performance, the psychophysics of sensory perception(including chemesthetic properties such as warming, cooling and tingling), the genetic basis for flavorand fragrance preference, and the effects of tastes and aromas on mood, performance, health and well-being. Utilizing our proprietary statistical programs, we use this information to enable us to understandthe emotional connections between a prospective product and the consumer. The ability to pinpoint thelikelihood of a product’s success translates into stronger brand equity for our customers’ products, ahigher likelihood of repeat purchases and market share gains for our customers and us, as well as a moreefficient creative process within IFF.
‰ Develop and utilize technology to create innovative solutions that drive brand success. We spendapproximately 8% of our sales on the research, development and implementation of new molecules,compounds and technologies that help our customers respond to changing consumer preference. As aresult of this investment, we have been granted 259 patents in the United States since 2000, including 8 in2014, and we have developed many unique molecules and delivery systems for our customers that areused as the foundations of successful flavors and fragrances around the world.
‰ Cultivate our creative expertise in collaboration with our customers. We have a network of creativecenters around the world where we create or adapt the basic flavors or fragrances that we have developedin the R&D process to commercialize for use in our customers’ consumer products. Our global creativeteams consist of perfumers, fragrance evaluators and flavorists, as well as marketing, consumer insightand technical application experts, from a wide range of cultures and nationalities. In close partnershipwith our customers’ product development groups, our creative teams create the scents and tastes that ourcustomers are seeking in order to satisfy consumer demands in each of their markets.
6

‰ Develop strong customer intimacy. We believe that understanding our customers’ brands, technologies;strategies and priorities enable us to provide them with superior products and solutions. This, combinedwith supply chain excellence and our global regulatory capabilities are key to being selected as apreferred/“core list supplier”.
‰ Drive efficiency in all that we do.We focus on integrating our consumer insight, technology, creative,regulatory and manufacturing expertise in a manner that we believe drives productivity and efficiency toimprove profitability on a long-term basis. We believe that discipline in driving efficiencies is asignificant factor in our ability to simultaneously enhance margins and cash flows, while continuing toinvest in our key growth initiatives.
Research and Product Development
We consider our R&D development infrastructure to be one of our key competencies and we focus andinvest substantial resources in the research and development of new and innovative compounds, formulas andtechnologies and the application of these to our customers’ products. Using the knowledge gained from ourConsumer Insights program, we strategically focus our resources around key R&D platforms that addressconsumer needs or preferences, or anticipate a future preference. By aligning our resources around theseplatforms, we ensure the proper support and focus for each program so that it can be further developed andeventually be accepted for commercial application.
We maintain six R&D centers around the world, where we employ scientists and application engineers tosupport (i) the discovery of new materials, (ii) the development of new technologies, such as our deliverysystems, (iii) the creation of new compounds and (iv) the enhancement of existing ingredients and compounds. Inour 31 creative centers around the world, including our newest facilities in Shanghai, Sao Paulo, Moscow,Singapore, Mumbai, Delhi, Chengdu, and Beijing, teams of flavorists and perfumers work with our customers’product development groups to create the exact scent or taste they are seeking. In 2014, we employed about1,250 people in research and product development activities. We spent $254 million, $260 million and $234million, or approximately 8%, 9% and 8% of sales in 2014, 2013 and 2012, respectively, on R&D activities.
Our ingredients research program discovers molecules found in natural substances and creates newmolecules that are subsequently tested for their fragrance or flavor value. To broaden our offering of natural,innovative and unique products, we seek collaborations with research institutions and other companiesthroughout the world. We have created a number of such collaborations, for example, our ongoing relationshipwith Amyris, which strengthens and broadens the pipeline of new and innovative molecules that we intend tolaunch in the coming years. To further strengthen and broaden our technology offerings and capabilities, weacquired Aromor in January 2014 to provide us with cost-effective complex specialty ingredients.
The development of new and customized flavor and fragrance compounds is a complex process calling uponthe combined knowledge of our scientists, flavorists and perfumers. Scientists from various disciplines work inproject teams with the flavorists and perfumers to develop flavor and fragrance compounds with consumerpreferred performance characteristics. The development of new flavor and fragrance compounds requires (i) in-depth knowledge of the flavor and fragrance characteristics of the various ingredients we use, (ii) anunderstanding of how the many ingredients in a consumer product interact and (iii) the creation of controlledrelease and delivery systems to enhance flavor and fragrance performance. To facilitate this process, we have ascientific advisory board comprised of five leading scientists that provide external perspectives and independentfeedback on our R&D initiatives.
Development of new flavors and fragrances is driven by a variety of sources including requests from ourcustomers, who are in need of a specific flavor or fragrance for use in a new or modified consumer product, or asa result of internal initiatives stemming from our Consumer Insights program. Our product development teamworks in partnership with our scientists and researchers to optimize the consumer appeal of the flavor orfragrance. A collaborative process between our researchers, our product development team and our customersthen follows to perfect the flavor or fragrance so that it is ready to be included in the final consumer product.
7

In addition to creating new flavors and fragrances, our researchers and product development teams advisecustomers on ways to improve their existing products by adjusting or substituting current ingredients with morereadily accessible or less expensive materials or by modifying the current ingredients to produce an enhancedyield. This often results in creating a better value proposition for our customers.
Our flavor and fragrance formulas are treated as trade secrets and remain our proprietary asset. Our businessis not materially dependent upon any individual patent, trademark or license.
Supply Chain
We have an integrated supply chain from raw material sourcing through manufacturing, quality assurance,regulatory compliance and distribution, which permits us to provide our customers with consistent qualityproducts on a timely and cost-effective basis.
Procurement. The ingredients that we use in our compounds are both natural and synthetic. We purchaseapproximately 8,500 different raw materials from about 2,300 domestic and international suppliers.Approximately half of the materials we purchase are naturals or crop related items and the other half aresynthetics and chemicals. Natural ingredients are derived from flowers, fruits and other botanical products aswell as from animal products. They contain varying numbers of organic chemicals that are responsible for thefragrance or flavor of the natural product. The natural products are purchased in processed or semi-processedform. Some are used in compounds in the state in which they are purchased and others after further processing.Natural products, together with various chemicals, are also used as raw materials for the manufacture of syntheticingredients by chemical processes. Our flavor products also include extracts and seasonings derived from variousfruits, vegetables, nuts, herbs and spices as well as microbiologically-derived ingredients. We manufacture mostof our synthetic ingredients for use in our fragrance compounds as well as for sale to others.
While we purchase a diverse portfolio of raw materials, about 80% of our spending is focused onapproximately 800 materials, which allows us to leverage our buying power with suppliers. In order to ensure oursupply of raw materials, achieve favorable pricing and provide timely transparency regarding inflationary trendsto our customers, we continue to be focused on (i) implementing a forward-buy strategy, (ii) entering intosupplier relationships to gain access to supplies that we do not have, (iii) implementing indexed pricing,(iv) reducing the complexity of our formulations and (v) evaluating whether it is more profitable to buy or makean ingredient. We are also concentrating on local country sourcing with our own procurement professionals.
Manufacturing and Distribution. We have 29 manufacturing sites around the world that support more than36,000 products. Our major manufacturing facilities are located in the United States, the Netherlands, Spain,Great Britain, Turkey, Brazil, Mexico, Australia, China, India, and Singapore. Our supply chain initiatives indeveloping markets are focused on increasing capacity and investments in key technologies, while within ourmore mature markets, we tend to focus on consolidation and cost optimization as well as implementing newtechnologies. In addition to our own manufacturing facilities, we develop relationships with third parties thatpermit us to expand the technologies, capabilities and capacity that we can access to serve our customers.
Based on the regional nature of the Flavors business and the concerns regarding the transportability of rawmaterials, we have established smaller manufacturing facilities in our local markets that are focused on localneeds. Products within the Fragrances business are typically composed of compounds that are more stable andmore transportable around the world. Consequently, we have fewer manufacturing facilities within ourFragrances business, which produce compounds and ingredients for global distribution.
In 2014, we continued to invest in our facilities, notably in emerging markets. We opened our newCreative & Applications lab at our existing facility in Jakarta, Indonesia and opened a new sales office andlaboratory in Chile. Construction is also ongoing of a new creative center and expansion of our manufacturingfacilities in Gebze, Turkey.
8

Sustainability. As a leading global creator of flavors and fragrances for a wide variety of consumer products,sustainability has been an important part of how we do business. Our sustainability strategy, which is closelyaligned with our long-term business strategy, was first formalized in 2011 and consists of four pillars: ourproducts; our impact; our sources; and our people. While the industry and our Company constantly evolves, weare committed to conducting our business in line with our dedication to the environment, to society and to theshareholders, customers and others that have placed their confidence in us. In 2014, we were identified as aleader in Climate Change Reporting and will be included in the Climate Disclosure Leadership Index compiledby the CDP (formerly known as the Carbon Disclosure Project). In addition, during 2014 a third party completedthe installation of a solar panel field on IFF property. The solar panel field is the largest in the industry. Inaddition to the installation of the solar panel field, the agreement we entered into also called for the third party,who is the owner of the solar panels, to operate and maintain the installation for a multi-year period.
Governmental Regulation
We develop, produce and market our products in a number of jurisdictions throughout the world and aresubject to federal, regional and local legislation and regulations in each of the various countries. Our flavor andmany of our fragrance products are intended for the food, beverage and pharmaceutical industries, which aresubject to strict quality and regulatory standards. As a result, we are required to meet these strict standards which,in recent years, have become increasingly stringent.
In addition, we are subject to various rules relating to health, work safety and the environment at the localand international levels in the various countries in which we operate. Our manufacturing facilities throughout theworld are subject to environmental standards relating to air emissions, sewage discharges, the use of hazardousmaterials, waste disposal practices and clean-up of existing environmental contamination. In recent years, therehas been a significant increase in the stringency of environmental regulation and enforcement of environmentalstandards, and the costs of compliance have risen significantly. We expect that the trend of increased regulationand disclosure will continue in the future.
Our products and operations are subject to regulation by governmental agencies in each of the markets inwhich we operate. These agencies include (1) the Food and Drug Administration and equivalent internationalagencies that regulate the flavors and other ingredients in consumer products, (2) the Environmental ProtectionAgency and equivalent international agencies that regulate our fragrance compounds, (3) the Occupational Safetyand Health Administration and equivalent international agencies that regulate the working conditions in ourmanufacturing, research laboratories and creative centers, (4) local and international agencies that regulate tradeand customs, (5) the Drug Enforcement Administration and other local or international agencies that regulatecontrolled chemicals that we use in our operations and (6) the Chemical Registration/Notification authorities thatregulate chemicals that we use in, or transport to, the various countries in which we manufacture and/or marketour products. We have seen an increase in registration and reporting requirements concerning the use of certainchemicals in a number of countries.
Competition
The flavors and fragrances market is part of a larger market which supplies a variety of ingredients andcomponents that consumer products companies utilize in their products. The broader market includes largemultinational companies or smaller regional and local participants which supply products such as seasonings,texturizers, spices, enzymes, certain food related commodities, fortified products and cosmetic ingredients.
The market for flavors and fragrances is highly competitive. Based on annual sales, our main competitorsconsist of (1) the three other large global flavor and fragrance manufacturers, Givaudan, Firmenich and Symrise,(2) mid-sized companies, (3) numerous small and local manufacturers with more limited research anddevelopment capabilities who focus on narrow market segments and local customers and (4) consumer productcompanies who may develop their own flavors or fragrances. We, together with the other top three companies,represent approximately two-thirds of the total estimated sales in the global flavors and fragrances sub-segmentof the broader market.
9

We believe that our ability to compete successfully in the flavors and fragrances market is based on (1) ourunderstanding of consumers, (2) innovation, arising from the creative skills of our perfumers and flavorists andthe technological advances resulting from our research and development activities, (3) our ability to createproducts which are tailor-made for our customers’ needs, (4) developing strong customer intimacy and(5) driving efficiency in all that we do.
Large multinational customers and, increasingly, mid-sized customers, may limit the number of theirsuppliers, placing some on “core lists,” giving them priority for development and production of their new ormodified products.
To compete more successfully in this environment, we must make continued investments in customerrelationships and tailor product research and development in order to anticipate customers’ needs, provideeffective service and secure and maintain inclusion on certain “core lists.”
Employee Relations
At December 31, 2014, we had approximately 6,200 employees worldwide, of whom approximately 1,400are employed in the United States. We believe that relations with our employees are good.
Availability of Reports
We make available free of charge on or through the Investor Relations link on our website, www.iff.com, allmaterials that we file electronically with the Securities and Exchange Commission (“SEC”), including our annualreport on Form 10-K, quarterly reports on Form 10-Q, current reports on Form 8-K and amendments to thosereports, filed or furnished pursuant to Section 13(a) or 15(d) of the Securities Exchange Act of 1934, as amended,as soon as reasonably practicable after electronically filing such materials with, or furnishing them to, the SEC.During the period covered by this Form 10-K, we made all such materials available through our website as soonas reasonably practicable after filing such materials with the SEC.
You may also read and copy any materials filed by us with the SEC at the SEC’s Public Reference Room at100 F Street, N.E., Washington, D.C. 20549, and you may obtain information on the operation of the PublicReference Room by calling the SEC in the United States at 1-800-SEC-0330. In addition, the SEC maintains anInternet website, www.sec.gov, that contains reports, proxy and information statements and other informationthat we file electronically with the SEC.
A copy of our Corporate Governance Guidelines, Code of Business Conduct and Ethics, and the charters ofthe Audit Committee, Compensation Committee and Nominating and Governance Committee of the Board ofDirectors are posted on the Investor Relations section of our website, www.iff.com.
Our principal executive offices are located at 521 West 57th Street, New York, New York 10019(212-765-5500).
Executive Officers of Registrant
The current executive officers of the Company, as of March 2, 2015, are listed below.
Andreas Fibig . . . . . . . . . . . . . . . . . . 53 Chairman of the Board and Chief Executive OfficerRichard A. O’Leary . . . . . . . . . . . . . 54 Interim Chief Financial Officer, Vice President and ControllerNicolas Mirzayantz . . . . . . . . . . . . . . 52 Group President, FragrancesMatthias Haeni . . . . . . . . . . . . . . . . . 49 Group President, FlavorsAhmet Baydar . . . . . . . . . . . . . . . . . . 62 Senior Vice President, Research and DevelopmentAngelica T. Cantlon . . . . . . . . . . . . . 63 Senior Vice President, Human ResourcesAnne Chwat . . . . . . . . . . . . . . . . . . . 55 Senior Vice President, General Counsel and Corporate SecretaryFrancisco Fortanet . . . . . . . . . . . . . . . 46 Senior Vice President, Operations
10

Andreas Fibig has served as our Chairman since December 2014 and Chief Executive Officer sinceSeptember 2014. Mr. Fibig has been a member of our Board of Directors since 2011. Previously, Mr. Fibigserved as President and Chairman of the Board of Management of Bayer HealthCare Pharmaceuticals, thepharmaceutical division of Bayer AG, since September 2008. Prior to this position, Mr. Fibig held a number ofpositions of increasing responsibility at Pfizer Inc., a research-based pharmaceutical company, including asSenior Vice President in the US Pharmaceutical Operations group from 2007 through 2008 and as President,Latin America, Africa and Middle East from 2006 through 2007.
Richard A. O’Leary has served as our Interim Chief Financial Officer since December 2014 and as our VicePresident and Controller since June 2009. Mr. O’Leary joined our Company in July 2007, and served as our VicePresident, Corporate Development from July 2007 to May 2009, and as our Interim Chief Financial Officer fromJuly 2008 to May 2009. Prior to joining us, Mr. O’Leary served in various positions since 1986 at InternationalPaper Co., a paper and packaging company, including, as Chief Financial Officer of International PaperCompany (Brazil) from June 2004 to June 2007.
Nicolas Mirzayantz has served as our Group President, Fragrances since January 2007, and originally joinedour Company in 1988. Prior to his appointment as Group President, Fragrances, he served as a member of ourTemporary Office of the Chief Executive Officer from October 1, 2009 until February 2010, our Senior VicePresident, Fine Fragrance and Beauty Care and Regional Manager North America, from March 2005 toDecember 2006, our Senior Vice President, Fine Fragrance and Beauty Care from October 2004 to February2005, and our Vice President Global Fragrance Business Development from February 2002 to September 2004.
Matthias Haeni has served as our Group President, Flavors since April 2014. Mr. Haeni joined us in 2007 inthe role of Regional General Manager, Flavors Greater Asia. In 2010, Mr. Haeni transferred to Hilversum, TheNetherlands where he served as Regional General Manager for Flavors Europe, Africa, and the Middle East(EAME).
Ahmet Baydar has served as our Senior Vice President, Research and Development since September 2010,and as our Vice President, Global Fragrance Research from February 2009 to August 2010. Prior to joining us,Dr. Baydar served as a Director of Shave Care and Integrated Shaving Systems at The Procter & GambleCompany, a branded consumer packaged goods company, and Vice President of R&D-Personal Care at TheGillette Company, a personal care products company.
Angelica T. Cantlon has served as our Senior Vice President, Human Resources since August 2009. Prior tojoining us, Ms. Cantlon served as Senior Vice President-International Chief Administrative Officer of MetLife,Inc., an insurance and financial services company, from June 2005 to August 2009, and Senior Vice President-Human Resources Business Leader, of Metlife from September 1999 to June 2005.
Anne Chwat has served as our Senior Vice President, General Counsel and Corporate Secretary since April2011. Prior to joining us, Ms. Chwat served as Executive Vice President and General Counsel of Burger KingHoldings, Inc., a fast food hamburger restaurant company, from September 2004 to April 2011. From September2000 to September 2004, Ms. Chwat served in various positions at BMG Music (now Sony MusicEntertainment), including as Senior Vice President, General Counsel and Chief Ethics and Compliance Officer.
Francisco Fortanet has served as Senior Vice President, Operations since February 27, 2012. Mr. Fortanetjoined our Company in 1995, and has served as our Vice President, Global Manufacturing Compounding fromJanuary 2007 to February 2012, our Vice President, Global Manufacturing from January 2006 to January 2007,our Regional Director of North America Operations from December 2003 to January 2005, the Project Managerof a Special Project in IFF Ireland from May 2003 to December 2003 and as our Plant Manager in Hazlet, NewJersey from October 1999 to May 2003.
11
ITEM 1A. RISK FACTORS.
We routinely encounter and address risks in conducting our business. Some of these risks may cause ourfuture results to be different — sometimes materially different — than we presently anticipate. Below are certainimportant operational and strategic risks that could adversely affect our business. How we react to materialfuture developments, as well as how our competitors react to those developments, could also affect our futureresults.
Volatility and increases in the price of raw materials, energy and transportation could harm our profits.
We use many different raw materials for our business, including essential oils, extracts and concentratesderived from fruits, vegetables, flowers, woods and other botanicals, animal products, raw fruits, organicchemicals and petroleum-based chemicals. Raw material costs continue to remain at elevated levels. Historically,we have experienced the greatest amount of price volatility in natural products that represent approximately halfof our raw material purchases. Availability and pricing of these natural products, such as citrus and vanilla, canbe impacted by crop size and quality, weather, alternative land use, and other factors which we cannot control.
If we are unable to increase the prices to our customers of our fragrance or flavor products to cover rawmaterial and other input cost increases, or if we are unable to achieve cost savings to offset such cost increases,we could fail to meet our cost expectations and our profits and operating results could be adversely affected.Increases in prices of our products to customers may lead to declines in volume, and we may not be able toaccurately predict the volume impact of price increases, which could adversely affect our financial condition andresults of operations.
Similarly, commodities and energy prices are subject to significant volatility caused by market fluctuations,supply and demand, currency fluctuations, production and transportation disruptions, and other world events. Aswe source many of our raw materials globally to help ensure quality control, if the cost of energy, shipping ortransportation increases and we are unable to pass along these costs to our customers, our profit margins wouldbe adversely affected. Furthermore, increasing our prices to our customers could result in long-term salesdeclines or loss of market share if our customers find alternative suppliers or choose to reformulate theirconsumer products to use fewer ingredients, which could have an adverse long-term impact on our results ofoperations.
To mitigate our sourcing risk, we maintain strategic stock levels for critical items. However, if we do notaccurately estimate the amount of raw materials that will be used for the geographic region in which we will needthese materials, our margins could be adversely affected.
Our international operations are subject to economic, political and other risks that could materially andadversely affect our revenues, cash flows or financial position.
We operate on a global basis, with manufacturing and sales facilities in the United States, Europe, Africa,the Middle East, Latin America, and Greater Asia. During 2014, 79% of our net sales were to customers outsidethe United States and we intend to continue expansion of our international operations. As a result, our business isincreasingly exposed to risks inherent in international operations. These risks, which can vary substantially bymarket, are described in many of the risk factors in this section and include the following:
‰ governmental laws, regulations and policies adopted to manage national economic conditions, such asincreases in taxes, austerity measures that may impact consumer spending, monetary policies that mayimpact inflation rates and currency fluctuations;
‰ changes in environmental, health and safety regulations, such as the continued implementation of theEuropean Union’s REACH regulations, and the burdens and costs of our compliance with suchregulations;
‰ the imposition of tariffs, quotas, trade barriers, other trade protection measures and import or exportlicensing requirements, which could adversely affect our cost or ability to import raw materials or exportour flavors or fragrances to surrounding markets;
12

‰ our ability to anticipate and adapt our flavors and fragrances to local preferences;
‰ risks and costs arising from language and cultural differences;
‰ changes in the laws and policies that govern foreign investment in the countries in which we operate,including the risk of expropriation or nationalization, and the costs and ability to repatriate the revenuethat we generate in these countries;
‰ the impact of recessionary economic conditions outside of the United States;
‰ risks and costs associated with political and economic instability, corruption, and social and ethnic unrestin the countries in which we operate;
‰ difficulty in recruiting and retaining trained personnel;
‰ national and regional labor strikes in the countries in which we operate;
‰ risks and costs associated with health or similar issues, such as a pandemic or epidemic; or
‰ the risks of operating in developing or emerging markets in which there are significant uncertaintiesregarding the interpretation, application and enforceability of laws and regulations and the enforceabilityof contract rights and intellectual property rights.
These factors may increase in importance as we expand our operations in emerging markets as part of ourgrowth strategy, and the occurrence of any one or more of these factors could increase our costs and adverselyaffect our results of operations.
We have made investments in and are expanding our business into emerging markets and regions, whichexposes us to certain risks.
As part of our growth strategy, we have increased our presence in emerging markets by expanding ourmanufacturing presence, sales organization and product offerings in these markets, and we expect to continue tofocus on expanding our business in these markets. In addition to the currency and international operation risksdescribed above, our operations in these markets may be subject to a variety of other risks. These risks includeeconomies that include consumers with limited or fluctuating disposable income and discretionary spending onwhich the end users of our products depend, weak legal systems which may affect our ability to enforce ourintellectual property and contractual rights, exchange controls, unstable governments and privatization or othergovernment actions affecting taxes, subsidies and incentive programs and the flow of goods and currency. Inconducting our business, we move products from one country to another and may provide services in one countryfrom a subsidiary located in another country. Accordingly, we are vulnerable to abrupt changes in customs andtax regimes that may have significant negative impacts on our financial condition and operating results.
The increase in demand for consumer products using flavors and fragrances has been driven by factorsoutside of our control, and if these factors do not persist our future growth could be adversely affected.
Demand for consumer products using flavors and fragrances has been stimulated and broadened bychanging social habits and consumer needs, an expanding global middle-class and general economic growth,especially in emerging markets. Approximately 50% of our sales during 2014 were generated in emergingmarkets and we expect emerging markets to continue to significantly contribute to our future growth. Increasingconsumer demand for products using flavors and fragrances is dependent on factors such as increases in personalincome, dual-earner households, teenage population, leisure time, consumer health concerns and urbanizationand by the continued growth in world’s population, all of which are outside of our control. Changes in anynumber of external economic factors, or changes in social or consumer preferences, could materially adverselyimpact our results of operations. Accordingly, our future growth will depend upon the continued economicgrowth and development of consumer spending on products for which we supply flavors and fragrances in theseglobal markets.
13

Our results of operations may be negatively affected by the impact of currency fluctuation or devaluationin the international markets in which we operate.
We have significant operations outside the U.S., the results of which are reported in the local currency andthen translated into U.S. dollars at applicable exchange rates for inclusion in our consolidated financialstatements. The exchange rates between these currencies and the U.S. dollar have fluctuated and will continue todo so in the future. Changes in exchange rates between these local currencies and the U.S. dollar will affect therecorded levels of sales, profitability, assets and/or liabilities. Additionally, volatility in currency exchange ratesmay adversely impact our financial condition, cash flows or liquidity. Although we employ a variety oftechniques to mitigate the impact of exchange rate fluctuations, including sourcing strategies and a limitednumber of foreign currency hedging activities, we cannot guarantee that such hedging and risk managementstrategies will be effective, and our results of operations could be adversely affected.
Volatility in the global economy may adversely affect consumer spending and may negatively impact ourbusiness and operating results.
Our flavors and fragrances are components of a wide assortment of global consumer products throughoutthe world. Since mid-2008, the global economy has experienced significant recessionary pressures and declinesin consumer confidence and economic growth. While some segments of the global economy appear to berecovering, the ongoing global recessionary economic environment in Europe has, and may in the near future,increase unemployment and underemployment, decrease salaries and wage rates, increase inflation or result inother market-wide cost pressures that will adversely affect demand for consumer products in both developed andemerging markets. In addition, growth rates in the emerging markets have moderated from previous levels.Reduced consumer spending may cause changes in our customer orders including reduced demand for ourflavors and fragrances, increased pressure to reduce the price of our flavors and fragrances or order cancellations.To the extent that the volatility in global economic conditions continues, our sales, profitability and overalloperating results could be adversely affected.
We may not successfully develop and introduce new products that appeal to our customers or ourcustomers may not accurately anticipate and respond to global consumer market trends, which mayadversely affect our results of operations.
Our growth and performance largely depends on our ability to successfully develop and introduce newproducts and product improvements that appeal to our customers, and ultimately to global consumer needs. Wemust continually anticipate and react to, in a timely and cost-efficient manner, changes in consumer preferencesand demands. We cannot be certain that we will successfully achieve our innovation goals, such as thedevelopment of new molecules, delivery methods and other technologies. We currently spend approximately 8%of our sales on research and development; however, such investments may only generate future revenues to theextent that we are able to successfully develop products that meet our customers’ specifications, can be deliveredat an acceptable price and are accepted by the targeted consumer market. Furthermore, there may be significantlag times from the time we incur R&D costs to the time that these R&D costs may result in increased revenue.Consequently, even when we “win” a project, our ability to generate revenues as a result of these investments issubject to numerous customer, economic and other risks that are outside of our control, including delays by ourcustomers in the launch of a new product, poor performance of our third-party vendors, reduced or insufficientresources allocated by our customers to promoting the new product, anticipated sales by our customers not beingrealized or changes in market preferences or demands, or disruptive innovations by our competitors.
If we are unable to maintain the integrity of our raw materials, supply chain and finished goods, it mayresult in regulatory non-compliance, litigation costs, and harm to our reputation, all of which mayadversely impact sales and our results of operations.
The development, manufacture and sale of our products are subject to various regulatory requirements ineach of the countries in which our products are developed, manufactured and sold. In addition, we are subject toproduct safety and compliance requirements established by the industry or similar oversight bodies. We use a
14

variety of strategies, methodologies and tools to (i) identify current product standards, (ii) assess relative risks inour supply chain that can impact product integrity, (iii) monitor internal and external performance and (iv) testraw materials and finished goods to minimize the likelihood of product or process non-compliance.
Gaps in our operational processes could adversely affect the quality of our finished products and result in aregulatory non-compliance event. If a product non-compliance event were to go undetected, it could subject us tocustomer claims, recalls, penalties, litigation costs and settlements, remediation costs or loss of sales. As ourflavors and fragrances are used as ingredients in many products meant for human consumption, theseconsequences would be exacerbated if our customer did not identify the defect and there was a resulting impactat the consumer level. Such a result could lead to potentially large scale adverse publicity, recalls and potentialconsumer litigation. Furthermore, adverse publicity about our products, including concerns about product safetyor similar issues, whether real or perceived, could harm our reputation and result in an immediate adverse effecton our sales, as well as require us to utilize significant resources to rebuild our reputation.
A disruption in operations or our supply chain could adversely affect our business and financial results.
As a company engaged in development, manufacturing and distribution on a global scale, we are subject tothe risks inherent in such activities, including industrial accidents, environmental events, strikes and other labordisputes, disruptions in supply chain or information systems, loss or impairment of key manufacturing sites,product quality control, safety, licensing requirements and other regulatory issues, as well as natural disasters andother external factors over which we have no control. If any of these events were to occur, it could have anadverse effect on our business and financial results. In addition, while we have manufacturing facilitiesthroughout the world, certain of our facilities are the sole source of a specific ingredient or product. If themanufacture of these ingredients or products was disrupted, the cost of relocating or replacing their production orreformulating them may be substantial, which could result in production delays or otherwise have an adverseeffect on our operating results, financial condition or cash flows.
Our performance may be adversely impacted if we are not successful in managing our inventory and/orworking capital balances.
We evaluate our inventory balances of materials based on shelf life, expected sourcing levels, known usesand anticipated demand based on forecasted customer order activity and changes in our product/sales mix.Efficient inventory management is a key component of our business success, financial returns profitability. To besuccessful, we must maintain sufficient inventory levels and an appropriate product/sales mix to meet ourcustomers’ demands, without allowing those levels to increase to such an extent that the costs associated withstoring and holding other inventory adversely impact our financial results. If our buying decisions do notaccurately predict sourcing levels, customer trends or our expectations about customer needs are inaccurate, wemay have to take unanticipated markdowns or impairment charges to dispose of the excess or obsolete inventory,which can adversely impact our financial results. Additionally, we believe excess inventory levels of rawmaterials with a short shelf life in our manufacturing facilities subjects us to the risk of increased inventoryshrinkage. If we are not successful in managing our inventory balances and shrinkage, our results fromoperations and cash flows from operations may be negatively affected.
The Company sells certain accounts receivable on a non-recourse basis to unrelated financial institutionsunder “factoring” agreements that are sponsored, solely and individually, by certain customers. The cost ofparticipating in these programs was immaterial to our results in all periods. Should we choose not to participate,or if these programs were no longer available, it could reduce our cash from operations in the period in which thearrangement ends.
Our ongoing optimization of our manufacturing facilities may not be as effective as we anticipate, and wemay fail to realize the expected cost savings and increased efficiencies.
As part of our strategy, we seek to enhance our manufacturing efficiency and align our geographicmanufacturing footprint with our expectations of future growth. To operate more efficiently and control costs,
15

from time to time we execute rationalization activities, which include manufacturing facility consolidations. Forexample, during 2014, we closed our Augusta, Georgia facility and relocated and consolidated its operations intoother facilities and we are in the midst of relocating our Ingredients facility in Hangzhou China. Our ability torealize anticipated cost savings, synergies and revenue enhancements from these activities may be affected by anumber of factors and may pose significant risks, including:
‰ the risk that we may be unable to integrate successfully the relocated manufacturing operations;
‰ the risk that we may be unable to effectively reduce overhead, coordinate management and integrate andretain employees of the relocated manufacturing operations;
‰ the risk that we may face difficulties in implementing and maintaining consistent standards, controls,procedures, policies and information systems;
‰ potential strains on our personnel, systems and resources and diversion of attention from other priorities;and
‰ unforeseen or contingent liabilities of the relocated manufacturing operations.
Furthermore, our rationalization and consolidation actions may not be as effective as we anticipate, and wemay fail to realize the cost savings we expect from these actions. Actual charges, costs and adjustments due tothese activities may vary materially from our estimates, and these activities may require cash and non-cashintegration and implementation costs or charges in excess of budgeted amounts, which could offset any suchsavings and other synergies and therefore could have an adverse effect on our margins.
We may not achieve expected efficiencies related to the proximity of our customers’ production facilities toour manufacturing facilities, or with respect to existing or future production relocation plans.
As part of our strategy, we manage our global manufacturing footprint to enhance manufacturingefficiencies and align with our expectations of future growth and technology needs. Many of our facilities arelocated in close proximity to our customers in order to minimize both our customers’ and our own costs.However, we may not have sufficient demand to utilize all of our production capacity and may be required toship excess products to other regions in which we operate, which will increase our costs and decrease ourmargins. In addition, our expected growth may not be realized which would result in excess capacity and reducedmargins.
We are subject to laws and regulations governing anti-bribery and corruption, and non-compliance withsuch laws and regulations could have a material adverse impact on our business, financial condition orresults of operations.
We are subject to a wide range of laws and regulations to prevent corruption, bribery and other unethicalbusiness practices, including the U.S. Foreign Corrupt Practices Act, or FCPA, and similar laws and regulationsin other countries. These laws and regulations generally prohibit companies and their intermediaries from makingimproper payments to foreign officials for the purpose of obtaining or keeping business or other benefits. Inaddition, we have manufacturing operations in some jurisdictions which pose potentially elevated risks of fraudor corruption or increased risk of internal control issues. As needed, we conduct internal investigations, controltesting and compliance reviews to help ensure that we are in compliance with applicable corruption and similarlaws and regulations. We could be subject to inquiries or investigations by government and other regulatorybodies. Any determination that our operations or activities are not in compliance with the FCPA or similarinternational laws and regulations could expose us to significant fines, penalties or other sanctions that may harmour business and reputation.
Our ability to compete effectively depends on our ability to protect our intellectual property rights.
We rely on patents and trade secrets to protect our intellectual property rights. As part of our strategy toprotect our intellectual property rights, we often rely on trade secrets to protect our proprietary fragrance andflavor formulations, as this does not require us to publicly file information regarding our intellectual property.
16

From time to time, a third party may claim that we have infringed upon their intellectual property rights, or athird party may infringe upon our intellectual property. As a result of such third party claims, we could incursignificant costs in connection with legal actions to assert our intellectual property rights or to defend ourselvesfrom assertions of invalidity, infringement or misappropriation. For those intellectual property rights that areprotected by way of trade secrets, this litigation could result in even higher costs, and potentially the loss ofcertain rights, as we would not have a perfected intellectual property right that precludes others from making,using or selling our products or processes.
For intellectual property rights that we seek to protect through patents, we cannot be certain that theserights, if obtained, will not later be opposed, invalidated, or circumvented. In addition, even if such rights areobtained in the United States, the laws of some of the other countries in which our products are or may be sold donot protect intellectual property rights to the same extent as the laws of the United States. If other parties were toinfringe on our intellectual property rights, or if a third party successfully asserted that we had infringed on theirintellectual property rights, it could materially and adversely affect our future results of operations by(i) reducing the price that we could obtain in the marketplace for products which are based on such rights,(ii) increasing the royalty or other fees that we may be required to pay in connection with such rights or(iii) limiting the volume, if any, of such products that we can sell.
Our business is highly competitive, and if we are unable to compete effectively our sales and results ofoperations will suffer.
The market for flavors and fragrances is highly competitive. We face vigorous competition from companiesthroughout the world, including multinational and specialized flavor and fragrance companies, as well asconsumer product companies who may develop their own flavors or fragrances. Some of our competitorsspecialize in one or more of our product segments, while others participate in many of our product segments. Inaddition, some of our global competitors may have greater resources than we do or may have proprietaryproducts that could permit them to respond to changing business and economic conditions more effectively thanwe can. Consolidation of our competitors may exacerbate these risks.
Competition in our business is based on innovation, product quality, regulatory compliance, pricing, qualityof our customer service, the support provided by our marketing and application groups, and our understanding ofconsumers. It is difficult for us to predict the timing and scale of our competitors’ actions in these areas. Thediscovery and development of new flavor and fragrance materials, protection of the Company’s intellectualproperty and development and retention of key employees are important issues in our ability to compete in ourbusiness. Increased competition by existing or future competitors, including aggressive price competition, couldresult in the potential loss of substantial sales or create the need for us to reduce prices or increase spending andthis could have an adverse impact on sales and profitability.
Large multinational customers, and increasingly, mid-sized customers, may limit the number of theirsuppliers, giving those that remain on “core lists” priority for new or modified products. To compete moresuccessfully in this environment, we must continue to make investments in customer relationships and tailorproduct research and development in order to anticipate customers’ needs, provide effective service and secureand maintain inclusion on certain “core lists.” If we are unable to do so, it could adversely impact our futureresults of operations.
Our success depends on attracting and retaining talented people within our business. Significant shortfallsin recruitment or retention could adversely affect our ability to compete and achieve our strategic goals.
Attracting, developing, and retaining talented employees, including our perfumers and flavorists, is essentialto the successful delivery of our products and success in the marketplace. Competition for these employees canbe intense. The ability to attract and retain talented employees is critical in the development of new products andtechnologies which is an integral component of our growth strategy. However, we may not be able to attract andretain such employees in the future. If we experience significant shortfalls in recruitment or retention, our abilityto effectively compete with our competitors and to grow our business could be adversely affected.
17

Our reliance on a limited base of suppliers may result in a disruption to our business and may adverselyaffect our financial results.
For certain raw materials, we rely on a limited number of suppliers and we may not have readily availablealternatives. If we are unable to maintain our supplier arrangements and relationships and are unable to obtain thequantity, quality and price levels needed for our business, or if any of our key suppliers becomes insolvent orexperiences other financial distress, we could experience disruptions in production and our financial results couldbe adversely affected.
Our results of operations may be negatively impacted by the outcome of uncertainties related to litigation.
We are involved in a number of legal claims and litigation, including claims related to indirect taxes. Wecannot predict the ultimate outcome of such litigation. In addition, we cannot provide assurance that future eventswill not result in an increase in the number of claims or require an increase in the amount accrued for any suchclaims, or require accrual for one or more claims that has not been previously accrued.
The level of returns on pension and postretirement plan assets and the actuarial assumptions used forvaluation purposes could affect our earnings and cash flows in future periods. Changes in governmentregulations could also affect our pension and postretirement plan expenses and funding requirements.
The funding obligations for our pension plans are impacted by the performance of the financial markets,particularly the equity markets, and interest rates. Funding obligations are determined under governmentregulations and are measured each year based on the value of assets and liabilities on a specific date. If thefinancial markets do not provide the long-term returns that are expected under the governmental fundingcalculations, we could be required to make larger contributions. The equity markets can be very volatile, andtherefore our estimate of future contribution requirements can change dramatically in relatively short periods oftime. Similarly, changes in interest rates and legislation enacted by governmental authorities can impact thetiming and amounts of contribution requirements. An adverse change in the funded status of the plans couldsignificantly increase our required contributions in the future and adversely impact our liquidity.
Assumptions used in determining projected benefit obligations and the fair value of plan assets for ourpension and other postretirement benefit plans are determined by us in consultation with outside consultants andadvisors. In the event that we determine that changes are warranted in the assumptions used, such as the discountrate, expected long-term rate of return on assets, or expected health care costs, our future pension andpostretirement benefit expenses could increase or decrease. Due to changing market conditions or changes in theparticipant population, the assumptions that we use may differ from actual results, which could have a significantimpact on our pension and postretirement liabilities and related costs and funding requirements.
Impairment charges on our long-lived assets could have a material adverse effect on our financial results.
Future events may occur that could adversely affect the reported value of our long-lived assets and requireimpairment charges. Such events may include, but are not limited to, strategic decisions made in response tochanges in economic and competitive conditions, the impact of the economic environment on our sales and ourrelationship with significant customers or business partners, or a sustained decline in our stock price. Wecontinue to evaluate the impact of economic and other developments on our business to assess whetherimpairment indicators are present. Accordingly, we may perform impairment tests more frequently than annuallyrequired, based on changes in the economic environment and other factors, and these tests could result inimpairment charges in the future.
Our financial results may be adversely impacted by the failure to successfully execute acquisitions,collaborations and joint ventures.
From time to time, we may evaluate and enter into acquisitions, collaborations or joint ventures that alignwith our strategic objectives. The success of such activity depends, in part, upon our ability to identify suitable
18
targets or partners, perform effective assessments prior to contract execution, negotiate contract terms, and, ifapplicable, obtain governmental approvals. For example, in January 2014, we completed the acquisition ofAromor Flavors and Fragrances Ltd., a manufacturer and marketer of complex specialty ingredients. Theseactivities may present certain financial, managerial and operational risks, including diversion of management’sattention from existing core businesses; difficulties integrating or separating businesses from existing operations,including employee integration; and challenges presented by acquisitions, collaborations or joint ventures whichmay not achieve sales levels and profitability that justify the investments made. If the acquisitions, collaborationsor joint ventures are not successfully implemented or completed, there could be a negative impact on our resultsof operations, financial condition and cash flows.
Changes in our tax rates, the adoption of new U.S. or international tax legislation or exposure to additionaltax liabilities could affect our future results.
We are subject to taxes in the United States and numerous foreign jurisdictions. Our future effective taxrates could be affected by changes in the mix of earnings in countries with differing statutory tax rates, changesin the valuation of deferred tax assets and liabilities, changes in liabilities for uncertain tax positions, cost ofrepatriations or changes in tax laws or their interpretation. In addition, the current administration and Congresshave announced proposals for new U.S. tax legislation that, if adopted, could affect our tax rate. Any of thesechanges could have a material adverse effect on our profitability.
We are also subject to the continual examination of our income tax returns by the Internal Revenue Serviceand foreign tax authorities in those countries in which we operate.
We have and will continue to implement transfer pricing policies among our various operations located indifferent countries. These transfer pricing policies are a significant component of the management of ouroperations across international boundaries and overall financial results. Many countries routinely examinetransfer pricing policies of taxpayers subject to their jurisdiction, challenge transfer pricing policies aggressivelywhere there is potential non-compliance and impose significant interest charges and penalties where non-compliance is determined. There can be no assurance that a governmental authority will not challenge thesepolicies more aggressively in the future or, if challenged, that we will prevail. We could suffer significant costsrelated to one or more challenges to our transfer pricing.
We may be subject to assessments or audits in the future in any of the countries in which we operate. Thefinal determination of tax audits and any related litigation could be materially different from our historicalincome tax provisions and accruals, and while we do not believe the results that follow would have a materialadverse effect on our financial condition, such results could have a material effect on our income tax provision,net income or cash flows in the period or periods in which that determination is made.
Our operations may be affected by greenhouse emissions and climate change and related regulations.
The availability of raw materials and energy supplies fluctuate in markets throughout the world. Climatechange may also affect the availability and price of key raw materials, including natural products used in themanufacture of our products. In order to mitigate the risk of price increases and shortages, our purchasers havedeveloped various sourcing strategies, including multiple suppliers, inventory management systems, variousgeographic suppliers and long-term agreements to mitigate risk.
In addition to market forces, there are various regulatory efforts relating to climate change that may increasethe cost of raw materials, particularly energy used to operate our facilities, that could materially impact ourfinancial condition, results of operations and cash flows.
19

Information technology system failures or disruptions or breaches of our network security may adverselyaffect our business, interrupt our operations, subject us to increased operating costs and expose us tolitigation.
We have information technology systems that support our business processes, including product formulas,product development, sales, order processing, production, distribution, finance and intra-companycommunications throughout the world. These systems may be susceptible to outages due to fire, floods, powerloss, telecommunications failures, natural disasters, break-ins and similar events. Effective response to suchdisruptions will require effort and diligence on the part of our third-party vendors and employees to avoid anyadverse impact to our information technology systems. In addition, our systems and proprietary data storedelectronically may be vulnerable to computer viruses, cybercrime, computer hacking and similar disruptionsfrom unauthorized tampering. If such unauthorized use of our systems were to occur, data related to our productformulas, product development and other proprietary information could be compromised. The occurrence of anyof these events could adversely affect our business, interrupt our operations, subject us to increased operatingcosts and expose us to litigation.
The potential government regulation of certain of our product development initiatives is uncertain, and wemay be subject to adverse consequences if we fail to comply with applicable regulations.
As part of our ingredients research program, we seek to collaborate with research institutions and companiesthroughout the world, including biotechnology companies. However, it is unclear whether any of our productdevelopments will be classified as genetically modified food products subject to regulation as a biotechnologyproduct. The manufacture of biotechnology products is subject to applicable Current Good ManufacturingPractice (cGMP) regulations as prescribed by the Food and Drug Administration and the applicable standardsprescribed by European Commission and the competent authorities of European Union Member States and toother rules and regulations prescribed by foreign regulatory authorities. Compliance with these regulations can beexpensive and time consuming. Such regulation could also subject us to requirements for labeling andtraceability, which may cause our customers to avoid our affected products and seek our competitors’ products.This may result in our inability to realize any benefit from our investment and have an adverse effect on ouroperating results.
ITEM 1B. UNRESOLVED STAFF COMMENTS.
None.
ITEM 2. PROPERTIES.
Our principal properties are as follows:
Location Operation
United StatesCarrollton, TX(1) . . . . . . . . . . . . Production of flavor compounds; flavor laboratories.Hazlet, NJ(1) . . . . . . . . . . . . . . . . Production of fragrance compounds; fragrance laboratories.Jacksonville, FL . . . . . . . . . . . . Production of fragrance ingredients.New York, NY(1) . . . . . . . . . . . . Fragrance laboratories; corporate headquarters.South Brunswick, NJ(1) . . . . . . . Production of flavor compounds and ingredients; flavor laboratories.Union Beach, NJ . . . . . . . . . . . . Research and development center.
FranceNeuilly(1) . . . . . . . . . . . . . . . . . . Fragrance laboratories.Grasse . . . . . . . . . . . . . . . . . . . . Production of flavor and fragrance ingredients; fragrance laboratories.
Great BritainHaverhill . . . . . . . . . . . . . . . . . . Production of flavor compounds and ingredients, and fragrance
ingredients; flavor laboratories.
20

Location Operation
NetherlandsHilversum . . . . . . . . . . . . . . . . . Flavor and fragrance laboratories.Tilburg . . . . . . . . . . . . . . . . . . . Production of flavor compounds and ingredients, and fragrance
compounds.
SpainBenicarló . . . . . . . . . . . . . . . . . . Production of fragrance ingredients.
ArgentinaGarin . . . . . . . . . . . . . . . . . . . . . Production of flavor compounds and ingredients, and fragrance
compounds; flavor laboratories.
BrazilRio de Janeiro . . . . . . . . . . . . . . Production of fragrance compounds.São Paulo . . . . . . . . . . . . . . . . . Flavor and fragrance laboratories.Taubate . . . . . . . . . . . . . . . . . . . Production of flavor compounds and ingredients.
MexicoTlalnepantla . . . . . . . . . . . . . . . Production of flavor and fragrance compounds; flavor and fragrance
laboratories.
IndiaMumbai(2) . . . . . . . . . . . . . . . . . Flavor and fragrance laboratories.Chennai(2) . . . . . . . . . . . . . . . . . Production of flavor compounds and ingredients, and fragrance
compounds; flavor laboratories.
AustraliaDandenong . . . . . . . . . . . . . . . . Production of flavor compounds and flavor ingredients.
ChinaGuangzhou(3) . . . . . . . . . . . . . . . Production of flavor compounds.Guangzhou(3) . . . . . . . . . . . . . . . Production of fragrance compounds.Shanghai(4) . . . . . . . . . . . . . . . . . Flavor and fragrance laboratories.Xin’anjiang(5) . . . . . . . . . . . . . . Production of fragrance ingredients.Zhejiang(3) . . . . . . . . . . . . . . . . . Production of fragrance ingredients.
IndonesiaJakarta . . . . . . . . . . . . . . . . . . . . Production of flavor compounds and ingredients; flavor and fragrance
laboratories.
JapanGotemba . . . . . . . . . . . . . . . . . . Production of flavor compounds.Tokyo . . . . . . . . . . . . . . . . . . . . Flavor and fragrance laboratories.
SingaporeJurong(4) . . . . . . . . . . . . . . . . . . . Production of flavor and fragrance compounds.Science Park(1) . . . . . . . . . . . . . . Flavor and fragrance laboratories.
TurkeyGebze . . . . . . . . . . . . . . . . . . . . Production of flavor compounds.
IsraelKibbutz Givat-Oz(3) . . . . . . . . . . Flavor and fragrance ingredients manufacturing and laboratories.
(1) Leased.(2) We have a 93.4% interest in the subsidiary company that owns this facility.(3) Land is leased and building and machinery and equipment are owned.(4) Building is leased and machinery and equipment are owned.(5) We have a 90% interest in the subsidiary company that leases the land and owns the buildings and machinery.
21
Our principal executive offices and New York laboratory facilities are located at 521 West 57th Street, NewYork City.
ITEM 3. LEGAL PROCEEDINGS.
We are subject to various claims and legal actions in the ordinary course of our business.
Tax Claims
We are currently involved in administrative and legal proceedings with the Spanish tax authorities thatchallenge tax deductions taken in our Spanish subsidiaries’ tax returns and allege claims of tax avoidance.
In 2012, we reached an overall settlement with the Spanish tax authorities regarding income tax deductionstaken by our Spanish subsidiaries for the 2004-2010 fiscal years and entered into a multi-year agreement with theSpanish tax authorities that established the tax basis for our activities in Spain for 2012 through 2014 consistentwith the key principles preliminarily agreed upon as part of the overall settlement. The settlement agreement didnot address the assessments for the 2002-2003 fiscal years, as these were further along in the Spanish judicialprocess, and did not address the 2011 fiscal year. During 2013, we reached a settlement with the Spanish taxauthorities related to the 2011 fiscal year, on a basis consistent with the overall settlement reached for the 2004-2010 fiscal years.
With respect to the audits of 2002-2003 fiscal years, the Spanish tax authorities imposed assessmentsaggregating Euro 22.4 million ($28.6 million), including aggregate estimated interest. The Company appealedthese assessments, however, in February 2013, the Appellate Court upheld the administrative ruling with respectto the 2003 tax assessment and the related tax avoidance claims. The Company decided not to pursue the appealsprocess with respect to the 2003 tax assessment and paid Euro 20.8 million ($27.3 million based on the exchangerate at the respective payment dates) in connection with the 2003 tax assessment in 2013. In June 2013, theAppellate Court ruled against us on our appeal of the 2002 income tax assessment and related claims, which theCompany also decided not to appeal. However, this case did not have a related tax exposure associated with it. Inan unrelated matter, there was a remaining aggregate assessment related to the 2002 fiscal year of Euro1.9 million ($2.3 million) as of December 31, 2014. To proceed with its appeal of the tax assessment for the 2002fiscal year, the Company was required to post bank guarantees. As of December 31, 2014, the Company hadremaining posted bank guarantees of Euro 1.9 million ($2.3 million) associated with the 2002 appeal. OnFebruary 11, 2015, the Company received a favorable ruling on this appeal.
In addition to the above, the Company has also been a party to four dividend withholding tax controversiesin Spain in which the Spanish tax authorities alleged that the Company’s Spanish subsidiaries underpaidwithholding taxes during the 1995-2001 fiscal years. The Company had previously appealed each of thesecontroversies. During 2012, the Company received unfavorable decisions on the first three cases. AtDecember 31, 2014, the Company had Euro 4.7 million ($5.6 million) reflected in income taxes payable inconnection with these three cases and had posted bank guarantees of Euro 4.7 million ($5.6 million) in order toproceed with the appeals in these three cases. The fourth case was heard by the Spanish National High Court inOctober, 2014 and we received a favorable ruling. Accordingly, during the fourth quarter of 2014, we reversedthe total reserve related to the 2001 fiscal year (with a value of Euro 3.6 million of $4.3 million).
The Spanish tax authorities also alleged claims related to capital tax positions arising from the businessstructure adopted by our Spanish subsidiaries. The aggregate amount of these claims was Euro 9.6 million($13.2 million), including aggregate estimated interest through December 31, 2014. Our previous settlement in2012 with the Spanish tax authorities addressed only the income tax assessments and did not address the capitaltax positions. In connection with their ruling on our 2002 income tax assessment, the Appellate Court rejectedone of the two bases upon which we based our capital tax position. During 2013, the Company was notified thatthe Spanish High Court of Justice ruled against us in regards to the 2002 capital tax case. As a result, theCompany recorded a charge of Euro 9.6 million ($13.0 million or $9.1 million, after tax), included in selling andadministrative expenses for the year ended December 31, 2013. On January 22, 2014, we filed an appeal. In order
22

to avoid future interest costs in the event our appeal is unsuccessful, we paid $11.2 million (representing theprincipal amount) during the first quarter of 2014. Such amount will be refundable if we prevail in our appeal.
We do not currently believe that any of our pending tax assessments, even if ultimately resolved against us,would have a material impact on our financial condition.
Environmental
Over the past 20 years, various federal and state authorities and private parties have claimed that we are aPotentially Responsible Party (“PRP”) as a generator of waste materials for alleged pollution at a number ofwaste sites operated by third parties located principally in New Jersey and have sought to recover costs incurredand to be incurred to clean up the sites.
We have been identified as a PRP at nine facilities operated by third parties at which investigation and/orremediation activities may be ongoing. We analyze our potential liability on at least a quarterly basis. We accruefor environmental liabilities when they are probable and estimable. We estimate our share of the total future costfor these sites to be less than $5 million.
While joint and several liability is authorized under federal and state environmental laws, we believe theamounts we have paid and anticipate paying in the future for clean-up costs and damages at all sites are notmaterial and will not have a material adverse effect on our financial condition, results of operations or liquidity.This assessment is based upon, among other things, the involvement of other PRPs at most of the sites, the statusof the proceedings, including various settlement agreements and consent decrees and the extended time periodover which payments will likely be made. There can be no assurance, however, that future events will not requireus to materially increase the amounts we anticipate paying for clean-up costs and damages at these sites, and thatsuch increased amounts will not have a material adverse effect on our financial condition, results of operations orcash flows.
Other
In March 2012, ZoomEssence, Inc. filed a complaint against the Company in the U.S. District Court of NewJersey alleging trade secret misappropriation, breach of contract and unjust enrichment in connection with certainspray dry technology disclosed to the Company. In connection with the claims, ZoomEssence is seeking aninjunction and monetary damages. ZoomEssence initially sought a temporary restraining order and preliminaryinjunction, but the Court denied these applications in an order entered on September 27, 2013, finding thatZoomEssence had not demonstrated a likelihood of success on the merits of its claims. The Court subsequentlyreferred the matter to mediation, however the private mediation session did not result in a resolution of thedispute. On November 3, 2014, ZoomEssence amended its complaint against the Company to include allegationsof breach of the duty of good faith and fair dealing, fraud in the inducement, and misappropriation of confidentialand proprietary information. On November 13, 2014, the Company filed a counterclaim against ZoomEssencealleging trade secret misappropriation, breach of contract, breach of the implied covenant of good faith and fairdealing, unjust enrichment, misappropriation of confidential and proprietary information, common law unfaircompetition, tortious interference with contractual relations, and conversion. The case is currently proceedingthrough discovery with a trial on the merits anticipated in late 2015. The Company denies the allegations and willvigorously defend and pursue its position in Court. At this stage of the litigation, based on the informationcurrently available to the Company, management does not believe that this matter represents a material losscontingency.
We are also a party to other litigation arising in the ordinary course of our business. We do not expect theoutcome of these cases, singly or in the aggregate, to have a material effect on our consolidated financialcondition.
ITEM 4. MINE SAFETY DISCLOSURES.
Not applicable.
23

PART II
ITEM 5. MARKET FOR REGISTRANT’S COMMON EQUITY, RELATED STOCKHOLDERMATTERS AND ISSUER PURCHASES OF EQUITY SECURITIES.
Market Information.
Our common stock is traded principally on the New York Stock Exchange. The high and low stock pricesfor each quarter during the last two years were:
2014 2013
Quarter High Low High Low
First . . . . . . . . . . . . . . . . . . . . . . . . . . . . . . . . . . . . . . . . . . . . $ 97.91 $82.91 $77.40 $65.74Second . . . . . . . . . . . . . . . . . . . . . . . . . . . . . . . . . . . . . . . . . . 105.61 91.31 82.80 73.02Third . . . . . . . . . . . . . . . . . . . . . . . . . . . . . . . . . . . . . . . . . . . 105.84 95.51 84.99 75.86Fourth . . . . . . . . . . . . . . . . . . . . . . . . . . . . . . . . . . . . . . . . . . 104.00 91.64 90.30 79.59
Approximate Number of Equity Security Holders.
Title of ClassNumber of shareholders of record
as of February 12, 2015
Common stock, par value 12 1⁄2¢ per share 2,026
Dividends.
Cash dividends declared per share for each quarter during the two most recent fiscal years were as follows:
Quarter 2014 2013
First . . . . . . . . . . . . . . . . . . . . . . . . . . . . . . . . . . . . . . . . . . . . . . . . . . . . . . . . . . . . . . . . $0.39 $0.34Second . . . . . . . . . . . . . . . . . . . . . . . . . . . . . . . . . . . . . . . . . . . . . . . . . . . . . . . . . . . . . . 0.39 0.34Third . . . . . . . . . . . . . . . . . . . . . . . . . . . . . . . . . . . . . . . . . . . . . . . . . . . . . . . . . . . . . . . 0.47 0.39Fourth . . . . . . . . . . . . . . . . . . . . . . . . . . . . . . . . . . . . . . . . . . . . . . . . . . . . . . . . . . . . . . 0.47 0.39
Our current intention is to pay dividends approximating 30%-35% of yearly earnings; however, the paymentof dividends is determined by our Board of Directors (“Board”) at its discretion based on various factors, and noassurance can be provided as to future dividends.
Performance Graph.
Total Return To Shareholders(1)
(Includes reinvestment of dividends)
ANNUAL RETURN PERCENTAGEYears Ending
Company Name / Index 2010 2011 2012 2013 2014
International Flavors & Fragrances . . . . . . . . . . . . . . . . . 38.06 (3.81) 29.72 31.59 19.95S&P 500 Index . . . . . . . . . . . . . . . . . . . . . . . . . . . . . . . . . 15.06 2.11 16.00 32.39 13.69Peer Group . . . . . . . . . . . . . . . . . . . . . . . . . . . . . . . . . . . . 15.56 9.69 8.21 19.83 7.98
INDEXED RETURNSYears Ending
Company Name / Index
BasePeriod2009 2010 2011 2012 2013 2014
International Flavors &Fragrances . . . . . . . . . . . . . . . . . $100 $138.06 $132.81 $172.28 $226.70 $271.92
S&P 500 Index . . . . . . . . . . . . . . . . 100 115.06 117.49 136.30 180.44 205.14Peer Group . . . . . . . . . . . . . . . . . . . 100 115.56 126.76 137.16 164.36 177.48
24

Peer Group Companies(2)
Alberto Culver Company Hillshire Brands Co. Unilever NV
Avon Products Hormel Foods Corp. YUM Brands, Inc.
Campbell Soup Co. Kellogg Co.
Church & Dwight Co. Inc. Estee Lauder Companies, Inc.
Clorox Company McCormick & Company, Inc.
Coca-Cola Company McDonald’s Corp.
Colgate-Palmolive Co. Nestle SA
ConAgra Foods, Inc. Pepsico Inc.
General Mills Inc. Procter & Gamble Co.
H.J. Heinz Co. Revlon Inc.
Hershey Company Sensient Technologies Corp.
$0
$50
$100
$150
$300
$250
$200
12/31/2009 12/31/2010 12/31/2011 12/31/2012 12/31/2013 12/31/2014
International Flavors & Fragrances S&P 500 Index Peer Group
(1) The Cumulative Shareholder Return assumes that the value of an investment in our Common Stock andeach index was $100 on December 31, 2008, and that all dividends were reinvested.
(2) Due to the international scope and breadth of our business, we believe that a Peer Group comprisinginternational public companies, which are representative of the customer group to which we sell ourproducts, is the most appropriate group against which to compare shareholder returns. Alberto CulverCompany ceased trading on May 9, 2011 and has only been included through that date. In July 2012, SaraLee Corp. spun off certain of its businesses and changed its name to Hillshire Brands Co. H.J. Heinz Co wasacquired by Hawk Acquisition Holding Corp on June 7, 2013 and has only been included through that date.Hillshire Brands Co was acquired by Tyson Foods on August 28, 2014 and has only been included throughthat date.
25
Issuer Purchases of Equity Securities.
The table below reflects shares of common stock we repurchased during the fourth quarter of 2014.
Period
Total Number ofShares
Repurchased(1)
AveragePrice Paidper Share
Total Number ofShares Purchased as
Part of PubliclyAnnounced Program
Approximate Dollar Valueof Shares That May Yetbe Purchased Under the
Program
October 1 — 31, 2014 . . . . . . . . . . . . . . 170,968 $ 95.06 170,968 $129,431,594November 1 — 30, 2014 . . . . . . . . . . . . 108,310 98.11 108,310 118,805,466December 1 — 31, 2014 . . . . . . . . . . . . 97,222 101.54 97,222 108,933,649
Total . . . . . . . . . . . . . . . . . . . . . . . . . . . 376,500 $ 98.24 376,500 $108,933,649
(1) Shares were repurchased pursuant to the repurchase program announced in December 2012, withrepurchases beginning in the first quarter of 2013. Repurchases under the program are limited to $250million in total repurchase price, and the expiration date is December 31, 2016. Authorization of therepurchase program may be modified, suspended, or discontinued at any time.
ITEM 6. SELECTED FINANCIAL DATA.
INTERNATIONAL FLAVORS & FRAGRANCES INC.QUARTERLY FINANCIAL DATA (UNAUDITED)
The following selected consolidated financial data is derived from our Consolidated Financial Statements.This data should be read in conjunction with the Consolidated Financial Statements and Notes thereto, and withItem 7, Management’s Discussion and Analysis of Financial Condition and Results of Operations.
(DOLLARS IN THOUSANDS EXCEPT PER SHARE DATA) Net Income Per Share(c)
Net Sales Gross Profit(a) Net Income(b) Basic Diluted
Quarter 2014 2013 2014 2013 2014 2013 2014 2013 2014 2013
First . . . . . . $ 770,224 $ 727,836 $ 341,412 $ 311,360 $106,707 $ 90,697 $1.31 $1.11 $1.30 $1.10Second . . . . 788,414 757,635 352,647 333,986 110,285 102,322 1.35 1.25 1.35 1.24Third . . . . . 773,813 742,256 340,111 325,404 107,415 99,046 1.32 1.21 1.31 1.20Fourth(d) . . . 756,082 725,169 327,980 313,455 90,136 61,479 1.11 0.75 1.10 0.75
$3,088,533 $2,952,896 $1,362,150 $1,284,205 $414,543 $353,544 $5.09 $4.32 $5.06 $4.29
(a) Q1-2014 includes $2.2 million of non-cash charges related to accelerated depreciation associated with the FragranceIngredients Rationalization and $0.4 million of operational improvement initiative costs associated with a plant closing,partial closings, and other organizational realignments, principally in Europe and Asia. Q2-2014 includes $2.9 million ofnon-cash charges related to accelerated depreciation and $0.3 million related to operational improvement initiative costs.Q3-2014 includes $0.3 million of operational improvement initiative costs. Q4-2014 includes $1.6 million of operationalimprovement initiative costs.
Q1-2013 includes $1.2 million of operational improvement initiative costs associated with the plant closings in Europeand partial closing in Asia. Q2-2013 includes $0.8 million of restructuring-related costs associated with the FragranceIngredients Rationalization and $0.2 million of operational improvement initiative costs associated with the plantclosings in Europe and Asia. Q3-2013 includes $2.2 million of restructuring-related costs associated with the FragranceIngredients Rationalization and $0.4 million of operational improvement initiative costs associated with the plantclosings in Europe and Asia. Q4-2013 includes $2.3 million of restructuring-related costs associated with the FragranceIngredients Rationalization and $1.8 million of operational improvement initiative costs associated with the plantclosings in Europe and several locations in Asia.
(b) Q1-2014 includes $1.5 million of restructuring-related costs associated with the Fragrance Ingredients Rationalization,net of tax, and $0.3 million, net of tax, of operational improvement initiative costs as discussed above. Q2-2014 includes$2.0 million, net of tax, of restructuring-related costs and $0.2 million, net of tax, of operational improvement initiative
26

costs. Q3-2014 includes $0.4 million, net of tax, of restructuring-related costs and $0.2 million, net of tax, of operationalimprovement initiative costs. Q4-2014 includes $0.3 million, net of tax, of restructuring-related costs, $1.2 million, net oftax, of operational improvement initiative costs, a $3.8 million tax benefit associated with the favorable ruling of the2011 Spanish dividend withholding case (as discussed in Note 9 of the Consolidated Financial Statements) and a $0.5million net gain related to the sale of a non-operating asset.
Q1-2013 includes a $6.2 million Spanish tax charge related to the 2002-2003 ruling and $0.9 million of operationalimprovement initiative costs, net of tax, associated with the plant closings in Europe and Asia. Q2-2013 includes $1.9million of restructuring-related costs, net of tax, associated with the Fragrance Ingredients Rationalization, $0.1 millionof operational improvement initiative costs, net of tax, associated with the plant closings in Europe and Asia, and a $10.5million net gain related to the sale of a non-operating asset. Q3-2013 includes $1.4 million of restructuring-related costs,net of tax, associated with the Fragrance Ingredients Rationalization and $0.3 million of operational improvementinitiative costs, net of tax, associated with the plant closings in Europe and Asia as discussed above. Q4-2013 includes$1.5 million, net of tax, associated with the Fragrance Ingredients Rationalization, $1.4 million of operationalimprovement initiative costs, net of tax, associated with the plant closings in Europe and several locations in Asia, a $9.1million charge related to the Spanish capital tax case, net of tax, and a $1.9 million loss related to the sale of a non-operating asset.
(c) Q1-2014 and Q2-2014 both include $0.02 per diluted share related to restructuring-related charges. Q3-2014 includes$0.1 per diluted share related to restructuring-related charges. Q4-2014 includes $0.01 per diluted share related tooperational improvement initiative costs and a loss of $0.05 per diluted share related to the favorable ruling of the 2001Spanish dividend withholding case.
Q1-2013 includes tax charges of $0.08 per diluted share related to the 2002-2003 ruling and $0.01 per diluted sharerelated to operational improvement initiative costs. Q2-2013 includes a gain of $0.13 per diluted share related to the saleof a non-operating asset and restructuring charges of $0.02 per diluted share. Q3-2013 includes restructuring charges of$0.02 per diluted share. Q4-2013 includes charges of $0.11 per diluted share related to the Spanish capital tax case,restructuring charges of $0.02 per diluted share, operational improvement initiative costs of $0.02 per diluted share and aloss of $0.02 per diluted share related to the sale of a non-operating asset.
(d) Q4-2014 includes the impact of an extra week in 2014 (as discussed in Note 1 of the Consolidated Financial Statements).This impact was not material to our results of operations for the year ended December 31, 2014.
27
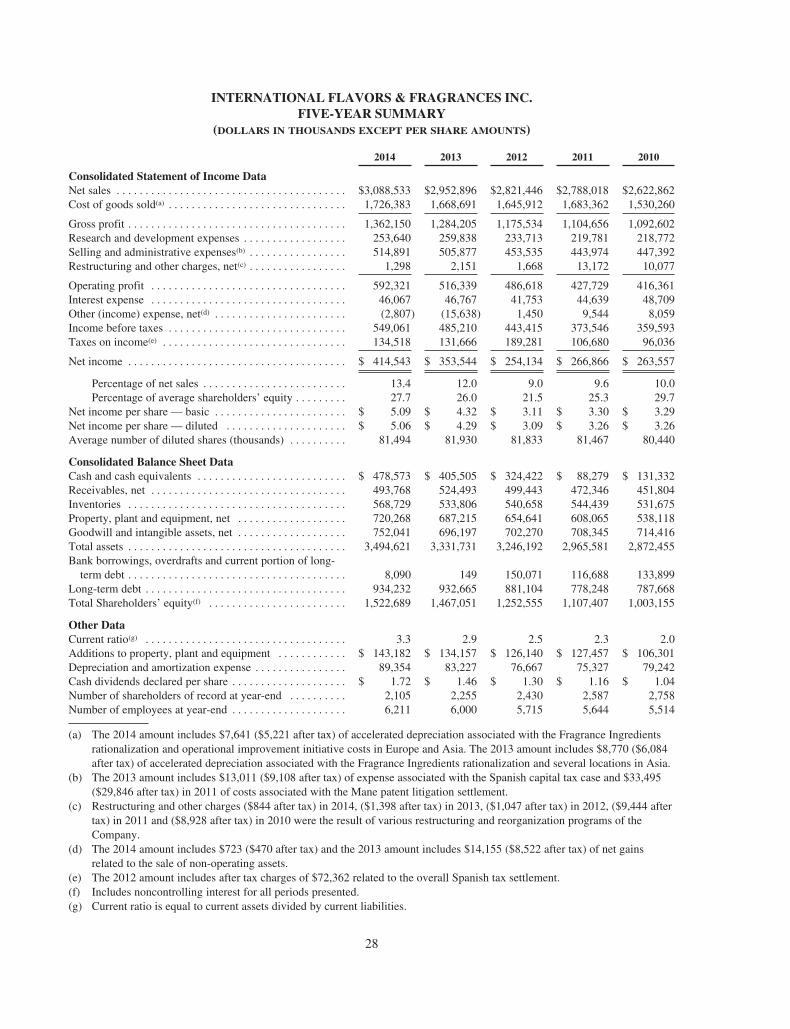
INTERNATIONAL FLAVORS & FRAGRANCES INC.FIVE-YEAR SUMMARY
(DOLLARS IN THOUSANDS EXCEPT PER SHARE AMOUNTS)
2014 2013 2012 2011 2010
Consolidated Statement of Income DataNet sales . . . . . . . . . . . . . . . . . . . . . . . . . . . . . . . . . . . . . . . . $3,088,533 $2,952,896 $2,821,446 $2,788,018 $2,622,862Cost of goods sold(a) . . . . . . . . . . . . . . . . . . . . . . . . . . . . . . . 1,726,383 1,668,691 1,645,912 1,683,362 1,530,260
Gross profit . . . . . . . . . . . . . . . . . . . . . . . . . . . . . . . . . . . . . . 1,362,150 1,284,205 1,175,534 1,104,656 1,092,602Research and development expenses . . . . . . . . . . . . . . . . . . 253,640 259,838 233,713 219,781 218,772Selling and administrative expenses(b) . . . . . . . . . . . . . . . . . 514,891 505,877 453,535 443,974 447,392Restructuring and other charges, net(c) . . . . . . . . . . . . . . . . . 1,298 2,151 1,668 13,172 10,077
Operating profit . . . . . . . . . . . . . . . . . . . . . . . . . . . . . . . . . . 592,321 516,339 486,618 427,729 416,361Interest expense . . . . . . . . . . . . . . . . . . . . . . . . . . . . . . . . . . 46,067 46,767 41,753 44,639 48,709Other (income) expense, net(d) . . . . . . . . . . . . . . . . . . . . . . . (2,807) (15,638) 1,450 9,544 8,059Income before taxes . . . . . . . . . . . . . . . . . . . . . . . . . . . . . . . 549,061 485,210 443,415 373,546 359,593Taxes on income(e) . . . . . . . . . . . . . . . . . . . . . . . . . . . . . . . . 134,518 131,666 189,281 106,680 96,036
Net income . . . . . . . . . . . . . . . . . . . . . . . . . . . . . . . . . . . . . . $ 414,543 $ 353,544 $ 254,134 $ 266,866 $ 263,557
Percentage of net sales . . . . . . . . . . . . . . . . . . . . . . . . . 13.4 12.0 9.0 9.6 10.0Percentage of average shareholders’ equity . . . . . . . . . 27.7 26.0 21.5 25.3 29.7
Net income per share — basic . . . . . . . . . . . . . . . . . . . . . . . $ 5.09 $ 4.32 $ 3.11 $ 3.30 $ 3.29Net income per share — diluted . . . . . . . . . . . . . . . . . . . . . $ 5.06 $ 4.29 $ 3.09 $ 3.26 $ 3.26Average number of diluted shares (thousands) . . . . . . . . . . 81,494 81,930 81,833 81,467 80,440
Consolidated Balance Sheet DataCash and cash equivalents . . . . . . . . . . . . . . . . . . . . . . . . . . $ 478,573 $ 405,505 $ 324,422 $ 88,279 $ 131,332Receivables, net . . . . . . . . . . . . . . . . . . . . . . . . . . . . . . . . . . 493,768 524,493 499,443 472,346 451,804Inventories . . . . . . . . . . . . . . . . . . . . . . . . . . . . . . . . . . . . . . 568,729 533,806 540,658 544,439 531,675Property, plant and equipment, net . . . . . . . . . . . . . . . . . . . 720,268 687,215 654,641 608,065 538,118Goodwill and intangible assets, net . . . . . . . . . . . . . . . . . . . 752,041 696,197 702,270 708,345 714,416Total assets . . . . . . . . . . . . . . . . . . . . . . . . . . . . . . . . . . . . . . 3,494,621 3,331,731 3,246,192 2,965,581 2,872,455Bank borrowings, overdrafts and current portion of long-term debt . . . . . . . . . . . . . . . . . . . . . . . . . . . . . . . . . . . . . . 8,090 149 150,071 116,688 133,899
Long-term debt . . . . . . . . . . . . . . . . . . . . . . . . . . . . . . . . . . . 934,232 932,665 881,104 778,248 787,668Total Shareholders’ equity(f) . . . . . . . . . . . . . . . . . . . . . . . . 1,522,689 1,467,051 1,252,555 1,107,407 1,003,155
Other DataCurrent ratio(g) . . . . . . . . . . . . . . . . . . . . . . . . . . . . . . . . . . . 3.3 2.9 2.5 2.3 2.0Additions to property, plant and equipment . . . . . . . . . . . . $ 143,182 $ 134,157 $ 126,140 $ 127,457 $ 106,301Depreciation and amortization expense . . . . . . . . . . . . . . . . 89,354 83,227 76,667 75,327 79,242Cash dividends declared per share . . . . . . . . . . . . . . . . . . . . $ 1.72 $ 1.46 $ 1.30 $ 1.16 $ 1.04Number of shareholders of record at year-end . . . . . . . . . . 2,105 2,255 2,430 2,587 2,758Number of employees at year-end . . . . . . . . . . . . . . . . . . . . 6,211 6,000 5,715 5,644 5,514
(a) The 2014 amount includes $7,641 ($5,221 after tax) of accelerated depreciation associated with the Fragrance Ingredientsrationalization and operational improvement initiative costs in Europe and Asia. The 2013 amount includes $8,770 ($6,084after tax) of accelerated depreciation associated with the Fragrance Ingredients rationalization and several locations in Asia.
(b) The 2013 amount includes $13,011 ($9,108 after tax) of expense associated with the Spanish capital tax case and $33,495($29,846 after tax) in 2011 of costs associated with the Mane patent litigation settlement.
(c) Restructuring and other charges ($844 after tax) in 2014, ($1,398 after tax) in 2013, ($1,047 after tax) in 2012, ($9,444 aftertax) in 2011 and ($8,928 after tax) in 2010 were the result of various restructuring and reorganization programs of theCompany.
(d) The 2014 amount includes $723 ($470 after tax) and the 2013 amount includes $14,155 ($8,522 after tax) of net gainsrelated to the sale of non-operating assets.
(e) The 2012 amount includes after tax charges of $72,362 related to the overall Spanish tax settlement.(f) Includes noncontrolling interest for all periods presented.(g) Current ratio is equal to current assets divided by current liabilities.
28

ITEM 7. MANAGEMENT’S DISCUSSION AND ANALYSIS OF FINANCIAL CONDITION ANDRESULTS OF OPERATIONS.
(UNLESS INDICATED OTHERWISE, DOLLARS IN MILLIONS EXCEPT PER SHARE AMOUNTS)
Overview
We create, manufacture and supply flavors and fragrances for the food, beverage, personal care andhousehold-products industries either in the form of compounds or individual ingredients. Our flavors andfragrance compounds combine a large number of ingredients that are blended, mixed or reacted together toproduce proprietary formulas created by our perfumers and flavorists.
Flavors are the key building blocks that impart taste in processed food and beverage products and, as such,play a significant role in determining consumer preference of the end products in which they are used. While weare a global leader, our flavors business is more regional in nature, with different formulas that reflect local tastesand ingredients. As a leading creator of flavors, we help our customers deliver on the promise of delicious andhealthy foods and drinks that appeal to consumers. Our flavors compounds are ultimately used by our customersin four end-use categories: (1) Savory, (2) Beverages, (3) Sweet, pharmaceutical and oral care (“Sweet”), and(4) Dairy.
Our fragrances are a key component in the world’s finest perfumes and best-known consumer brands,including beauty care, fabric care, personal wash and home care products. In 2014, we announced that werealigned our creative and commercial teams within our Fragrance Compounds activities resulting in two newly-defined broad market categories, (1) Fine Fragrances and (2) Consumer Fragrances. Consumer Fragrancesconsists of five end-use categories: Fabric Care, Home Care, Personal Wash, Hair Care and Toiletries. Prior tothe realignment, our Fragrance Compounds activities consisted of two broad categories (1) Fine Fragrance andBeauty Care and (2) Functional Fragrances. In addition, Fragrance Ingredients, which are used internally andsold to third parties, including customers and competitors, for use in preparation of compounds, are also includedin the Fragrances business unit.
The flavors and fragrances market is part of a larger market which supplies a variety of ingredients andcomponents that consumer products companies utilize in their products. The broader market includes largemultinational companies or smaller regional and local participants which supply products such as seasonings,texturizers, spices, enzymes, certain food related commodities, fortified products and cosmetic ingredients. Theflavors and fragrances market is estimated to be at least $18 billion; however the exact size of the global marketis not available due to fragmentation of data. We, together with the other top three companies are estimated tocomprise approximately two-thirds of the total estimated sales in the global flavors and fragrances sub-segmentof the broader market.
Development of new flavors and fragrance compounds is driven by a variety of sources, including requestsfrom our customers, who are in need of a specific flavor or fragrance for use in a new or modified consumerproduct, or as a result of internal initiatives stemming from our Consumer Insights program. Our productdevelopment team works in partnership with our scientists and researchers to optimize the consumer appeal ofthe flavor or fragrance. It then becomes a collaborative process between our researchers, our productdevelopment team and our customers to perfect the flavor or fragrance so that it is ready to be included in thefinal consumer product.
Our 25 largest customers accounted for 53% of total sales in 2014; this percentage has remained fairlyconstant for several years. A key factor for commercial success is inclusion on our strategic customers’ coresupplier lists, which provides opportunities to win new business. We are on the core supplier lists of a largemajority of our global and strategic customers within Fragrances and Flavors.
Sales in 2014 grew 5% both on a reported basis and in local currency (LC) terms, with the acquisition ofAromor adding approximately 1% to both reported and local currency basis amounts. Flavors achieved LC
29

growth of 4% and Fragrances achieved LC growth of 7% in 2014. The LC growth reflects new win performance(net of losses) in both Flavors and Fragrance Compounds partially offset by volume erosion on existing business.In addition, Fragrance Ingredients sales were up 18% driven largely by the Aromor acquisition. Overall, our 2014results continued to be driven by our strong emerging market presence that represented 50% of total sales andexperienced 6% LC growth in 2014. From a geographic perspective, all regions delivered LC growth on aconsolidated basis in 2014; led by Latin America (LA) with 7% LC sales growth.
The year 2014 included an extra week of activity, due to the timing of our fiscal year-end (as discussed inNote 1 of the Consolidated Financial Statements). The impact of this week was not material to our results ofoperations for the year ended December 31, 2014.
2014 Sales by Business Unit
53% Fragrances
47% Flavors
Sales by Destination(DOLLARS IN MILLIONS) 2014
Percentof sales 2013
Percentof sales 2012
Percentof sales
Europe, Africa and Middle East (EAME) . . . . . . . . . . . . . $1,042 34% $ 972 33% $ 913 32%Greater Asia (GA) . . . . . . . . . . . . . . . . . . . . . . . . . . . . . . . . 856 28% 823 28% 772 27%North America (NOAM) . . . . . . . . . . . . . . . . . . . . . . . . . . 690 22% 681 23% 694 25%Latin America (LA) . . . . . . . . . . . . . . . . . . . . . . . . . . . . . . 501 16% 477 16% 442 16%
Total net sales, as reported . . . . . . . . . . . . . . . . . . . . . $3,089 $2,953 $2,821
Year Ended December 31,
Sales by End-Use Product Category 2014 2013 2012
Flavor Compounds . . . . . . . . . . . . . . . . . . . . . . . . . . . . . . . . . . . . . . . . . . . . . . . . . . . . . . . 47% 48% 49%Consumer Fragrances . . . . . . . . . . . . . . . . . . . . . . . . . . . . . . . . . . . . . . . . . . . . . . . . . . . . . 32% 32% 31%Fine Fragrances . . . . . . . . . . . . . . . . . . . . . . . . . . . . . . . . . . . . . . . . . . . . . . . . . . . . . . . . . . 11% 11% 11%Fragrance Ingredients . . . . . . . . . . . . . . . . . . . . . . . . . . . . . . . . . . . . . . . . . . . . . . . . . . . . . 10% 9% 9%
Total Net Sales . . . . . . . . . . . . . . . . . . . . . . . . . . . . . . . . . . . . . . . . . . . . . . . . . . . . . . 100% 100% 100%
FINANCIAL PERFORMANCE OVERVIEW
Reported sales for 2014 increased 5% year-over-year (including approximately 1% growth from theacquisition of Aromor). We continue to benefit from our diverse portfolio of end-use product categories andgeographies and had growth in all four regions and in Consumer Fragrances, Fragrance Ingredients and FlavorCompounds. Both Flavors and Fragrances benefited from new win performance (net of losses) that was partiallyoffset by volume erosion on existing business. Exchange rate variations were flat in year-over-year sales. Theeffect of exchange rates can vary by business and region depending upon the mix of sales by country as well asthe relative percentage of local sales priced in U.S. dollars versus local currencies. LC sales growth of 5% in2014 was consistent with our long-term strategic target of 4%-6% LC growth. We saw good LC sales growthduring each quarter of 2014, despite the impact of volume erosion on existing business. Regarding our 2015outlook, we believe that LC sales growth will be in line with our long-term targets, while operating profit growth
30

is expected to be at the low end of the range, in light of a stronger U.S. dollar versus most currencies and higherincentive compensation expense. In addition, we believe EPS growth will be high single-digits, driven byoperating profit growth.
On a long-term basis we expect that sales growth for the industry will generally be in line with theunderlying assumptions that support our long-term strategic goals, albeit with some risk in the near term giventhe continuing global economic uncertainty. We believe changing social habits resulting from increaseddisposable income, improved focus on personal health and wellness awareness should help drive growth of ourconsumer product customers’ businesses.
Gross margins increased 60 basis points (bps) year-over-year, due to solid sales growth, and benefits fromcost and productivity initiatives, that more than offset the slightly unfavorable price versus input cost dynamicduring 2014. However, the overall raw material cost base remains elevated, including certain categories whereprices remain near all time highs. We believe input costs will increase approximately 1% in 2015 as higher priceson certain categories, such as naturals, will more than offset potential benefits associated with oil-basedderivatives that are expected to occur later in 2015. We continue to seek improvements in our margins throughoperational performance and mix enhancement.
Operating profit increased $76.0 million to $592.3 million (19.2% of sales) in 2014 compared to $516.3million (17.5% of sales) in 2013. Included in 2014 were operational improvement initiative costs of $2.5 million,Restructuring and other charges, net of $1.3 million and $5.1 million of accelerated depreciation included in Costof goods sold related to the Fragrance Ingredients Rationalization and several locations in Asia. Excluding thesecharges, adjusted operating profit was $601.3 million (19.5% of sales) for 2014. Included in 2013 wereoperational improvement initiative costs of $3.7 million primarily related to closing a smaller facility in Europeand certain manufacturing activities in Asia while transferring production to larger facilities in each respectiveregion and accelerated depreciation associated with several locations in Asia, as well as restructuring costs of$7.4 million related to the Fragrance Ingredients Rationalization. In addition, 2013 included a $13.0 millioncharge related to the Spanish capital tax case. Excluding these charges, adjusted operating profit was $540.4million (18.3% of sales) for 2013. The year-over-year improvement reflects sales volume growth combined withreduced R&D, selling and administrative expenses as a percentages of sales, all of which were driven largely byfavorable year-over-year incentive compensation expenses. The results of Aromor were not significant to theconsolidated financial performance of the Company for 2014.
Although we are in the process of refreshing the key elements of our strategic priorities, we continued toexecute against the core elements of the strategic priorities identified during our in depth 2010 strategicassessment. In particular, ensuring that we have adequate resources and capabilities in place to support plannedgrowth in emerging markets through investments and installing key technologies globally was the primary driverrelated to the $143.2 million (4.6% of sales) of capital spending during 2014. We anticipate capital spending in2015 to be 4-5% of sales, net of potential grants and other reimbursements from government authorities that weexpect to receive as we continue to prioritize investments in emerging markets and Flavors.
Cash flows from operations were $518.4 million or 16.8% of sales in 2014 as compared to cash flows fromoperations of $407.6 million, or 13.8% of sales, during 2013. Excluding an incremental pension contribution of$15 million year-over-year and total Spanish tax payments of $33 million (related to the 2003 and 2011 fiscalyears) made during 2013, our adjusted cash flow from operations was $455.6 million in 2013, representing anincrease of $62.8 million in 2014 from 2013.
31

Results of Operations
Year Ended December 31, Change
(DOLLARS IN THOUSANDS EXCEPT PER SHARE AMOUNTS) 2014 2013 20122014 vs.2013
2013 vs.2012
Net sales . . . . . . . . . . . . . . . . . . . . . . . . . . . . . . . . . . . $3,088,533 $2,952,896 $2,821,446 4.6% 4.7%Cost of goods sold . . . . . . . . . . . . . . . . . . . . . . . . . . . . 1,726,383 1,668,691 1,645,912 3.5% 1.4%
Gross profit . . . . . . . . . . . . . . . . . . . . . . . . . . . . . . . . . 1,362,150 1,284,205 1,175,534Research and development (R&D) expenses . . . . . . . 253,640 259,838 233,713 (2.4)% 11.2%Selling and administrative (S&A) expenses . . . . . . . . 514,891 505,877 453,535 1.8% 11.5%Restructuring and other charges, net . . . . . . . . . . . . . . 1,298 2,151 1,668 -39.7% 29.0%
Operating profit . . . . . . . . . . . . . . . . . . . . . . . . . . . . . . 592,321 516,339 486,618Interest expense . . . . . . . . . . . . . . . . . . . . . . . . . . . . . . 46,067 46,767 41,753 -1.5% 12.0%Other (income) expense, net . . . . . . . . . . . . . . . . . . . . (2,807) (15,638) 1,450 -82.1%(1,178.5)%
Income before taxes . . . . . . . . . . . . . . . . . . . . . . . . . . 549,061 485,210 443,415Taxes on income . . . . . . . . . . . . . . . . . . . . . . . . . . . . . 134,518 131,666 189,281 2.2% (30.4)%
Net income . . . . . . . . . . . . . . . . . . . . . . . . . . . . . . . . . $ 414,543 $ 353,544 $ 254,134
Net income per share — diluted . . . . . . . . . . . . . . . . . $ 5.06 $ 4.29 $ 3.09 17.9% 38.8%Gross margin . . . . . . . . . . . . . . . . . . . . . . . . . . . . . . . . 44.1% 43.5% 41.7% 60.0 180.0R&D as a percentage of sales . . . . . . . . . . . . . . . . . . . 8.2% 8.8% 8.3% (60.0) 50.0S&A as a percentage of sales . . . . . . . . . . . . . . . . . . . 16.7% 17.1% 16.1% (40.0) 100.0Operating margin . . . . . . . . . . . . . . . . . . . . . . . . . . . . 19.2% 17.5% 17.2% 170.0 30.0Adjusted operating margin(1) . . . . . . . . . . . . . . . . . . . . 19.5% 18.3% 17.3% 120.0 100.0Effective tax rate . . . . . . . . . . . . . . . . . . . . . . . . . . . . . 24.5% 27.1% 42.7%(260.0) (1,560.0)
Segment net salesFlavors . . . . . . . . . . . . . . . . . . . . . . . . . . . . . . . . . . . . . $1,457,055 $1,422,739 $1,378,377 2.4% 3.2%Fragrances . . . . . . . . . . . . . . . . . . . . . . . . . . . . . . . . . . 1,631,478 1,530,157 1,443,069 6.6% 6.0%
Consolidated . . . . . . . . . . . . . . . . . . . . . . . . . . . . . . . . $3,088,533 $2,952,896 $2,821,446
(1) Adjusted operating margin for the twelve months ended December 31, 2014 excludes the operationalimprovement initiative costs of $2.5 million, Restructuring and other charges, net of $1.3 million and $5.1million of accelerated depreciation included in Cost of goods sold related to the Fragrance IngredientsRationalization and several locations in Asia. Adjusted operating margin for the twelve months endedDecember 31, 2013 excludes the operational improvement initiative costs of $2.3 million, Restructuring andother charges, net of $2.2 million, $6.7 million of accelerated depreciation included in Cost of goods soldrelated to the Fragrance Ingredients Rationalization and several locations in Asia, and the Spanish capitaltax charge of $13.0 million. Adjusted operating margin for the twelve months ended December 31, 2012excludes Restructuring and other charges, net of $1.7 million.
Cost of goods sold includes the cost of materials and manufacturing expenses; raw materials generallyconstitute 70% of the total. R&D expenses relate to the development of new and improved molecules andtechnologies, technical product support and compliance with governmental regulations. S&A expenses includeexpenses necessary to support our commercial activities and administrative expenses principally associated withstaff groups that support our overall operating activities.
2014 IN COMPARISON TO 2013
Sales
Sales for 2014 totaled $3.1 billion, an increase of 5% from the prior year on both a reported and LC basis,with the acquisition of Aromor adding approximately 1% to both reported and LC basis amounts. The LC growth
32

reflects new win performance (net of losses) in both Flavors and Fragrance Compounds partially offset byvolume erosion on existing business. In addition, Fragrance Ingredients sales were up 18% (which includes thebenefit of the Aromor acquisition). Overall LC growth was driven by 6% growth in emerging markets.
Flavors Business Unit
On a reported basis, Flavors sales increased 2%. Excluding the impact of foreign currency, LC sales for theFlavors business increased 4% versus the prior year period. The overall performance reflects new wins offset byvolume erosion on existing business. Overall high single-digit growth in Beverage combined with low single-digit growth in Savory and mid single-digit growth in Dairy was partially offset by low single-digit declines inSweet. Regionally, the Flavors business delivered LC growth in LA, EAME and GA, led by LA, while salesdeclined in NOAM. Sales in LA were driven by high double-digit gains in Beverage. Sales in GA were led bymid single-digit gains in Savory and sales in EAME were driven by double-digit gains in Beverage. The declinesin NOAM were primarily driven by low single-digit declines in Beverage and Sweet, which were only partiallyoffset by double-digit gains in Dairy. EAME performance continues to be led by our performance in theemerging market countries within the region. Globally, Flavors growth was led by high single-digit growth inemerging markets. Overall, emerging markets represented approximately 52% of total Flavors sales.
Fragrances Business Unit
The Fragrances business was up 7% in both reported and LC terms. Year-over-year, 2014 LC salesperformance was led by double-digit growth in Fragrance Ingredients, high single-digit growth in Fabric Careand mid single-digit growth in Hair Care categories, as well as low single-digit growth in Fine Fragrances. LCgrowth within the regions was led by GA at 11% reflecting double-digit gains in the Fabric Care and FragranceIngredients. EAME experienced LC sales growth of 8% reflecting double-digit gains in Fragrance Ingredientsand high single-digit gains in Fabric Care. LA had LC sales growth of 3% reflecting double-digit gains in HairCare and Personal Wash. NOAM LC sales increased 4% reflecting double-digit gains in Home Care and mid tohigh single-digit gains in Fabric Care and Hair Care categories that more than offset low single-digit declines inFragrance Ingredients. Overall, emerging markets represented 47% of total Fragrances sales.
Sales Performance by Region and Category
%Change in Sales — 2014 vs 2013
FineFragrances
ConsumerFragrances Ingredients
TotalFrag. Flavors Total
NOAM . . . . . . . . . . . . . . . . . Reported 1% 8% -1% 4% -1% 1%EAME . . . . . . . . . . . . . . . . . . Reported 4% 4% 33% 9% 5% 7%
Local Currency(1) 2% 3% 32% 8% 4% 6%LA . . . . . . . . . . . . . . . . . . . . . Reported -2% 3% 3% 2% 12% 5%
Local Currency(1) 1% 4% 3% 3% 16% 7%GA . . . . . . . . . . . . . . . . . . . . . Reported 8% 7% 31% 10% 0% 4%
Local Currency(1) 9% 8% 33% 11% 3% 6%Total . . . . . . . . . . . . . . . . . . . Reported 2% 5% 18% 7% 2% 5%
Local Currency(1) 2% 5% 18% 7% 4% 5%
(1) Local currency sales growth is calculated by translating prior year sales at the exchange rates for thecorresponding 2014 period.
‰ NOAM reported sales growth of 1% reflecting a decline of 1% in Flavors as double-digit growth in Dairywas more than offset by volume declines in Sweet and Beverage, and 4% growth in Fragrances.Consumer Fragrances sales were up 8% versus last year as new wins and volume gains in Home Care andFabric Care were only partially offset by lower volumes on existing business in Fragrance Ingredients.
33

‰ EAME LC growth reflects 4% growth in Flavors primarily resulting from double-digit gains inBeverages. This growth was mainly due to new wins within our emerging markets in the region, as wellas volume increases. Total Fragrances growth of 8% was driven by double-digit growth in FragranceIngredients as well as high single-digit growth in Fabric Care.
‰ LA LC sales growth of 7% was driven by double-digit gains in Flavors, driven by Beverage. TotalFragrances growth reflects double-digit gains in Hair Care and mid single-digit gains in Fabric Care.
‰ GA delivered LC sales growth of 6%, led by mid single-digit gains in Savory. Both Consumer Fragrancesand Fine Fragrances experienced high single-digit growth led by double-digit growth in Fabric Care andhigh single-digit growth in Fine Fragrances. In addition, GA experienced Fragrance Ingredients LC salesgrowth of 33%.
Cost of Goods Sold
Cost of goods sold, as a percentage of sales, decreased 60 bps, on both a reported and adjusted basis, to55.9% in 2014 compared to 56.5% in 2013 (or 55.6% and 56.2% on an adjusted basis in 2014 and 2013,respectively). Included in cost of goods sold was $7.6 million of charges related to restructuring and operationalimprovement initiative costs in 2014 and $8.8 million of restructuring and operational improvement initiativecosts in 2013.
Research and Development (R&D)
R&D expenses decreased approximately $6.2 million versus the prior year. Overall, R&D expensesdecreased 60 bps as a percentage of sales from 8.8% in 2013 to 8.2% in 2014. This decrease is primarily drivenby lower incentive compensation expense.
Selling and Administrative (S&A)
S&A, as a percentage of sales, decreased 40 bps to 16.7% versus 17.1%. Excluding the $13.0 millionSpanish capital tax charge (as discussed in Note 17 to the Consolidated Financial Statements) in 2013, adjustedS&A expenses, as a percentage of sales, were 16.7% in 2013, consistent with the current year.
Restructuring and Other Charges
Restructuring and other charges primarily consist of separation costs for employees, including severance,outplacement and other benefit costs.
Restructuring Charges(In Thousands)
2014 2013
Flavors . . . . . . . . . . . . . . . . . . . . . . . . . . . . . . . . . . . . . . . . . . . . . . . . . . . . . . . . . . . . . . . . . . . $ — $ —Fragrances . . . . . . . . . . . . . . . . . . . . . . . . . . . . . . . . . . . . . . . . . . . . . . . . . . . . . . . . . . . . . . . . 1,298 2,151Global . . . . . . . . . . . . . . . . . . . . . . . . . . . . . . . . . . . . . . . . . . . . . . . . . . . . . . . . . . . . . . . . . . . . — —
Total . . . . . . . . . . . . . . . . . . . . . . . . . . . . . . . . . . . . . . . . . . . . . . . . . . . . . . . . . . . . . . . . . . . . . $1,298 $2,151
Fragrance Ingredients Rationalization
In 2014, the Company closed its fragrance ingredients manufacturing facility in Augusta, Georgia andconsolidated production into other Company facilities. In connection with this closure in 2014, the Companyincurred charges of $13.8 million, consisting primarily of $10.3 million in accelerated depreciation of fixedassets, $2.2 million in personnel-related costs and $1.3 million in plant shutdown and other related costs. TheCompany recorded total charges of $7.4 million during 2013, consisting of $2.2 million of pre-tax chargesrelated to severance included in Restructuring and other charges, net and $5.2 million of non-cash charges relatedto accelerated depreciation included in Cost of goods sold. During 2014, the Company recorded $1.3 million of
34

plant shutdown and other related costs included in Restructuring and other charges, net as well as an additional$5.1 million of non-cash charges related to accelerated depreciation included in Cost of goods sold. As a result ofthis closure, 43 positions have been eliminated. The Company estimates that approximately $3 – $4 million ofthe costs will be or have been cash expenditures.
Other
During 2013, the Company reversed $1.2 million of employee-related liabilities, offset by $0.6 million ofadditional costs incurred related to the European Rationalization Plan announced in 2009. Additionally, during2013, the Company recorded a charge of $1.7 million related to the Strategic Initiative, which began in 2011.
Operating Results by Business Unit
We evaluate the performance of business units based on segment profit which is defined as operating profitbefore Restructuring and certain non-recurring items, Interest expense, Other expense, net and Taxes on income.See Note 12 to our Consolidated Financial Statements for the reconciliation to Income before taxes.
For the Year EndedDecember 31,
(DOLLARS IN THOUSANDS) 2014 2013
Segment profit:Flavors . . . . . . . . . . . . . . . . . . . . . . . . . . . . . . . . . . . . . . . . . . . . . . . . . . . . . . . . . . . . . . $331,257 $323,562Fragrances . . . . . . . . . . . . . . . . . . . . . . . . . . . . . . . . . . . . . . . . . . . . . . . . . . . . . . . . . . . 335,447 283,651Global Expenses . . . . . . . . . . . . . . . . . . . . . . . . . . . . . . . . . . . . . . . . . . . . . . . . . . . . . . (65,443) (66,942)
Restructuring and other charges, net . . . . . . . . . . . . . . . . . . . . . . . . . . . . . . . . . . . . . . . . . . . (1,298) (2,151)Spanish capital tax charge . . . . . . . . . . . . . . . . . . . . . . . . . . . . . . . . . . . . . . . . . . . . . . . . . . . — (13,011)Operational improvement initiative costs . . . . . . . . . . . . . . . . . . . . . . . . . . . . . . . . . . . . . . . (7,642) (8,770)
Operating Profit . . . . . . . . . . . . . . . . . . . . . . . . . . . . . . . . . . . . . . . . . . . . . . . . . . . . . . . . . . . $592,321 $516,339
Profit marginFlavors . . . . . . . . . . . . . . . . . . . . . . . . . . . . . . . . . . . . . . . . . . . . . . . . . . . . . . . . . . . . . . 22.7% 22.7%Fragrances . . . . . . . . . . . . . . . . . . . . . . . . . . . . . . . . . . . . . . . . . . . . . . . . . . . . . . . . . . . 20.6% 18.5%Consolidated . . . . . . . . . . . . . . . . . . . . . . . . . . . . . . . . . . . . . . . . . . . . . . . . . . . . . . . . . 19.2% 17.5%
Flavors Business Unit
Flavors segment profit totaled $331.3 million in 2014 (22.7% of sales) consistent with $323.6 million(22.7% of sales) in the comparable 2013 period. The increase in segment profit was driven by lower incentivecompensation expense.
Fragrances Business Unit
Fragrances segment profit totaled $335.4 million in 2014 (20.6% of sales), compared to $283.7 million(18.5% of sales) reported in 2013. The improvement in segment profit and profit margin was primarily due tostrong sales growth combined with gross margin expansion, ongoing cost discipline, and lower incentivecompensation expense.
Global Expenses
Global expenses represent corporate and headquarter-related expenses which include legal, finance, humanresources and R&D and other administrative expenses that are not allocated to an individual business unit. In2014, Global expenses were $65.4 million compared to $66.9 million during 2013. The decrease is principallydriven by lower incentive compensation expense.
Interest Expense
In 2014, interest expense decreased $0.7 million to $46.1 million, as a result of the refinancing of our debtin 2013. Average cost of debt was 4.9% for the 2014 period compared to 4.7% in 2013.
35

Other (Income) Expense, Net
Other (income) expense, net decreased approximately $12.8 million to $2.8 million of income in 2014versus $15.6 million of income in 2013. The decrease was largely driven by a $14.2 million gain related to thesale of non-operating assets that occurred during 2013.
Income Taxes
The effective tax rate was 24.5% in 2014 as compared to 27.1% in 2013. Excluding the $2.6 million taxbenefit associated with the pretax restructuring charges and operational improvement initiative costs as well asthe $3.8 million tax benefit related to the reserve reversal for the 2001 Spanish dividend withholding tax case (asdiscussed in Note 9 of the Consolidated Financial Statements), the adjusted tax rate for 2014 is 25.3%. Excludingthe tax charge of $6.2 million related to the 2002-2003 income tax cases (as discussed in Note 9 of theConsolidated Financial Statements) and net of the $3.9 million tax benefit associated with the pretax Spanishcapital tax charge (as discussed in Note 17 of the Consolidated Financial Statements), the adjusted tax rate for2013 was 25.7%. The year-over-year reduction reflects a benefit from mix of earnings and lower loss provisionspartially offset by a higher cost of repatriation.
2013 IN COMPARISON TO 2012
Sales
Sales for 2013 totaled $3.0 billion, an increase of 5% from the prior year. Excluding currency impacts, LCsales grew by 5% (or 6% on a like-for-like basis, excluding the effects of the exit of low margin sales activities inFlavors), driven principally by new wins and the realization of price increases. LC sales growth was largelydriven by new customer wins, with price offset by volume reductions on existing business, primarily inFragrance Ingredients.
Flavors Business Unit
On a reported basis, Flavors sales increased 3%. Excluding the impact of foreign currency, LC sales for theFlavors business increased 4% versus the prior year period. Excluding the impact of a 2% decline in salesassociated with the strategic decision to exit certain lower margin sales activities, LC sales increased 6% on alike-for-like basis. The increase was driven by growth from new wins. LC growth was led by double-digit gainsin Beverages, mid single-digit gains in Savory and single-digit gains in Sweet, all of which benefited from newwins, supported by our innovative technology. Regionally, the business benefited from mid to high single-digitLC growth in GA, EAME and LA, which was partially offset by low single-digit LC declines in NOAM. On alike-for-like basis, NOAM experienced mid single-digit growth. LC growth in EAME and GA reflect growth inall categories led by double-digit growth in Beverages in EAME and high single-digit gains in Savory and Dairyin GA. LA LC growth reflects double-digit growth in Beverages. Sales in NOAM were led by double-digit gainsin Beverages. EAME performance was led by our performance in the emerging market countries within theregion. Globally, Flavors growth was led by high single-digit growth in emerging markets. Overall, emergingmarkets represented approximately 51% of total Flavors sales.
Fragrances Business Unit
The Fragrances business was up 6% in both reported and LC terms compared to flat LC sales in 2012 over2011. New wins across Fragrance Compounds were partially offset by volume declines in Fragrance Ingredientsprincipally related to the transition of volume to Fragrance Compounds. Year-over-year, 2013 LC salesperformance was led by double-digit growth in Fabric Care and high single-digit growth in Fine Fragrances andHair Care categories along with mid single-digit gains in Toiletries and Home Care. Offsetting these gains was a4% decline in Fragrance Ingredients. LC growth within the regions was led by GA at 13% reflecting double-digitgains in the Hair Care and Toiletries categories and double-digit gains in Fabric Care and high single-digitgrowth in Fragrance Ingredients. LA experienced LC sales growth of 11% reflecting double-digit gains in FineFragrances and the Fabric Care and Personal Wash categories and EAME had LC sales growth of 4% reflecting
36

double-digit gains in Fine Fragrances and mid to high single-digit gains in Fabric Care, Hair Care and Toiletriescategories, with both regions partially offset by mid single-digit declines in Fragrance Ingredients. NOAM LCsales decreased reflecting double-digit gains in Home Care and Hair Care categories that were more than offsetby high single-digit declines in Fine Fragrances, Fabric Care and Fragrance Ingredients. Overall, emergingmarkets represented 47% of total Fragrances sales.
Sales Performance by Region and Category
%Change in Sales — 2013 vs 2012
FineFragrances
ConsumerFragrances Ingredients
TotalFrag. Flavors Total
NOAM . . . . . . . . . . . . . . . . . Reported -6% 4% -6% -2% -2% -2%EAME . . . . . . . . . . . . . . . . . . Reported 14% 6% -4% 6% 7% 6%
Local Currency(1) 11% 4% -6% 4% 6% 5%LA . . . . . . . . . . . . . . . . . . . . . Reported 14% 10% -5% 9% 5% 8%
Local Currency(1) 17% 11% -5% 11% 8% 10%GA . . . . . . . . . . . . . . . . . . . . . Reported -2% 13% 3% 11% 4% 7%
Local Currency(1) -2% 14% 8% 13% 7% 9%Total . . . . . . . . . . . . . . . . . . . Reported 8% 8% -4% 6% 3% 5%
Local Currency(1) 8% 8% -4% 6% 4% 5%
(1) Local currency sales growth is calculated by translating prior year sales at the exchange rates for thecorresponding 2013 period.
‰ NOAM reported sales decline reflects a 2% Flavors decline as double-digit growth in Beverages wasmore than offset by volume declines in Sweet and Dairy, driven primarily by the exit of low margin salesactivities. In Fragrances, Consumer Fragrances sales were up 4% versus last year as new wins andvolume gains in Home Care were offset by lower volumes on existing business in Fabric Care. FineFragrances sales declined 6% as a result of mid single-digit declines in Fine Fragrances. On a like-for-likebasis, excluding the effects of the exit of low margin sales activities, NOAM Flavors experienced midsingle-digit growth.
‰ EAME LC growth was led by 6% growth in Flavors resulting from double-digit gains in Beverages alongwith mid single-digit growth in Savory. This growth was mainly due to new wins within our emergingmarkets in the region, as well as volume increases. On a like-for-like basis, excluding the effects of theexit of low margin sales activities, EAME Flavors experienced high single-digit growth. Fine Fragranceshad LC sales growth of 11% and Consumer Fragrances experienced 4% LC growth driven by high single-digit gains in Fabric Care and mid single-digit growth in Hair Care and Toiletries, which more than offsetvolume declines in Fragrance Ingredients of 6% year-over-year.
‰ LA LC sales growth of 10% was driven by double-digit gains in Fragrance Compounds, reflectingdouble-digit LC sales growth in Fabric Care, Personal Wash and Fine Fragrances, and mid single-digitgrowth in Hair Care and Toiletries categories, which were only partially offset by mid single-digit volumedeclines in Fragrance Ingredients. Flavors LC sales growth was 8%, driven by double-digit gains inBeverages and mid single-digit gains in Savory, which were only partially offset by single-digit declinesin Sweet (as a result of exiting low margin sales activities). On a like-for-like basis, excluding the effectsof the exit of low margin sales activities, LA Flavors experienced double-digit growth.
‰ GA delivered LC sales growth of 9%, led by high single-digit gains in Savory and Dairy, along with midsingle-digit growth in Beverages and Sweet categories. On a like-for-like basis, excluding the effects ofthe exit of low margin sales activities, GA Flavors experienced high single-digit growth. ConsumerFragrances experienced double-digit growth led by high double-digit growth in Fabric Care, Hair Careand Toiletries. In addition, GA experienced Fragrance Ingredients LC sales growth of 8%.
37

Cost of Goods Sold
Cost of goods sold, as a percentage of sales, decreased 180 bps to 56.5% in 2013 compared to 58.3% in2012. The improvement versus prior year was mainly driven by a slightly favorable input cost environment,manufacturing efficiencies, favorable sales mix and price realization. Overall, raw material costs have decreasedslightly on a year-over-year basis.
Research and Development (R&D)
R&D expenses increased approximately $26.1 million versus the prior year as a result of additionalinvestments in technology and innovation, consistent with our strategy to accelerate levels of innovation into themarketplace. Our product portfolio is actively managed to support gross margin expansion and be aligned withthe strategic priorities identified for each of our operating segments. Overall, R&D expenses increased 50 bps asa percentage of sales from 8.3% in 2012 to 8.8% in 2013.
Selling and Administrative (S&A)
S&A, as a percentage of sales, increased 100 bps to 17.1% versus 16.1%. Excluding the $13.0 millionSpanish capital tax charge (as discussed in Note 17 to the Consolidated Financial Statements), adjusted S&Aexpenses, as a percentage of sales, were 16.7%, an increase of 60 bps from the prior year. The increase inadjusted S&A expenses was driven by higher incentive compensation, planned spend in sales activities (mainlyin emerging markets) as well as the mark-to-market costs of our Deferred Compensation Plan awards.
Restructuring and Other Charges
Restructuring and other charges primarily consist of separation costs for employees, including severance,outplacement and other benefit costs.
Restructuring Charges(In Thousands)
2013 2012
Flavors . . . . . . . . . . . . . . . . . . . . . . . . . . . . . . . . . . . . . . . . . . . . . . . . . . . . . . . . . . . . . . . . . . . $ — $ (36)Fragrances . . . . . . . . . . . . . . . . . . . . . . . . . . . . . . . . . . . . . . . . . . . . . . . . . . . . . . . . . . . . . . . . 2,151 1,636Global . . . . . . . . . . . . . . . . . . . . . . . . . . . . . . . . . . . . . . . . . . . . . . . . . . . . . . . . . . . . . . . . . . . . — 68
Total . . . . . . . . . . . . . . . . . . . . . . . . . . . . . . . . . . . . . . . . . . . . . . . . . . . . . . . . . . . . . . . . . . . . . $2,151 $1,668
Fragrance Ingredients Rationalization
During the second quarter of 2013, the Company announced that it intended to close its fragranceingredients manufacturing facility in Augusta, Georgia by July 2014 and planned to consolidate production intoother Company facilities. The Company recorded total charges of $7.4 million during 2013, consisting of $2.2million of pre-tax charges related to severance included in Restructuring and other charges, net and $5.2 millionof non-cash charges related to accelerated depreciation included in Cost of goods sold.
Strategic Initiative
In December 2011, we recorded a charge to cover a restructuring which involved a reduction in workforceas well as a realignment of responsibilities in our Fragrances business unit. This alignment partly addressesissues identified in our 2010 strategic review process towards improving the underperforming areas of ourportfolio. It resulted in the redeployment of creative resources in emerging markets and the reorganization from aregional to a global category structure. We implemented a plan to streamline business operations globally whichresulted in the elimination of 72 positions, across Fragrances, Flavors and Corporate functions. As a result, werecorded a provision for severance costs of $9.8 million to Restructuring and other charges. We recorded anadditional net charge of $1.7 million during the twelve months ended December 31, 2012, principally attributableto adjustments based on the final separation terms with affected employees. We realized pre-tax savings ofapproximately $8 million in 2012.
38

European Rationalization Plan
During the second quarter 2011, we executed a partial settlement of our pension obligations with the formeremployees of the Drogheda, Ireland facility. As a result, we recorded a charge of $3.9 million related to theEuropean rationalization plan to cover settlements and special termination benefits. This settlement was fundedprimarily through pension plan investment trust assets.
We also reversed $1.2 million of employee-related liabilities in 2011 due to certain employees acceptingother roles within the Company, offset by $0.6 million of additional costs incurred.
Based upon the period-end estimates regarding the separation agreements, we increased our provision forseverance costs by $4.4 million in 2010. The remaining $5.7 million of the restructuring charges in 2010 wasmainly due to accelerated depreciation and other restructuring related costs pertaining to the rationalization ofour Fragrances and Ingredients operations in Europe.
In the aggregate, as of December 31, 2013, we have recorded expenses of $34.1 million relating to theEuropean Rationalization Plan and $11.5 million for the Strategic Initiative, of which $41.5 million was recordedto Restructuring and other charges, net and $11.6 million was recorded to Cost of goods sold, R&D and Sellingand administrative expenses.
Operating Results by Business Unit
We evaluate the performance of business units based on segment profit which is defined as operating profitbefore Restructuring and certain non-recurring items, Interest expense, Other expense, net and Taxes on income.See Note 12 to our Consolidated Financial Statements for the reconciliation to Income before taxes.
For the Year EndedDecember 31,
(DOLLARS IN THOUSANDS) 2013 2012
Segment profit:Flavors . . . . . . . . . . . . . . . . . . . . . . . . . . . . . . . . . . . . . . . . . . . . . . . . . . . . . . . . . . . . $323,562 $298,326Fragrances . . . . . . . . . . . . . . . . . . . . . . . . . . . . . . . . . . . . . . . . . . . . . . . . . . . . . . . . . 283,651 238,379Global Expenses . . . . . . . . . . . . . . . . . . . . . . . . . . . . . . . . . . . . . . . . . . . . . . . . . . . . (66,942) (48,419)
Restructuring and other charges, net . . . . . . . . . . . . . . . . . . . . . . . . . . . . . . . . . . . . . . . . . (2,151) (1,668)Spanish capital tax charge . . . . . . . . . . . . . . . . . . . . . . . . . . . . . . . . . . . . . . . . . . . . . . . . . (13,011) —Operational improvement initiative costs . . . . . . . . . . . . . . . . . . . . . . . . . . . . . . . . . . . . . (8,770) —
Operating Profit . . . . . . . . . . . . . . . . . . . . . . . . . . . . . . . . . . . . . . . . . . . . . . . . . . . . . . . . . $516,339 $486,618
Profit marginFlavors . . . . . . . . . . . . . . . . . . . . . . . . . . . . . . . . . . . . . . . . . . . . . . . . . . . . . . . . . . . . 22.7% 21.6%Fragrances . . . . . . . . . . . . . . . . . . . . . . . . . . . . . . . . . . . . . . . . . . . . . . . . . . . . . . . . . 18.5% 16.5%Consolidated . . . . . . . . . . . . . . . . . . . . . . . . . . . . . . . . . . . . . . . . . . . . . . . . . . . . . . . 17.5% 17.2%
Flavors Business Unit
Flavors segment profit totaled $323.6 million in 2013 (22.7% of sales) compared to $298.3 million (21.6%of sales) in the comparable 2012 period. The improvement in profitability was mainly driven by strong volumegrowth, favorable category mix, including the impact of exiting low margin sales activities, and the net impact ofprice versus input costs, which were partially offset by ongoing investments in R&D, higher employee costs andincreased incentive compensation related to strong 2013 performance.
Fragrances Business Unit
Fragrances segment profit totaled $283.7 million in 2013 (18.5% of sales), compared to $238.4 million(16.5% of sales) reported in 2012. The increase in profitability was driven by the strong sales growth combinedwith further gross margin expansion and ongoing cost discipline, which more than offset increased R&D andincentive compensation related to strong 2013 performance.
39
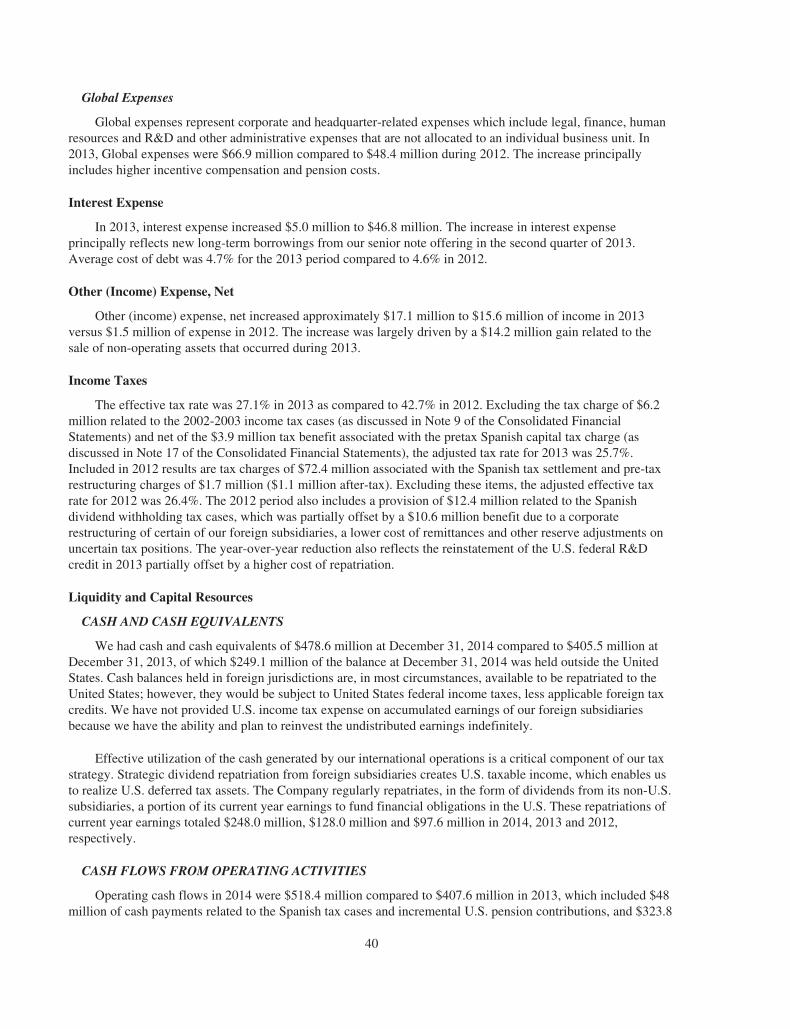
Global Expenses
Global expenses represent corporate and headquarter-related expenses which include legal, finance, humanresources and R&D and other administrative expenses that are not allocated to an individual business unit. In2013, Global expenses were $66.9 million compared to $48.4 million during 2012. The increase principallyincludes higher incentive compensation and pension costs.
Interest Expense
In 2013, interest expense increased $5.0 million to $46.8 million. The increase in interest expenseprincipally reflects new long-term borrowings from our senior note offering in the second quarter of 2013.Average cost of debt was 4.7% for the 2013 period compared to 4.6% in 2012.
Other (Income) Expense, Net
Other (income) expense, net increased approximately $17.1 million to $15.6 million of income in 2013versus $1.5 million of expense in 2012. The increase was largely driven by a $14.2 million gain related to thesale of non-operating assets that occurred during 2013.
Income Taxes
The effective tax rate was 27.1% in 2013 as compared to 42.7% in 2012. Excluding the tax charge of $6.2million related to the 2002-2003 income tax cases (as discussed in Note 9 of the Consolidated FinancialStatements) and net of the $3.9 million tax benefit associated with the pretax Spanish capital tax charge (asdiscussed in Note 17 of the Consolidated Financial Statements), the adjusted tax rate for 2013 was 25.7%.Included in 2012 results are tax charges of $72.4 million associated with the Spanish tax settlement and pre-taxrestructuring charges of $1.7 million ($1.1 million after-tax). Excluding these items, the adjusted effective taxrate for 2012 was 26.4%. The 2012 period also includes a provision of $12.4 million related to the Spanishdividend withholding tax cases, which was partially offset by a $10.6 million benefit due to a corporaterestructuring of certain of our foreign subsidiaries, a lower cost of remittances and other reserve adjustments onuncertain tax positions. The year-over-year reduction also reflects the reinstatement of the U.S. federal R&Dcredit in 2013 partially offset by a higher cost of repatriation.
Liquidity and Capital Resources
CASH AND CASH EQUIVALENTS
We had cash and cash equivalents of $478.6 million at December 31, 2014 compared to $405.5 million atDecember 31, 2013, of which $249.1 million of the balance at December 31, 2014 was held outside the UnitedStates. Cash balances held in foreign jurisdictions are, in most circumstances, available to be repatriated to theUnited States; however, they would be subject to United States federal income taxes, less applicable foreign taxcredits. We have not provided U.S. income tax expense on accumulated earnings of our foreign subsidiariesbecause we have the ability and plan to reinvest the undistributed earnings indefinitely.
Effective utilization of the cash generated by our international operations is a critical component of our taxstrategy. Strategic dividend repatriation from foreign subsidiaries creates U.S. taxable income, which enables usto realize U.S. deferred tax assets. The Company regularly repatriates, in the form of dividends from its non-U.S.subsidiaries, a portion of its current year earnings to fund financial obligations in the U.S. These repatriations ofcurrent year earnings totaled $248.0 million, $128.0 million and $97.6 million in 2014, 2013 and 2012,respectively.
CASH FLOWS FROM OPERATING ACTIVITIES
Operating cash flows in 2014 were $518.4 million compared to $407.6 million in 2013, which included $48million of cash payments related to the Spanish tax cases and incremental U.S. pension contributions, and $323.8
40

million in 2012, which included an outflow of cash of $105.5 million associated with the Spanish tax settlement(as discussed in Note 9 to the Consolidated Financial Statements). The cash flow impact associated with coreworking capital (trade receivables, inventories and accounts payable) improved compared to 2013. Operatingcash flows versus the prior year also reflect strong net income growth and improvements in working capital as apercentage of sales. Although we have appealed the lower court ruling on our Spanish capital tax case, we madepayment of $11.2 million (representing the principal amount) to the Spanish government relating to the caseduring the first quarter of 2014, which is refundable if we prevail on our appeal.
Working capital (current assets less current liabilities) totaled $1,191.2 million at year-end 2014 comparedto $1,092.5 million at December 31, 2013. This increase in working capital of $98.7 million primarily reflectsstrong sales growth and inventory increases associated with plant startups. The Company sold certain accountsreceivable on a non-recourse basis to unrelated financial institutions under “factoring” agreements that aresponsored, solely and individually, by certain customers. We believe that participating in the factoring programsstrengthens our relationships with these customers and provides operational efficiencies. We estimate that, as aresult of participating in the programs, there was a beneficial impact to cash inflows from operations ofapproximately $33 million, $7 million and $18 million in 2014, 2013 and 2012, respectively. The cost ofparticipating in these programs was immaterial to our results in all periods.
CASH FLOWS USED IN INVESTING ACTIVITIES
Net investing activities in 2014 utilized $221.3 million compared to $105.4 million and $114.3 million in2013 and 2012, respectively. The increase in the investing activities was principally driven by the acquisition ofAromor in the first quarter of 2014.
Additions to property, plant and equipment were $143.2 million, $134.2 million and $126.1 million in 2014,2013 and 2012, respectively, and are again expected to be 4-5% of sales in 2015, net of potential grants and otherreimbursements from government authorities that we expect to receive. Investments were largely focused onemerging markets and new technology consistent with our strategy.
On January 16, 2014, the Company completed the acquisition of Aromor Flavors and Fragrances Ltd., aprivately held manufacturer and marketer of complex specialty ingredients that are used in fragrances andflavors. IFF funded the transaction with cash.
CASH FLOWS (USED IN) PROVIDED BY FINANCING ACTIVITIES
Net financing activities in 2014 had an outflow of $202.3 million compared to an outflow of $217.0 millionand an inflow of $25.4 million in 2013 and 2012, respectively. The decrease in outflow of cash used in financingactivities in 2014 as compared to 2013 principally reflects higher incremental dividend payments and treasuryshare repurchases in 2014 which were more than offset by the repayment of long-term debt of $100 million madein July 2013. The outflow of cash used in financing activities in 2013 compared to the inflow of cash in 2012principally reflects the repayment of long-term debt of $100 million made in 2013 and changes in the revolvingcredit facility borrowings in 2013 compared to 2012.
At December 31, 2014, we had $942.3 million of debt outstanding compared to $932.8 million outstandingat December 31, 2013.
We paid dividends totaling $133.2 million, $87.3 million and $130.9 million in 2014, 2013 and 2012,respectively. The cash dividend declared per share in 2014, 2013 and 2012 was $1.72, $1.46 and $1.30,respectively.
In December 2012, the Board of Directors authorized a $250 million share repurchase program, whichcommenced in the first quarter of 2013 and is expected to be completed by the end of 2014. Based on the totalremaining amount of $109 million available under the repurchase program, approximately 1.1 million shares, or
41

1.4% of shares outstanding (based on the market price and shares outstanding as of December 31, 2014) could berepurchased under the program as of December 31, 2014. The purchases will be made from time to time on theopen market or through private transactions as market and business conditions warrant. Repurchased shares willbe placed into treasury stock.
CAPITAL RESOURCES
Operating cash flow provides the primary source of funds for capital investment needs, dividends paid toshareholders and debt repayments. We anticipate that cash flows from operations and availability under ourexisting credit facilities are sufficient to meet our investing and financing needs for at least the next eighteenmonths. We regularly assess our capital structure, including both current and long-term debt instruments, ascompared to our cash generation and investment needs in order to provide ample flexibility and to optimize ourleverage ratios. We believe our existing cash balances are sufficient to meet our debt service requirements.
Credit Facility and Senior Notes
We supplement short-term liquidity with access to capital markets, mainly through bank credit facilities andissuance of commercial paper. We did not issue commercial paper during 2014 and 2013.
Credit Facility
In April 2014, we amended and restated our unsecured revolving credit facility, including to modify theavailable tranches, reduce the applicable margin on the interest rate on advances under the credit facility andextend the maturity date of the credit facility to April 2019.
There are two tranches under the credit facility. The Tranche A facility is available in U.S. dollars, euros,Swiss francs, Japanese yen and British sterling in an aggregate amount up to an equivalent of $456.0 million,with a sublimit of $25.0 million for swing line borrowings. The Tranche B facility is available in euros, Swissfrancs, Japanese yen and British sterling in an aggregate amount up to an equivalent of $494.0 million. The creditfacility is available for general corporate purposes and may be extended for up to two additional one-year periodsat the Company’s request, subject to the agreement of the lenders having commitments representing more than50% of the aggregate commitments of all lenders under the credit facility. Borrowings under the credit facilitybear interest at an annual rate of LIBOR plus a margin, currently 112.5 bps, linked to our credit rating. Theinterest rate under our credit facility at December 31, 2014 was 1.41%. The credit facility contains variousaffirmative and negative covenants, including the requirement for us to maintain, at the end of each fiscal quarter,a ratio of net debt for borrowed money to adjusted EBITDA in respect of the previous 12-month period of notmore than 3.25 to 1. Based on this ratio, at December 31, 2014 our covenant compliance would provide overallborrowing capacity of $1,831.8 million.
On April 26, 2013, the Company repaid the full amount outstanding under the credit facility ($283.1million). As of December 31, 2014 we had no borrowings under the credit facility. The amount which we areable to draw down on under the credit facility is limited by financial covenants as described in more detail below.Our drawdown capacity on the credit facility was $940.4 million at December 31, 2014. See Note 8 to theConsolidated Financial Statements for further information on the credit facility.
42

At December 31, 2014 and 2013 we were in compliance with all financial and other covenants, includingthe net debt to adjusted EBITDA ratio. At December 31, 2014 our Net Debt/adjusted EBITDA(1) ratio was 0.65 to1 as defined by the credit facility, well below the financial covenants of existing outstanding debt. Failure tocomply with the financial and other covenants under our debt agreements would constitute default and wouldallow the lenders to accelerate the maturity of all indebtedness under the related agreement. If such accelerationwere to occur, we would not have sufficient liquidity available to repay the indebtedness. We would likely haveto seek amendments under the agreements for relief from the financial covenants or repay the debt with proceedsfrom the issuance of new debt or equity, and/or asset sales, if necessary. We may be unable to amend theagreements or raise sufficient capital to repay such obligations in the event the maturities are accelerated.
(1) Adjusted EBITDA and Net Debt, which are non-GAAP measures used for these covenants, are calculated inaccordance with the definition in the debt agreements. In this context, these measures are used solely toprovide information on the extent to which we are in compliance with debt covenants and may not becomparable to adjusted EBITDA and Net Debt used by other companies. Reconciliations of adjustedEBITDA to net income and net debt to total debt are as follows:
12 Months EndedDecember 31,
(DOLLARS IN MILLIONS) 2014 2013
Net income . . . . . . . . . . . . . . . . . . . . . . . . . . . . . . . . . . . . . . . . . . . . . . . . . . . . . . . . . . . . . . . . $414.5 $353.5Interest expense . . . . . . . . . . . . . . . . . . . . . . . . . . . . . . . . . . . . . . . . . . . . . . . . . . . . . . . . . . . . 46.1 46.8Income taxes . . . . . . . . . . . . . . . . . . . . . . . . . . . . . . . . . . . . . . . . . . . . . . . . . . . . . . . . . . . . . . . 134.5 131.7Depreciation and amortization . . . . . . . . . . . . . . . . . . . . . . . . . . . . . . . . . . . . . . . . . . . . . . . . 89.4 83.2Specified items(1) . . . . . . . . . . . . . . . . . . . . . . . . . . . . . . . . . . . . . . . . . . . . . . . . . . . . . . . . . . . . 1.3 2.2Non-cash items(2) . . . . . . . . . . . . . . . . . . . . . . . . . . . . . . . . . . . . . . . . . . . . . . . . . . . . . . . . . . . 18.9 6.1
Adjusted EBITDA . . . . . . . . . . . . . . . . . . . . . . . . . . . . . . . . . . . . . . . . . . . . . . . . . . . . . . . . . . . $704.7 $623.5
(1) Specified items for the 12 months ended December 31, 2014 of $1.3 million consist of restructuring chargesrelated to the Fragrance Ingredients Rationalization. Specified items for the 12 months ended December 31,2013 of $2.2 million consist of restructuring charges related to the 2011 Strategic Initiative.
(2) Non-cash items, defined as part of Adjusted EBITDA in the terms of the Company’s New Facility agreement,represent all other adjustments to reconcile net income to net cash provided by operations as presented onthe Statement of Cash Flows, including gain on disposal of assets, stock-based compensation and pensionsettlement/curtailment.
December 31,
(DOLLARS IN MILLIONS) 2014 2013
Total debt . . . . . . . . . . . . . . . . . . . . . . . . . . . . . . . . . . . . . . . . . . . . . . . . . . . . . . . . . . . . . . . . $ 942.3 $ 932.8Adjustments:
Deferred gain on interest rate swaps . . . . . . . . . . . . . . . . . . . . . . . . . . . . . . . . . . . . . . . (5.2) (7.1)Cash and cash equivalents . . . . . . . . . . . . . . . . . . . . . . . . . . . . . . . . . . . . . . . . . . . . . . . (478.6) (405.5)
Net debt . . . . . . . . . . . . . . . . . . . . . . . . . . . . . . . . . . . . . . . . . . . . . . . . . . . . . . . . . . . . . . . . . . $ 458.5 $ 520.2
Senior Notes
Senior Notes — 2013. In April 2013, we issued $300.0 million face amount of 3.20% Senior Notes (“SeniorNotes — 2013”) due 2023 at a discount of $0.3 million, to take advantage of attractive borrowing rates andmaintain efficiency and flexibility in our capital structure, and received proceeds of $297.8 million. The SeniorNotes -2013 bear interest at a rate of 3.20% per year, with interest payable on May 1 and November 1 of eachyear, commencing on November 1, 2013. See Note 8 to the Consolidated Financial Statements for furtherinformation on the Senior Notes — 2013.
43

Senior Notes — 2007. In September 2007, we issued an aggregate of $500.0 million of senior unsecurednotes in four series, with $250.0 million due in 2017, $100.0 million due in 2019, $50 million due in 2022 and$100.0 million due in 2027. See Note 8 to the Consolidated Financial Statements for further information on theSenior Notes — 2007.
Senior Notes — 2006. In 2006, we issued an aggregate of $375.0 million of senior unsecured notes in fourseries, of which $250.0 million has been repaid, and the remaining $125.0 million is due in 2016. See Note 8 tothe Consolidated Financial Statements for further information on the Senior Notes — 2013.
Other Commitments
Compliance with existing governmental requirements regulating the discharge of materials into theenvironment has not materially affected our operations, earnings or competitive position. In 2014 and 2013, wespent $4.3 million and $1.7 million on capital projects and $19.2 million and $18.9 million, respectively, inoperating expenses and governmental charges for the purpose of complying with such regulations. Expendituresfor these purposes will continue for the foreseeable future. In addition, we are party to a number of proceedingsbrought under the Comprehensive Environmental Response, Compensation and Liability Act or similar statestatutes. It is expected that the impact of any judgments in or voluntary settlements of such proceedings will notbe material to our financial condition, results of operations or liquidity.
CONTRACTUAL OBLIGATIONS
At December 31, 2014, we had contractual payment obligations due within the time periods as specified inthe following table:
Payments Due
Contractual Obligations(Dollars In Millions) Total 2015 2016-2017 2018-2019
2020 andthereafter
Borrowings(1) . . . . . . . . . . . . . . . . . . . . . . . . . . . . . . . . . . . . . . . . $ 925 $— $375 $100 $450Interest on borrowings(1) . . . . . . . . . . . . . . . . . . . . . . . . . . . . . . . 275 49 83 50 93Operating leases(2) . . . . . . . . . . . . . . . . . . . . . . . . . . . . . . . . . . . . 249 29 48 38 134Pension funding obligations(3) . . . . . . . . . . . . . . . . . . . . . . . . . . . 60 20 40 — —Postretirement obligations(4) . . . . . . . . . . . . . . . . . . . . . . . . . . . . 114 5 11 12 86Purchase commitments(5) . . . . . . . . . . . . . . . . . . . . . . . . . . . . . . 110 44 63 3 —
Total . . . . . . . . . . . . . . . . . . . . . . . . . . . . . . . . . . . . . . . . . . . . . . $1,733 $147 $620 $203 $763
(1) See Note 8 to the Consolidated Financial Statements for a further discussion of our various borrowingfacilities.
(2) Operating leases include facility and other lease commitments executed in the normal course of thebusiness, including sale leaseback obligations included in Note 7 of the Notes to the Consolidated FinancialStatements. Further details concerning worldwide aggregate operating leases are contained in Note 17 of theNotes to the Consolidated Financial Statements.
(3) See Note 13 to the Consolidated Financial Statements for a further discussion of our retirement plans.Anticipated funding obligations are based on current actuarial assumptions. The projected contributionsbeyond fiscal year 2017 are not currently determinable.
(4) Amounts represent expected future benefit payments for our postretirement benefit plans.(5) Purchase commitments include agreements for raw material procurement and contractual capital
expenditures. Amounts for purchase commitments represent only those items which are based onagreements that are enforceable and legally binding.
The table above does not include $23.1 million of the total unrecognized tax benefits for uncertain tax positionsand approximately $2.2 million of associated accrued interest, of which $1.2 million is expected to be paid in the next12 months. Due to the high degree of uncertainty regarding the timing of potential cash flows, the Company is unableto make a reasonable estimate of the amount and period in which the remaining liabilities might be paid.
44

Critical Accounting Policies and Use of Estimates
Our significant accounting policies are more fully described in Note 1 to the Consolidated FinancialStatements. As disclosed in Note 1, the preparation of financial statements in conformity with U.S. generallyaccepted accounting principles (“GAAP”) requires management to make estimates and assumptions that affectreported amounts and accompanying disclosures. These estimates are based on management’s best judgment ofcurrent events and actions that we may undertake in the future. Actual results may ultimately differ from estimates.
Those areas requiring the greatest degree of management judgment or deemed most critical to our financialreporting involve:
The periodic assessment of potential impairment of intangible assets acquired in business combinations. Wecurrently have net intangible assets, including goodwill, of $752.0 million. In assessing the potential forimpairment of goodwill, management uses the most current actual and forecasted operating data available andcurrent market based assumptions in accordance with the criteria in ASC 350. In 2012, the Company re-evaluated its reporting unit structure and identified three reporting units: (1) Flavors, (2) Fragrance Compoundsand (3) Fragrance Ingredients. Prior to 2012, the Company had identified two reporting units, Flavors andFragrances. As a result, in 2012 the Company reallocated the goodwill previously allocated to its Fragrancesreporting unit to its Fragrance Compounds and Fragrance Ingredients reporting units.
The Company performed the annual goodwill impairment test, utilizing the two-step approach for theFlavors, Fragrance Compounds and Fragrance Ingredients reporting units, by assessing the fair value of ourreporting units based on discounted cash flows. We completed our annual goodwill impairment test as ofNovember 30, 2014, which indicated no impairment of goodwill, as the estimated fair values substantiallyexceeded the carrying values of each of these reporting units.
The analysis and evaluation of income taxes.We account for taxes under the asset and liability method. Underthis method, deferred income taxes are recognized for temporary differences between the financial statement andtax return bases of assets and liabilities. A valuation allowance is recognized if, based on the weight of availableevidence, it is more likely than not that some portion or all of the deferred tax asset will not be realized. Theassessment of the need for a valuation allowance requires management to make estimates and assumptions aboutfuture earnings, reversal of existing temporary differences and available tax planning strategies. If actual experiencediffers from these estimates and assumptions, the recorded deferred tax asset may not be fully realized resulting inan increase to income tax expense in our results of operations.
The Company has not established deferred tax liabilities for undistributed foreign earnings as it has plans toand intends to indefinitely reinvest those earnings to finance foreign activities. The unrecognized deferred taxliability on these undistributed earnings approximates $219 million.
We are subject to income taxes in the U.S. and numerous foreign jurisdictions. Significant judgment isrequired in evaluating our uncertain tax positions and determining our provision for income taxes. We firstdetermine whether it is “more likely than not” that we would sustain our tax position if the relevant tax authoritywere to audit the position with full knowledge of all the relevant facts and other information. For those taxpositions that meet this threshold, we measure the amount of tax benefit based on the largest amount of taxbenefit that we have a greater than 50% chance of realizing in a final settlement with the relevant authority.Those tax positions failing to qualify for initial recognition are recognized in the first interim period in whichthey meet the more likely than not standard. This evaluation is made at the time that we adopt a tax position andwhenever there is new information and is based upon management’s evaluation of the facts, circumstances andinformation available at the reporting date. We maintain a cumulative risk portfolio relating to all of ouruncertainties in income taxes in order to perform this analysis, but the evaluation of our tax positions requiressignificant judgment and estimation in part because, in certain cases, tax law is subject to varied interpretation,and whether a tax position will ultimately be sustained may be uncertain. We do not currently believe that any ofour pending tax assessments, even if ultimately resolved against us, would have a material impact on our resultsof operations and cash flows.
45

The evaluation of potential litigation and environmental liabilities, where changing circumstances, rulesand regulations require regular reassessment of related practices and anticipated costs. We are subject to certainlegal claims regarding products and other matters, as well as environmental-related matters. Significantmanagement judgment is involved in determining when it is probable that a liability has been incurred and theextent to which it can be reasonably estimated.
We regularly assess potential liabilities with respect to all legal claims based on the most recent availableinformation, in consultation with outside counsel we have engaged on our behalf to handle the defense of suchmatters. To the extent a liability is considered to be probable and reasonably estimable, we recognize acorresponding liability; if the reasonably estimated liability is a range, we recognize that amount considered mostlikely, or in the absence of such a determination, the minimum reasonably estimated liability. To the extent suchclaims are covered by various insurance policies, we separately evaluate the right to recovery and estimate therelated insurance claim receivable. Management judgments involve determination as to whether a liability hasbeen incurred, the reasonably estimated amount of that liability, and any potential insurance recovery.
We regularly evaluate potential environmental exposure in terms of total estimated cost and the viability ofother potentially responsible parties (“PRP’s”) associated with our exposure. Recorded liabilities are adjustedperiodically as remediation efforts progress and additional information becomes available. Critical managementassumptions relate to expected total costs to remediate and the financial viability of PRP’s to share such costs.
Determination of the various assumptions employed in the valuation of pension and retiree health careexpense and associated obligations. Amounts recognized in the Consolidated Financial Statements related topension and other postretirement benefits are determined from actuarial valuations. Inherent in such valuationsare assumptions including expected return on plan assets, discount rates at which the liabilities could be settled,rates of increase in future compensation levels, mortality rates and health care cost trend rates. Theseassumptions are updated annually and are disclosed in Note 13 to the Consolidated Financial Statements. Inaccordance with GAAP, actual results that differ from the assumptions are accumulated and amortized overfuture periods and, therefore, affect expense recognized and obligations recorded in future periods.
We consider a number of factors in determining and selecting assumptions for the overall expected long-term rate of return on plan assets. We consider the historical long-term return experience of our assets, thecurrent and expected allocation of our plan assets, and expected long-term rates of return. We derive theseexpected long-term rates of return with the assistance of our investment advisors. We base our expectedallocation of plan assets on a diversified portfolio consisting of domestic and international equity securities, fixedincome, real estate, and alternative asset classes.
We consider a variety of factors in determining and selecting our assumptions for the discount rate atDecember 31. For the U.S. plans, the discount rate was based on the internal rate of return for a portfolio ofMoody’s Aaa, Aa and Merrill Lynch AAA-AA high quality bonds with maturities that are consistent with theprojected future benefit payment obligations of the plan. The rate of compensation increase for all plans and themedical cost trend rate for the applicable U.S. plans are based on plan experience.
With respect to the U.S. plans, the expected rate of return on plan assets was determined based on an assetallocation model using the current target allocation, real rates of return by asset class and an anticipated inflationrate. The target asset allocation consists of approximately: 40% in equity securities and 60% in fixed incomesecurities. The plan has achieved a compounded annual rate of return of 8.0% over the previous 20 years. AtDecember 31, 2014, the actual asset allocation was: 40% in equity securities; 59% in fixed income securities; and1% in cash equivalents.
The expected rate of return for the non-U.S. plans employs a similar set of criteria adapted for localinvestments, inflation rates and in certain cases specific government requirements. The target asset allocation, forthe non-U.S. plans, consists of approximately: 40% – 60% in fixed income securities; 20%— 40% in equitysecurities; 5%— 20% in real estate; and 5%— 10% in alternative investments. At December 31, 2014, the actualasset allocation was: 62% in fixed income investments; 26% in equity investments; 7% in real estate investments;4% in alternative investments and 1% in cash and cash equivalents.
46

Changes in pension and other post-employment benefits, and associated expenses, may occur in the futuredue to changes in these assumptions. The impact that a 0.25% decrease in the discount rate or a 1% change in themedical cost trend rate would have on our pension and other post-employment benefit expense, as applicable, isas follows:
Sensitivity of Disclosures to Changes in Selected Assumptions
25 BP Decrease inDiscount Rate
25 BP Decrease inDiscount Rate
25 BP Decrease inLong-Term Rate
of Return
(DOLLARS IN THOUSANDS)Change in
PBOChange in
ABOChange in
pension expenseChange in
pension expense
U.S. Pension Plans . . . . . . . . . . . . . . . . . . . . . . . . . . . . . $19,983 $19,609 $1,304 $1,043Non-U.S. Pension Plans . . . . . . . . . . . . . . . . . . . . . . . . . $47,377 $45,329 $2,783 $2,115Postretirement Benefit Plan . . . . . . . . . . . . . . . . . . . . . . N/A $ 3,745 $ 215 N/A
The effect of a 1% increase in the medical cost trend rate would increase the accumulated postretirementbenefit obligation and the annual postretirement expense by approximately $6.9 million and $0.3 million,respectively; a 1% decrease in the rate would decrease the obligation and expense by approximately $6.7 millionand $0.3 million, respectively.
The ongoing assessment of the valuation of inventory, given the large number of natural ingredientsemployed, the quality of which may be diminished over time. We hold a majority of our inventory as rawmaterials, providing the greatest degree of flexibility in manufacture and use. As of December 31, 2014, wemaintained 48% of our inventory as raw materials. Materials are evaluated based on shelf life, known uses andanticipated demand based on forecasted customer order activity and changes in product/sales mix. Managementpolicy provides for an ongoing assessment of inventory with adjustments recorded when an item is deemed to beslow moving or obsolete.
We believe that we have considered relevant circumstances that we may be currently subject to, and thefinancial statements accurately reflect our best estimate of the impact of these items in our results of operations,financial condition and cash flows for the years presented. We have discussed the decision process and selectionof these critical accounting policies with the Audit Committee of the Board of Directors.
New Accounting Standards
In March 2013, the Financial Accounting Standards Board (“FASB”) issued authoritative guidanceclarifying the accounting for the release of cumulative translation adjustments into net income when a parenteither sells a part or all of its investment in a foreign entity or no longer holds a controlling financial interest in asubsidiary or group of assets that is a nonprofit activity or a business within a foreign entity. The guidance waseffective prospectively for reporting periods beginning after December 15, 2013. The adoption of this statementdid not have an impact on our financial position, results of operations or cash flows.
In July 2013, the FASB issued authoritative guidance related to the financial statement presentation ofunrecognized tax benefits. This update clarifies that an unrecognized tax benefit, or a portion of an unrecognized taxbenefit, should be presented in the financial statements as a reduction to a deferred tax asset for a net operating losscarryforward, a similar tax loss, or a tax credit carryforward, except to the extent a net operating loss carryforward, asimilar tax loss, or a tax credit carryforward is not available at the reporting date under the tax law of the applicablejurisdiction to settle any additional income taxes that would result from the disallowance of a tax position or the taxlaw of the applicable jurisdiction does not require the entity to use, and the entity does not intend to use, the deferredtax asset for such purpose. In such situations, the unrecognized tax benefit should be presented in the financialstatements as a liability and should not be combined with deferred tax assets. The guidance was effectiveprospectively for reporting periods beginning after December 15, 2013. The adoption of this statement did not havea significant impact on our financial position, results of operations or cash flows.
47

In May 2014, the FASB issued authoritative guidance to clarify the principles to be used to recognizerevenue. The guidance is applicable to all entities and is effective for annual and interim periods beginning afterDecember 15, 2016. Early adoption is not permitted. The Company is currently evaluating the impact that thisnew standard will have on its consolidated financial statements.
Non-GAAP Financial Measures
The Company uses non-GAAP financial operating measures in this Annual Report, including: (i) localcurrency sales (which eliminates the effects that result from translating its international sales in U.S. dollars),(ii) like-for-like sales (which eliminated the effects of local currency and the strategic decision to exit certain lowmargin sales in 2013), (iii) adjusted operating profit and operating profit margin (which excludes the operationalimprovement initiative and restructuring charges), (iv) adjusted effective tax rate (which excludes the sale of anon-operating assets, tax and litigation settlements, restructuring charges and operational improvement initiativecosts) and (v) adjusted cash flows from operations (which excludes the Spanish tax payments made and the year-over-year incremental pension contribution). The Company also provides the non-GAAP measures adjustedEBITDA (which excludes certain specified items and non-cash items as set forth in the Company’s debtagreements) and net debt (which is adjusted for deferred gain on interest rate swaps and cash and cashequivalents) solely for the purpose of providing information regarding the Company’s compliance with debtcovenants contained in its debt agreements.
We have included each of these non-GAAP measures in order to provide additional information regardingour underlying operating results and comparable year-over-year performance. Such information is supplementalto information presented in accordance with GAAP and is not intended to represent a presentation in accordancewith GAAP. In discussing our historical and expected future results and financial condition, we believe it ismeaningful for investors to be made aware of and to be assisted in a better understanding of, on a period-to-period comparable basis, financial amounts both including and excluding these identified items, as well as theimpact of exchange rate fluctuations and the exit of certain low margin sales activities on operating results andfinancial condition. We believe such additional non-GAAP information provides investors with an overallperspective of the period-to-period performance of our business. In addition, management internally reviewseach of these non-GAAP measures to evaluate performance on a comparative period-to-period basis in terms ofabsolute performance, trends and expected future performance with respect to our business. A material limitationof these non-GAAP measures is that such measures do not reflect actual GAAP amounts; for example, costsassociated with operational improvements and restructuring activities involve actual cash outlays. Wecompensate for such limitations by using these measures as one of several metrics, including GAAP measures.These non-GAAP measures may not be comparable to similarly titled measures used by other companies.
International Flavors & Fragrances Inc.Like-for-Like Flavors Sales Reconciliation
Twelve Months Ended December 31, 2013
ReportedSales
Growth
LocalCurrency
Sales Growth(1)
Exit of LowMargin SalesActivities
Like-for-Like SalesGrowth(2)
Total Company . . . . . . . . . . . . . . . . . . . . . . . . . . . . . . . . . . . . . 5% 5% 1% 6%FlavorsNorth America . . . . . . . . . . . . . . . . . . . . . . . . . . . . . . . . . . . . . . -2% -2% 5% 3%EAME . . . . . . . . . . . . . . . . . . . . . . . . . . . . . . . . . . . . . . . . . . . . 7% 6% 1% 7%Latin America . . . . . . . . . . . . . . . . . . . . . . . . . . . . . . . . . . . . . . 5% 8% 3% 11%Greater Asia . . . . . . . . . . . . . . . . . . . . . . . . . . . . . . . . . . . . . . . . 4% 7% 0% 7%Total . . . . . . . . . . . . . . . . . . . . . . . . . . . . . . . . . . . . . . . . . . . . . . 3% 4% 2% 6%
(1) Local currency sales growth is calculated by translating prior year sales at the exchange rates used for the corresponding 2013 period.(2) Like-for-like is a non-GAAP metric that excludes the impact of exiting low margin sales activities and foreign exchange.
48

Cautionary Statement Under the Private Securities Litigation Reform Act of 1995
Statements in this Annual Report, which are not historical facts or information, are “forward-lookingstatements” within the meaning of The Private Securities Litigation Reform Act of 1995. Such forward-lookingstatements are based on management’s current assumptions, estimates and expectations and include statementsconcerning (i) our ability to achieve long-term sustainable growth and increase shareholder value, (ii) growthpotential in the emerging markets, (iii) our ability to generate returns above cost of capital, (iv) our competitiveposition in the market and expected financial results in 2015, and (v) expected capital expenditures and costpressures in 2015. These forward-looking statements should be evaluated with consideration given to the manyrisks and uncertainties inherent in the Company’s business that could cause actual results and events to differmaterially from those in the forward-looking statements. Certain of such forward-looking information may beidentified by such terms as “expect”, “anticipate”, “believe”, “outlook”, “may”, “estimate”, “should” and“predict” similar terms or variations thereof. Such forward-looking statements are based on a series ofexpectations, assumptions, estimates and projections about the Company, are not guarantees of future results orperformance, and involve significant risks, uncertainties and other factors, including assumptions andprojections, for all forward periods. Actual results of the Company may differ materially from any future resultsexpressed or implied by such forward-looking statements. Such factors include, among others, the following:
‰ volatility and increases in the price of raw materials, energy and transportation;
‰ the economic and political risks associated with the Company’s international operations;
‰ the Company’s ability to benefit from its investments and expansion in emerging markets;
‰ fluctuations in the quality and availability of raw materials;
‰ changes in consumer preferences and demand for the Company’s products or decline in consumerconfidence and spending;
‰ the Company’s ability to implement its business strategy, including the achievement of anticipated costsavings, profitability, realization of price increases and growth targets;
‰ the Company’s ability to successfully develop new and competitive products that appeal to its customersand consumers;
‰ the impact of a disruption in the Company’s supply chain or its relationship with its suppliers;
‰ the Company’s ability to successfully manage inventory and working capital;
‰ the effects of any unanticipated costs and construction or start-up delays in the expansion of any of theCompany’s facilities;
‰ the impact of currency fluctuations or devaluations in the Company’s principal foreign markets;
‰ any adverse impact on the availability, effectiveness and cost of the Company’s hedging and riskmanagement strategies;
‰ uncertainties regarding the outcome of, or funding requirements, related to litigation or settlement ofpending litigation, uncertain tax positions or other contingencies;
‰ the impact of possible pension funding obligations and increased pension expense, particularly as a resultof changes in asset returns or discount rates, on the Company’s cash flow and results of operations;
‰ the Company’s ability to optimize its manufacturing facilities, including the achievement of expected costsavings and increased efficiencies;
‰ the effect of legal and regulatory proceedings, as well as restrictions imposed on the Company, itsoperations or its representatives by U.S. and foreign governments;
‰ adverse changes in federal, state, local and foreign tax legislation or adverse results of tax audits,assessments, or disputes;
49

‰ the ability of the Company to attract and retain talented employees;
‰ the direct and indirect costs and other financial impact that may result from any business disruptions dueto political instability, armed hostilities, incidents of terrorism, natural disasters, or the responses to orrepercussion from any of these or similar events or conditions;
‰ the Company’s ability to quickly and effectively implement its disaster recovery and crisis managementplans; and
‰ adverse changes due to accounting rules or regulations.
The foregoing list of important factors does not include all such factors, nor necessarily present them inorder of importance. In addition, you should consult other disclosures made by the Company (such as in ourother filings with the Securities and Exchange Commission (“SEC”) or in company press releases) for otherfactors that may cause actual results to differ materially from those projected by the Company. Please refer toPart I. Item 1A., Risk Factors, of this 2014 Form 10-K for additional information regarding factors that couldaffect the Company’s results of operations, financial condition and liquidity.
The Company intends its forward-looking statements to speak only as of the time of such statements anddoes not undertake or plan to update or revise them as more information becomes available or to reflect changesin expectations, assumptions or results. The Company can give no assurance that such expectations or forward-looking statements will prove to be correct. An occurrence of, or any material adverse change in, one or more ofthe risk factors or risks and uncertainties referred to in this report or included in our other periodic reports filedwith the SEC could materially and adversely impact our operations and our future financial results.
Any public statements or disclosures by IFF following this report that modify or impact any of the forward-looking statements contained in or accompanying this report will be deemed to modify or supersede such outlookor other forward-looking statements in or accompanying this report.
50

ITEM 7A. QUANTITATIVE AND QUALITATIVE DISCLOSURES ABOUTMARKET RISK.
We operate on a global basis and are exposed to currency fluctuation related to the manufacture and sale ofour products in currencies other than the U.S. dollar. The major foreign currencies involve the markets in theEuropean Union, Great Britain, Mexico, Brazil, China, India, Indonesia, Australia and Japan, although all regionsare subject to foreign currency fluctuations versus the U.S. dollar. We actively monitor our foreign currencyexposures in all major markets in which we operate, and employ a variety of techniques to mitigate the impact ofexchange rate fluctuations, including foreign currency hedging activities.
We have established a centralized reporting system to evaluate the effects of changes in interest rates,currency exchange rates and other relevant market risks. Our risk management procedures include the monitoringof interest rate and foreign exchange exposures and hedge positions utilizing statistical analyses of cash flows,market value and sensitivity analysis. However, the use of these techniques to quantify the market risk of suchinstruments should not be construed as an endorsement of their accuracy or the accuracy of the relatedassumptions. For the year ended December 31, 2014, the Company’s exposure to market risk was estimatedusing sensitivity analyses, which illustrate the change in the fair value of a derivative financial instrumentassuming hypothetical changes in foreign exchange rates and interest rates.
We enter into foreign currency forward contracts with the objective of reducing exposure to cash flowvolatility associated with foreign currency receivables and payables, and with anticipated purchases of certainraw materials used in operations. These contracts, the counterparties to which are major international financialinstitutions, generally involve the exchange of one currency for a second currency at a future date, and havematurities not exceeding twelve months. The gain or loss on the hedging instrument and services is recorded inearnings at the same time as the transaction being hedged is recorded in earnings. At December 31, 2014, theCompany’s foreign currency exposures pertaining to derivative contracts exist with the Euro, Japanese Yen,South African Rand, and Chinese Renminbi. Based on a hypothetical decrease or increase of 10% in theapplicable balance sheet exchange rates (primarily against the U.S. dollar), the estimated fair value of theCompany’s foreign currency forward contracts would increase or decrease by approximately $25 million.However, any change in the value of the contracts, real or hypothetical, would be significantly offset by acorresponding change in the value of the underlying hedged items.
We have also used non-U.S. dollar borrowings and foreign currency forward contracts, to hedge the foreigncurrency exposures of our net investment in certain foreign subsidiaries, primarily in the European Union. Basedon a hypothetical decrease or increase of 10% in the value of the U.S. dollar against the Euro, the estimated fairvalue of the Company’s foreign currency forward contracts would change by approximately $4 million.However, any change in the value of the contracts, real or hypothetical, would be significantly offset by acorresponding change in the value of the underlying hedged items.
We use derivative instruments as part of our interest rate risk management strategy. The derivativeinstruments used are comprised principally of fixed to variable rate interest rate swaps based on the LIBOR plusan interest mark up. The notional amount, interest payment and maturity date of the swaps match the principal,interest payment and maturity date of the related debt and the swaps are valued using observable benchmarkrates. Based on a hypothetical decrease or increase of one percentage point in LIBOR, the estimated fair value ofthe Company’s interest rate swaps would change by less than $10 million.
At December 31, 2014, the fair value of our fixed rate debt was $1 billion. Based on a hypothetical decreaseof 10% in interest rates, the estimated fair value of the Company’s fixed debt would increase by $8 million.
We purchase certain commodities, such as natural gas, electricity, petroleum based products and certaincrop related items. We generally purchase these commodities based upon market prices that are established withthe vendor as part of the purchase process. In general, we do not use commodity financial instruments to hedgecommodity prices.
51

ITEM 8. FINANCIAL STATEMENTS AND SUPPLEMENTARY DATA.
See index to Consolidated Financial Statements on page 54. See Item 6 on page 26 for supplementalquarterly data.
ITEM 9. CHANGES IN AND DISAGREEMENTSWITH ACCOUNTANTS ON ACCOUNTING ANDFINANCIAL DISCLOSURE.
None.
ITEM 9A. CONTROLS AND PROCEDURES.
Evaluation of Disclosure Controls and Procedures and Changes in Internal Control over FinancialReporting.
Our Chief Executive Officer and Chief Financial Officer, with the assistance of other members of ourmanagement, have evaluated the effectiveness of our disclosure controls and procedures as of the end of theperiod covered by this Annual Report on Form 10-K. Based on such evaluation, our Chief Executive Officer andChief Financial Officer have concluded that our disclosure controls and procedures are effective as of the end ofthe period covered by this Annual Report on Form 10-K.
We have established controls and procedures designed to ensure that information required to be disclosed inthe reports that we file or submit under the Exchange Act is recorded, processed, summarized and reported withinthe time periods specified in the Commission’s rules and forms and is accumulated and communicated tomanagement, including the principal executive officer and the principal financial officer, to allow timelydecisions regarding required disclosure.
Our Chief Executive Officer and Chief Financial Officer have concluded that there have not been anychanges in our internal control over financial reporting during the fourth quarter that have materially affected, orare reasonably likely to materially affect, our internal control over financial reporting.
Management’s Report on Internal Control Over Financial Reporting.
Our management is responsible for establishing and maintaining adequate internal control over financialreporting as defined in Rules 13a-15(f) and 15d-15(f) under the Securities Exchange Act of 1934. Our internalcontrol over financial reporting is a process designed to provide reasonable assurance regarding the reliability offinancial reporting and the preparation of financial statements for external purposes in accordance with generallyaccepted accounting principles.
Because of its inherent limitations, internal control over financial reporting may not prevent or detectmisstatements. Also, projections of any evaluation of effectiveness to future periods are subject to the risk thatcontrols may become inadequate because of changes in conditions, or that the degree of compliance with thepolicies or procedures may deteriorate.
Management assessed the effectiveness of our internal control over financial reporting as of December 31,2014. In making this assessment, management used the criteria set forth by the Committee of SponsoringOrganizations of the Treadway Commission (“COSO”) in its 2013 Internal Control — Integrated Framework.
Based on this assessment, management determined that, as of December 31, 2014, our internal control overfinancial reporting was effective.
PricewaterhouseCoopers LLP, our independent registered public accounting firm, has audited theeffectiveness of our internal control over financial reporting as of December 31, 2014 as stated in their reportwhich is included herein.
ITEM 9B. OTHER INFORMATION.
None.
52

PART III
ITEM 10. DIRECTORS, EXECUTIVE OFFICERS AND CORPORATE GOVERNANCE.
The information relating to directors and nominees of the Company is set forth in the IFF 2015 ProxyStatement and is incorporated by reference herein. The information relating to Section 16(a) beneficial ownershipreporting compliance that appears in the IFF 2015 Proxy Statement is also incorporated by reference herein. SeePart I, Item 1 of this Form 10-K for information relating to the Company’s Executive Officers.
We have adopted a Code of Business Conduct and Ethics (the “Code of Ethics”) that applies to all of ouremployees, including our chief executive officer and our chief financial officer (who is also our principalaccounting officer). We have also adopted a Code of Conduct for Directors and a Code of Conduct for ExecutiveOfficers (together with the Code of Ethics, the “Codes”). The Codes are available through the Investors —Corporate Governance link on our website www.iff.com.
Only the Board of Directors or the Audit Committee of the Board may grant a waiver from any provision ofour Codes in favor of a director or executive officer, and any such waiver will be publicly disclosed. We willdisclose substantive amendments to and any waivers from the Codes provided to our chief executive officer andprincipal financial officer (principal accounting officer), as well as any other executive officer or director, on theCompany’s website: www.iff.com.
The information regarding the Company’s Audit Committee and its designated audit committee financialexperts is set forth in the IFF 2015 Proxy Statement and such information is incorporated by reference herein.
The information concerning procedures by which shareholders may recommend director nominees is setforth in the IFF 2015 Proxy Statement and such information is incorporated by reference herein.
ITEM 11. EXECUTIVE COMPENSATION.
The information relating to executive compensation and the Company’s policies and practices as they relateto the Company’s risk management is set forth in the IFF 2015 Proxy Statement and such information isincorporated by reference herein; except that the information under the caption “Compensation CommitteeReport” shall be deemed “furnished” with this report and shall not be deemed “filed” with this report, notdeemed incorporated by reference into any filing under the Securities Act of 1933 except only as may beexpressly set forth in any such filing by specific reference.
ITEM 12. SECURITY OWNERSHIP OF CERTAIN BENEFICIAL OWNERS ANDMANAGEMENTAND RELATED STOCKHOLDERMATTERS.
The information relating to security ownership of management, certain beneficial owners and theCompany’s equity plans is set forth in the IFF 2015 Proxy Statement and such information is incorporated byreference herein.
ITEM 13. CERTAIN RELATIONSHIPS AND RELATED TRANSACTIONS, AND DIRECTORINDEPENDENCE.
The information regarding certain relationships and related party transactions and director independence isset forth in the IFF 2015 Proxy Statement and such information is incorporated by reference herein.
ITEM 14. PRINCIPAL ACCOUNTANT FEES AND SERVICES.
The information regarding the independent registered public accounting firm (“independent accountant”)fees and services and the Company’s pre-approval policies and procedures for audit and non-audit servicesprovided by the Company’s independent accountant are set forth in the IFF 2015 Proxy Statement and suchinformation is incorporated by reference herein.
53

PART IV
ITEM 15. EXHIBITS AND FINANCIAL STATEMENT SCHEDULES.
(a)(1) FINANCIAL STATEMENTS: The following consolidated financial statements, related notes, andindependent registered public accounting firm’s report are included in this report on Form 10-K:
Report of Independent Registered Public Accounting Firm . . . . . . . . . . . . . . . . . . . . . . . . . . . . . . . . . . . . . . . 55Consolidated Statement of Income and Comprehensive Income for the three years ended December 31,2014, 2013 and 2012 . . . . . . . . . . . . . . . . . . . . . . . . . . . . . . . . . . . . . . . . . . . . . . . . . . . . . . . . . . . . . . . . . . . 56
Consolidated Balance Sheet as of December 31, 2014 and 2013 . . . . . . . . . . . . . . . . . . . . . . . . . . . . . . . . . . . 57Consolidated Statement of Cash Flows for the three years ended December 31, 2014, 2013 and 2012 . . . . . 58Consolidated Statement of Shareholders’ Equity . . . . . . . . . . . . . . . . . . . . . . . . . . . . . . . . . . . . . . . . . . . . . . . 59Notes to Consolidated Financial Statements . . . . . . . . . . . . . . . . . . . . . . . . . . . . . . . . . . . . . . . . . . . . . . . . . . . 60
(a)(2) FINANCIAL STATEMENT SCHEDULES
Schedule II — Valuation and Qualifying Accounts and Reserves for the three years ended December 31,2014, 2013 and 2012 . . . . . . . . . . . . . . . . . . . . . . . . . . . . . . . . . . . . . . . . . . . . . . . . . . . . . . . . . . . . . . . . . . . S-1
All other schedules are omitted because they are not applicable or the required information is shown in thefinancial statements or notes thereto.
54

REPORT OF INDEPENDENT REGISTERED PUBLIC ACCOUNTING FIRM
To the Board of Directors and Shareholders of International Flavors & Fragrances Inc.:
In our opinion, the consolidated financial statements listed in the index appearing under item 15(a)(1)present fairly, in all material respects, the financial position of International Flavors & Fragrances Inc. and itssubsidiaries at December 31, 2014 and December 31, 2013, and the results of their operations and their cashflows for each of the three years in the period ended December 31, 2014 in conformity with accounting principlesgenerally accepted in the United States of America. In addition, in our opinion, the financial statement schedulelisted in the index appearing under Item 15(a)(2) presents fairly, in all material respects, the information set forththerein when read in conjunction with the related consolidated financial statements. Also in our opinion, theCompany maintained, in all material respects, effective internal control over financial reporting as ofDecember 31, 2014, based on criteria established in 2013 Internal Control — Integrated Framework issued bythe Committee of Sponsoring Organizations of the Treadway Commission (COSO). The Company’smanagement is responsible for these financial statements and financial statement schedule, for maintainingeffective internal control over financial reporting and for its assessment of the effectiveness of internal controlover financial reporting, included in Management’s Report on Internal Control Over Financial Reporting,appearing under Item 9A. Our responsibility is to express opinions on these financial statements, on the financialstatement schedule, and on the Company’s internal control over financial reporting based on our integratedaudits. We conducted our audits in accordance with the standards of the Public Company Accounting OversightBoard (United States). Those standards require that we plan and perform the audits to obtain reasonableassurance about whether the financial statements are free of material misstatement and whether effective internalcontrol over financial reporting was maintained in all material respects. Our audits of the financial statementsincluded examining, on a test basis, evidence supporting the amounts and disclosures in the financial statements,assessing the accounting principles used and significant estimates made by management, and evaluating theoverall financial statement presentation. Our audit of internal control over financial reporting included obtainingan understanding of internal control over financial reporting, assessing the risk that a material weakness exists,and testing and evaluating the design and operating effectiveness of internal control based on the assessed risk.Our audits also included performing such other procedures as we considered necessary in the circumstances. Webelieve that our audits provide a reasonable basis for our opinions.
A company’s internal control over financial reporting is a process designed to provide reasonable assuranceregarding the reliability of financial reporting and the preparation of financial statements for external purposes inaccordance with generally accepted accounting principles. A company’s internal control over financial reportingincludes those policies and procedures that (i) pertain to the maintenance of records that, in reasonable detail,accurately and fairly reflect the transactions and dispositions of the assets of the company; (ii) provide reasonableassurance that transactions are recorded as necessary to permit preparation of financial statements in accordancewith generally accepted accounting principles, and that receipts and expenditures of the company are being madeonly in accordance with authorizations of management and directors of the company; and (iii) provide reasonableassurance regarding prevention or timely detection of unauthorized acquisition, use, or disposition of thecompany’s assets that could have a material effect on the financial statements.
Because of its inherent limitations, internal control over financial reporting may not prevent or detectmisstatements. Also, projections of any evaluation of effectiveness to future periods are subject to the risk thatcontrols may become inadequate because of changes in conditions, or that the degree of compliance with thepolicies or procedures may deteriorate.
/s/ PricewaterhouseCoopers LLP
New York, New YorkMarch 2, 2015
55

INTERNATIONAL FLAVORS & FRAGRANCES INC.
CONSOLIDATED STATEMENT OF INCOME AND COMPREHENSIVE INCOME
Year Ended December 31,
(DOLLARS IN THOUSANDS EXCEPT PER SHARE AMOUNTS) 2014 2013 2012
Net sales . . . . . . . . . . . . . . . . . . . . . . . . . . . . . . . . . . . . . . . . . . . . . . . . . . $3,088,533 $2,952,896 $2,821,446Cost of goods sold . . . . . . . . . . . . . . . . . . . . . . . . . . . . . . . . . . . . . . . . . . . 1,726,383 1,668,691 1,645,912
Gross profit . . . . . . . . . . . . . . . . . . . . . . . . . . . . . . . . . . . . . . . . . . . . . . . . 1,362,150 1,284,205 1,175,534Research and development expenses . . . . . . . . . . . . . . . . . . . . . . . . . . . . 253,640 259,838 233,713Selling and administrative expenses . . . . . . . . . . . . . . . . . . . . . . . . . . . . . 514,891 505,877 453,535Restructuring and other charges, net . . . . . . . . . . . . . . . . . . . . . . . . . . . . . 1,298 2,151 1,668
Operating profit . . . . . . . . . . . . . . . . . . . . . . . . . . . . . . . . . . . . . . . . . . . . . 592,321 516,339 486,618Interest expense . . . . . . . . . . . . . . . . . . . . . . . . . . . . . . . . . . . . . . . . . . . . . 46,067 46,767 41,753Other (income) expense, net . . . . . . . . . . . . . . . . . . . . . . . . . . . . . . . . . . . (2,807) (15,638) 1,450
Income before taxes . . . . . . . . . . . . . . . . . . . . . . . . . . . . . . . . . . . . . . . . . 549,061 485,210 443,415Taxes on income . . . . . . . . . . . . . . . . . . . . . . . . . . . . . . . . . . . . . . . . . . . . 134,518 131,666 189,281
Net income . . . . . . . . . . . . . . . . . . . . . . . . . . . . . . . . . . . . . . . . . . . . . . . . 414,543 353,544 254,134
Other comprehensive income (loss):Foreign currency translation adjustments . . . . . . . . . . . . . . . . . . . . . . . . . (69,064) (10,556) 17,687Gains (losses) on derivatives qualifying as hedges . . . . . . . . . . . . . . . . . . 16,383 (3,794) (4,455)Pension and postretirement liability adjustment . . . . . . . . . . . . . . . . . . . . (95,038) 25,264 (41,548)
Comprehensive income . . . . . . . . . . . . . . . . . . . . . . . . . . . . . . . . . . . . . . . $ 266,824 $ 364,458 $ 225,818
2014 2013 2012
Net income per share — basic . . . . . . . . . . . . . . . . . . . . . . . . . . . . . . . . . . $ 5.09 $ 4.32 $ 3.11Net income per share — diluted . . . . . . . . . . . . . . . . . . . . . . . . . . . . . . . . $ 5.06 $ 4.29 $ 3.09
See Notes to Consolidated Financial Statements
56

INTERNATIONAL FLAVORS & FRAGRANCES INC.
CONSOLIDATED BALANCE SHEET
December 31,
(DOLLARS IN THOUSANDS) 2014 2013
ASSETSCurrent Assets:Cash and cash equivalents . . . . . . . . . . . . . . . . . . . . . . . . . . . . . . . . . . . . . . . . . . . . . . . . . . . . . . . . $ 478,573 $ 405,505Receivables:
Trade . . . . . . . . . . . . . . . . . . . . . . . . . . . . . . . . . . . . . . . . . . . . . . . . . . . . . . . . . . . . . . . . . . . . 502,915 534,986Allowance for doubtful accounts . . . . . . . . . . . . . . . . . . . . . . . . . . . . . . . . . . . . . . . . . . . . . . . (9,147) (10,493)
Inventories . . . . . . . . . . . . . . . . . . . . . . . . . . . . . . . . . . . . . . . . . . . . . . . . . . . . . . . . . . . . . . . . . . . . 568,729 533,806Deferred income taxes . . . . . . . . . . . . . . . . . . . . . . . . . . . . . . . . . . . . . . . . . . . . . . . . . . . . . . . . . . . 27,709 40,189Prepaid expenses and other current assets . . . . . . . . . . . . . . . . . . . . . . . . . . . . . . . . . . . . . . . . . . . . 141,248 148,910
Total Current Assets . . . . . . . . . . . . . . . . . . . . . . . . . . . . . . . . . . . . . . . . . . . . . . . . . . . . . . . . . 1,710,027 1,652,903
Property, plant and equipment, net . . . . . . . . . . . . . . . . . . . . . . . . . . . . . . . . . . . . . . . . . . . . . . . . . 720,268 687,215Goodwill . . . . . . . . . . . . . . . . . . . . . . . . . . . . . . . . . . . . . . . . . . . . . . . . . . . . . . . . . . . . . . . . . . . . . . 675,484 665,582Other intangible assets, net . . . . . . . . . . . . . . . . . . . . . . . . . . . . . . . . . . . . . . . . . . . . . . . . . . . . . . . 76,557 30,615Deferred income taxes . . . . . . . . . . . . . . . . . . . . . . . . . . . . . . . . . . . . . . . . . . . . . . . . . . . . . . . . . . . 183,047 154,437Other assets . . . . . . . . . . . . . . . . . . . . . . . . . . . . . . . . . . . . . . . . . . . . . . . . . . . . . . . . . . . . . . . . . . . 129,238 140,979
Total Assets . . . . . . . . . . . . . . . . . . . . . . . . . . . . . . . . . . . . . . . . . . . . . . . . . . . . . . . . . . . . . . . . . . . $ 3,494,621 $ 3,331,731
LIABILITIES AND SHAREHOLDERS’ EQUITYCurrent Liabilities:Bank borrowings, overdrafts and current portion of long-term debt . . . . . . . . . . . . . . . . . . . . . . . . $ 8,090 $ 149Accounts payable . . . . . . . . . . . . . . . . . . . . . . . . . . . . . . . . . . . . . . . . . . . . . . . . . . . . . . . . . . . . . . . 229,866 226,733Dividends payable . . . . . . . . . . . . . . . . . . . . . . . . . . . . . . . . . . . . . . . . . . . . . . . . . . . . . . . . . . . . . . 37,968 31,740Other current liabilities . . . . . . . . . . . . . . . . . . . . . . . . . . . . . . . . . . . . . . . . . . . . . . . . . . . . . . . . . . 242,884 301,744
Total Current Liabilities . . . . . . . . . . . . . . . . . . . . . . . . . . . . . . . . . . . . . . . . . . . . . . . . . . . . . . 518,808 560,366
Other Liabilities:Long-term debt . . . . . . . . . . . . . . . . . . . . . . . . . . . . . . . . . . . . . . . . . . . . . . . . . . . . . . . . . . . . . . . . . 934,232 932,665Deferred gains . . . . . . . . . . . . . . . . . . . . . . . . . . . . . . . . . . . . . . . . . . . . . . . . . . . . . . . . . . . . . . . . . 46,535 41,339Retirement liabilities . . . . . . . . . . . . . . . . . . . . . . . . . . . . . . . . . . . . . . . . . . . . . . . . . . . . . . . . . . . . 354,333 238,225Other liabilities . . . . . . . . . . . . . . . . . . . . . . . . . . . . . . . . . . . . . . . . . . . . . . . . . . . . . . . . . . . . . . . . . 118,024 92,085
Total Other Liabilities . . . . . . . . . . . . . . . . . . . . . . . . . . . . . . . . . . . . . . . . . . . . . . . . . . . . . . . 1,453,124 1,304,314
Commitments and Contingencies (Note 17)Shareholders’ Equity:Common stock 121⁄2¢ par value; authorized 500,000,000 shares; issued 115,858,190 and
115,761,840 shares as of December 31, 2014 and 2013; and outstanding 80,777,590 and81,384,246 shares as of December 31, 2014 and 2013 . . . . . . . . . . . . . . . . . . . . . . . . . . . . . . . . 14,470 14,470
Capital in excess of par value . . . . . . . . . . . . . . . . . . . . . . . . . . . . . . . . . . . . . . . . . . . . . . . . . . . . . 140,008 131,461Retained earnings . . . . . . . . . . . . . . . . . . . . . . . . . . . . . . . . . . . . . . . . . . . . . . . . . . . . . . . . . . . . . . . 3,350,734 3,075,657Accumulated other comprehensive loss:
Cumulative translation adjustments . . . . . . . . . . . . . . . . . . . . . . . . . . . . . . . . . . . . . . . . . . . . . (173,342) (104,278)Accumulated gains (losses) on derivatives qualifying as hedges . . . . . . . . . . . . . . . . . . . . . . 12,371 (4,012)Pension and postretirement liability adjustment . . . . . . . . . . . . . . . . . . . . . . . . . . . . . . . . . . . (379,459) (284,421)
Treasury stock, at cost — 35,080,600 and 34,377,594 shares as of December 31, 2014and 2013 . . . . . . . . . . . . . . . . . . . . . . . . . . . . . . . . . . . . . . . . . . . . . . . . . . . . . . . . . . . . . . . . . . . . (1,446,221) (1,365,805)
Total Shareholders’ Equity . . . . . . . . . . . . . . . . . . . . . . . . . . . . . . . . . . . . . . . . . . . . . . . . . . . 1,518,561 1,463,072
Noncontrolling interest . . . . . . . . . . . . . . . . . . . . . . . . . . . . . . . . . . . . . . . . . . . . . . . . . . . . . . . . . . 4,128 3,979
Total Shareholders’ Equity including noncontrolling interest . . . . . . . . . . . . . . . . . . . . . . . . . 1,522,689 1,467,051
Total Liabilities and Shareholders’ Equity . . . . . . . . . . . . . . . . . . . . . . . . . . . . . . . . . . . . . . . . . . . $ 3,494,621 $ 3,331,731
See Notes to Consolidated Financial Statements
57

INTERNATIONAL FLAVORS & FRAGRANCES INC.
CONSOLIDATED STATEMENT OF CASH FLOWSYear Ended December 31,
(DOLLARS IN THOUSANDS) 2014 2013 2012
Cash flows from operating activities:Net income . . . . . . . . . . . . . . . . . . . . . . . . . . . . . . . . . . . . . . . . . . . . . . . . . . . $ 414,543 $ 353,544 $ 254,134Adjustments to reconcile to net cash provided by operating activities:
Depreciation and amortization . . . . . . . . . . . . . . . . . . . . . . . . . . . . . . . . 89,354 83,227 76,667Deferred income taxes . . . . . . . . . . . . . . . . . . . . . . . . . . . . . . . . . . . . . . 23,350 (484) (15,878)Gain on disposal of assets . . . . . . . . . . . . . . . . . . . . . . . . . . . . . . . . . . . (3,768) (17,841) (4,461)Stock-based compensation . . . . . . . . . . . . . . . . . . . . . . . . . . . . . . . . . . . 22,648 23,736 19,716Spanish tax charges . . . . . . . . . . . . . . . . . . . . . . . . . . . . . . . . . . . . . . . . — — 72,362Payments pursuant to Spanish tax settlement . . . . . . . . . . . . . . . . . . . . — — (105,503)Changes in assets and liabilities, net of Aromor acquisition:
Trade receivables . . . . . . . . . . . . . . . . . . . . . . . . . . . . . . . . . . . . . . (2,635) (53,156) (33,056)Inventories . . . . . . . . . . . . . . . . . . . . . . . . . . . . . . . . . . . . . . . . . . . (40,042) 4,822 4,571Accounts payable . . . . . . . . . . . . . . . . . . . . . . . . . . . . . . . . . . . . . . 7,753 10,074 (740)Accruals for incentive compensation . . . . . . . . . . . . . . . . . . . . . . . (30,947) 24,518 34,632Other current payables and accrued expenses . . . . . . . . . . . . . . . . (19,332) 9,995 29,203Changes in other assets/liabilities, net . . . . . . . . . . . . . . . . . . . . . . 57,466 (30,873) (7,851)
Net cash provided by operating activities . . . . . . . . . . . . . . . . . . . . . . . . . . . 518,390 407,562 323,796
Cash flows from investing activities:Cash paid for acquisition, net of cash received (including $15 millionof contingent consideration) . . . . . . . . . . . . . . . . . . . . . . . . . . . . . . . . (102,500) — —
Additions to property, plant and equipment . . . . . . . . . . . . . . . . . . . . . . (143,182) (134,157) (126,140)Proceeds from disposal of assets . . . . . . . . . . . . . . . . . . . . . . . . . . . . . . 3,295 27,312 1,763Maturity of net investment hedges . . . . . . . . . . . . . . . . . . . . . . . . . . . . . 3,304 646 1,960Purchase of life insurance contracts . . . . . . . . . . . . . . . . . . . . . . . . . . . . — — (1,127)Proceeds from life insurance contracts . . . . . . . . . . . . . . . . . . . . . . . . . 17,750 793 9,283
Net cash used in investing activities . . . . . . . . . . . . . . . . . . . . . . . . . . . . . . . (221,333) (105,406) (114,261)
Cash flows from financing activities:Cash dividends paid to shareholders . . . . . . . . . . . . . . . . . . . . . . . . . . . (133,239) (87,347) (130,943)Net change in revolving credit facility borrowings and overdrafts . . . . 8,332 (283,225) 138,756Deferred financing costs . . . . . . . . . . . . . . . . . . . . . . . . . . . . . . . . . . . . (1,023) (2,800) —Repayments of long-term debt . . . . . . . . . . . . . . . . . . . . . . . . . . . . . . . . — (100,000) —Proceeds from long-term debt . . . . . . . . . . . . . . . . . . . . . . . . . . . . . . . . 3,609 297,786 —Proceeds from issuance of stock under stock plans . . . . . . . . . . . . . . . . 1,864 3,799 9,211Excess tax benefits on stock-based payments . . . . . . . . . . . . . . . . . . . . 6,330 6,112 8,380Purchase of treasury stock . . . . . . . . . . . . . . . . . . . . . . . . . . . . . . . . . . . (88,203) (51,363) —
Net cash (used in) provided by financing activities . . . . . . . . . . . . . . . . . . . . (202,330) (217,038) 25,404
Effect of exchange rate changes on cash and cash equivalents . . . . . . . . . . . (21,659) (4,035) 1,204Net change in cash and cash equivalents . . . . . . . . . . . . . . . . . . . . . . . . . . 73,068 81,083 236,143Cash and cash equivalents at beginning of year . . . . . . . . . . . . . . . . . . . . 405,505 324,422 88,279
Cash and cash equivalents at end of year . . . . . . . . . . . . . . . . . . . . . . . . . $ 478,573 $ 405,505 $ 324,422
Cash paid for:Interest, net of amounts capitalized . . . . . . . . . . . . . . . . . . . . . . . . . . . . . . . . $ 46,106 $ 48,165 $ 41,315Income taxes(1) . . . . . . . . . . . . . . . . . . . . . . . . . . . . . . . . . . . . . . . . . . . . . . . . $ 92,087 $ 138,940 $ 184,592Noncash investing activities:Accrued capital expenditures . . . . . . . . . . . . . . . . . . . . . . . . . . . . . . . . . . . . . $ 14,376 $ 21,744 $ 26,565
(1) The 2012 amount includes $105.5 million pursuant to the Spanish tax settlement (see Note 9).
See Notes to Consolidated Financial Statements
58

INTERNATIONAL FLAVORS & FRAGRANCES INC.
CONSOLIDATED STATEMENT OF SHAREHOLDERS’ EQUITY
(DOLLARS IN THOUSANDS)Commonstock
Capital inexcess ofpar value
Retainedearnings
Accumu-lated other
comprehensive(loss) income
Treasury stock NoncontrollinginterestShares Cost
Balance at December 31, 2011 . . . . . . $14,470 $128,631 $2,692,893 $(375,309) (34,840,632) $(1,356,273) $2,995
Net income . . . . . . . . . . . . . . . . . . . . . 254,134 752Cumulative translation adjustment . . . 17,687Losses on derivatives qualifying as
hedges; net of tax $1,327 . . . . . . . . . (4,455)Pension liability and postretirement
adjustment; net of tax $11,696 . . . . (41,548)Cash dividends declared ($1.30 per
share) . . . . . . . . . . . . . . . . . . . . . . . . (105,861)Stock options/SSARs . . . . . . . . . . . . . 4,248 336,296 13,144Vested restricted stock units and
awards . . . . . . . . . . . . . . . . . . . . . . . (23,113) 263,645 10,298Stock-based compensation . . . . . . . . . 17,738 105,725 2,124
Balance at December 31, 2012 . . . . . . $14,470 $127,504 $2,841,166 $(403,625) (34,134,966) $(1,330,707) $3,747Net income . . . . . . . . . . . . . . . . . . . . . 353,544 232Cumulative translation adjustment . . . (10,556)Losses on derivatives qualifying as
hedges; net of tax $429 . . . . . . . . . . (3,794)Pension liability and postretirement
adjustment; net of tax $22,778 . . . . 25,264Cash dividends declared ($1.46 per
share) . . . . . . . . . . . . . . . . . . . . . . . . (119,053)Stock options . . . . . . . . . . . . . . . . . . . . 10,395 157,403 6,196Treasury share repurchases . . . . . . . . . (655,907) (51,363)Vested restricted stock units and
awards . . . . . . . . . . . . . . . . . . . . . . . (26,735) 159,559 6,277Stock-based compensation . . . . . . . . . 20,297 96,317 3,792
Balance at December 31, 2013 . . . . . . $14,470 $131,461 $3,075,657 $(392,711) (34,377,594) $(1,365,805) $3,979Net income . . . . . . . . . . . . . . . . . . . . . 414,543 149Cumulative translation adjustment . . . (69,064)Gains on derivatives qualifying as
hedges; net of tax $(2,526) . . . . . . . 16,383Pension liability and postretirement
adjustment; net of tax $36,554 . . . . (95,038)Cash dividends declared ($1.72 per
share) . . . . . . . . . . . . . . . . . . . . . . . . (139,466)Stock options . . . . . . . . . . . . . . . . . . . . 9,770 87,706 3,590Treasury share repurchases . . . . . . . . . (927,339) (88,959)Vested restricted stock units and
awards . . . . . . . . . . . . . . . . . . . . . . . (23,871) 136,627 4,953Stock-based compensation . . . . . . . . . 22,648
Balance at December 31, 2014 . . . . . . $14,470 $140,008 $3,350,734 $(540,430) (35,080,600) $(1,446,221) $4,128
See Notes to Consolidated Financial Statements
59

INTERNATIONAL FLAVORS & FRAGRANCES INC.NOTES TO CONSOLIDATED FINANCIAL STATEMENTS
NOTE 1. NATURE OF OPERATIONS AND SUMMARY OF SIGNIFICANT ACCOUNTINGPOLICIES
Nature of Operations International Flavors & Fragrances Inc. and its subsidiaries (the “Registrant,”“IFF,” “the Company,” “we,” “us” and “our”) is a leading creator and manufacturer of flavor and fragrancecompounds used to impart or improve flavor or fragrance in a wide variety of consumer products. Our productsare sold principally to manufacturers of perfumes and cosmetics, hair and other personal care products, soaps anddetergents, cleaning products, dairy, meat and other processed foods, beverages, snacks and savory foods, sweetand baked goods, and pharmaceutical and oral care products.
Fiscal Year End The Company has historically operated on a 52/53 week fiscal year generally ending onthe Friday closest to the last day of the year. For ease of presentation, December 31 is used consistentlythroughout the financial statements and notes to represent the period-end date. The 2012 and 2013 fiscal yearswere 52 week periods and the 2014 fiscal year was a 53 week period. For the 2014, 2013 and 2012 fiscal years,the actual closing dates were January 2, December 27 and December 28, respectively.
Use of Estimates The preparation of financial statements in conformity with accounting principlesgenerally accepted in the United States requires management to make estimates and assumptions that affect thereported amounts and accompanying disclosures. These estimates are based on management’s best knowledge ofcurrent events and actions the Company may undertake in the future. Actual results may ultimately differ fromestimates.
Principles of Consolidation The consolidated financial statements include the accounts of InternationalFlavors & Fragrances Inc. and those of its subsidiaries. Significant intercompany balances and transactions havebeen eliminated. To the extent a subsidiary is not wholly-owned, any related noncontrolling interest is includedas a separate component of Shareholders’ Equity. Any applicable expense (income) attributable to thenoncontrolling interest is included in Other expense, net in the accompanying Consolidated Statement of Incomeand Comprehensive Income due to its immateriality and, as such, is not presented separately.
Revenue Recognition The Company recognizes revenue when the earnings process is complete. Thisgenerally occurs when (i) title and risk of loss have been transferred to the customer in accordance with the termsof sale and (ii) collection is reasonably assured. Sales are reduced, at the time revenue is recognized, forapplicable discounts, rebates and sales allowances based on historical experience. Related accruals are includedin Other current liabilities in the accompanying Consolidated Balance Sheet.
Foreign Currency Translation The Company translates the assets and liabilities of non-U.S. subsidiariesinto U.S. dollars at year-end exchange rates. Income and expense items are translated at average exchange ratesduring the year. Cumulative translation adjustments are shown as a separate component of Shareholders’ Equity.
Research and Development Research and development (“R&D”) expenses relate to the development ofnew and improved flavors or fragrances, technical product support and compliance with governmental regulation.All research and development costs are expensed as incurred.
Cash Equivalents Cash equivalents include highly liquid investments with maturities of three months orless at date of purchase.
Accounts Receivable The Company sells certain accounts receivable on a non-recourse basis to unrelatedfinancial institutions under “factoring” agreements that are sponsored, solely and individually, by certaincustomers. The Company accounts for these transactions as sale of receivables, removes the receivables soldfrom its financial statements, and records cash proceeds when received by the Company. The increase in cash
60

from operations was approximately $33 million, $7 million and $18 million in 2014, 2013 and 2012,respectively, along with approximately $40 million in periods prior to 2012 in connection with these programs.The cost of participating in these programs was immaterial to our results in all periods.
Inventories Inventories are stated at the lower of cost (on a weighted average basis) or market. Ourinventories consisted of the following:
December 31,
(DOLLARS IN THOUSANDS) 2014 2013
Raw materials . . . . . . . . . . . . . . . . . . . . . . . . . . . . . . . . . . . . . . . . . . . . . . . . . . . . . . . . . . $275,161 $252,457Work in process . . . . . . . . . . . . . . . . . . . . . . . . . . . . . . . . . . . . . . . . . . . . . . . . . . . . . . . . . 17,705 6,658Finished goods . . . . . . . . . . . . . . . . . . . . . . . . . . . . . . . . . . . . . . . . . . . . . . . . . . . . . . . . . . 275,863 274,691
Total . . . . . . . . . . . . . . . . . . . . . . . . . . . . . . . . . . . . . . . . . . . . . . . . . . . . . . . . . . . . . $568,729 $533,806
Property, Plant and Equipment Property, plant and equipment are recorded at cost. Depreciation iscalculated on a straight-line basis, principally over the following estimated useful lives: buildings andimprovements, 10 to 40 years; machinery and equipment, 3 to 20 years; information technology hardware andsoftware, 3 to 7 years; and leasehold improvements which are included in buildings and improvements, theestimated life of the improvements or the remaining term of the lease, whichever is shorter. During 2014, theCompany began to use an estimated useful life of 20 years for certain machinery and equipment. The change inuseful life, which was adopted prospectively, did not have a material effect on the Company’s 2014 financialstatements.
The Company reviews long-lived assets for impairment when events or changes in business conditionsindicate that their full carrying value may not be recovered. An estimate of undiscounted future cash flowsproduced by an asset or group of assets is compared to the carrying value to determine whether impairmentexists. If assets are determined to be impaired, the loss is measured based on an estimate of fair value usingvarious valuation techniques, including a discounted estimate of future cash flows.
Goodwill and Other Intangible Assets Goodwill represents the difference between the total purchaseprice and the fair value of identifiable assets and liabilities acquired in business acquisitions.
In assessing the potential for impairment of goodwill, management uses the most current actual andforecasted operating data available and current market based assumptions in accordance with the criteria in ASC350. In 2012, the Company re-evaluated its reporting unit structure and identified three reporting units:(1) Flavors, (2) Fragrance Compounds and (3) Fragrance Ingredients. These reporting units were determinedbased on the level at which the performance is measured and reviewed by segment management.
The Company performed the annual goodwill impairment test utilizing the two-step approach for theFlavors, Fragrance Compounds and Fragrance Ingredients reporting units, by assessing the fair value of ourreporting units based on discounted cash flows. We completed our annual goodwill impairment test as ofNovember 30, 2014, which indicated no impairment of goodwill, as the estimated fair values substantiallyexceeded the carrying values of each of these reporting units.
Other intangible assets include patents, trademarks and other intellectual property valued at acquisition, andamortized on a straight-line basis over periods ranging from 6 to 20 years.
Income Taxes The Company accounts for taxes under the asset and liability method. Under this method,deferred income taxes are recognized for temporary differences between the financial statement and tax returnbases of assets and liabilities, based on enacted tax rates and other provisions of the tax law. The effect of achange in tax laws or rates on deferred tax assets and liabilities is recognized in income in the period in which
61

such change is enacted. Future tax benefits are recognized to the extent that realization of such benefits is morelikely than not, and a valuation allowance is established for any portion of a deferred tax asset that managementbelieves may not be realized.
The Company recognizes uncertain tax positions that it has taken or expects to take on a tax return. Pursuantto accounting requirements, we first determine whether it is “more likely than not” our tax position will besustained if the relevant tax authority were to audit the position with full knowledge of all the relevant facts andother information. For those tax positions that meet this threshold, we measure the amount of tax benefit basedon the largest amount of tax benefit that we have a greater than 50% chance of realizing in a final settlement withthe relevant authority. Those tax positions failing to qualify for initial recognition are recognized in the firstinterim period in which they meet the more likely than not standard. We maintain a cumulative risk portfoliorelating to all of our uncertainties in income taxes in order to perform this analysis, but the evaluation of our taxpositions requires significant judgment and estimation in part because, in certain cases, tax law is subject tovaried interpretation, and whether a tax position will ultimately be sustained may be uncertain.
The Company regularly repatriates a portion of current year earnings from select non–U.S. subsidiaries. Noprovision has been made for additional taxes on undistributed earnings of subsidiary companies that are intendedand planned to be indefinitely invested in such subsidiaries. We intend to, and have plans to, reinvest theseearnings indefinitely in our foreign subsidiaries to fund local operations and/or capital projects.
Interest and penalties related to unrecognized tax benefits are recognized as a component of income taxexpense.
Retirement Benefits Current service costs of retirement plans and postretirement health care and lifeinsurance benefits are accrued. Prior service costs resulting from plan improvements are amortized over periodsranging from 10 to 20 years.
Financial Instruments Derivative financial instruments are used to manage interest and foreign currencyexposures. The gain or loss on the hedging instrument is recorded in earnings at the same time as the transactionbeing hedged is recorded in earnings. The associated asset or liability related to the open hedge instrument isrecorded in Prepaid expenses and other current assets or Other current liabilities, as applicable.
The Company records all derivative financial instruments on the balance sheet at fair value. Changes in aderivative’s fair value are recognized in earnings unless specific hedge criteria are met. If the derivative isdesignated as a fair value hedge, the changes in the fair value of the derivative and of the hedged itemattributable to the hedged risk are recognized in Net income. If the derivative is designated as a cash flow hedge,the effective portions of changes in the fair value of the derivative are recorded in Accumulated othercomprehensive income (“AOCI”) in the accompanying Consolidated Balance Sheet and are subsequentlyrecognized in Net income when the hedged item affects earnings. Ineffective portions of changes in the fair valueof cash flow hedges, if any, are recognized as a charge or credit to earnings.
Software Costs The Company capitalizes direct internal and external development costs for certainsignificant projects associated with internal-use software and amortizes these costs over 7 years. Neitherpreliminary evaluation costs nor costs associated with the software after implementation are capitalized. Costsrelated to projects that are not significant are expensed as incurred.
Shipping and Handling Costs Net sales include shipping and handling charges billed to customers. Costof goods sold includes all costs incurred in connection with shipping and handling.
62

Net Income Per Share Net income per share is based on the weighted average number of sharesoutstanding. A reconciliation of shares used in the computations of basic and diluted net income per share is asfollows:
Number of Shares
(SHARES IN THOUSANDS) 2014 2013 2012
Basic . . . . . . . . . . . . . . . . . . . . . . . . . . . . . . . . . . . . . . . . . . . . . . . . . . . . . . . . . . . . . 80,936 81,322 81,108Assumed dilution under stock plans . . . . . . . . . . . . . . . . . . . . . . . . . . . . . . . . . . . . 558 608 725
Diluted . . . . . . . . . . . . . . . . . . . . . . . . . . . . . . . . . . . . . . . . . . . . . . . . . . . . . . . . . . . 81,494 81,930 81,833
Stock options and stock settled appreciation rights (“SSARs”) to purchase 132,000 shares in the aggregatewere outstanding at December 31, 2012, but are not included in the computation of diluted net income per sharebecause to do so would have been anti-dilutive for the periods presented. There were no stock options or SSARsexcluded from the computation of diluted net income per share at December 31, 2013 and 2014.
The Company has issued shares of Purchased Restricted Stock (“PRS”) which contain nonforfeitable rightsto dividends and thus are considered participating securities which are required to be included in the computationof basic and diluted earnings per share pursuant to the two-class method. The two-class method was notpresented since the difference between basic and diluted net income per share for both common shareholders andPRS shareholders was approximately $0.01 per share for each year and the number of PRS outstanding as ofDecember 31, 2014, 2013 and 2012 was immaterial (approximately 0.6% 0.7%, and 0.6%, respectively, of thetotal number of common shares outstanding). Net income allocated to such PRS during 2014, 2013 and 2012 wasapproximately $2.4 million, $2.3 million and $1.6 million, respectively.
Stock-Based Compensation Compensation cost of all share-based awards is measured at fair value on thedate of grant and recognized over the service period for which awards are expected to vest. The cost of suchshare-based awards is principally recognized on a straight-line attribution basis over their respective vestingperiods, net of estimated forfeitures.
New Accounting Standards
In March 2013, the Financial Accounting Standards Board (“FASB”) issued authoritative guidanceclarifying the accounting for the release of cumulative translation adjustments into net income when a parenteither sells a part or all of its investment in a foreign entity or no longer holds a controlling financial interest in asubsidiary or group of assets that is a nonprofit activity or a business within a foreign entity. The guidance waseffective prospectively for reporting periods beginning after December 15, 2013. The adoption of this statementdid not have an impact on our financial position, results of operations or cash flows.
In July 2013, the FASB issued authoritative guidance related to the financial statement presentation ofunrecognized tax benefits. This update clarifies that an unrecognized tax benefit, or a portion of an unrecognizedtax benefit, should be presented in the financial statements as a reduction to a deferred tax asset for a netoperating loss carryforward, a similar tax loss, or a tax credit carryforward, except to the extent a net operatingloss carryforward, a similar tax loss, or a tax credit carryforward is not available at the reporting date under thetax law of the applicable jurisdiction to settle any additional income taxes that would result from thedisallowance of a tax position or the tax law of the applicable jurisdiction does not require the entity to use, andthe entity does not intend to use, the deferred tax asset for such purpose. In such situations, the unrecognized taxbenefit should be presented in the financial statements as a liability and should not be combined with deferred taxassets. The guidance was effective prospectively for reporting periods beginning after December 15, 2013. Theadoption of this statement did not have a significant impact on our financial position, results of operations or cashflows.
63

In May 2014, the FASB issued authoritative guidance to clarify the principles to be used to recognizerevenue. The guidance is applicable to all entities and is effective for annual and interim periods beginning afterDecember 15, 2016. Early adoption is not permitted. The Company is currently evaluating the impact that thisnew standard will have on its consolidated financial statements.
Reclassifications
Certain reclassifications have been made to the prior years’ financial statements to conform to the 2014presentation.
NOTE 2. RESTRUCTURING AND OTHER CHARGES
Restructuring and other charges primarily consist of separation costs for employees including severance,outplacement and other benefit costs.
Fragrance Ingredients Rationalization
In 2014, the Company closed its fragrance ingredients manufacturing facility in Augusta, Georgia andconsolidated production into other Company facilities. In connection with this closure, the Company incurredcharges of $13.8 million, consisting primarily of $10.3 million in accelerated depreciation of fixed assets, $2.2million in personnel-related costs and $1.3 million in plant shutdown and other related costs. The Companyrecorded total charges of $7.4 million during 2013, consisting of $2.2 million of pre-tax charges related toseverance included in Restructuring and other charges, net and $5.2 million of non-cash charges related toaccelerated depreciation included in Cost of goods sold. During 2014, the Company recorded $1.3 million ofplant shutdown and other related costs included in Restructuring and other charges, net as well as an additional$5.1 million of non-cash charges related to accelerated depreciation included in Cost of goods sold. As a result ofthis closure, 43 positions have been eliminated. The Company estimates that approximately $3 – $4 million ofthe costs will be or have been cash expenditures.
Other
During 2013, the Company reversed $1.2 million of employee-related liabilities, offset by $0.6 million ofadditional costs incurred related to the European Rationalization Plan that was announced in 2009 and completedin 2011. Additionally, during 2013, the Company recorded a charge of $1.7 million related to the StrategicInitiative, which began in 2011 and was completed in 2013.
Reorganization Plan
Movements in related accruals during 2012, 2013 and 2014 are as follows:
(DOLLARS IN THOUSANDS)Employee-Related Pension
Asset -Related/and
Other Total
Balance at January 1, 2012 . . . . . . . . . . . . . . . . . . . . . . . . . . . . . . $10,774 $ — $ — $10,774Additional charges (reversals), net . . . . . . . . . . . . . . . . . . . . . . . . 1,376 292 — 1,668Non-cash charges . . . . . . . . . . . . . . . . . . . . . . . . . . . . . . . . . . . . . — (292) — (292)Payments and other costs . . . . . . . . . . . . . . . . . . . . . . . . . . . . . . . (9,001) — — (9,001)
Balance at December 31, 2012 . . . . . . . . . . . . . . . . . . . . . . . . . . . 3,149 — — 3,149Additional charges (reversals), net . . . . . . . . . . . . . . . . . . . . . . . . 2,151 — 5,250 7,401Non-cash charges . . . . . . . . . . . . . . . . . . . . . . . . . . . . . . . . . . . . . — — (5,250) (5,250)Payments and other costs . . . . . . . . . . . . . . . . . . . . . . . . . . . . . . . (3,184) — — (3,184)
Balance at December 31, 2013 . . . . . . . . . . . . . . . . . . . . . . . . . . . 2,116 — — 2,116Additional charges (reversals), net . . . . . . . . . . . . . . . . . . . . . . . . (46) — 6,444 6,398Non-cash charges . . . . . . . . . . . . . . . . . . . . . . . . . . . . . . . . . . . . . — — (5,100) (5,100)Payments and other costs . . . . . . . . . . . . . . . . . . . . . . . . . . . . . . . (1,311) — (1,344) (2,655)
Balance at December 31, 2014 . . . . . . . . . . . . . . . . . . . . . . . . . . . $ 759 $ — $ — $ 759
64

NOTE 3. PROPERTY, PLANT AND EQUIPMENT, NET
Property, plant and equipment consists of the following amounts:
(DOLLARS IN THOUSANDS)
December 31,
2014 2013
Asset TypeLand . . . . . . . . . . . . . . . . . . . . . . . . . . . . . . . . . . . . . . . . . . . . . . . . . . . . . . . . . . . . . . . $ 16,448 $ 20,723Buildings and improvements . . . . . . . . . . . . . . . . . . . . . . . . . . . . . . . . . . . . . . . . . . . . 411,157 432,978Machinery and equipment . . . . . . . . . . . . . . . . . . . . . . . . . . . . . . . . . . . . . . . . . . . . . . 935,340 952,103Information technology . . . . . . . . . . . . . . . . . . . . . . . . . . . . . . . . . . . . . . . . . . . . . . . . 257,092 254,961Construction in process . . . . . . . . . . . . . . . . . . . . . . . . . . . . . . . . . . . . . . . . . . . . . . . . 146,709 97,218
1,766,746 1,757,983Accumulated depreciation . . . . . . . . . . . . . . . . . . . . . . . . . . . . . . . . . . . . . . . . . . . . . . (1,046,478) (1,070,768)
$ 720,268 $ 687,215
NOTE 4. GOODWILL AND OTHER INTANGIBLE ASSETS, NET
Goodwill by segment is as follows:
December 31,
(DOLLARS IN THOUSANDS) 2014 2013
Flavors . . . . . . . . . . . . . . . . . . . . . . . . . . . . . . . . . . . . . . . . . . . . . . . . . . . . . . . . . . . . . . . . . . $319,479 $319,479Fragrances . . . . . . . . . . . . . . . . . . . . . . . . . . . . . . . . . . . . . . . . . . . . . . . . . . . . . . . . . . . . . . . 356,005 346,103
Total . . . . . . . . . . . . . . . . . . . . . . . . . . . . . . . . . . . . . . . . . . . . . . . . . . . . . . . . . . . . . . . $675,484 $665,582
The increase in Fragrances goodwill for the year ended December 31, 2014, relates to the acquisition ofAromor, as discussed below.
Trademark and other intangible assets consist of the following amounts:
December 31,
(DOLLARS IN THOUSANDS) 2014 2013
Gross carrying value(1) . . . . . . . . . . . . . . . . . . . . . . . . . . . . . . . . . . . . . . . . . . . . . . . . . . . . $ 218,676 $ 165,406Accumulated amortization . . . . . . . . . . . . . . . . . . . . . . . . . . . . . . . . . . . . . . . . . . . . . . . . . (142,119) (134,791)
Total . . . . . . . . . . . . . . . . . . . . . . . . . . . . . . . . . . . . . . . . . . . . . . . . . . . . . . . . . . . . . . $ 76,557 $ 30,615
(1) Includes patents, trademarks, technological know-how, and other intellectual property, valued at acquisition.
Aromor
On January 15, 2014, the Company completed the acquisition of 100% of the equity of Aromor Flavors andFragrances Ltd. (“Aromor”), a privately held manufacturer and marketer of complex specialty ingredients thatare used in fragrances and flavors. The acquisition was accounted for under the purchase method. The Companypaid $102.6 million (including $0.1 million of cash acquired) for this acquisition, which was funded out ofexisting cash resources. Aromor is part of the IFF Fragrances Ingredients business and was acquired in order tostrengthen this business and provide cost-effective quality materials for use in our formula creations. Thepurchase price exceeded the carrying value of existing net assets by approximately $56 million. The excess wasallocated principally to identifiable intangible assets (approximately $53 million), goodwill (approximately$10 million) and approximately $9 million to deferred tax liabilities. Separately identifiable intangible assets are
65

principally related to technological know-how. The intangible assets are amortized using lives ranging from 13-19 years. Additionally, the consideration included $15 million related to post-combination contingentconsideration, held in escrow. This escrowed amount will be expensed by the Company as it is earned by theselling shareholders over three years based upon the continued participation in the acquired business of certainkey personnel. The purchase price allocation was completed during the second quarter. No pro forma financialinformation for 2013 is presented as the impact of the acquisition is immaterial.
Amortization
Amortization expense was $7.3 million for the year ended December 31, 2014, and $6.1 million for eachyear ended December 31, 2013 and 2012. Estimated annual amortization is $7.2 million for years 2015 through2018 and $6.5 million for 2019.
NOTE 5. OTHER ASSETS
Other assets consist of the following amounts:
December 31,
(DOLLARS IN THOUSANDS) 2014 2013
Overfunded pension plans . . . . . . . . . . . . . . . . . . . . . . . . . . . . . . . . . . . . . . . . . . . . . . . . . . . $ 1,338 $ 14,058Cash surrender value of life insurance contracts . . . . . . . . . . . . . . . . . . . . . . . . . . . . . . . . . . 42,378 56,292Other . . . . . . . . . . . . . . . . . . . . . . . . . . . . . . . . . . . . . . . . . . . . . . . . . . . . . . . . . . . . . . . . . . . 85,522 70,629
Total . . . . . . . . . . . . . . . . . . . . . . . . . . . . . . . . . . . . . . . . . . . . . . . . . . . . . . . . . . . . . . . $129,238 $140,979
NOTE 6. OTHER CURRENT LIABILITIES
Other current liabilities consist of the following amounts:
December 31,
(DOLLARS IN THOUSANDS) 2014 2013
Accrued payrolls and bonuses . . . . . . . . . . . . . . . . . . . . . . . . . . . . . . . . . . . . . . . . . . . . . . . . $ 71,264 $105,816VAT payable . . . . . . . . . . . . . . . . . . . . . . . . . . . . . . . . . . . . . . . . . . . . . . . . . . . . . . . . . . . . . 15,125 23,448Interest payable . . . . . . . . . . . . . . . . . . . . . . . . . . . . . . . . . . . . . . . . . . . . . . . . . . . . . . . . . . . 12,974 12,709Current pension and other postretirement benefit obligation . . . . . . . . . . . . . . . . . . . . . . . . 11,902 11,891Accrued insurance (including workers’ compensation) . . . . . . . . . . . . . . . . . . . . . . . . . . . . 10,718 9,777Restructuring and other charges . . . . . . . . . . . . . . . . . . . . . . . . . . . . . . . . . . . . . . . . . . . . . . 759 2,116Other . . . . . . . . . . . . . . . . . . . . . . . . . . . . . . . . . . . . . . . . . . . . . . . . . . . . . . . . . . . . . . . . . . . 120,142 135,987
Total . . . . . . . . . . . . . . . . . . . . . . . . . . . . . . . . . . . . . . . . . . . . . . . . . . . . . . . . . . . . . . . $242,884 $301,744
NOTE 7. SALE AND LEASEBACK TRANSACTIONS
In connection with the disposition of certain real estate in prior years, we entered into long-term operatingleases. The leases are classified as operating leases and the gains realized on these leases have been deferred andare being credited to income over the initial lease term. Such deferred gains totaled $42 million and $45 millionat December 31, 2014 and 2013, respectively, of which $39 million and $41 million, respectively, are reflected inthe accompanying Consolidated Balance Sheet under the caption Deferred gains, with the remainder included asa component of Other current liabilities.
66

NOTE 8. BORROWINGS
Debt consists of the following at December 31:
(DOLLARS IN THOUSANDS) Rate Maturities 2014 2013
Senior notes — 2007 . . . . . . . . . . . . . . . . . . . . . . . . . . . . . . . . . . 6.40% 2017-27 $500,000 $500,000Senior notes — 2006 . . . . . . . . . . . . . . . . . . . . . . . . . . . . . . . . . . 6.14% 2016 125,000 125,000Senior notes — 2013 . . . . . . . . . . . . . . . . . . . . . . . . . . . . . . . . . . 3.20% 2023 299,782 299,736Bank overdrafts and other . . . . . . . . . . . . . . . . . . . . . . . . . . . . . . 12,335 984Deferred realized gains on interest rate swaps . . . . . . . . . . . . . . . 5,205 7,094
942,322 932,814Less: Current portion of long-term debt . . . . . . . . . . . . . . . . . . . . (8,090) (149)
$934,232 $932,665
Commercial Paper
Commercial paper issued by the Company generally has terms of 30 days or less. There were no outstandingcommercial paper borrowings at December 31, 2014 or 2013.
Senior Notes — 2013
On April 4, 2013, the Company issued $300.0 million face amount of 3.20% Senior Notes (“SeniorNotes — 2013”) due 2023 at a discount of $0.3 million. The Company received proceeds related to the issuanceof these Senior Notes — 2013 of $297.8 million which was net of the $0.3 million discount and a $1.9 millionunderwriting discount (recorded as deferred financing costs). In addition, the Company incurred $0.9 million ofother deferred financing costs in connection with the debt issuance. The discount and deferred financing costs arebeing amortized as interest expense over the term of the Senior Notes — 2013. The Senior Notes — 2013 bearinterest at a rate of 3.20% per year, with interest payable on May 1 and November 1 of each year, commencingon November 1, 2013. The Senior Notes — 2013 mature on May 1, 2023. Upon 30 days’ notice to holders of theSenior Notes — 2013, the Company may redeem the Senior Notes — 2013 for cash in whole, at any time, or inpart, from time to time, prior to maturity, at redemption prices that include accrued and unpaid interest and amake-whole premium. However, no make-whole premium will be paid for redemptions of the Senior Notes —2013 on or after February 1, 2023. The Indenture provides for customary events of default and contains certainnegative covenants that limit the ability of the Company and its subsidiaries to grant liens on assets, to enter intosale-leaseback transactions or to consolidate with or merge into any other entity or convey, transfer or lease all orsubstantially all of the Company’s properties and assets. In addition, subject to certain limitations, in the event ofthe occurrence of both (1) a change of control of the Company and (2) a downgrade of the Senior Notes — 2013below investment grade rating by both Moody’s Investors Services, Inc. and Standard & Poor’s Ratings Serviceswithin a specified time period, the Company will be required to make an offer to repurchase the Senior Notes —2013 at a price equal to 101% of the principal amount of the Senior Notes — 2013, plus accrued and unpaidinterest to the date of repurchase.
Senior Notes — 2007
On September 27, 2007, the Company issued $500 million of Senior Unsecured Notes (“Senior Notes —2007”) in four series under the Note Purchase Agreement (“NPA”): (i) $250 million in aggregate principalamount of 6.25% Series A Senior Notes due September 27, 2017, (ii) $100 million in aggregate principal amountof 6.35% Series B Notes due September 27, 2019, (iii) $50 million in aggregate principal amount of 6.50%Series C Notes due September 27, 2022, and (iv) $100 million in aggregate principal amount of 6.79% Series DNotes due September 27, 2027. Proceeds of the offering were used primarily to fund an accelerated repurchase ofIFF stock.
67

Senior Notes — 2006
In 2006, the Company issued $375 million of Senior Unsecured Notes (“Senior Notes — 2006”) in fourseries under another NPA: (i) $50 million in aggregate principal amount of 5.89% Series A Senior Notes dueJuly 12, 2009, (ii) $100 million in aggregate principal amount of 5.96% Series B Notes due July 12, 2011,(iii) $100 million in aggregate principal amount of 6.05% Series C Notes due July 12, 2013, and (iv) $125million in aggregate principal amount of 6.14% Series D Notes due July 12, 2016. Proceeds of the offering wereused primarily to repay commercial paper borrowings used to fund our maturing debt. In 2009, 2011 and 2013,the Company repaid $50 million, $100 million and $100 million, respectively, upon maturity of the first threeseries of the Senior Notes — 2006.
Maturities on our outstanding Senior Notes — 2006, Senior Notes — 2007 and Senior Notes — 2013 atDecember 31, 2014 were: 2016, $125 million; 2017, $250 million; 2019, $100 million; 2020 and thereafter, $450million. There is no debt maturing in 2015 and 2018.
Credit Facility
On April 4, 2014, the Company and certain of its subsidiaries amended and restated the Company’s existingcredit agreement with Citibank, N.A., as administrative agent. The credit agreement, as amended, provides for arevolving loan facility in an aggregate amount up to an equivalent of $950 million (the “Credit Facility”). Under theCredit Facility, Tranche A is available to borrowers in U.S. dollars, euros, Swiss francs, Japanese yen and Britishsterling in an aggregate amount up to an equivalent of approximately $456 million, with a sublimit of $25 millionfor swing line borrowings. Tranche B of the Credit Facility is available to borrowers in euros, Swiss francs,Japanese yen and British sterling in an aggregate amount up to an equivalent of approximately $494 million.
The Credit Facility is available for general corporate purposes of each borrower and its subsidiaries. Theobligations under the Credit Facility are unsecured and the Company has guaranteed the obligations of each otherborrower under the Credit Facility. The 2014 amendment to the Credit Facility extended the maturity date of thefacility to April 4, 2019, which may be extended for up to two additional one-year periods at the Company’srequest, subject to the agreement of the lenders having commitments representing more than 50% of the aggregatecommitments of all lenders under the Credit Facility. Borrowings under the Credit Facility bear interest at an annualrate of LIBOR plus a margin, currently 112.5 bps, linked to our credit rating. The Company pays a commitment feeon the aggregate unused commitments; such fee is not material. The Credit Facility contains various affirmative andnegative covenants, including the requirement for the Company to maintain, at the end of each fiscal quarter, a ratioof net debt for borrowed money to adjusted EBITDA (Earnings Before Interest, Taxes, Depreciation andAmortization) in respect of the previous 12-month period of not more than 3.25 to 1. As of December 31, 2014, theCompany was in compliance with all covenants under this Credit Facility. The Company had no borrowingsoutstanding under the Credit Facility as of December 31, 2014, with $940.4 million still available for additionalborrowings. As the Credit Facility is a multi-year revolving credit agreement, the Company classifies as long-termdebt the portion that it has the intent and ability to maintain outstanding longer than 12 months.
Credit facility borrowings and bank overdrafts were outstanding in several countries and averaged $3 millionin 2014 and $72.4 million in 2013. The highest levels were $8 million in 2014, $296 million in 2013, and $297million in 2012. The 2014 weighted average interest rate of these borrowings, based on balances outstanding at theend of each month, was 4.13%. These rates compare with 0.35% and 1.5%, respectively, in 2013 and 2012.
Other
The estimated fair value at December 31, 2014 of our Senior Notes — 2007, Senior Notes — 2006 andSenior Notes — 2013 was approximately $588 million, $133 million and $296 million, respectively, and isdiscussed in further detail in Note 14.
During 2013, the Company entered into multiple interest rate swap agreements effectively converting thefixed rate on a portion of our long-term Senior Notes to a variable short-term rate based on the LIBOR plus aninterest markup.
68

In March 2008, the Company realized an $18 million gain on the termination of an interest rate swap, whichhas been deferred and is being amortized as a reduction to interest expense over the remaining term of the relateddebt. The balance of this deferred gain was $5 million at December 31, 2014.
NOTE 9. INCOME TAXES
Earnings before income taxes consisted of the following:
December 31,
(DOLLARS IN THOUSANDS) 2014 2013 2012
U.S. income (loss) before taxes . . . . . . . . . . . . . . . . . . . . . . . . . . . . . . . . . . $ 17,650 $ (20,727) $ (21,308)Foreign income before taxes . . . . . . . . . . . . . . . . . . . . . . . . . . . . . . . . . . . . 531,411 505,937 464,723
Total income before taxes . . . . . . . . . . . . . . . . . . . . . . . . . . . . . . . . . . . . . . $549,061 $485,210 $443,415
The income tax provision consisted of the following:
December 31,
(DOLLARS IN THOUSANDS) 2014 2013 2012
CurrentFederal . . . . . . . . . . . . . . . . . . . . . . . . . . . . . . . . . . . . . . . . . . . . . . . . . $ 1,175 $ 8,658 $ 8,280State and local . . . . . . . . . . . . . . . . . . . . . . . . . . . . . . . . . . . . . . . . . . . 264 1,246 (456)Foreign(1) . . . . . . . . . . . . . . . . . . . . . . . . . . . . . . . . . . . . . . . . . . . . . . . 109,729 122,246 197,335
111,168 132,150 205,159
DeferredFederal . . . . . . . . . . . . . . . . . . . . . . . . . . . . . . . . . . . . . . . . . . . . . . . . . 20,795 (4,686) (4,650)State and local . . . . . . . . . . . . . . . . . . . . . . . . . . . . . . . . . . . . . . . . . . . 113 262 (74)Foreign(1) . . . . . . . . . . . . . . . . . . . . . . . . . . . . . . . . . . . . . . . . . . . . . . . 2,442 3,940 (11,154)
23,350 (484) (15,878)
Total income taxes . . . . . . . . . . . . . . . . . . . . . . . . . . . . . . . . . . . . . . . . . . . . $134,518 $131,666 $189,281
(1) For the year ended December 31, 2012, the foreign current income tax provision includes $72 million ofSpanish tax charges and $12 million of charges related to the Spanish dividend withholding cases. For theyear ended December 31, 2012, the foreign deferred income tax provision includes an $11 million taxbenefit from the corporate restructuring of certain foreign subsidiaries.
Effective Tax Rate Reconciliation
A reconciliation between the U.S. federal statutory income tax rate to our actual effective tax rate is asfollows:
December 31,
2014 2013 2012
Statutory tax rate . . . . . . . . . . . . . . . . . . . . . . . . . . . . . . . . . . . . . . . . . . . . . . . . . . . . . . . . 35.0% 35.0% 35.0%Difference in effective tax rate on foreign earnings and remittances . . . . . . . . . . . . . . . . (9.9) (10.2) (10.6)Unrecognized tax benefit, net of reversals . . . . . . . . . . . . . . . . . . . . . . . . . . . . . . . . . . . . 0.8 1.0 0.9Corporate restructuring of certain foreign subsidiaries . . . . . . . . . . . . . . . . . . . . . . . . . . . — — (2.4)Spanish tax charges . . . . . . . . . . . . . . . . . . . . . . . . . . . . . . . . . . . . . . . . . . . . . . . . . . . . . . — 1.3 16.3Spanish dividend withholdings . . . . . . . . . . . . . . . . . . . . . . . . . . . . . . . . . . . . . . . . . . . . . (0.7) — 2.6State and local taxes . . . . . . . . . . . . . . . . . . . . . . . . . . . . . . . . . . . . . . . . . . . . . . . . . . . . . 0.1 0.2 (0.1)Other, net . . . . . . . . . . . . . . . . . . . . . . . . . . . . . . . . . . . . . . . . . . . . . . . . . . . . . . . . . . . . . . (0.8) (0.2) 1.0
Effective tax rate . . . . . . . . . . . . . . . . . . . . . . . . . . . . . . . . . . . . . . . . . . . . . . . . . . . . . . . . 24.5% 27.1% 42.7%
69

Our effective tax rate reflects the benefit from having significant operations outside the U.S. that are taxedat rates that are lower than the U.S. federal rate of 35%. Included in the 2014 effective tax rate is a $3.8 milliontax benefit related to the reserve reversal for the 2001 Spanish dividend withholding tax case. Included in the2013 effective tax rate is a $6.2 million tax charge related to the 2002-2003 Spanish income tax cases asdiscussed below. Included in the 2012 effective tax rate is $72.4 million of tax charges pursuant to the Spanishtax settlement. The 2014, 2013 and 2012 effective tax rates were also favorably impacted by the reversals ofliabilities for uncertain tax positions of $2 million, $5 million and $1 million, respectively, principally due tostatutory expiry and effective settlement.
Deferred Taxes
The deferred tax assets consist of the following amounts:
December 31,
(DOLLARS IN THOUSANDS) 2014 2013
Employee and retiree benefits . . . . . . . . . . . . . . . . . . . . . . . . . . . . . . . . . . . . . . . . . . . . $ 164,542 $ 136,370Credit and net operating loss carryforwards(1) . . . . . . . . . . . . . . . . . . . . . . . . . . . . . . . . 180,296 311,562Property, plant and equipment, net . . . . . . . . . . . . . . . . . . . . . . . . . . . . . . . . . . . . . . . . . (7,275) (699)Trademarks and other . . . . . . . . . . . . . . . . . . . . . . . . . . . . . . . . . . . . . . . . . . . . . . . . . . . 149,695 189,536Amortizable R&D expenses . . . . . . . . . . . . . . . . . . . . . . . . . . . . . . . . . . . . . . . . . . . . . . 48,982 42,303Other, net . . . . . . . . . . . . . . . . . . . . . . . . . . . . . . . . . . . . . . . . . . . . . . . . . . . . . . . . . . . . 17,320 16,957
Gross deferred tax assets . . . . . . . . . . . . . . . . . . . . . . . . . . . . . . . . . . . . . . . . . . . . 553,560 696,029Valuation allowance(1) . . . . . . . . . . . . . . . . . . . . . . . . . . . . . . . . . . . . . . . . . . . . . . (355,568) (503,990)
Total net deferred tax assets . . . . . . . . . . . . . . . . . . . . . . . . . . . . . . . . . . . . . . $ 197,992 $ 192,039
(1) During 2014 and 2013, the Company decreased its deferred tax assets by $81 million and $30 million,respectively, relating to an adjustment to the 2013 and 2012 foreign net operating loss carryforwards,respectively. The entire decreases of $81 million and $30 million were offset by corresponding decreases invaluation allowances. These adjustments are not considered material to the previously issued financialstatements.
Net operating loss carryforwards were $141 million and $264 million at December 31, 2014 and 2013,respectively. If unused, $5 million will expire between 2015 and 2034. The remainder, totaling $136 million,may be carried forward indefinitely. Tax credit carryforwards were $40 million and $48 million at December 31,2014 and 2013, respectively. If unused, the credit carryforwards will expire between 2015 and 2034.
The U.S. consolidated group has historically generated taxable income after the inclusion of foreigndividends. As such, the Company is not in a federal net operating loss position. This allows IFF and its U.S.subsidiaries to realize tax benefits from the reversal of temporary differences and the utilization of its federal taxcredits before the expiration of the applicable carryforward periods. The Company has not factored any futuretrends, other than inflation, in its U.S. taxable income projections. The corresponding U.S. federal taxableincome is sufficient to realize $160.3 million in deferred tax assets as of December 31, 2014.
The majority of states in the U.S. where IFF and its subsidiaries file income tax returns allow a 100%foreign dividend exclusion, effectively converting the domestic companies’ reversing temporary differences intonet operating losses. As there is significant doubt with respect to realizability of these net operating losses, wehave established a full valuation allowance against these deferred tax assets.
Of the $181 million deferred tax asset for net operating loss carryforwards and credits at December 31,2014, we consider it unlikely that a portion of the tax benefit will be realized. Accordingly, a valuation allowanceof $138 million of net operating loss carryforwards and $8 million of tax credits has been established againstthese deferred tax assets, respectively. In addition, due to realizability concerns, we established a valuationallowance against certain other net deferred tax assets of $210 million.
70

Uncertain Tax Positions
A reconciliation of the beginning and ending amount of unrecognized tax benefits is as follows:
December 31,
(DOLLARS IN THOUSANDS) 2014 2013 2012
Balance of unrecognized tax benefits at beginning of year . . . . . . . . . . . . . . . . . . $21,553 $ 41,153 $ 67,615Gross amount of increases in unrecognized tax benefits as a result of positionstaken during a prior year . . . . . . . . . . . . . . . . . . . . . . . . . . . . . . . . . . . . . . . . . . 1,795 7,364 22,031
Gross amount of decreases in unrecognized tax benefits as a result of positionstaken during a prior year . . . . . . . . . . . . . . . . . . . . . . . . . . . . . . . . . . . . . . . . . . (823) (993) (1,853)
Gross amount of increases in unrecognized tax benefits as a result of positionstaken during the current year . . . . . . . . . . . . . . . . . . . . . . . . . . . . . . . . . . . . . . . 5,378 4,951 3,854
The amounts of decreases in unrecognized benefits relating to settlements withtaxing authorities . . . . . . . . . . . . . . . . . . . . . . . . . . . . . . . . . . . . . . . . . . . . . . . . — (26,712) (48,355)
Reduction in unrecognized tax benefits due to the lapse of applicable statute oflimitation . . . . . . . . . . . . . . . . . . . . . . . . . . . . . . . . . . . . . . . . . . . . . . . . . . . . . . (4,848) (4,210) (2,139)
Balance of unrecognized tax benefits at end of year . . . . . . . . . . . . . . . . . . . . . . . $23,055 $ 21,553 $ 41,153
At December 31, 2014, 2013 and 2012, there are $22.3 million, $21.6 million, and $36.4 million,respectively, of unrecognized tax benefits recorded to Other liabilities and $0.7 million and $4.8 million recordedto Other current liabilities for 2014 and 2012, respectively. If these unrecognized tax benefits were recognized,all the benefits and related interest would be recorded as a benefit to income tax expense.
For the year ended December 31, 2014, the Company reduced its liabilities for interest and penalties by $0.1million, net, and $5.2 million, net, and $5.3 million, net for the years ended 2013 and 2012, respectively,principally due to payments made pursuant to the Spanish tax settlement, as discussed below. At December 31,2014, 2013 and 2012, we had accrued $1.7 million, $2.3 million and $7.4 million, respectively, of interest andpenalties classified as Other liabilities and $0.5 million in 2014 recorded to Other current liabilities.
As of December 31, 2014, the Company’s aggregate provisions for uncertain tax positions, includinginterest and penalties, was $25.2 million, which includes $2.3 million associated with the tax positions taken byour Spanish subsidiaries for the 2002 fiscal year (as discussed below) and the remainder associated with variousother tax positions asserted in foreign jurisdictions, none of which is individually material.
Other
Tax benefits credited to Shareholders’ equity totaled $0.2 million, $0.6 million and $0.4 million for 2014,2013 and 2012, respectively, associated with stock option exercises and Purchased Restricted Stock (“PRS”)dividends.
U.S. income taxes and foreign withholding taxes associated with the repatriation of earnings of its foreignsubsidiaries were not provided on a cumulative total of $1.5 billion of undistributed earnings of foreignsubsidiaries. We intend to, and have plans to, reinvest these earnings indefinitely in our foreign subsidiaries tofund local operations and/or capital projects. The unrecognized deferred tax liability on these undistributedearnings approximates $219 million.
The Company has ongoing income tax audits and legal proceedings which are at various stages ofadministrative or judicial review, of which the material items are discussed below. In addition, the Company hasother ongoing tax audits and legal proceedings that relate to indirect taxes, such as value-added taxes, capital tax,sales and use and property taxes, which are discussed in Note 17.
71

Spanish Tax Items
During 2012 the Company and the Spanish tax authorities entered into an overall settlement with respect toassessments imposed in connection with audits for the 2004-2010 fiscal years. In connection with this settlement,the Company paid Euro 84.0 million ($105.5 million based on exchange rates at the respective payment dates)during 2012 and paid the remainder of Euro 1.5 million ($1.9 million based on the exchange rate at the paymentdate) in 2013. This settlement did not address either the 2002-2003 fiscal years or the 2011 fiscal year. Alsoduring 2012, the Company and the Spanish tax authorities finalized a multi-year agreement that established thetax basis for the Company’s activities in Spain for 2012 through 2014 consistent with the key principlespreliminarily agreed upon as part of the overall settlement.
During 2013, the Company reached a settlement with the Spanish tax authorities related to the 2011 fiscalyear audit, on a basis consistent with the overall settlement reached for the 2004-2010 fiscal year audits, and paidEuro 3.9 million ($5.2 million based on the exchange rate at the payment date).
With respect to the audits of 2002-2003 fiscal years, the Spanish tax authorities imposed assessmentsaggregating Euro 22.4 million ($28.6 million), including aggregate estimated interest. The Company appealedthese assessments, however, in February 2013, the Appellate Court upheld the administrative ruling with respectto the 2003 tax assessment and the related tax avoidance claims. The Company decided not to pursue the appealsprocess with respect to the 2003 tax assessment and paid Euro 20.8 million ($27.3 million based on the exchangerate at the respective payment dates) in connection with the 2003 tax assessment in 2013. In June 2013, theAppellate Court ruled against us on our appeal of the 2002 income tax assessment and related claims, which theCompany also decided not to appeal. However, this case did not have a related tax exposure associated with it. Inan unrelated matter, there was a remaining aggregate assessment related to the 2002 fiscal year of Euro1.9 million ($2.3 million) as of December 31, 2014. To proceed with its appeal of the tax assessment for the 2002fiscal year, the Company was required to post bank guarantees. As of December 31, 2014, the Company hadremaining posted bank guarantees of Euro 1.9 million ($2.3 million) associated with the 2002 appeal. OnFebruary 11, 2015, the Company received a favorable ruling on this appeal.
In addition to the above, the Company has also been a party to four dividend withholding tax controversiesin Spain in which the Spanish tax authorities alleged that the Company’s Spanish subsidiaries underpaidwithholding taxes during the 1995-2001 fiscal years. The Company had previously appealed each of thesecontroversies. During 2012, the Company received unfavorable decisions on the first three cases. As a result ofthese rulings, during 2012 the Company (i) recorded charges (including estimated interest) of approximately$12.0 million after-tax and (ii) made payments of Euro 9.8 million ($12.8 million based on exchange rate at therespective payment dates). At December 31, 2014, the Company had Euro 4.7 million ($5.6 million) reflected inincome taxes payable in connection with these three cases. The fourth case was heard by the Spanish NationalHigh Court in October, 2014 and we received a favorable ruling. Accordingly, during the fourth quarter of 2014,we reversed the total reserve related to the 2001 fiscal year (with a value of Euro 3.6 million of $4.3 million). Asof December 31, 2014, the Company had posted bank guarantees of Euro 4.7 million ($5.6 million) in order toproceed with the appeals of the interest portion of these three remaining controversies.
In addition, the Company has several other tax audits in process and has open tax years with various taxingjurisdictions that range primarily from 2004 to 2013. Based on currently available information, we do not believethe ultimate outcome of any of these tax audits and other tax positions related to open tax years, when finalized,will have a material impact on our financial position.
NOTE 10. SHAREHOLDERS’ EQUITY
Dividends
Cash dividends declared per share were $1.72, $1.46 and $1.30 in 2014, 2013 and 2012, respectively. TheConsolidated Balance Sheet reflects $38.0 million of dividends payable at December 31, 2014. This amount
72

relates to a cash dividend of $0.47 per share declared in December 2014 and paid in January 2015. Dividendsdeclared, but not paid as of December 31, 2013 were $31.7 million ($0.39 per share). There were no dividendspayable as of December 31, 2012. The decrease in the dividends paid in 2013 versus 2012 is a result of theaccelerated payment in December 2012 of the 2012 fourth quarter dividend.
Share Repurchases
In December 2012, the Board of Directors authorized a $250 million share repurchase program, whichcommenced in the first quarter of 2013 and is expected to be completed by the end of 2016. Based on the totalremaining amount of $109 million available under the repurchase program, approximately 1.1 million shares, or1.4% of shares outstanding (based on the market price and shares outstanding as of December 31, 2014) could berepurchased under the program as of December 31, 2014. The purchases will be made from time to time on theopen market or through private transactions as market and business conditions warrant. Repurchased shares willbe placed into treasury stock. The ultimate level of purchases will be a function of the daily purchase limitsestablished in the pre-approved program according to the share price at that time. This plan expires onDecember 31, 2016.
NOTE 11. STOCK COMPENSATION PLANS
We have various equity plans under which our officers, senior management, other key employees anddirectors may be granted options to purchase IFF common stock or other forms of stock-based awards. Beginningin 2004, we granted Restricted Stock Units (“RSUs”) as the principal element of our equity compensation for alleligible U.S. based employees and a majority of eligible overseas employees. Vesting of the RSUs is solely timebased; the vesting period is primarily 3 years from date of grant. For a small group of employees, primarilyoverseas, we granted stock options prior to 2008.
The cost of all employee stock-based awards are principally recognized on a straight-line attribution basisover their respective vesting periods, net of estimated forfeitures. Total stock-based compensation expenseincluded in our Consolidated Statement of Income and Comprehensive Income was as follows:
December 31,
(DOLLARS IN THOUSANDS) 2014 2013 2012
Equity-based awards . . . . . . . . . . . . . . . . . . . . . . . . . . . . . . . . . . . . . . . . . . . . . $22,648 $23,736 $19,716Liability-based awards . . . . . . . . . . . . . . . . . . . . . . . . . . . . . . . . . . . . . . . . . . . . 4,354 4,042 3,294
Total stock-based compensation . . . . . . . . . . . . . . . . . . . . . . . . . . . . . . . . . . . . 27,002 27,778 23,010Less tax benefit . . . . . . . . . . . . . . . . . . . . . . . . . . . . . . . . . . . . . . . . . . . . . . . . . . (8,018) (8,456) (7,228)
Total stock-based compensation, net of tax . . . . . . . . . . . . . . . . . . . . . . . . . . . . $18,984 $19,322 $15,782
The shareholders of the Company approved the Company’s 2010 Stock Award and Incentive Plan (the“2010 Plan”) at the Annual Meeting of Shareholders held on April 27, 2010. The 2010 Plan replaced theCompany’s 2000 Stock Award and Incentive Plan and the 2000 Supplemental Stock Award Plan (the “2000Plans”) and provides the source for future deferrals of cash into deferred stock under the Company’s DeferredCompensation Plan (with the Deferred Compensation Plan being deemed a subplan under the 2010 Plan for thesole purpose of funding deferrals under the IFF Share Fund).
Under the 2010 Plan, a total of 2,749,669 shares are authorized for issuance, including 749,669 sharesremaining available under a previous plan that were rolled into the 2010 Plan. At December 31, 2014,1,206,380 shares were subject to outstanding awards and 1,546,494 shares remained available for future awardsunder all of the Company’s equity award plans, including the 2010 Plan (excluding shares not yet issued underopen cycles of the Company’s Long-Term Incentive Plan).
The Company offers a Long-Term Incentive Plan (“LTIP”) for senior management. The targeted payout is50% cash and 50% IFF stock at the end of the three-year cycle and provides for segmentation in which one-
73

fourth of the award vests during each twelve-month period, with the final one-fourth segment vesting over thefull three-year period. The 2011 grant was earned based on the achievement of defined EPS targets and ourperformance ranking of total shareholder return as a percentile of the S&P 500. Commencing with the 2012-2014LTIP cycle, the Company used Economic Profit (“EP”), rather than EPS, as one of the two financial metrics ofCompany performance. EP measures operating profitability after considering (i) all our operating costs,(ii) income taxes and (iii) a charge for the capital employed in the business. When the award is granted, 50% ofthe target dollar value of the award is converted to a number of “notional” shares based on the closing price at thebeginning of the cycle. For those shares whose payout is based on shareholder return as a percentile of the S&P500, compensation expense is recognized using a graded-vesting attribution method, while compensationexpense for the remainder of the performance shares (e.g., EPS targets) is recognized on a straight-line basis overthe vesting period based on the probable outcome of the performance condition.
The 2010-2012 cycle concluded at the end of 2012 and an aggregate 119,561 shares of our common stockwere issued in March 2013. The 2011-2013 cycle concluded at the end of 2013 and an aggregate 65,735 shares ofour common stock were issued in March 2014. The 2012-2014 cycle concluded at the end of 2014 and anaggregate 90,062 shares of our common stock will be issued in March 2015.
In 2006, our Board approved the Equity Choice Program (the “Program”) for senior management. Thisprogram continues under the 2010 Plan. Eligible employees can choose from among three equity alternatives andwill be granted such equity awards up to certain dollar awards depending on the participant’s grade level. Aparticipant may choose among (1) Stock Settled Appreciation Rights (“SSARs”), (2) RSUs or (3) PRS. No stockoptions were granted in 2014, 2013 or 2012.
SSARs
SSARs granted become exercisable on the third anniversary of the grant date and have a maximum term of7 years. No SSARs were granted in 2014 or 2013. We granted 54,307 SSARs during 2012.
We use the Binomial lattice-pricing model as our valuation model for estimating the fair value of SSARsgranted. In applying the Binomial model, we utilize historical information to estimate expected term and post-vesting terminations within the model. The expected term of a SSAR is based on historical employee exercisebehavior, vesting terms and a contractual life of primarily 7 years. The risk-free interest rate for periods withinthe expected term of the award is based on the U.S. Treasury yield curve in effect at the time of grant. Expectedvolatility is based on an average of implied and historical volatility of the price of our common stock over thecalculated expected term. We anticipate paying cash dividends in the future and therefore use an expecteddividend yield in the valuation model; the cash dividend in effect at the time of grant was employed in thiscalculation.
Principal assumptions used in applying the Binomial model in 2012 were:
2012
Weighted average fair value of SSARs granted during the period . . . . . . . . . . . . . . . . . . . . . . . . . . . . . . $10.39Assumptions:Risk-free interest rate . . . . . . . . . . . . . . . . . . . . . . . . . . . . . . . . . . . . . . . . . . . . . . . . . . . . . . . . . . . . . . . . . 0.9%Expected volatility . . . . . . . . . . . . . . . . . . . . . . . . . . . . . . . . . . . . . . . . . . . . . . . . . . . . . . . . . . . . . . . . . . . 22.5%Expected dividend yield . . . . . . . . . . . . . . . . . . . . . . . . . . . . . . . . . . . . . . . . . . . . . . . . . . . . . . . . . . . . . . . 2.1%Expected life, in years . . . . . . . . . . . . . . . . . . . . . . . . . . . . . . . . . . . . . . . . . . . . . . . . . . . . . . . . . . . . . . . . 5Termination rate . . . . . . . . . . . . . . . . . . . . . . . . . . . . . . . . . . . . . . . . . . . . . . . . . . . . . . . . . . . . . . . . . . . . . 1.05%Exercise multiple . . . . . . . . . . . . . . . . . . . . . . . . . . . . . . . . . . . . . . . . . . . . . . . . . . . . . . . . . . . . . . . . . . . . 1.44
74

SSARs and options activity were as follows:
(SHARE AMOUNTS IN THOUSANDS)Shares Subject toSSARs/Options
WeightedAverage Exercise
Price
SSARs/Options
Exercisable
Balance at December 31, 2013 . . . . . . . . . . . . . . . . . . . . . . . . . 315 $49.96 183Exercised . . . . . . . . . . . . . . . . . . . . . . . . . . . . . . . . . . . . . . (144) $50.45Cancelled . . . . . . . . . . . . . . . . . . . . . . . . . . . . . . . . . . . . . . (20) $60.39
Balance at December 31, 2014 . . . . . . . . . . . . . . . . . . . . . . . . . 151 $51.13 116
The weighted average exercise price of our SSARs and options exercisable at December 31, 2014, 2013 and2012 were $47.92, $41.70 and $37.64, respectively. The following tables summarize information concerningcurrently outstanding and exercisable SSARs and options.
SSARs and options outstanding at December 31, 2014 were as follows:
Price Range
NumberOutstanding(in thousands)
Weighted AverageRemaining
Contractual Life(in years)
WeightedAverage
Exercise Price
AggregateIntrinsic Value(in thousands)
$26 – $30 . . . . . . . . . . . . . . . . . . . . . . . . . . . . 1 4.4 $30.48$31 – $35 . . . . . . . . . . . . . . . . . . . . . . . . . . . . 18 0.9 $35.03$36 – $40 . . . . . . . . . . . . . . . . . . . . . . . . . . . . 6 1.3 $36.00$41 – $50 . . . . . . . . . . . . . . . . . . . . . . . . . . . . 39 1.9 $44.56$51 – $60 . . . . . . . . . . . . . . . . . . . . . . . . . . . . 59 3.4 $56.68$61 – $65 . . . . . . . . . . . . . . . . . . . . . . . . . . . . 28 1.6 $62.13
151 $51.13 $7,490
SSARs and options exercisable as of December 31, 2014 were as follows:
Price Range
NumberExercisable
(in thousands)
Weighted AverageRemaining
Contractual Life(in years)
WeightedAverage
Exercise Price
AggregateIntrinsic Value(in thousands)
$26 – $30 . . . . . . . . . . . . . . . . . . . . . . . . . . . . 1 4.4 $30.48$31 – $35 . . . . . . . . . . . . . . . . . . . . . . . . . . . . 18 0.9 $35.03$36 – $40 . . . . . . . . . . . . . . . . . . . . . . . . . . . . 6 1.3 $36.00$41 – $50 . . . . . . . . . . . . . . . . . . . . . . . . . . . . 39 1.9 $44.56$51 – $55 . . . . . . . . . . . . . . . . . . . . . . . . . . . . 25 2.0 $49.58$61 – $65 . . . . . . . . . . . . . . . . . . . . . . . . . . . . 27 1.61 $62.13
116 $47.92 $6,050
The total intrinsic value of options/SSARs exercised during 2014, 2013 and 2012 totaled $7 million, $11million and $11 million, respectively.
As of December 31, 2014, there was $0.1 million of total unrecognized compensation cost related to non-vested SSARs granted; such cost is expected to be recognized over a period of 0.3 years.
Restricted Stock Units
We have granted RSUs to eligible employees and directors. Such RSUs are subject to forfeiture if certainemployment conditions are not met. RSUs principally vest 100% at the end of 3 years and contain noperformance criteria provisions. An RSU’s fair value is calculated based on the market price of our stock at dateof grant, with an adjustment to reflect the fact that such awards do not participate in dividend rights. Theaggregate fair value is amortized to expense ratably over the vesting period.
75

RSU activity was as follows:
(SHARE AMOUNTS IN THOUSANDS)Number ofShares
Weighted AverageGrant Date FairValue Per Share
Balance at December 31, 2013 . . . . . . . . . . . . . . . . . . . . . . . . . . . . . . . . . . . . . . . . 558 $64.86Granted . . . . . . . . . . . . . . . . . . . . . . . . . . . . . . . . . . . . . . . . . . . . . . . . . . . . . . 206 $94.19Vested . . . . . . . . . . . . . . . . . . . . . . . . . . . . . . . . . . . . . . . . . . . . . . . . . . . . . . . (200) $59.43Forfeited . . . . . . . . . . . . . . . . . . . . . . . . . . . . . . . . . . . . . . . . . . . . . . . . . . . . . (42) $82.34
Balance at December 31, 2014 . . . . . . . . . . . . . . . . . . . . . . . . . . . . . . . . . . . . . . . . 522 $74.83
The total fair value of RSUs which vested during the year ended December 31, 2014 was $19.5 million.
As of December 31, 2014, there was $15.6 million of total unrecognized compensation cost related to non-vested RSUs granted under the equity incentive plans; such cost is expected to be recognized over a weightedaverage period of 1.8 years.
Purchased Restricted Stock
For awards issued in 2012 and prior, PRS provides for eligible employees to purchase restricted shares ofIFF stock at 50% of the fair market value on the grant date of the award. The shares generally vest on the thirdanniversary of the grant date, are subject to continued employment and other specified conditions and paydividends if and when paid by us. Holders of PRS have, in most instances, all of the rights of stockholders,except that they may not sell, assign, pledge or otherwise encumber such shares. RSUs provide no such rights. In2013, the terms of PRS were modified such that, for each share put in escrow by the eligible employee, theCompany matches with a grant of a share of restricted stock or, for non-U.S. participants, a restricted stock unit.We issued 99,091shares of PRS in 2014 for an aggregate purchase price of $9.7 million covering 49,545purchased shares, 101,326 shares of PRS in 2013 for $7.8 million covering 50,633 purchased shares and 228,750shares in 2012 for $6.9 million covering 114,375 purchased shares.
PRS activity was as follows:
(SHARE AMOUNTS IN THOUSANDS)Number ofShares
Weighted AverageGrant Date FairValue Per Share
Balance at December 31, 2013 . . . . . . . . . . . . . . . . . . . . . . . . . . . . . . . . . . . . . . . . 476 $60.58Granted . . . . . . . . . . . . . . . . . . . . . . . . . . . . . . . . . . . . . . . . . . . . . . . . . . . . . . 99 $97.94Vested . . . . . . . . . . . . . . . . . . . . . . . . . . . . . . . . . . . . . . . . . . . . . . . . . . . . . . . (155) $62.13Forfeited . . . . . . . . . . . . . . . . . . . . . . . . . . . . . . . . . . . . . . . . . . . . . . . . . . . . . (40) $57.59
Balance at December 31, 2014 . . . . . . . . . . . . . . . . . . . . . . . . . . . . . . . . . . . . . . . . 380 $57.36
The total fair value of PRS which vested during the year ended December 31, 2014 was $14.9 million.
As of December 31, 2014, there was $6.8 million of total unrecognized compensation cost related to non-vested PRS granted under the equity incentive plans; such cost is expected to be recognized over a weightedaverage period of 1.8 years.
Liability Awards
We have granted Cash RSUs to eligible employees that are paid out 100% in cash upon vesting. Such RSUsare subject to forfeiture if certain employment conditions are not met. Cash RSUs principally vest 100% at theend of three years and contain no performance criteria provisions. A Cash RSU’s fair value is calculated based onthe market price of our stock at date of our closing period and is accounted for as a liability award. The aggregatefair value is amortized to expense ratably over the vesting period.
76

Cash RSU activity was as follows:
(SHARE AMOUNTS IN THOUSANDS) Cash RSUsWeighted Average Fair
Value Per Share
Balance at December 31, 2013 . . . . . . . . . . . . . . . . . . . . . . . . . . . . . . . . . . . . 112 $ 85.94Granted . . . . . . . . . . . . . . . . . . . . . . . . . . . . . . . . . . . . . . . . . . . . . . . . . . . 35 $100.85Vested . . . . . . . . . . . . . . . . . . . . . . . . . . . . . . . . . . . . . . . . . . . . . . . . . . . (37) $ 97.68Cancelled . . . . . . . . . . . . . . . . . . . . . . . . . . . . . . . . . . . . . . . . . . . . . . . . . (4) $ 99.73
Balance at December 31, 2014 . . . . . . . . . . . . . . . . . . . . . . . . . . . . . . . . . . . . 106 $100.85
The total fair value of Cash RSUs which vested during the year ended December 31, 2014 was $3.7 million.
As of December 31, 2014, there was $3.7 million of total unrecognized compensation cost related to non-vested Cash RSUs granted under the equity incentive plans; such cost is expected to be recognized over aweighted average period of 1.9 years. The aggregate compensation cost will be adjusted based on changes in theCompany’s stock price.
NOTE 12. SEGMENT INFORMATION
We are organized into two operating segments, Flavors and Fragrances; these segments align with theinternal structure used to manage these businesses. Flavor compounds are sold to the food and beverageindustries for use in consumer products such as prepared foods, beverages, dairy, food and sweet products.Fragrances is comprised of Fragrance Compounds, which are ultimately used by our customers in two broadcategories: Fine Fragrances, including perfumes and colognes and Consumer Fragrances, including fragrancecompounds for personal care (e.g., soaps), household products (e.g., detergents and cleaning agents) and beautycare, including toiletries; and Fragrance Ingredients, consisting of synthetic and natural ingredients that can becombined with other materials to create unique fine fragrance and consumer compounds. Major fragrancecustomers include the cosmetics industry, including perfume and toiletries manufacturers, and the householdproducts industry, including manufacturers of soaps, detergents, fabric care, household cleaners and airfresheners.
We evaluate the performance of these operating segments based on segment profit which is defined asoperating profit before Restructuring, global expenses (as discussed below) and certain non-recurring items,Interest expense, Other income (expense), net and Taxes on income.
The Global expenses caption represents corporate and headquarters-related expenses which include legal,finance, human resources, certain incentive compensation expenses and other R&D and administrative expensesthat are not allocated to individual operating segments. Unallocated assets are principally cash and cashequivalents and other corporate and headquarters-related assets.
77

Our reportable segment information is as follows:
December 31,
(DOLLARS IN THOUSANDS) 2014 2013 2012
Net salesFlavors . . . . . . . . . . . . . . . . . . . . . . . . . . . . . . . . . . . . . . . . . . . . . $1,457,055 $1,422,739 $1,378,377Fragrances . . . . . . . . . . . . . . . . . . . . . . . . . . . . . . . . . . . . . . . . . . 1,631,478 1,530,157 1,443,069
Consolidated . . . . . . . . . . . . . . . . . . . . . . . . . . . . . . . . . . . . $3,088,533 $2,952,896 $2,821,446
December 31,
(DOLLARS IN THOUSANDS) 2014 2013
Segment assetsFlavors . . . . . . . . . . . . . . . . . . . . . . . . . . . . . . . . . . . . . . . . . . . . . $1,539,254 $1,573,737Fragrances . . . . . . . . . . . . . . . . . . . . . . . . . . . . . . . . . . . . . . . . . . 1,753,477 1,623,033Global assets . . . . . . . . . . . . . . . . . . . . . . . . . . . . . . . . . . . . . . . . 201,890 134,961
Consolidated . . . . . . . . . . . . . . . . . . . . . . . . . . . . . . . . . . . . $3,494,621 $3,331,731
December 31,
(DOLLARS IN THOUSANDS) 2014 2013 2012
Segment profit:Flavors . . . . . . . . . . . . . . . . . . . . . . . . . . . . . . . . . . . . . . . . . . . . . $ 331,257 $ 323,562 $ 298,326Fragrances . . . . . . . . . . . . . . . . . . . . . . . . . . . . . . . . . . . . . . . . . . 335,447 283,651 238,379Global expenses . . . . . . . . . . . . . . . . . . . . . . . . . . . . . . . . . . . . . . (65,443) (66,942) (48,419)
Restructuring and other charges, net . . . . . . . . . . . . . . . . . . . . . . . . . . (1,298) (2,151) (1,668)Spanish capital tax charge(1) . . . . . . . . . . . . . . . . . . . . . . . . . . . . . . . . — (13,011) —Operational improvement initiative costs(2) . . . . . . . . . . . . . . . . . . . . (7,642) (8,770) —
Operating Profit . . . . . . . . . . . . . . . . . . . . . . . . . . . . . . . . . . . . . . . . . . 592,321 516,339 486,618Interest expense . . . . . . . . . . . . . . . . . . . . . . . . . . . . . . . . . . . . . . . . . . (46,067) (46,767) (41,753)Other income (expense), net(3) . . . . . . . . . . . . . . . . . . . . . . . . . . . . . . 2,807 15,638 (1,450)
Income before taxes . . . . . . . . . . . . . . . . . . . . . . . . . . . . . . . . . . . . . . $ 549,061 $ 485,210 $ 443,415
Profit marginFlavors . . . . . . . . . . . . . . . . . . . . . . . . . . . . . . . . . . . . . . . . . . . . . 22.7% 22.7% 21.6%Fragrances . . . . . . . . . . . . . . . . . . . . . . . . . . . . . . . . . . . . . . . . . . 20.6% 18.5% 16.5%Consolidated . . . . . . . . . . . . . . . . . . . . . . . . . . . . . . . . . . . . . . . . 19.2% 17.5% 17.2%
(1) The Spanish capital tax charge represents the charge recorded during the year ended December 31, 2013 asa result of the unfavorable ruling of the Spanish capital tax case from 2002.
(2) Operational improvement initiative costs relate to the closing of a smaller facility in Europe and certainmanufacturing activities in Asia, while transferring production to larger facilities in each respective region.
(3) Other income (expense), net includes a $14.2 million gain on the sale of non-operating assets for the yearended December 31, 2013.
We have not disclosed revenues at a lower level than provided herein, such as revenues from externalcustomers by product, as it is impracticable for us to do so.
We had one customer that accounted for more than 10% of our consolidated net sales in each year for allperiods presented and related net sales were $368 million, $355 million and $320 million in 2014, 2013 and2012, respectively. The majority of these sales were in the Fragrances operating segment.
78

Total long-lived assets consist of net property, plant and equipment and amounted to $720 million and $687million at December 31, 2014 and 2013, respectively. Of this total $159 million and $163 million was located inthe United States at December 31, 2014 and 2013, respectively, and $105 million and $107 million were locatedin the Netherlands at December 31, 2014 and 2013, respectively.
Capital Expenditures Depreciation and Amortization
(DOLLARS IN THOUSANDS) 2014 2013 2012 2014 2013 2012
Flavors . . . . . . . . . . . . . . . . . . . . . . . . . . . . . . . $ 91,104 $108,215 $ 90,309 $36,008 $33,662 $30,816Fragrances . . . . . . . . . . . . . . . . . . . . . . . . . . . . 43,948 17,616 26,069 43,790 39,716 42,987Unallocated assets . . . . . . . . . . . . . . . . . . . . . . 8,130 8,326 9,762 9,556 9,849 2,864
Consolidated . . . . . . . . . . . . . . . . . . . . . . $143,182 $134,157 $126,140 $89,354 $83,227 $76,667
Net Sales by Geographic Area
(DOLLARS IN THOUSANDS) 2014 2013 2012
Europe, Africa and Middle East . . . . . . . . . . . . . . . . . . . . . . . . . . . . . $1,041,585 $ 971,921 $ 912,768Greater Asia . . . . . . . . . . . . . . . . . . . . . . . . . . . . . . . . . . . . . . . . . . . . . 856,217 823,504 771,877North America . . . . . . . . . . . . . . . . . . . . . . . . . . . . . . . . . . . . . . . . . . . 690,214 680,840 694,430Latin America . . . . . . . . . . . . . . . . . . . . . . . . . . . . . . . . . . . . . . . . . . . 500,517 476,631 442,371
Consolidated . . . . . . . . . . . . . . . . . . . . . . . . . . . . . . . . . . . . . . . . $3,088,533 $2,952,896 $2,821,446
Net sales are attributed to individual regions based upon the destination of product delivery. Net salesrelated to the U.S. for the years ended December 31, 2014, 2013 and 2012 were $653 million, $653 million and$662 million, respectively. Net sales attributed to all foreign countries in total for the years ended December 31,2014, 2013 and 2012 were $2,435 million, $2,300 million and $2,159 million, respectively. No non-U.S. countryhad net sales in any period presented greater than 7.1% of total consolidated net sales.
NOTE 13. EMPLOYEE BENEFITS
We have pension and/or other retirement benefit plans covering approximately one-third of activeemployees. In 2007 the Company amended its U.S. qualified and non-qualified pension plans under whichaccrual of future benefits was suspended for all participants that did not meet the rule of 70 (age plus years ofservice equal to at least 70 at December 31, 2007). Pension benefits are generally based on years of service andon compensation during the final years of employment. Plan assets consist primarily of equity securities andcorporate and government fixed income securities. Substantially all pension benefit costs are funded as accrued;such funding is limited, where applicable, to amounts deductible for income tax purposes. Certain otherretirement benefits are provided by general corporate assets.
We sponsor a qualified defined contribution plan covering substantially all U.S. employees. Under this plan,we match 100% of participants’ contributions up to 4% of compensation and 75% of participants’ contributionsfrom over 4% to 8%. Employees that are still eligible to accrue benefits under the defined benefit plan are limitedto a 50% match up to 6% of the participants’ compensation.
In addition to pension benefits, certain health care and life insurance benefits are provided to qualifyingUnited States employees upon retirement from IFF. Such coverage is provided through insurance plans withpremiums based on benefits paid. We do not generally provide health care or life insurance coverage for retiredemployees of foreign subsidiaries; such benefits are provided in most foreign countries by government-sponsoredplans, and the cost of these programs is not material to us.
We offer a non-qualified Deferred Compensation Plan (DCP) for certain key employees and non-employeedirectors. Eligible employees and non-employee directors may elect to defer receipt of salary, incentive paymentsand Board of Directors’ fees into participant directed investments, which are generally invested by the Company
79

in individual variable life insurance contracts we own that are designed to informally fund savings plans of thisnature. The cash surrender value of life insurance is based on the net asset values of the underlying fundsavailable to plan participants. At December 31, 2014 and December 31, 2013, the Consolidated Balance Sheetreflects liabilities of $33.9 million and $29.7 million, respectively, related to the DCP in Other liabilities and$19.0 million and $15.1 million, respectively, included in Capital in excess of par value related to the portion ofthe DCP that will be paid out in IFF shares.
The total cash surrender value of life insurance contracts the Company owns in relation to the DCP andpost-retirement life insurance benefits amounted to $42.4 million and $56.3 million at December 31, 2014 and2013, respectively, and are recorded in Other assets in the Consolidated Balance Sheet.
The plan assets and benefit obligations of our defined benefit pension plans are measured at December 31 ofeach year.
U.S. Plans Non-U.S. Plans
(DOLLARS IN THOUSANDS) 2014 2013 2012 2014 2013 2012
Components of net periodic benefit costService cost for benefits earned . . . . . . . . . . . . $ 3,057 $ 3,644 $ 3,121 $ 14,142 $ 16,423 $ 12,585Interest cost on projected benefit obligation . . . 25,090 23,284 24,314 33,360 31,103 30,944Expected return on plan assets . . . . . . . . . . . . . (27,647) (26,320) (24,329) (49,861) (47,793) (43,728)Net amortization of deferrals . . . . . . . . . . . . . . . 17,656 24,600 20,180 10,584 9,337 6,443Settlements and curtailments . . . . . . . . . . . . . . . — — — 43 215 873
Net periodic benefit cost . . . . . . . . . . . . . . . . . . 18,156 25,208 23,286 8,268 9,285 7,117Defined contribution and other retirementplans . . . . . . . . . . . . . . . . . . . . . . . . . . . . . . . . 7,854 7,326 7,039 6,323 4,094 4,837
Total expense . . . . . . . . . . . . . . . . . . . . . . . . . . . $ 26,010 $ 32,534 $ 30,325 $ 14,591 $ 13,379 $ 11,954
Changes in plan assets and benefitobligations recognized in OCI
Net actuarial (gain) loss . . . . . . . . . . . . . . . . . . . $ 50,918 $(39,754) $138,652 $ 36,134Recognized actuarial loss . . . . . . . . . . . . . . . . . (17,345) (24,296) (10,874) (9,536)Prior service cost . . . . . . . . . . . . . . . . . . . . . . . . 216 — (10,814) (873)Recognized prior service cost . . . . . . . . . . . . . . (311) (304) 248 (15)Currency translation adjustment . . . . . . . . . . . . — — (30,441) 5,464
Total recognized in OCI (before tax effects) . . $ 33,478 $(64,354) $ 86,771 $ 31,174
Postretirement Benefits
(DOLLARS IN THOUSANDS) 2014 2013 2012
Components of net periodic benefit costService cost for benefits earned . . . . . . . . . . . . . . . . . . . . . . . . . . . . . . . . . . . . . $ 1,295 $ 1,526 $ 1,357Interest cost on projected benefit obligation . . . . . . . . . . . . . . . . . . . . . . . . . . . 4,896 4,503 5,656Net amortization and deferrals . . . . . . . . . . . . . . . . . . . . . . . . . . . . . . . . . . . . . (4,109) (3,040) (1,770)
Expense . . . . . . . . . . . . . . . . . . . . . . . . . . . . . . . . . . . . . . . . . . . . . . . . . . . . . . . $ 2,082 $ 2,989 $ 5,243
Changes in plan assets and benefit obligations recognized in OCINet actuarial (gain) . . . . . . . . . . . . . . . . . . . . . . . . . . . . . . . . . . . . . . . . . . . . . . $ 7,706 $(15,524)Recognized actuarial loss . . . . . . . . . . . . . . . . . . . . . . . . . . . . . . . . . . . . . . . . . (540) (1,672)Recognized prior service credit . . . . . . . . . . . . . . . . . . . . . . . . . . . . . . . . . . . . . 4,649 4,712
Total recognized in OCI (before tax effects) . . . . . . . . . . . . . . . . . . . . . . . . . . . $11,815 $(12,484)
80

The amounts expected to be recognized in net periodic cost in 2015 are:
(DOLLARS IN THOUSANDS) U.S. Plans Non-U.S. PlansPostretirement
Benefits
Actuarial loss recognition . . . . . . . . . . . . . . . . . . . . . . . . . . . . . . . . . $20,627 $15,088 $ 1,184Prior service cost (credit) recognition . . . . . . . . . . . . . . . . . . . . . . . . 183 (840) (4,029)
Weighted-average actuarialassumption used to determine expense
U.S. Plans Non-U.S. Plans
2014 2013 2012 2014 2013 2012
Discount rate . . . . . . . . . . . . . . . . . . . . . . . . . . . . . . . . . . . . . 4.70% 4.10% 4.70% 4.18% 4.14% 4.71%Expected return on plan assets . . . . . . . . . . . . . . . . . . . . . . . 7.30% 7.30% 7.30% 6.27% 6.26% 6.27%Rate of compensation increase . . . . . . . . . . . . . . . . . . . . . . . 3.25% 3.25% 3.25% 2.66% 2.73% 2.88%
Changes in the postretirement benefit obligation and plan assets, as applicable, are detailed in the followingtable:
U.S. Plans Non-U.S. Plans Postretirement Benefits
(DOLLARS IN THOUSANDS) 2014 2013 2014 2013 2014 2013
Benefit obligation at beginning ofyear . . . . . . . . . . . . . . . . . . . . . . . . . . . $ 544,602 $573,706 $ 818,578 $780,164 $105,521 $119,308
Service cost for benefits earned . . . . . . . 3,057 3,644 14,142 16,423 1,295 1,526Interest cost on projected benefitobligation . . . . . . . . . . . . . . . . . . . . . . 25,090 23,284 33,360 31,103 4,896 4,503
Actuarial (gain) loss . . . . . . . . . . . . . . . . 79,855 (29,875) 236,096 2,655 7,706 (15,524)Plan amendments . . . . . . . . . . . . . . . . . . 216 — (10,814) (873) — —Adjustments for expense/tax containedin service cost . . . . . . . . . . . . . . . . . . . — — (2,087) (2,343) — —
Plan participants’ contributions . . . . . . . — — 2,096 2,793 1,024 1,022Benefits paid . . . . . . . . . . . . . . . . . . . . . . (27,341) (26,157) (32,134) (27,571) (6,945) (5,314)Curtailments / settlements . . . . . . . . . . . — — (9,270) (768) — —Translation adjustments . . . . . . . . . . . . . — — (86,413) 16,995 — —Acquisitions/Transferred Liabilities . . . . — — 1,712 — — —
Benefit obligation at end of year . . . . . . $ 625,479 $544,602 $ 965,266 $818,578 $113,497 $105,521
Fair value of plan assets at beginning ofyear . . . . . . . . . . . . . . . . . . . . . . . . . . . $ 448,851 $405,289 $ 799,670 $776,188
Actual return on plan assets . . . . . . . . . . 56,584 36,199 135,947 11,970Employer contributions . . . . . . . . . . . . . 23,707 33,520 20,282 19,377Participants’ contributions . . . . . . . . . . . — — 2,096 2,793Benefits paid . . . . . . . . . . . . . . . . . . . . . . (27,341) (26,157) (32,134) (27,571)Settlements . . . . . . . . . . . . . . . . . . . . . . . — — — (768)Translation adjustments . . . . . . . . . . . . . — — (74,680) 17,681Acquisitions/Transferred Assets . . . . . . . — — 1,712 —
Fair value of plan assets at end ofyear . . . . . . . . . . . . . . . . . . . . . . . . . . . $ 501,801 $448,851 $ 852,893 $799,670
Funded status at end of year . . . . . . . . . . $(123,678) $ (95,751) $(112,373) $ (18,908)
U.S. Plans Non-U.S. Plans
(DOLLARS IN THOUSANDS) 2014 2013 2014 2013
Amounts recognized in the balance sheet:Other assets . . . . . . . . . . . . . . . . . . . . . . . . . . . . . . . . . . . . . . . . . . $ — $ — $ 1,338 $ 14,058Other current liabilities . . . . . . . . . . . . . . . . . . . . . . . . . . . . . . . . . (3,887) (3,819) (608) (651)Retirement liabilities . . . . . . . . . . . . . . . . . . . . . . . . . . . . . . . . . . . (119,791) (91,930) (113,103) (32,315)
Net amount recognized . . . . . . . . . . . . . . . . . . . . . . . . . . . . . . . . . $(123,678) $(95,749) $(112,373) $(18,908)
81

U.S. Plans Non-U.S. Plans Postretirement Benefits
(DOLLARS IN THOUSANDS) 2014 2013 2014 2013 2014 2013
Amounts recognized in AOCI consist of:Net actuarial loss . . . . . . . . . . . . . . . . . . . . $178,677 $145,105 $360,070 $263,930 $ 21,057 $ 13,891Prior service cost (credit) . . . . . . . . . . . . . . 387 482 (10,697) (1,330) (10,358) (15,007)
Total AOCI (before tax effects) . . . . . . . . . $179,064 $145,587 $349,373 $262,600 $ 10,699 $ (1,116)
U.S. Plans Non-U.S. Plans
(DOLLARS IN THOUSANDS) 2014 2013 2014 2013
Accumulated Benefit Obligation — end of year . . . . . . . . . . $616,004 $536,176 $942,103 $777,188
Information for Pension Plans with an ABO in excess ofPlan Assets:
Projected benefit obligation . . . . . . . . . . . . . . . . . . . . . . . . . . . . $625,479 $544,602 $695,552 $ 43,778Accumulated benefit obligation . . . . . . . . . . . . . . . . . . . . . . . . . 616,004 536,176 672,389 41,991Fair value of plan assets . . . . . . . . . . . . . . . . . . . . . . . . . . . . . . . 501,801 448,851 581,841 18,669
Weighted-average assumptions used to determineobligations at December 31
Discount rate . . . . . . . . . . . . . . . . . . . . . . . . . . . . . . . . . . . . . . . . 3.90% 4.70% 2.74% 4.18%Rate of compensation increase . . . . . . . . . . . . . . . . . . . . . . . . . . 3.25% 3.25% 2.00% 2.66%
(DOLLARS IN THOUSANDS) U.S. Plans Non-U.S. PlansPostretirement
Benefits
Estimated Future Benefit Payments2015 . . . . . . . . . . . . . . . . . . . . . . . . . . . . . . . . . . . . . . . . . . . . . . . . . . 30,068 28,045 5,0852016 . . . . . . . . . . . . . . . . . . . . . . . . . . . . . . . . . . . . . . . . . . . . . . . . . . 31,194 27,710 5,2852017 . . . . . . . . . . . . . . . . . . . . . . . . . . . . . . . . . . . . . . . . . . . . . . . . . . 32,589 28,893 5,5222018 . . . . . . . . . . . . . . . . . . . . . . . . . . . . . . . . . . . . . . . . . . . . . . . . . . 34,115 31,459 5,7842019 . . . . . . . . . . . . . . . . . . . . . . . . . . . . . . . . . . . . . . . . . . . . . . . . . . 35,483 32,259 6,0432020-2024 . . . . . . . . . . . . . . . . . . . . . . . . . . . . . . . . . . . . . . . . . . . . . 188,512 169,579 33,627
ContributionsRequired Company Contributions in the Following Year (2015) . . . $ 4,156 $ 16,183 $ 5,085
We consider a number of factors in determining and selecting assumptions for the overall expected long-term rate of return on plan assets. We consider the historical long-term return experience of our assets, thecurrent and expected allocation of our plan assets and expected long-term rates of return. We derive theseexpected long-term rates of return with the assistance of our investment advisors. We base our expectedallocation of plan assets on a diversified portfolio consisting of domestic and international equity securities, fixedincome, real estate and alternative asset classes. The asset allocation is monitored on an ongoing basis.
82

We consider a variety of factors in determining and selecting our assumptions for the discount rate atDecember 31. For the U.S. plans, the discount rate was based on the internal rate of return for a portfolio ofMoody’s Aaa, Aa and Merrill Lynch AAA-AA high quality bonds with maturities that are consistent with theprojected future benefit payment obligations of the plan. The rate of compensation increase for all plans and themedical cost trend rate for the applicable U.S. plans are based on plan experience.
U.S. Plans Non-U.S. Plans
2014 2013 2014 2013
Percentage of assets invested in:Cash and cash equivalents . . . . . . . . . . . . . . . . . . . . . . . . . . . . . . . . . . . . . . . . . . . . 1% 1% 1% 2%Equities . . . . . . . . . . . . . . . . . . . . . . . . . . . . . . . . . . . . . . . . . . . . . . . . . . . . . . . . . . 40% 48% 26% 25%Fixed income . . . . . . . . . . . . . . . . . . . . . . . . . . . . . . . . . . . . . . . . . . . . . . . . . . . . . . 59% 51% 62% 59%Property . . . . . . . . . . . . . . . . . . . . . . . . . . . . . . . . . . . . . . . . . . . . . . . . . . . . . . . . . . 0% 0% 7% 8%Alternative and other investments . . . . . . . . . . . . . . . . . . . . . . . . . . . . . . . . . . . . . . 0% 0% 4% 6%
With respect to the U.S. plans, the expected return on plan assets was determined based on an assetallocation model using the current target allocation, real rates of return by asset class and an anticipated inflationrate. The target investment allocation is 40% equity securities and 60% fixed income securities.
The expected annual rate of return for the non-U.S. plans employs a similar set of criteria adapted for localinvestments, inflation rates and in certain cases specific government requirements. The target asset allocation, forthe non-U.S. plans, consists of approximately: 40% – 60% in fixed income securities; 20% – 40% in equitysecurities; 5% – 20% in real estate; and 5% – 10% in alternative investments.
The following tables present our plan assets for the U.S. and non-U.S. plans using the fair value hierarchy asof December 31, 2014 and 2013. Our plans’ assets were accounted for at fair value and are classified in theirentirety based on the lowest level of input that is significant to the fair value measurement. Our assessment of thesignificance of a particular input to the fair value measurement requires judgment, and may affect the valuationof fair value assets and their placement within the fair value hierarchy levels. For more information on adescription of the fair value hierarchy, see Note 14.
U.S. Plans for the year endedDecember 31, 2014
(DOLLARS IN THOUSANDS) Level 1 Level 2 Level 3 Total
Cash Equivalents . . . . . . . . . . . . . . . . . . . . . . . . . . . . . . . . . . . . . . $ — $ 3,829 $— $ 3,829Equity SecuritiesU.S. Common Stock . . . . . . . . . . . . . . . . . . . . . . . . . . . . . . . . . . . . 37,278 — — 37,278Non-U.S. Common Stock . . . . . . . . . . . . . . . . . . . . . . . . . . . . . . . . 1,635 — — 1,635Balanced Funds . . . . . . . . . . . . . . . . . . . . . . . . . . . . . . . . . . . . . . . — 9,270 — 9,270Pooled Funds . . . . . . . . . . . . . . . . . . . . . . . . . . . . . . . . . . . . . . . . . — 154,559 — 154,559Fixed Income SecuritiesGovernment & Government Agency Bonds . . . . . . . . . . . . . . . . . — 10,620 — 10,620Mutual Funds . . . . . . . . . . . . . . . . . . . . . . . . . . . . . . . . . . . . . . . . . — 212,007 — 212,007Corporate Bonds . . . . . . . . . . . . . . . . . . . . . . . . . . . . . . . . . . . . . . . — 63,057 — 63,057Municipal Bonds . . . . . . . . . . . . . . . . . . . . . . . . . . . . . . . . . . . . . . — 9,100 — 9,100
Total . . . . . . . . . . . . . . . . . . . . . . . . . . . . . . . . . . . . . . . . . . . . . . . . $38,913 $462,442 $— $501,355
Receivables . . . . . . . . . . . . . . . . . . . . . . . . . . . . . . . . . . . . . . . . . . . $ 446
Total . . . . . . . . . . . . . . . . . . . . . . . . . . . . . . . . . . . . . . . . . . . . . . . . $501,801
83

U.S. Plans for the year endedDecember 31, 2013
(DOLLARS IN THOUSANDS) Level 1 Level 2 Level 3 Total
Cash Equivalents . . . . . . . . . . . . . . . . . . . . . . . . . . . . . . . . . . . . . . $ — $ 5,694 $— $ 5,694Equity SecuritiesU.S. Common Stock . . . . . . . . . . . . . . . . . . . . . . . . . . . . . . . . . . . . 38,993 — — 38,993Non-U.S. Common Stock . . . . . . . . . . . . . . . . . . . . . . . . . . . . . . . . 343 — — 343Balanced Funds . . . . . . . . . . . . . . . . . . . . . . . . . . . . . . . . . . . . . . . — 8,389 — 8,389Pooled Funds . . . . . . . . . . . . . . . . . . . . . . . . . . . . . . . . . . . . . . . . . — 165,670 — 165,670Fixed Income SecuritiesGovernment & Government Agency Bonds . . . . . . . . . . . . . . . . . — 8,262 — 8,262Mutual Funds . . . . . . . . . . . . . . . . . . . . . . . . . . . . . . . . . . . . . . . . . — 158,646 — 158,646Corporate Bonds . . . . . . . . . . . . . . . . . . . . . . . . . . . . . . . . . . . . . . . — 54,699 — 54,699Municipal Bonds . . . . . . . . . . . . . . . . . . . . . . . . . . . . . . . . . . . . . . — 7,440 — 7,440
Total . . . . . . . . . . . . . . . . . . . . . . . . . . . . . . . . . . . . . . . . . . . . . . . . $39,336 $408,800 $— $448,136
Receivables . . . . . . . . . . . . . . . . . . . . . . . . . . . . . . . . . . . . . . . . . . . $ 715
Total . . . . . . . . . . . . . . . . . . . . . . . . . . . . . . . . . . . . . . . . . . . . . . . . $448,851
Non-U.S. Plans for the year endedDecember 31, 2014
(DOLLARS IN THOUSANDS) Level 1 Level 2 Level 3 Total
Cash . . . . . . . . . . . . . . . . . . . . . . . . . . . . . . . . . . . . . . . . . . . . . $ 10,792 $ — $ — $ 10,792Equity SecuritiesU.S. Large Cap . . . . . . . . . . . . . . . . . . . . . . . . . . . . . . . . . . . . . 64,852 8,295 — 73,147Non-U.S. Large Cap . . . . . . . . . . . . . . . . . . . . . . . . . . . . . . . . . 83,671 5,853 — 89,524Non-U.S. Mid Cap . . . . . . . . . . . . . . . . . . . . . . . . . . . . . . . . . . 145 — — 145Non-U.S. Small Cap . . . . . . . . . . . . . . . . . . . . . . . . . . . . . . . . . 33 — — 33Emerging Markets . . . . . . . . . . . . . . . . . . . . . . . . . . . . . . . . . . . 52,664 1,214 — 53,878Fixed Income SecuritiesU.S. Treasuries/Government Bonds . . . . . . . . . . . . . . . . . . . . . 47 — — 47Non-U.S. Treasuries/Government Bonds . . . . . . . . . . . . . . . . . 163,143 100,544 — 263,687Non-U.S. Corporate Bonds . . . . . . . . . . . . . . . . . . . . . . . . . . . . 62,630 186,837 — 249,467Non-U.S. Asset-Backed Securities . . . . . . . . . . . . . . . . . . . . . . — 16,375 — 16,375Non-U.S. Other Fixed Income . . . . . . . . . . . . . . . . . . . . . . . . . 1,409 — — 1,409Alternative Types of InvestmentsInsurance Contracts . . . . . . . . . . . . . . . . . . . . . . . . . . . . . . . . . . 316 — — 316Hedge Funds . . . . . . . . . . . . . . . . . . . . . . . . . . . . . . . . . . . . . . . — — 14,775 14,775Other . . . . . . . . . . . . . . . . . . . . . . . . . . . . . . . . . . . . . . . . . . . . . 904 — — 904Absolute Return Funds . . . . . . . . . . . . . . . . . . . . . . . . . . . . . . . — 17,135 — 17,135Private Equity Funds . . . . . . . . . . . . . . . . . . . . . . . . . . . . . . . . . — — 6 6Real EstateNon-U.S. Real Estate . . . . . . . . . . . . . . . . . . . . . . . . . . . . . . . . — 56,346 4,907 61,253
Total . . . . . . . . . . . . . . . . . . . . . . . . . . . . . . . . . . . . . . . . . . . . . $440,606 $392,599 $19,688 $852,893
84

Non-U.S. Plans for the year endedDecember 31, 2013
(DOLLARS IN THOUSANDS) Level 1 Level 2 Level 3 Total
Cash . . . . . . . . . . . . . . . . . . . . . . . . . . . . . . . . . . . . . . . . . . . . . $ 11,956 $ — $ — $ 11,956Equity SecuritiesU.S. Large Cap . . . . . . . . . . . . . . . . . . . . . . . . . . . . . . . . . . . . . 40,274 — — 40,274Non-U.S. Large Cap . . . . . . . . . . . . . . . . . . . . . . . . . . . . . . . . . 92,551 12,783 — 105,334Non-U.S. Mid Cap . . . . . . . . . . . . . . . . . . . . . . . . . . . . . . . . . . 107 — — 107Non-U.S. Small Cap . . . . . . . . . . . . . . . . . . . . . . . . . . . . . . . . . 29 — — 29Emerging Markets . . . . . . . . . . . . . . . . . . . . . . . . . . . . . . . . . . . 57,689 — — 57,689Fixed Income SecuritiesU.S. Treasuries/Government Bonds . . . . . . . . . . . . . . . . . . . . . 328 — — 328U.S. Corporate Bonds . . . . . . . . . . . . . . . . . . . . . . . . . . . . . . . . — — — —Non-U.S. Treasuries/Government Bonds . . . . . . . . . . . . . . . . . 120,651 75,131 — 195,782Non-U.S. Corporate Bonds . . . . . . . . . . . . . . . . . . . . . . . . . . . . 65,443 189,707 — 255,150Non-U.S. Mortgage-Backed Securities . . . . . . . . . . . . . . . . . . . — — — —Non-U.S. Asset-Backed Securities . . . . . . . . . . . . . . . . . . . . . . — 17,895 — 17,895Non-U.S. Other Fixed Income . . . . . . . . . . . . . . . . . . . . . . . . . 1,205 — — 1,205Alternative Types of InvestmentsInsurance Contracts . . . . . . . . . . . . . . . . . . . . . . . . . . . . . . . . . . 334 — — 334Hedge Funds . . . . . . . . . . . . . . . . . . . . . . . . . . . . . . . . . . . . . . . — — 15,280 15,280Other . . . . . . . . . . . . . . . . . . . . . . . . . . . . . . . . . . . . . . . . . . . . . 928 — — 928Absolute Return Funds . . . . . . . . . . . . . . . . . . . . . . . . . . . . . . . — 31,253 — 31,253Private Equity Funds . . . . . . . . . . . . . . . . . . . . . . . . . . . . . . . . . — — 7 7Real EstateNon-U.S. Real Estate . . . . . . . . . . . . . . . . . . . . . . . . . . . . . . . . — 58,660 7,459 66,119
Total . . . . . . . . . . . . . . . . . . . . . . . . . . . . . . . . . . . . . . . . . . . . . $391,495 $385,429 $22,746 $799,670
Cash and cash equivalents are primarily held in registered money market funds which are valued using amarket approach based on the quoted market prices of identical instruments. Other cash and cash equivalents arevalued daily by the fund using a market approach with inputs that include quoted market prices for similarinstruments.
Equity securities are primarily valued using a market approach based on the quoted market prices ofidentical instruments. Pooled funds are typically common or collective trusts valued at their net asset values(NAVs).
Fixed income securities are primarily valued using a market approach with inputs that include broker quotesand benchmark yields.
Derivative instruments are valued by the custodian using closing market swap curves and market derivedinputs.
Real estate values are primarily based on valuation of the underlying investments, which include inputs suchas cost, discounted future cash flows, independent appraisals and market comparable data.
Hedge funds are valued based on valuation of the underlying securities and instruments within the funds.Quoted market prices are used when available and NAVs are used for unquoted securities within the funds.
Absolute return funds are actively managed funds mainly invested in debt and equity securities and arevalued at their NAVs.
85

The following table presents a reconciliation of Level 3 non-U.S. plan assets held during the year endedDecember 31, 2014:
Non-U.S. Plans
(DOLLARS IN THOUSANDS)RealEstate
PrivateEquity
HedgeFunds Total
Ending balance as of December 31, 2013 . . . . . . . . . . . . . . . . . . . . . . . . . . $ 7,459 $ 7 $15,280 $22,746Actual return on plan assets . . . . . . . . . . . . . . . . . . . . . . . . . . . . . . . . . . . . (2,322) (1) (505) (2,828)Purchases, sales and settlements . . . . . . . . . . . . . . . . . . . . . . . . . . . . . . . . . (230) — — (230)
Ending balance as of December 31, 2014 . . . . . . . . . . . . . . . . . . . . . . . . . . $ 4,907 $ 6 $14,775 $19,688
The following weighted average assumptions were used to determine our postretirement benefit expense andobligation for the years ended December 31:
Expense Liability
2014 2013 2014 2013
Discount rate . . . . . . . . . . . . . . . . . . . . . . . . . . . . . . . . . . . . . . . . . . . . . . . . . . . . 4.80% 4.00% 3.90% 4.80%Current medical cost trend rate . . . . . . . . . . . . . . . . . . . . . . . . . . . . . . . . . . . . . . 6.50% 6.75% 5.80% 6.50%Ultimate medical cost trend rate . . . . . . . . . . . . . . . . . . . . . . . . . . . . . . . . . . . . . 4.75% 4.75% 4.75% 4.75%Medical cost trend rate decreases to ultimate rate in year . . . . . . . . . . . . . . . . . 2021 2021 2023 2021
Sensitivity of Disclosures to Changes in Selected Assumptions
25 BP Decrease in DiscountRate
25 BP Decrease inDiscount Rate
25 BP Decrease inLong-Term Rate of
Return
(DOLLARS IN THOUSANDS)Change in
PBOChange in
ABOChange in
pension expenseChange in pension
expense
U.S. Pension Plans . . . . . . . . . . . . . . . . . . . . . . . . . $19,983 $19,609 $1,304 $1,043Non-U.S. Pension Plans . . . . . . . . . . . . . . . . . . . . . $47,377 $45,329 $2,783 $2,115Postretirement Benefit Plan . . . . . . . . . . . . . . . . . . N/A $ 3,745 $ 215 N/A
The effect of a 1% increase in the medical cost trend rate would increase the accumulated postretirementbenefit obligation and the annual postretirement expense by approximately $6.9 million and $0.3 million,respectively; a 1% decrease in the rate would decrease the obligation and expense by approximately $6.7 millionand $0.3 million, respectively.
We contributed $20.0 million and $20.3 million to our qualified U.S. pension plans and non-U.S. pensionplans in 2014, respectively. We made $3.7 million in benefit payments with respect to our non-qualified U.S.pension plan. In addition, $6.9 million of payments were made with respect to our other postretirement plans.
NOTE 14. FINANCIAL INSTRUMENTS
Fair Value
Accounting guidance on fair value measurements specifies a hierarchy of valuation techniques based onwhether the inputs to those valuation techniques are observable or unobservable. Observable inputs reflectmarket data obtained from independent sources, while unobservable inputs reflect our market assumptions. Thesetwo types of inputs create the following fair value hierarchy:
‰ Level 1 — Quoted prices for identical instruments in active markets.
‰ Level 2 — Quoted prices for similar instruments in active markets; quoted prices for identical or similarinstruments in markets that are not active; and model-derived valuations in which all significant inputsand significant value drivers are observable in active markets.
86

‰ Level 3 — Valuations derived from valuation techniques in which one or more significant inputs orsignificant value drivers are unobservable.
This hierarchy requires us to use observable market data, when available, and to minimize the use ofunobservable inputs when determining fair value. We determine the fair value of structured liabilities (whereperformance is linked to structured interest rates, inflation or currency risks) using the London InterBank OfferRate (“LIBOR”) swap curve and forward interest and exchange rates at period end. Such instruments areclassified as Level 2 based on the observability of significant inputs to the model. We do not have anyinstruments classified as Level 1 or Level 3, other than those included in pension asset trusts included in Note 13.
These valuations take into consideration our credit risk and our counterparties’ credit risk. The estimatedchange in the fair value of these instruments due to such changes in our own credit risk (or instrument-specificcredit risk) was immaterial as of December 31, 2014.
The amounts recorded in the balance sheet (carrying amount) and the estimated fair values of financialinstruments at December 31 consisted of the following:
2014 2013
(DOLLARS IN THOUSANDS)CarryingAmount
FairValue
CarryingAmount
FairValue
Cash and cash equivalents(1) . . . . . . . . . . . . . . . . . . . . . . . . . . . . . . $478,573 $478,573 $405,505 $405,505Credit facilities and bank overdrafts(2) . . . . . . . . . . . . . . . . . . . . . . 12,335 12,335 984 984Long-term debt:(3)
Senior notes — 2007 . . . . . . . . . . . . . . . . . . . . . . . . . . . . . . . . 500,000 587,650 500,000 590,024Senior notes — 2006 . . . . . . . . . . . . . . . . . . . . . . . . . . . . . . . . 125,000 133,137 125,000 139,146Senior notes — 2013 . . . . . . . . . . . . . . . . . . . . . . . . . . . . . . . . 299,782 296,290 299,736 278,770
(1) The carrying amount of cash and cash equivalents approximates fair value due to the short maturity of thoseinstruments.
(2) The carrying amount of our credit facilities and bank overdrafts approximates fair value as the interest rateis reset frequently based on current market rates as well as the short maturity of those instruments.
(3) The fair value of our long-term debt was calculated using discounted cash flows applying current interestrates and current credit spreads based on our own credit risk.
Derivatives
We periodically enter into foreign currency forward contracts with the objective of reducing exposure tocash flow volatility associated with our intercompany loans, foreign currency receivables and payables andanticipated purchases of certain raw materials used in operations. These contracts generally involve the exchangeof one currency for a second currency at a future date, have maturities not exceeding twelve months and are withcounterparties which are major international financial institutions.
In 2003, we executed a 10-year Yen — U.S. dollar currency swap related to the monthly sale and purchaseof products between the U.S. and Japan which has been designated as a cash flow hedge. This swap matured inJanuary 2013.
During the years ended December 31, 2014 and 2013, we entered into forward currency contracts whichqualified as net investment hedges, in order to mitigate a portion of our net European investments from foreigncurrency risk. The effective portions of net investment hedges are recorded in other comprehensive income(“OCI”) as a component of Foreign currency translation adjustments in the accompanying ConsolidatedStatement of Income and Comprehensive Income. Realized gains/(losses) are deferred in AOCI where they willremain until the net investments in our European subsidiaries are divested. Six of these forward currencycontracts matured during the year ended December 31, 2014. The outstanding forward currency contacts haveremaining maturities of less than one year.
87

During the year ended December 31, 2014 and 2013, we continued to enter into several forward currencycontracts which qualified as cash flow hedges. The objective of these hedges is to protect against the currencyrisk associated with forecasted U.S. dollar (USD) denominated raw material purchases made by Euro (EUR)functional currency entities which result from changes in the EUR/USD exchange rate. The effective portions ofcash flow hedges are recorded in OCI as a component of Gains/(Losses) on derivatives qualifying as hedges inthe accompanying Consolidated Statement of Income and Comprehensive Income. Realized gains/(losses) inAOCI related to cash flow hedges of raw material purchases are recognized as a component of Cost of goods soldin the accompanying Consolidated Statement of Income and Comprehensive Income in the same period as therelated costs are recognized.
During 2014 and 2013, we entered into interest rate swap agreements that effectively converted the fixedrate on a portion of our long-term borrowings to a variable short-term rate based on the LIBOR plus an interestmarkup. These swaps are designated as fair value hedges. Amounts recognized in Interest expense wereimmaterial for the year ended December 31, 2014.
During Q1 2013, we entered into three interest rate swaps to hedge the anticipated issuance of fixed-ratedebt, which are designated as cash flow hedges. The effective portions of cash flow hedges are recorded in OCIas a component of Losses/gains on derivatives qualifying as hedges in the accompanying Consolidated Statementof Income and Comprehensive Income. During the second quarter of 2013, we terminated these swaps andincurred a loss of $2.7 million, which we will amortize as Interest expense over the life of the Senior Notes —2013 (discussed in Note 8).
The following table shows the notional amount of the Company’s derivative instruments outstanding as ofDecember 31, 2014 and December 31, 2013:
(DOLLARS IN THOUSANDS)December 31,
2014December 31,
2013
Forward currency contracts . . . . . . . . . . . . . . . . . . . . . . . . . . . . . . . . . . . . . . . . . . . . $191,150 $255,500Interest rate swaps . . . . . . . . . . . . . . . . . . . . . . . . . . . . . . . . . . . . . . . . . . . . . . . . . . . $425,000 $375,000
88

The following tables show the Company’s derivative instruments measured at fair value (Level 2 of the fairvalue hierarchy) as reflected in the Consolidated Balance Sheets as of December 31, 2014 and December 31,2013 (in thousands):
December 31, 2014
Fair Value ofDerivatives
Designated asHedging
Instruments
Fair Value ofDerivatives NotDesignated as
HedgingInstruments
Total FairValue
Derivative assets(a)
Foreign currency contracts . . . . . . . . . . . . . . . . . . . . . . . . . . . . . $16,637 $4,398 $21,035Interest rate swaps . . . . . . . . . . . . . . . . . . . . . . . . . . . . . . . . . . . . 683 — 683
$17,320 $4,398 $21,718Derivative liabilities(b)
Foreign currency contracts . . . . . . . . . . . . . . . . . . . . . . . . . . . . . $ 6 $1,055 $ 1,061
December 31, 2013
Fair Value ofDerivatives
Designated asHedging
Instruments
Fair Value ofDerivatives NotDesignated as
HedgingInstruments
Total FairValue
Derivative assets(a)
Foreign currency contracts . . . . . . . . . . . . . . . . . . . . . . . . . . . . . $ 580 $8,896 $ 9,476Interest rate swaps . . . . . . . . . . . . . . . . . . . . . . . . . . . . . . . . . . . . 670 — 670
$ 1,250 $8,896 $10,146Derivative liabilities(b)
Foreign currency contracts . . . . . . . . . . . . . . . . . . . . . . . . . . . . . $ 6,024 $2,909 $ 8,933
(a) Derivative assets are recorded to Prepaid expenses and other current assets in the Consolidated BalanceSheet.
(b) Derivative liabilities are recorded as Other current liabilities in the Consolidated Balance Sheet.
The following table shows the effect of the Company’s derivative instruments which were not designated ashedging instruments in the Consolidated Statement of Income and Comprehensive Income for the years endedDecember 31, 2014 and December 31, 2013 (in thousands):
Derivatives Not Designated as Hedging Instruments
Amount of GainFor the years ended
December 31, Location of GainRecognized in
Income on Derivative2014 2013
Foreign currency contract . . . . . . . . . . . . . . . . . . . . . . . . . $25,678 $16,479 Other (income) expense, net
Most of these net gains (losses) offset any recognized gains (losses) arising from the revaluation of therelated intercompany loans during the same respective periods.
89

The following table shows the effect of the Company’s derivative instruments designated as cash flow andnet investment hedging instruments in the Consolidated Statement of Income and Comprehensive Income for theyears ended December 31, 2014 and December 31, 2013 (in thousands):
Amount of Gain or(Loss) Recognized inOCI on Derivative(Effective Portion) Location of Gain or
(Loss) Reclassifiedfrom AccumulatedOCI into Income(Effective Portion)
Amount of Gain or(Loss) Reclassifiedfrom AccumulatedOCI into Income(Effective Portion)
For the years endedDecember 31,
For the years endedDecember 31,
2014 2013 2014 2013
Derivatives in Cash Flow HedgingRelationships:
Cross currency swap(1) . . . . . . . . . . . . . . . $ — $ — Other (income) expense, net $ — $ (333)Forward currency contract . . . . . . . . . . . . 16,109 (1,308) Cost of goods sold (3,675) (624)Interest rate swaps(2) . . . . . . . . . . . . . . . . . 274 (2,530) Interest expense (274) (205)
Derivatives in Net Investment HedgingRelationships:
Forward currency contract . . . . . . . . . . . . 7,415 (1,330) N/A — —
Total . . . . . . . . . . . . . . . . . . . . . . . . . . . . $23,798 $(5,168) $(3,949) $(1,162)
(1) Ten year swap executed in 2003, matured in January 2013.(2) Interest rate swaps were entered into as pre-issuance hedges for the $300 million bond offering.
The ineffective portion of the above noted cash flow hedges and net investment hedges was not material forthe years ended December 31, 2014 and 2013.
The Company expects approximately $7.0 million (net of tax), of derivative gains included in AOCI atDecember 31, 2014, based on current market rates, will be reclassified into earnings within the next twelvemonths. The majority of this amount will vary due to fluctuations in foreign currency exchange rates.
NOTE 15. ACCUMULATED OTHER COMPREHENSIVE INCOME (LOSS)
The following tables present changes in the accumulated balances for each component of othercomprehensive income, including current period other comprehensive income and reclassifications out ofaccumulated other comprehensive income:
(DOLLARS IN THOUSANDS)
ForeignCurrencyTranslationAdjustments
(Losses) Gains onDerivativesQualifying as
Hedges
Pension andPostretirement
LiabilityAdjustment Total
Accumulated other comprehensive loss, net of tax,as of December 31, 2013 . . . . . . . . . . . . . . . . . . . . . $(104,278) $ (4,012) $(284,421) $(392,711)
OCI before reclassifications . . . . . . . . . . . . . . . . . (69,064) 12,434 (111,915) (168,545)Amounts reclassified from AOCI . . . . . . . . . . . . . — 3,949 16,877 20,826
Net current period other comprehensive income(loss) . . . . . . . . . . . . . . . . . . . . . . . . . . . . . . . . . . . . . (69,064) 16,383 (95,038) (147,719)
Accumulated other comprehensive loss, net of tax,as of December 31, 2014 . . . . . . . . . . . . . . . . . . . . . $(173,342) $12,371 $(379,459) $(540,430)
90

(DOLLARS IN THOUSANDS)
ForeignCurrencyTranslationAdjustments
(Losses) Gains onDerivativesQualifying as
Hedges
Pension andPostretirement
LiabilityAdjustment Total
Accumulated other comprehensive (loss) income,net of tax, as of December 31, 2012 . . . . . . . . . . . . $ (93,722) $ (218) $(309,685) $(403,625)
OCI before reclassifications . . . . . . . . . . . . . . . . . (10,556) (4,956) 4,339 (11,173)Amounts reclassified from AOCI . . . . . . . . . . . . . — 1,162 20,925 22,087
Net current period other comprehensive income(loss) . . . . . . . . . . . . . . . . . . . . . . . . . . . . . . . . . . . . . (10,556) (3,794) 25,264 10,914
Accumulated other comprehensive loss, net of tax,as of December 31, 2013 . . . . . . . . . . . . . . . . . . . . . $(104,278) $(4,012) $(284,421) $(392,711)
The following table provides details about reclassifications out of accumulated other comprehensive incometo the Consolidated Statement of Comprehensive Income:
(DOLLARS IN THOUSANDS)December 31,
2014December 31,
2013
Affected Line Item in theConsolidated Statementof Comprehensive Income
(Losses) gains on derivatives qualifying as hedgesCross currency swap . . . . . . . . . . . . . . . . . . . . . . . $ — $ (333) Other (income) expense, netForeign currency contracts . . . . . . . . . . . . . . . . . . (4,426) (861) Cost of goods soldInterest rate swaps . . . . . . . . . . . . . . . . . . . . . . . . (274) (205) Interest expense
751 237 Provision for income taxes
$ (3,949) $ (1,162) Total, net of income taxes
(Losses) gains on pension and postretirement liabilityadjustmentsSettlements / Curtailments . . . . . . . . . . . . . . . . . . $ (43) $ (215)(a)
Prior service cost . . . . . . . . . . . . . . . . . . . . . . . . . (63) (319)(a)
Actuarial losses . . . . . . . . . . . . . . . . . . . . . . . . . . . (28,219) (33,618)(a)
11,448 13,227 Provision for income taxes
$(16,877) $(20,925) Total, net of income taxes
(a) The amortization of prior service cost and actuarial loss is included in the computation of net periodicbenefit cost. Refer to Note 13 to the Consolidated Financial Statements — Employee Benefits for additionalinformation regarding net periodic benefit cost.
NOTE 16. CONCENTRATIONS OF CREDIT RISK
The Company does not have significant concentrations of risk in financial instruments. Temporaryinvestments are made in a well-diversified portfolio of high-quality, liquid obligations of government, corporateand financial institutions. There are also limited concentrations of credit risk with respect to trade receivablesbecause the Company has a large number of customers who are spread across many industries and geographicregions. The Company’s larger customers are each spread across many sub-categories of its segments andgeographical regions. We had one customer that accounted for more than 10% of our consolidated net sales ineach year for all periods presented.
NOTE 17. COMMITMENTS AND CONTINGENCIES
Lease Commitments
Minimum rental payments under non-cancelable operating leases are $29.0 million in 2015, $25.3 million in2016, $22.3 million in 2017 and from 2018 and thereafter through 2031, the aggregate lease obligations are
91

$133.8 million. The corresponding rental expense amounted to $34.4 million, $32.4 million and $31.5 million forthe years ended December 31, 2014, 2013 and 2012, respectively. None of our leases contain escalation clausesand they do not require capital improvement funding.
Guarantees and Letters of Credit
The Company has various bank guarantees and letters of credit which are available for use regardinggovernmental requirements associated with pending litigation in various jurisdictions and to support its ongoingbusiness operations.
At December 31, 2014, we had total bank guarantees and standby letters of credit of approximately $38.5million with various financial institutions. Of this amount, Euro 6.5 million ($7.9 million) in bank guarantees arerelated to governmental requirements on income tax disputes in Spain, as discussed in further detail in Note 9.Also included in the above aggregate amount is a total of $19.6 million for certain other assessments in Brazil forother diverse income tax and indirect tax disputes related to fiscal years 1998-2011. There were no materialamounts utilized under the standby letters of credit as of December 31, 2014.
In order to challenge the assessments in these cases in Brazil, the Company has been required to and hasseparately pledged assets, principally property, plant and equipment to cover assessments in the amount ofapproximately $18.0 million as of December 31, 2014.
Lines of Credit
The Company has various lines of credit which are available to support its ongoing business operations.December 31, 2014, we had available lines of credit (in addition to the New Facility as discussed in Note 8) ofapproximately $78.6 million with various financial institutions. There were no material amounts drawn downpursuant to these lines of credit as of December 31, 2014.
Litigation
The Company assesses contingencies related to litigation and/or other matters to determine the degree ofprobability and range of possible loss. A loss contingency is accrued in the Company’s consolidated financialstatements if it is probable that a liability has been incurred and the amount of the loss can be reasonablyestimated. Because litigation is inherently unpredictable and unfavorable resolutions could occur, assessingcontingencies is highly sensitive and requires judgments about future events. On at least a quarterly basis, theCompany reviews contingencies related to litigation to determine the adequacy of accruals. The amount ofultimate loss may differ from these estimates and further events may require the Company to increase or decreasethe amounts it has accrued on any matter.
Periodically, we assess our insurance coverage for all known claims, where applicable, taking into accountaggregate coverage by occurrence, limits of coverage, self-insured retentions and deductibles, historical claimsexperience and claims experience with our insurance carriers. The liabilities are recorded at management’s bestestimate of the probable outcome of the lawsuits and claims, taking into consideration the facts andcircumstances of the individual matters as well as past experience on similar matters. At each balance sheet date,the key issues that management assesses are whether it is probable that a loss as to asserted or unasserted claimshas been incurred and if so, whether the amount of loss can be reasonably estimated. We record the expectedliability with respect to claims in Other liabilities and expected recoveries from our insurance carriers in Otherassets. We recognize a receivable when we believe that realization of the insurance receivable is probable underthe terms of the insurance policies and our payment experience to date.
Environmental
Over the past 20 years, various federal and state authorities and private parties have claimed that we are aPotentially Responsible Party (“PRP”) as a generator of waste materials for alleged pollution at a number ofwaste sites operated by third parties located principally in New Jersey and have sought to recover costs incurredand to be incurred to clean up the sites.
92

We have been identified as a PRP at nine facilities operated by third parties at which investigation and/orremediation activities may be ongoing. We analyze our potential liability on at least a quarterly basis. We accruefor environmental liabilities when they are probable and estimable. We estimate our share of the total future costfor these sites to be less than $5 million.
While joint and several liability is authorized under federal and state environmental laws, we believe theamounts we have paid and anticipate paying in the future for clean-up costs and damages at all sites are not andwill not have a material adverse effect on our financial condition, results of operations or liquidity. Thisassessment is based upon, among other things, the involvement of other PRPs at most of the sites, the status ofthe proceedings, including various settlement agreements and consent decrees and the extended time period overwhich payments will likely be made. There can be no assurance, however, that future events will not require us tomaterially increase the amounts we anticipate paying for clean-up costs and damages at these sites, and that suchincreased amounts will not have a material adverse effect on our financial condition, results of operations or cashflows.
Other Contingencies
The Company has contingencies involving third parties (such as labor, contract, technology or product-related claims or litigation) as well as government-related items in various jurisdictions in which we operatepertaining to such items as value-added taxes, other indirect taxes, customs and duties and sales and use taxes. Itis possible that cash flows or results of operations, in any period, could be materially affected by the unfavorableresolution of one or more of these contingencies.
The most significant government-related contingencies exist in Brazil. With regard to the Brazilian matters,we believe we have valid defenses for the underlying positions under dispute; however, in order to pursue thesedefenses, we are required to, and have provided, bank guarantees and pledged assets in the aggregate amount of$37.6 million. The Brazilian matters take an extended period of time to proceed through the judicial process andthere are a limited number of rulings to date.
In March 2012, ZoomEssence, Inc. filed a complaint against the Company in the U.S. District Court of NewJersey alleging trade secret misappropriation, breach of contract and unjust enrichment in connection with certainspray dry technology disclosed to the Company. In connection with the claims, ZoomEssence is seeking aninjunction and monetary damages. ZoomEssence initially sought a temporary restraining order and preliminaryinjunction, but the Court denied these applications in an order entered on September 27, 2013, finding thatZoomEssence had not demonstrated a likelihood of success on the merits of its claims. The Court subsequentlyreferred the matter to mediation, however the private mediation session did not result in a resolution of thedispute. On November 3, 2014, ZoomEssence amended its complaint against the Company to include allegationsof breach of the duty of good faith and fair dealing, fraud in the inducement, and misappropriation of confidentialand proprietary information. On November 13, 2014, the Company filed a counterclaim against ZoomEssencealleging trade secret misappropriation, breach of contract, breach of the implied covenant of good faith and fairdealing, unjust enrichment, misappropriation of confidential and proprietary information, common law unfaircompetition, tortious interference with contractual relations, and conversion. The case is currently proceedingthrough discovery with a trial on the merits anticipated in late 2015. The Company denies the allegations and willvigorously defend and pursue its position in Court. At this stage of the litigation, based on the informationcurrently available to the Company, management does not believe that this matter represents a material losscontingency.
Based on the information available as of December 31, 2014, we estimate a range of reasonably possibleloss related to all of the matters above of $0-$31 million.
Separately, the Spanish tax authorities are alleging claims for a capital tax in a case arising from similarallegations as the income tax cases (discussed in further detail in Note 9). In connection with the 2002 income tax
93

assessment ruling discussed in Note 9, the Appellate Court rejected one of the two bases upon which we basedour capital tax position. However, we believe that we still have a strong basis for our capital tax position andintend to continue to defend these claims. If there is an unfavorable ruling in this case, we estimate the loss woldbe approximately $13 million, which was fully reserved as of December 31, 2014. On January 22, 2014, we filedan appeal and in order to avoid future interest costs in the event our appeal is unsuccessful, we paid $11.2 million(representing the principal amount) during the first quarter of 2014.
94

(a)(3) EXHIBITS
ExhibitNumber Description
3(i) Restated Certificate of Incorporation of the Company, incorporated by reference to Exhibit 10(g)to Registrant’s Report on Form 10-Q filed on August 12, 2002.
3(ii) By-laws of the Registrant, effective as of February 6, 2014, incorporated by reference toExhibit 3(ii) to Registrant’s Report on Form 8-K filed on February 7, 2014.
4.1 Note Purchase Agreement, dated as of July 12, 2006, by and among International Flavors &Fragrances Inc. and the various purchasers named therein, incorporated by reference to Exhibit4.7 to Registrant’s Report on Form 8-K filed on July 13, 2006.
4.2 Form of Series A, Series B, Series C and Series D Senior Notes incorporated by reference toExhibit 4.8 to Registrant’s Report on Form 8-K filed on July 13, 2006.
4.3 Note Purchase Agreement, dated as of September 27, 2007, by and among International Flavors& Fragrances Inc. and the various purchasers named therein, incorporated by reference toExhibit 4.7 to Registrant’s Report on Form 8-K filed on October 1, 2007.
4.4 Form of Series A, Series B, Series C and Series D Senior Notes incorporated by reference toExhibit 4.8 of Registrant’s Report on Form 8-K filed on October 1, 2007.
*10.1 Letter Agreement between International Flavors & Fragrances Inc. and Andreas Fibig, datedMay 26, 2014, incorporated by reference to Exhibit 10.1 to the Registrant’s Report on Form 8-Kfiled on May 28, 2014.
*10.2 Supplemental Retirement Plan, adopted by the Registrant’s Board of Directors on October 29,1986 as amended and restated through October 9, 2007, incorporated by reference to Exhibit 10.5to Registrant’s Report on Form 10-K filed on February 27, 2008.
*10.3 2000 Stock Award and Incentive Plan, adopted by the Registrant’s Board of Directors onMarch 9, 2000 as amended and restated through October 9, 2007, incorporated by reference toExhibit 10.6 to Registrant’s Report on Form 10-K filed on February 27, 2008.
*10.4 2010 Stock Award and Incentive Plan, as Amended and Restated as of February 6, 2014.
*10.5 2000 Supplemental Stock Award Plan, adopted by the Registrant’s Board of Directors onNovember 14, 2000 as amended and restated through October 9, 2007, incorporated by referenceto Exhibit 10.7 to Registrant’s Report on Form 10-K filed on February 27, 2008.
*10.6 Performance Criteria for the Registrant’s Equity Choice Program relating to Senior Executivesincorporated by reference to Exhibit 10.1 to Registrant’s Report on Form 10-Q filed on May 6,2010.
*10.7 Form of Non-Employee Director’s Restricted Stock Units Agreement under International Flavors& Fragrances Inc. 2000 Stock Award and Incentive Plan, incorporated by reference toExhibit 10.7 to Registrant’s Report on Form 10-Q filed on October 31, 2007.
*10.8 Form of U.S. Restricted Stock Units Agreement under International Flavors & Fragrances Inc.2000 Stock Award and Incentive Plan incorporated by reference to Exhibit 10.5 to Registrant’sReport on Form 10-Q filed on October 31, 2007.
*10.9 Form of U.S. Stock Settled Appreciation Rights Agreement under International Flavors &Fragrances Inc. 2000 Stock Award and Incentive Plan, incorporated by reference to Exhibit 10.6to Registrant’s Report on Form 10-Q filed on October 31, 2007.
95

ExhibitNumber Description
*10.10 Form of Restricted Stock Units Agreement under International Flavors & Fragrances Inc. 2000Stock Award and Incentive Plan incorporated by reference to Exhibit 10.2 to Registrant’s Reporton Form 10-Q filed on August 5, 2009.
*10.11 Form of Purchased Restricted Stock Agreement under International Flavors & Fragrances Inc.2000 Stock Award and Incentive Plan incorporated by reference to Exhibit 10.1 to Registrant’sReport on Form 10-Q filed on August 5, 2009.
*10.12 Form of Employee Stock Option Agreement under International Flavors & Fragrances Inc. 2000Stock Award and Incentive Plan, incorporated by reference to Exhibit 10.1 to Registrant’s Reporton Form 10-Q filed on November 9, 2004.
*10.13 Form of International Flavors & Fragrances Inc. Stock Option Agreement under 2000 StockOption Plan for Non-Employee Directors, incorporated by reference to Exhibit 10.2 toRegistrant’s Report on Form 10-Q filed on November 9, 2004.
*10.14 Amended and Restated Executive Severance Policy, as Amended through and includingOctober 23, 2014, incorporated by reference to Exhibit 10.1 to Registrant’s Report on Form 10-QFiled on November 4, 2014.
*10.15 Director Charitable Contribution Program, adopted by the Board of Directors on December 8,2009, incorporated by reference to Exhibit 10.38 to Registrant’s Report on Form 10-K filed onFebruary 25, 2010.
10.16 Form of Director/Officer Indemnification Agreement incorporated by reference to Exhibit 10.1 toRegistrant’s Report on Form 8-K filed on July 28, 2008.
10.17 Credit Agreement, dated as of November 9, 2011, Amended and Restated as of April 4, 2014,among International Flavors & Fragrances Inc., International Flavors & Fragrances(Luxembourg) S.à r.l., International Flavors & Fragrances (Nederland) Holding B.V.,International Flavors & Fragrances I.F.F. (Nederland) B.V., IFF Worldwide (Gibraltar) Limitedand IFF Aroma Esans Sanayi Ve Ticaret Anonim Sirketi, as borrowers, the banks, financialinstitutions and other institutional lenders party thereto, and Citibank, N.A. as administrativeagent, incorporated by reference to Exhibit 10.1 to Registrant’s Report on Form 8-K filed onApril 8, 2014.
10.18 Amendment No. 1 to the Credit Agreement, dated as of June 2, 2014, among InternationalFlavors & Fragrances Inc., International Flavors & Fragrances (Luxembourg) S.à.r.l.,International Flavors & Fragrances (Nederland) Holding B.V., International Flavors &Fragrances I.F.F. (Nederland) B.V., IFF Worldwide (Gibraltar) Limited and IFF Aroma EsansSanayi Ve Ticaret Anonim Sirketi, the various financial institutions as are parties to the CreditAgreement, and Citibank, N.A. as administrative agent.
*10.19 Form of Executive Death Benefit Plan Agreement incorporated by reference to Exhibit 10.27 toRegistrant’s Report on Form 10-K filed on February 28, 2012.
*10.20 Deferred Compensation Plan, as amended and restated December 12, 2011 incorporated byreference to Exhibit 10.28 to Registrant’s Report on Form 10-K filed on February 28, 2012.
*10.21 Form of U.S. Stock Settled Appreciation Rights Agreement under International Flavors &Fragrances Inc. 2010 Stock Award and Incentive Plan incorporated by reference to Exhibit 10.29to Registrant’s Report on Form 10-K filed on February 28, 2012.
*10.22 Form of Restricted Stock Units Award Agreement under International Flavors & Fragrances Inc.2010 Stock Award and Incentive Plan incorporated by reference to Exhibit 10.31 to Registrant’sReport on Form 10-Q filed on May 6, 2014.
96

ExhibitNumber Description
*10.23 Form of Purchased Restricted Stock Agreement under International Flavors & Fragrances Inc.2010 Stock Award and Incentive Plan incorporated by reference to Exhibit 10.31 to Registrant’sReport on Form 10-K filed on February 28, 2012.
*10.24 Form of Non-Employee Director’s Restricted Stock Units Agreement under International Flavors& Fragrances Inc. 2010 Stock Award and Incentive Plan incorporated by reference toExhibit 10.32 to Registrant’s Report on Form 10-K filed on February 28, 2012.
*10.25 Form of Annual Bonus Award Agreement under International Flavors & Fragrances Inc. 2010Stock Award and Incentive Plan
*10.26 Form of Long-Term Incentive Plan Award Agreement under International Flavors & FragrancesInc. 2010 Stock Award and Incentive Plan
*10.27 Restricted Stock Units Award Agreement, dated as of June 13, 2014, between InternationalFlavors and Fragrances Inc. and Nicolas Mirzayantz, incorporated by reference to Exhibit 10.5 toRegistrant’s Report on Form 10-Q Filed on August 5, 2014.
*10.28 Form of Equity Choice Program Award Agreement under International Flavors & Fragrances Inc.2010 Stock Award and Incentive Plan incorporated by reference to Exhibit 10.2 to Registrant’sReport on Form 10-Q Filed on May 6, 2014.
*10.29 Restricted Stock Units Award Agreement, dated as of March 6, 2014, between InternationalFlavors & Fragrances Inc. and Hernan Vaisman, incorporated by reference to Exhibit 10.3 toRegistrant’s Report on Form 10-Q Filed on May 6, 2014.
21 List of Principal Subsidiaries.
23 Consent of PricewaterhouseCoopers LLP.
31.1 Certification of Andreas Fibig pursuant to Section 302 of the Sarbanes-Oxley Act of 2002.
31.2 Certification of Richard A. O’Leary pursuant to Section 302 of the Sarbanes-Oxley Act of 2002.
32 Certification of Andreas Fibig and Richard A. O’Leary pursuant to 18 U.S.C. Section 1350 asadopted pursuant to the Sarbanes-Oxley Act of 2002.
101.INS XBRL Instance Document
101.SCH XBRL Taxonomy Extensions Schema
101.CAL XBRL Taxonomy Extension Calculation Linkbase
101.DEF XBRL Taxonomy Extension Definition Linkbase
101.LAB XBRL Taxonomy Extension Label Linkbase
101.PRE XBRL Taxonomy Extension Presentation Linkbase
* Management contract or compensatory plan or arrangement
97

Pursuant to the requirements of Section 13 or 15(d) of the Securities Exchange Act of 1934, the Registranthas duly caused this report to be signed on its behalf by the undersigned, thereunto duly authorized.
INTERNATIONAL FLAVORS & FRAGRANCESINC.
By: /s/ Richard A. O’Leary
Name: Richard A. O’Leary
Title: Interim Chief Financial Officer,Vice President and Controller
Dated: March 2, 2015
Pursuant to the requirements of the Securities Exchange Act of 1934, this report has been signed below bythe following persons on behalf of the registrant and in the capacities and on the dates indicated:
Signature Title Date
/s/ Andreas FibigAndreas Fibig
Chairman of the Board, ChiefExecutive Officer and Director(Principal Executive Officer)
March 2, 2015
/s/ Richard A. O’LearyRichard A. O’Leary
Interim Chief Financial Officer,Vice President and Controller
March 2, 2015
/s/ Marcello V. BottoliMarcello V. Bottoli
Director March 2, 2015
/s/ Linda B. BuckLinda B. Buck
Director March 2, 2015
/s/ J. Michael CookJ. Michael Cook
Director March 2, 2015
/s/ Michael DuckerMichael Ducker
Director March 2, 2015
/s/ Roger W. Ferguson, Jr.Roger W. Ferguson, Jr.
Director March 2, 2015
/s/ Christina GoldChristina Gold
Director March 2, 2015
/s/ Alexandra A. HerzanAlexandra A. Herzan
Director March 2, 2015
/s/ Henry W. Howell, Jr.Henry W. Howell, Jr.
Director March 2, 2015
/s/ Katherine M. HudsonKatherine M. Hudson
Director March 2, 2015
/s/ Arthur C. MartinezArthur C. Martinez
Director March 2, 2015
/s/ Dale F. MorrisonDale F. Morrison
Director March 2, 2015
98

INTERNATIONAL FLAVORS & FRAGRANCES INC. AND SUBSIDIARIES
SCHEDULE II — VALUATION AND QUALIFYING ACCOUNTS AND RESERVES
(IN THOUSANDS)
For the Year Ended December 31, 2014
Balance atbeginningof period
Additions(deductions)charged tocosts andexpenses
Accountswrittenoff
Translationadjustments
Balance atend ofperiod
Allowance for doubtful accounts(1) . . . . . . . . . . . . . . . $ 10,493 $ 222 $ (554) $ (1,014) $ 9,147Valuation allowance on credit and operating losscarryforwards and other net deferred tax assets . . . 503,990 (92,204)(2) — (56,218) 355,568
For the Year Ended December 31, 2013
Balance atbeginningof period
Additions(deductions)charged tocosts andexpenses
Accountswrittenoff
Translationadjustments
Balance atend ofperiod
Allowance for doubtful accounts(1) . . . . . . . . . . . . . . . $ 9,293 $ 1,984 $(1,059) $ 275 $ 10,493Valuation allowance on credit and operating losscarryforwards and other net deferred tax assets . . . 450,733 38,360(3) — 14,897 503,990
For the Year Ended December 31, 2012
Balance atbeginningof period
Additions(deductions)charged tocosts andexpenses
Accountswrittenoff
Translationadjustments
Balance atend ofperiod
Allowance for doubtful accounts(1) . . . . . . . . . . . . . . . $ 5,831 $ 3,639 $ (824) $ 647 $ 9,293Valuation allowance on credit and operating losscarryforwards and other net deferred tax assets . . . 290,879 153,718(4) — 6,136 450,733
(1) Amounts have been revised to properly reflect a $2.1 million prior period adjustment.(2) The 2014 amount includes an adjustment to the 2013 foreign net operating loss carryforwards in the amount
of $81 million, as discussed in Note 9 of the Consolidated Financial Statements.(3) The 2013 amount includes an adjustment to the 2012 foreign net operating loss carryforwards in the amount
of $30 million, as discussed in Note 9 of the Consolidated Financial Statements.(4) During 2012, the Company increased its deferred tax assets by $129 million. The 2012 amount includes an
adjustment to the 2011 foreign net operating loss carryforwards in the amount of $74 million and a $55million increase related to current year internally generated intangible assets. This entire increase of $129million was offset by a corresponding increase in valuation allowances.
S-1

INTERNATIONAL FLAVORS & FRAGRANCES INC.
INVESTOR INFORMATION
ANNUALMEETING
The Annual Meeting of Shareholders will be held at the offices of the Company, 521 West 57th Street,New York, New York, on May 6, 2015 at 10:00 a.m., EDT.
IFF will be furnishing proxy materials to shareholders on the internet, rather than mailing printed copies ofthose materials to each shareholder. A Notice of Internet Availability of Proxy Materials will be mailed to eachshareholder on or about March 18, 2015, which will provide instructions as to how shareholders may access andreview the proxy materials for the 2015 Annual Meeting on the website referred to in the Notice or, alternatively,how to request a printed copy of the proxy materials be sent to them by mail.
TRANSFER AGENT AND REGISTRAR
American Stock Transfer & Trust Company59 Maiden LaneNew York, New York 10038800-937-5449www.amstock.com
LISTED
New York Stock Exchange
INDEPENDENT REGISTERED PUBLIC ACCOUNTING FIRM
PricewaterhouseCoopers LLP
WEBSITE
www.iff.com

Annual Report Form 10-K
for the fiscal year ended
December 31, 2014
INTERNATIONAL FLAVORS & FRAGRANCES INC. >>
IFF GLOBAL HEADQUARTERS521 West 57th Street, New York, NY 10019212.765.5500 www.iff.com