for saleflyers/10214north... · colliers international p. 1 for sale | 10214 north i-35 ... >...
TRANSCRIPT
COLLIERS INTERNATIONAL P. 1
FOR SALE | 10214 North I-35 | AUSTIN, TEXAS 78753
PRESENTED BY
DOUG RAULSExecutive Vice PresidentDirect +1 512 539 3006Mobile +1 512 695 [email protected]
VOLNEY CAMPBELLCo-Chairman & PrincipalDirect +1 512 539 3002Mobile +1 512 750 8036
TRAVIS HICKSVice PresidentDirect +1 512 539 3005Mobile +1 512 964 [email protected]
This document has been prepared by Colliers International for advertising and general information only. Colliers International makes no guarantees, representations or warranties of any kind, expressed or implied, regarding the information including, but not limited to, warranties of content, accuracy and reliability. Any interested party should undertake their own inquiries as to the accuracy of the information. Colliers International excludes unequivocally all inferred or implied terms, conditions and warranties arising out of this document and excludes all liability for loss and damages arising there from. This publication is the copyrighted property of Colliers International and/or its licensor(s). ©2016. All rights reserved.

Overview10214 North I-35 offers an investor or user the op-portunity to purchase a well located, highly visible office/warehouse property with easy access to I-35. The property is composed of two buildings on 1.62 acres. The original building is a 9,585 SF single story office building. The newer building was built in 1990 and contains 20,000 SF of production/ware-house space on the main level with an additional 10,000 SF on the lower level for storage. Both build-ings are 100% HVAC.
LocationThis property is located on Interstate 35 just south of Braker Lane in North Austin. It offers easy access to I-35, Hwy 180, and Hwy 290 offering easy access to all parts of Austin.
Asking Price$3,500,000
FOR SALE | 10214 North I-35 | AUSTIN, TEXAS 78753

Physical Overview
> TOTAL BUILDING AREA Buildings:20,000 SF| Main Level Warehouse10,000 SF | Lower Level Warehouse9,585 SF | Office39,585 SF | Total
1.62 Acres | Land
> PROPERTY ADDRESS 10214 North I-35, Austin, Texas 78735
> YEAR BUILT Office: 1962Warehouse: 1990
> NUMBER OF FLOORSOffice | One FloorWarehouse | Two Floors
> PARKING 53 spaces
> ZONING CS-CO-NP
> TRAFFIC COUNTS 173,000 vehicles per day on I-35
> OCCUPANCY Owner will vacate the buidling at closing
> HVAC SYSTEM 100% HVAC
> SPRINKLERSOffice: NoneWarehouse: Yes - 100%
> ROOF Office: Metal decking, tar overlay. Replaced in 2012Warehouse: Sloped metal roof. replaced in 2015. 20 year warrantee.
> DOCK DOORSOffice: One (1) 8’x10’ - grade levelWarehouse: One (1) 8’x10’ - grade level One (1) 10’x10’ - dock high
> CLEAR HEIGHTOffice: 9’Warehouse: Main Level - 12’-18’Lower Level - 8.5’
> BUILDING CONSTRUCTIONOffice: Concrete Foundation with masonry and wood structureWarehouse: Concrete foundation with steel structure
> ELECTRICOffice: 400 amp serviceWarehouse: 800 amp, 3 phase service

Location

Location
N In
ters
tate
35
Fron
tage
Roa
dSUBJECT

OFFICE BUILDING
COLLIERS INTERNATIONAL P. 6 COLLIERS INTERNATIONAL P. 6BLUESTONE RIDGE | OFFERING MEMORANDUM
INVESTMENT SUMMARY

COLLIERS INTERNATIONAL P. 7 COLLIERS INTERNATIONAL P. 7BLUESTONE RIDGE | OFFERING MEMORANDUM
INVESTMENT SUMMARY
WAREHOUSE OFFICE AREA
WAREHOUSE BREAKROOM AREA

COLLIERS INTERNATIONAL P. 8 COLLIERS INTERNATIONAL P. 8BLUESTONE RIDGE | OFFERING MEMORANDUM
INVESTMENT SUMMARY
WAREHOUSE MAIN LEVEL
LOWER LEVEL WAREHOUSE ACCESS
WAREHOUSE MAIN LEVEL

COLLIERS INTERNATIONAL P. 9 COLLIERS INTERNATIONAL P. 9BLUESTONE RIDGE | OFFERING MEMORANDUM
INVESTMENT SUMMARY
SITE PLAN

COLLIERS INTERNATIONAL P. 10 COLLIERS INTERNATIONAL P. 10BLUESTONE RIDGE | OFFERING MEMORANDUM
INVESTMENT SUMMARY
FLOOR PLAN - WAREHOUSE

COLLIERS INTERNATIONAL P. 11 COLLIERS INTERNATIONAL P. 11BLUESTONE RIDGE | OFFERING MEMORANDUM
INVESTMENT SUMMARY
FLOOR PLAN - OFFICE

Research & Forecast Report
AUSTIN | OFFICEQ2 2017
Kaitlin Holm Research and Marketing Coordinator | Austin
TOTAL INVENTORY
50.9M SFTOTAL VACANCY
11.7%
Q2 NET ABSORPTION
599,982 SFYTD NET ABSORPTION
551,119 SFTOTAL UNDER
CONSTRUCTION
1.6M SFTOTAL PRE-LEASED
340K SFCBD CLASS A
$49.84SUBURBAN CLASS A
$34.57
AVERAGE RATE/SF
$34.02*Rates inclusive of estimated operating expenses.
Boots On The Ground Commentary by David Bremer
Our “Boots on the Ground” view point is the voice of our experts, who have broken down the market data and compared it to what they are seeing for themselves. This is their take on what the numbers actually mean for the Austin office market.
There are two mistruths I’ve heard perpetuated by the real estate community, including myself once or twice, over the past year: (1) This occupancy and these rates can’t last forever, and (2) MoPac construction should be done soon.
The Austin office market rebounded sharply in the 2nd quarter, with extremely high Net Absorption of almost 600,000 RSF. Vacancy remained relatively flat, however rates continue to trend higher.
Our local experts have seen an increase in general activity over the past few months. CBD and East submarkets are still extremely hot with significant competition for prime spaces. On the East side, several large projects delivering throughout 2018 should help create additional leasing opportunities near the CBD and in East Austin, but new deals continue to trade at high rates, therefore we’re not predicting rates to decline. There is no substantial help on the horizon for the core CBD, however. The suburbs continue to be reasonably healthy with a surge in medium and large activity over the past five months, but there are still plentiful options and Landlords are being forced to compete for deals.
We continue to see the trend toward greater density (less space, more people), which will continue to create more parking issues. Many of the developments in the East submarket, which we had hoped would help soften the parking dilemma, have decided to charge for parking (due to high construction expense) and very few are delivering with a self-sustaining parking ratio. While solutions are on the horizon in the form of ridesharing, Chariot, trains and Luxe, we expect parking to be a major headache for HR departments for years to come.
Austin’s office market continues to deliver as we hit the midyear mark
Future Forecast
We expect continued strength in the office market with the CBD and East Austin continuing to lead the way. It’s likely that rents will remain reasonably flat due to planned deliveries over the next 12 months, but significant pre-leasing success could again pressure vacancy and push rates higher. Monitoring continued growth by some of the current Austin juggernauts (WeWork, Amazon, Facebook, Indeed, and HomeAway) should provide a reasonable bellwether for the entire market. If they keep gobbling up space and Austin’s job growth continues to expand, which is probably in the near future, then it’s likely to remain a Landlord’s Market. Also, there will be a continued increase in sublet space coming on the market, and those avalabilities will sit longer as co-working opportunities continue to grow in number and popularity.
By The Numbers

2
Austin Office OverviewIn the second quarter of 2017, Austin’s office market saw 599,982 SF of positive net absorption. This sets the year-to-date absorption at 551,119 SF of positive net absorption. A majority of this absorption happened in class A buildings with a total of 577,789 SF of positive net absorption. Class B buildings in Austin saw 6,844 of negative net absorption and class C properties saw 29,037 of positive net absorption.
There is currently 1,584,879 SF of office space under construction and 340,959 SF of that is pre-leased. The third quarter of 2017 is expected to see 594,504 SF of deliveries and 232,835 SF of that is pre-leased.
Nine buildings totaling 1,443,538 SF delivered in the second quarter, and 1,183,557 SF of that was pre-leased. The largest building that delivered was the 500,512 SF, 80.3% pre-leased, 500 West Second Street located in the CBD submarket.
The citywide average rental rate increased slightly over the quarter from $33.83 per SF in Q1 2017 to $34.02 per SF. Class A rental rates in Austin’s CBD increased by 1.2% over the quarter to $49.84 per SF from $49.25 per SF in the first quarter of 2017. Overall suburban Class A rental rates increased, from $33.46 per SF to $34.02, over the quarter.
In April, Austin was ranked #1 on Savills’ “Tech Cities 2017 Report”, which ranks 22 cities across the globe that are at the forefront of the global tech industry. Austin beat out four other U.S. cities, including San Francisco, New York, Boston, and Seattle, along with international giants, such as Hong Kong and Berlin. Some of the reasons Austin was chosen were the low taxes and entrepreneurial culture. Austin’s lower cost of living, compared to places like San Francisco or New York, has a knack for attracting some of the world’s top talent.
Vacancy & Availability
Austin’s citywide vacancy rate increased marginally between quarters from 11.3% to 11.7%. The CBD Class A vacancy rate also increased from 7.3% in Q1 to 10.4% in Q2. The suburban Class A vacancy rate dropped quarter over quarter from 11.7% to 11.6%.
Overall suburban vacancy remained the same for the first half of 2017 at 12.3%. Submarkets that saw a decrease in vacancy over the quarter include Cedar Park, Central, Far Northwest, North/Domain, South, Southeast, Southwest and West Central. The Cedar Park submarket saw the largest decrease in vacancy, falling from 20.9% to 6.8% over the quarter.
2 Austin Research & Forecast Report | Q2 2017 | Office | Colliers International
Market IndicatorsRelative to prior period
AnnualChange
Quarterly Change
Quarterly Forecast*
VACANCY
NET ABSORPTION
NEW CONSTRUCTION
UNDER CONSTRUCTION
*Projected
Summary Statistics Austin Office Market Q2 2016 Q1 2017 Q2 2017
Vacancy Rate 12.0% 11.3% 11.7%
Net Absorption (Million Square Feet) .002 -.048 .600
New Construction (Million Square Feet) .212 .842 .264
Under Construction (Million Square Feet) 1.097 2.817 1.584
Class A Vacancy Rate CBD Suburban
7.1%13.7%
7.3%11.7%
10.4%11.6%
Gross Asking Rents Per Square Foot Per Year
Average $32.39 $33.83 $34.02
CBD Class A $45.98 $49.25 $49.84
Suburban Class A $33.96 $34.46 $34.57
0.0
5.0
10.0
15.0
20.0
25.0
-200,000
0
200,000
400,000
600,000
800,000
1,000,000
Net Absorption New Supply Vacancy
ANNUAL ABSORPTION, NEW SUPPLY, AND VACANCY

$0.00
$10.00
$20.00
$30.00
$40.00
$50.00
$60.00
CBD Rents Suburban Rents
0.0%
2.0%
4.0%
6.0%
8.0%
10.0%
12.0%
14.0%
16.0%
CBD Vacancy Suburban Vacancy
0.0%
2.0%
4.0%
6.0%
8.0%
10.0%
12.0%
14.0%
16.0%
-200,000
0
200,000
400,000
600,000
800,000
1,000,000
1,200,000
Net Absorption New Supply Vacancy
Absorption & Demand
Austin’s office market posted 599,982 square feet of positive net absorption in Q2 2017. The three submarkets that experienced the largest positive net absorption gains over the quarter include North, CBD, and Southwest.
A majority of the positive net absorption in the second quarter happened in the Class A North/Domain submarket, totalling 282,475 square feet of positive net absorption. This can be attributed to Facebook and Amazon moving into their spaces, totaling 273,168 SF, at Domain 8 (11601 Alterra Parkway). The second highest positive net absorption occurred in Class A space in the CBD submarket, with 233,113 square feet absorbed in the second quarter.
The Southwest and CBD submarkets had the most tenants sign leases for spaces 10,000 square feet or larger. There were ten leases signed in Q2 in the Southwest submarket while the CBD inked seven. The submarket with the most square feet leased in Q2 was North/Domain with 324,046 square feet, while the Southwest submarket came in second with 203,228 square feet of leases. One of those leases was Linebarger Goggan Blair & Sampson LLP’s 29,854 square foot renewal.
Rental Rates
According to CoStar, our data provider, Austin’s citywide average rental rate increased slightly over the quarter from $33.83 per SF to $34.02 per SF.
As expected, the highest rates across the Austin market in the first quarter were in CBD Class A buildings, where rental rates averaged $49.84 per SF. Rental rates were also high in the West Central submarket and Central submarket where Class A rental rates reached $42.92 per SF and $41.59 per SF, respectively.
Citywide Class B rental rates increased in Q2 to $28.21 per square foot from $27.82 in Q1. Class B rental rates in the CBD increased by 6% over the quarter from $38.04 per square foot to $40.28 per square foot.
3 Austin Research & Forecast Report | Q2 2017 | Office | Colliers International
UNEMPLOYMENT 5/16 5/17
AUSTIN 2.9% 3.2%
TEXAS 4.3% 4.4%
U.S. 4.5% 4.1%
JOB GROWTHAnnual Change
# of Jobs Added
AUSTIN 2.8% 27.4K
TEXAS 2.2% 268.1K
U.S. 1.6% 2.26M
CBD vs. SuburbanCLASS A OFFICE VACANCY
CLASS A OFFICE RENTS
Job Growth & Unemployment(not seasonally adjusted)
QUARTERLY ABSORPTION, NEW SUPPLY, AND VACANCY

44 Austin Research & Forecast Report | Q2 2017 | Office | Colliers International
Q2 2017 Top Office Lease TransactionsBUILDING NAME/ADDRESS SUBMARKET SF TENANT LEASE DATE
3110 Esperanza Xing North/Domain 298,815 HomeAway/Expedia June-17
500 W 2nd St CBD 65,206 Unknown May-17
7300 Ranch Road 2222 Northwest 56,466 SailPoint2 May-17
5707 Southwest Pky Southwest 42,369 Kestra Financial April-17
300 W 6th St CBD 29,952 Facebook June-17
2700 Via Fortuna Drive Southwest 29,854 Linebarger Goggan Blair & Sampson, LLP1 June-17
2100 S Interstate 35 S South 28,149 Mood Media June-17
10801 N MoPac Expy North/Domain 25,231 Social Solutions April-17
6330 Hwy 290 E Northeast 24,000 Unknown April-17
5301 Southwest Pky Southwest 23,767 Cylce Solutions, Inc. May-17
301 Sundance Pky Round Rock 23,669 Unknown June-17
13301 Galleria Cir Southwest 18,525 Unknown2 May-17
800 Brazos St CBD 17,212 Trendkite May-17
285 SE Inner Loop Georgetown 17,200 Unknown June-17
200 W Cesar Chavez St CBD 15,970 Enthought May-17
115 Sandra Muraida Way CBD 15,134 ViaSat April-17
804 Congress Ave CBD 14,918 Duo Security June-17
108 Wild Basin Rd Southwest 14,625 Unknown May-17
1044 Liberty Park Dr Southwest 13,684 Legacy Education Inc. April-17
919 Congress Ave CBD 13,207 Texas Tribune June-17
5508 Hwy 290 W Southwest 12,832 Unknown May-17
804 Las Cimas Pky Southwest 12,699 Unknown2 May-17
9430 Research Blvd Northwest 11,359 Unknown April-17
110 Wild Basin Rd S Southwest 11,106 Unknown June-17
2202 Hunter Rd Hays County 10,000 Unknown May-17
4412 Spicewood Springs Rd Northwest 10,000 Unknown June-17
Leasing ActivityAustin’s office leasing activity recorded 879,716 SF in Q2 2017. Major transactions this quarter included HomeAway/Expedia taking several floors at 3110 Esperanza Crossing (Domain 11). They will be occupying 298,815 SF there once construction has finished.
1 Renewal 2 Sublease
Q2 2017 Significant Sales Transactions – (100,000 SF or greater)
BUILDING ADDRESS SUBMARKET RBA (SF) YEAR BUILT BUYER SELLER SALE PRICE $/SF CLOSED
320 S Capital Of Texas Hwy Southwest 216,511 2015 GLL Real Estate
Partners, Inc. Riverside Resources $96,000,000 $443 Apr-17
Sales ActivityAustin’s office investment sales activity included just one transaction. GLL Real Estate Partners, Inc. purchased a seven story office building, located at 320 South Capital of Texas Highway, from Riverside Resources for $96,000,000 ($443/SF). This building is currently 100% occupied by Apple, who’s lease expires in about 11 years.
Sources: CoStar and Real Capital Analytics1Part of a portfolio2 Sale Price is Approximate

5 Austin Research & Forecast Report | Q2 2017 | Office | Colliers International
This is placeholder text. Place your text here.
Chart Title–One Line
Chart TitleSUBHEAD 1 SUBHEAD 1 SUBHEAD 1 SUBHEAD 1
Body
INVENTORY DIRECT VACANCY SUBLEASE VACANCY VACANCY VACANCY RATE (%) NET ABSORPTION
(SF)RENTAL
RATE
CLASS # OF BLDGS TOTAL (SF) (SF) RATE
(%) (SF) RATE (%)
TOTAL (SF) Q2-2017 Q1-2017 Q2-2017 Q1-2017 AVG ($/
SF)
CBD
A 29 7,505,999 673,760 9.0% 110,410 1.5% 784,170 10.4% 7.3% 233,113 -92,073 $49.84
B 35 2,723,892 170,938 6.3% 34,855 1.3% 205,793 7.6% 9.9% 65,176 -52,954 $40.28
C 10 605,277 22,858 3.8% 2,000 0.3% 24,858 4.1% 3.9% -968 -4,092 $27.91
Total 74 10,835,168 867,556 8.0% 147,265 1.4% 1,014,821 9.4% 7.8% 297,321 -149,119 $47.81
SUBURBAN
A 180 20,164,128 1,879,272 9.3% 457,739 2.3% 2,337,011 11.6% 11.7% 344,676 241,181 $34.57
B 331 16,803,971 2,161,965 12.9% 253,997 1.5% 2,415,962 14.4% 13.9% -72,020 -147,376 $27.00
C 61 3,183,623 186,956 5.9% 3,176 0.1% 190,132 6.0% 6.9% 30,005 6,451 $23.26
Total 572 40,151,722 4,228,193 10.5% 714,912 1.8% 4,943,105 12.3% 12.3% 302,661 100,256 $31.02
OVERALL
A 209 27,670,127 2,553,032 9.2% 568,149 2.1% 3,121,181 11.3% 10.6% 577,789 149,108 $38.24
B 366 19,527,863 2,332,903 11.9% 288,852 1.5% 2,621,755 13.4% 13.4% -6,844 -200,330 $28.21
C 71 3,788,900 209,814 5.5% 5,176 0.1% 214,990 5.7% 6.4% 29,037 2,359 $23.52
Total 646 50,986,890 5,095,749 10.0% 862,177 1.7% 5,957,926 11.7% 11.3% 599,982 -48,863 $34.02
INVENTORY DIRECT VACANCY
SUBLEASE VACANCY VACANCY VACANCY RATE (%) NET ABSORPTION (SF) RENTAL
RATE
CLASS # OF BLDGS. TOTAL (SF) (SF) RATE
(%) (SF) RATE (%)
TOTAL (SF) Q2-2017 Q1-2017 Q2-2017 Q1-2017 AVG
($/SF)
CEDAR PARK
A 3 335,660 20,542 6.1% 0 0.0% 20,542 6.1% 26.1% 67,117 0 $27.79
B 3 142,000 12,110 8.5% 0 0.0% 12,110 8.5% 8.5% 0 0 $25.56
Total 6 477,660 32,652 6.8% 0 0.0% 32,652 6.8% 20.9% 67,117 0 $27.05
CENTRAL .
A 4 520,288 27,867 5.4% 4,317 0.8% 32,184 6.2% 7.5% 6,830 -6,084 $41.59
B 34 1,889,751 150,532 8.0% 20,109 1.1% 170,641 9.0% 9.6% 10,746 7,462 $25.63
C 16 939,528 17,509 1.9% 926 0.1% 18,435 2.0% 1.1% -8,530 -549 $26.17
Total 54 3,349,567 195,908 5.8% 25,352 0.8% 221,260 6.6% 6.9% 9,046 829 $26.99
EAST
A 3 162,582 47,849 29.4% 0 0.0% 47,849 29.4% 28.6% -1,413 18,258 $34.38
B 15 1,385,953 456,961 33.0% 0 0.0% 456,961 33.0% 32.7% -4,421 491 $36.81
C 5 202,765 24,000 11.8% 0 0.0% 24,000 11.8% 14.3% 5,050 0 $19.98
Total 23 1,751,300 528,810 30.2% 0 0.0% 528,810 30.2% 30.2% -784 18,749 $33.93
FAR NORTHEAST
B 1 23,408 0 0.0% 0 0.0% 0 0.0% 0.0% 0 0 -
Total 1 23,408 0 0.0% 0 0.0% 0 0.0% 0.0% 0 0 -
FAR NORTHWEST
A 14 2,101,169 167,106 8.0% 43,557 2.1% 210,663 10.0% 10.6% 12,974 115,144 $29.07
B 9 347,418 34,406 9.9% 0 0.0% 34,406 9.9% 10.3% 1,445 -11,939 $23.99
C 2 77,864 2,400 3.1% 0 0.0% 2,400 3.1% 0.0% -2,400 0 $15.00
Total 25 2,526,451 203,912 8.1% 43,557 1.7% 247,469 9.8% 10.3% 12,019 103,205 $28.52
Austin Suburban Office Market Summary
Austin Office Market Summary (CBD, Suburban, & Overall)

6 Austin Research & Forecast Report | Q2 2017 | Office | Colliers International
Austin Suburban Office Market Summary - Continued
INVENTORY DIRECT VACANCY SUBLEASE VACANCY VACANCY VACANCY RATE (%) NET ABSORPTION
(SF)RENTAL
RATE
CLASS # OF BLDGS. TOTAL (SF) (SF) RATE
(%) (SF) RATE (%)
TOTAL (SF) Q2-2017 Q1-2017 Q2-2017 Q1-2017 AVG
($/SF)
NORTH/DOMAINA 15 2,177,806 145,885 6.7% 49,631 2.3% 195,516 9.0% 9.9% 282,475 75,592 $31.43B 29 1,646,935 181,398 11.0% 30,990 1.9% 212,388 12.9% 12.5% -7,276 -16,937 $23.74C 1 24,759 0 0.0% 0 0.0% 0 0.0% 0.0% 0 0 -Total 45 3,849,500 327,283 8.5% 80,621 2.1% 407,904 10.6% 11.0% 275,199 58,655 $28.84NORTHEASTA 5 413,863 25,118 6.1% 1,559 0.4% 26,677 6.4% 6.3% -732 15,968 $24.92B 19 1,317,643 143,619 10.9% 1,510 0.1% 145,129 11.0% 8.9% -27,521 -3,961 $21.82C 8 276,413 80,799 29.2% 0 0.0% 80,799 29.2% 38.5% 25,670 -1,730 $19.90Total 32 2,007,919 249,536 12.4% 3,069 0.2% 252,605 12.6% 12.5% -2,583 10,277 $22.66NORTHWESTA 73 6,914,952 635,654 9.2% 194,836 2.8% 830,490 12.0% 10.1% -134,830 -73,125 $36.64B 99 4,423,103 534,308 12.1% 134,468 3.0% 668,776 15.1% 14.6% -22,522 -41,519 $29.94C 5 428,563 2,564 0.6% 1000 0.2% 3,564 0.8% 0.8% 0 2,396 $22.96Total 177 11,766,618 1,172,526 10.0% 330,304 2.8% 1,502,830 12.8% 11.4% -157,352 -112,248 $33.36ROUND ROCKA 3 308,130 29,475 9.6% 0 0.0% 29,475 9.6% 10.3% 2,283 5,547 $32.06B 14 544,813 91,761 16.8% 4,725 0.9% 96,486 17.7% 15.8% -10,423 -31,417 $28.30C 3 147,466 0 0.0% 0 0.0% 0 0.0% 0.0% 0 0 -Total 20 1,000,409 121,236 12.1% 4,725 0.5% 125,961 12.6% 11.8% -8,140 -25,870 $28.78SOUTHA 5 395,493 35,809 9.1% 8,929 2.3% 44,738 11.3% 11.3% 0 -6,131 $35.99B 23 1,131,499 129,101 11.4% 5,079 0.4% 134,180 11.9% 12.8% 10,304 -61,644 $28.12C 12 682,703 40,379 5.9% 1,250 0.2% 41,629 6.1% 7.5% 9,399 4,963 $25.32Total 40 2,209,695 205,289 9.3% 15,258 0.7% 220,547 10.0% 10.9% 19,703 -62,812 $29.06SOUTHEAST
B 10 1,173,424 213,260 18.2% 2,032 0.2% 215,292 18.3% 18.7% 3,723 -3,413 $23.30C 5 259,292 0 0.0% 0 0.0% 0 0.0% 0.0% 0 0 $20.00Total 14 1,432,716 213,260 14.9% 2,032 0.1% 215,292 15.0% 15.3% 3,723 -3,413 $23.18SOUTHWESTA 50 6,243,735 724,420 11.6% 154,910 2.5% 879,330 14.1% 14.7% 102,714 101,441 $37.08B 72 2,692,876 210,557 7.8% 55,084 2.0% 265,641 9.9% 8.9% -25,073 -2,389 $30.51C 3 94,138 16,748 17.8% 0 0.0% 16,748 17.8% 17.8% 0 3,466 $26.30Total 125 9,030,749 951,725 10.5% 209,994 2.3% 1,161,719 12.9% 13.0% 77,641 102,518 $35.36WEST CENTRALA 5 590,450 19,547 3.3% 0 0.0% 19,547 3.3% 4.5% 7,258 -5,429 $42.92B 3 85,148 3,952 4.6% 0 0.0% 3,952 4.6% 3.5% -1,002 0 $31.35C 1 50,132 2,557 5.1% 0 0.0% 2,557 5.1% 6.7% 816 -2,095 -Total 9 725,730 26,056 3.6% 0 0.0% 26,056 3.6% 4.6% 7,072 -7,524 $41.71
7 Austin Research & Forecast Report | Q2 2017 | Office | Colliers International
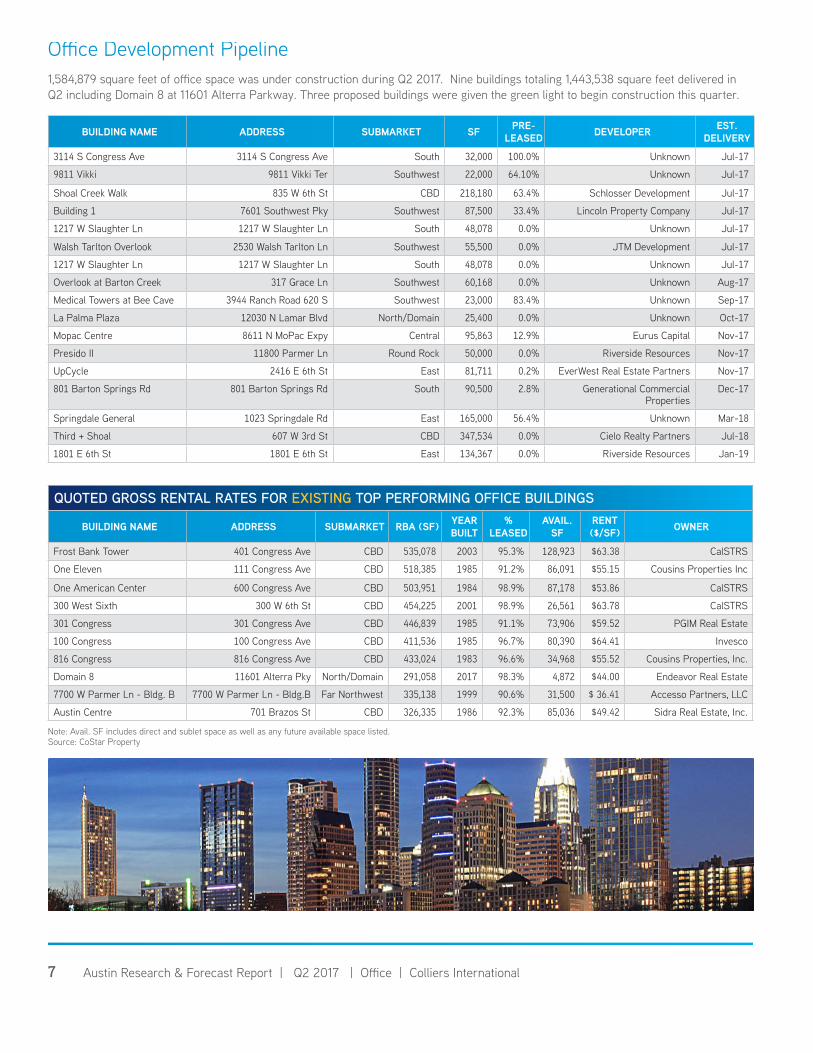
Office Development Pipeline1,584,879 square feet of office space was under construction during Q2 2017. Nine buildings totaling 1,443,538 square feet delivered in Q2 including Domain 8 at 11601 Alterra Parkway. Three proposed buildings were given the green light to begin construction this quarter.
BUILDING NAME ADDRESS SUBMARKET SF PRE-LEASED DEVELOPER EST.
DELIVERY
3114 S Congress Ave 3114 S Congress Ave South 32,000 100.0% Unknown Jul-17
9811 Vikki 9811 Vikki Ter Southwest 22,000 64.10% Unknown Jul-17
Shoal Creek Walk 835 W 6th St CBD 218,180 63.4% Schlosser Development Jul-17
Building 1 7601 Southwest Pky Southwest 87,500 33.4% Lincoln Property Company Jul-17
1217 W Slaughter Ln 1217 W Slaughter Ln South 48,078 0.0% Unknown Jul-17
Walsh Tarlton Overlook 2530 Walsh Tarlton Ln Southwest 55,500 0.0% JTM Development Jul-17
1217 W Slaughter Ln 1217 W Slaughter Ln South 48,078 0.0% Unknown Jul-17
Overlook at Barton Creek 317 Grace Ln Southwest 60,168 0.0% Unknown Aug-17
Medical Towers at Bee Cave 3944 Ranch Road 620 S Southwest 23,000 83.4% Unknown Sep-17
La Palma Plaza 12030 N Lamar Blvd North/Domain 25,400 0.0% Unknown Oct-17
Mopac Centre 8611 N MoPac Expy Central 95,863 12.9% Eurus Capital Nov-17
Presido II 11800 Parmer Ln Round Rock 50,000 0.0% Riverside Resources Nov-17
UpCycle 2416 E 6th St East 81,711 0.2% EverWest Real Estate Partners Nov-17
801 Barton Springs Rd 801 Barton Springs Rd South 90,500 2.8% Generational Commercial Properties
Dec-17
Springdale General 1023 Springdale Rd East 165,000 56.4% Unknown Mar-18
Third + Shoal 607 W 3rd St CBD 347,534 0.0% Cielo Realty Partners Jul-18
1801 E 6th St 1801 E 6th St East 134,367 0.0% Riverside Resources Jan-19
QUOTED GROSS RENTAL RATES FOR EXISTING TOP PERFORMING OFFICE BUILDINGS
BUILDING NAME ADDRESS SUBMARKET RBA (SF) YEAR BUILT
% LEASED
AVAIL. SF
RENT ($/SF) OWNER
Frost Bank Tower 401 Congress Ave CBD 535,078 2003 95.3% 128,923 $63.38 CalSTRS
One Eleven 111 Congress Ave CBD 518,385 1985 91.2% 86,091 $55.15 Cousins Properties Inc
One American Center 600 Congress Ave CBD 503,951 1984 98.9% 87,178 $53.86 CalSTRS
300 West Sixth 300 W 6th St CBD 454,225 2001 98.9% 26,561 $63.78 CalSTRS
301 Congress 301 Congress Ave CBD 446,839 1985 91.1% 73,906 $59.52 PGIM Real Estate
100 Congress 100 Congress Ave CBD 411,536 1985 96.7% 80,390 $64.41 Invesco
816 Congress 816 Congress Ave CBD 433,024 1983 96.6% 34,968 $55.52 Cousins Properties, Inc.
Domain 8 11601 Alterra Pky North/Domain 291,058 2017 98.3% 4,872 $44.00 Endeavor Real Estate
7700 W Parmer Ln - Bldg. B 7700 W Parmer Ln - Bldg.B Far Northwest 335,138 1999 90.6% 31,500 $ 36.41 Accesso Partners, LLC
Austin Centre 701 Brazos St CBD 326,335 1986 92.3% 85,036 $49.42 Sidra Real Estate, Inc.
Note: Avail. SF includes direct and sublet space as well as any future available space listed. Source: CoStar Property

Colliers International
Austin, LLC 9003290 (512)539-3000
Volney Campbell 364845 [email protected] (512)539-3002
Marc Vanderslice 495430 [email protected] (512)539-3001
Doug Rauls 462355 [email protected] (512)539-3006

Colliers International111 Congress AvenueSuite 750Austin, TX 78701512 539 3000www.colliers.com/austin