for review only - rdo.psu.ac.thrdo.psu.ac.th/sjstweb/ar-press/2018aug/3.pdf · for review only 2...
TRANSCRIPT

For Review Only
INVESTIGATION OF CONCRETE MATERIAL MODELS FOR
ANALYSIS OF SEISMIC BEHAVIOR OF REINFORCED
CONCRETE UNDER REVERSED CYCLIC LOAD
Journal: Songklanakarin Journal of Science and Technology
Manuscript ID SJST-2018-0073.R1
Manuscript Type: Original Article
Date Submitted by the Author: 08-May-2018
Complete List of Authors: Bohara, Rajendra ; Sirindhorn International Institute of Technology, School
of Civil Engineering and Technology Tanapornraweekit, Ganchai; Sirindhorn International Institute of Technology, Construction and Maintenance Technology Research Center Tangtermsirikul, Somnuk; Sirindhorn International Institute of Technology, School of Civil Engineering and Technology
Keyword: CSCM Model, FEA, KCC Model, Seismic Loading, Winfrith Concrete
For Proof Read only
Songklanakarin Journal of Science and Technology SJST-2018-0073.R1 Tanapornraweekit

For Review Only
1
Original Article
INVESTIGATION OF CONCRETE MATERIAL MODELS FOR ANALYSIS OF
SEISMIC BEHAVIOR OF REINFORCED CONCRETE UNDER REVERSED
CYCLIC LOAD
Rajendra Prasad Bohara1, Ganchai Tanapornraweekit
2*, Somnuk Tangtermsirikul
1
1School of Civil Engineering and Technology, Sirindhorn International Institute of
Technology, Thammasat University, Pathum Thani, 12120, Thailand
2Construction and Maintenance Technology Research Center, School of Civil Engineering
and Technology, Sirindhorn International Institute of Technology, Thammasat University,
Pathum Thani, 12121, Thailand
*Corresponding author, Email address: [email protected]
Abstract
Several concrete material models with unique theoretical backgrounds are available in
different finite element analysis (FEA) software packages such as ABAQUAS, ATENA,
DIANA, LS-DYNA. In the simulation of structural responses of concrete using FEA
software, various parameters such as strength, stiffness, softening, strain rate, dilation, and
etc. are required to be provided. Though depending on each concrete material model, all of
these parameters do not hold equal importance during a single type of loading. This paper
presents the relevance of using three most widely used concrete material models available in
LS-DYNA; Karagozian & Case Concrete (KCC) Model, Winfrith Concrete Model and
Continuous Surface Cap Model (CSCM) for simulation of concrete structures under reversed
cyclic loading, when only limited material properties are available. In this paper, a series of
nonlinear 3D-finite element analysis of non-ductile reinforced concrete (RC) column
subjected to lateral cyclic loading were carried out with these three different concrete models.
The results from each model were compared with documented experimental results. The
Page 3 of 25
For Proof Read only
Songklanakarin Journal of Science and Technology SJST-2018-0073.R1 Tanapornraweekit
123456789101112131415161718192021222324252627282930313233343536373839404142434445464748495051525354555657585960

For Review Only
2
capacity of each material model to capture the cyclic load reversal behavior, softening due to
cyclic compression and tension, and damages are the major foci of this paper. Based on a
series of numerical analyses of an RC column under cyclic loading, reviewed single element
analysis and theoretical overview of each model, recommendations for selecting the
appropriate concrete material model under cyclic loading were made.
Keywords: CSCM Model, FEA, KCC Model, Seismic Loading, Winfrith Concrete
1. Introduction
Concrete is the most widely used material for structures all over the globe. Concrete
structures are required to resist various types of loads such as gravity, earthquake, wind and
sometimes blast, and impact loadings. In order to ensure the safety and reliability of the
structures against these actions, various laboratory experiments have been carried out.
However, most of structural load tests, especially for full scale structures, require extensive
resources, i.e., lab facilities as well as budget and time consuming (Sharath, Arumugam,
Dhanasekaran, & Subash, 2017; Wu, Crawford, Magallanes, & Way, 2012). Due to this
reason, simulation of structural responses using finite element analysis (FEA) software
package is a better alternative to obtain quick and reliable results. However, it is worth
pointing out that improper use of FEA leads to inaccurate prediction of structural
performance which results from various reasons, e.g. inappropriate selection of material
models and their parameters, as well as boundary conditions. Therefore, this paper
emphasizes on behavior of concrete material models subjected to seismic loading so that an
appropriate selection of concrete material model for seismic loading can be suggested.
Earthquake, which causes the dynamic actions on structures, is a displacement-type
loading (Murthy, Rupen, Vijayanarayanan, & Mehta, 2012). Most of the seismic loading
problems are simulated using displacement controlled lateral cyclic loading so that nonlinear
Page 4 of 25
For Proof Read only
Songklanakarin Journal of Science and Technology SJST-2018-0073.R1 Tanapornraweekit
123456789101112131415161718192021222324252627282930313233343536373839404142434445464748495051525354555657585960
For Review Only
3
behavior is able to be captured. A comprehensive material model to take into account the
cyclic behavior and the softening plays a vital role for the simulation of structures subjected
to lateral cyclic loading.
LS-DYNA, a high fidelity FE code, has been used to analyze large deformation
response of structures both under static and dynamic loadings (Hallquist, 2006). The current
version of LS-DYNA is rich in material models; it contains more than 270 material models
and approximately 100 of them are constitutive models governed by ten equations-of-state to
cover broad spectrum of materials (Hallquist, 2006; Livemore Technology Software
Corporation [LSTC], 2016). Further, among the constitutive models, several constitutive
concrete material models are available with some pros and cons in each.
In LS-DYNA, many researches have been carried out to validate various material
models for different loads such as quasi static, blast and impact (Coleman, 2016). However,
limited researches on simulation of structures under earthquake load using LS-DYNA have
been reported. Coleman (2016) evaluated the cyclic performance of four commonly used LS-
DYNA concrete materials (KCC, Winfrith Concrete, CSCM and RTH) in single element and
multi element analysis with respect to element size, strain application, hourglass and element
formulation in explicit solver. It is only the document found which completely focuses on
seismic behavior of different concrete material models.
This paper focuses on the behavior of three most widely used concrete material
models (KCC Model, Winfrith Concrete Model and CSCM) under lateral cyclic loading. In
this paper, a series of nonlinear finite element analysis of a non-ductile RC column under
lateral cyclic loading were carried out with three different material models using implicit
solver to investigate the cyclic and softening behavior due to cyclic compression and tension.
Results from each material model were compared with the previously reported laboratory
results. Recommendation on the selection of an appropriate material model is made based on
Page 5 of 25
For Proof Read only
Songklanakarin Journal of Science and Technology SJST-2018-0073.R1 Tanapornraweekit
123456789101112131415161718192021222324252627282930313233343536373839404142434445464748495051525354555657585960

For Review Only
4
three platforms: numerical analysis, review of single element analysis and theoretical
background.
2. Experimental Program
A non-ductile RC column of cross section 350mm×250mm and shear span of
2050mm, previously tested by Rosdin, Warnitchai, and Awan (2010) and numerically
analyzed by Saleem, Pimanmas, and Mehmood (2015) using VecTor2 software (a non-linear
FE program developed at the University of Toronto), was selected as a case for verification of
concrete material models. This type of column is commonly found in low-rise buildings in
Thailand. The column consisted of 12-DB16 as longitudinal reinforcement and two closed
loops of RB6@200mm as stirrups. The column cross section and reinforcement details are
shown in Error! Reference source not found..
A 30MPa compressive strength of concrete was used for the column. The mechanical
properties of the reinforcement are summarized in Error! Reference source not found..
The column was constructed on a base RC block, which was designed to remain
elastic throughout the experiment and was firmly fixed with a rigid floor. A constant vertical
load of 400 kN was applied on the top of the column till the end of experiment. The
incremental drift ratios (±0.25%, ±0.50%, ±0.75%, ±1.0%, ±1.5%, ±2.0%, ±2.5%, ±3.0%
etc.) with two cycles of each drift ratio were applied using a hydraulic actuator.
3. FEA Methodology
Both the column and the base block were modeled with solid brick elements (eight
nodes hexahedron). Rebars were modeled as beam elements, which were constrained in the
concrete so that a perfect bonding between reinforcement and concrete was obtained. Based
on the mesh convergence study, a uniform mesh size of 50mm was adopted for both solid and
beam elements. In order to simulate cast-in-situ behavior, the nodes of base block and column
Page 6 of 25
For Proof Read only
Songklanakarin Journal of Science and Technology SJST-2018-0073.R1 Tanapornraweekit
123456789101112131415161718192021222324252627282930313233343536373839404142434445464748495051525354555657585960
For Review Only
5
were merged together on the common overlapping surface. The bottom nodes of the base
block were assigned to be hinge support and implicit solver was utilized to obtain quasi static
solution. The analyzed FE model is presented in Error! Reference source not found..
The gravity load was applied on top of the column, which was distributed uniformly
to the column cross section. This gravity load was ramped for 3 seconds till it attained its
peak value of 400kN and then held constant until the termination time. The ramping of load
was used in order to prevent a probable divergence in implicit solver. The lateral
displacement cycle began only after 3 seconds following the same incremental drifts as
employed in the experimental study.
4. Material Input Parameters
Depending on the material models, each model has different minimum input
parameters, which is explained in sections 4.1 to 4.3. As only the compressive strength of
concrete (30MPa) was known, the general values of other concrete properties were adopted
as following; mass density (2400kg/m3), poisson’s ratio (0.19) and aggregate size (19mm). It
is noted that for each material model only the minimum required inputs were provided for
each analysis since this study investigates the performance of each concrete model when only
limited material properties are known.
The steel reinforcement in the column were defined with Plastic Kinematic Model
(MAT_003), which is suitable for the simulation of both isotropic and kinematic hardening
plasticity (LSTC, 2016). As recommended by Hallquist (2009) for cyclic loading, mixed
hardening approach with the hardening parameter 0.3 was used.
4.1 KCC Model: MAT_72R3
Although this material model has forty nine input parameters provided in eight
keywords cards, all of them are not necessary to be input by the user for general purpose.
This model can auto-generate all the parameters based on the provided density and
Page 7 of 25
For Proof Read only
Songklanakarin Journal of Science and Technology SJST-2018-0073.R1 Tanapornraweekit
123456789101112131415161718192021222324252627282930313233343536373839404142434445464748495051525354555657585960

For Review Only
6
compressive strength of concrete. Therefore, only the compressive strength and density of
concrete along with unit conversion parameters were input in the model and other parameters
were left to be default. Details on simplified input for KCC model can be found in Schwer
and Malvar (2005).
4.2 Winfrith Concrete Model: MAT_84
In comparison to KCC model, relatively higher numbers of parameters need to be
defined for Winfrith concrete model. However, these parameters can be obtained through
tests or calculation based on various design codes. This paper adopts ACI 318-08 (ACI
Committee 318 2008) for such calculations.
The crack generation up to three orthogonal planes in a single element is one of the
appealing features of this model, which is utilized in strain softening during tension.
However, as reported by Schwer (2011), in cyclic tension and compression, the tensile cracks
opened during tension were found to be healed during subsequent compression and no
softening was observed after compression failure. In addition, as per Wu et al. (2012)
Winfrith Concrete is able to capture the post-peak softening in tension but not in
compression.
The input parameters for this concrete model are mass density, initial tangent
modulus, poisson’s ratio, uniaxial compressive strength, uniaxial tensile strength, and fracture
energy.
4.3 CSCM Model: MAT_159
Similar to the KCC Model, this model also have feature to generate the required
parameters based on unconfined compressive strength (LSTC, 2016). As per Jiang and Zhao
(2014), CSCM Model (MAT_159) is applicable only for concrete with compressive strength
in the range of 20MPa to 48MPa. For the concrete having compressive strength out of this
range, MAT_SCHWER_ MURRAY_CAP_MODEL (MAT_145) can be used. However,
Page 8 of 25
For Proof Read only
Songklanakarin Journal of Science and Technology SJST-2018-0073.R1 Tanapornraweekit
123456789101112131415161718192021222324252627282930313233343536373839404142434445464748495051525354555657585960

For Review Only
7
MAT_145 has no inbuilt parameter generation feature.
Similar to other material models, the compressive strength of concrete was defined to
be 30MPa, which is also the default value in this model. Further, the cap retraction was
turned on and modulus recovery option was turned off in the analysis performed in this study.
5. Results and Discussion
In order to investigate the cyclic load reversal and softening behavior of different
material models, the force-drift (backbone) curves obtained from all the simulations were
compared, which is shown in Figure 3. Although the force was expected to drop after
reaching the maximum value, it kept on increasing for Winfrith and KCC models even after
exceeding the peak force resulted from experiment. However, the force was relatively smaller
in KCC model compared to that from Winfrith concrete model and the gradual drop in the
force was observed in KCC model at very high drift (see Figure 3). Among these materials,
CSCM Model is the only material which shows the drop in force at expected drift level
(similar to the experimental results). It can be observed in Figure 3, during the early cycles
(the elastic range), all of the models show the approximately equal force output. Then, a clear
gap between the peak force values, with the increasing drift, from different material models
can be observed from analysis results. Further, KCC and CSCM models show approximately
the same force output till the maximum force level. It is noted that all of the models are able
to capture the cyclic reversal loading.
Although no gradual drop in the force was observed in Winfrith concrete, the rate of
force rising was not same; it gradually decreased with increasing drift. This behavior was
expected due to its crack forming in tension and then, healing in compression during cyclic
loading as explained by Schwer (2011).
Winfrith concrete model is based on Ottosen Plasticity Model (Ottosen, 1977), which
expresses the shear failure surface as
Page 9 of 25
For Proof Read only
Songklanakarin Journal of Science and Technology SJST-2018-0073.R1 Tanapornraweekit
123456789101112131415161718192021222324252627282930313233343536373839404142434445464748495051525354555657585960
For Review Only
8
f(I1, J2, cos3θ) = A������ + λ
������ + B ��� – 1
(1)
where, I1, J2, θ, and f′c represent first invariant stress tensor, second deviatoric stress tensor,
lode angle, and unconfined compressive strength of concrete, respectively.
This expression is also known as four-parameter model. The parameters A and B
account for meridional shape of shear failure surface and λ controls the shape of the shear
failure surface on the π-plane (Schwer, 2011). Further, λ is a function of cos3θ which is
expressed as:
λ =� K�cos ��� cos��(K�cos3θ)� forcos3θ ≥ 0K�cos ��� − �� cos��(−K�cos3θ)� forcos3θ ≥ 0
(2)
The parameters K1 and K2 are known as size and shape factors, respectively. The
values of failure criterion parameters A, B, K1 and K2 are the function of the ratio of tensile
strength to compressive strength of concrete. In Winfrith Concrete Model, strain softening in
tension is carried out by regularization of crack widths or fracture energy. However, its crack
healing behavior in cyclic loading (Schwer, 2011) prevents the actual rate of softening in this
type of loading. Further, it should be noted that concrete failure criteria in Ottosen plasticity
model (Ottosen, 1977) was, originally, validated for short-term monotonic loading.
The behavior of KCC and CSCM models are more or less similar, though KCC model
over predicted the resistant force. In generalized form, both KCC and CSCM are expressed in
three shear strength surfaces: yield surface, limit surface and residual surface (Brannon &
Leelavanichkul 2009), which are shown in Figure 4.
With respect to Figure 4, the softening is defined as the gradual shifting of limit
surface to the residual surface. In other words, some stress attained once can never be reached
again due to softening.
The three surfaces of KCC model are defined as:
Page 10 of 25
For Proof Read only
Songklanakarin Journal of Science and Technology SJST-2018-0073.R1 Tanapornraweekit
123456789101112131415161718192021222324252627282930313233343536373839404142434445464748495051525354555657585960

For Review Only
9
Initial Yield Surface, Yy = a0y + !"#$"�#! (3)
Limit Surface, Ym = a0m + !"%$"�%! (4)
Residual Surface, Yr = a0f + !"&$"�&! (5)
The a-parameters (a0y, a1y, a1y, a0m, a1m, a2m, a0f, a1f and a2f) are the user input for
initial yield, limit and residual surfaces, and p is the pressure, which can be expressed as –
I1/3.
The failure surface is interpolated between Ym or Yr depending on following
conditions:
f(I1, J2, J3) = '(()�) �ŋ(+) ,-.(/) − -0(/)1 + -0(/)� 34(+ ≤ +.(()�)6ŋ(+)7-.(/) − -8(/)9 + -8(/):34(+ > +.
(6)
where λ is the modified effective plastic strain which accounts for internal damage and is
defined in Eq. 7. r(J�) is function of third devioteric stress serving as scale factor in the form
of William-Warnke Equation (William & Warnke, 1975). In KCC model, rate effects are used
to take account for shear damage accumulation. A factor rf, (strain
rate enhancement factor), termed as Dynamic Increasing Factor (DIF) in CEB-FIB model
code 90, is implemented to account for high loading rates.
λ = h >�� ?@AB?@AB (7)
where ?@AB is the strain tensor. The parameter h, which is the function of softening
parameters, tensile strength of concrete, pressure and DIF, is expressed as:
Page 11 of 25
For Proof Read only
Songklanakarin Journal of Science and Technology SJST-2018-0073.R1 Tanapornraweekit
123456789101112131415161718192021222324252627282930313233343536373839404142434445464748495051525354555657585960
For Review Only
10
h=
CDEDF �8GH�$ IJGGKL
M 34(N4O/(PQQR4S(/ ≥ 0)�
8GH�$ IJGGKLM� 34(TPSQR4S(/ < 0)
(8)
The parameters b1 and b2 account for softening in compression and tension,
respectively. Despite of having the softening parameters in KCC model, a significant
difference in the resistant forces between experiment and simulation still exists. The main
reason for this difference might result from an adoption of auto parameter generation feature;
when only unconfined compressive strength and density of concrete are defined as input, the
curve for strain rate effects (LCRATE in keyword Card 3) is not generated, which holds
paramount importance in softening and damage accumulation. As a result, softening is not
well simulated as actual rate and higher force output is shown.
CSCM model, an elasto-plastic damage model, is based on formulations purposed by
Schwer and Murray (1994) and Sandler, DiMaggio, and Baladi (1976). The yield function of
this model can be expressed as three invariants as follows(LSTC, 2016):
Y(I1, J2, J3 ) = J2 – Ʀ (J3)2 ff
2 (I1) fc(I1, ƙ) (9)
Ʀ(J3) represents the Rubin three-invariant reduction factor, ff(I1) is the shear failure surface
and fc(I1, ƙ) represents hardening cap with ƙ as cap hardening parameter, which are defined as
follows:
Shear Failure Surface, ff (I1) = α – λ(exp)�Y� − θI� (10)
Cap Hardening Surface, fc (I1, ƙ) =1 − 7��\(])9�7^(])�\(])9� forI� ≥ L(k)
= 1 otherwise (11)
L(ƙ) = eƙforƙ ≥ ƙgƙgotherwise (12)
Page 12 of 25
For Proof Read only
Songklanakarin Journal of Science and Technology SJST-2018-0073.R1 Tanapornraweekit
123456789101112131415161718192021222324252627282930313233343536373839404142434445464748495051525354555657585960

For Review Only
11
X(ƙ) = L(ƙ) + Rff(I1) (13)
where the material parameters α, β, θ, and λ are based on triaxial compression tests on plain
concrete and then, the parameters are adjusted for compaction and damage(Murray, 2007). ff
(I1) and fc (I1, ƙ) intersect at I� = L(k). Further, Eq. 11 depicts an ellipse when I� ≥ L(k) and
R is the cap ellipticity. Eq. 13 governs the location of cap. Moreover, increased value of X(ƙ)
and ƙ indicates expansion of cap and vice-versa. And following hardening rule is
implemented to control the motion of cap:
Plastic volumetric strain, εj! = W61 −exp(�l(^�^m)�l�(^�^m)�: (14)
where W is the maximum value of volumetric strain, X0 represents the initial location of the
cap (when ƙ = ƙ0). D1 and D2 are the model input parameters.
Unlike the KCC model, CSCM has inbuilt functions that take into account the DIF
during both tension and compression. Two separate equations (Eq. 15 and Eq. 16) are
implemented to capture the softening during brittle and ductile damage with softening
parameters A, B, C and D(LSTC, 2016).
Brittle damage, d(τb) = g.pppl � �$l�$lqr!st(uvswmv) − 1� (15)
Ductile damage, d(τd) =xy"rz � �$z�$zqr!s{(uvswm|) − 1� (16)
where,
Brittle damage accumulation, τb= �Eε�y"r (17)
Ductile damage accumulation,τx = >��σ��ε�� (18)
where σ��andε��are the stress and strain components, respectively.
Viscoplastic damage threshold, rg =,1 + �ἐŋ��√�1 r� (19)
rgb and rgb in Eq. 15 and Eq. 16 are the threshold brittle and ductile damage parameters; the
damage initiates only when τb and τd exceed respective thresholds. r�and rgrepresent damage
Page 13 of 25
For Proof Read only
Songklanakarin Journal of Science and Technology SJST-2018-0073.R1 Tanapornraweekit
123456789101112131415161718192021222324252627282930313233343536373839404142434445464748495051525354555657585960

For Review Only
12
threshold before and after application of viscoplasticity.
Using all the inbuilt parameters, CSCM model was able to capture softening behavior
and predict peak load and respective drift of non-ductile column with good accuracy. The
hysteresis curve obtained from CSCM model compared to the experimental hysteresis curve
is presented in Figure 5.
Peak load from experiment was 86.83kN at around 2% drift and the peak load
predicted by FEA was 85.82kN at the same level of drift. The numerical modeling in
VecTor2 by Saleem et al. (2015) reported the maximum load to be 89.1kN at around 2% drift.
Regarding the damage patterns resulted from the analyzed models, the fringes of
maximum principal strains at 3% drift are presented in Figure 6. Based on maximum
principal strain, the KCC model over predicts the damage and the Winfrith concrete shows
the least damage. Again, the CSCM model captures damages with good accuracy compared
to the test results.
On the basis of maximum plastic strain, the damage zone and damage propagation can
be identified. However, it is rather unclear to specify which element fails first and gets
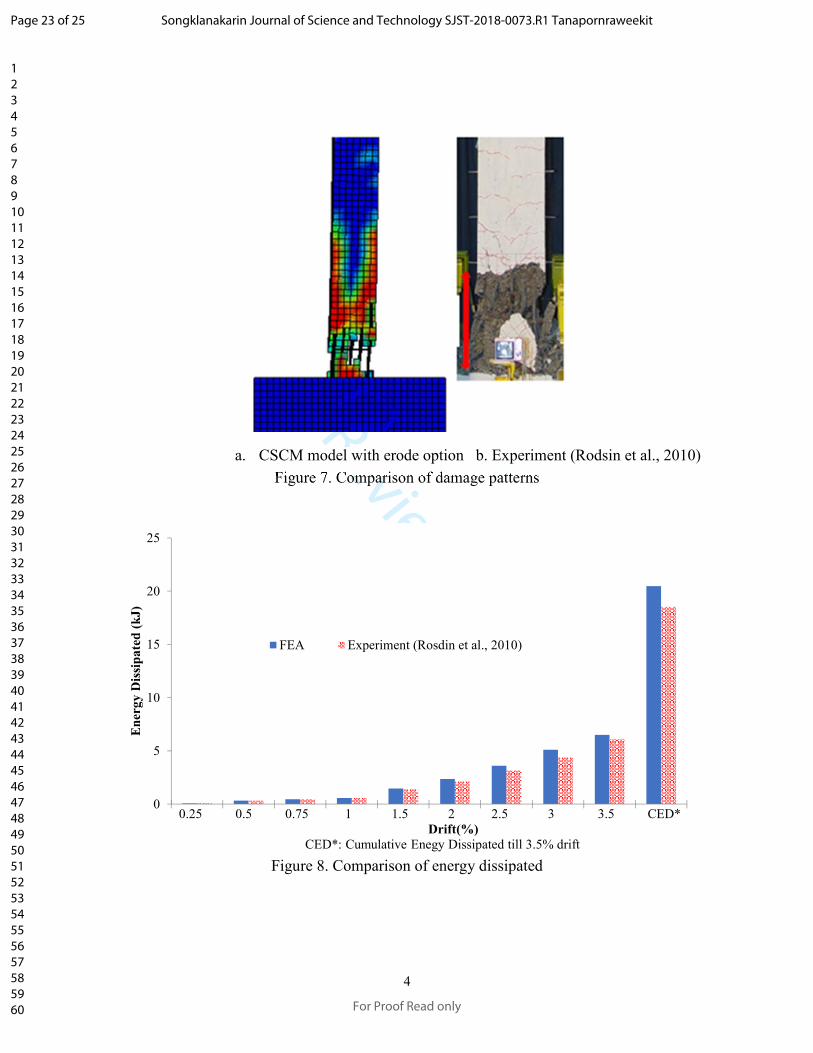
damaged earlier. Therefore, CSCM model was run again with activation of its inbuilt erode
option. Activation of this option eliminates the failed elements from the model (LSTC, 2016).
Damage obtained from this model is presented in Figure 7, which shows good resemblance to
the damage shown in experiment (Rosdin et al., 2010).
In order to evaluate the energy dissipated during reversed lateral cyclic loading, the
area enclosed within the hysteresis loops at various drift ratios were calculated. The
comparison of energy dissipated during the cycles of different drifts as well as the cumulative
energy dissipation from both the experiment (Rosdin et al., 2010) and the FEA are presented
in Figure 8. During the early cycles, the FE model is able to capture the energy dissipation
with a good accuracy. However, the comparison of cumulative energy dissipation till 3.5%
Page 14 of 25
For Proof Read only
Songklanakarin Journal of Science and Technology SJST-2018-0073.R1 Tanapornraweekit
123456789101112131415161718192021222324252627282930313233343536373839404142434445464748495051525354555657585960
For Review Only
13
drift shows that the FE model over predicts the energy by 10.48%.
In the experiment, longitudinal rebar buckling was observed at the lateral drift of 3%
and the column was ultimately collapsed by flexural mode of failure (Saleem et al., 2015).
Similar to the experiment, bucking in the longitudinal rebars was shown at 3% drift in
numerical simulation as well. Figure 9 presents the development of axial stress in
longitudinal rebars with respect to increasing drift at the buckling location of longitudinal
rebars. The main longitudinal rebars at the corner along the loading direction started buckling
at 3% drift. As the relationship of axial stress of both the rebars and drift ratio showed similar
behavior, a single curve is presented in Figure 9. The buckling in the rebars can be identified
with the rapid drop in axial compressive stress at 3% drift (see Figure 9). Buckling of rebars
and excessive damage in the concrete led the model to numerical instability and no
convergence was obtained after 3.5% drift.
Among the simulated material models, the performance of CSCM model was
excellent regarding prediction of peak load and corresponding drift level as well as damage
level when only the minimum required input parameters are defined. However, energy
dissipitaion capacity predicted by CSCM model (with mimimum input parameters) differed
from the experiment in the post-peak regime. The predicted energy dissipation capacity by
FEA was good till 1.5% drift. After 1.5% drift the local yeilding occurred in both
longitudinal and lateral ties at critical locations and significant flexural damages were
observed in the column. With the increasing level of damages, relatively larger deviataions in
energy dissipated by FEA and the experiment were obseved.
6. Conclusions
This paper evaluates the seismic performance of three widely used concrete material
models (KCC model, Winfrith concrete model and CSCM model) with minimum input
parameters using implicit solver provided by LS-DYNA FE code. The selected specimen
Page 15 of 25
For Proof Read only
Songklanakarin Journal of Science and Technology SJST-2018-0073.R1 Tanapornraweekit
123456789101112131415161718192021222324252627282930313233343536373839404142434445464748495051525354555657585960

For Review Only
14
used for comparison was a previously tested non-ductile RC column under lateral cyclic
loading. The results from simulation with three different material models were compared with
the experimental results. Finally, the obtained results from each material model were
investigated together with an overview of theoretical background and documented single
element analysis. Based on this study, the following conclusions are drawn:
• All the concrete material models used in this study are able to capture the cyclic load
reversal behavior during application of cyclic displacements. However, only the CSCM
model shows the softening with good accuracy and consequently, predicts the reliable
force-displacement behavior and damage pattern. Therefore, on the basis of theoretical
background, and comparison of experimental and simulation results, this paper
recommends CSCM model (MAT_159) for lateral cyclic loading simulation when only
compressive strength of concrete is known.
• Overview of theory of KCC model shows its potential for a simulation of softening in
concrete. However, due to lack of automatic generated of DIF input, the softening
behavior which is function of strain rate cannot be simulated well and no reliable force-
displacement output can be obtained when only the density and compressive strength of
concrete are input in material keyword cards. On the other hand, cyclic behavior of this
material model is not as good as those of others and excessive maximum principal strain
(damage) formation is another disadvantage of this model. However, it should be noted
here again that this investigation is based on the minimum input with auto-generation
parameters. The inputs are only density and compressive strength of concrete for the KCC
model.
• In Winfrith Concrete model, no softening in compression was observed during cyclic
loading. As a result, among the three evaluated material models, this model shows the
maximum force output and least maximum principal strain (damage). Therefore, this
Page 16 of 25
For Proof Read only
Songklanakarin Journal of Science and Technology SJST-2018-0073.R1 Tanapornraweekit
123456789101112131415161718192021222324252627282930313233343536373839404142434445464748495051525354555657585960
For Review Only
15
material model is not recommended for simulation of concrete under cycling loading
when the significant damages are expected.
7. Acknowledgement
The first author would like to expression his appreciation to Excellent foreign student
(EFS) Scholarship and TU Scholarship for foreign students for the opportunity to pursue MS
degree at Sirindhorn International Institute of Technology (SIIT), Thammasat University.
REFERENCES
ACI Committee, American Concrete Institute, & International Organization for
Standardization. (2008). Building code requirements for structural concrete (ACI 318-
08) and commentary. American Concrete Institute.
Brannon, R. M., & Leelavanichkul, S. (2009). Survey of four damage models for
concrete. Sandia National Laboratories, 32(1), 1-80. Retrieved from
http://prod.sandia.gov/techlib/access-control.cgi/2009/095544.pdf
Coleman, D. K. (2016). Evaluation of concrete modeling in LS-DYNA for seismic
application (MS Thesis, The University of Texas at Austin, USA). Retrieved from
https://repositories.lib.utexas.edu/handle/2152/47239
Hallquist, J. O. (2006). LS-DYNA theory manual. Livemore Technology Software
Corporation (LSTC).
Hallquist, J. (2009). Recent developments in LS-DYNA. Livemore Technology Software
Corporation (LSTC).
Jiang, H., & Zhao, J. (2015). Calibration of the continuous surface cap model for
concrete. Finite Elements in Analysis and Design, 97, 1-19.
LS-DYNA Keyword Mannual, vol. II.(2016), Livemore Technology Software Corporation
(LSTC).
Murray, Y. D. (2007). Users manual for LS-DYNA concrete material model 159 (No. FHWA-
Page 17 of 25
For Proof Read only
Songklanakarin Journal of Science and Technology SJST-2018-0073.R1 Tanapornraweekit
123456789101112131415161718192021222324252627282930313233343536373839404142434445464748495051525354555657585960

For Review Only
16
HRT-05-062). Retrieved from
https://www.fhwa.dot.gov/publications/research/infrastructure/pavements/05062/05062.
Murty, C. V. R., Goswami, R., Vijayanarayanan, A. R., & Mehta, V. V. (2012). Some concepts
in earthquake behavior of buildings. Gujarat State Disaster Management Authority,
Government of Gujarat. Retrieved from http://www.iitk.ac.in/nicee/IITK-
GSDMA/EBB_001_30May2013.pdf.
Ottosen, N. S. (1977). A failure criterion for concrete. American Society of Civil Engineers.
Engineering Mechanics Division. Journal, 103(4), 527-535.
Rodsin, K., Warnitchai, P., & Awan, T. (2010). Ultimate drift at gravity load collapse of non-
ductile RC columns. 5th Civil Engineering Conference in the Asian Region and
Australasian Structural Engineering Conference, Sydney Australia (p. 441).
Saleem, S., Pimanmas, A., & Mehmood, T. (2015). Finite element modeling of non-ductile
reinforced concrete columns. Engineering Journal of Research and Development, 26(1),
23-34.
Sandler, I. S., Dimaggio, F. L., & Baladi, G. Y. (1976). Generalized cap model for geological
materials. Journal of Geotechnical and Geoenvironmental Engineering, 102(ASCE#
12243 Proceeding).
Schwer, L. (2011). The Winfrith concrete model: beauty or beast? Insights into the Winfrith
concrete model. In 8th European LS-DYNA Users Conference (pp. 23-24), Strasbourg,
France.
Schwer, L. E., & Malvar, L. J. (2005). Simplified concrete modeling with*
MAT_CONCRETE_DAMAGE_REL3. JRI LS-Dyna User Week, 49-60.
Schwer, L. E., & Murray, Y. D. (1994). A three^invariant smooth cap model with mixed
hardening. International Journal for Numerical and Analytical Methods in
Page 18 of 25
For Proof Read only
Songklanakarin Journal of Science and Technology SJST-2018-0073.R1 Tanapornraweekit
123456789101112131415161718192021222324252627282930313233343536373839404142434445464748495051525354555657585960

For Review Only
17
Geomechanics, 18(10), 657-688.
Sharath, R., Arumugam, D., Dhanasekaran, B. and Subash, T. R. (2017). Numerical
modeling of ‘concrete response ’ to high strain rate loadings. 11th European LS-DYNA
User Conferene, Salzburg, Austria.
Telford, T. (1990). CEB-FIB Model Code. Design Code Edition, Lausanne, Switzerland.
William, K. J. and Warnke, E. P. (1975). Constitutive model for the triaxial behavior of
concrete, ISMES Seminar on Concrete Structures Subjected to Triaxial Stresses,
Bergamo, Italy, 1975.
Wu, Y., Crawford, J. E., & Magallanes, J. M. (2012). Performance of LS-DYNA concrete
constitutive models. In 12th International LS-DYNA users conference (pp. 3-5), Detroit,
USA.
Page 19 of 25
For Proof Read only
Songklanakarin Journal of Science and Technology SJST-2018-0073.R1 Tanapornraweekit
123456789101112131415161718192021222324252627282930313233343536373839404142434445464748495051525354555657585960

For Review Only
1
Figure 1. Cross section of column (Rosdin et al., 2010)
Figure 2. Finite element meshes of the analyzed specimen
Page 20 of 25
For Proof Read only
Songklanakarin Journal of Science and Technology SJST-2018-0073.R1 Tanapornraweekit
123456789101112131415161718192021222324252627282930313233343536373839404142434445464748495051525354555657585960

For Review Only
2
Figure 3. Comparison of force-drift (backbone curves) from experiment and analyses using different concrete material models
Figure 4. Strength surfaces (Brannon & Leelavanichkul, 2009)
Drift (%)
Lateral Load (kN)
-8 -7 -6 -5 -4 -3 -2 -1 1 2 3 4 5 6 7 8
-250
-200
-150
-100
-50
50
100
150
200
250
-8 -7 -6 -5 -4 -3 -2 -1 1 2 3 4 5 6 7 8
-250
-200
-150
-100
-50
50
100
150
200
250
Experiment (Rosdin et al., 2010)
KCC Model
Winfrith Model
CSCM Model
Page 21 of 25
For Proof Read only
Songklanakarin Journal of Science and Technology SJST-2018-0073.R1 Tanapornraweekit
123456789101112131415161718192021222324252627282930313233343536373839404142434445464748495051525354555657585960

For Review Only
3
Figure 5. Comparison of force-drift (hysteresis curves) from experiment and analysis using CSCM concrete model
Figure 6. Fringes of maximum principal strain
-90
-80
-70
-60
-50
-40
-30
-20
-10
0
10
20
30
40
50
60
70
80
90
-5 -4 -3 -2 -1 0 1 2 3 4 5
Lateral Load(kN)
Drift(%)
FEA
Experiment (Rosdin et al., 2010)
a. KCC model b. Winfrith model c. CSCM model
Page 22 of 25
For Proof Read only
Songklanakarin Journal of Science and Technology SJST-2018-0073.R1 Tanapornraweekit
123456789101112131415161718192021222324252627282930313233343536373839404142434445464748495051525354555657585960
For Review Only
4
Figure 7. Comparison of damage patterns
Figure 8. Comparison of energy dissipated
0
5
10
15
20
25
Energy Dissipated (kJ)
FEA Experiment (Rosdin et al., 2010)
0.25 0.5 0.75 1 1.5 2 2.5 3 3.5 CED*
Drift(%)
CED*: Cumulative Enegy Dissipated till 3.5% drift
a. CSCM model with erode option b. Experiment (Rodsin et al., 2010)
Page 23 of 25
For Proof Read only
Songklanakarin Journal of Science and Technology SJST-2018-0073.R1 Tanapornraweekit
123456789101112131415161718192021222324252627282930313233343536373839404142434445464748495051525354555657585960

For Review Only
5
Figure 9. Axial stress in longitudinal rebars vs. drift ratio
-600
-400
-200
0
200
400
600
800
-4 -3 -2 -1 0 1 2 3 4
Axial Stress(MPa)
Drift Ratio(%)
Page 24 of 25
For Proof Read only
Songklanakarin Journal of Science and Technology SJST-2018-0073.R1 Tanapornraweekit
123456789101112131415161718192021222324252627282930313233343536373839404142434445464748495051525354555657585960

For Review Only
Table 1. Mechanical properties of rebars (Rodsin et al., 2010)
Bar size Modulus of elasticity (GPa) Yield strength (MPa)
DB12 204 547
RB9 204 396
Page 25 of 25
For Proof Read only
Songklanakarin Journal of Science and Technology SJST-2018-0073.R1 Tanapornraweekit
123456789101112131415161718192021222324252627282930313233343536373839404142434445464748495051525354555657585960