for personal use only - asx · your awesome presentation title {segoe ui 12 pt.} revenue $160m, up...
TRANSCRIPT

For
per
sona
l use
onl
y

FY16 FULL YEAR RESULTS 2
Empired Snapshot
Managed Services
Cloud (IaaS, SaaS, PaaS)
Enterprise ERP & CRM
IOT & Data Insights
Systems Integration
Mobile Solutions
Empired (ASX:EPD)
Australia
New Zealand
Singapore
USA
India
12 locations
5 countries
Shares 122m
Price $0.43
Market Cap $52m
55% of Revenue from multi year contracts
Revenue
$160m
West Coast 336
East Coast 232
New Zealand 407
975 People
Government 23%
Energy and Natural Resources 19%
Finance, Healthcare, Education, Transport
& ICT
Broad Horizontal Industry Appeal
One of the largest
dedicated Microsoft
Partners in the Australasian market
Focused on growth through disruptive
market trends
Transforming traditional business
models in the digital era
Growth across our contestable market is set to accelerate
Comprehensive Technology &
Business Solutions
For
per
sona
l use
onl
y

Your Awesome Presentation Title {Segoe UI 12 pt.}
Revenue $160m, up 25%
EBITDA* $8.2m, down 25%
Operating Cash Flow $11.6m
Net Debt $25.6m, down $7.6m v H1
Undrawn bank facilities and cash of $14m For
per
sona
l use
onl
y

FY16 FULL YEAR RESULTS
55% of Revenue generated from long term multi-year contracts.
Strong annuity revenue growth as new contracts ramp up.
Standout growth in Data Insights, Digital and Microsoft Dynamics.
Cohesion market share accelerated to 4,500 users within NZ
Government with strong growth anticipated in FY17.
Implementation of an integrated operating/organisational model
& portfolio sales team within Australia and New Zealand.
FY16 HIGHLIGHTSF
or p
erso
nal u
se o
nly

FY16 FULL YEAR RESULTS
Results
5
$m FY16 H1 FY16 H2 FY16
Revenue 78.5 81.5 160
EBITDA* 1.2 7.0 8.2
EBITDA* / Revenue % 1.1% 8.6% 5.1%
Depreciation & Amortisation (3.2) (3.7) (6.9)
Loss on Disposal** (2.3) - (2.3)
Interest (Net) (0.7) (0.9) (1.6)
NPAT (3.8) 2.1 (1.7)
Operating Cash Flow (1.3) 12.9 11.6
Net Debt 33.2 25.6 25.6
EBITDA* adjusted for $0.7m (H1 $0.3m, H2 $0.4m) debtor impairment relating to a prior financial year. This reference is applied throughout this document.
Loss** on Disposal was a non cash adjustment primarily relating to the consolidation and relocation of a number of offices during the year.
Revenue growth of 25% on prior year
underpinned by 9% organic growth.
Second half results demonstrate
recovering earnings with EBITDA
improving across the half year period.
Strong operating cash flow represents
unwind in working capital and improved
profitability through H2.
Net Debt has reduced by $7.6m across
the half year period.
Undrawn bank facilities and cash of $14m.
First half results impacted by acquisition
integration and organisational changes as
outlined in prior ASX announcements.
For
per
sona
l use
onl
y

FY16 FULL YEAR RESULTS 6
$m 2016 2015
EBITDA 7.5 10.9
Non cash items 0.2 (1.3)
Tax paid (0.3) -
Interest paid (net) (1.7) (1.0)
Dividends - associate 0.2 -
Changes in working capital 5.7 (3.5)
Operating cash flow 11.6 5.1
Purchases of P&E and intangibles (14.6) (11.5)
Acquisitions (inc deferred consideration) (1.2) (11.6)
Repayment of borrowings (7.1) (10.4)
Proceeds from borrowings 4.4 18.0
Options exercised 0.2 13.8
Equity raising costs - (0.6)
Dividends paid - (1.1)
Change in cash (6.7) 1.7
Cash flow
Operating Cash Flow of $11.6m.
H2 Operating Cash Flow of $12.9m.
Operating Cash Flow includes landlord
incentives of $3.8m, adjusted
operating cash flow demonstrates
EBITDA to cash conversion of 104%.
Repayment of borrowings includes
term debt repayment of $4.1m and
repayment of $3m in asset finance.
PPE & Intangibles includes $4m
relating to one-off office
consolidations and fit outs. For
per
sona
l use
onl
y

FY16 FULL YEAR RESULTS 7
$m (1)June Dec June
2016 2015 2015
Cash 3.0 2.6 9.6
Receivables and WIP 32.6 32.1 33.9
Other 2.6 3.2 2.0
Current Assets 38.2 37.9 45.5
Plant & Equipment 21.1 20.3 16.2
Intangibles and other 58.7 56.2 55.5
Non Current Assets 79.8 76.5 71.7
Trade and other payables 26.1 19.2 24.9
Borrowings* 8.9 17.2 12.3
Provisions and other 6.0 4.8 4.7
Current Liabilities 41.1 41.3 41.9
Borrowings* 19.6 18.6 21.1
Other 4.8 5.2 1.6
Non Current Liabilities 24.5 23.8 22.6
Net Assets / Equity 52.4 49.4 52.7
Net debt (Nd) 25.6 33.2 23.8
Gearing Nd/(Nd+Equity) 33% 40% 31%
Financial Position
*Borrowings includes all deferred vendor amounts
(1)Balance sheet restated based on new bank debt facilities finalised subsequent to 30 June 2016
Net debt of $25.6m down $7.6m.
Undrawn bank facilities and cash of $14m.
Current borrowings include repayment
amounts for term bank debt, hire purchase
liabilities and deferred vendor payments.
Increase to intangibles due to the
reclassification of software from PPE to
Intangibles.
Receivable days (debtors + WIP) of 69 days
down from 89 days at 30 June 15.
Deferred vendor payments; $1.2m paid July
2016, $1.0m due May 2017 and $6.8m due
June 2017.
For
per
sona
l use
onl
y
FY16 FULL YEAR RESULTS 8
$0
$20,000,000
$40,000,000
$60,000,000
$80,000,000
$100,000,000
$120,000,000
$140,000,000
$160,000,000
$180,000,000
FY 2012 FY 2013 FY 2014 FY 2015 FY 2016
Revenue Year on Year
Revenue H1 Revenue H2
$0
$2,000,000
$4,000,000
$6,000,000
$8,000,000
$10,000,000
$12,000,000
FY 2012 FY 2013 FY 2014 FY 2015 FY 2016
EBITDA* Year on Year
EBITDA H1 EBITDA H2
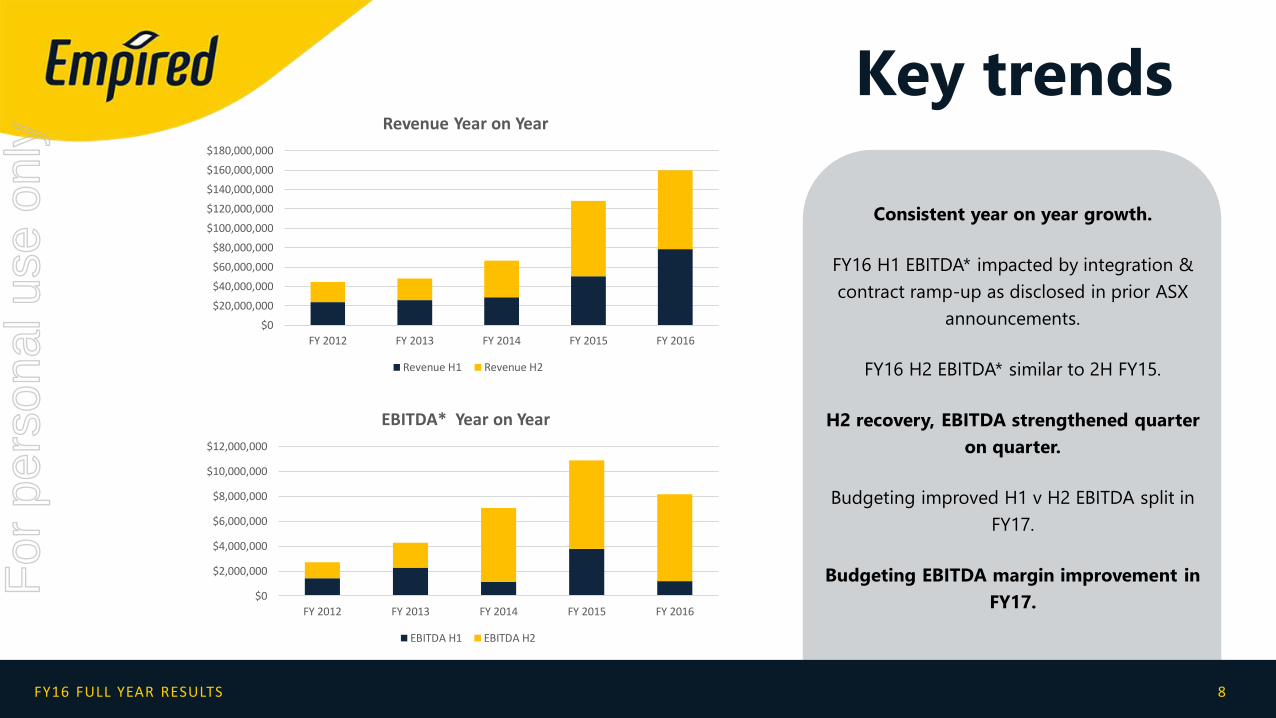
Key trends
Consistent year on year growth.
FY16 H1 EBITDA* impacted by integration &
contract ramp-up as disclosed in prior ASX
announcements.
FY16 H2 EBITDA* similar to 2H FY15.
H2 recovery, EBITDA strengthened quarter
on quarter.
Budgeting improved H1 v H2 EBITDA split in
FY17.
Budgeting EBITDA margin improvement in
FY17.
For
per
sona
l use
onl
y

FY16 FULL YEAR RESULTS 9
$0
$50,000,000
$100,000,000
$150,000,000
$200,000,000
2013 2014 2015 2016
Apps & Consulting Services Infrastructure Services
Revenue growth
TOTAL
Revenue growth of 25%
Organic growth of 9%
Applications & Consulting up 25%
Strong growth in Managed Services.
Microsoft Dynamics services (CRM & ERP) up
31% during the period.
Data Insights and Digital services grew by
27% and 132% respectively.
Infrastructure Services up 25%
Strong growth in Managed Services
Trend toward consumption based services
and unit based pricing.
Strong hybrid cloud based offering.
For
per
sona
l use
onl
y

FY16 FULL YEAR RESULTS 10
24%
53%
73%
75%
76%
47%
27%
25%
0% 10% 20% 30% 40% 50% 60% 70% 80% 90% 100%
2 0 1 3
2 0 1 4
2 0 1 5
2 0 1 6
Apps & Consulting Services Infrastructure Services
Revenue mix
ANALYSIS
Application and Infrastructure services
are becoming tightly aligned to
provide seamless solutions to
customers.
Strong organic growth in Infrastructure
services in FY16.
Application services continued to grow
as a percentage of revenue based on
organic growth and full year
contribution from the Intergen Limited
acquisition in November 2014.For
per
sona
l use
onl
y

FY16 FULL YEAR RESULTS 11
Revenue by region
34%
29%
37%
2016 Revenue split
West Coast East Coast NZ/US -
10,000,000
20,000,000
30,000,000
40,000,000
50,000,000
60,000,000
East Coast West Coast NZ and US
Regional Growth
+14%+39%
+3%
ANALYSIS
East Coast growth incurred the highest
impact of First Half initiatives.
NZ / US region grew strongly
including full year impact of
acquisition. Organic growth in the
region was strong at 18.1%.
Western region grew by 14%.
Strong growth opportunity exists
across all contested markets.
For
per
sona
l use
onl
y

FY16 FULL YEAR RESULTS 12
Education ( 2%)
Finance (10 %)
Government (23 %)
Healthcare (5%)
ICT (9%)
Manufacturing & transport (8%)
other (20%)
Wholesale & Retail Trade (3%)
Energy & Natural Resources (19%)
Revenue by industry
ANALYSIS
No major exposure or reliance on
any one particular sector.
Government remains Empired’s
strongest sector.
Energy & Natural Resources (ENR)
continues to be a growing sector for
Empired.
Continuing to focus on East coast
growth through Finance, Insurance,
Healthcare & Education sectors.
For
per
sona
l use
onl
y

FY16 FULL YEAR RESULTS 13
FY11 FY12 FY13 FY14 FY15 FY 16
Multi Year Contracts Additional projects from Multi Year Contracts New Clients/Individual Contracts'
Contracted revenue
ANALYSIS
55% of Revenue generated from multi-year
contracts.
Year on Year growth underpinned by asset
bank of locked in multi-year contracts.
Strong growth in managed services continues
to be a key strength & focus.
Acceleration in additional projects secured
from multi-year contracts as services portfolio
expands.
New annuity revenue streams developing from
in-house cloud based software as a service IP
(Cohesion) and cloud platform (FlexScale)
Focused on continuing to build long term
contracts and recurring revenue.
For
per
sona
l use
onl
y

FY16 FULL YEAR RESULTS 14
Business solutions focus.
Enterprise Managed Services.
Infrastructure & Apps
Leader in emerging services
Digital transformation
Service Integration
IOT/Business Insight
Mobility
‘As a Service’ IP & Solutions.
Building industry solutions
& credibility.
Where high performing,
talented people come
together to deliver excellent
solutions to clients.
A trusted end to end
partner in the transformation
and operation of critical
business processes and
systems for our clients.
Delivering on an attractive
growth profile.
Focused on building our
recurring revenue.
Whilst maintaining healthy
EBITDA & NPAT margins.
Delivering robust, sustainable
returns to our stakeholders.
FINANCIALBRANDCAPABILITY
Strategic OverviewF
or p
erso
nal u
se o
nly

FY16 FULL YEAR RESULTS 15
Market Opportunity
Position ourselves as the most respected local full services IT provider in the Australasian market
Unprecedented consolidation in the market has removed many of our
traditional local competitors.
Disruptive technologies, explosion of data and the proliferation of connected
devices is accelerating the adoption of digital business models.
Our breadth of capability uniquely positions us to assist our clients transform
their organisations from traditional to digitally enabled business models.
There is a growing market opportunity – we are focused on seizing it!
For
per
sona
l use
onl
y

Expecting solid growth in all key financial metrics in FY17.
Enter FY17 with record level of contracted Revenue.
Strong sales pipeline, refreshed sales leadership and expecting to
benefit from portfolio based sales model.
Positioned to secure strategic wins and growth in Cohesion.
Services aligned to major industry growth trends.
FY17 OUTLOOK
For
per
sona
l use
onl
y

FY16 FULL YEAR RESULTS
Questions?
For
per
sona
l use
onl
y

FY16 FULL YEAR RESULTS18
For
per
sona
l use
onl
y